Embed Size (px)
Citation preview
1
2
San Francisco, CAMarch 19, 2010
FE/EIT Review
Materials Properties
3
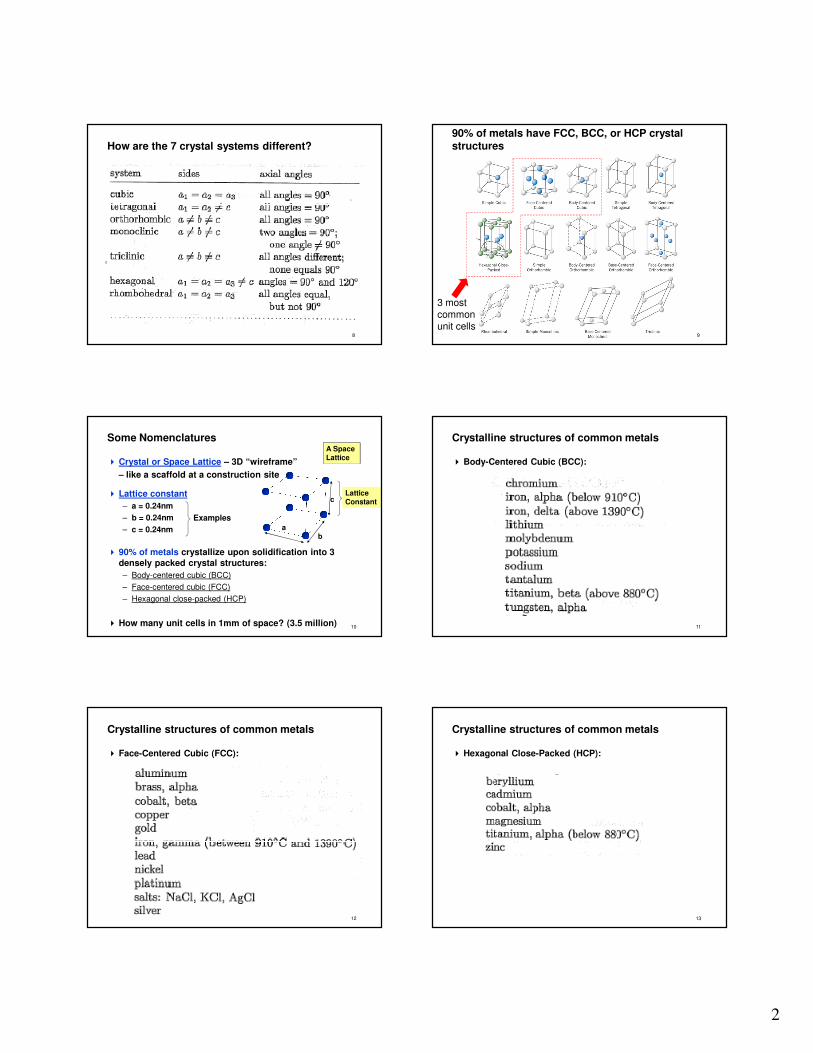
This Review Session’s Agenda
� Materials Science – Quick Review
– 60 minutes
– You should already know these materials
� Practice Problems
– 20 minutes to take the practice test
– 10 minutes to go over problems
4
Materials Science
Quick Review
5
Materials Science/Properties – 7% of total
A. Properties
� mechanical
� chemical
� electrical
� physical
B. Corrosion mechanisms and control
C. Materials
� engineered materials
� ferrous metals
� nonferrous metals
6
Materials Science Review
Atomic Bonding & Crystal Structures
7
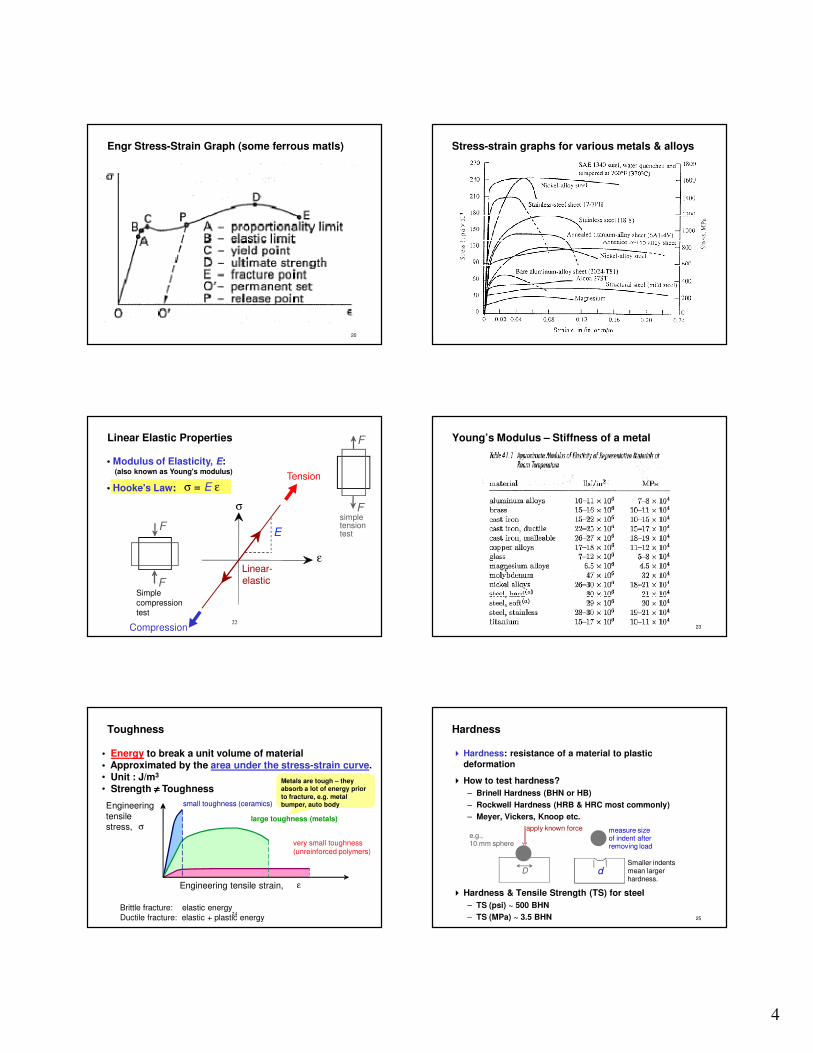
Metals form crystals; 14 basic crystalline lattice structures (unit cells) based on 7 crystal systems
2
8
How are the 7 crystal systems different?
9
90% of metals have FCC, BCC, or HCP crystal structures
3 most common unit cells
10
Some Nomenclatures
� Crystal or Space Lattice – 3D “wireframe”
– like a scaffold at a construction site
� Lattice constant
– a = 0.24nm
– b = 0.24nm
– c = 0.24nm
� 90% of metals crystallize upon solidification into 3
densely packed crystal structures:
– Body-centered cubic (BCC)
– Face-centered cubic (FCC)
– Hexagonal close-packed (HCP)
� How many unit cells in 1mm of space? (3.5 million)
ab
cLattice Constant
A Space Lattice
Examples
11
Crystalline structures of common metals
� Body-Centered Cubic (BCC):
12
Crystalline structures of common metals
� Face-Centered Cubic (FCC):
13
Crystalline structures of common metals
� Hexagonal Close-Packed (HCP):
3
14
Number of atoms in a unit cell
� Most atoms are only ‘partially’ in the unit cell!
� In a simple cubic unit cell, only 1 atom is in the unit cell
1/8 x 1 atom = 1/8 atom
There are 8 of these� Total number of atoms = 1/8 x 8 = 1
15
Coordination Number & Atomic Packing Factor
� Coordination number: number of nearest neighbors
� Atomic Packing Factor (APF)
APF = Volume of atoms in unit cell*
Volume of unit cell
*assume hard spheres
16
Miller Indices for Crystal Planes (BCC, FCC)z
x
ya b
c
4. Miller Indices (110)
example a b cz
x
ya b
c
4. Miller Indices (100)
1. Intercepts 1 1 ∞
2. Reciprocals 1/1 1/1 1/∞1 1 0
3. Reduction 1 1 0
1. Intercepts 1/2 ∞ ∞2. Reciprocals 1/½ 1/∞ 1/∞
2 0 03. Reduction 2 0 0
example a b c
17
Miller Indices for Crystal Planes (HCP)
18
Materials Science Review
2. Materials Testing
Engr Stress-Strain Curve (non-ferrous matls)
19Engineering Strain (εεεε)
En
gin
ee
rin
g S
tre
ss
(σσ σσ
)
0.002 Offset Strain
Permanent Set
4
20
Engr Stress-Strain Graph (some ferrous matls)
21
Stress-strain graphs for various metals & alloys
22
Linear Elastic Properties
• Modulus of Elasticity, E:(also known as Young's modulus)
• Hooke's Law: σ = E ε
σ
Linear-elastic
E
ε
F
Fsimple tension test
Tension
Compression
F
FSimple
compression test
23
Young’s Modulus – Stiffness of a metal
24
• Energy to break a unit volume of material• Approximated by the area under the stress-strain curve.• Unit : J/m3
• Strength ≠≠≠≠ Toughness
Toughness
Brittle fracture: elastic energy
Ductile fracture: elastic + plastic energy
very small toughness (unreinforced polymers)
Engineering tensile strain, ε
Engineering tensile stress, σ
small toughness (ceramics)
large toughness (metals)
Metals are tough – they absorb a lot of energy prior
to fracture, e.g. metal bumper, auto body
Metals are tough – they absorb a lot of energy prior
to fracture, e.g. metal bumper, auto body
25
Hardness
� Hardness: resistance of a material to plastic
deformation
� How to test hardness?
– Brinell Hardness (BHN or HB)
– Rockwell Hardness (HRB & HRC most commonly)
– Meyer, Vickers, Knoop etc.
� Hardness & Tensile Strength (TS) for steel
– TS (psi) ~ 500 BHN
– TS (MPa) ~ 3.5 BHN
e.g., 10 mm sphere
apply known force measure size of indent after removing load
dDSmaller indents mean larger hardness.
5
26increasing hardness
most plastics
brasses Al alloys
easy to machine steels file hard
cutting tools
nitrided steels diamond
27
Fracture : temperature-, environment-, loading rate- & loading history - dependent process
� Fracture is the separation of a body into 2 or more parts
in response to an externally applied stress
� Fracture involves 2 steps:
– Crack formation – presence of voids, hairline crack
– Crack propagation – crack continues to enlarge
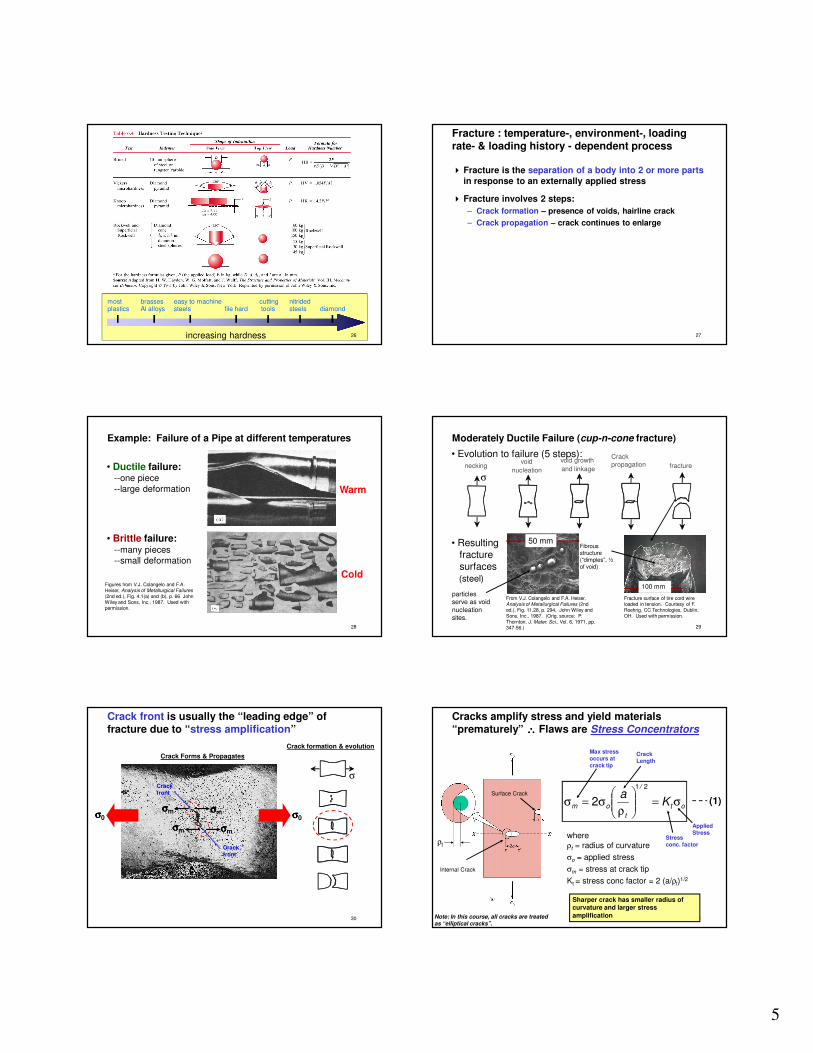
28
• Ductile failure:--one piece
--large deformation
Figures from V.J. Colangelo and F.A. Heiser, Analysis of Metallurgical Failures(2nd ed.), Fig. 4.1(a) and (b), p. 66 John Wiley and Sons, Inc., 1987. Used with permission.
Example: Failure of a Pipe at different temperatures
• Brittle failure:--many pieces
--small deformation
Warm
Cold
29
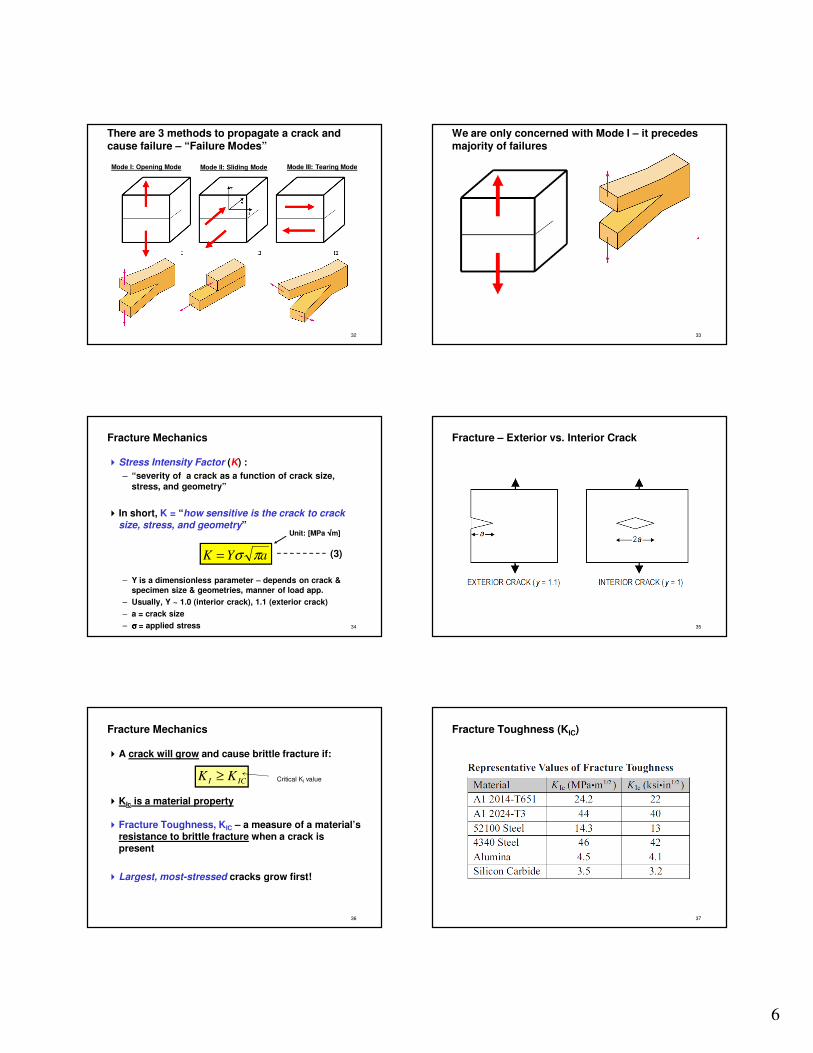
• Evolution to failure (5 steps):
• Resultingfracturesurfaces(steel)
50 mm
particlesserve as void
nucleationsites.
50 mm
From V.J. Colangelo and F.A. Heiser, Analysis of Metallurgical Failures (2nd ed.), Fig. 11.28, p. 294, John Wiley and Sons, Inc., 1987. (Orig. source: P. Thornton, J. Mater. Sci., Vol. 6, 1971, pp. 347-56.)
100 mm
Fracture surface of tire cord wire loaded in tension. Courtesy of F. Roehrig, CC Technologies, Dublin, OH. Used with permission.
Moderately Ductile Failure (cup-n-cone fracture)
necking
σ
void
nucleation
void growth
and linkage
Crack propagation fracture
Fibrous structure (“dimples”, ½ of void)
30
Crack front is usually the “leading edge” of fracture due to “stress amplification”
σσσσ0σσσσ0
Crack Forms & Propagates
σσσσm σσσσm
σσσσm σσσσm
Crack front
Crack front
σ
Crack formation & evolution
31
Cracks amplify stress and yield materials “prematurely” ∴∴∴∴ Flaws are Stress Concentrators
where
ρt = radius of curvature
σo = applied stress
σm = stress at crack tip
Kt = stress conc factor = 2 (a/ρt)1/2
ρt
Internal Crack
Surface Crack
Sharper crack has smaller radius of curvature and larger stress
amplification
ot
/
t
om Ka
σ=
ρσ=σ
21
2
Max stress occurs at crack tip
Applied Stress
Stress conc. factor
Crack Length
(1)
Note: In this course, all cracks are treated as “elliptical cracks”.
6
32
There are 3 methods to propagate a crack and cause failure – “Failure Modes”
Mode II: Sliding ModeMode I: Opening Mode Mode III: Tearing Mode
33
We are only concerned with Mode I – it precedes majority of failures
34
Fracture Mechanics
�Stress Intensity Factor (K) :
– “severity of a crack as a function of crack size, stress, and geometry”
� In short, K = “how sensitive is the crack to crack size, stress, and geometry”
– Y is a dimensionless parameter – depends on crack &
specimen size & geometries, manner of load app.
– Usually, Y ~ 1.0 (interior crack), 1.1 (exterior crack)
– a = crack size
– σσσσ = applied stress
aYK πσ= (3)
Unit: [MPa √ √ √ √m]
Fracture – Exterior vs. Interior Crack
35
36
Fracture Mechanics
�A crack will grow and cause brittle fracture if:
�KIc is a material property
�Fracture Toughness, KIC – a measure of a material’s resistance to brittle fracture when a crack is present
�Largest, most-stressed cracks grow first!
ICI KK ≥ Critical KI value
Fracture Toughness (KIC)
37
7
38
Fracture Mechanics
39
Fatigue: mean stress, max stress, min stress, stress ratio, range of stress, stress amplitude
σσσσm = mean stress (0 in this case) σσσσm = mean stress ( ≠ ≠ ≠ ≠ 0 in this case)
σmax
σmin
σ
timeσm
σσσσa
Stress amplitude σmax
σmin time
σmS
σmax
σmin
σ
time
σmS
Mean stress ≠ 0
2
minmax σσσ
+=
m 2
minmax σσσ
−=a
minmax σσσ −=r
max
min
σ
σ=R
Mean stress =Stress amplitude =
Stress range = Stress ratio=
Mean stress = 0
40
Fatigue
� Fatigue limit = endurance limit
� It is the largest value of fluctuating stress that will not cause failure for essentially an infinite number of cycles
� For ferrous alloy,
– steels: ~ 35-60% of UTS
� For non-ferrous alloys, usually NO fatigue limit. E.g. Mg,
Cu, Al
– Fatigue Strength is used rather than fatigue limit
� Fatigue strength is the stress level at which failure will
occur for some specified # of cycles, e.g. 107 cycles
N = Cycles to failure
S = stress amplitude
Endurance limit
41
Example: σσσσa vs. N graph
42
Creep: Matl deformation occurs due to long term exposure to stress level < yield or UTS
Sample deformation at a constant stress (σσσσ) vs. time
Primary Creep: slope (creep rate)
decreases with time.
Secondary Creep: steady-state
i.e., constant slope.
Tertiary Creep: slope (creep rate)
increases with time, i.e. acceleration of rate.
σσ,ε
0 t
Mostly elastic
Creep
43
Gradient of graph
8
44
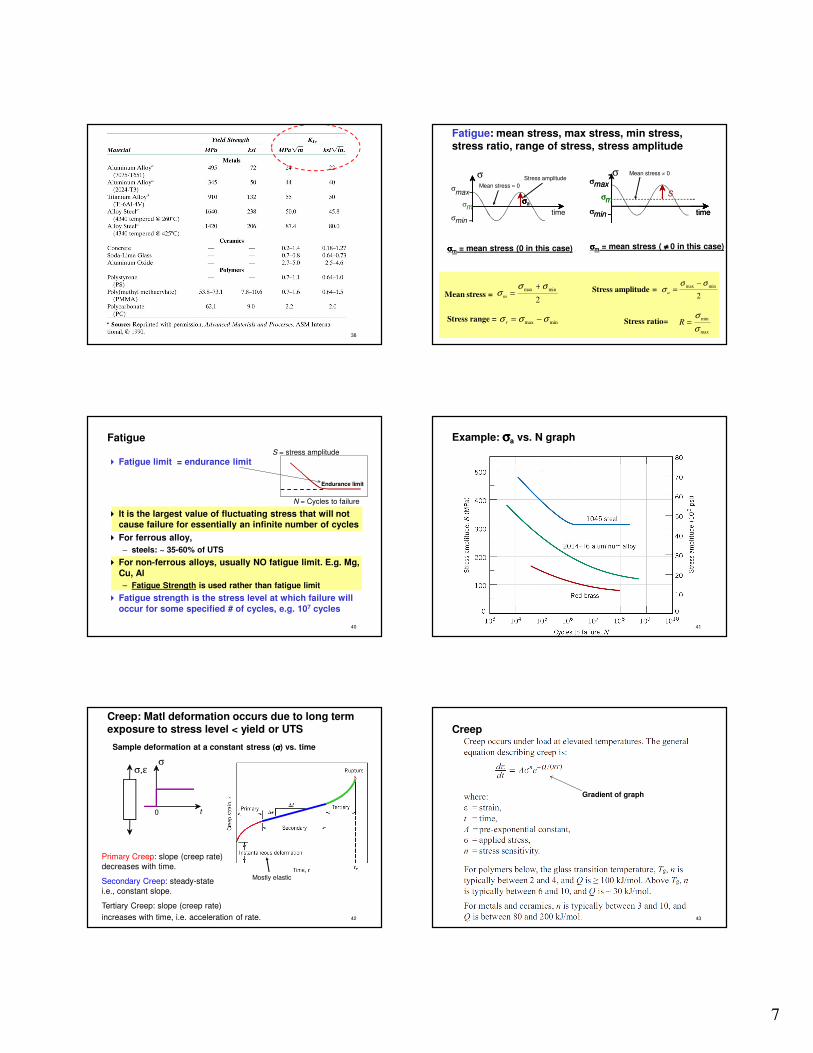
Impact Testing (Charpy Test, Izod Test) –measures impact energy (toughness)
final height initial height
�Qualitative tests, simple, economical, quick
comparison of possible materials
�Effect of Impact loading:
– Makes material more brittle (e.g. plane
hitting ocean, belly flip)
– Decreases toughness
(Charpy)
Izod Test
Charpy Test
45
Ductile-to-Brittle-Transition Temperature (DBTT)
BCC metals (e.g., iron at T < 914°C)
Impact
Energ
y
Temperature
High strength materials (σσσσ y > E/150)
polymers
More DuctileBrittle
Ductile-to-brittle transition temperature
FCC metals (e.g., Cu, Ni)
Coz BCC is not close packedEnergy is needed to push dislocation through, resulting in a sudden drop in impact energy
46
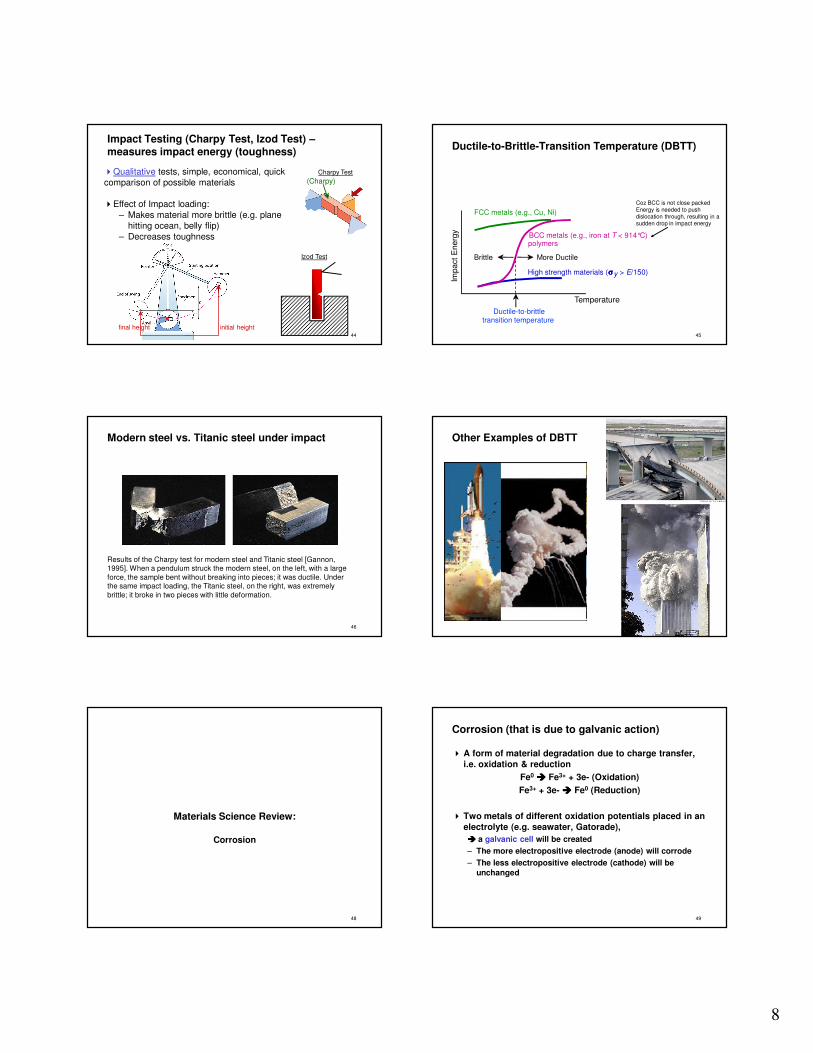
Modern steel vs. Titanic steel under impact
Results of the Charpy test for modern steel and Titanic steel [Gannon, 1995]. When a pendulum struck the modern steel, on the left, with a large
force, the sample bent without breaking into pieces; it was ductile. Under the same impact loading, the Titanic steel, on the right, was extremely
brittle; it broke in two pieces with little deformation.
Other Examples of DBTT
47
48
Materials Science Review:
Corrosion
49
Corrosion (that is due to galvanic action)
� A form of material degradation due to charge transfer,
i.e. oxidation & reduction
Fe0 ���� Fe3+ + 3e- (Oxidation)
Fe3+ + 3e- ���� Fe0 (Reduction)
� Two metals of different oxidation potentials placed in an
electrolyte (e.g. seawater, Gatorade),
���� a galvanic cell will be created
– The more electropositive electrode (anode) will corrode
– The less electropositive electrode (cathode) will be
unchanged
9
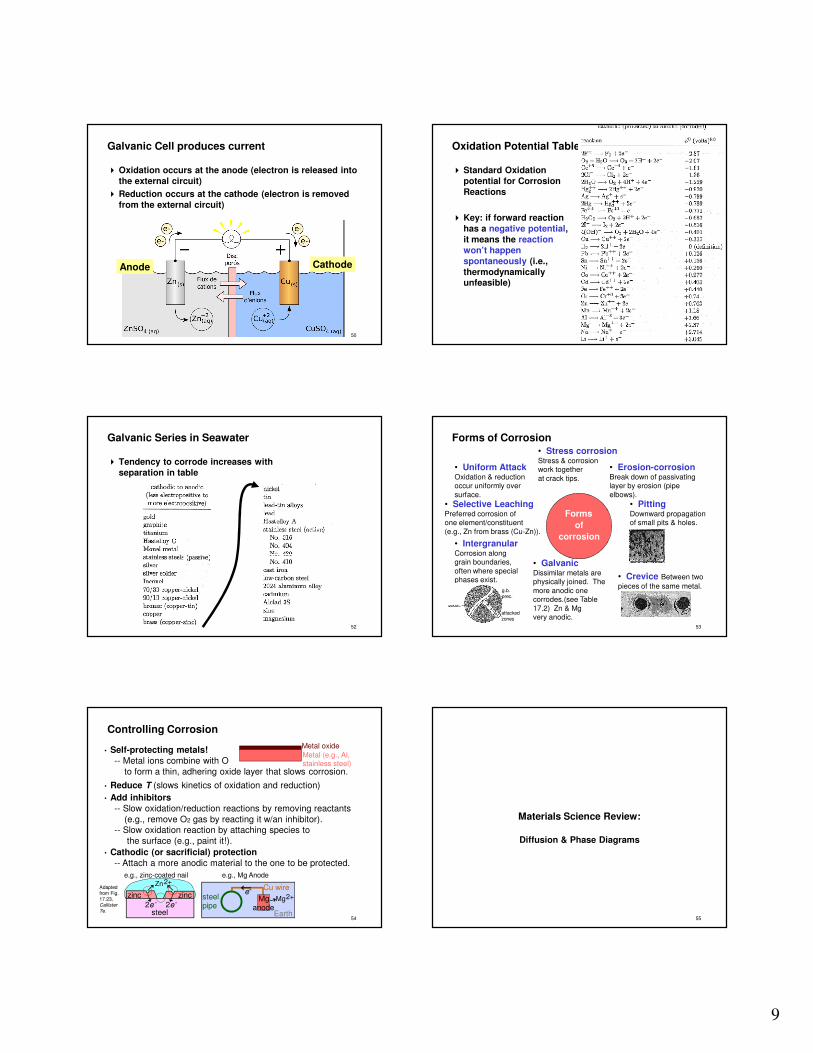
50
Galvanic Cell produces current
� Oxidation occurs at the anode (electron is released into
the external circuit)
� Reduction occurs at the cathode (electron is removed
from the external circuit)
AnodeAnode CathodeCathode
51
Oxidation Potential Table
� Standard Oxidation
potential for Corrosion
Reactions
� Key: if forward reaction
has a negative potential,
it means the reaction
won’t happen
spontaneously (i.e.,
thermodynamically unfeasible)
52
Galvanic Series in Seawater
� Tendency to corrode increases with
separation in table
53
• Uniform AttackOxidation & reductionoccur uniformly over
surface.
• Selective LeachingPreferred corrosion ofone element/constituent
(e.g., Zn from brass (Cu-Zn)).
• Stress corrosionStress & corrosionwork together
at crack tips.
• GalvanicDissimilar metals arephysically joined. The
more anodic onecorrodes.(see Table
17.2) Zn & Mgvery anodic.
• Erosion-corrosionBreak down of passivatinglayer by erosion (pipe
elbows).
Forms of Corrosion
Forms
of
corrosion
• Crevice Between two
pieces of the same metal.
Rivet holes
• IntergranularCorrosion alonggrain boundaries,
often where specialphases exist.
attacked zones
g.b. prec.
• PittingDownward propagationof small pits & holes.
54
• Self-protecting metals!
-- Metal ions combine with O
to form a thin, adhering oxide layer that slows corrosion.
• Reduce T (slows kinetics of oxidation and reduction)
• Add inhibitors
-- Slow oxidation/reduction reactions by removing reactants
(e.g., remove O2 gas by reacting it w/an inhibitor).-- Slow oxidation reaction by attaching species to
the surface (e.g., paint it!).
Controlling Corrosion
Metal (e.g., Al, stainless steel)
Metal oxide
steel pipe
Mg anode
Cu wiree-
Earth
Mg2+
e.g., Mg Anode
• Cathodic (or sacrificial) protection
-- Attach a more anodic material to the one to be protected.
Adapted from Fig. 17.23, Callister 7e. steel
zinczinc
Zn2+
2e- 2e-
e.g., zinc-coated nail
55
Materials Science Review:
Diffusion & Phase Diagrams
10
56
• In an alloy, atoms or vacancies tend to migrate from regions
of high conc. to regions of low conc.
Initially
Diffusion
After some time
Vacancy
t
57
Diffusion is important in defect movement
58
Diffusion
� Fick’s first law of diffusion:
� D, diffusion coefficient or
diffusivity, depends on the
material (D0), activation
energy (Q), and temperature
−=dx
dCDJ
−=kT
QDD O exp
59
Diffusion and Temperature
• Diffusion coefficient increases with increasing T.
= pre-exponential [m2/s]
= diffusion coefficient [m2/s]
= activation energy [J/mol or eV/atom]
= gas constant [8.314 J/mol-K]
= absolute temperature [K]
D
Do
Q
R
T
−=RT
QDD O exp
60
Binary Isomorphous Phase Diagram (complete solubility, simplest form of PD)
• Indicate phases as function of T, Co, (and P). • Generally:
-binary systems: just 2 components.
-independent variables: T and Co (P = 1 atm is almost always used).
• Phase
Diagram
for Cu-Nisystem
• 2 phases:
L (liquid)
α (FCC solid solution)
• 3 phase fields: LL + αα
wt% Ni20 40 60 80 10001000
1100
1200
1300
1400
1500
1600T(°C)
L (liquid)
α(FCC solid solution)1084°C
1455°C
61
Binary Isomorphous Phase Diagram: Cu-Ni system (complete solubility)
wt% Ni20
1200
1300
30 40 50110 0
L (liquid)
α(solid)
T(°C)
A
35Co
L: 35wt%Ni
Cu-Ni
system
4635
4332
α: 43 wt% Ni
L: 32 wt% Ni
L: 24 wt% Ni
α: 36 wt% Ni
Bα: 46 wt% NiL: 35 wt% Ni
C
D
E
24 36
11
62
Binary Eutectic Alloy System
� In some binary alloy systems, components have limited solid solubility (or partial solubility)
• Eutectic composition
freezes at lower
temperature than all other compositions.
• This lowest temperature is
called eutectic temperature.
Example : Pb-Sn alloy.
2 components has a special composition
with a min. melting T.
Tm (Pb) = 327°C, Tm (Sn) = 232°C63
Binary Eutectic Alloy: Lead-Tin (Pb-Sn)
EUTECTIC POINT
LIQUID ONLY
SOLID ONLY
Liquid α solid solution + β solid solutionEutectic temperature
Cooling
α + β
2 phases (both are
solid)
EUTECTICTEMPERATURE
Means: Pb & Sn can only dissolve in each other partially
64
Eutectic composition & temperature
� Eutectic composition:
– 61.9 wt% Sn, 38.1 wt% Pb
� Eutectic temperature: 183°C
65
Binary Eutectic Alloy: Lead-Tin (Pb-Sn)
66
Eutectic Temp =
Eutectic Composition
67
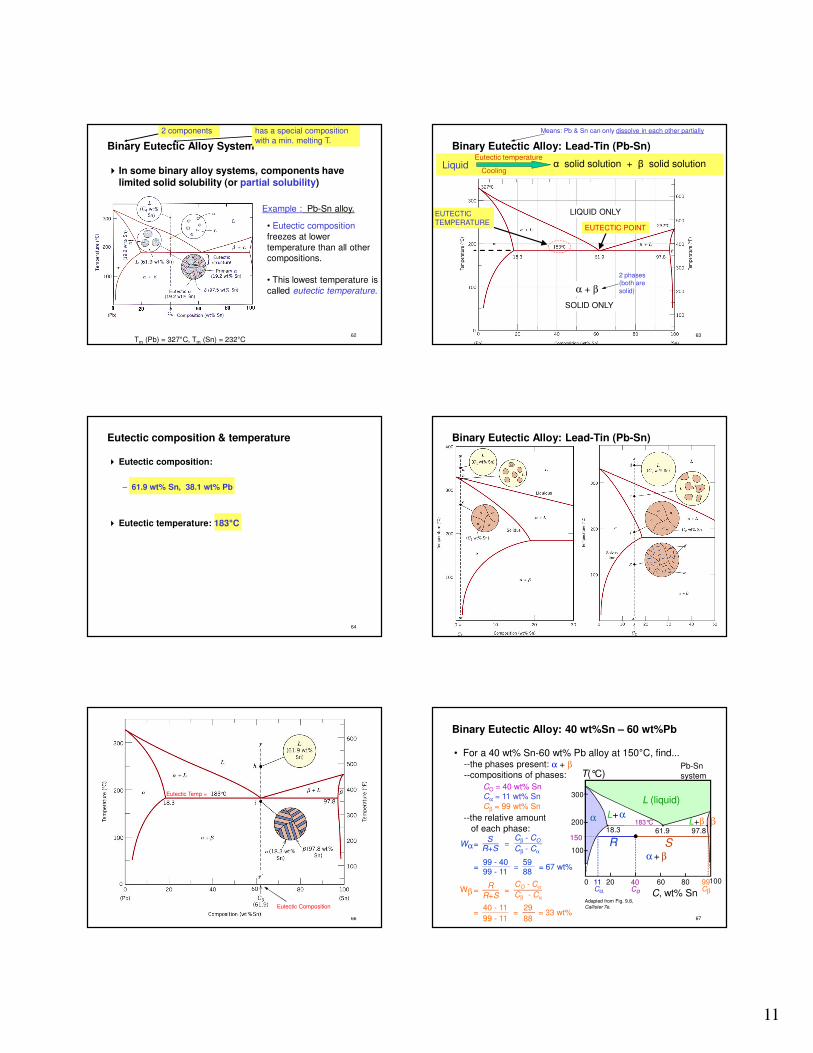
Binary Eutectic Alloy: 40 wt%Sn – 60 wt%Pb
L+αL+β
α + β
200
T(°C)
18.3
C, wt% Sn20 60 80 1000
300
100
L (liquid)
α183°C
61.9 97.8β
• For a 40 wt% Sn-60 wt% Pb alloy at 150°C, find...--the phases present: Pb-Sn
system
α + β--compositions of phases:
CO = 40 wt% Sn
--the relative amount
of each phase:150
40Co
11Cα
99Cβ
SR
Cα = 11 wt% Sn
Cβ = 99 wt% Sn
Wα=Cβ - CO
Cβ - Cα
=99 - 4099 - 11
=5988
= 67 wt%
SR+S
=
Wβ =CO - Cα
Cβ - Cα=
R
R+S
=29
88= 33 wt%=
40 - 11
99 - 11
Adapted from Fig. 9.8, Callister 7e.
12
68
L+β
α + β
200
T(°C)
C, wt% Sn20 60 80 1000
300
100
L (liquid)
α β
L+α
183°C
• For a 40 wt% Sn-60 wt% Pb alloy at 220°C, find...--the phases present: Pb-Sn
system
Adapted from Fig. 9.8, Callister 7e.
Example: Pb-Sn Eutectic System
α + L--compositions of phases:
CO = 40 wt% Sn
--the relative amount
of each phase:
Wα =CL - CO
CL - Cα=
46 - 40
46 - 17
=6
29= 21 wt%
WL =CO - Cα
CL - Cα=
23
29= 79 wt%
40Co
46CL
17Cα
220SR
Cα = 17 wt% SnCL = 46 wt% Sn
69
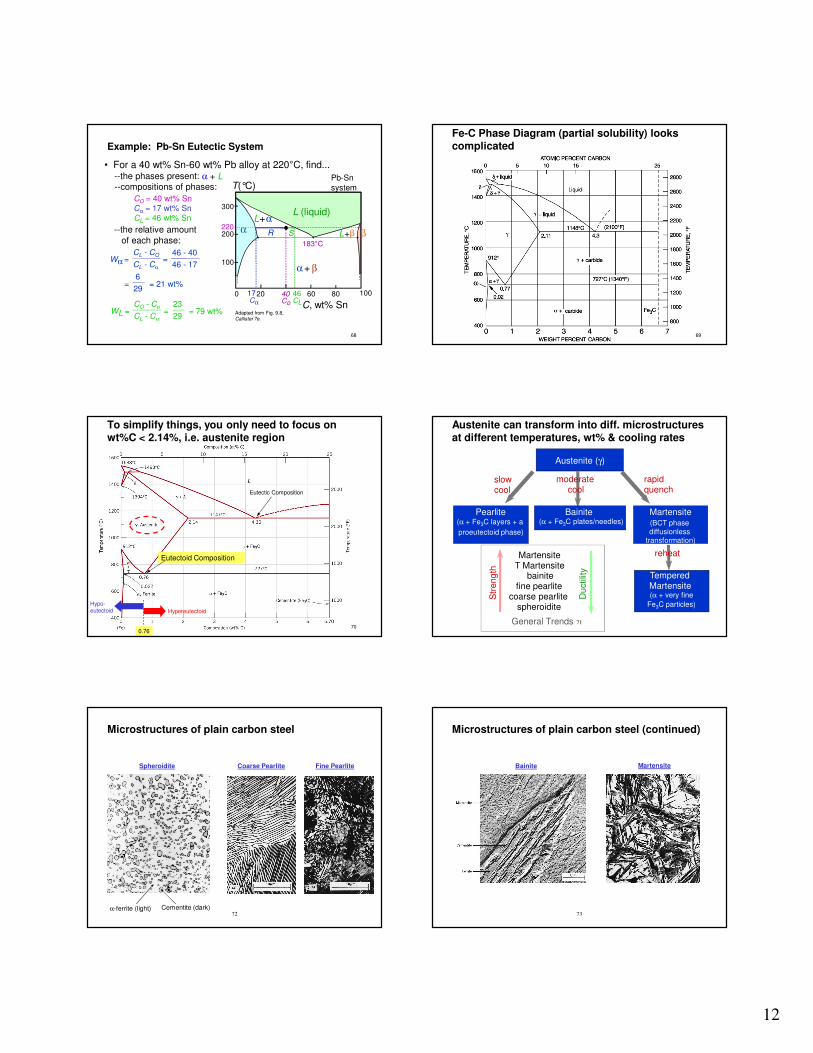
Fe-C Phase Diagram (partial solubility) looks complicated
70
To simplify things, you only need to focus on wt%C < 2.14%, i.e. austenite region
Hypereutectoid
0.76
Hypo-eutectoid
Eutectic Composition
Eutectoid Composition
71
Austenite can transform into diff. microstructures at different temperatures, wt% & cooling rates
Austenite (γ)
Bainite(α + Fe3C plates/needles)
Pearlite(α + Fe3C layers + a
proeutectoid phase)
Martensite(BCT phase diffusionless
transformation)
Tempered Martensite (α + very fine
Fe3C particles)
slow cool
moderatecool
rapid quench
reheat
Str
ength
Ductilit
y
Martensite T Martensite
bainite fine pearlite
coarse pearlite spheroidite
General Trends
72
Microstructures of plain carbon steel
Spheroidite Coarse Pearlite Fine Pearlite
α-ferrite (light) Cementite (dark)73
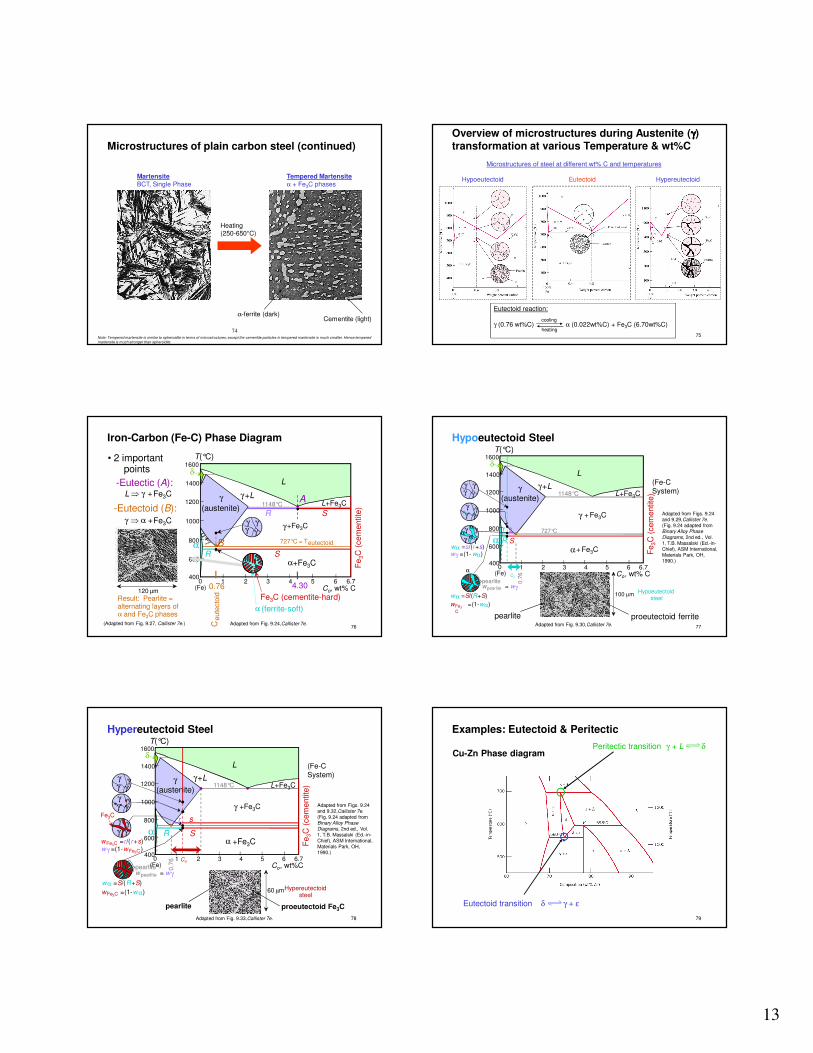
Microstructures of plain carbon steel (continued)
Bainite Martensite
13
74
Microstructures of plain carbon steel (continued)
MartensiteBCT, Single Phase
Tempered Martensiteα + Fe3C phases
Heating(250-650°C)
α-ferrite (dark)Cementite (light)
Note: Tempered martensite is similar to spheroidite in terms of microstructures, except the cementite particles in tempered martensite is much smaller. Hence tempered
martensite is much stronger than spheroidite
75
Overview of microstructures during Austenite (γγγγ) transformation at various Temperature & wt%C
Microstructures of steel at different wt% C and temperatures
Hypoeutectoid Eutectoid Hypereutectoid
Eutectoid reaction:
γ (0.76 wt%C) α (0.022wt%C) + Fe3C (6.70wt%C)heating
cooling
76
Iron-Carbon (Fe-C) Phase Diagram
• 2 important points
-Eutectoid (B):γ ⇒ α +Fe3C
-Eutectic (A):L ⇒ γ +Fe3C
Adapted from Fig. 9.24,Callister 7e.
Fe
3C
(cem
entite
)
1600
1400
1200
1000
800
600
4000 1 2 3 4 5 6 6.7
L
γ (austenite)
γ+L
γ+Fe3C
α+Fe3C
L+Fe3C
δ
(Fe) Co, wt% C
1148°C
T(°C)
α 727°C = Teutectoid
A
SR
4.30
Result: Pearlite = alternating layers of α and Fe3C phases
120 µm
(Adapted from Fig. 9.27, Callister 7e.)
γ γγγ
R S
0.76
Ceute
cto
id
B
Fe3C (cementite-hard)
α (ferrite-soft)
77
Hypoeutectoid Steel
Adapted from Figs. 9.24 and 9.29,Callister 7e. (Fig. 9.24 adapted from Binary Alloy Phase Diagrams, 2nd ed., Vol. 1, T.B. Massalski (Ed.-in-Chief), ASM International, Materials Park, OH, 1990.)
Fe
3C
(cem
entite
)
1600
1400
1200
1000
800
600
4000 1 2 3 4 5 6 6.7
L
γ (austenite)
γ+L
γ + Fe3C
α+ Fe3C
L+Fe3C
δ
(Fe) Co, wt% C
1148°C
T(°C)
α727°C
(Fe-C System)
C0
0.7
6
Adapted from Fig. 9.30,Callister 7e.
proeutectoid ferritepearlite
100 µmHypoeutectoid
steel
R S
α
wα =S/(R+S)
wFe3
C
=(1-wα)
wpearlite = wγpearlite
r s
wα =s/(r+s)wγ =(1- wα)
γγ γ
γα
αα
γγγ γ
γ γγγ
78
Hypereutectoid Steel
Fe
3C
(cem
entite
)
1600
1400
1200
1000
800
600
4000 1 2 3 4 5 6 6.7
L
γ (austenite)
γ+L
γ +Fe3C
α +Fe3C
L+Fe3C
δ
(Fe) Co, wt%C
1148°C
T(°C)
α
Adapted from Figs. 9.24 and 9.32,Callister 7e. (Fig. 9.24 adapted from Binary Alloy Phase Diagrams, 2nd ed., Vol. 1, T.B. Massalski (Ed.-in-Chief), ASM International, Materials Park, OH, 1990.)
(Fe-C System)
0.7
6 Co
Adapted from Fig. 9.33,Callister 7e.
proeutectoid Fe3C
60 µmHypereutectoid steel
pearlite
R S
wα =S/(R+S)
wFe3C=(1-wα)
wpearlite = wγpearlite
sr
wFe3C=r/(r+s)
wγ =(1-w Fe3C)
Fe3C
γγγ γ
γγγ γ
γγγ γ
79
Examples: Eutectoid & Peritectic
Cu-Zn Phase diagram
Eutectoid transition δ γ + ε
Peritectic transition γ + L δ
14
80
Eutectic, peritectic, eutectoid, peritectoid
81
Classification of Steels
� Three designation schemes or “standards” by
– AISI: American Iron & Steel Institute (ferrous)
– SAE: Society of Automotive Engineers (ferrous)
– UNS: Unified Numbering System (ferrous & non-ferrous
alloys)
AISI/SAEAISI/SAE UNSUNS
1040 G10400
Examples of Alloy Code:13 – only Mn
40 – Mo only41 – Cr & Mo43 – Ni, Cr & Mo
46 – Ni & Mo (<2%Ni)48 – Ni & Mo (>3%Ni)51 – Cr only
61 – Cr & V86 – Ni, Cr, Mo92 – Si only
Type of AlloyType of Alloy wt% of Cwt% of C
“40” = 0.40 wt%C“10” = Plain carbon steel
82
AISI/SAE & UNS Designation System
83
Annealing: Heat to Tanneal, then cool slowly.
Thermal Processing of Steel (same for other metals)
Types of Annealing
• Process Anneal:
Negate effect of cold working by (recovery/ recrystallization)
• Stress Relief: Reducestress caused by:
-plastic deformation -nonuniform cooling -phase transform.
• Normalize (steels): Deform steel with largegrains, then normalizeto make grains small.
• Full Anneal (steels): Make soft steels for good forming by heating to get γ, then cool in
furnace to get coarse P.
• Spheroidize (steels): Make very soft steels for good machining. Heat just
below TE & hold for
15-25 h.
84
a) Annealing
b) Quenching
Heat Treatments
c)
c) Tempered Martensite
time (s)10 10
310
510
-1
400
600
800
T(°C)
Austenite (stable)
200
P
B
TEA
A
M + A
M + A
0%
50%
90%a)
b)
85
Thermal Processing – Time-Temperature-Transformation Diagram
15
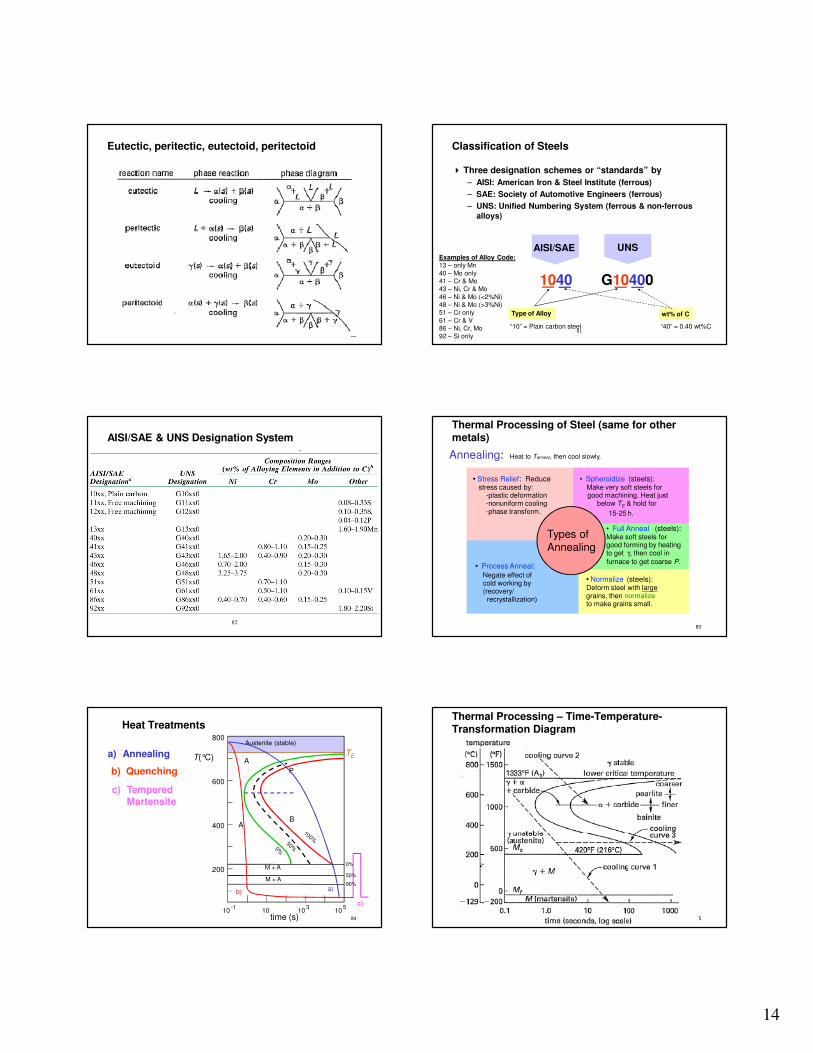
Jominy End-Quench Test – Measure Ease of attaining hardness by quenching from austenite
� Hardenability = Ability to form martensite
� Jominy end-quench test to measure hardenability
� Hardness versus distance
from the quenched end
86
24°C water
specimen (heated to γphase field)
flat ground
Rockwell Chardness tests
Ha
rdn
ess, H
RC
Distance from quenched end 87
88
• The cooling rate varies with position.
Why Hardness Changes w/ Position
distance from quenched end (in)Hard
ness,
HR
C
20
40
60
0 1 2 3
600
400
200A → M
0.1 1 10 100 1000
T(°C)
M(start)
Time (s)
0
0%
100%
M(finish)
89
• Effect of quenching medium:
Medium
airoil
water
Severity of Quench
lowmoderate
high
Hardness
lowmoderate
high
• Effect of geometry:
When surface-to-volume ratio increases: (SA/V = 2/R)
--cooling rate increases--hardness increases
Position
centersurface
Cooling rate
lowhigh
Hardness
lowhigh
Quenching Medium & Geometry
S (Surface)
¾-R (3/4 Radius)
M-R (Mid Radius)C (Center)
1
23
Cross Section
of Bar
90
S (Surface)
¾-R (3/4 Radius)
C (Center)
M-R (Mid Radius)
91
S (Surface)
¾-R (3/4 Radius)
C (Center)
M-R (Mid Radius)
16
92
ASTM Grain Size
93
Materials Science Review:
Polymer, Composites, Concrete
Polymers
�Thermoplastics
– Can be heated to high
temp & reformed
– E.g. Polyethylene,
polycarbonate, PMMA, Polystyrene,
Polypropylene, PVC
�Thermoset Plastic
– Cannot be reformed
because of cross linkages between
polymer chains
– E.g. vulcanized rubber,
epoxy resins
94 95
Most commodity polymers are thermoplatics
Poly(ethylene terephthalate)
High density polyethylene
1
2
3 Poly(vinyl chloride)
Low density polyethylene
Polypropylene
4
5
6 Polystyrene
PET
Code Letter ID Polymer Name
HDPE
V
LDPE
PP
PS
96
Microstructures of polymers: Amorphous, Crystalline, and Semi-crystalline polymers
� Amorphous polymer
– Mixture of short and long chains
– No long-range order; “random”
– “A bowl of cooked spaghetti”
� Crystalline polymer
– Long-range order
– “A box of uncooked spaghetti”
� Semicrystalline polymer
– Consists of amorphous and
crystalline regions
– “Mixture of cooked & uncooked
spaghetti” or “half-cooked spaghetti”
Crystalline
Amorphous97
Temp greatly affects mech. properties of thermoplastic ���� Transition Temp (Tg) is key
� Thermoplastics soften (becoming more viscous) as
temperature increases.
� Strength dramatically decreases above Tg.
UTS
Temperature
17
98
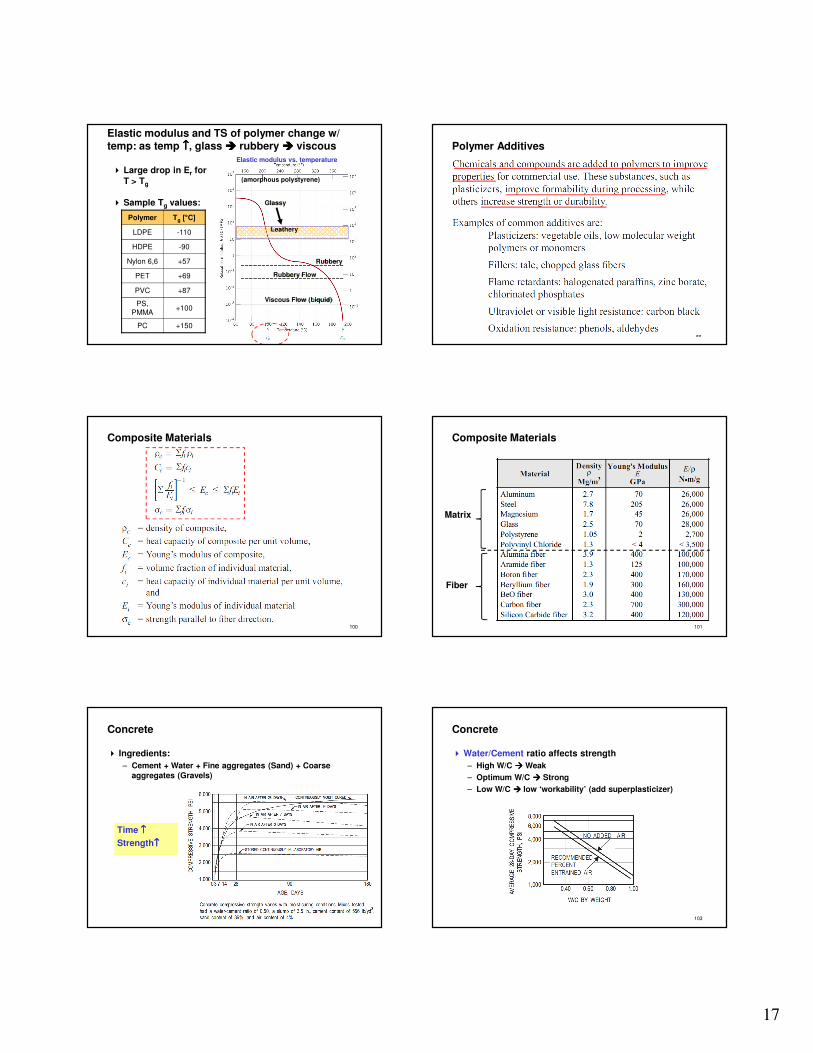
Elastic modulus and TS of polymer change w/ temp: as temp ↑↑↑↑, glass ���� rubbery ���� viscous
� Large drop in Er for
T > Tg
� Sample Tg values:
Leathery
Glassy
Rubbery
Rubbery Flow
Viscous Flow (Liquid)
Polymer Tg [°C]
LDPE -110
HDPE -90
Nylon 6,6 +57
PET +69
PVC +87
PS, PMMA
+100
PC +150
Elastic modulus vs. temperature
(amorphous polystyrene)
Polymer Additives
99
Composite Materials
100
Composite Materials
101
Matrix
Fiber
Concrete
� Ingredients:
– Cement + Water + Fine aggregates (Sand) + Coarse
aggregates (Gravels)
102
Time ↑ ↑ ↑ ↑
Strength↑↑↑↑
Concrete
� Water/Cement ratio affects strength
– High W/C ���� Weak
– Optimum W/C ���� Strong
– Low W/C ���� low ‘workability’ (add superplasticizer)
103


![[PPT]“The Nation and its Fragments” - San Francisco State ...online.sfsu.edu/nfwatts/TurkeyNationandFragments.ppt · Web view... Kurdish peripheral nationalism Early uprisings](https://img.pdfslide.net/doc/110x75/5aa274b17f8b9ab4208d11c1/pptthe-nation-and-its-fragments-san-francisco-state-view-kurdish.jpg)