Embed Size (px)
Citation preview
Regional Educational Laboratory at EDCrelnei.org
Practitioner Data Use Workshop
DateLocation
Presenters
1
Regional Educational Laboratory at EDCrelnei.org
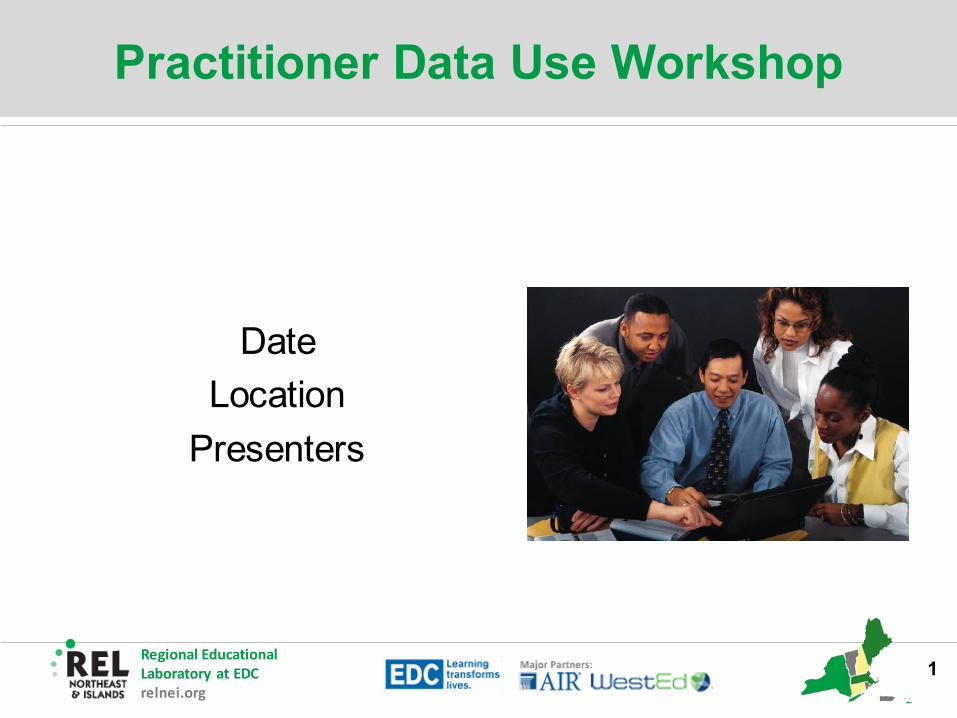
What is a Regional Educational Laboratory?
• Network of 10 RELs across the country
• Help states and districts use research and data to inform policy and practice with the goal of improving student outcomes
• Funded by USED Institute of Education Sciences
ies.ed.gov/ncee/edlabs/
2
Regional Educational Laboratory at EDCrelnei.org
Goals for TodayDuring the workshop, participants will: • Become familiar with an inquiry framework for interpreting
data.• Be introduced to common first steps in data use, such as
determining the questions to be answered with data and building data literacy.
• Engage in a protocol to analyze data and identify a student learning challenge.
• Generate possible root causes that contribute to a student learning challenge and possible related teacher actions.
• Draft student learning goals and action plans.• Review how to monitor results.
3
Regional Educational Laboratory at EDCrelnei.org
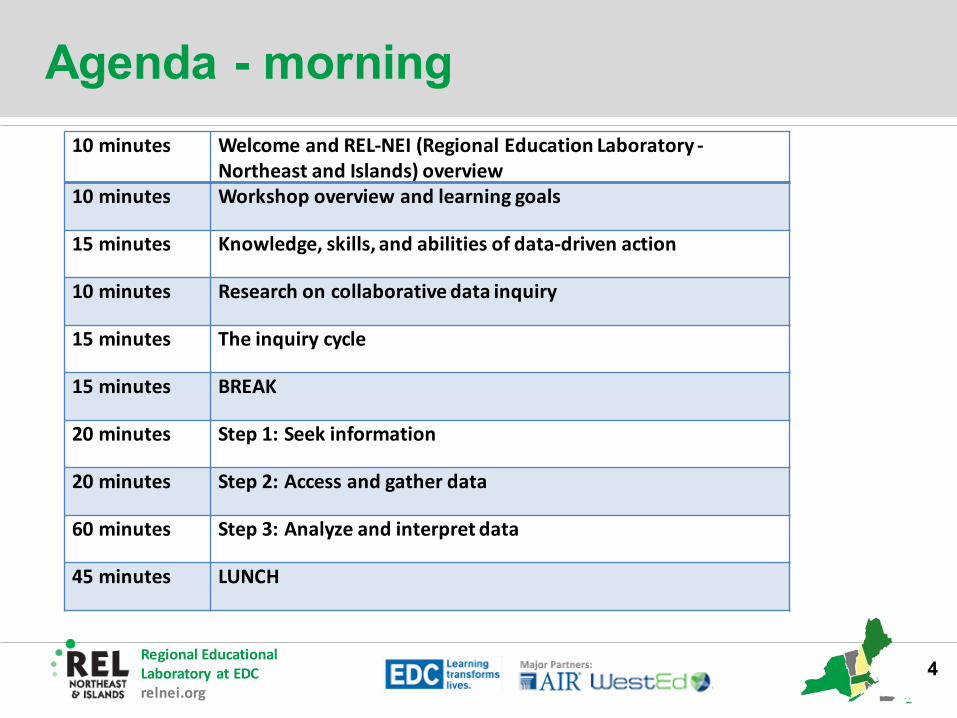
Agenda - morning
4
10 minutes Welcome and REL-NEI (Regional Education Laboratory -Northeast and Islands) overview Workshop overview and learning goals10 minutes
15 minutes Knowledge, skills, and abilities of data-driven action
10 minutes Research on collaborative data inquiry
15 minutes The inquiry cycle
15 minutes BREAK
20 minutes Step 1: Seek information
20 minutes Step 2: Access and gather data
60 minutes Step 3: Analyze and interpret data
LUNCH45 minutes
Regional Educational Laboratory at EDCrelnei.org
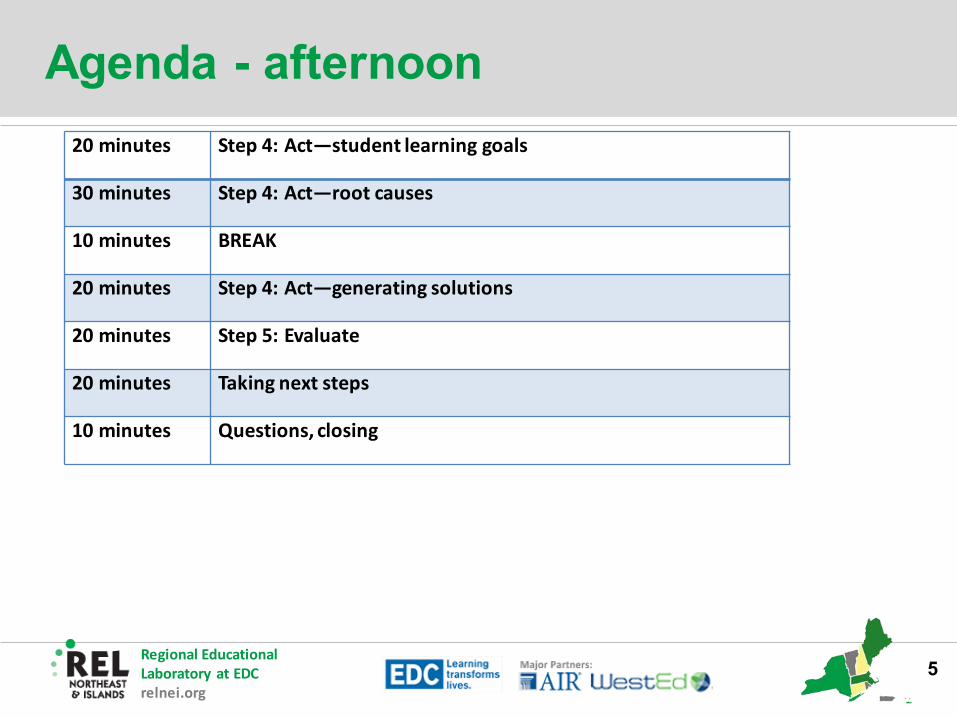
Agenda - afternoon
5
20 minutes Step 4: Act—student learning goals
30 minutes Step 4: Act—root causes
10 minutes BREAK
20 minutes Step 4: Act—generating solutions
20 minutes Step 5: Evaluate
20 minutes Taking next steps
Questions, closing10 minutes
Regional Educational Laboratory at EDCrelnei.org
Knowledge, skills, and abilities for data-driven action
• What data do you encounter in your job?
• In what format do the data appear?
• How do you use the data?
6

Regional Educational Laboratory at EDCrelnei.org
Knowledge, skills, and abilities for data-driven action
7
Educators use data to:
Make instructional decisions• Identify where classes
or students are succeeding or struggling
• Modify, adjust, or differentiate instruction
Set goals• Classroom or student
goals• Professional practice
or teacher goals
Engage in collaborative decisionmaking• Design extra supports
and services for students
• Learn from other teachers’ successful practices
Regional Educational Laboratory at EDCrelnei.org
Handout 3: Knowledge, skills, and abilities for data-driven action
Compare your lists of data use with the skills and abilities listed in the handout.
• Which of these do you participate in regularly at your school?
• Which skill do you feel most comfortable with?
• Which skill do you feel least comfortable with?
8
Regional Educational Laboratory at EDCrelnei.org
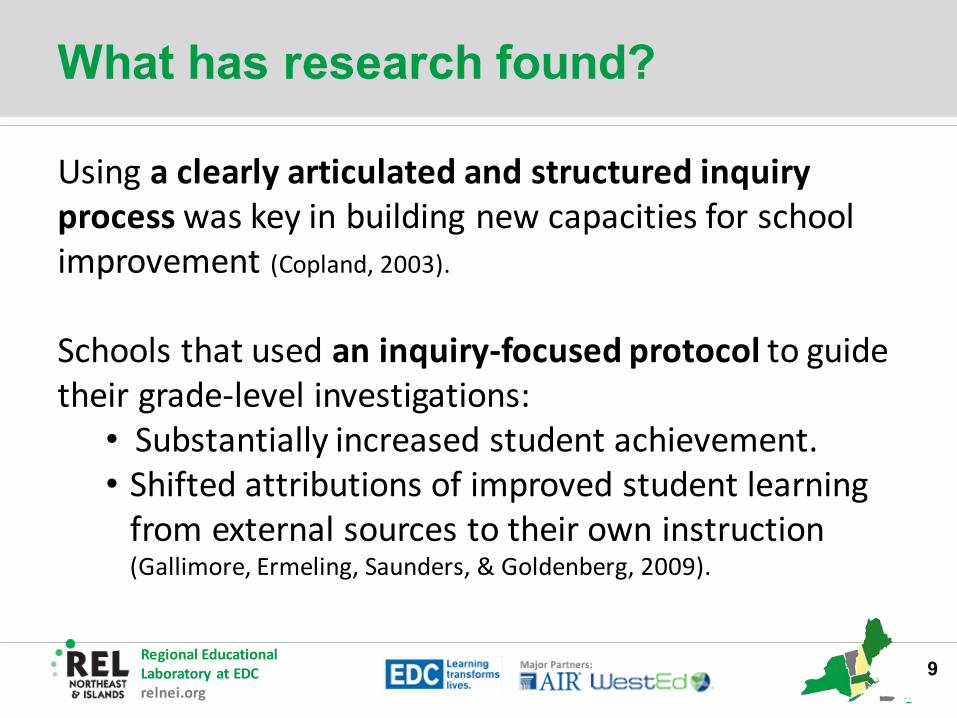
What has research found?
9
Using a clearly articulated and structured inquiry process was key in building new capacities for school improvement (Copland, 2003).
Schools that used an inquiry-focused protocol to guide their grade-level investigations:
• Substantially increased student achievement.• Shifted attributions of improved student learning
from external sources to their own instruction (Gallimore, Ermeling, Saunders, & Goldenberg, 2009).
Regional Educational Laboratory at EDCrelnei.org
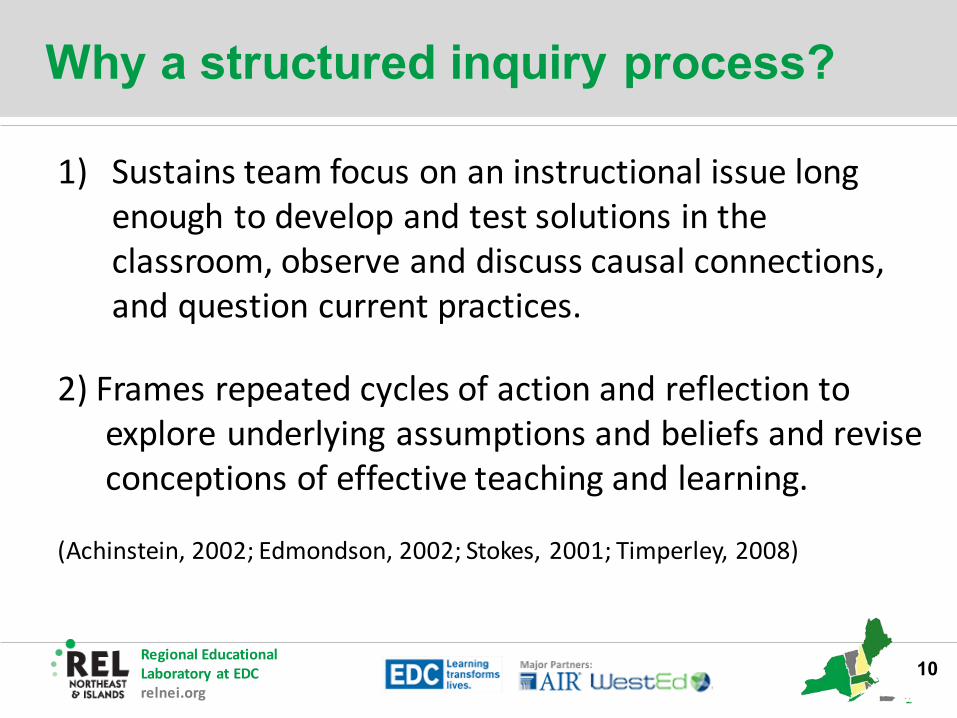
Why a structured inquiry process?
10
1) Sustains team focus on an instructional issue long enough to develop and test solutions in the classroom, observe and discuss causal connections, and question current practices.
2) Frames repeated cycles of action and reflection to explore underlying assumptions and beliefs and revise conceptions of effective teaching and learning.
(Achinstein, 2002; Edmondson, 2002; Stokes, 2001; Timperley, 2008)
Regional Educational Laboratory at EDCrelnei.org
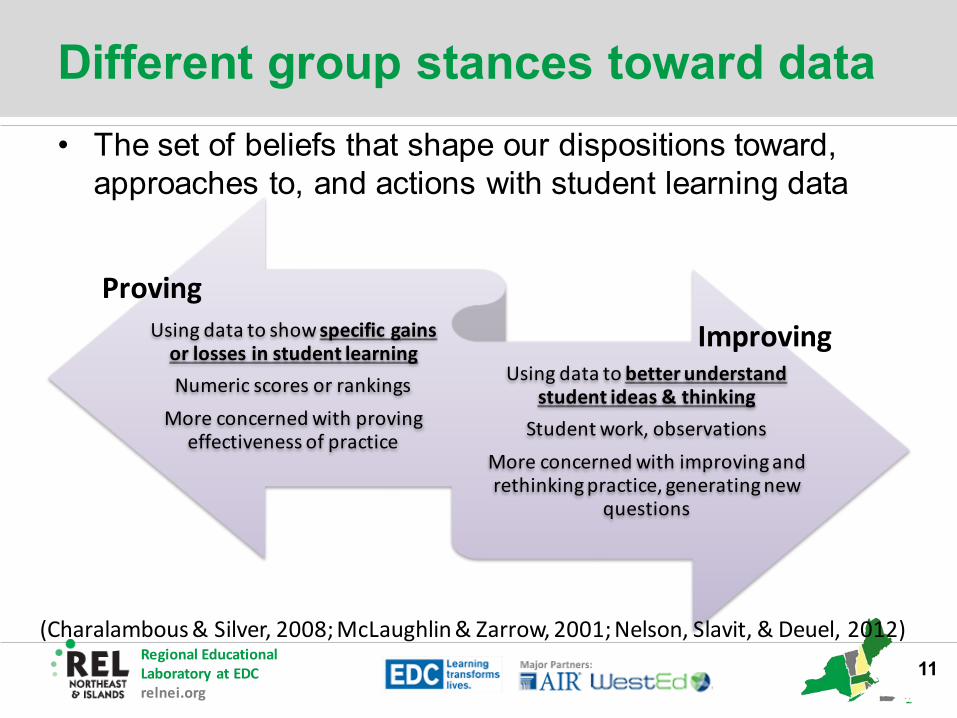
Different group stances toward data• The set of beliefs that shape our dispositions toward,
approaches to, and actions with student learning data
11
(Charalambous & Silver, 2008; McLaughlin & Zarrow, 2001; Nelson, Slavit, & Deuel, 2012)
ProvingUsing data to show specific gains
or losses in student learningNumeric scores or rankings
More concerned with proving effectiveness of practice
ImprovingUsing data to better understand
student ideas & thinkingStudent work, observations
More concerned with improving and rethinking practice, generating new
questions

Regional Educational Laboratory at EDCrelnei.org
Reactions to the research
• What is your reaction to the research on collaborative inquiry and data use?
• What sounds familiar? Surprising?
• Why do you think there is more focus on collaborative, data-based inquiry in schools today?
12
Regional Educational Laboratory at EDCrelnei.org
Conceptualizing a data inquiry cycle
?
??
?
?
13

Regional Educational Laboratory at EDCrelnei.org
The inquiry cycle
14
National Forum on Education Statistics. (2012). Forum Guide to Taking Action with Education Data. (NFES 2013-801). U.S. Department of Education. Washington, DC: National Center for Education Statistics.
2. Access and gather
data
3. Analyze and
interpret data
4. Act
5. Evaluate
1. Seek information
Regional Educational Laboratory at EDCrelnei.org
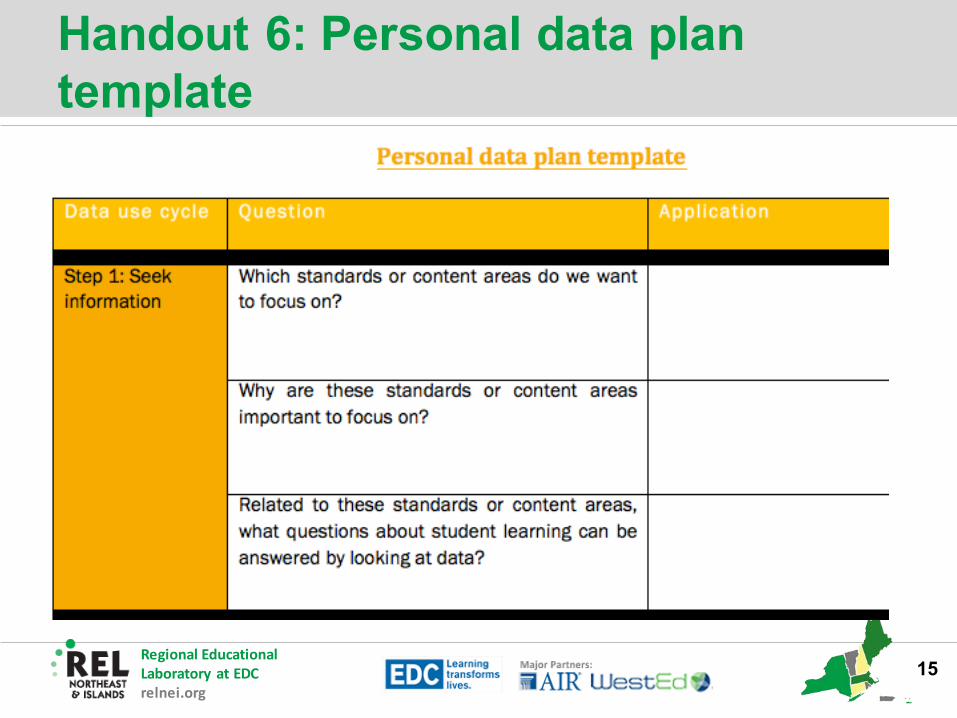
Handout 6: Personal data plan template
15
Regional Educational Laboratory at EDCrelnei.org
16
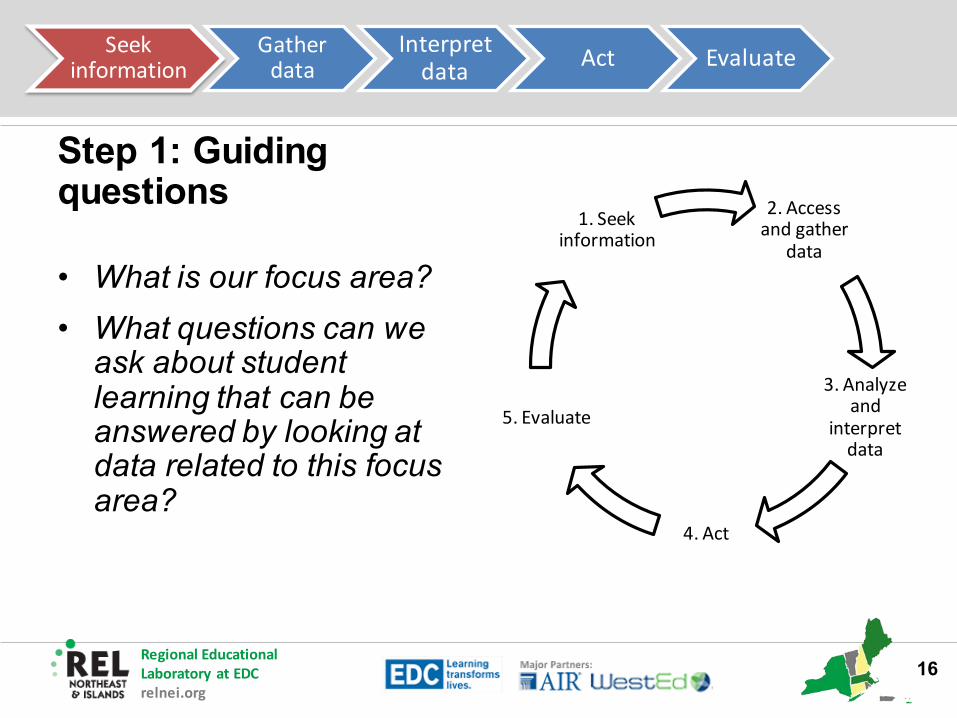
Seek information
Gather data
Interpret data Act Evaluate
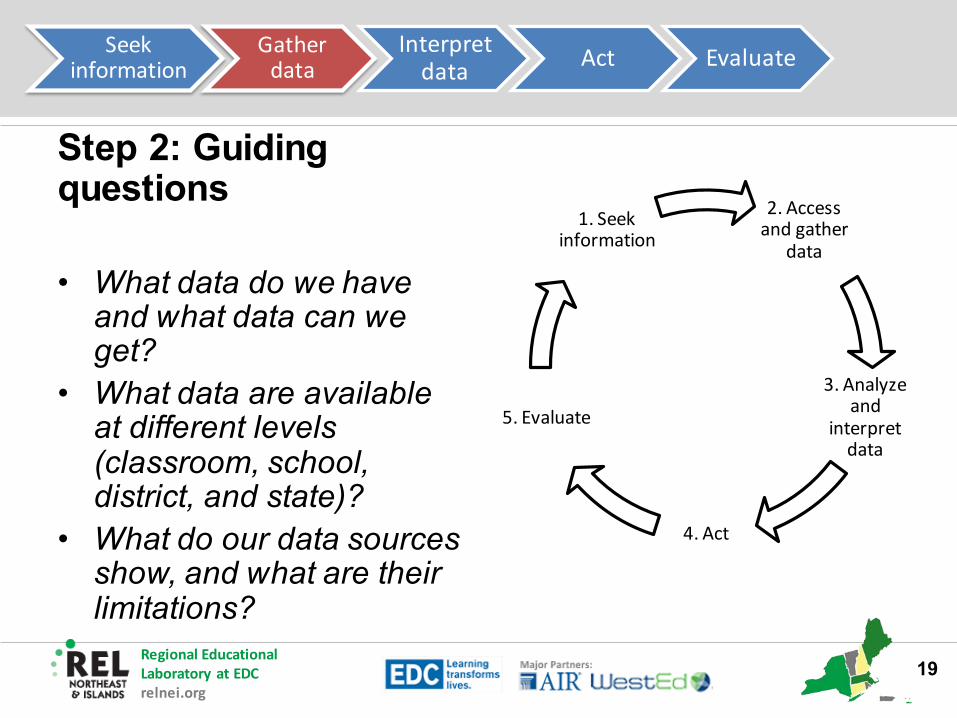
Step 1: Guiding questions
• What is our focus area? • What questions can we
ask about student learning that can be answered by looking at data related to this focus area?
2. Access and gather
data
3. Analyze and
interpret data
4. Act
5. Evaluate
1. Seek information
Regional Educational Laboratory at EDCrelnei.org
17
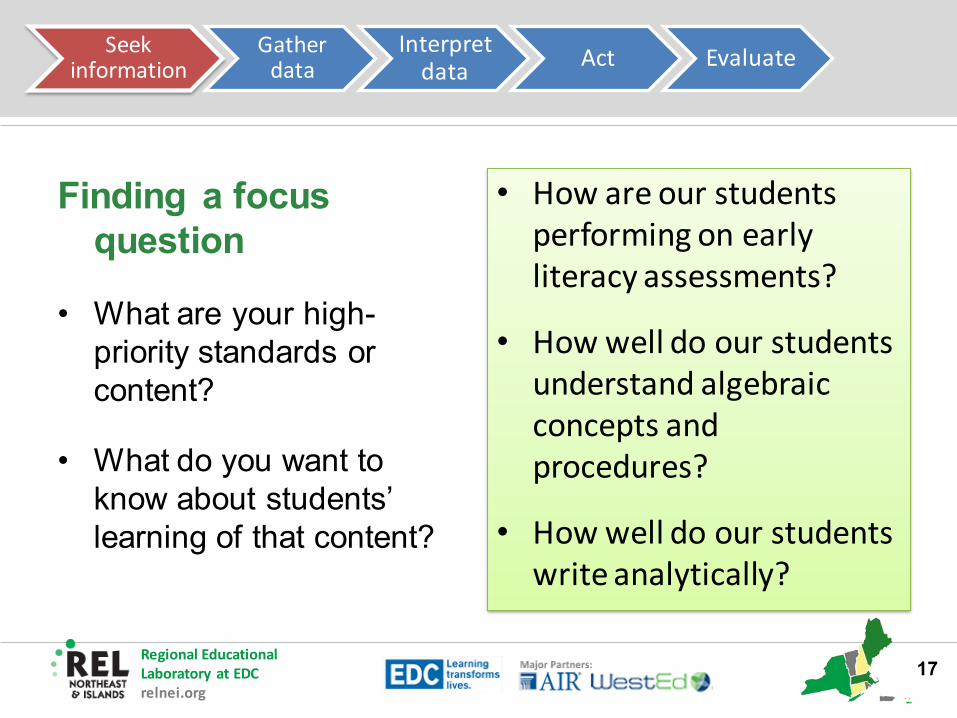
Seek information
Gather data
Interpret data Act Evaluate
Finding a focus question
• What are your high-priority standards or content?
• What do you want to know about students’ learning of that content?
• How are our students performing on early literacy assessments?
• How well do our students understand algebraic concepts and procedures?
• How well do our students write analytically?
Regional Educational Laboratory at EDCrelnei.org
18
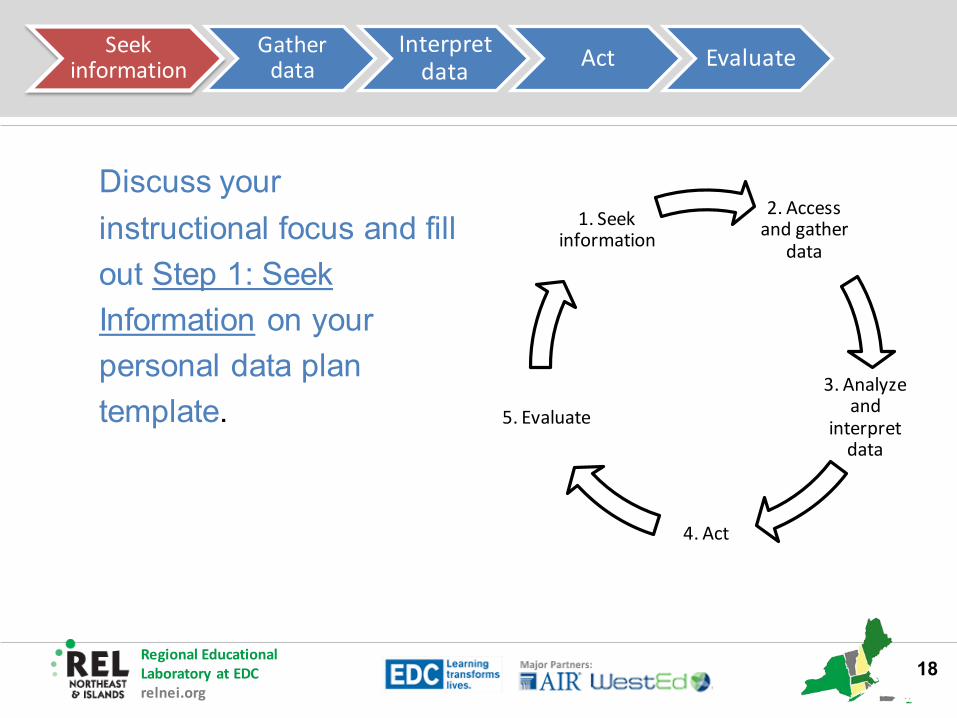
Seek information
Gather data
Interpret data Act Evaluate
Discuss your instructional focus and fill out Step 1: Seek Information on your personal data plan template.
2. Access and gather
data
3. Analyze and
interpret data
4. Act
5. Evaluate
1. Seek information
Regional Educational Laboratory at EDCrelnei.org
19
Seek information
Gather data
Interpret data Act Evaluate
Step 2: Guiding questions
• What data do we have and what data can we get?
• What data are available at different levels (classroom, school, district, and state)?
• What do our data sources show, and what are their limitations?
2. Access and gather
data
3. Analyze and
interpret data
4. Act
5. Evaluate
1. Seek information
Regional Educational Laboratory at EDCrelnei.org
20
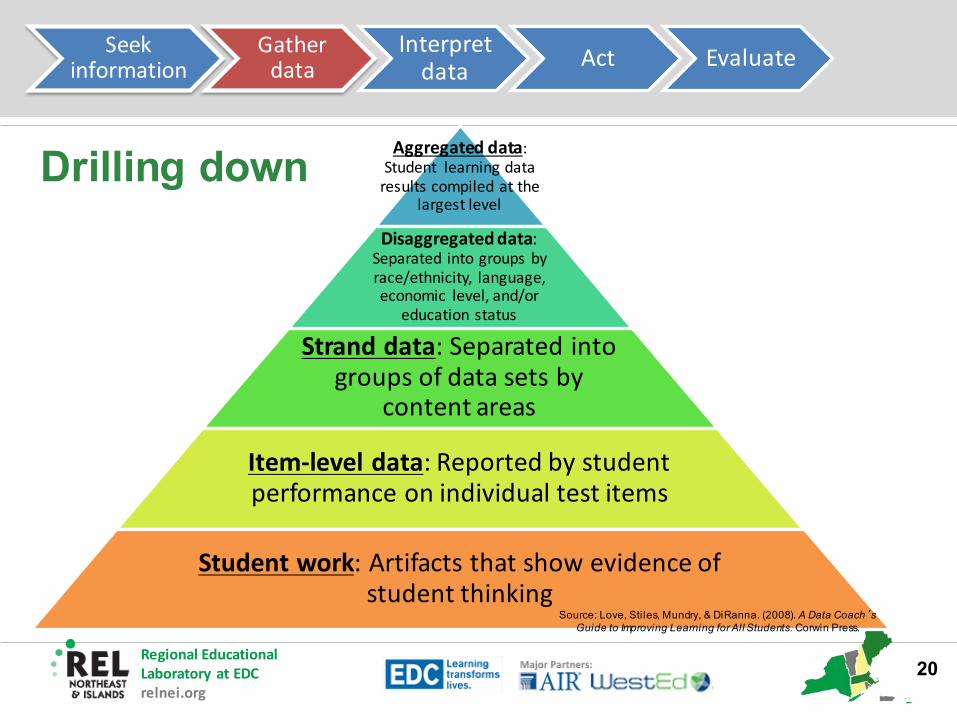
Source: Love, Stiles, Mundry, & DiRanna. (2008). A Data Coach’s Guide to Improving Learning for All Students. Corwin Press.
Seek information
Gather data
Interpret data Act Evaluate
Drilling down Aggregated data: Student learning data
results compiled at the largest level
Disaggregated data: Separated into groups by race/ethnicity, language, economic level, and/or
education status
Strand data: Separated into groups of data sets by
content areas
Item-level data: Reported by student performance on individual test items
Student work: Artifacts that show evidence of student thinking
Regional Educational Laboratory at EDCrelnei.org
21
Seek information
Gather data
Interpret data Act Evaluate
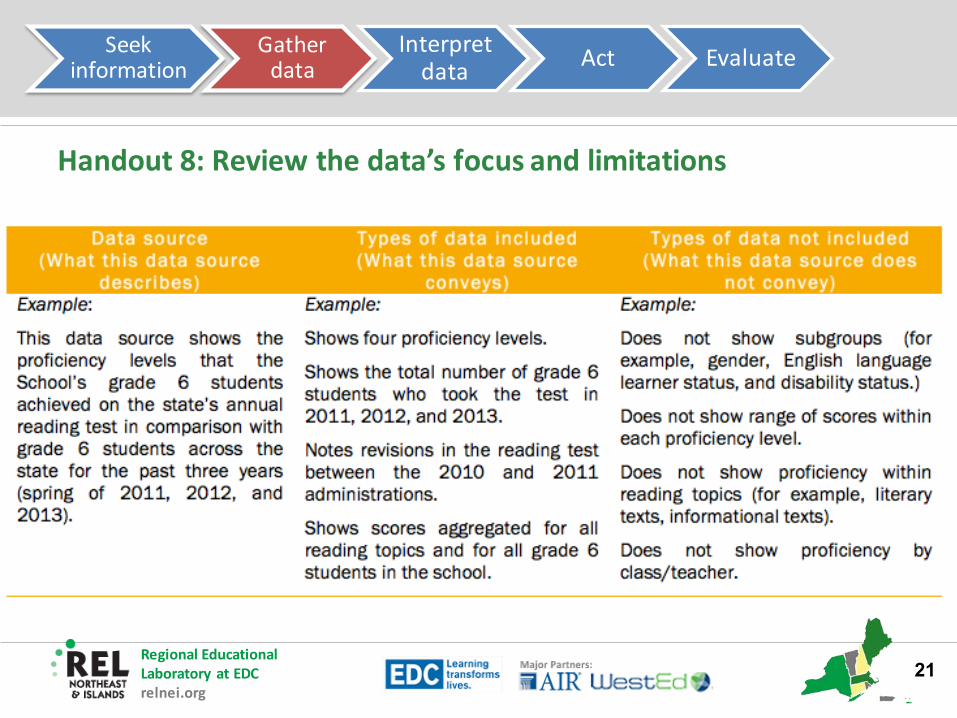
Handout 8: Review the data’s focus and limitations
Regional Educational Laboratory at EDCrelnei.org
22
Seek information
Gather data
Interpret data Act Evaluate
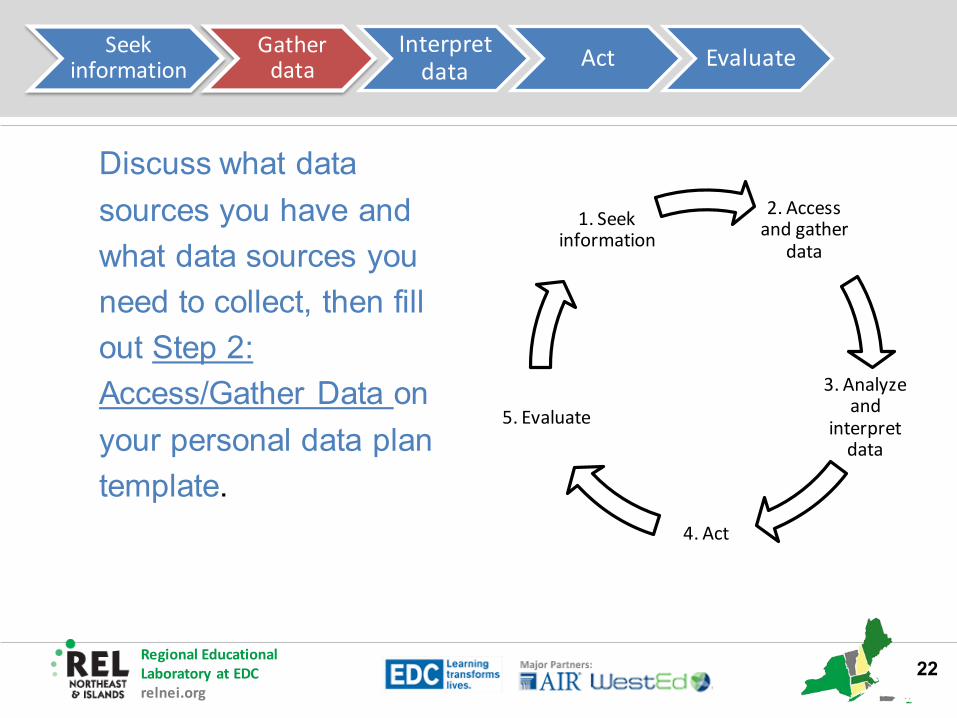
Discuss what data sources you have and what data sources you need to collect, then fill out Step 2: Access/Gather Data on your personal data plan template.
2. Access and gather
data
3. Analyze and
interpret data
4. Act
5. Evaluate
1. Seek information

Regional Educational Laboratory at EDCrelnei.org
23
Seek information
Gather data
Interpret data Act Evaluate
Step 3: Guiding questions
• What do we observe in the data? What patterns do we notice?
• What can we infer about our students’ strengths and challenges?
• Which challenge shall we address?
2. Access and gather
data
3. Analyze and
interpret data
4. Act
5. Evaluate
1. Seek information

Regional Educational Laboratory at EDCrelnei.org
24
Seek information
Gather data
Interpret data Act Evaluate
Tips for creating data displays
Provide complete title, labels to axes, and key
• Name of assessment
• Date
• Content area
• Grades tested
• Number of students (n=__)
Make chart simple and easy to read
• Minimize distracting elements (no grid lines)
• Appropriate fonts & color• Provide data point values
where helpful• Consistent scales when
comparisons are needed
Source: Boudett, City, & Murnane (2013). Data Wise: A Step-by-Step Guide to Using Assessment Data to Improve Teaching and Learning. Harvard Education Press. p. 82.
Regional Educational Laboratory at EDCrelnei.org
25
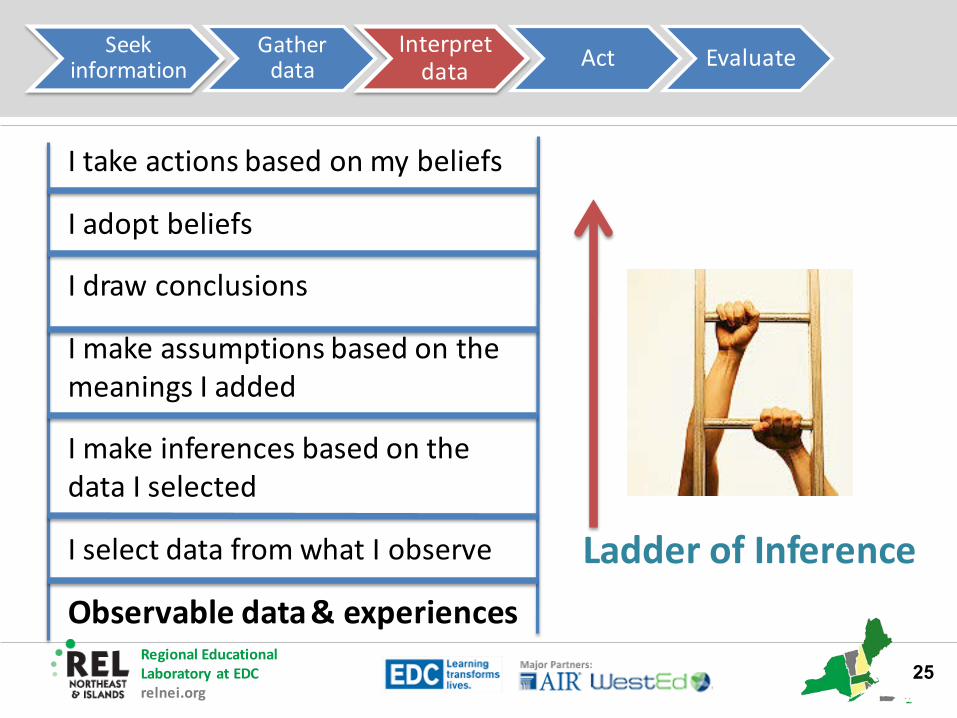
Ladder of Inference
Seek information
Gather data
Interpret data Act Evaluate
I take actions based on my beliefs
I adopt beliefs
I draw conclusions
I make assumptions based on the meanings I added
I make inferences based on the data I selected
I select data from what I observe
Observable data & experiences
Regional Educational Laboratory at EDCrelnei.org
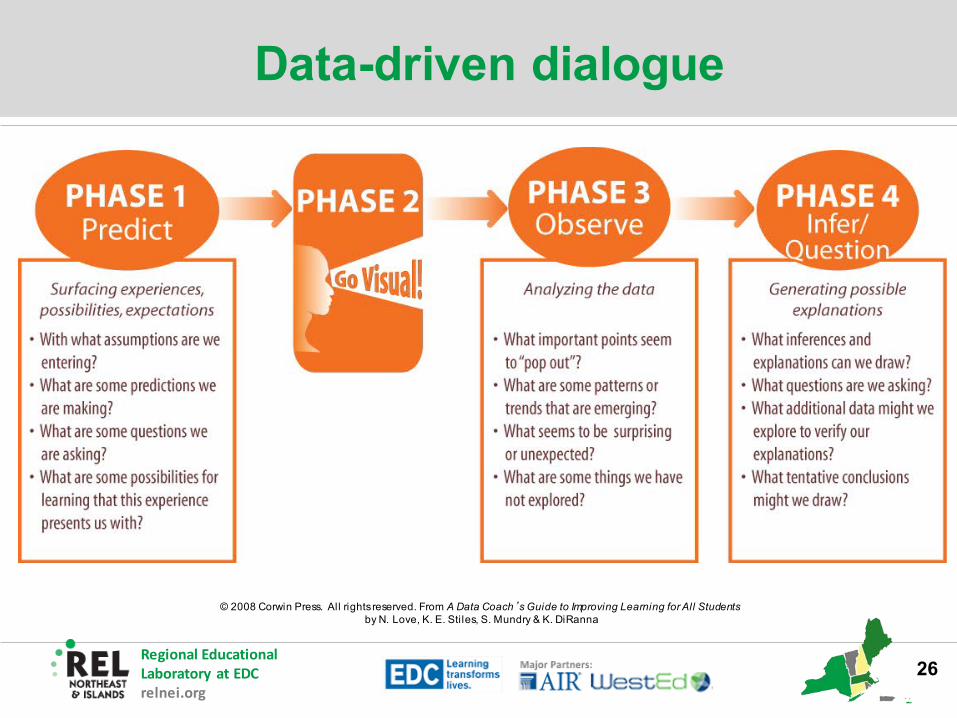
Data-driven dialogue
26
© 2008 Corwin Press. All rights reserved. From A Data Coach’s Guide to Improving Learning for All Studentsby N. Love, K. E. Stiles, S. Mundry & K. DiRanna

Regional Educational Laboratory at EDCrelnei.org
Select a student learning challengeExamples:• Based on assessments of early reading (for example,
Diagnostic Reading Assessment), students are scoring only 45% on letter-naming fluency.
• Based on 5th-grade end-of-unit writing portfolios and state writing test results, students are having difficulty citing evidence from literature or research to support their arguments.
• Based on 7th-grade standardized math assessment results and current benchmark assessments, 14% of students with disabilities meet the proficiency standard, compared with 77% of students without disabilities.
• Based on 10th-grade student science lab reports and end-of-unit exams, students have difficulty writing detailed discussions that compare and contrast findings from the experiment with other sources or explanations.
27
Regional Educational Laboratory at EDCrelnei.org
28
Seek information
Gather data
Interpret data Act Evaluate
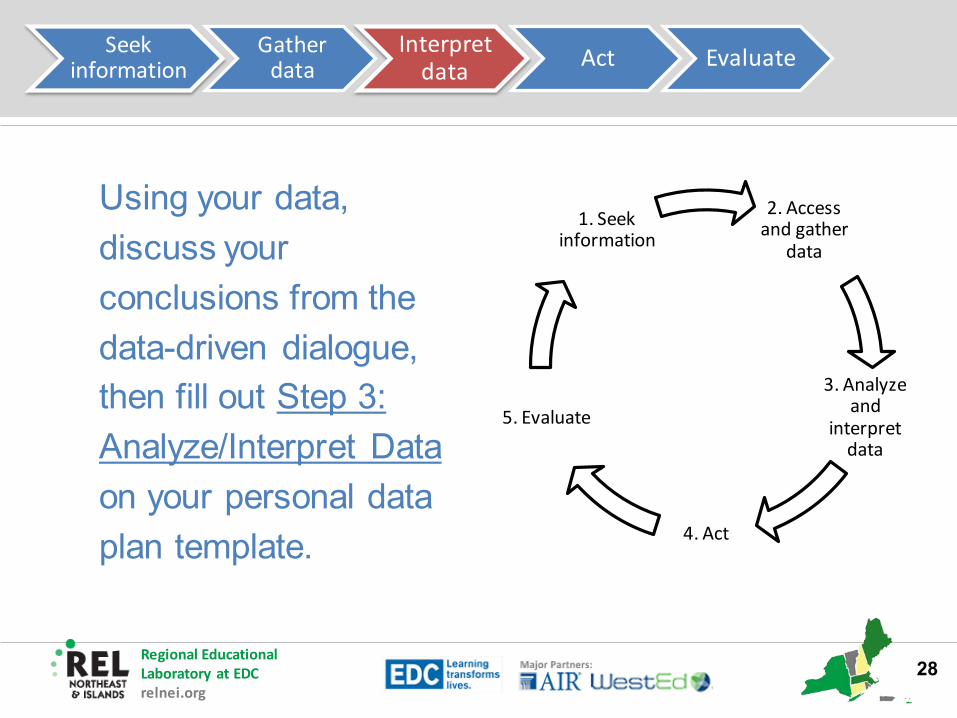
Using your data, discuss your conclusions from the data-driven dialogue, then fill out Step 3: Analyze/Interpret Data on your personal data plan template.
2. Access and gather
data
3. Analyze and
interpret data
4. Act
5. Evaluate
1. Seek information

Regional Educational Laboratory at EDCrelnei.org
29
Seek information
Gather data
Interpret data Act Evaluate
Step 4: Guiding questions
• What goals do we have for our students’ learning?
• What are the root causes that might have led to the patterns seen in student performance?
• What changes or action steps will address the goals we set for our students’ learning?
2. Access and gather
data
3. Analyze and
interpret data
4. Act
5. Evaluate
1. Seek information
Regional Educational Laboratory at EDCrelnei.org
30
Seek information
Gather data
Interpret data Act Evaluate
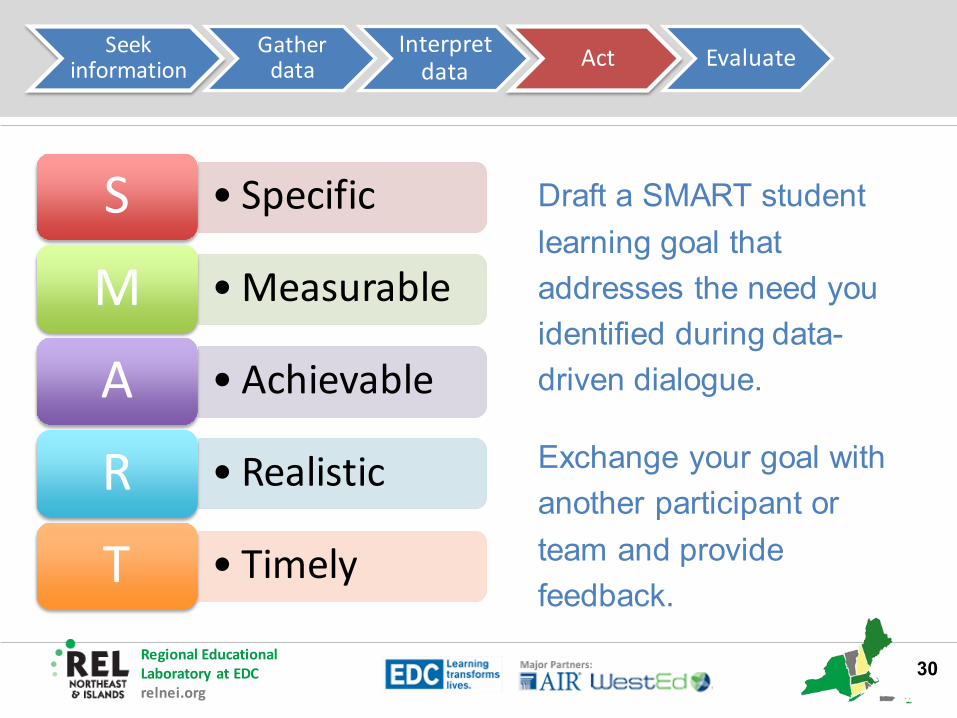
S • Specific
M • Measurable
A • Achievable
R • Realistic
T • Timely
Draft a SMART student learning goal that addresses the need you identified during data-driven dialogue.
Exchange your goal with another participant or team and provide feedback.
Regional Educational Laboratory at EDCrelnei.org
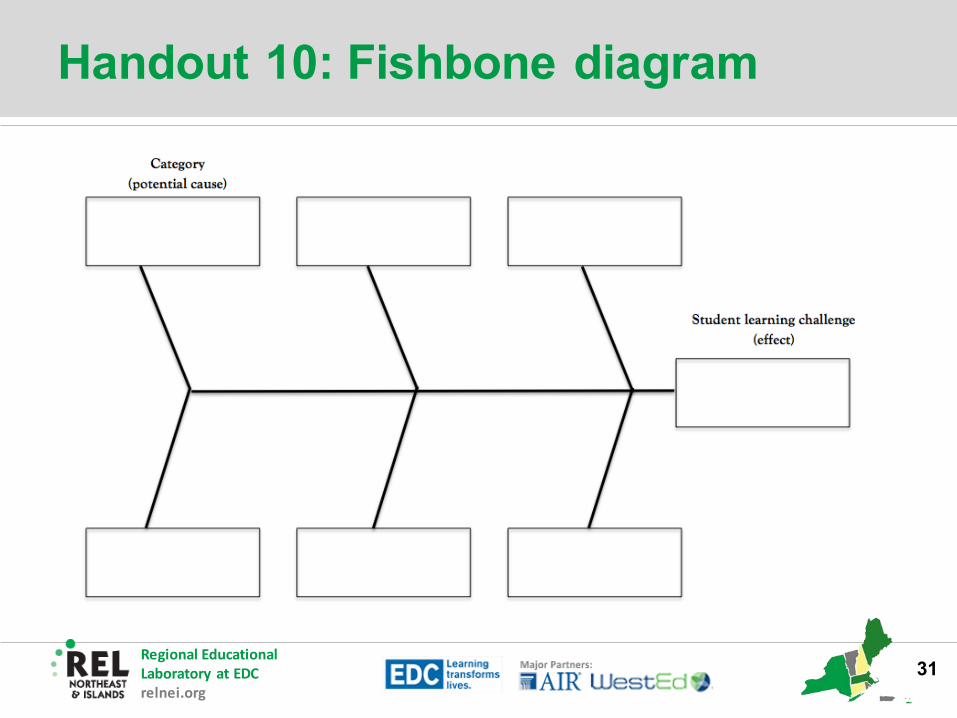
Handout 10: Fishbone diagram
31
Regional Educational Laboratory at EDCrelnei.org
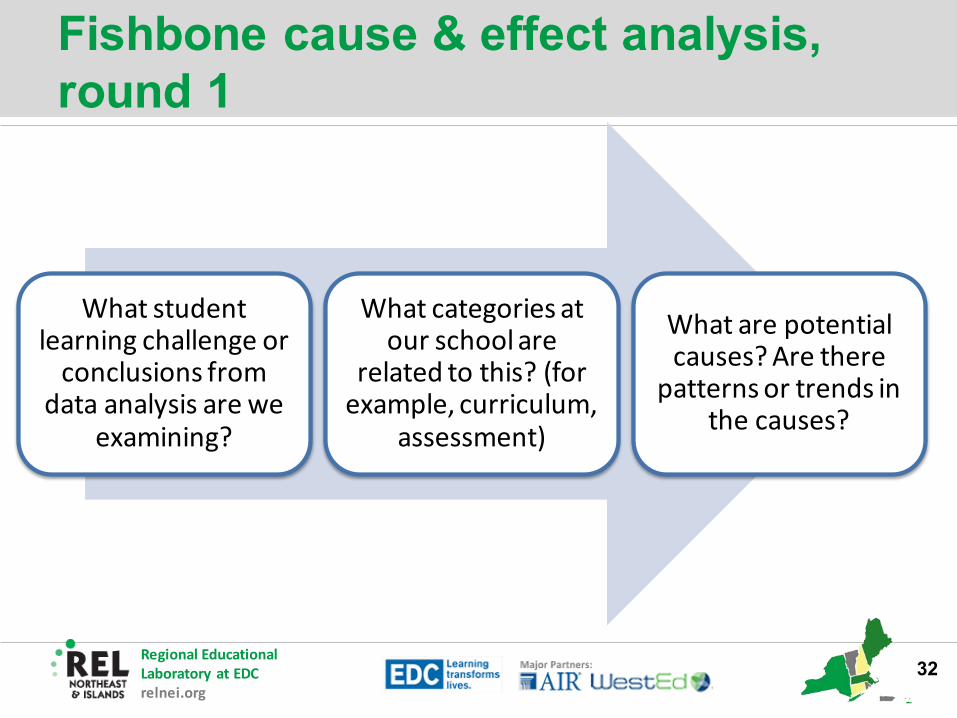
Fishbone cause & effect analysis, round 1
What student learning challenge or
conclusions from data analysis are we
examining?
What categories at our school are
related to this? (for example, curriculum,
assessment)
What are potential causes? Are there
patterns or trends in the causes?
32

Regional Educational Laboratory at EDCrelnei.org
Fishbone cause & effect analysis, round 2
What student learning
challenge or conclusions from data analysis are we examining?
What categories at our school are related to this? (for example, curriculum, assessment)
What are potential causes?
Are there patterns or
trends in the causes?
What action steps might address the
patterns in the causes?
33
Regional Educational Laboratory at EDCrelnei.org
34
Seek information
Gather data
Interpret data Act Evaluate
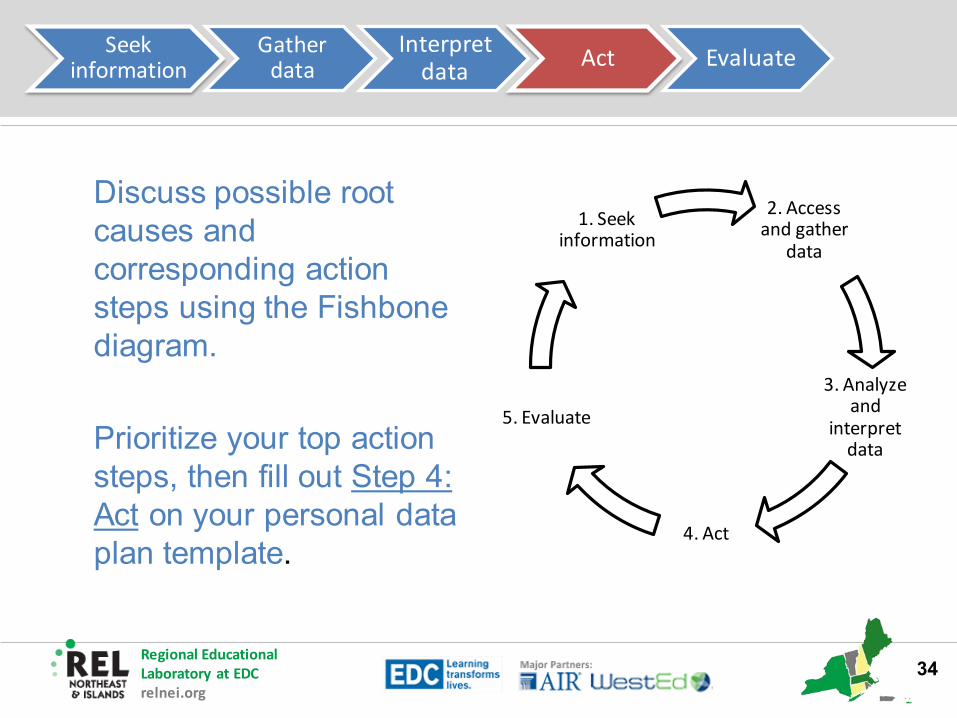
Discuss possible root causes and corresponding action steps using the Fishbone diagram.
Prioritize your top action steps, then fill out Step 4: Act on your personal data plan template.
2. Access and gather
data
3. Analyze and
interpret data
4. Act
5. Evaluate
1. Seek information

Regional Educational Laboratory at EDCrelnei.org
35
Seek information
Gather data
Interpret data Act Evaluate
Step 5: Guiding questions
• How effectively has the initial issue been resolved?
• What new concerns have arisen?
• Should we continue with our action plan or choose a new area of focus?
2. Access and gather
data
3. Analyze and
interpret data
4. Act
5. Evaluate
1. Seek information
Regional Educational Laboratory at EDCrelnei.org
36
Seek information
Gather data
Interpret data Act Evaluate
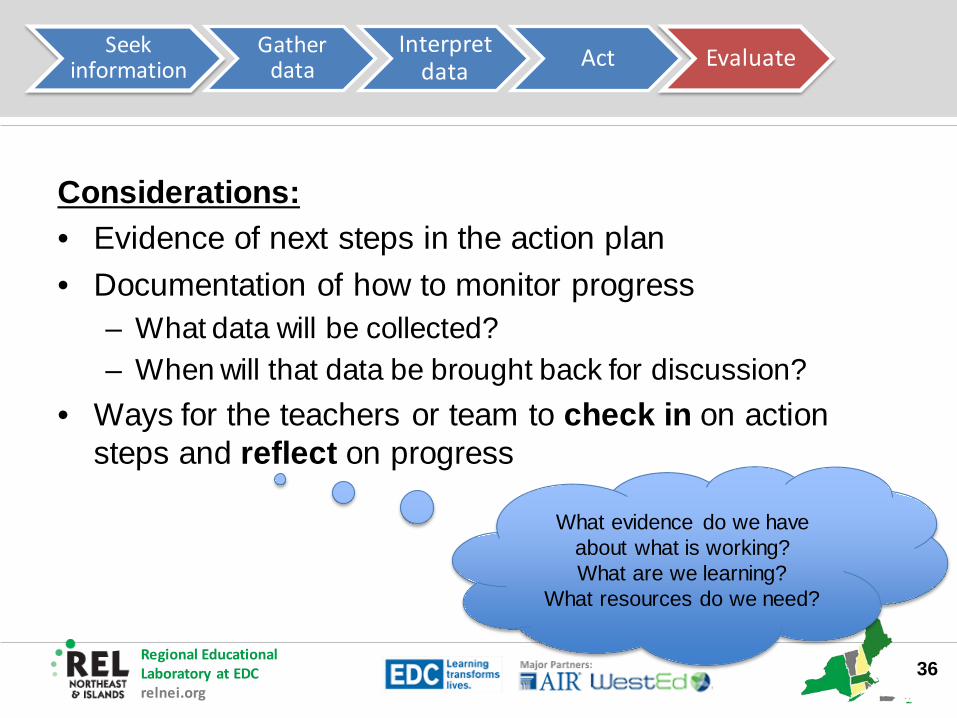
Considerations: • Evidence of next steps in the action plan• Documentation of how to monitor progress
– What data will be collected? – When will that data be brought back for discussion?
• Ways for the teachers or team to check in on action steps and reflect on progress
What evidence do we have about what is working? What are we learning?
What resources do we need?
Regional Educational Laboratory at EDCrelnei.org
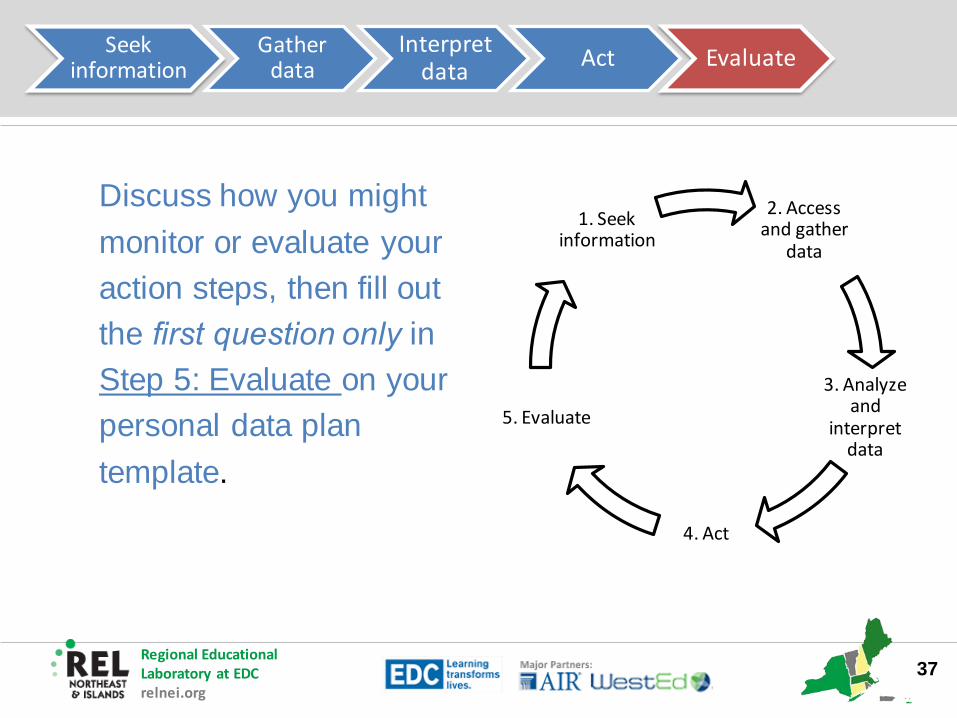
37
Seek information
Gather data
Interpret data Act Evaluate
Discuss how you might monitor or evaluate your action steps, then fill out the first question only in Step 5: Evaluate on your personal data plan template.
2. Access and gather
data
3. Analyze and
interpret data
4. Act
5. Evaluate
1. Seek information
Regional Educational Laboratory at EDCrelnei.org
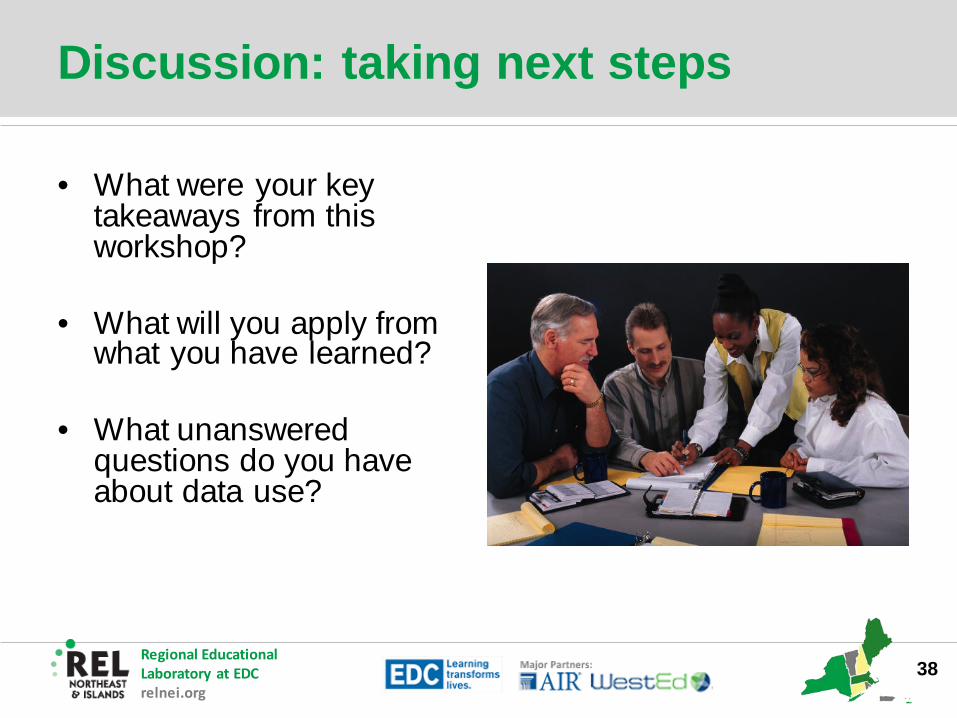
Discussion: taking next steps
• What were your key takeaways from this workshop?
• What will you apply from what you have learned?
• What unanswered questions do you have about data use?
38

Regional Educational Laboratory at EDCrelnei.org
Questions?
39

Regional Educational Laboratory at EDCrelnei.org
Goals for today—revisited During the workshop, participants will: • Become familiar with an inquiry framework for interpreting
data.• Be introduced to common first steps in data use, such as
determining the questions to be answered with data and building data literacy.
• Engage in a protocol to analyze data and identify a student learning challenge.
• Generate possible root causes that contribute to a student learning challenge and possible related teacher actions.
• Draft student learning goals and action plans.• Review how to monitor results.
40
Regional Educational Laboratory at EDCrelnei.org
Thank you!
41

Regional Educational Laboratory at EDCrelnei.org
Resources Achinstein, B. (2002). Conflict amid community: The micropolitics of teacher collaboration. Teachers College Record, 104(3), 421–455. Retrieved from http://eric.ed.gov/?q=Conflict+amid+community%3a+The+micropolitics+of+teacher+collaboration&id=EJ649782.
Boudett, K. P., City, E. A., & Murnane, R. J. (Eds.) (2013). Data wise: A step-by-step guide to using assessment results to improve teaching and learning, revised and expanded edition. Cambridge, MA: Harvard Education Press.
Charalambous, C., & Silver, E. A. (2008, January). Shifting from proving to improving: Using assessment as an integral part of instruction. Paper presented at the annual meeting of the Association of Mathematics Teacher Educators, Tulsa, OK.
Copland, M. A. (2003). Leadership of inquiry: Building and sustaining capacity for school improvement. Educational Evaluation and Policy Analysis, 25(4), 375–395. Retrieved from http://eric.ed.gov/?q=Leadership+of+inquiry%3a+Building+and+sustaining+capacity+for+school+improvement&id=EJ782423
Doran, G. T. (1981). There's a S.M.A.R.T. way to write management's goals and objectives. Management Review, 70(11), 35–36.
Edmondson, A. (2002). The local and variegated nature of learning in organizations: A group- level perspective. Organization Science, 13(2), 128–146.
Gallimore, R., Ermeling, B., Saunders, W., & Goldenberg, C. (2009). Moving the learning of teaching closer to practice: Teacher education implications of school-based inquiry teams. The Elementary School Journal, 109(5), 537–553. Retrieved from http://eric.ed.gov/?q=Moving+the+learning+of+teaching+closer+to+practice%3a+Teacher+education+implications+of+school-based+inquiry+teams&id=EJ844058
Hamilton, L., Halverson, R., Jackson, S., Mandinach, E., Supovitz, J., & Wayman, J. (2009). Using student achievement data to support instructional decision making (NCEE 2009-4067). Washington, DC: National Center for Education Evaluation and Regional Assistance, Institute of Education Sciences, U.S. Department of Education. Retrieved from http://ies.ed.gov/ncee/wwc/publications/practiceguides/
42
Regional Educational Laboratory at EDCrelnei.org
Resources Herman, J. L., Osmundson, E., & Dietel, R. (2010). Benchmark assessment for improved learning (AACC Report). Los Angeles, CA: University of California. Retrieved from http://www.aacompcenter.org/cs/aacc/view/rs/25400
Kekahio, W., & Baker, M. (2013). Five steps for structuring data-informed conversations and action in education (REL 2013–001). Washington, DC: U.S. Department of Education, Institute of Education Sciences, National Center for Education Evaluation and Regional Assistance, Regional Educational Laboratory Pacific. Retrieved from http://ies.ed.gov/ncee/edlabs
Love, N., Stiles, K. E., Mundry, S., and DiRanna, K. (2008). The data coach’s guide to improving learning for all students: Unleashing the power of collaborative inquiry. Thousand Oaks, CA: Corwin Press.
McLaughlin, M. W., & Zarrow, J. (2001). Teachers engaged in evidence-based reform: Trajectories of teachers’ inquiry, analysis, and action. In A. Lieberman & L. Miller (Eds.), Teachers caught in the action: Professional development that matters (pp. 79–101). New York: Teachers College Press.
National Forum on Education Statistics. (2012). Forum Guide to Taking Action with Education Data. (NFES 2013-801). U.S. Department of Education. Washington, DC: National Center for Education Statistics. Retrieved from http://nces.ed.gov/pubs2013/2013801.pdf
Nelson, T. H., Slavit, D., & Deuel, A. (2012). Two dimensions of an inquiry stance toward student-learning data. Teachers College Record (114). Retrieved from http://eric.ed.gov/?q=Two+dimensions+of+an+inquiry+stance+toward+student-learning+data&id=EJ1001974
Stokes, L. (2001). Lessons from an inquiring school: Forms of inquiry and conditions for teacher learning. In A. Lieberman & L. Miller (Eds.), Teachers caught in the action: Professional development that matters (pp. 141–158). New York: Teachers College Press.
Timperley, H. (2008). Evidence-informed conversations: Making a difference to student achievement. In L. M. Earl & H. Timperley (Eds.), Professional learning conversations: Challenges in using evidence for improvement (Vol. 1, pp. 69–79). Dordrecht: Springer.
43


![Regional Educational Laboratory at EDC relnei.org Research Agenda Workshop [District/State Name] Session 1: [Date and time] Session 2: [Date and time]](https://img.pdfslide.net/doc/110x75/56649d895503460f94a6e62c/regional-educational-laboratory-at-edc-relneiorg-research-agenda-workshop.jpg)