Embed Size (px)
Citation preview

2011
Praemium Ltd Annual Report
Praemium Ltd
ACN: 098 405 826
For
per
sona
l use
onl
y
Contents
Chairman‘s Letter to Shareholders ........................................................................................................ 2
CEO‘s Letter to Shareholders.............................................................................................................. 3
Key Facts & Figures ........................................................................................................................ 4
Directors‘ Report ............................................................................................................................ 5
Who We Are & What We Do ............................................................................................................ 5
Review of Operations - Australia ....................................................................................................... 6
Review of Operations – United Kingdom & Jersey ................................................................................... 7
Looking Forward .......................................................................................................................... 8
Overview of 2011 Financial Position ................................................................................................... 9
CEO ........................................................................................................................................ 9
Præmium Ltd Board .................................................................................................................... 10
Præmium UK Board .................................................................................................................... 11
Præmium Australia Pty Ltd ............................................................................................................ 12
Disclosures Relating to Directors and Senior Management ....................................................................... 12
Meetings – Board Meetings and Committee Meetings ............................................................................ 13
Remuneration Report .................................................................................................................. 15
Directors‘ Declaration .................................................................................................................. 23
Financial Report ........................................................................................................................... 27
Statement of Comprehensive Income ............................................................................................... 28
Statement of Financial Position ....................................................................................................... 29
Statement of Changes in Equity ...................................................................................................... 30
Statement of Cash Flows .............................................................................................................. 31
Notes the Financial Statements ...................................................................................................... 32
Auditor‘s Independence Declaration ................................................................................................. 62
Independent Audit Report ............................................................................................................. 63
Praemium' pro factis'...........'Reward through effort'
Praemium Ltd ACN: 098 405 826
For
per
sona
l use
onl
y

2 Praemium Ltd Annual Report
Chairman’s Letter to Shareholders
Dear Præmium Shareholder,
The period since the last Præmium annual report has been disappointing for the Company and for shareholders.
While there have been some significant achievements, the previously expected growth in funds administered has not been achieved and revenues for the year fell well short of budget levels. The loss for the 2010/11 financial year of $5.5 million is most disappointing.
Funds under administration in Australia remain steady at approximately $46 billion, while funds on the company‘s platforms in the United Kingdom grew to GBP283 million, up by GBP116 million over the year. The slower than expected growth has been, in part, due to the continuing uncertainty in investment markets which has resulted in the time frame between signing new clients and the subsequent transfer of funds being, on average, more drawn out than had been expected. We have, however, experienced encouraging growth in the pipeline of clients for both our platform product in Australia and for the services we provide in the UK.
While our financial performance fell short, the company made good progress in further developing our proprietary portfolio administration software and extending our product and service offerings.
Powerwrap Ltd, which offers a sophisticated investment administration platform using technology licensed from Præmium, continued to develop its business securing several important new clients and growing its pipeline of wholesale partners. We also launched our badge of the Powerwrap offering, SMARTwrap, which is targeted at the wider market of financial advisors. SMARTwrap has achieved encouraging initial sales.
In the UK our business footprint was extended to Jersey following the recent approvals received from the Jersey Financial Services Commission to provide online Separately Managed Account (SMA) services from Jersey to investors in the Channel Islands and other offshore locations.
A number of steps were taken during the year to improve revenues, contain costs and reduce the cash drain. Toward the end of the financial year the Board accepted that more broad-ranging action was required and commissioned an independent review of the Company's strategy and performance. This report, presented to the Board in July, concluded that Præmium needed both a new approach to managing to take it to its next stage of growth and a realistic plan to achieve near-term profitability.
In early August, the Board announced changes to the position of Group Chief Executive Officer, accepting the resignation of Mr Arthur Naoumidis as CEO and executive director and selecting Mr Michael Ohanessian as CEO.
Mr Naoumidis was Præmium's founder and had been CEO and executive director of the listed Company since it was floated in 2006; it was on his initiative that Præmium first developed market-leading technologies for delivering portfolio administration services. Mr Naoumidis commented in the announcement to the ASX at the time his role as CEO ended: "Præmium is poised at the threshold of a period of rapid growth. I believe it is time to pass the baton on for the next phase in Præmium's development and growth." Mr Naoumidis will continue his relationship with Præmium as a consultant to the Board and the CEO.
Mr Ohanessian, who has many years of experience, both as a CEO in technology-related businesses and as a consultant to companies across a range of industries, brings fresh operational, strategic and leadership capabilities to Præmium.
On 8 August, I accepted the Board‘s invitation to become a non-executive director. Further changes to the Board occurred later in August. Dr Don Stammer, Præmium's Chairman since its listing in 2006, asked to step down from that position on health grounds; he remains a non-executive director. The Board elected me as Chairman.
The Board also accepted the resignation of Ms Cathryn Nolan as executive director. As General Counsel, Ms Nolan reports to the CEO, Mr Ohanessian, who is not a member of the Board. In view of this reporting line and in the interests of good corporate governance, Ms Nolan and the Board agreed that it would be inappropriate for her to continue as executive director in these circumstances.
As someone who has followed Præmium for some time as an observer and more recently as a shareholder, I welcome my appointments to the Board and to the position of Chairman. It is widely appreciated that Præmium has a highly regarded suite of portfolio administration services and that regulatory changes in Australia and the United Kingdom are creating additional demands for these services. The objective now is to significantly improve the market shares of the key services we offer and to deliver them profitably. The new CEO‘s priority is to deliver a strategy that successfully takes Præmium through its next stage of growth and development as it builds revenues, contains costs and takes the Company as quickly as possible to profitability.
I look forward to meeting shareholders at our Annual General Meeting in October.
Bruce Parncutt Chairman
For
per
sona
l use
onl
y
3
CEO’s Letter to Shareholders
Dear Shareholder,
Let me first say that I am honoured and excited by the opportunity presented here at Præmium. I had the good fortune to be involved in a recent strategic review of the company and have hence had a chance to consider this opportunity before coming on board several weeks ago. I am genuinely excited by the company‘s prospects and am confident that we can build this into a great business.
In terms of our results for the F2011 financial year, it is fair to say it has been a mixed bag. On the operational side, the company has continued to progress numerous initiatives and achieve top line growth. On the financial side though, the results have been less than satisfactory.
Operationally, it is pleasing that sales momentum continues, albeit slower than expected, with revenue of $13.0 million, which is 9% higher than last year. In particular, the company has made a solid step up in sales and funds-under-administration in its UK operation — revenue was up 51% and funds-under-administration were up 145%. This is an excellent result in just our second full year of revenue generation, reflecting the uniquely innovative position that Præmium has built in the rapidly expanding UK platform market. This market is going through a once-in-a-generation transformation as reflected in the 35% average year-on-year growth of the UK platform market over the past 5 years. While Præmium has been a relative latecomer, it has brought with it a unique and modern solution to the UK platform market. This solution is compliant with the impending UK regulatory changes (which are not dissimilar in intent to those being proposed in Australia) and is based on Separately Managed Account technology – the next frontier in actively managed investment portfolios.
We recently received approval from the Jersey Financial Services Commission to begin providing online investment administration and reporting services in the Channel Islands. We have now launched a service suitable for Discretionary Managers, Advisor Firms and Trustees to provide an investment solution for their wealthy and expat clients. Præmium International is regulated and incorporated in Jersey; it will act as the custodian for offshore investment business and be responsible for processing applications and handling client data. The technology will be run from London leveraging our existing infrastructure to ensure scalability going forward. This opens a huge potential market to us, where competition is comparatively thin and where we can offer an elegant solution well matched to the profile of the investor.
In Australia, our flagship portfolio administration service, V-Wrap, remained steady in a challenging market where investor activity has been generally low. V-Wrap has now
been developed to incorporate Fixed Interest capability to suit changing investor requirements. We believe we are fully prepared to benefit from the proposed Future of Financial Advice (FoFA) regulatory changes, as we assist advisors to transition to fee-for-service, and will continue to invest in enhancing our systems to retain our competitive edge.
Financially, the company has recorded an EBITDA loss of $5.1 million. Given that this is the same as the loss recorded in the previous year, it is clearly not satisfactory to either our investors or our customers. As such, our immediate priority is to implement an organisational restructure and a review of our operating expenses. This review will be conducted in a structured manner to ensure we do not jeopardise our core customer offering and to ensure we maintain the high operational and quality standards our customers have come to expect. That said, we will review all our expenditures and prioritise all our activities. We expect that the review will be completed and implemented prior to the end of calendar 2011. We believe this review will place the company on a much stronger financial footing.
In terms of our prospects post the restructure, I believe that this business has demonstrable scalability and future incremental revenue should generate attractive profit margins. This is driven by the highly automated nature of our core software that enables us to leverage our technology across a multitude of clients and services. The scalability that drives efficiencies in our business is also true for the clients who choose to adopt our technology solutions. They too have the potential to more efficiently administer their investors‘ portfolios and hence deliver a more cost effective and rewarding experience.
Finally, I would like to thank our investors who have shown considerable patience in the Præmium story. We understand the challenges facing us and are determined to start delivering on the financial side of the business as well as operationally.
I look forward to discussing the company‘s prospects at our Annual General Meeting.
Michael Ohanessian Chief Executive Officer
For
per
sona
l use
onl
y
4 Praemium Ltd Annual Report
Key Facts & Figures
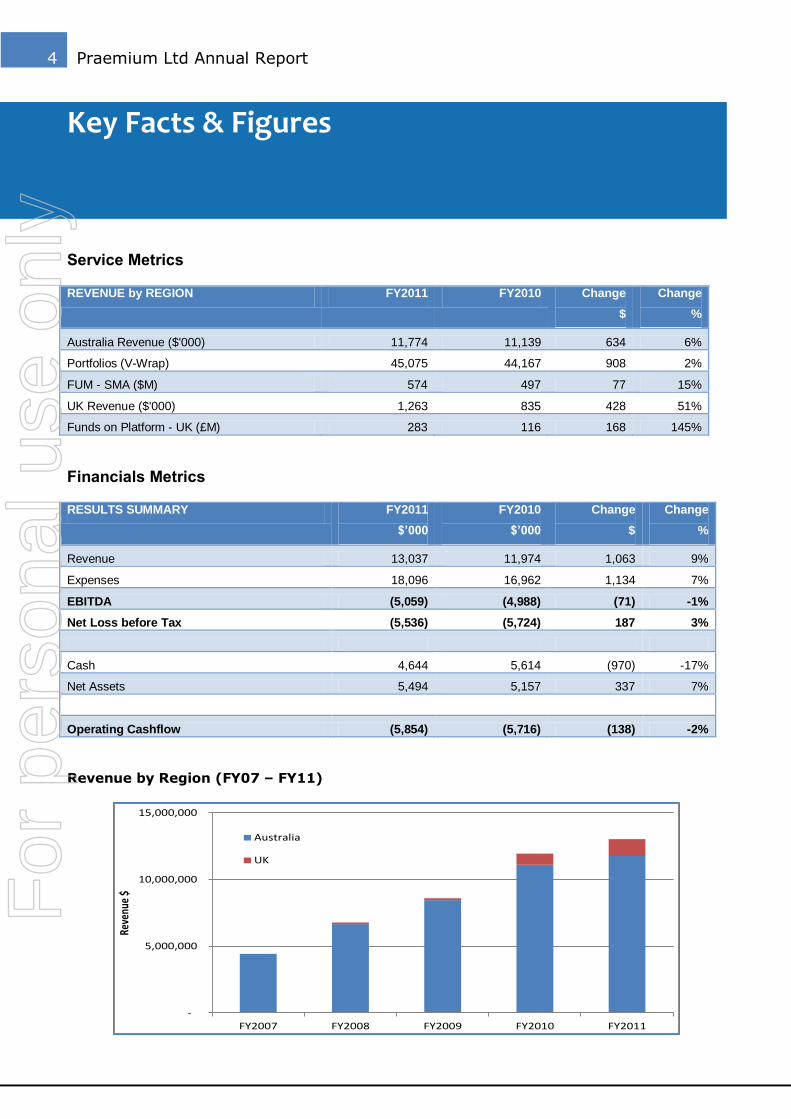
Service Metrics
REVENUE by REGION FY2011 FY2010 Change
$
Change
%
Australia Revenue ($'000) 11,774 11,139 634 6%
Portfolios (V-Wrap) 45,075 44,167 908 2%
FUM - SMA ($M) 574 497 77 15%
UK Revenue ($'000) 1,263 835 428 51%
Funds on Platform - UK (£M) 283 116 168 145%
Financials Metrics
RESULTS SUMMARY FY2011
$’000
FY2010
$’000
Change
$
Change
%
Revenue 13,037 11,974 1,063 9%
Expenses 18,096 16,962 1,134 7%
EBITDA (5,059) (4,988) (71) -1%
Net Loss before Tax (5,536) (5,724) 187 3%
Cash 4,644 5,614 (970) -17%
Net Assets 5,494 5,157 337 7%
Operating Cashflow (5,854) (5,716) (138) -2%
Revenue by Region (FY07 – FY11)
-
5,000,000
10,000,000
15,000,000
FY2007 FY2008 FY2009 FY2010 FY2011
Reve
nue
$
Australia
UK
For
per
sona
l use
onl
y
5
Directors’ Report
Who We Are & What We Do
Who we are
Præmium was founded in 2001 to meet the technology needs of a rapidly growing direct equity investments market. Præmium‘s range of portfolio management services is used by accountants, financial advisors, stockbrokers, self-managed super fund administrators and large institutions who usually rebrand and package the services for their own customers.
Præmium launched in the UK in 2006, shortly after the Company was listed on the Australian Stock Exchange. Its first UK product, SMARTfund, was delivered to market in November 2008. In the UK today Præmium offers both SMARTfund and Discretionary Platform Service (dps).
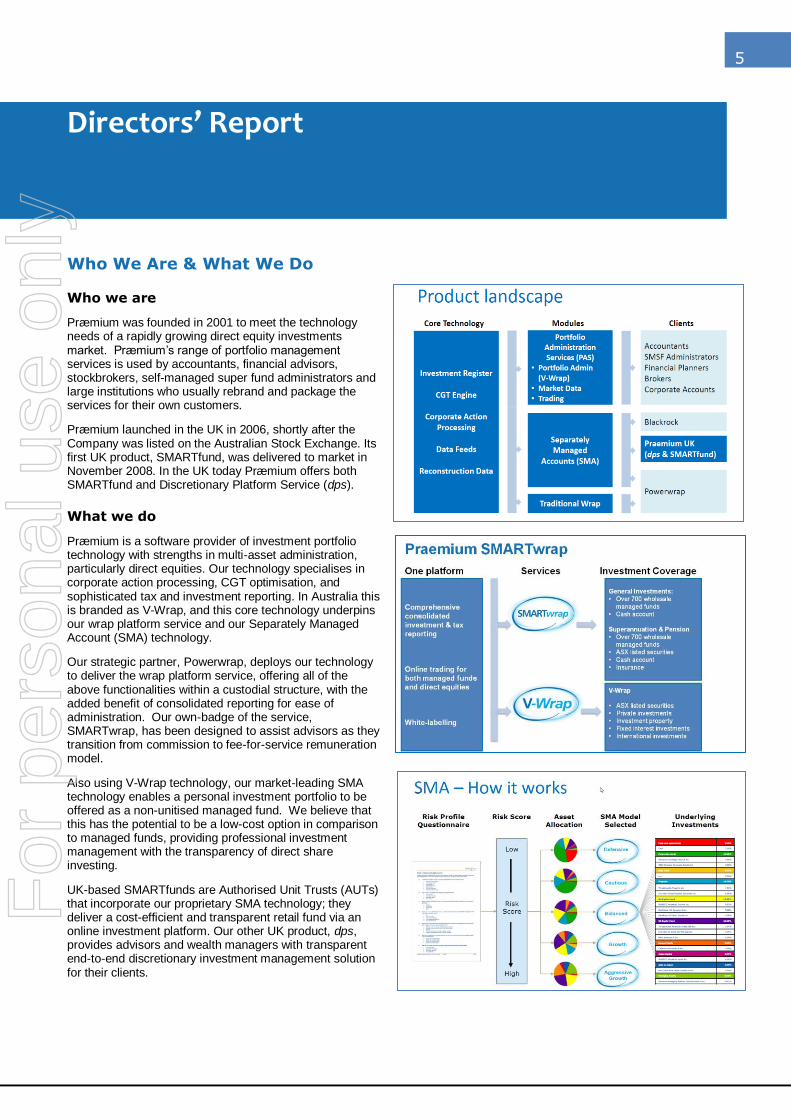
What we do
Præmium is a software provider of investment portfolio technology with strengths in multi-asset administration, particularly direct equities. Our technology specialises in corporate action processing, CGT optimisation, and sophisticated tax and investment reporting. In Australia this is branded as V-Wrap, and this core technology underpins our wrap platform service and our Separately Managed Account (SMA) technology.
Our strategic partner, Powerwrap, deploys our technology to deliver the wrap platform service, offering all of the above functionalities within a custodial structure, with the added benefit of consolidated reporting for ease of administration. Our own-badge of the service, SMARTwrap, has been designed to assist advisors as they transition from commission to fee-for-service remuneration model.
Also using V-Wrap technology, our market-leading SMA technology enables a personal investment portfolio to be offered as a non-unitised managed fund. We believe that this has the potential to be a low-cost option in comparison to managed funds, providing professional investment management with the transparency of direct share investing.
UK-based SMARTfunds are Authorised Unit Trusts (AUTs) that incorporate our proprietary SMA technology; they deliver a cost-efficient and transparent retail fund via an online investment platform. Our other UK product, dps, provides advisors and wealth managers with transparent end-to-end discretionary investment management solution for their clients.
For
per
sona
l use
onl
y
6 Praemium Ltd Annual Report
Review of Operations - Australia
Principal activities
An important focus this year was supporting Powerwrap in attracting new wholesale clients to white-label their wrap platform service. The first white-label is MyState, Tasmania‘s largest financial institution; they are on track to launch in November 2011.
Additionally, considerable effort was made in developing our technology to meet the changing demands of our market. We have:
Enhanced V-Wrap to better administer fixed-interest products including term deposits, bank bills, promissory notes and other securities;
Increased the number of data updates available within V-Wrap for easier reconciliation of cash transactions and balances;
Created a feature for advisors to manage the elections for complex corporate actions such as takeovers, demergers, and schemes of arrangement;
Enhanced our wrap platform technology to include online application forms for Powerwrap and our own-labelled SMARTwrap; and
Increased the range of user interfaces for V-Wrap by introducing V-Wrap Mobile.
V-Wrap
V-Wrap‘s growth remained static. Whilst organic growth (growth in portfolios by existing clients) was reasonably strong, we saw high levels of portfolio closures during the year (though fewer than the previous year). As was the case in FY2010, these closures have not been prevalent within any particular client segment, indicating that investors have generally converted their investments to cash in response to the volatile financial markets.
We believe we will see a higher rate of new client acquisition over the next 2-3 years due to:
Renewed stability and growth in share markets;
Financial advisors shifting from commissions to fee-for-service as regulatory reform deadlines approach; and
Cross-selling SMARTwrap to existing V-Wrap users.
We have, however, recognised the importance of continuing to maintain, support and further develop V-Wrap, which has been our flagship product since its launch in 2002.
SMARTwrap
SMARTwrap, our badge of the Powerwrap platform, was launched in June 2010 and became operational in August 2010. Having our own branded wrap service has allowed us entry into the approximately AU$400billion traditional wrap platform market.
Importantly, in the context of the fundamental changes currently being made to the way that financial advisors are remunerated in Australia, SMARTwrap incorporates features designed to assist the transition from commission to fee-for-service remuneration models (see FoFA Changes).
Separately Managed Account (SMA) Technology
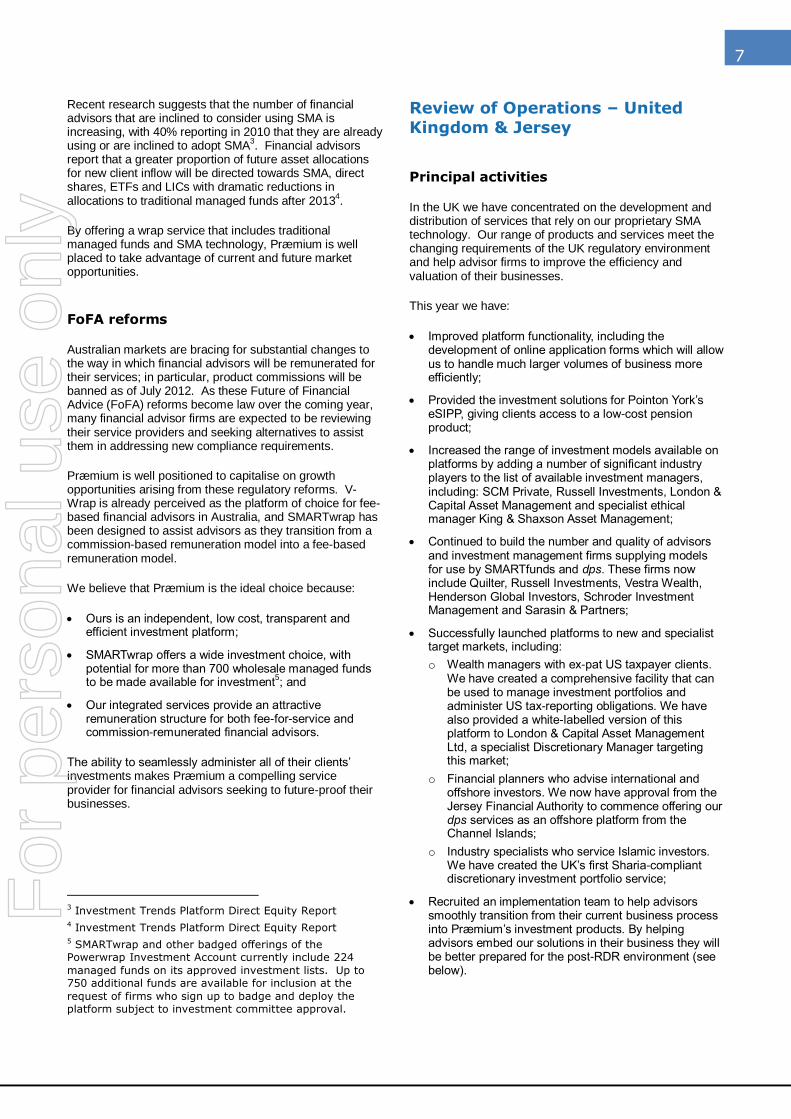
Præmium‘s SMA technology continues to be deployed by BlackRock Investment Managers (Australia) Limited and more recently by Powerwrap. The BlackRock Customised Portfolio Service funds under administration (FUA) increased by 15% to $574 million, reflecting a combination of new fund inflows and improved asset valuations. As at 30 June 2011, 130 organisations
1 subscribed to the service
with 28 Product Disclosure Statements on issue and 87 model portfolios from which to choose.
Competition has increased markedly in the SMA market over the past few years; however, the Præmium-powered BlackRock SMA service continues to have strong brand equity and appears on more than 50% of dealer group-approved investment lists (more than twice as many as any other SMA offering)
2.
1 According to BlackRock reports 2 Investment Trends Platform Direct Equity Report
For
per
sona
l use
onl
y
7
Recent research suggests that the number of financial advisors that are inclined to consider using SMA is increasing, with 40% reporting in 2010 that they are already using or are inclined to adopt SMA
3. Financial advisors
report that a greater proportion of future asset allocations for new client inflow will be directed towards SMA, direct shares, ETFs and LICs with dramatic reductions in allocations to traditional managed funds after 2013
4.
By offering a wrap service that includes traditional managed funds and SMA technology, Præmium is well placed to take advantage of current and future market opportunities.
FoFA reforms
Australian markets are bracing for substantial changes to the way in which financial advisors will be remunerated for their services; in particular, product commissions will be banned as of July 2012. As these Future of Financial Advice (FoFA) reforms become law over the coming year, many financial advisor firms are expected to be reviewing their service providers and seeking alternatives to assist them in addressing new compliance requirements.
Præmium is well positioned to capitalise on growth opportunities arising from these regulatory reforms. V-Wrap is already perceived as the platform of choice for fee-based financial advisors in Australia, and SMARTwrap has been designed to assist advisors as they transition from a commission-based remuneration model into a fee-based remuneration model.
We believe that Præmium is the ideal choice because:
Ours is an independent, low cost, transparent and efficient investment platform;
SMARTwrap offers a wide investment choice, with potential for more than 700 wholesale managed funds to be made available for investment
5; and
Our integrated services provide an attractive remuneration structure for both fee-for-service and commission-remunerated financial advisors.
The ability to seamlessly administer all of their clients‘ investments makes Præmium a compelling service provider for financial advisors seeking to future-proof their businesses.
3 Investment Trends Platform Direct Equity Report 4 Investment Trends Platform Direct Equity Report 5 SMARTwrap and other badged offerings of the Powerwrap Investment Account currently include 224
managed funds on its approved investment lists. Up to 750 additional funds are available for inclusion at the
request of firms who sign up to badge and deploy the platform subject to investment committee approval.
Review of Operations – United
Kingdom & Jersey
Principal activities
In the UK we have concentrated on the development and distribution of services that rely on our proprietary SMA technology. Our range of products and services meet the changing requirements of the UK regulatory environment and help advisor firms to improve the efficiency and valuation of their businesses.
This year we have:
Improved platform functionality, including the development of online application forms which will allow us to handle much larger volumes of business more efficiently;
Provided the investment solutions for Pointon York‘s eSIPP, giving clients access to a low-cost pension product;
Increased the range of investment models available on platforms by adding a number of significant industry players to the list of available investment managers, including: SCM Private, Russell Investments, London & Capital Asset Management and specialist ethical manager King & Shaxson Asset Management;
Continued to build the number and quality of advisors and investment management firms supplying models for use by SMARTfunds and dps. These firms now include Quilter, Russell Investments, Vestra Wealth, Henderson Global Investors, Schroder Investment Management and Sarasin & Partners;
Successfully launched platforms to new and specialist target markets, including:
o Wealth managers with ex-pat US taxpayer clients. We have created a comprehensive facility that can be used to manage investment portfolios and administer US tax-reporting obligations. We have also provided a white-labelled version of this platform to London & Capital Asset Management Ltd, a specialist Discretionary Manager targeting this market;
o Financial planners who advise international and offshore investors. We now have approval from the Jersey Financial Authority to commence offering our dps services as an offshore platform from the Channel Islands;
o Industry specialists who service Islamic investors. We have created the UK‘s first Sharia-compliant discretionary investment portfolio service;
Recruited an implementation team to help advisors smoothly transition from their current business process into Præmium‘s investment products. By helping advisors embed our solutions in their business they will be better prepared for the post-RDR environment (see below).
For
per
sona
l use
onl
y
8 Praemium Ltd Annual Report
SMARTfunds and dps
During the last year, Præmium UK more than doubled the FUA value on its SMARTfunds and dps platforms, reaching £283.3 million as at 30 June 2011. Whilst demonstrating that there is a real and tangible opportunity in the UK, the rate of growth has, nonetheless, been disappointing.
Slower than expected growth is attributable to a range of factors, some outside of Præmium‘s control (such as market uncertainty in the UK and Europe) but some of which are directly related to issues within our grasp. Firstly, we were not always efficient in implementing new resources and on-boarding funds to the platform from incumbent products, and we faced customer service issues relating to the speed of our query responses and issue resolution. We have now introduced a dedicated support team and implemented a case tracking system, allowing us to better monitor the services we provide. Secondly, we have recognised the need for additional sales staff to bolster our market position. We will continue to focus on sales to acquire more FUA, and on improving our customer service to retain and build on current funds.
Retail Distribution Review (RDR)
Like the Australian market, the UK market is facing substantial change to the way in which financial advisors will be remunerated for their services. These changes will be introduced by the end of 2012 in the UK following the Retail Distribution Review (RDR), and will include the requirement that advisors offer independent advice and no longer accept commissions on new business.
Advisor firms in the UK are now actively engaged in reviewing their business model as the December 2012 deadline approaches. In addition, as a result of the RDR and the fallout from the GFC many advisors now acknowledge the need to move away from ‗fund picking‘ towards the use of external Investment Managers; this will allow them to focus on maintaining client relationships and on non-investment areas such as effective tax planning.
Præmium‘s services are perfectly positioned to meet the needs of this new advisory model. Our two core services (dps and SMARTfunds):
Provide a robust and scalable means to consistently manage individual portfolios and meet compliance obligations;
Enable the appointment, and replacement, of external Investment Managers;
Offer transparent fee-for-service remuneration arrangements which remove any commission bias; and
Allow advisors to develop their own bespoke investment solutions to embed value within their own business.
Our revenue model is built on asset-based fees with substantial minimum fee commitments for bespoke projects. This provides a strong foundation for continued growth that minimises the impact of future share market downturns and maximises the upside potential of recovering markets.
Jersey
We have launched a service suitable for Discretionary Managers, Advisor Firms and Trustees to provide an investment solution for their wealthy and expat clients. Præmium International is regulated and incorporated in Jersey; it will act as the custodian for offshore investment business and be responsible for processing applications and handling client data. The technology will be run from London leveraging our existing infrastructure to ensure scalability going forward. This opens a huge potential market to us, where competition is comparatively thin and where we can offer an elegant solution well matched to the profile of the investor.
Looking Forward
The focus for 2011/12 is to achieve near-term profitability, both through increased sales focus and a significant cost review.
We believe Præmium‘s growth prospects within Australia will be strong over the next 3-5 years given the likely share market recovery, anticipated regulatory changes, and the strength of Præmium technology. The financial planning segment is expected to be the primary growth driver for us; however, the accountant segment continues to be important for Præmium and we are developing several initiatives to increase our appeal within this segment. Given this expected growth, we plan to expand our sales and client support teams to capture this opportunity.
Having established our presence in the UK and having built up our FUA, we are beginning to see success in the institutional space and expect this to have an impact on our growth over the next 12 months. With the Jersey operation live, we will look to sign up foundation clients that will move their clients onto the platform as quickly and effectively as possible.
We are also aware that sales growth alone is not enough; hence, we are in the process of conducting a significant cost review that will include an organisational restructure. We will also prioritise our product development initiatives whilst protecting our core service offering. These measures will place us in a much stronger financial position for the future.
For
per
sona
l use
onl
y
9
Overview of 2011 Financial Position
Results
The consolidated loss attributable to the members of the Group was $5,536,420.
The Group‘s net asset position at 30 June 2011 was $5,493,766 with $4,643,958 held in cash or cash equivalents. The Group is debt free.
Significant Change in the State of Affairs
Subsequent to the reporting date, on 8 August 2011 Arthur Naoumidis resigned as Chief Executive Officer and as an Executive Director of the Company. Michael Ohanessian commenced as Chief Executive Officer on 9 August 2011. On 19 August 2011, Dr Don Stammer stepped down as the Chairman of the Board for health reasons, but will stay on as a Non-Executive Director. On the same day Bruce Parncutt was appointed as Chairman of the Board and Ms Nolan resigned as an executive director but remains an executive.
After Balance Date Events
On 9 September 2011, the Company successfully completed a placement to sophisticated and professional investors of 50 million fully paid shares at 10 cent per share to raise $5 million. The capital raising provides the Company with capital required to implement some short-term cost efficiency initiatives and to support longer-term growth plans. The placement is subject to shareholder approval at the Company‘s Annual Meeting planned to be held on 17 October.
No matters or circumstances, other than noted above, have arisen since the end of the financial year which significantly affect or may significantly affect the operations of the Group, the results of those operations or the state of affairs of the Group in future financial years.
Future Developments
The company will continue its activities as outlined in its prospectus dated 13 April 2006 and subsequent disclosures to the ASX. In the opinion of the Directors, disclosure of any further information would be likely to result in unreasonable prejudice to the consolidated entity.
Dividend Recommended, Declared or Paid
The Company has not recommended, declared or paid a dividend in respect of the full year result.
CEO
In August 2011, following Arthur Naoumidis‘ resignation as CEO and from the Board, the Board selected Mr Michael Ohanessian as Chief Executive Officer to lead the next phase in the Company's growth.
Mr Ohanessian's executive experience in technology-related businesses brings a mixture of operational, strategic and leadership capabilities to this role. Following a ten-year career at Mobil Oil, Mr Ohanessian joined the Boston Consulting Group where he consulted to clients in industries such as banking, airlines, mining, packaging, sports, oil and gas, retailing and biotechnology.
As the CEO of Vision BioSystems, a division of the publicly listed Vision Systems, he transformed the business over seven years from a small unprofitable contract manufacturer into a vertically integrated, profitable and growing medical diagnostics business with distribution to over 60 countries. More recently, he has served as Chief Executive of Genetic Technologies Limited and has been involved in investment management and corporate advice with Lion Capital.
As CEO, Mr Ohanessian will work particularly closely with our UK team to expand our presence in the burgeoning market for financial services in the United Kingdom.
For
per
sona
l use
onl
y
10 Praemium Ltd Annual Report
Præmium Ltd Board
The qualifications, experience and special responsibilities of each person who has been a director of the Company at any time during or since the end of the financial year is provided below.
Non-executive Chairman – Mr Bruce Parncutt
Mr Bruce Parncutt was appointed the board as a non-executive director on 8 August 2011. He became the Chair of the board on the resignation from that role of Dr Don Stammer on 18 August 2011.
His career spans over 30 years in investment management, investment banking and stock broking, including seven years as Chief Executive of listed securities firm McIntosh Securities and three years as Senior Vice President of Merrill Lynch. Mr Parncutt was a director of Stuart Petroleum (an ASX listed company) from July 2010 until March 2011.
Mr Parncutt brings to the Board his extensive experience as a senior executive and director in the financial services industry as well as a non-executive director, including as a previous director of Australian Stock Exchange Limited.
In accordance with the Company‘s charter, Mr Parncutt will serve as a member of each of its board committees but will not chair any of them.
In accordance with the requirements of the Company‘s constitution and the Corporations Act, the term of Mr Parncutt‘s appointment as a director expires at the Company‘s AGM and, being eligible, he stands for election at that meeting.
Non-executive – Dr Donald William
Stammer
Don Stammer holds a Bachelor of Arts (with honours) degree and a Master of Arts (with honours) degree from the University of New England and a Doctor of Philosophy degree from the Australian National University. He taught economics and finance at both universities prior to 1971, when he joined the Reserve Bank of Australia, where he held senior positions in the Bank‘s Research Department and its Banking and Finance Department.
From 1981 to 2001, Dr Stammer was Chief Economist/Director of Investment Strategy for Deutsche Bank and its predecessor Bain & Company.
In addition to his role as non-executive Chairman of the Company, Dr Stammer is a non-executive director of ING Private Equity Access Limited, Sustainable Investment Research Institute Pty Ltd and Kaplan Higher Education Pty Limited. He chairs the Australian Ecosystems Foundation Incorporated and the advisory council of FIIG Securities.
Dr Stammer served as the Company‘s Chairman from 2005 until 18 August 2011. He remains a non-executive director. Dr Stammer retires by rotation at the Company‘s Annual General Meeting and, being eligible, will be seeking re-election.
Dr Stammer is a member of the Audit & Compliance Committee, the Risk Committee and the Remuneration Committee.
Executive Director –Mr Arthur Naoumidis
Arthur Naoumidis is the Company‘s founder and the inventor of its core technology. Since late 2001, Mr Naoumidis has been responsible for establishing the underlying technology components as well as the marketing and operation of the business and held the role of Group CEO until his resignation in August 2011, when he also resigned as a Director. Mr Naoumidis continues to provide consulting services to the Group.
Non-executive Director – Mr Robert Edgley
Mr Edgley holds a Bachelor‘s degree in Economics from Monash University together with a second degree in Japanese language and is a fluent speaker of Japanese.
His career has been predominately focused in International Finance and Investment Banking in Australia, the UK and throughout Asia, most notably in Japan.
Mr Edgley previously held the position of Director & Head of Sales, Asia Pacific Region, Royal Bank of Scotland, and was a Director of Royal Bank of Scotland Australia Pty Ltd. Mr Edgley is also a non-executive director of EVZ Limited an ASX Listed company.
Mr Edgley chairs the Group‘s Audit & Compliance Committee and the Remuneration Committee and is also a member of the Risk Committee.
Non-executive Director –Mr John Bryson
John Bryson was appointed as a director in August 2007 and elected to that position at the Company‘s AGM in November 2007.
After nine years in the engineering profession, Mr Bryson joined JBWere and Son in 1983 and was appointed Group General Manager in 1985 during a period of significant changes in the marketplace, with the firm emerging as the premier privately-owned investment house in Australasia over this period.
In 1991 Mr Bryson was appointed ―National Manager – Private Clients‖ for the JBWere group‘s retail advisory division and was responsible for building this group from its then-small base to one of the largest and most respected retail investment operations in Australia. The retail group under Mr Bryson‘s leadership evolved over the 1990s to be recognised within JBWere and in the marketplace as the core strategic strength of the firm at a time when many
For
per
sona
l use
onl
y

11
brokers were struggling with and disbanding their retail networks.
In 2000 Mr Bryson established JBWere‘s Private Equity presence and has also been involved in other capital raisings.
Mr Bryson retired from Goldman Sachs JBWere in 2003. Since that time he has been providing consulting services to the financial services, and in particular stock broking, industry in Australia.
Mr Bryson has chaired the group‘s Risk Committee and is a member of both the Remuneration Committee and Audit & Compliance Committees.
Mr Bryson is also a non-executive director of The Bionic Ear Institute, First Samuel Limited and was a non-executive director Choiseul Investments Limited, an ASX-listed investment company, from May 2008 until December 2010.
Mr Bryson retires by rotation at the Company‘s Annual General Meeting and, being eligible, will be seeking re-election.
Executive Director & Company Secretary – Ms Cathryn Nolan
Cathryn Nolan was appointed as an executive director in August 2007 following 15 months as a member of the senior management team and was elected to that position at the Company‘s 2007 AGM.
Ms Nolan holds an LL.B (Sydney) and a Graduate Diploma in Natural Resources Law (Melbourne). Since being admitted to practice as a solicitor in 1989, Ms Nolan has practiced extensively as a Corporate Lawyer with a focus on both Australian and international capital raisings, financial services reform, information technology, ASX Listing Rules and intellectual property.
The Board accepted the resignation of Ms Cathryn Nolan as executive director on 18 August 2011.
As the Company's General Counsel, Ms Nolan reports to the Chief Executive Officer, Mr Michael Ohanessian, who is not a member of the Præmium Board. In view of this reporting line and in the interests of best corporate governance, Ms Nolan and the Board agreed that it would be inappropriate for her to continue as executive director in these circumstances.
Præmium UK Board
The Board of Præmium Portfolio Services Limited, which comprises three non-executive directors and two executive directors, is responsible for the oversight and governance of the group‘s UK and Jersey incorporated subsidiaries.
Managing Director – John Martin
John Martin joined Præmium with over 20 years experience in running IFA businesses. Mr Martin has held senior management positions in national IFAs and established two IFA businesses. Mr Martin was appointed as Managing Director in April 2008. Through an enormous wealth of industry experience, Mr Martin provides valuable thought leadership to the development of our products and services and drives development to ensure that our service offerings can be differentiated by their practical usefulness for our target markets.
Non-executive Director - David Harrison
David Harrison MA, FCA was formerly a partner in Harrison Son Hill & Co, Chartered Accountants and Chairman and Chief Executive of Harrison Brothers, an Underwriting Agency at Lloyd‘s of London. He is currently Chairman of Harrison Son Hill & Co Ltd, Insurancewide.com Services Ltd and deputy Chairman of Argenta Private Capital Ltd. Mr Harrison has more than 30 years experience in the insurance industry.
A supporter of Præmium‘s UK Strategy since 2005, Harrison Son Hill & Co Ltd, which is associated with Mr Harrison‘s family interests, is a reseller of Præmium‘s technologies in the UK.
Mr Harrison is a member of the Group‘s Risk Committee.
Non-executive Director - Roland Ward
Roland Ward has 30 years operational experience in the financial services industry in the UK, continental Europe and the United States. The positions he has held include Chairman of HBOS Financial Services (Europe); Finance Director, Clerical Medical Investment Group; Chief Executive Laurentian Financial Service; and Deputy Chief Executive of The Mortgage Corporation, 1989-1992. He has also been the Executive Assistant to the President of Bank of America, a non-executive director of financial distribution companies in Europe and chairman of an offshore venture capital firm.
Mr Ward acts as a member of the Group‘s Audit & Compliance Committee.
UK Executive Director / Group CEO - Arthur Naoumidis
Arthur Naoumidis, the Group Chief Executive Officer of Præmium until August 2010, served as an executive member of the UK board until his resignation. F
or p
erso
nal u
se o
nly

12 Praemium Ltd Annual Report
Executive Director & UK Head of Finance - Gary Wilson
Gary Wilson has over 20 years experience in financial and operational management of start-up technology companies in the UK and International markets, overseeing their rapid growth to full market listing. He started his career in technology with Admiral plc (now part of LogicaCMG) where he played an instrumental part in their LSE debut. In the role of Finance Director and Chief Operating Officer, Mr Wilson went on to set up two venture capital-backed European CRM businesses which became market leaders in their respective fields.
Taking a short break from technology, he steered his interests towards property investment when he joined a privately owned property investment group as Finance Director prior to joining Præmium as its UK Director of Finance in 2006. In April 2007 Gary was asked to join the board of the UK subsidiaries and in addition to his responsibilities for finance was responsible for UK operations until the end of the 2010 calendar year. Mr Wilson‘s exposure to dynamic business growth, acquisitions and market listings provide a solid platform to guide and manage the finances and operations of Præmium UK during this phase of dynamic growth. Mr Wilson holds the professional accreditation of FCCA.
Mr Wilson acts as Company Secretary for each of the UK incorporated subsidiaries.
Præmium Australia Pty Ltd
The Board of Præmium Australia Pty Limited is responsible for the oversight and operation of the Group‘s Australian business.
CEO (FY 2011) – Arthur Naoumidis
Mr Naoumidis was a member of the Præmium Australia Pty Ltd Board until his resignation from the role of Group CEO in August 2011. More information about Mr Naoumidis‘ qualifications and experience can be found on page 10.
Executive Director: Chief Operating Officer– Christine Silcox
Ms Silcox has extensive experience in project management, product development and back-office administration. For some years she carried out projects in a self-employed capacity working within a range of organisations and industry types, focusing on finance and administration services.
Chris brought her expertise into the financial service industry over 15 years ago. Immediately prior to joining Præmium in 2002 she served as Administration Manager in the Australian operation of a large international broking firm; she was in charge of their retail portfolio management products, including superannuation.
At Præmium, Chris is responsible for the strategic direction of the operations for the development and support services in the Australian region. She also oversees the implementation of Risk activities for the region.
Executive Director: Head of Institutional Sales – James Maramis
Mr Maramis entered the financial services industry in the early 1990s working in Superannuation Administration with VicSuper then Portfolio Administration with Austrust. Further roles in Portfolio Administration followed with Bell Potter before he joined the Advent software in various consulting, product sales and distribution roles.
James initially joined Præmium in 2003 as a distributor before joining full time in 2005. As Strategic Sales Manager James‘ focus is on large network and institutional accounts with broking firms and fund managers, and those accounts requiring implementation strategies.
Executive Director: Australian Sales – Warren Gibson
Mr Gibson began his financial services career in 1984 as an authorised dealers‘ representative. After 4 years on the advisory side he moved into corporate and business development, practice administration and marketing, establishing his own advertising and distribution company in 1995. In November 2002 he joined Præmium as senior product manager to promote the fledgling V-Wrap Service (then known as Præmium‘s PAS) to the retail investor market. As Præmium recognised that its strength would be in the provision of sophisticated portfolio services to advisors, accountants, administrators and others responsible for the administration or management of multiple portfolios, he moved into a marketing and sales management role and now oversees the Company‘s marketing and sales functions.
Company Secretary: Cathryn Nolan
Cathryn Nolan, who is an Executive Director of the Company, also acts as Company Secretary to Præmium Australia Pty Ltd. Further details about Ms Nolan‘s qualifications and experience are set out on page 11.
Disclosures Relating to Directors and Senior Management
Indemnification and Insurance of Directors, Officers and Auditors
The Company has executed a deed of access, indemnity and insurance in favour of each officer, including Directors and past directors, of the Company and in accordance with applicable laws.
Under the deeds, Præmium indemnifies the officers and previous officers in respect of liabilities incurred in connection with holding office, to the extent permitted by the Corporations Act (or, where relevant, the UK Companies law). The Company is also obliged to carry insurance cover for the Directors and previous directors and provide them with access to Board and Committee papers. Such insurance also extends to cover directors and officers of the group subsidiaries.
Under its Constitution, Præmium must, subject to certain exceptions, indemnify each of its Directors to the extent
For
per
sona
l use
onl
y
13
permitted by law against liability that did not arise out of a lack of good faith.
Total premiums paid in respect of all Directors‘ and Officers‘ liability insurance in this reporting period was
$75,351 (ex GST). In addition, $149,850 (ex GST) paid in the prior reporting period relates to Directors‘ and Officers‘ liability insurance that covers the period up to 11 April 2013.
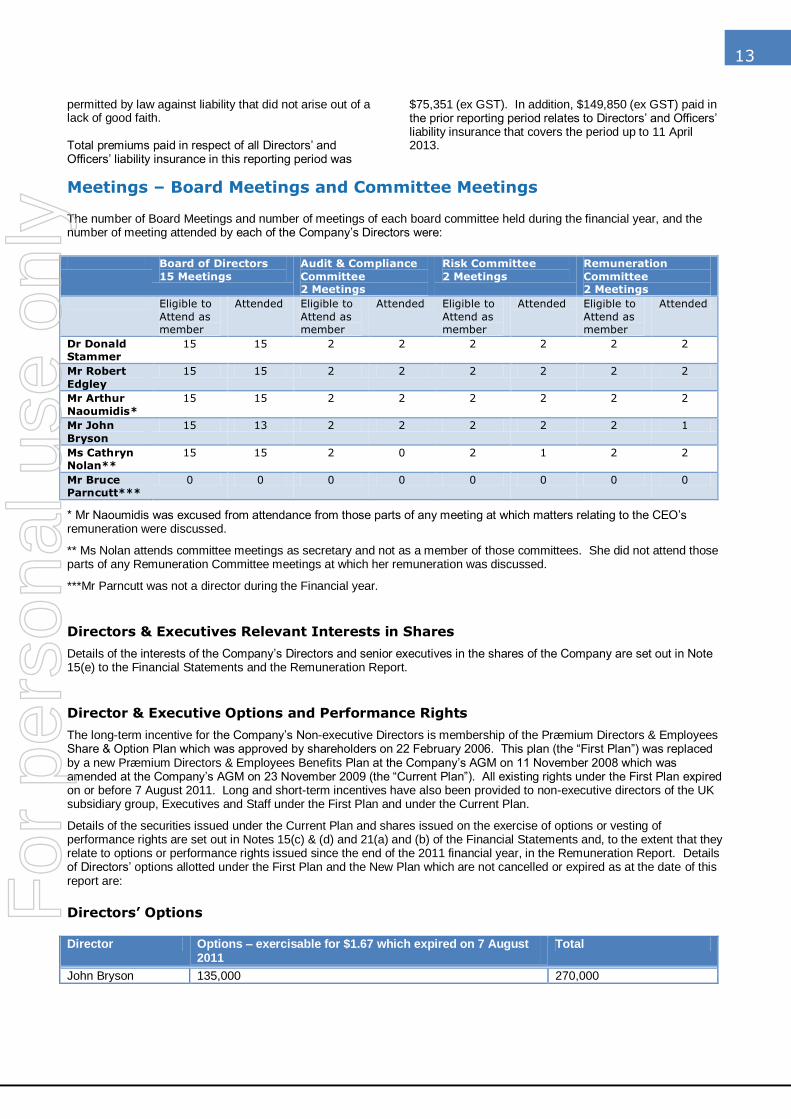
Meetings – Board Meetings and Committee Meetings
The number of Board Meetings and number of meetings of each board committee held during the financial year, and the number of meeting attended by each of the Company‘s Directors were:
Board of Directors
15 Meetings
Audit & Compliance
Committee 2 Meetings
Risk Committee
2 Meetings
Remuneration
Committee 2 Meetings
Eligible to
Attend as member
Attended Eligible to
Attend as member
Attended Eligible to
Attend as member
Attended Eligible to
Attend as member
Attended
Dr Donald Stammer
15 15 2 2 2 2 2 2
Mr Robert
Edgley
15 15 2 2 2 2 2 2
Mr Arthur
Naoumidis*
15 15 2 2 2 2 2 2
Mr John
Bryson
15 13 2 2 2 2 2 1
Ms Cathryn Nolan**
15 15 2 0 2 1 2 2
Mr Bruce Parncutt***
0 0 0 0 0 0 0 0
* Mr Naoumidis was excused from attendance from those parts of any meeting at which matters relating to the CEO‘s remuneration were discussed.
** Ms Nolan attends committee meetings as secretary and not as a member of those committees. She did not attend those parts of any Remuneration Committee meetings at which her remuneration was discussed.
***Mr Parncutt was not a director during the Financial year.
Directors & Executives Relevant Interests in Shares
Details of the interests of the Company‘s Directors and senior executives in the shares of the Company are set out in Note 15(e) to the Financial Statements and the Remuneration Report.
Director & Executive Options and Performance Rights
The long-term incentive for the Company‘s Non-executive Directors is membership of the Præmium Directors & Employees Share & Option Plan which was approved by shareholders on 22 February 2006. This plan (the ―First Plan‖) was replaced by a new Præmium Directors & Employees Benefits Plan at the Company‘s AGM on 11 November 2008 which was amended at the Company‘s AGM on 23 November 2009 (the ―Current Plan‖). All existing rights under the First Plan expired on or before 7 August 2011. Long and short-term incentives have also been provided to non-executive directors of the UK subsidiary group, Executives and Staff under the First Plan and under the Current Plan.
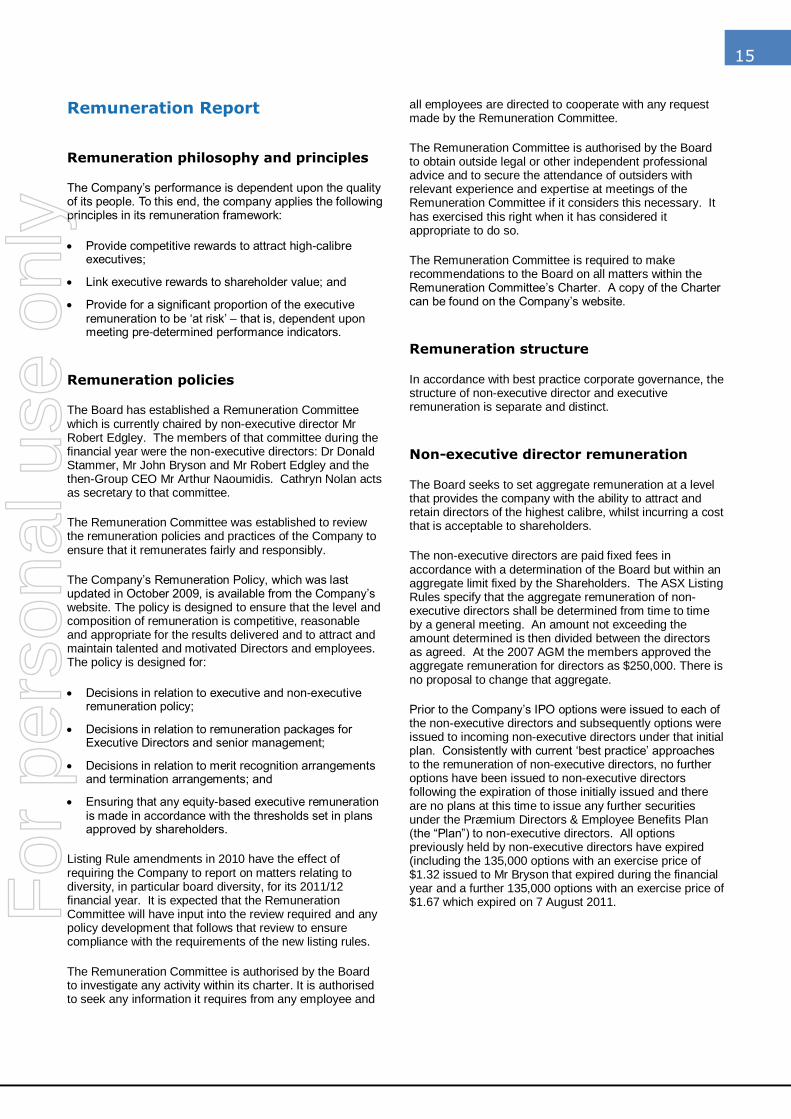
Details of the securities issued under the Current Plan and shares issued on the exercise of options or vesting of performance rights are set out in Notes 15(c) & (d) and 21(a) and (b) of the Financial Statements and, to the extent that they relate to options or performance rights issued since the end of the 2011 financial year, in the Remuneration Report. Details of Directors‘ options allotted under the First Plan and the New Plan which are not cancelled or expired as at the date of this report are:
Directors’ Options
Director Options – exercisable for $1.67 which expired on 7 August 2011
Total
John Bryson 135,000 270,000
For
per
sona
l use
onl
y

14 Praemium Ltd Annual Report
Further disclosures
1,000,000 options, 5,500,000 performance rights and 480,000 fully paid shares have been issued under the Current Plan since the end of the financial year. Details of these options are set out in the Remuneration Report.
50,000 options were exercised during the financial year (at an exercise price of $0.155cents).
Other than as set out in this report:
No directors have any other rights or options over shares in, debentures of or interests in a registered scheme made available by the company or a related body corporate; or
No directors have any relevant interest in debentures of, or interest in a registered scheme made available by the company or a related body corporate.
There are no contracts to which any director is a party or under which any director is entitled to a benefit; and
There are no contracts that confer a right to call for or deliver shares in, or debentures of or interests in a registered scheme made available by the company or a related body corporate.
For
per
sona
l use
onl
y
15
Remuneration Report
Remuneration philosophy and principles
The Company‘s performance is dependent upon the quality of its people. To this end, the company applies the following principles in its remuneration framework:
Provide competitive rewards to attract high-calibre executives;
Link executive rewards to shareholder value; and
Provide for a significant proportion of the executive remuneration to be ‗at risk‘ – that is, dependent upon meeting pre-determined performance indicators.
Remuneration policies
The Board has established a Remuneration Committee which is currently chaired by non-executive director Mr Robert Edgley. The members of that committee during the financial year were the non-executive directors: Dr Donald Stammer, Mr John Bryson and Mr Robert Edgley and the then-Group CEO Mr Arthur Naoumidis. Cathryn Nolan acts as secretary to that committee.
The Remuneration Committee was established to review the remuneration policies and practices of the Company to ensure that it remunerates fairly and responsibly.
The Company‘s Remuneration Policy, which was last updated in October 2009, is available from the Company‘s website. The policy is designed to ensure that the level and composition of remuneration is competitive, reasonable and appropriate for the results delivered and to attract and maintain talented and motivated Directors and employees. The policy is designed for:
Decisions in relation to executive and non-executive remuneration policy;
Decisions in relation to remuneration packages for Executive Directors and senior management;
Decisions in relation to merit recognition arrangements and termination arrangements; and
Ensuring that any equity-based executive remuneration is made in accordance with the thresholds set in plans approved by shareholders.
Listing Rule amendments in 2010 have the effect of requiring the Company to report on matters relating to diversity, in particular board diversity, for its 2011/12 financial year. It is expected that the Remuneration Committee will have input into the review required and any policy development that follows that review to ensure compliance with the requirements of the new listing rules.
The Remuneration Committee is authorised by the Board to investigate any activity within its charter. It is authorised to seek any information it requires from any employee and
all employees are directed to cooperate with any request made by the Remuneration Committee.
The Remuneration Committee is authorised by the Board to obtain outside legal or other independent professional advice and to secure the attendance of outsiders with relevant experience and expertise at meetings of the Remuneration Committee if it considers this necessary. It has exercised this right when it has considered it appropriate to do so.
The Remuneration Committee is required to make recommendations to the Board on all matters within the Remuneration Committee‘s Charter. A copy of the Charter can be found on the Company‘s website.
Remuneration structure
In accordance with best practice corporate governance, the structure of non-executive director and executive remuneration is separate and distinct.
Non-executive director remuneration
The Board seeks to set aggregate remuneration at a level that provides the company with the ability to attract and retain directors of the highest calibre, whilst incurring a cost that is acceptable to shareholders.
The non-executive directors are paid fixed fees in accordance with a determination of the Board but within an aggregate limit fixed by the Shareholders. The ASX Listing Rules specify that the aggregate remuneration of non-executive directors shall be determined from time to time by a general meeting. An amount not exceeding the amount determined is then divided between the directors as agreed. At the 2007 AGM the members approved the aggregate remuneration for directors as $250,000. There is no proposal to change that aggregate.
Prior to the Company‘s IPO options were issued to each of the non-executive directors and subsequently options were issued to incoming non-executive directors under that initial plan. Consistently with current ‗best practice‘ approaches to the remuneration of non-executive directors, no further options have been issued to non-executive directors following the expiration of those initially issued and there are no plans at this time to issue any further securities under the Præmium Directors & Employee Benefits Plan (the ―Plan‖) to non-executive directors. All options previously held by non-executive directors have expired (including the 135,000 options with an exercise price of $1.32 issued to Mr Bryson that expired during the financial year and a further 135,000 options with an exercise price of $1.67 which expired on 7 August 2011.
For
per
sona
l use
onl
y
16 Praemium Ltd Annual Report
Key Management Personnel
The remuneration of Key Management Personnel, including Executive Directors of the Consolidated Entity, comprises:
Fixed salary;
Variable remuneration: short-term incentives;
Variable remuneration: long-term incentives.
The short-term incentives for executives may take the form of an annual cash payment determined by the amount of fixed salary and achievement of individual KPIs. The long-term incentive is membership of the Præmium Directors & Employees Share & Option Plan.
Payment of equity-based executive remuneration is made in accordance with thresholds set out in the Præmium Directors & Employees Share & Option Plan. A copy of the plan can be found on the Company‘s website.
The names and positions of each person who held the position of Director of Præmium Limited at any time during the financial year is provided at note 15 of the financial statements and information about each of those persons (including their qualifications and experience) is set out on pages 10-12.
Performance-related remuneration - UK
As reported last year, key performance targets for the UK business were set and agreed with the UK Board during FY10; however, the EMI Options (being the equivalent of performance rights under UK regulations) relating to those criteria were only issued in December 2010. A total of 4,010,000 EMI options were issued to selected UK-based staff which, subject to achievement of milestones, are capable of conversion on exercise to fully paid ordinary shares in the capital of the company. The first milestone (achievement of £250m funds on platform, being a value that the Board considered demonstrated ‗proof of life‘ in the UK) was achieved in April 2011 and accordingly 1,336,668 of those EMI Options have vested and are capable of conversion to ordinary shares on exercise for no further consideration. The remainder of these EMI options will, subject to vesting conditions which include continuity of employment and time thresholds, vest (and accordingly be capable of conversion to ordinary shares) on achievement of milestones. Up to 1,136,668 will vest after the date on which the UK subsidiary group achieves a financial quarter of profitability or positive cash flow, and 1,136,664 when the value of client assets (investments and cash) recorded on Præmium UK‘s dps, dps Select, SMARTfund and offshore services are first capable of generating an annualised positive cash flow for Præmium UK. Any unvested EMI options, or vested but unexercised options, will expire on 1 December 2020.
The performance conditions were chosen because the Board considered at the relevant time that achieving viable funds on platform, positive cash flow and ultimately sustainable profitability are appropriate milestones which were aligned with the interests and expectations of shareholders.
Achievement of the performance conditions was determined by reference to monthly reporting of funds administered on the UK business‘ platform. Each of the funds that are administered on the UK platform are independently audited and the Company‘s own systems and controls for non-custodial funds are regularly reviewed. The Board did not consider that any independent measure was required.
In respect to future performance criteria, which relate to the extent to which the UK group is either cash-flow positive or sustainably profitable, the Board intends to assess the achievement of milestones by reference to audited reports.
Performance-related remuneration - Australia
In determining the number of entitlements under the Employee & Directors Share Scheme to be granted to Executives in particular, the Board, on the recommendations of the CEO, considered the individual performance of the executives and the contributions to the Company‘s performance and strategic plan by those key management personnel as individuals and by the teams that they manage. Other factors, including the extent to which the Company considers it important to further incentivise specific individuals, market factors and factors relevant to retention were also taken into account.
The number and value of entitlements issued were not directly linked to the Company‘s earnings; however, by aligning the interests of key personnel with shareholders by issuing them options and performance rights with relatively short vesting periods at exercise prices that were comparable to the market price of the Company‘s shares at the time they were issued, the Board aimed to link its short-term and long-term incentive plans to shareholder wealth.
The extent to which key management personnel achieved the performance criteria (and accordingly performance rights issued to them were vested and converted to ordinary shares) was based, in the case of those staff with targets that were set based on objective criteria (for example sales targets), on whether those criteria were met, and in the case of subjective criteria (for example, achievement of internal compliance or systems projects) on the CEO‘s recommendation following the conduct of annual performance appraisals. This method of assessment was chosen because of the subjective nature of some of the performance criteria set for certain key management personnel.
For
per
sona
l use
onl
y
17
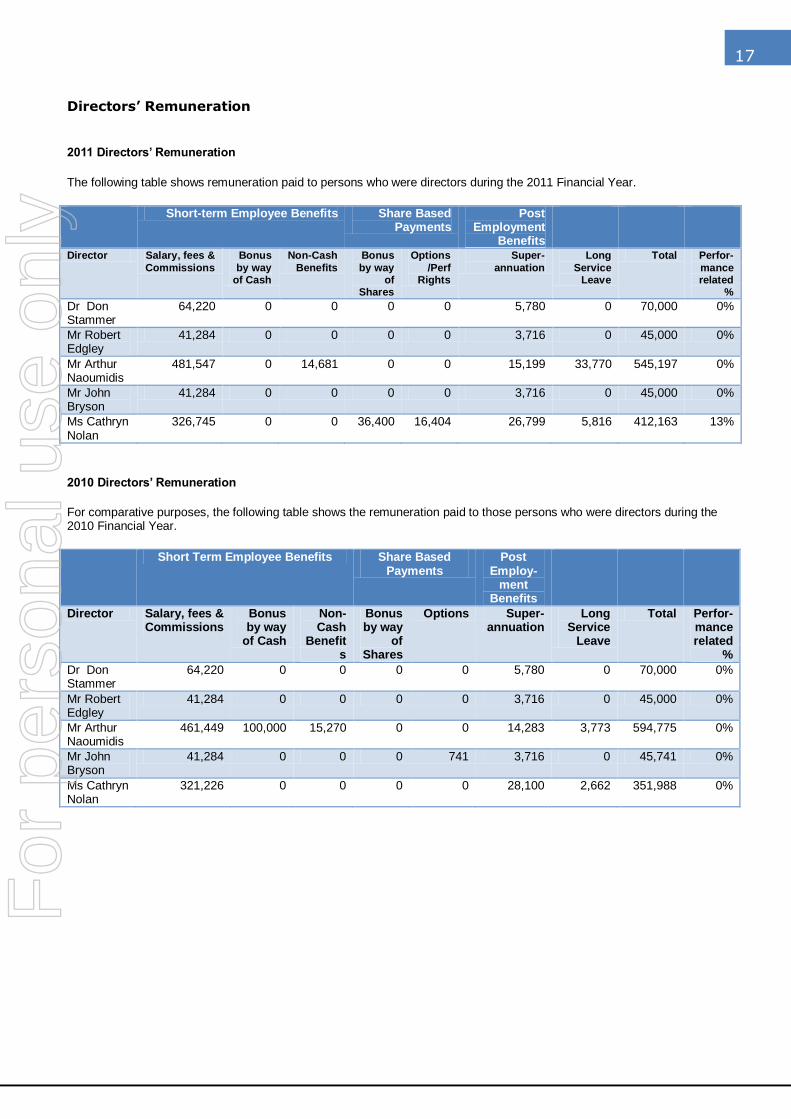
Directors’ Remuneration
2011 Directors’ Remuneration
The following table shows remuneration paid to persons who were directors during the 2011 Financial Year.
Short-term Employee Benefits Share Based Payments
Post Employment
Benefits
Director Salary, fees &
Commissions
Bonus
by way of Cash
Non-Cash
Benefits
Bonus
by way of
Shares
Options
/Perf Rights
Super-
annuation
Long
Service Leave
Total Perfor-
mance related
%
Dr Don Stammer
64,220 0 0 0 0 5,780 0 70,000 0%
Mr Robert Edgley
41,284 0 0 0 0 3,716 0 45,000 0%
Mr Arthur Naoumidis
481,547 0 14,681 0 0 15,199 33,770 545,197 0%
Mr John Bryson
41,284 0 0 0 0 3,716 0 45,000 0%
Ms Cathryn Nolan
326,745 0 0 36,400 16,404 26,799 5,816 412,163 13%
2010 Directors’ Remuneration
For comparative purposes, the following table shows the remuneration paid to those persons who were directors during the 2010 Financial Year.
Short Term Employee Benefits Share Based Payments
Post Employ-
ment Benefits
Director Salary, fees & Commissions
Bonus by way
of Cash
Non-Cash
Benefits
Bonus by way
of Shares
Options Super-annuation
Long Service
Leave
Total Perfor-mance related
%
Dr Don Stammer
64,220 0 0 0 0 5,780 0 70,000 0%
Mr Robert Edgley
41,284 0 0 0 0 3,716 0 45,000 0%
Mr Arthur Naoumidis
461,449 100,000 15,270 0 0 14,283 3,773 594,775 0%
Mr John Bryson
41,284 0 0 0 741 3,716 0 45,741 0%
Ms Cathryn Nolan
321,226 0 0 0 0 28,100 2,662 351,988 0%
For
per
sona
l use
onl
y
18 Praemium Ltd Annual Report
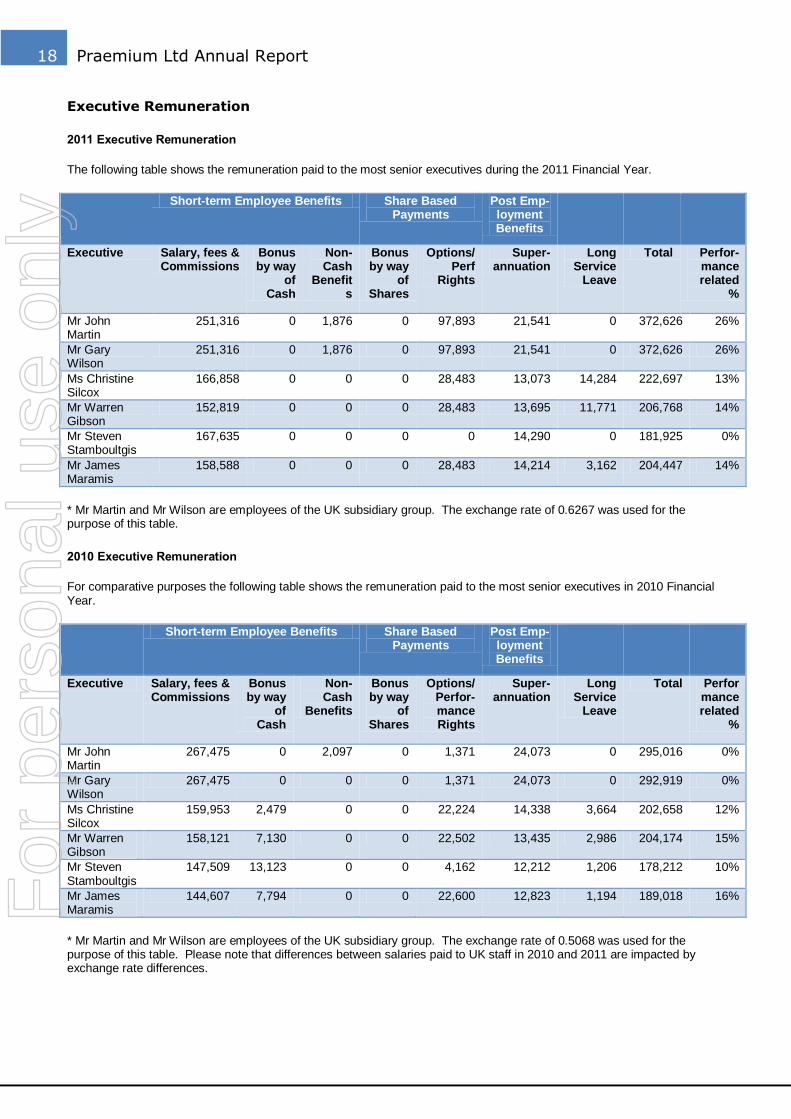
Executive Remuneration
2011 Executive Remuneration
The following table shows the remuneration paid to the most senior executives during the 2011 Financial Year.
Short-term Employee Benefits Share Based Payments
Post Emp-loyment Benefits
Executive Salary, fees & Commissions
Bonus by way
of Cash
Non-Cash
Benefits
Bonus by way
of Shares
Options/Perf
Rights
Super-annuation
Long Service
Leave
Total Perfor-mance related
%
Mr John Martin
251,316 0 1,876 0 97,893 21,541 0 372,626 26%
Mr Gary Wilson
251,316 0 1,876 0 97,893 21,541 0 372,626 26%
Ms Christine Silcox
166,858 0 0 0 28,483 13,073 14,284 222,697 13%
Mr Warren Gibson
152,819 0 0 0 28,483 13,695 11,771 206,768 14%
Mr Steven Stamboultgis
167,635 0 0 0 0 14,290 0 181,925 0%
Mr James Maramis
158,588 0 0 0 28,483 14,214 3,162 204,447 14%
* Mr Martin and Mr Wilson are employees of the UK subsidiary group. The exchange rate of 0.6267 was used for the purpose of this table.
2010 Executive Remuneration
For comparative purposes the following table shows the remuneration paid to the most senior executives in 2010 Financial Year.
Short-term Employee Benefits Share Based Payments
Post Emp-loyment Benefits
Executive Salary, fees & Commissions
Bonus by way
of Cash
Non-Cash
Benefits
Bonus by way
of Shares
Options/Perfor-mance Rights
Super-annuation
Long Service
Leave
Total Performance related
%
Mr John Martin
267,475 0 2,097 0 1,371 24,073 0 295,016 0%
Mr Gary Wilson
267,475 0 0 0 1,371 24,073 0 292,919 0%
Ms Christine Silcox
159,953 2,479 0 0 22,224 14,338 3,664 202,658 12%
Mr Warren Gibson
158,121 7,130 0 0 22,502 13,435 2,986 204,174 15%
Mr Steven Stamboultgis
147,509 13,123 0 0 4,162 12,212 1,206 178,212 10%
Mr James Maramis
144,607 7,794 0 0 22,600 12,823 1,194 189,018 16%
* Mr Martin and Mr Wilson are employees of the UK subsidiary group. The exchange rate of 0.5068 was used for the purpose of this table. Please note that differences between salaries paid to UK staff in 2010 and 2011 are impacted by exchange rate differences.
For
per
sona
l use
onl
y
19
Executive Remuneration policies and contracts
The policy for determining the nature and amount (or value, as appropriate) of key management personnel remuneration involves regular reviews and assessment of the market conditions for persons with the skills, qualifications and experience of the relevant executive. Performance bonuses are determined by reference to the market as well as the individual performances and contributions of key management personnel.
Whilst the Group is not profitable, there has been no direct link between performance payments to key executives and the profitability of the Company. However, performance payments are linked to key performance indicators that include the extent to which the Group has performed against its corporate plan and whether certain objectives and milestones have been achieved. Further, by using the Group‘s Directors & Employees Benefits Plan to offer shares and options to employees, the interests of employees are aligned with shareholder wealth.
To the extent that elements of the remuneration of key executives consists of securities in the Company, the Board, in considering whether to grant those securities and negotiating the terms of remuneration with the key executive, requires the key executive to obtain their own advice in respect to their exposure to risk in relation to the securities and relies on the undertakings of the key executives that they have obtained such advice prior to accepting the offer of securities as the method of enforcing that policy. No securities were issued to new employees as an incentive or sign on bonus during the 2011 financial year. However, since the end of the financial year the Board has issued performance rights and options as follows:
480,000 fully paid shares to key management personnel in the UK in recognition of the achievement of a milestone;
500,000 performance rights to Mr Paul Gutteridge, the Company‘s recently appointed Group CFO, who was appointed on 15 June 2011; and
1 million options and 5 million performance rights to Mr Michael Ohanessian, the CEO, who was appointed on 8 August 2011.
The performance conditions that are attached to the vesting of these performance rights are directly linked to achieving targeted EBIT per share. The Company, which is still in a startup/growth phase, is not in a position to issue forecasts and the targets will be determined by reference to management projections and accordingly not suitable for release to the market.
The exercise price for the options granted to Mr Ohanessian represents a substantial premium to the share price at the time of issue. The options have been granted on terms that provide the exercise price increases over the time that the options are vested and capable of exercise. This was designed to further align the interests of shareholders with that of the CEO.
Mr Ohanessian‘s employment agreement also provides for the granting of both short-term incentives and long-term incentives. The short-term incentives, in the form of bonuses that may be (at the discretion of the Board) paid in cash or by the issue of securities under the plan, are directly linked to the performance of the Group against the Board‘s budgets and plans. Unless Board-set budgets are achieved, no bonus payment will be made. Overachievement of budgets will result in an increase to the amount of the bonus payable, subject to caps.
All Group Executives, including Executive Directors, are employed under employment contracts. Those contracts do not have a fixed term and are terminable on between one and nine months notice (as set out below) by the executive or by the Company or, in the event that the Executive materially breaches the contract of employment in a way that involves dishonesty, fraud, a breach of any law affecting the company or a breach of certain of the Group‘s policies, the executive may be summarily dismissed.
The Company may elect on the giving or receipt of notice from any executive to pay out the balance of the term with or without requiring the executive to ‗go on garden leave‘ for the remaining term. The notice periods and amounts payable in lieu of notice for each of the key members of the Group Executives required to be disclosed are:
Mr Michael Ohanessian, CEO, is currently employed pursuant to an ongoing contract commencing 8 August 2011. Mr Ohanessian‘s maximum entitlement on termination in lieu of notice would be equal to the value of 9 months total employment package (TEP).
Ms Cathryn Nolan, General Counsel and Company Secretary, is employed on an ongoing basis subject to the terms of an agreement commencing 1 May 2006. Her entitlement in lieu of notice would be equal to the value of 6 months TEP.
Mr Paul Gutteridge, Group Chief Financial Officer, is currently employed subject to a contract which commenced 15 June 2011 which has a probationary period of 6 months. During the probationary period, either party may terminate the agreement on 1 week‘s notice. Thereafter, Mr Gutteridge‘s maximum entitlement on termination in lieu of notice would be equal to the value of 3 months TEP.
Ms Chris Silcox, Executive Director Præmium Australia Pty Ltd and Head of Operations (Australia), Mr Warren Gibson, Executive Director Præmium Australia Pty Ltd and Head of Sales & Marketing Australia and Mr James Maramis, Executive Director Præmium Australia Pty Ltd and Head of Institutional Sales are all employed on an ongoing basis. Each has a maximum entitlement on termination in lieu of notice would be equal to the value of 3 months TEP.
Mssrs John Martin and Gary Wilson, each Executive Directors of the Group‘s UK subsidiaries, are employed on an ongoing basis subject to the terms of an agreement commencing in March 2007. Their respective entitlements on termination in lieu of notice would be 3 months TEP.
For
per
sona
l use
onl
y
20 Praemium Ltd Annual Report
Additional Disclosures required or recommended by the Listing Rules & Corporations Act
Information required to be disclosed by the Listing Rules and not disclosed elsewhere in this report is set out below:
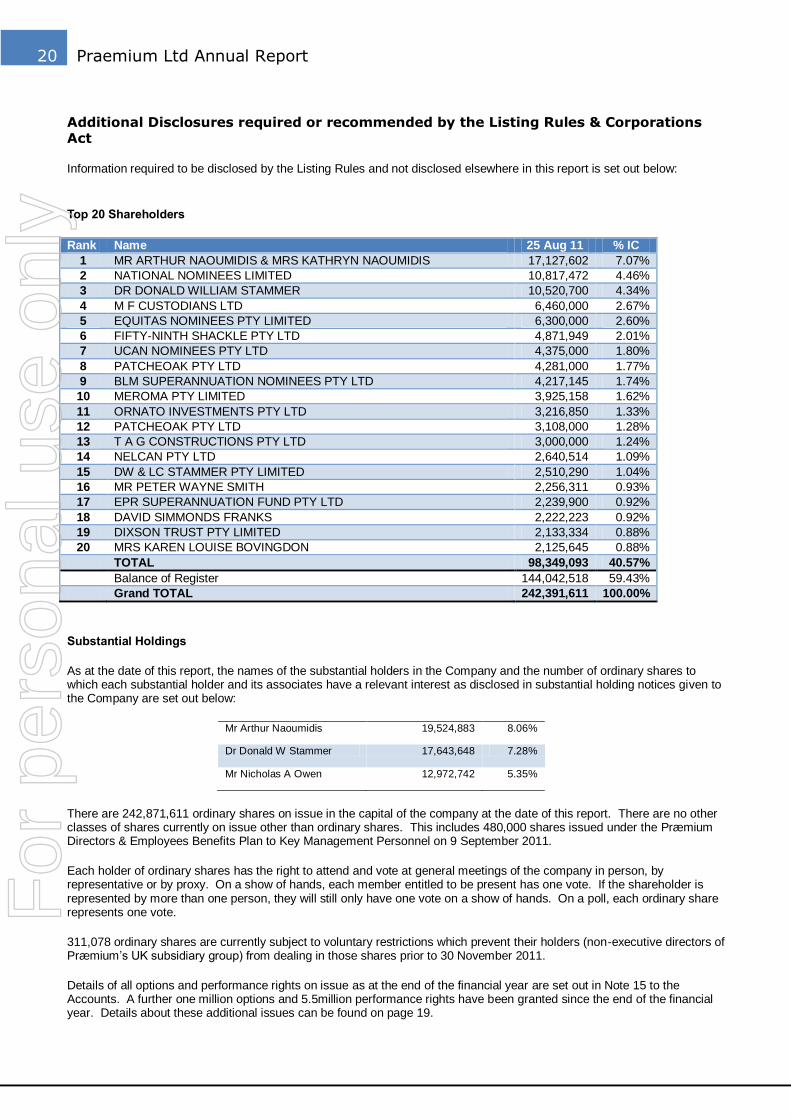
Top 20 Shareholders
Rank Name 25 Aug 11 % IC
1 MR ARTHUR NAOUMIDIS & MRS KATHRYN NAOUMIDIS 17,127,602 7.07%
2 NATIONAL NOMINEES LIMITED 10,817,472 4.46%
3 DR DONALD WILLIAM STAMMER 10,520,700 4.34%
4 M F CUSTODIANS LTD 6,460,000 2.67%
5 EQUITAS NOMINEES PTY LIMITED 6,300,000 2.60%
6 FIFTY-NINTH SHACKLE PTY LTD 4,871,949 2.01%
7 UCAN NOMINEES PTY LTD 4,375,000 1.80%
8 PATCHEOAK PTY LTD 4,281,000 1.77%
9 BLM SUPERANNUATION NOMINEES PTY LTD 4,217,145 1.74%
10 MEROMA PTY LIMITED 3,925,158 1.62%
11 ORNATO INVESTMENTS PTY LTD 3,216,850 1.33%
12 PATCHEOAK PTY LTD 3,108,000 1.28%
13 T A G CONSTRUCTIONS PTY LTD 3,000,000 1.24%
14 NELCAN PTY LTD 2,640,514 1.09%
15 DW & LC STAMMER PTY LIMITED 2,510,290 1.04%
16 MR PETER WAYNE SMITH 2,256,311 0.93%
17 EPR SUPERANNUATION FUND PTY LTD 2,239,900 0.92%
18 DAVID SIMMONDS FRANKS 2,222,223 0.92%
19 DIXSON TRUST PTY LIMITED 2,133,334 0.88%
20 MRS KAREN LOUISE BOVINGDON 2,125,645 0.88%
TOTAL 98,349,093 40.57%
Balance of Register 144,042,518 59.43%
Grand TOTAL 242,391,611 100.00%
Substantial Holdings
As at the date of this report, the names of the substantial holders in the Company and the number of ordinary shares to which each substantial holder and its associates have a relevant interest as disclosed in substantial holding notices given to the Company are set out below:
Mr Arthur Naoumidis 19,524,883 8.06%
Dr Donald W Stammer 17,643,648 7.28%
Mr Nicholas A Owen 12,972,742 5.35%
There are 242,871,611 ordinary shares on issue in the capital of the company at the date of this report. There are no other classes of shares currently on issue other than ordinary shares. This includes 480,000 shares issued under the Præmium Directors & Employees Benefits Plan to Key Management Personnel on 9 September 2011.
Each holder of ordinary shares has the right to attend and vote at general meetings of the company in person, by representative or by proxy. On a show of hands, each member entitled to be present has one vote. If the shareholder is represented by more than one person, they will still only have one vote on a show of hands. On a poll, each ordinary share represents one vote.
311,078 ordinary shares are currently subject to voluntary restrictions which prevent their holders (non-executive directors of Præmium‘s UK subsidiary group) from dealing in those shares prior to 30 November 2011.
Details of all options and performance rights on issue as at the end of the financial year are set out in Note 15 to the Accounts. A further one million options and 5.5million performance rights have been granted since the end of the financial year. Details about these additional issues can be found on page 19.
For
per
sona
l use
onl
y
21
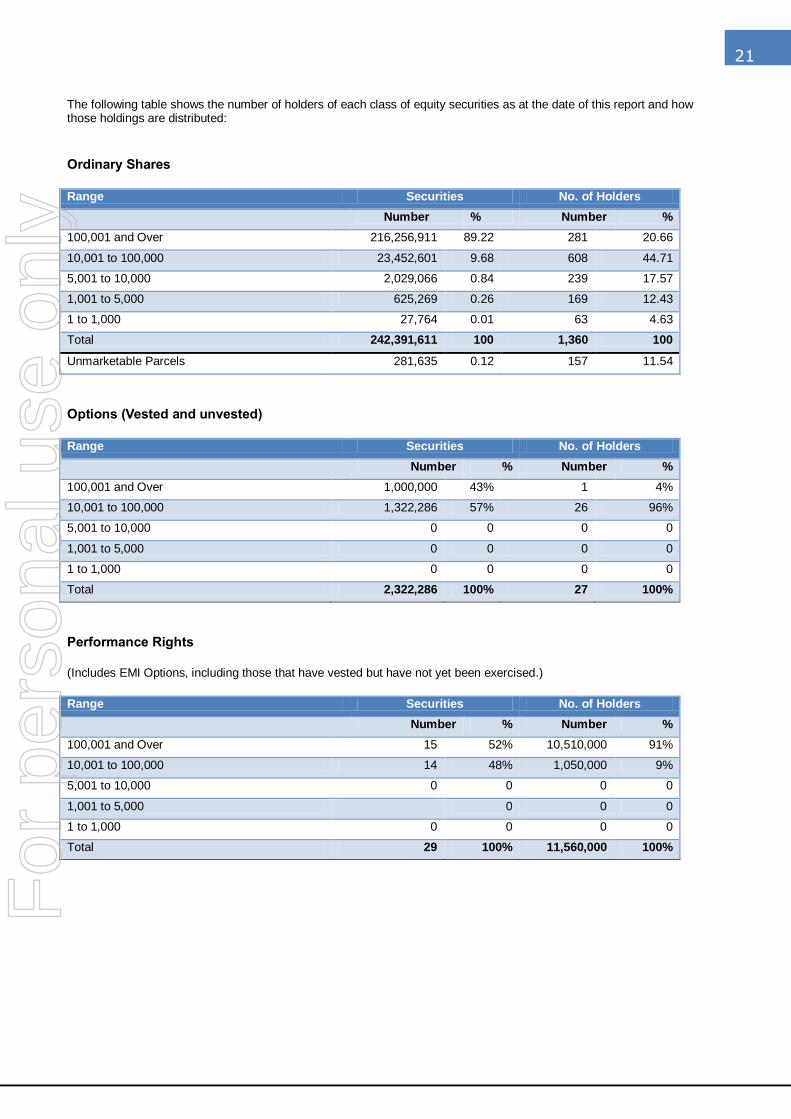
The following table shows the number of holders of each class of equity securities as at the date of this report and how those holdings are distributed:
Ordinary Shares
Range Securities No. of Holders
Number % Number %
100,001 and Over 216,256,911 89.22 281 20.66
10,001 to 100,000 23,452,601 9.68 608 44.71
5,001 to 10,000 2,029,066 0.84 239 17.57
1,001 to 5,000 625,269 0.26 169 12.43
1 to 1,000 27,764 0.01 63 4.63
Total 242,391,611 100 1,360 100
Unmarketable Parcels 281,635 0.12 157 11.54
Options (Vested and unvested)
Range Securities No. of Holders
Number % Number %
100,001 and Over 1,000,000 43% 1 4%
10,001 to 100,000 1,322,286 57% 26 96%
5,001 to 10,000 0 0 0 0
1,001 to 5,000 0 0 0 0
1 to 1,000 0 0 0 0
Total 2,322,286 100% 27 100%
Performance Rights
(Includes EMI Options, including those that have vested but have not yet been exercised.)
Range Securities No. of Holders
Number % Number %
100,001 and Over 15 52% 10,510,000 91%
10,001 to 100,000 14 48% 1,050,000 9%
5,001 to 10,000 0 0 0 0
1,001 to 5,000 0 0 0
1 to 1,000 0 0 0 0
Total 29 100% 11,560,000 100%
For
per
sona
l use
onl
y
22 Praemium Ltd Annual Report
ASX Listed Company
As at the date of this report, the Company‘s securities are not quoted on any stock exchange other than ASX. There is not currently any on-market buy back in progress.
Unquoted Securities
The only unquoted securities in the capital of the Company currently on issue are the options and performance rights referred to above. All of the options that are unquoted securities were issued or acquired under an employee incentive scheme.
Use of Cash and assets readily convertible to cash since admission to ASX Official List
In accordance with Listing Rule 4.10.19 the Company confirms that the Group has been utilising the cash and assets in a form readily convertible to cash that it held at the time of its admission to the Official List of ASX since its admission to the end of the reporting period (being 30 June 2006) in a way that is consistent with its business objectives.
Corporate Governance
A corporate governance statement is set out on pages 24 -26 of this document.
Environmental Issues
The Group‘s operations are not presently subject to significant environmental regulations under the law of the Commonwealth or State.
Proceedings on behalf of the Consolidated Entity
No person has applied for leave of Court to bring proceedings on behalf of the consolidated entity. The Company was not a party to any such proceedings during the year.
Non-Audit Services / Auditor’s Independence Declaration
A copy of the Auditor‘s Independence declaration in relation to the audit for the financial year is provided with this report. The auditor of the Australian and UK subsidiary entities is Grant Thornton. Non-audit services of approximately $125,000 have been provided by the Group‘s Parent Entity audit firm for internal controls review and income tax compliance services and similarly approximately $29,759 have been provided by the Group‘s subsidiary‘s audit firm for UK income tax compliance services. The Directors are satisfied that the provision of non-audit services is compatible with the general standard of independence for auditors, and that the nature of non-audit services means that auditor independence was not compromised.
Signed in accordance with a resolution of Directors.
Bruce Parncutt Director 12 September 2011
For
per
sona
l use
onl
y
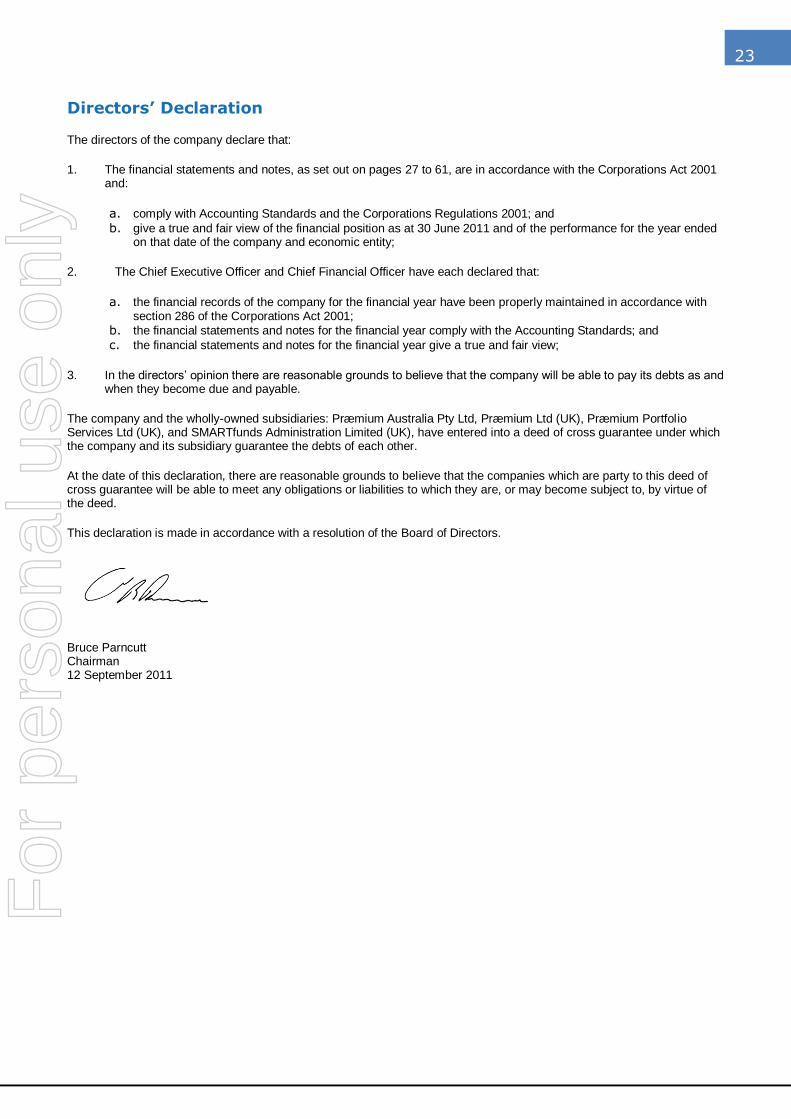
23
Directors’ Declaration
The directors of the company declare that:
1. The financial statements and notes, as set out on pages 27 to 61, are in accordance with the Corporations Act 2001 and:
a. comply with Accounting Standards and the Corporations Regulations 2001; and
b. give a true and fair view of the financial position as at 30 June 2011 and of the performance for the year ended on that date of the company and economic entity;
2. The Chief Executive Officer and Chief Financial Officer have each declared that:
a. the financial records of the company for the financial year have been properly maintained in accordance with section 286 of the Corporations Act 2001;
b. the financial statements and notes for the financial year comply with the Accounting Standards; and
c. the financial statements and notes for the financial year give a true and fair view;
3. In the directors‘ opinion there are reasonable grounds to believe that the company will be able to pay its debts as and when they become due and payable.
The company and the wholly-owned subsidiaries: Præmium Australia Pty Ltd, Præmium Ltd (UK), Præmium Portfolio Services Ltd (UK), and SMARTfunds Administration Limited (UK), have entered into a deed of cross guarantee under which the company and its subsidiary guarantee the debts of each other.
At the date of this declaration, there are reasonable grounds to believe that the companies which are party to this deed of cross guarantee will be able to meet any obligations or liabilities to which they are, or may become subject to, by virtue of the deed.
This declaration is made in accordance with a resolution of the Board of Directors.
Bruce Parncutt Chairman 12 September 2011
For
per
sona
l use
onl
y
24 Praemium Ltd Annual Report
Præmium FY2011 Corporate
Governance Statement
The policies and practices of the company are in accordance with the ASX Corporate Governance Council‘s ―Corporate Governance Principles and Recommendations (2nd Edition)‖ (ASX Guidelines) unless otherwise stated. Where the Company‘s corporate governance practices do not correlate with the ASX Guidelines, it is generally because the Company‘s Board does not consider that the practices are appropriate for the Company due to the size of its operations.
The Company provided a comprehensive statement of its approach to corporate governance in its 2006 Annual Report and has provided further information in subsequent reports. A copy of each of the Company‘s annual reports since ASX listing remains available on the Company‘s website.
In this section there are a number of references to documents being available on the Company‘s website. These documents are linked to this page: http://www.Præmium.com.au/corporate-governance.html or are otherwise available under the ―Investor Relations‖ menu that appears at the top of each page.
The Corporate Governance Statement below has been set out using the same headings used in the ASX Guidelines.
Principle 1 – Lay solid foundations for management and oversight
Principle 1.1 was slightly amended in the ASX Guidelines from its form in 2006 when the Company was initially listed to more specifically state that entities should formalise functions reserved to the board and those delegated to senior executives, and should disclose those functions.
The Company has adopted a Board Charter, a copy of which it makes publicly available on its website, which enumerates the principle functions of the Company‘s board (see Section 2). The Charter makes it clear that it is the role of the Board to govern the Company, and in particular to set policy direction, whilst it is the role of the executive to manage the Company‘s operations.
The Company has appointed boards to oversee the operations of both its UK and Australian subsidiaries. The UK Board comprises a majority of non-executive directors, whilst the group entity through which its Australian operations are conducted has only executive directors. The boards of the subsidiary companies liaise closely with the Board of the parent company. Mr Arthur Naoumidis, Præmium‘s then-Group CEO, was a member of each of the boards to ensure continued communications between the boards.
There were no new appointments to the Company‘s board during the 2011 Financial Year, however, changes in August 2011 saw the resignation of Arthur Naoumidis and Cathryn Nolan as executive directors and the appointment of Mr Bruce Parncutt as a non-executive Director. Subsequently Mr Parncutt was appointed Chairman when
Dr Stammer, who remains a non-executive director, stood down from that position.
Præmium‘s processes require that annual reviews are undertaken in respect to all staff at least annually for the purpose of reviewing activities over the past 12 month period and setting key performance indicators, goals and targets for the coming year. The process also recommends and supports managers ‗catching up‘ with their direct reports for the purpose of monitoring outcomes and plans agreed at the reviews. All Senior Executives participated in the review process in the financial year in accordance with the process.
Principle 2 – Structure the Board to add value
Skills & Experience
Information about the skills and experience of the Company‘s Directors is set out on pages 10-12.
Directors’ Independence
The Company has a majority of non-executive directors. Using the criteria recommended by the ASX Guidelines, three of the Company‘s non-executive directors (Mr Parncutt, Mr Edgley and Mr Bryson) are independent directors. Dr Stammer, who is a significant shareholder, is not classified as independent.
All directors are shareholders in the Company, and three of the non-executive directors are not substantial shareholders.
The Company‘s policies allow directors to seek independent advice at the Company‘s expense.
Independence of Chair / Division of responsibility
During the financial year the Chair of the Board was a non-executive director. As he is a substantial shareholder Dr Stammer was not classified as independent. Mr Parncutt, who was appointed to the position of Chair on 18 August 2011 is not a substantial shareholder and accordingly can be classified as an independent non-executive Chair.
The Chair of each Board Committee is an independent non-executive director and there is a clear division of responsibility between the Chairman and the CEO.
Nomination Committee
The Board does not have a separate nomination committee, recognising that ultimate responsibility for the selection and appointment of directors is ultimately the responsibility of the board as a whole and as a smaller company it considers, consistently with the ASX Guidelines, that the same efficiencies may not be derived from a formal committee structure for this important function. There is no documented procedure for the selection and appointment of new directors or the re-election of incumbent directors, as the Board does not
For
per
sona
l use
onl
y
25
consider any particular need to change its composition at this time.
The Company will be required to report on a range of matters relating to diversity for its 2011/12 financial year and following. Over the current financial year the Remuneration Committee plans to address the matters set out in the most recent edition of the Corporate Governance Principles and Recommendations published by the ASX Governance Council, with a view to ensuring that it meets the requirements of those principles to the extent that they are applicable to the Company‘s circumstances when addressing the composition of the Board.
Board Performance
The Chair conducts a review of Board Performance at least once each calendar year. The process involves the preparation of a questionnaire, to which directors and nominated senior executives respond anonymously, addressing matters relating to the conduct of meeting, the content of board papers and other matters relevant to Board performance. The results of the survey are collated and reported to the Board and discussed in the Board meeting. The process was last conducted in February 2011 and the process described above was followed.
Term of appointment
All Non-executive Directors have been elected to their positions and the term of their appointment expires at the end of the next annual general meeting at which they are required by the Company‘s constitution or the listing rules to retire by rotation.
Principle 3 – Provide ethical and responsible decision making
Code of Conduct
The Company has a code of conduct which is published on its website. The Code is reviewed every two years and was last updated in August 2009.
Trading Policies
A copy of the Group‘s policies in respect to trading in the Company‘s shares is also published on its website. This policy was updated in December 2010 and reflects changes to the listing rules that took effect on 1 January 2011.
Diversity Policies
During the current financial year the Board will consider its policy concerning diversity with a view to disclosing that policy (or a summary of it) and being in a position to identify, report on appropriate measurable objectives for achieving gender diversity and to commence reporting on the numbers of women in the organisation, including senior management and on the board, prior to the commencement of the FY2011/12 financial year (being the
first year in which the recent changes to the listing rules requiring disclosures relating to diversity will apply).
Principle 4 – Safeguard integrity in financial reporting
The Company has established an Audit & Compliance Committee which comprises: Mr Robert Edgley (Chair), Dr Don Stammer, Mr John Bryson and Mr Roland Ward. Mr Parncutt became a member of that committee on his appointment in August 2011. All members are independent and non-executive. 2 Committee meetings were held during the 2009 financial year, and all meetings were attended by all Committee members and the Company‘s Auditor. The Audit & Compliance Committee has a formal charter, a copy of which is available from the Company‘s website. The Charter was updated in reviewed and updated in September 2010.
Principle 5 – Make timely and balanced disclosure
The Company has established written policies designed to ensure compliance with ASX Listing Rule disclosure requirements and to ensure accountability at a senior executive level for that compliance. The key policy, Præmium‘s Continuous Market Disclosure Policy, and corresponding procedures were reviewed in June 2010 and are published on the Company‘s website.
Principle 6 – Respect the rights of shareholders
The Company has a website to communicate information to its shareholders.
The Company has developed a policy for communicating with shareholders (this policy is also set out on the Company‘s website) which has been followed during the 2011 Financial Year.
Where possible and practical, the Company communicates with Shareholders using the internet and other electronic forms of communication. For this purpose it maintains a list of email addresses for shareholders and others interested in hearing from the Company and provides regular updates by email – in particular, links to market sensitive announcements and financial filings.
Præmium strongly encourages all shareholders to assist it to reduce costs and be kind to our environment by opting to receive annual reports, notices of meeting, proxy forms and other formal communications electronically. Præmium‘s constitution allows for direct online voting.
The Company is in the process of reviewing processes for the planning and conduct of external briefings with a view to ensuring compliance with the revisions to Principle 6 over the current 2011/12 financial year.
For
per
sona
l use
onl
y
26 Praemium Ltd Annual Report
Principle 7 – Recognise and manage risk
Responsibility for risk oversight and management and internal control has been delegated by the Board to a separate Risk Committee. The Charter for the Risk Committee, which can be found on the Company‘s Website, complies with the recommendations set out in Principle 7 of the ASX Guidelines.
The Company‘s Risk Management Policy Statement is published on the Company‘s website. The policy was last reviewed in September 2010.
The Company‘s Risk Committee comprises Mr John Bryson (Chair), Dr Don Stammer, Mr Rob Edgley and (during the financial year) Mr David Harrison. Mr Parncutt joined that committee on his appointment in August 2011. The Committee met twice during the financial year.
In accordance with Recommendation 7.2 the Risk Committee has required management to design and implement a risk management and internal control system to identify and manage the Group‘s material business risks and to report to it on whether those risks are being managed effectively; management has been meeting this requirement and managing risks effectively.
The Group does not currently have any internal audit function. The Board considers that at the Company‘s current stage of growth and size there is no particular benefit to appointing internal audit and in the alternative seeks independent advice as it considers appropriate. In all other respects, the Company complies with the recommendations set out in Principle 7.
Principle 8 – Remunerate fairly and responsibly
The Company‘s approach to remuneration and this principle is set out in its Remuneration Report on page 15 and following. The Company‘s approach to the remuneration of non-executive directors is clearly distinguished from that of executive directors and senior executives.
The Company‘s Remuneration Committee comprises Mr Robert Edgley (Chair), Dr Don Stammer, Mr John Bryson and (during the financial year) Mr Arthur Naoumidis. Mr Parncutt joined that committee on his appointment in August 2011. The Committee met twice during the financial year and all members of the Committee attended each meeting. A copy of the Remuneration Committee Charter is published on the Company‘s website. It was last reviewed in June 2008.
The Company does not operate any schemes for retirement benefits for any non-executive Director other than the contributions that it makes to superannuation in accordance with statutory requirements.
For
per
sona
l use
onl
y

27
Financial Report
For
per
sona
l use
onl
y
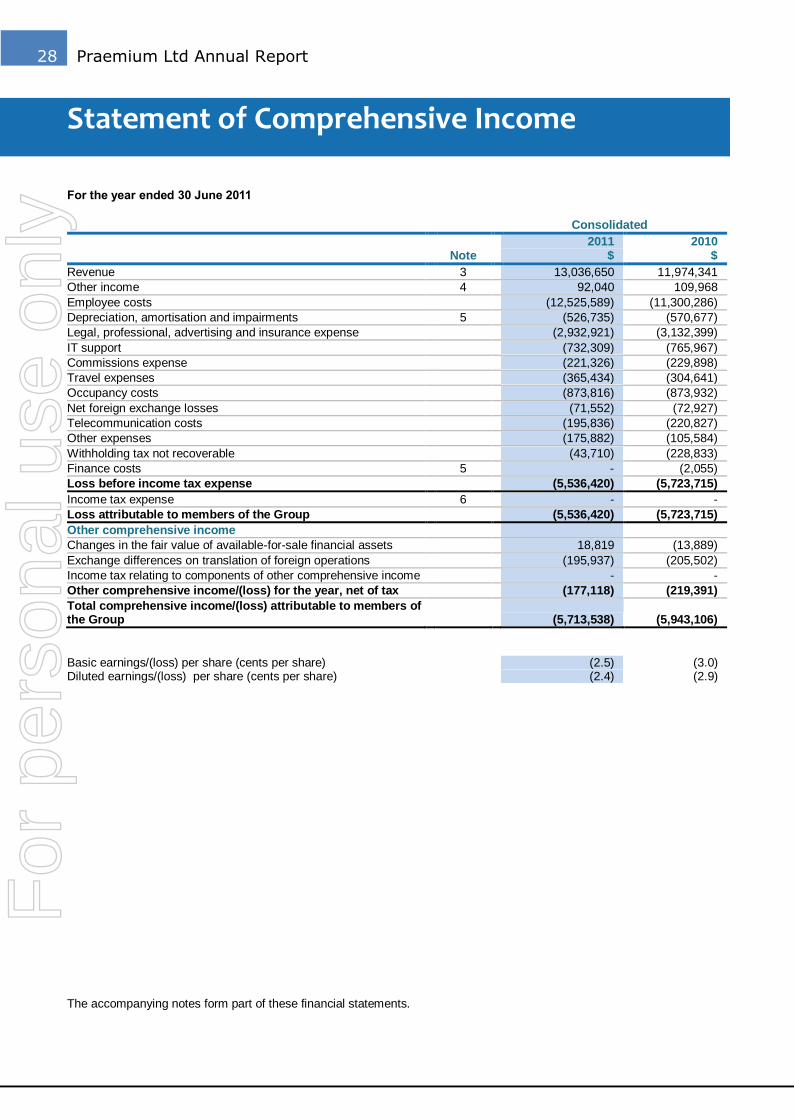
28 Praemium Ltd Annual Report
Statement of Comprehensive Income
For the year ended 30 June 2011
Consolidated
Note
2011 $
2010 $
Revenue 3 13,036,650 11,974,341
Other income 4 92,040 109,968
Employee costs (12,525,589) (11,300,286)
Depreciation, amortisation and impairments 5 (526,735) (570,677)
Legal, professional, advertising and insurance expense (2,932,921) (3,132,399)
IT support (732,309) (765,967)
Commissions expense (221,326) (229,898)
Travel expenses (365,434) (304,641)
Occupancy costs (873,816) (873,932)
Net foreign exchange losses (71,552) (72,927)
Telecommunication costs (195,836) (220,827)
Other expenses (175,882) (105,584)
Withholding tax not recoverable (43,710) (228,833)
Finance costs 5 - (2,055)
Loss before income tax expense (5,536,420) (5,723,715)
Income tax expense 6 - -
Loss attributable to members of the Group (5,536,420) (5,723,715)
Other comprehensive income
Changes in the fair value of available-for-sale financial assets 18,819 (13,889)
Exchange differences on translation of foreign operations (195,937) (205,502)
Income tax relating to components of other comprehensive income - -
Other comprehensive income/(loss) for the year, net of tax (177,118) (219,391)
Total comprehensive income/(loss) attributable to members of the Group (5,713,538) (5,943,106)
Basic earnings/(loss) per share (cents per share) (2.5) (3.0) Diluted earnings/(loss) per share (cents per share) (2.4) (2.9)
The accompanying notes form part of these financial statements.
For
per
sona
l use
onl
y
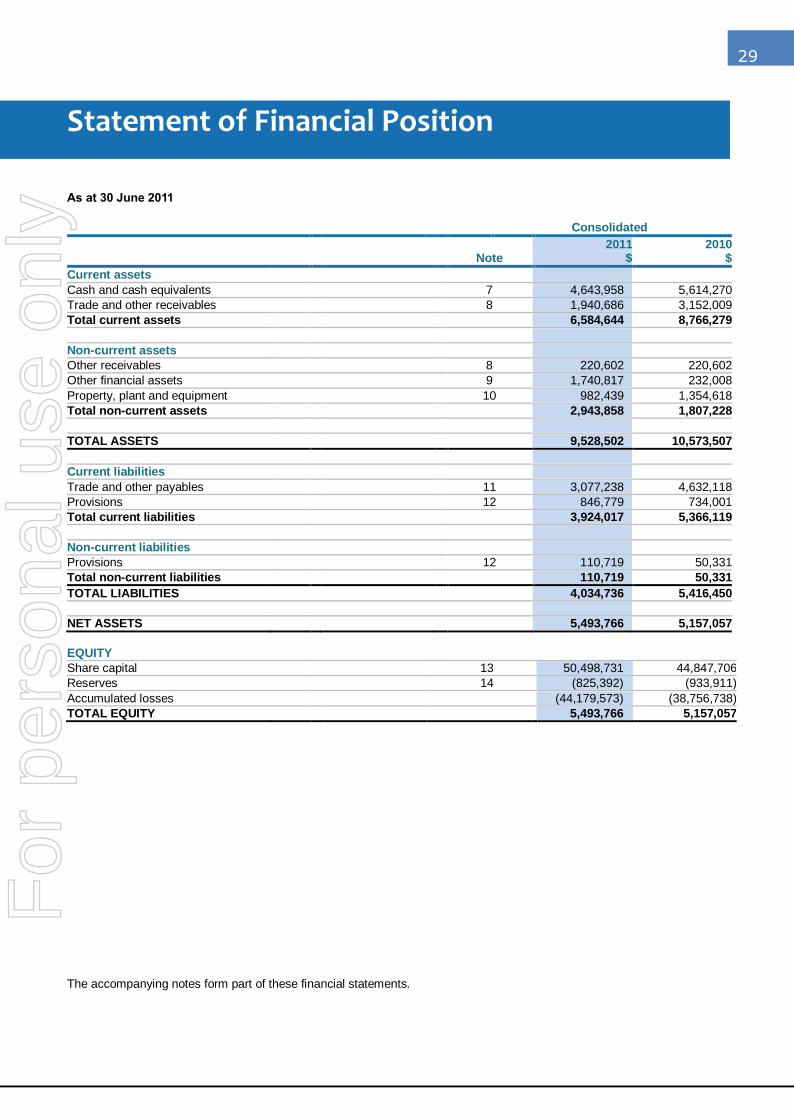
29
Statement of Financial Position
As at 30 June 2011
Consolidated
Note 2011
$ 2010
$
Current assets
Cash and cash equivalents 7 4,643,958 5,614,270
Trade and other receivables 8 1,940,686 3,152,009
Total current assets 6,584,644 8,766,279
Non-current assets
Other receivables 8 220,602 220,602
Other financial assets 9 1,740,817 232,008
Property, plant and equipment 10 982,439 1,354,618
Total non-current assets 2,943,858 1,807,228
TOTAL ASSETS 9,528,502 10,573,507
Current liabilities
Trade and other payables 11 3,077,238 4,632,118
Provisions 12 846,779 734,001
Total current liabilities 3,924,017 5,366,119
Non-current liabilities
Provisions 12 110,719 50,331
Total non-current liabilities 110,719 50,331
TOTAL LIABILITIES 4,034,736 5,416,450
NET ASSETS 5,493,766 5,157,057
EQUITY
Share capital 13 50,498,731 44,847,706
Reserves 14 (825,392) (933,911)
Accumulated losses (44,179,573) (38,756,738)
TOTAL EQUITY 5,493,766 5,157,057
The accompanying notes form part of these financial statements.
For
per
sona
l use
onl
y
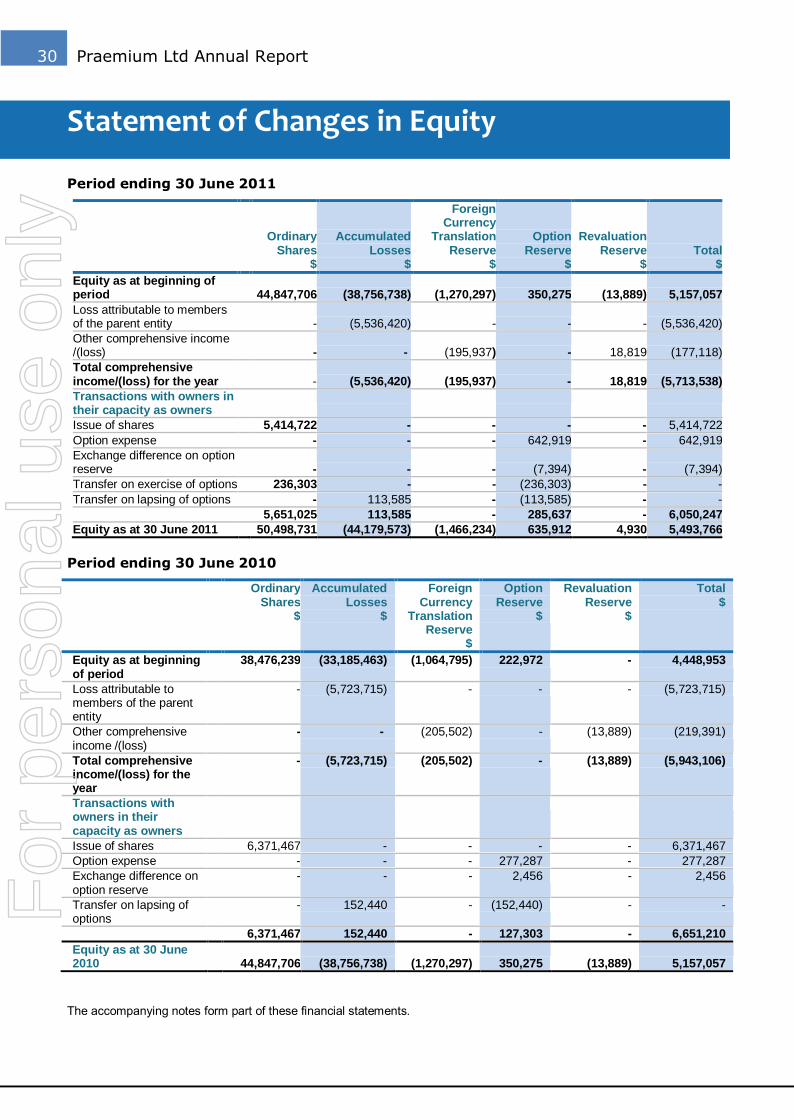
30 Praemium Ltd Annual Report
Statement of Changes in Equity
Period ending 30 June 2011
Ordinary Shares
$
Accumulated Losses
$
Foreign Currency
Translation Reserve
$
Option Reserve
$
Revaluation Reserve
$ Total
$
Equity as at beginning of period 44,847,706 (38,756,738) (1,270,297) 350,275 (13,889) 5,157,057
Loss attributable to members of the parent entity - (5,536,420) - - - (5,536,420)
Other comprehensive income /(loss) - - (195,937) - 18,819 (177,118)
Total comprehensive income/(loss) for the year - (5,536,420) (195,937) - 18,819 (5,713,538)
Transactions with owners in their capacity as owners
Issue of shares 5,414,722 - - - - 5,414,722
Option expense - - - 642,919 - 642,919
Exchange difference on option reserve - - - (7,394) - (7,394)
Transfer on exercise of options 236,303 - - (236,303) - -
Transfer on lapsing of options - 113,585 - (113,585) - -
5,651,025 113,585 - 285,637 - 6,050,247
Equity as at 30 June 2011 50,498,731 (44,179,573) (1,466,234) 635,912 4,930 5,493,766
Period ending 30 June 2010
Ordinary Shares
$
Accumulated Losses
$
Foreign Currency
Translation Reserve
$
Option Reserve
$
Revaluation Reserve
$
Total $
Equity as at beginning of period
38,476,239 (33,185,463) (1,064,795) 222,972 - 4,448,953
Loss attributable to members of the parent entity
- (5,723,715) - - - (5,723,715)
Other comprehensive income /(loss)
- - (205,502) - (13,889) (219,391)
Total comprehensive income/(loss) for the year
- (5,723,715) (205,502) - (13,889) (5,943,106)
Transactions with owners in their capacity as owners
Issue of shares 6,371,467 - - - - 6,371,467
Option expense - - - 277,287 - 277,287
Exchange difference on option reserve
- - - 2,456 - 2,456
Transfer on lapsing of options
- 152,440 - (152,440) - -
6,371,467 152,440 - 127,303 - 6,651,210
Equity as at 30 June 2010
44,847,706 (38,756,738) (1,270,297) 350,275 (13,889) 5,157,057
The accompanying notes form part of these financial statements.
For
per
sona
l use
onl
y
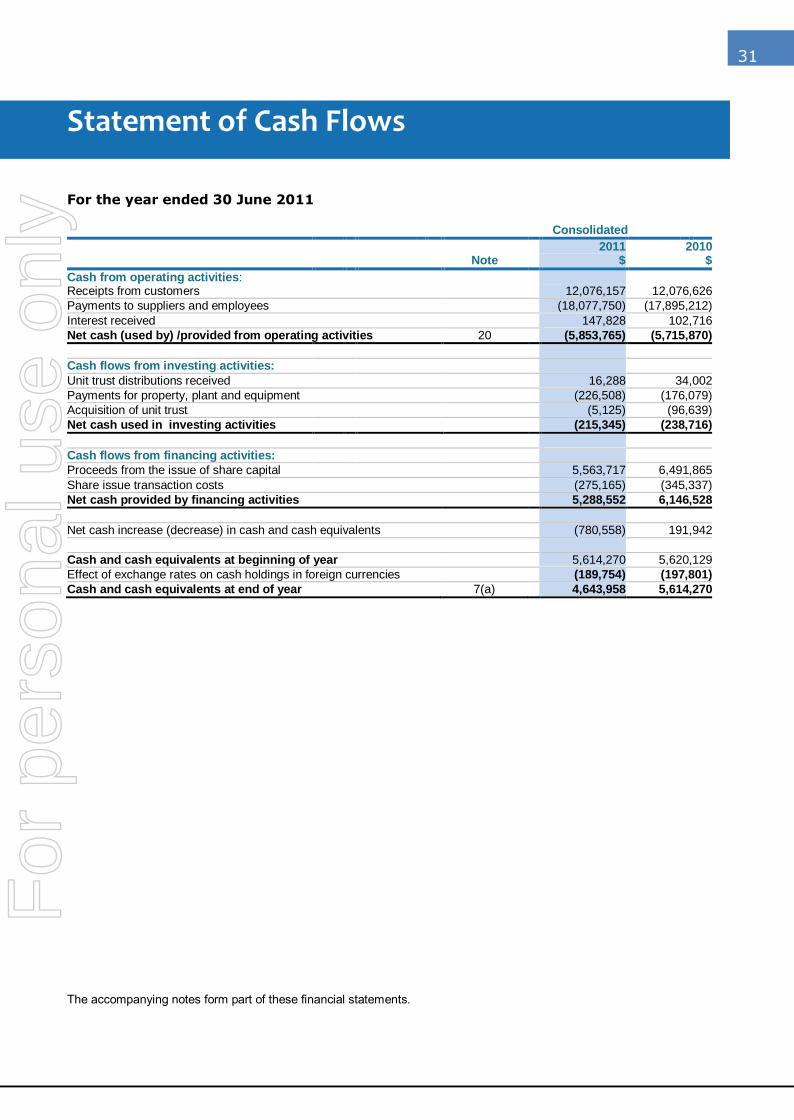
31
Statement of Cash Flows
For the year ended 30 June 2011
Consolidated
Note 2011
$ 2010
$
Cash from operating activities: Receipts from customers 12,076,157 12,076,626
Payments to suppliers and employees (18,077,750) (17,895,212)
Interest received 147,828 102,716
Net cash (used by) /provided from operating activities 20 (5,853,765) (5,715,870)
Cash flows from investing activities:
Unit trust distributions received 16,288 34,002
Payments for property, plant and equipment (226,508) (176,079)
Acquisition of unit trust (5,125) (96,639)
Net cash used in investing activities (215,345) (238,716)
Cash flows from financing activities:
Proceeds from the issue of share capital 5,563,717 6,491,865
Share issue transaction costs (275,165) (345,337)
Net cash provided by financing activities 5,288,552 6,146,528
Net cash increase (decrease) in cash and cash equivalents (780,558) 191,942
Cash and cash equivalents at beginning of year 5,614,270 5,620,129
Effect of exchange rates on cash holdings in foreign currencies (189,754) (197,801)
Cash and cash equivalents at end of year 7(a) 4,643,958 5,614,270
The accompanying notes form part of these financial statements.
For
per
sona
l use
onl
y

32 Praemium Ltd Annual Report
Notes the Financial Statements
1. Notes to the Financial Statements
(a) General information
The financial report is a general purpose financial report that covers the consolidated entity consisting of Præmium Limited and its subsidiaries. Præmium Limited is a listed public company, incorporated and domiciled in Australia. Separate financial statements for Præmium Limited as an individual entity are no longer presented as the consequence of a change to the Corporations Act 2001, however, limited financial information for Præmium Limited as an individual entity are included in Note 23.
The following is a summary of the material accounting policies adopted by the Group in the preparation of the financial report. The accounting policies have been consistently applied, unless otherwise stated.
(b) Basis of preparation
The financial report of Præmium Limited and controlled entities has been prepared in accordance with Australian Accounting Standards (including Australian Accounting Interpretations), other authoritative pronouncements of the Australian Accounting Standards Board and the Corporations Act 2001.
Australian Accounting Standards include International Financial Reporting Standards as adopted in Australia. Compliance with AIFRS ensures that the financial report complies with International Financial Reporting Standards (IFRS).
(i) Reporting basis and conventions
The financial report has been prepared on an accruals basis and is based on historical costs as modified by the revaluation of available for sale financial assets, financial assets and liabilities at fair value through profit or loss, certain classes of property, plant and equipment and investment property.
(c) Principles of consolidation
The consolidated financial statements incorporate the assets and liabilities of all subsidiaries of Præmium Limited (―parent entity‖) as at 30 June 2011 and the results of all subsidiaries for the year then ended. Præmium Limited and its subsidiaries are referred to in this financial report as the ―Group‖ or the ―consolidated entity‖.
A subsidiary is any entity over which Præmium Limited has the power to control the financial and operating policies so as to obtain benefits from its activities.
All inter-company balances and transactions between entities in the Group, including any unrealised profits or losses, have been eliminated on consolidation. Accounting policies of subsidiaries have been changed where necessary to ensure consistency with those policies adopted by the Group.
Subsidiaries are fully consolidated from the date which control is transferred to the Group. They are de-consolidated from the date control ceases.
The purchase method of accounting is used to account for all acquisitions of assets (including business combinations). Cost is measured as the fair value of the assets given, equity instruments issued or liabilities incurred or assumed at the date of exchange.
Identifiable assets acquired and liabilities and contingent liabilities assumed in a business combination are measured initially at their fair values at the acquisition date, irrespective of the extent of any minority interest. The excess of the cost of acquisition over the Group‘s share of the identifiable net assets acquired is recorded as goodwill. If the cost of acquisition is less than the fair value of the Group‘s share of net assets of the subsidiary acquired, the difference is recognised directly in the statement of comprehensive income.
Where settlement of any part of cash consideration is deferred, the amounts payable in the future are discounted to their present value as at the date of exchange. The discount rate used is the entity‘s incremental borrowing rate, being the rate at which a similar borrowing could be obtained from an independent financier under comparable terms and conditions.
(d) Segment reporting
From 1 July 2009, operating segments are identified and segment information disclosed on the basis of internal reports that are regularly provided to, or reviewed by, the Group‘s chief operating decision maker which, for the Group, is the board of directors. In this regard, such information is provided using different measures to those used in preparing the statement of comprehensive income and statement of financial position.
For
per
sona
l use
onl
y
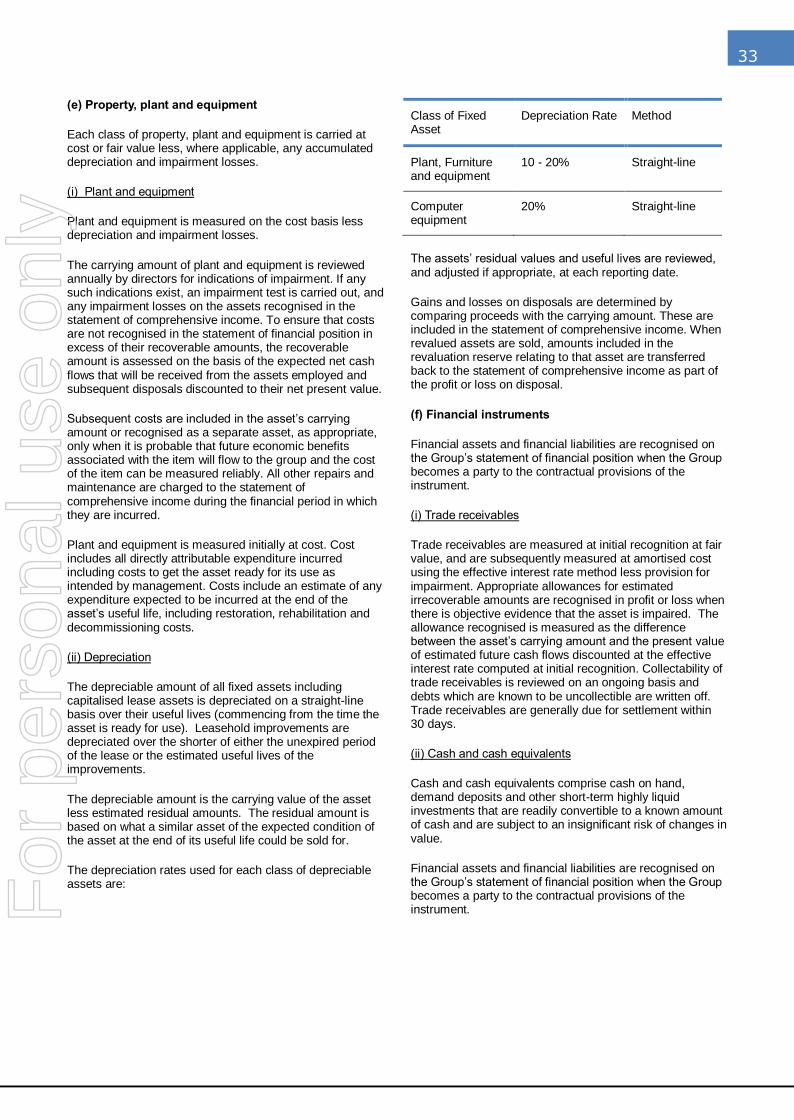
33
(e) Property, plant and equipment
Each class of property, plant and equipment is carried at cost or fair value less, where applicable, any accumulated depreciation and impairment losses.
(i) Plant and equipment
Plant and equipment is measured on the cost basis less depreciation and impairment losses.
The carrying amount of plant and equipment is reviewed annually by directors for indications of impairment. If any such indications exist, an impairment test is carried out, and any impairment losses on the assets recognised in the statement of comprehensive income. To ensure that costs are not recognised in the statement of financial position in excess of their recoverable amounts, the recoverable amount is assessed on the basis of the expected net cash flows that will be received from the assets employed and subsequent disposals discounted to their net present value.
Subsequent costs are included in the asset‘s carrying amount or recognised as a separate asset, as appropriate, only when it is probable that future economic benefits associated with the item will flow to the group and the cost of the item can be measured reliably. All other repairs and maintenance are charged to the statement of comprehensive income during the financial period in which they are incurred.
Plant and equipment is measured initially at cost. Cost includes all directly attributable expenditure incurred including costs to get the asset ready for its use as intended by management. Costs include an estimate of any expenditure expected to be incurred at the end of the asset‘s useful life, including restoration, rehabilitation and decommissioning costs.
(ii) Depreciation
The depreciable amount of all fixed assets including capitalised lease assets is depreciated on a straight-line basis over their useful lives (commencing from the time the asset is ready for use). Leasehold improvements are depreciated over the shorter of either the unexpired period of the lease or the estimated useful lives of the improvements.
The depreciable amount is the carrying value of the asset less estimated residual amounts. The residual amount is based on what a similar asset of the expected condition of the asset at the end of its useful life could be sold for.
The depreciation rates used for each class of depreciable assets are:
Class of Fixed Asset
Depreciation Rate Method
Plant, Furniture and equipment
10 - 20% Straight-line
Computer equipment
20% Straight-line
The assets‘ residual values and useful lives are reviewed, and adjusted if appropriate, at each reporting date.
Gains and losses on disposals are determined by comparing proceeds with the carrying amount. These are included in the statement of comprehensive income. When revalued assets are sold, amounts included in the revaluation reserve relating to that asset are transferred back to the statement of comprehensive income as part of the profit or loss on disposal.
(f) Financial instruments
Financial assets and financial liabilities are recognised on the Group‘s statement of financial position when the Group becomes a party to the contractual provisions of the instrument.
(i) Trade receivables
Trade receivables are measured at initial recognition at fair value, and are subsequently measured at amortised cost using the effective interest rate method less provision for impairment. Appropriate allowances for estimated irrecoverable amounts are recognised in profit or loss when there is objective evidence that the asset is impaired. The allowance recognised is measured as the difference between the asset‘s carrying amount and the present value of estimated future cash flows discounted at the effective interest rate computed at initial recognition. Collectability of trade receivables is reviewed on an ongoing basis and debts which are known to be uncollectible are written off. Trade receivables are generally due for settlement within 30 days.
(ii) Cash and cash equivalents
Cash and cash equivalents comprise cash on hand, demand deposits and other short-term highly liquid investments that are readily convertible to a known amount of cash and are subject to an insignificant risk of changes in value.
Financial assets and financial liabilities are recognised on the Group‘s statement of financial position when the Group becomes a party to the contractual provisions of the instrument.
For
per
sona
l use
onl
y
34 Praemium Ltd Annual Report
(iii) Financial liabilities and equity
Financial liabilities and equity instruments issued by the Group are classified according to the substance of the contractual arrangements entered into and the definitions of a financial liability and an equity instrument. An equity instrument is any contract that evidences a residual interest in the assets of the Group after deducting all of its liabilities. The accounting policies adopted for specific financial liabilities and equity instruments are set out below.
Financial liabilities are classified as either financial liabilities ―at fair value through profit or loss‖ or other financial liabilities depending on the purpose for which the liability was acquired.
The Group‘s financial liabilities include trade and other payables.
Financial liabilities are recognized when the Group becomes a party to the contractual agreements of the instrument. All interest related charges and, if applicable, changes in an instrument‘s fair value that are reported in profit or loss are included in the statement of comprehensive income line items ―finance costs‖ or ―finance income‖.
(iv) Trade payables
Trade payables are initially measured at fair value, and are subsequently measured at amortised cost. These amounts are unsecured and are usually paid within 45 days of recognition.
(v) Equity instruments
Equity instruments issued by the Group are recorded at the proceeds received, net of direct issue costs.
(vi) Fair Value
The net fair value of financial assets and financial liabilities approximates their carrying amounts as disclosed in the statement of financial position and notes to the financial statements. Fair value is defined as the amount that could be exchanged for an asset between knowledgeable willing parties in an arm‘s length transaction.
(vii) Available-for-sale financial assets
Available-for-sale financial assets, comprising principally units in unlisted registered schemes, are non-derivatives that are either designated in this category or not classified in any of the other categories. They are included as non-current assets unless management intends to dispose of the investment within 12 months of reporting date.
Available-for-sale financial assets are initially recognised at fair value plus transaction costs and are subsequently measured at fair value. Changes in fair value are recognised directly in equity in an available-for-sale assets revaluation reserve.
When securities classified as available-for-sale are sold or impaired, the accumulated fair value adjustments recognised in equity are included in the statement of comprehensive income as gains and losses.
The group assesses at each reporting date whether there is objective evidence that a financial asset is impaired. In the case of equity securities classified as available-for-sale, a significant or prolonged decline in the fair value of a security below its cost is considered in determining whether the security is impaired. If such evidence exists for available-for-sale financial assets, the cumulative loss – measured as the difference between the acquisition cost and the current fair value, less any impairment loss on that financial asset previously recognised in profit or loss – is removed from equity and recognised in the statement of comprehensive income. Impairment losses recognised in the statement of comprehensive income on equity instruments classified as available-for-sale are not reversed through the statement of comprehensive income.
(g) Impairment of non-financial assets
At each reporting date, the Group reviews the carrying values of its assets to determine whether there is any indication that those assets have been impaired. For assets where such an indication exists, the recoverable amount of the asset, being the higher of the asset‘s fair value less costs to sell and value in use, is compared to the asset‘s carrying value. Any excess of the asset‘s carrying value over its recoverable amount is expensed to the statement of comprehensive income, unless the relevant asset is carried at a revalued amount, in which case the impairment loss is treated as a revaluation decrease to the extent that the revaluation reserve relates to that asset.
In assessing value in use, the estimated future cash flows are discounted to their present value using a pre-tax discount rate that reflects current market assessments of the time value of money and the risks specific to the asset for which the estimates of future cash flows have not been adjusted.
Where it is not possible to estimate the recoverable amount of an individual asset, the Group estimates the recoverable amount of the cash-generating unit to which the asset belongs.
Where an impairment loss subsequently reverses, the carrying amount of the asset or cash generating unit is increased to the revised recoverable amount, but so that the increased carrying amount does not exceed the carrying amount that would have been determined had no impairment loss been recognised in prior years. A reversal of an impairment loss is recognised as income in the statement of comprehensive income, unless the relevant asset is carried at a revalued amount, in which case the reversal is recognised as a revaluation increase.
(h) Employee benefits
Provision is made for the Group‘s liability for employee benefits arising from services rendered by employees to reporting date. Employee benefits that are expected to be settled within one year have been measured at the
For
per
sona
l use
onl
y
35
amounts expected to be paid when the liability is settled, plus related on-costs. Employee benefits payable later than one year have been measured at the present value of the estimated future cash outflows to be made for those benefits.
(i) Equity-settled compensation
The Group operates a share based compensation scheme.
Equity-settled share-based payments are measured at fair value at the date of grant. The fair value determined at the grant date is expensed on a straight line basis over the vesting period, based on the Group‘s estimate of shares that will eventually vest.
Fair value is measured by use of a Black-Scholes model. The expected life used in the model has been adjusted, based on management‘s estimate, for the effects of non-transferability, exercise restrictions and behavioural considerations.
(j) Provisions
Provisions are recognised when the Group has a legal or constructive obligation, as a result of past events, for which it is probable that an outflow of economic benefits will result and that the outflow can be reliably measured.
(k) Income tax
The charge for current income tax expense is based on the profit for the year adjusted for any non-assessable or disallowed items. It is calculated using the tax rates that have been enacted or are substantially enacted by reporting date.
Deferred tax assets and liabilities are recognised using the balance sheet liability method in respect of temporary differences arising between the tax bases of assets and liabilities and their carrying amounts in the financial statements, and on unused tax losses. No deferred tax assets or liabilities will be recognised from the initial recognition of an asset or liability excluding a business combination, which at the time of the transaction did not affect either accounting or taxable profit or loss.
Deferred tax is calculated at the tax rates that are expected to apply to the period when the asset is realised or liability is settled. Deferred tax is recognised in the statement of comprehensive income except where it relates to items which are recognised directly in equity, in which case the deferred tax is recognised directly in equity.
Deferred tax assets are recognised for deductible temporary differences and unused tax losses only if it is probable that future taxable amounts will be available to utilise those temporary differences and losses.
Deferred tax liabilities and assets are not recognised for temporary differences between the carrying amount and tax bases of investments in controlled entities where the parent entity is able to control then timing of the reversal of the temporary differences and it is probable that the differences will not reverse in the foreseeable future.
The directors have elected for those entities within the consolidated entity that are wholly-owned Australian resident entities to be taxed as a single entity from July 1 2005. The head entity within the tax consolidated group for the purposes of tax consolidation is Præmium Ltd.
Præmium Limited and its wholly-owned Australian controlled entities have implemented the tax consolidation legislation. Præmium Limited and each of the entities within the tax consolidated group account for their own current and deferred tax amounts. These amounts are measured as if each entity in the group continues to be a stand-alone tax payer in its own right.
In addition to its own current and deferred tax amounts, Præmium Limited also recognises the current tax liabilities (or assets) and the deferred tax assets arising from unused tax losses and unused tax credits assumed from controlled entities in the tax consolidated group.
Entities within the tax consolidated group have entered into a tax funding agreement with the head entity. Under the terms of this agreement, each of the wholly-owned entities within the tax consolidated group has agreed to fully compensate Præmium Limited for any current tax payable assumed and are compensated by Præmium Limited for any current tax receivable and deferred tax assets relating to unused tax losses or unused tax credits that are transferred to Præmium Limited under the tax consolidation legislation. The funding amounts are determined by reference to the amounts recognised in the wholly-owned entities‘ financial statements. Such amounts are reflected in amounts receivable from or payable to other entities in the tax consolidated group.
Any difference between the amounts assumed and amounts receivable or payable under the tax funding agreement are recognised as a contribution to (or distribution from) wholly-owned tax consolidated entities.
(l) Leases
Leases of fixed assets where substantially all the risks and rewards incidental to the ownership of the asset, but not the legal ownership, that are transferred to entities in the Group are classified as finance leases.
Finance leases are capitalised at the inception of the lease by recording an asset and a liability at the lower of the amounts equal to the fair value of the leased property and the present value of the minimum lease payments, including any guaranteed residual values. Lease payments are allocated between the reduction of the lease liability and the lease interest expense.
The interest expense is recognised in the statement of comprehensive income so as to achieve a constant periodic rate of interest on the remaining balance of the liability outstanding.
Leased assets are depreciated on a straight-line basis over the shorter of the asset‘s useful life and the lease term.
Lease payments for operating leases, where substantially all the risks and benefits remain with the lessor, are
For
per
sona
l use
onl
y
36 Praemium Ltd Annual Report
charged to the statement of comprehensive income on a straight line basis over the lease term.
Lease incentives under operating leases are recognised as a liability and amortised on a straight- line basis over the lease term.
(m) Revenue recognition
Revenue is measured at the fair value of the consideration received or receivable. Revenue from the rendering of services is recognised in the accounting period in which the services are rendered. When revenue is received but services not rendered at balance date the receipt is recorded in the statement of financial position as unearned income.
Interest revenue is recognised on a proportional basis using the effective interest rate in relation to the outstanding financial asset.
Dividends are recognised as revenue when the right to receive payment is established.
All revenue is stated net of the amount of goods and services tax (GST), returns, trade allowances and other duties and taxes paid.
Revenue in the form of grant income is recognised when earned and receivable.
(n) Foreign currency translation
(i) Functional and presentation currency
The functional currency of each of the Group‘s entities is identified as the currency of the primary economic environment in which that entity operates, and is used in the recognition of transactions and balances for that entity. Where the functional currency of a group entity is different from the parent‘s functional currency, the entity has been translated for consolidation using the method described below for ‗Group entities‘.
The United Kingdom subsidiaries‘ functional currency is GBP which is translated to the presentation currency at the end of each reporting period.
The consolidated financial statements are presented in Australian dollars which is the Parent‘s functional and presentation currency.
(ii) Group entities
The financial results and position of all Group entities whose functional currency is different from the group‘s presentation currency are translated as follows:
assets and liabilities are translated at year-end
exchange rates prevailing at reporting date;
income and expenses are translated at the rate on the
date of the transaction, or an average exchange rate
for the period (if the average approximates the actual
rate for that period); and
retained earnings are translated at the respective
historical exchange rate.
Exchange differences arising on translation of Group entities from a different functional currency are recognised directly in a foreign currency translation reserve in the statement of financial position. These differences are recognised in the statement of comprehensive income in the period in which the entity is disposed. Goodwill and fair value adjustments arising on the acquisition of a foreign entity are treated as assets and liabilities of the foreign entity and translated at the closing rate.
(iii) Transactions and balances
Foreign currency transactions are translated into the functional currency using the exchange rates prevailing at the date of the transaction. Foreign currency monetary items are translated at the spot rate on reporting date. Non-monetary items measured at historical cost are not retranslated. Non-monetary items measured at fair value are reported at the exchange rate at the date when fair values were determined.
Exchange differences arising on the translation of monetary items are recognised in the statement of comprehensive income.
Exchange differences on translation of non-monetary items are recognised directly in equity.
(o) Contributed equity
Ordinary shares are classified as equity.
Incremental costs directly attributable to the issue of new shares or options are shown in equity as a deduction, net of tax, from the proceeds. Incremental costs directly attributable to the issue of new shares or options for the acquisition of a business are not included in the cost of the acquisition as part of the purchase consideration.
(p) Dividends
Provision is made for the amount of any dividend declared, being appropriately authorised and no longer at the discretion of the entity, on or before the end of the financial year but not distributed at reporting date.
(q) Earnings per share
(i) Basic earnings per share
Basic earnings per share is calculated by dividing the profit attributable to equity holders of the Group, excluding any costs of servicing equity other than ordinary shares, by the weighted average number of ordinary shares outstanding during the financial year, adjusted for bonus elements in ordinary shares issued during the year.
For
per
sona
l use
onl
y
37
(ii) Diluted earnings per share
Diluted earnings per share adjusts the figures used in the determination of basic earnings per share to take into account the after income tax effect of interest and other financing costs associated with dilutive potential ordinary shares and the weighted average number of shares assumed to have been issued for no consideration in relation to dilutive potential ordinary shares.
(r) Goods and services tax (GST)
Revenues, expenses and assets are recognised net of the amount of goods and services tax (GST), except:
1. where the amount of the GST incurred is not recoverable from the taxation authority, it is recognised as part of the cost of acquisition of an asset or as part of an item of expense; or
2. for receivable and payables which are recognised inclusive of GST.
The net amount of GST recoverable from, or payable to, the taxation authority is included as part of receivables or payables.
Cash flows are included in the statement of cash flows on a gross basis. The GST component of cash flows arising from investing and financing activities which is recoverable from, or payable to, the taxation authority is classified as operating cash flows.
(s) Comparatives
Where necessary, comparative figures have been adjusted to conform to changes in presentation in the current year.
(t) Going concern
The financial report has been prepared on a going-concern basis. This contemplates continuity of normal business activities and the realisation of assets and settlement of liabilities in the ordinary course of business even though the Company has experienced operating losses of $5,536,420 during the financial year ended 30 June 2011 (June 2010 $5,723,715). Cash reserves were $4,643,958 at 30 June 2011.
The Directors are of the opinion that the existing cash reserves and a likely capital raising (as outlined at Note 19(a)) and strategic alliance within the next 12 months will provide the Company with adequate funds to ensure its continued viability and operate as a going concern. A capital raising is considered desirable and the Company has on 8 September 2011 announced the completion of a capital raising by way of a placement of ordinary shares to sophisticated and professional investors which is subject to the approval of members, as outlined in Note 19(a).
The Company is actively enhancing its profile in the Australian and UK markets and is extending its network of capital market contacts globally through engagement with strategic advisors. Moreover, internal control processes in
place will facilitate close monitoring of expenditure, and the Board is confident that it will be able to manage its cash resources appropriately without negatively impacting upon product development or revenue opportunities.
At this time, the Directors are of the opinion that no asset is likely to be realised for an amount less than the amount at which it is recognised in the financial report as at 30 June 2011. Accordingly, no adjustments have been made to the financial report relating to the recoverability and classification of the asset carrying amounts and classification of liabilities that might be necessary.
(u) Accounting standards and interpretations issued but not yet effective and not yet adopted
The following new accounting standards, amendments to standards and interpretations have been issued, but are not mandatory as at 30 June 2011. They may impact the Consolidated Entity in the period of initial application. They are available for early adoption, but have not been applied in preparing this financial report:
AASB 9 Financial Instruments
Introduces new requirements for the classification and measurement of financial assets and liabilities, with a single approach to determine whether a financial asset if measured at amortised cost or fair value. Impairment testing may only be limited to assets held at amortised cost only. With this standard effective for periods ending on 31 December 2013 the Group has not yet made an assessment of the impact of these amendments.
AASB 2010-4 Further Amendments to Australian Accounting Standards arising from the Annual Improvements Project
Emphasises the interaction between quantative and qualitative AASB 7 disclosures and the nature and extent of risks associated with financial instruments. This standard is effective for periods ending on 31 December 2011. The Group has not yet made an assessment of the impact of these amendments.
(v) Critical accounting estimates and judgments
The directors evaluate estimates and judgments incorporated into the financial report based on historical knowledge and best available current information. Estimates assume a reasonable expectation of future events and are based on current trends and economic data, obtained both externally and within the group.
Impairment of available-for-sale financial assets
In the 2010 and 2011 financial reports, the Group made judgments about the impairment of its available-for-sale financial assets. The Group follows the guidance of AASB 139 Financial Instruments: Recognition and Measurement in determining when an available-for-sale financial asset is impaired. This determination requires significant judgment.
For
per
sona
l use
onl
y
38 Praemium Ltd Annual Report
In making this judgment, the Group evaluates, among other factors, the duration and extent to which the fair value of an investment is less than its cost and the financial health of and near-term business outlook for the investee, including factors such as industry and sector performance, changes in technology, and operational and financing cash flows.
In the 2011 financial year, the fair value of the assets had increased by $18,819. Accordingly the movement was recognized in other comprehensive income and thus no impairment loss was recognised.
Share-based payment transactions
The consolidated entity measures the cost of equity-settled transactions with employees by reference to the fair value of the equity instruments at the date at which they are granted. The fair value is determined using either the Binomial or Black-Scholes model taking into account the terms and conditions upon which the instruments were granted. The accounting estimates and assumptions relating to equity-settled share-based payments would have no impact on the carrying amounts of assets and liabilities within the next annual reporting period but may impact profit or loss and equity.
Fair value and hierarchy of financial instruments
The consolidated entity is required to classify financial instruments, measured at fair value, using a three level hierarchy, being: Level 1: Quoted prices (unadjusted) in active markets for identical assets and liabilities; Level 2: Inputs other than quoted prices included within Level 1 that are observable for the asset or liability, either directly (as prices) or indirectly (derived from prices); and Level 3: Inputs for the asset and liability that are not based on observable market data (unobservable inputs). An instrument is required to be classified in its entirety on the basis of the lowest level of valuation inputs that is significant to fair value. Considerable judgement is required to determine what is significant to fair value and therefore the category in which the financial instrument is placed can be subjective.
The fair value of financial instruments classified as Level 3 is determined by the use of valuation models. These include discounted cash flow analysis or the use of observable inputs that require significant adjustments based on unobservable inputs.
Provision for impairment of receivables
The provision for impairment of receivables assessment requires a degree of estimation and judgement. The level of provision is assessed by taking into account the recent sales experience, the aging of receivables, historical collection rates and specific knowledge of the individual debtors financial position.
Estimation of useful lives of assets
The consolidated entity determines the estimated useful lives and related depreciation and amortization charges for its property, plant and equipment and definitive life intangible assets. The useful lives could change significantly as a result of technical innovations or some other event. The depreciation and amortization charge will
increase where the useful lives are less than previously estimated lives, or technically obsolete or non-strategic assets that have been abandoned or sold will be written off or written down.
(w) Business combinations
The acquisition method of accounting is used to account for business combinations regardless of whether equity instruments or other assets are acquired.
The consideration transferred is the sum of the acquisition-date fair values of the assets transferred, equity instruments issued or liabilities incurred by the acquirer to former owners of the acquire and the amount of any non-controlling interest in the acquire. For each business combination, the non-controlling interest in the acquiree is measured at either fair value or at the proportionate share of the acquiree‘s identifiable net assets. All acquisition costs are expensed as incurred to the profit or loss.
On the acquisition of the business, the consolidated entity assesses the financial assets acquired and liabilities assumed for appropriate classification and designation in accordance with the contractual terms, economic conditions, the consolidated entity‘s operating or accounting policies and other pertinent conditions in the existence at the acquisition-date.
Where the business combination is achieved in stages, the consolidated entity remeasures its previously held equity interest in the acquiree at the acquisition-date fair value and the difference between the fair value and the previous carrying amount is recognized in the profit or loss.
Contingent consideration to be transferred by the acquirer is recognized at the acquisition-date fair value. Subsequent changes in the fair value of contingent consideration classified as an asset or liability is recognized in profit or loss. Contingent consideration classified as equity is not remeasured and its subsequent settlement is accounted for within equity.
The difference between the acquisition-date fair value of assets acquired, liabilities assumed and any non-controlling interest in the acquiree and the fair value of the consideration transferred and the fair value of any pre-existing investment in the acquire is recognized as goodwill. If the consideration transferred and the pre-existing fair value is less than the fair value of the identifiable net assets acquired, being a bargain purchase to the acquirer, the difference is recognized as a gain directly in profit or loss by the acquirer on the acquisition-date, but only after a reassessment of the identification and measurement of the net assets acquired, the non-controlling interest in the acquiree, if any, the consideration transferred and the acquirer‘s previously held equity interest in the acquirer.
Business combinations are initially accounted for on a provisional basis. The acquirer retrospectively adjusts the provisional amounts recognized and also recognizes additional assets and liabilities during the period, based on new information obtained about the facts and circumstances that existed at the acquisition-date. The measurement period ends on either the earlier of (i) 12 months from the date of acquisition or (ii) when the acquirer receives all the information possible to determine fair value.
For
per
sona
l use
onl
y
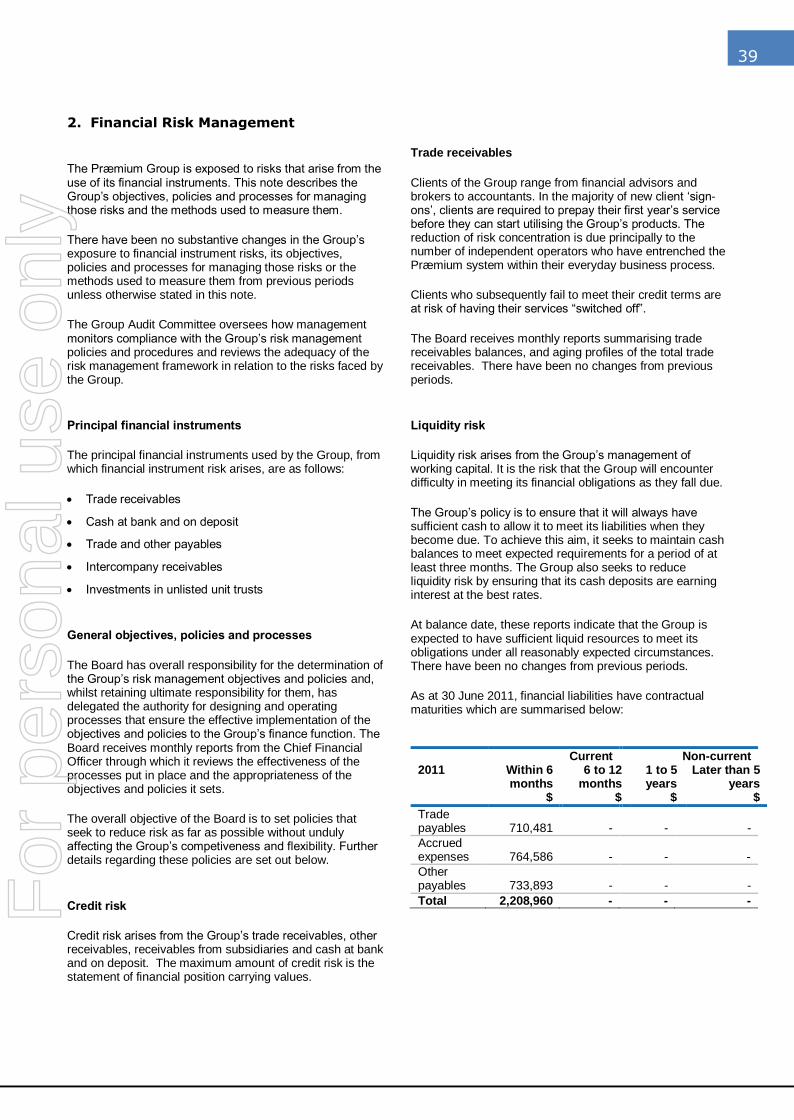
39
2. Financial Risk Management
The Præmium Group is exposed to risks that arise from the use of its financial instruments. This note describes the Group‘s objectives, policies and processes for managing those risks and the methods used to measure them.
There have been no substantive changes in the Group‘s exposure to financial instrument risks, its objectives, policies and processes for managing those risks or the methods used to measure them from previous periods unless otherwise stated in this note.
The Group Audit Committee oversees how management monitors compliance with the Group‘s risk management policies and procedures and reviews the adequacy of the risk management framework in relation to the risks faced by the Group.
Principal financial instruments
The principal financial instruments used by the Group, from which financial instrument risk arises, are as follows:
Trade receivables
Cash at bank and on deposit
Trade and other payables
Intercompany receivables
Investments in unlisted unit trusts
General objectives, policies and processes
The Board has overall responsibility for the determination of the Group‘s risk management objectives and policies and, whilst retaining ultimate responsibility for them, has delegated the authority for designing and operating processes that ensure the effective implementation of the objectives and policies to the Group‘s finance function. The Board receives monthly reports from the Chief Financial Officer through which it reviews the effectiveness of the processes put in place and the appropriateness of the objectives and policies it sets.
The overall objective of the Board is to set policies that seek to reduce risk as far as possible without unduly affecting the Group‘s competiveness and flexibility. Further details regarding these policies are set out below.
Credit risk
Credit risk arises from the Group‘s trade receivables, other receivables, receivables from subsidiaries and cash at bank and on deposit. The maximum amount of credit risk is the statement of financial position carrying values.
Trade receivables
Clients of the Group range from financial advisors and brokers to accountants. In the majority of new client ‗sign-ons‘, clients are required to prepay their first year‘s service before they can start utilising the Group‘s products. The reduction of risk concentration is due principally to the number of independent operators who have entrenched the Præmium system within their everyday business process.
Clients who subsequently fail to meet their credit terms are at risk of having their services ―switched off‖.
The Board receives monthly reports summarising trade receivables balances, and aging profiles of the total trade receivables. There have been no changes from previous periods.
Liquidity risk
Liquidity risk arises from the Group‘s management of working capital. It is the risk that the Group will encounter difficulty in meeting its financial obligations as they fall due.
The Group‘s policy is to ensure that it will always have sufficient cash to allow it to meet its liabilities when they become due. To achieve this aim, it seeks to maintain cash balances to meet expected requirements for a period of at least three months. The Group also seeks to reduce liquidity risk by ensuring that its cash deposits are earning interest at the best rates.
At balance date, these reports indicate that the Group is expected to have sufficient liquid resources to meet its obligations under all reasonably expected circumstances. There have been no changes from previous periods.
As at 30 June 2011, financial liabilities have contractual maturities which are summarised below:
2011
Current Non-current Within 6 months
$
6 to 12 months
$
1 to 5 years
$
Later than 5 years
$
Trade payables 710,481 - - -
Accrued expenses 764,586 - - -
Other payables 733,893 - - -
Total 2,208,960 - - -
For
per
sona
l use
onl
y
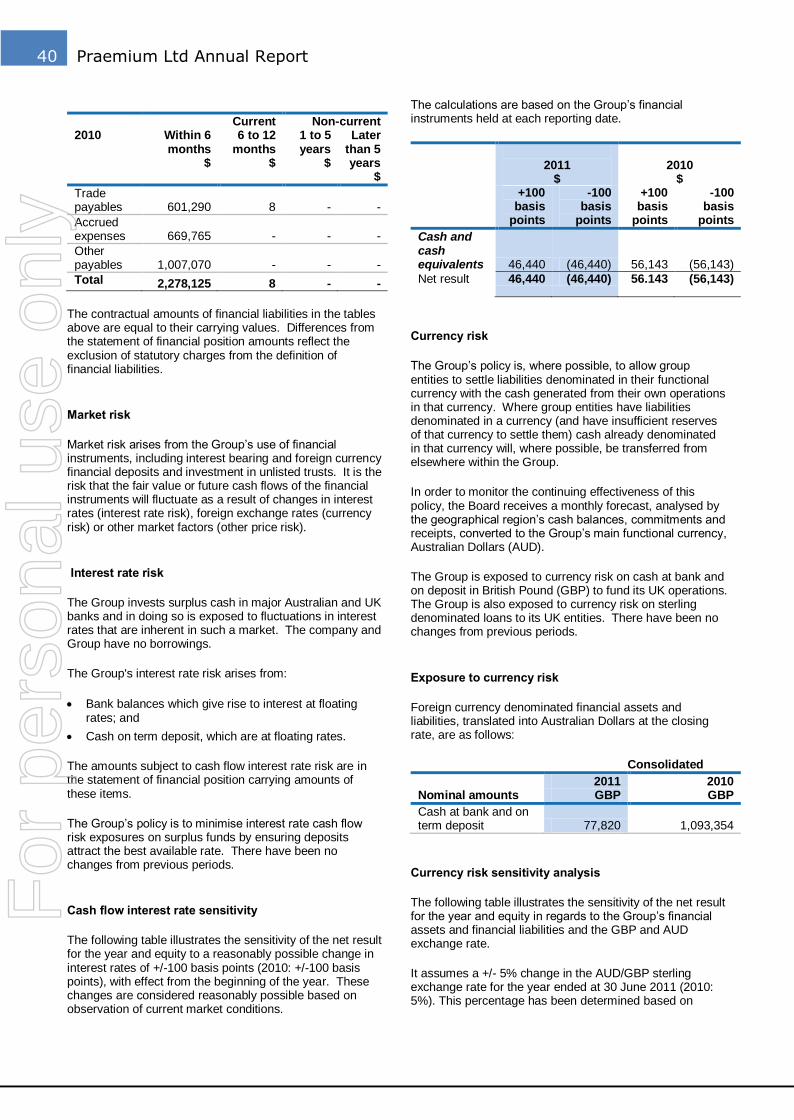
40 Praemium Ltd Annual Report
2010
Current Non-current Within 6 months
$
6 to 12 months
$
1 to 5 years
$
Later than 5 years
$
Trade payables 601,290 8 - -
Accrued expenses 669,765 - - -
Other payables 1,007,070 - - -
Total 2,278,125 8 - -
The contractual amounts of financial liabilities in the tables above are equal to their carrying values. Differences from the statement of financial position amounts reflect the exclusion of statutory charges from the definition of financial liabilities.
Market risk
Market risk arises from the Group‘s use of financial instruments, including interest bearing and foreign currency financial deposits and investment in unlisted trusts. It is the risk that the fair value or future cash flows of the financial instruments will fluctuate as a result of changes in interest rates (interest rate risk), foreign exchange rates (currency risk) or other market factors (other price risk).
Interest rate risk
The Group invests surplus cash in major Australian and UK banks and in doing so is exposed to fluctuations in interest rates that are inherent in such a market. The company and Group have no borrowings.
The Group's interest rate risk arises from:
Bank balances which give rise to interest at floating rates; and
Cash on term deposit, which are at floating rates.
The amounts subject to cash flow interest rate risk are in the statement of financial position carrying amounts of these items.
The Group‘s policy is to minimise interest rate cash flow risk exposures on surplus funds by ensuring deposits attract the best available rate. There have been no changes from previous periods.
Cash flow interest rate sensitivity
The following table illustrates the sensitivity of the net result for the year and equity to a reasonably possible change in interest rates of +/-100 basis points (2010: +/-100 basis points), with effect from the beginning of the year. These changes are considered reasonably possible based on observation of current market conditions.
The calculations are based on the Group‘s financial instruments held at each reporting date.
2011
$
2010
$ +100
basis points
-100 basis
points
+100 basis
points
-100 basis
points
Cash and cash equivalents 46,440 (46,440) 56,143 (56,143)
Net result 46,440 (46,440) 56.143 (56,143)
Currency risk
The Group‘s policy is, where possible, to allow group entities to settle liabilities denominated in their functional currency with the cash generated from their own operations in that currency. Where group entities have liabilities denominated in a currency (and have insufficient reserves of that currency to settle them) cash already denominated in that currency will, where possible, be transferred from elsewhere within the Group.
In order to monitor the continuing effectiveness of this policy, the Board receives a monthly forecast, analysed by the geographical region‘s cash balances, commitments and receipts, converted to the Group‘s main functional currency, Australian Dollars (AUD).
The Group is exposed to currency risk on cash at bank and on deposit in British Pound (GBP) to fund its UK operations. The Group is also exposed to currency risk on sterling denominated loans to its UK entities. There have been no changes from previous periods.
Exposure to currency risk
Foreign currency denominated financial assets and liabilities, translated into Australian Dollars at the closing rate, are as follows:
Consolidated
2011 2010 Nominal amounts GBP GBP
Cash at bank and on term deposit 77,820 1,093,354
Currency risk sensitivity analysis
The following table illustrates the sensitivity of the net result for the year and equity in regards to the Group‘s financial assets and financial liabilities and the GBP and AUD exchange rate.
It assumes a +/- 5% change in the AUD/GBP sterling exchange rate for the year ended at 30 June 2011 (2010: 5%). This percentage has been determined based on
For
per
sona
l use
onl
y
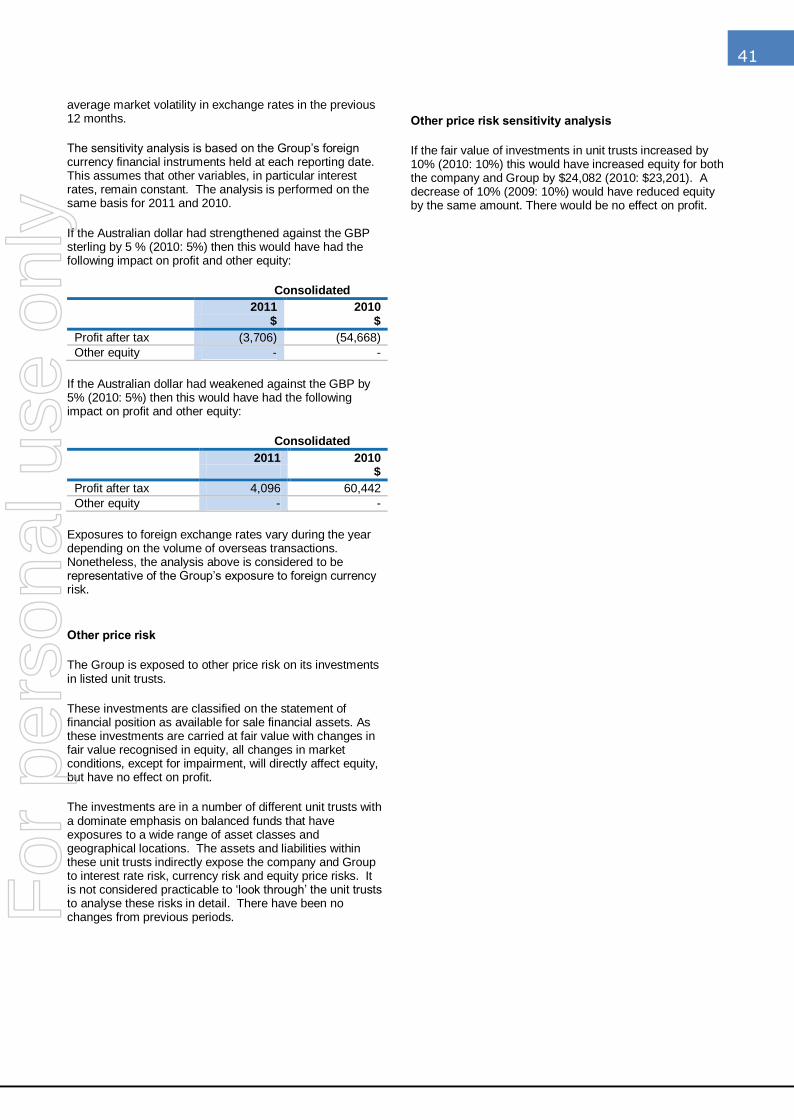
41
average market volatility in exchange rates in the previous 12 months.
The sensitivity analysis is based on the Group‘s foreign currency financial instruments held at each reporting date. This assumes that other variables, in particular interest rates, remain constant. The analysis is performed on the same basis for 2011 and 2010.
If the Australian dollar had strengthened against the GBP sterling by 5 % (2010: 5%) then this would have had the following impact on profit and other equity:
Consolidated
2011 2010 $ $
Profit after tax (3,706) (54,668)
Other equity - -
If the Australian dollar had weakened against the GBP by 5% (2010: 5%) then this would have had the following impact on profit and other equity:
Consolidated
2011 2010 $
Profit after tax 4,096 60,442
Other equity - -
Exposures to foreign exchange rates vary during the year depending on the volume of overseas transactions. Nonetheless, the analysis above is considered to be representative of the Group‘s exposure to foreign currency risk.
Other price risk
The Group is exposed to other price risk on its investments in listed unit trusts.
These investments are classified on the statement of financial position as available for sale financial assets. As these investments are carried at fair value with changes in fair value recognised in equity, all changes in market conditions, except for impairment, will directly affect equity, but have no effect on profit.
The investments are in a number of different unit trusts with a dominate emphasis on balanced funds that have exposures to a wide range of asset classes and geographical locations. The assets and liabilities within these unit trusts indirectly expose the company and Group to interest rate risk, currency risk and equity price risks. It is not considered practicable to ‗look through‘ the unit trusts to analyse these risks in detail. There have been no changes from previous periods.
Other price risk sensitivity analysis
If the fair value of investments in unit trusts increased by 10% (2010: 10%) this would have increased equity for both the company and Group by $24,082 (2010: $23,201). A decrease of 10% (2009: 10%) would have reduced equity by the same amount. There would be no effect on profit.
For
per
sona
l use
onl
y
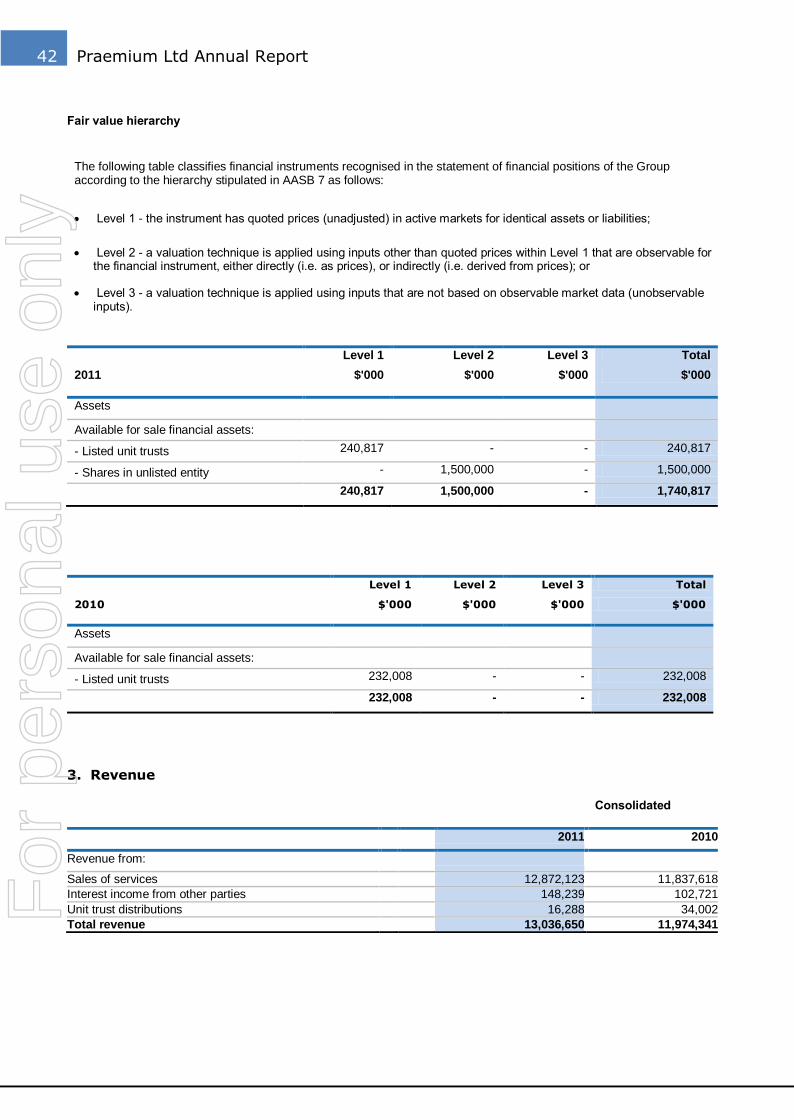
42 Praemium Ltd Annual Report
Fair value hierarchy
The following table classifies financial instruments recognised in the statement of financial positions of the Group according to the hierarchy stipulated in AASB 7 as follows:
Level 1 - the instrument has quoted prices (unadjusted) in active markets for identical assets or liabilities;
Level 2 - a valuation technique is applied using inputs other than quoted prices within Level 1 that are observable for the financial instrument, either directly (i.e. as prices), or indirectly (i.e. derived from prices); or
Level 3 - a valuation technique is applied using inputs that are not based on observable market data (unobservable inputs).
Level 1 Level 2 Level 3 Total
2011
$'000 $'000 $'000 $'000
Assets
Available for sale financial assets:
- Listed unit trusts 240,817 - - 240,817
- Shares in unlisted entity - 1,500,000 - 1,500,000
240,817 1,500,000 - 1,740,817
Level 1 Level 2 Level 3 Total
2010
$'000 $'000 $'000 $'000
Assets
Available for sale financial assets:
- Listed unit trusts 232,008 - - 232,008
232,008 - - 232,008
3. Revenue
Consolidated
2011 2010
Revenue from:
Sales of services 12,872,123 11,837,618
Interest income from other parties 148,239 102,721
Unit trust distributions 16,288 34,002
Total revenue 13,036,650 11,974,341 For
per
sona
l use
onl
y
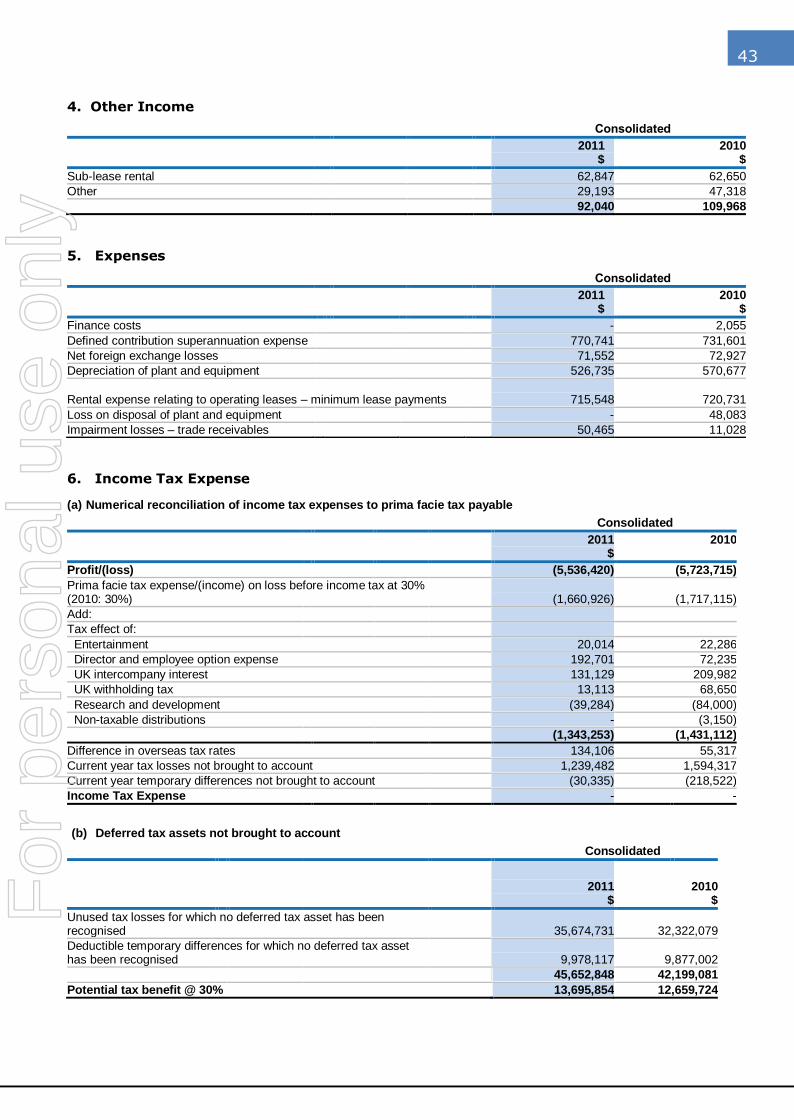
43
4. Other Income
Consolidated
2011 $
2010 $
Sub-lease rental 62,847 62,650
Other 29,193 47,318
92,040 109,968
5. Expenses
Consolidated
2011 $
2010 $
Finance costs - 2,055
Defined contribution superannuation expense 770,741 731,601
Net foreign exchange losses 71,552 72,927
Depreciation of plant and equipment 526,735 570,677
Rental expense relating to operating leases – minimum lease payments
715,548 720,731
Loss on disposal of plant and equipment - 48,083
Impairment losses – trade receivables 50,465 11,028
6. Income Tax Expense
(a) Numerical reconciliation of income tax expenses to prima facie tax payable
Consolidated
2011
$ 2010
$
Profit/(loss) (5,536,420) (5,723,715)
Prima facie tax expense/(income) on loss before income tax at 30% (2010: 30%)
(1,660,926) (1,717,115)
Add:
Tax effect of:
Entertainment 20,014 22,286
Director and employee option expense 192,701 72,235
UK intercompany interest 131,129 209,982
UK withholding tax 13,113 68,650
Research and development (39,284) (84,000)
Non-taxable distributions - (3,150)
(1,343,253) (1,431,112)
Difference in overseas tax rates 134,106 55,317
Current year tax losses not brought to account 1,239,482 1,594,317
Current year temporary differences not brought to account (30,335) (218,522)
Income Tax Expense - -
(b) Deferred tax assets not brought to account
Consolidated
2011 $
2010 $
Unused tax losses for which no deferred tax asset has been recognised 35,674,731 32,322,079
Deductible temporary differences for which no deferred tax asset has been recognised 9,978,117 9,877,002
45,652,848 42,199,081
Potential tax benefit @ 30% 13,695,854 12,659,724
For
per
sona
l use
onl
y
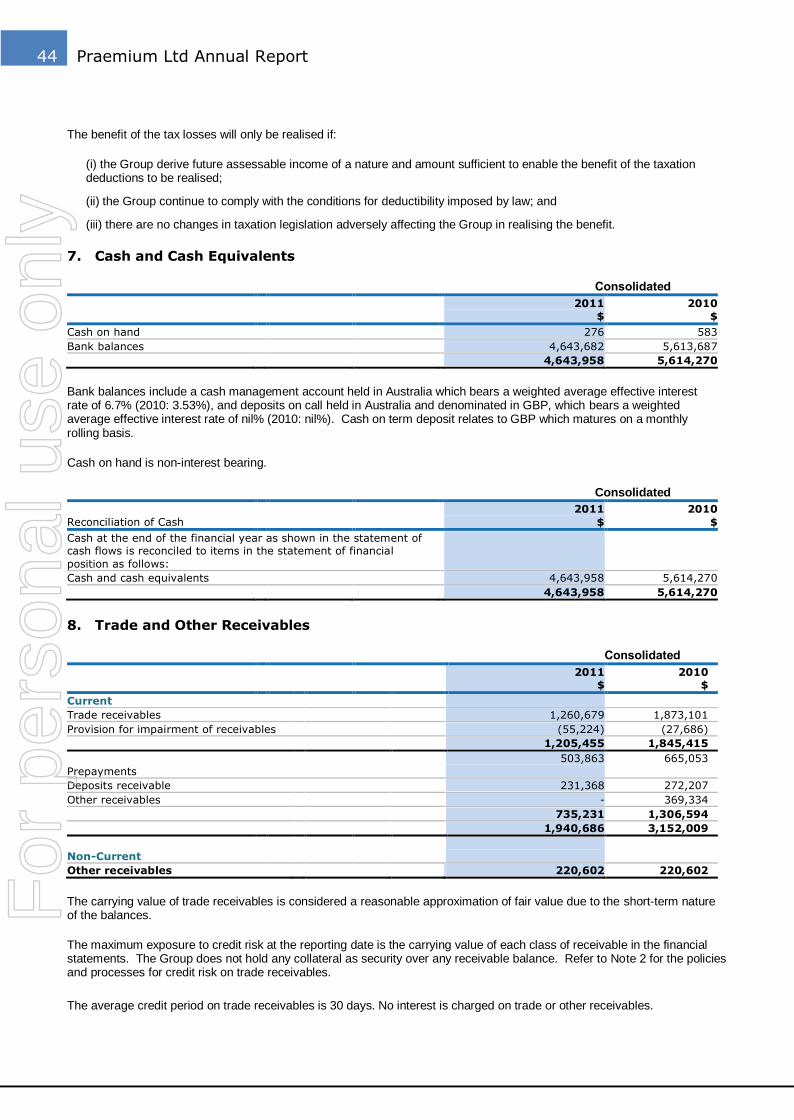
44 Praemium Ltd Annual Report
The benefit of the tax losses will only be realised if:
(i) the Group derive future assessable income of a nature and amount sufficient to enable the benefit of the taxation deductions to be realised;
(ii) the Group continue to comply with the conditions for deductibility imposed by law; and
(iii) there are no changes in taxation legislation adversely affecting the Group in realising the benefit.
7. Cash and Cash Equivalents
Consolidated
2011 $
2010 $
Cash on hand 276 583
Bank balances 4,643,682 5,613,687
4,643,958 5,614,270
Bank balances include a cash management account held in Australia which bears a weighted average effective interest rate of 6.7% (2010: 3.53%), and deposits on call held in Australia and denominated in GBP, which bears a weighted average effective interest rate of nil% (2010: nil%). Cash on term deposit relates to GBP which matures on a monthly rolling basis.
Cash on hand is non-interest bearing.
Consolidated
Reconciliation of Cash
2011
$
2010
$
Cash at the end of the financial year as shown in the statement of cash flows is reconciled to items in the statement of financial
position as follows:
Cash and cash equivalents 4,643,958 5,614,270
4,643,958 5,614,270
8. Trade and Other Receivables
Consolidated
2011 $
2010 $
Current
Trade receivables 1,260,679 1,873,101
Provision for impairment of receivables (55,224) (27,686)
1,205,455 1,845,415
Prepayments
503,863 665,053
Deposits receivable 231,368 272,207
Other receivables - 369,334
735,231 1,306,594
1,940,686 3,152,009
Non-Current
Other receivables 220,602 220,602
The carrying value of trade receivables is considered a reasonable approximation of fair value due to the short-term nature of the balances.
The maximum exposure to credit risk at the reporting date is the carrying value of each class of receivable in the financial statements. The Group does not hold any collateral as security over any receivable balance. Refer to Note 2 for the policies and processes for credit risk on trade receivables.
The average credit period on trade receivables is 30 days. No interest is charged on trade or other receivables.
For
per
sona
l use
onl
y
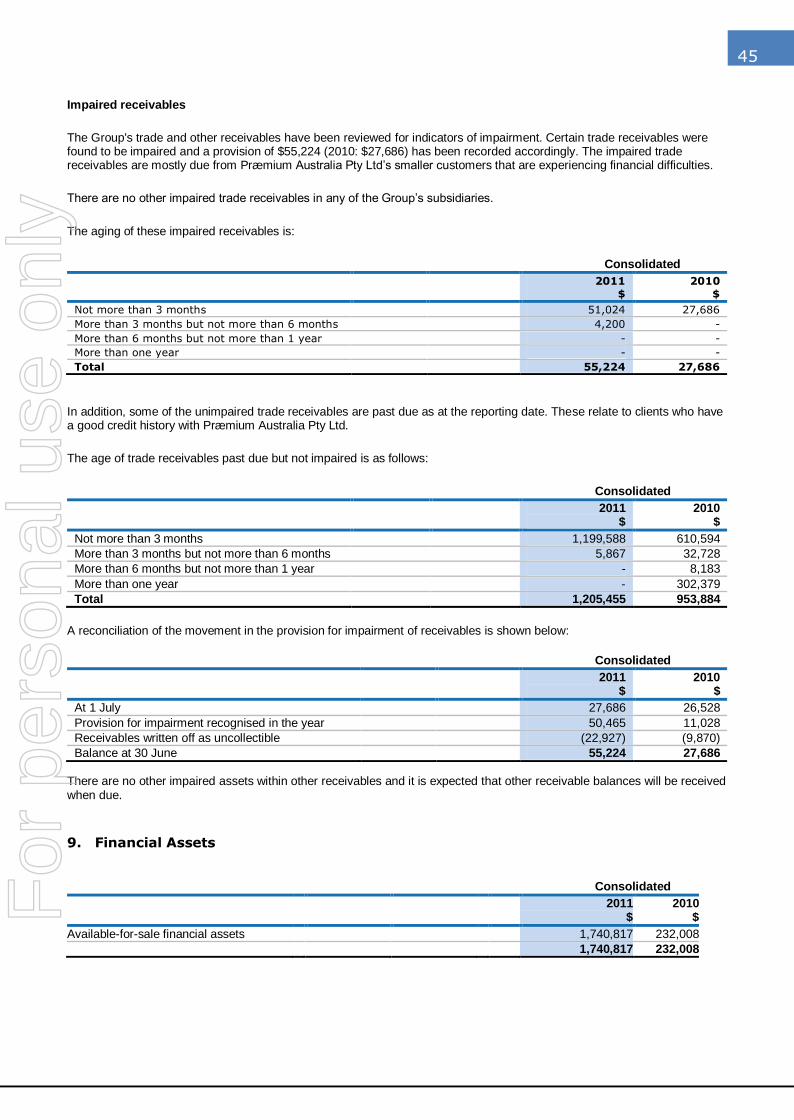
45
Impaired receivables
The Group's trade and other receivables have been reviewed for indicators of impairment. Certain trade receivables were found to be impaired and a provision of $55,224 (2010: $27,686) has been recorded accordingly. The impaired trade receivables are mostly due from Præmium Australia Pty Ltd‘s smaller customers that are experiencing financial difficulties.
There are no other impaired trade receivables in any of the Group‘s subsidiaries.
The aging of these impaired receivables is:
Consolidated
2011 $
2010 $
Not more than 3 months 51,024 27,686
More than 3 months but not more than 6 months 4,200 -
More than 6 months but not more than 1 year - -
More than one year - -
Total 55,224 27,686
In addition, some of the unimpaired trade receivables are past due as at the reporting date. These relate to clients who have a good credit history with Præmium Australia Pty Ltd.
The age of trade receivables past due but not impaired is as follows:
Consolidated
2011 $
2010 $
Not more than 3 months 1,199,588 610,594
More than 3 months but not more than 6 months 5,867 32,728
More than 6 months but not more than 1 year - 8,183
More than one year - 302,379
Total 1,205,455 953,884
A reconciliation of the movement in the provision for impairment of receivables is shown below:
Consolidated
2011 $
2010 $
At 1 July 27,686 26,528
Provision for impairment recognised in the year 50,465 11,028
Receivables written off as uncollectible (22,927) (9,870)
Balance at 30 June 55,224 27,686
There are no other impaired assets within other receivables and it is expected that other receivable balances will be received when due.
9. Financial Assets
Consolidated
2011 $
2010 $
Available-for-sale financial assets 1,740,817 232,008
1,740,817 232,008
For
per
sona
l use
onl
y
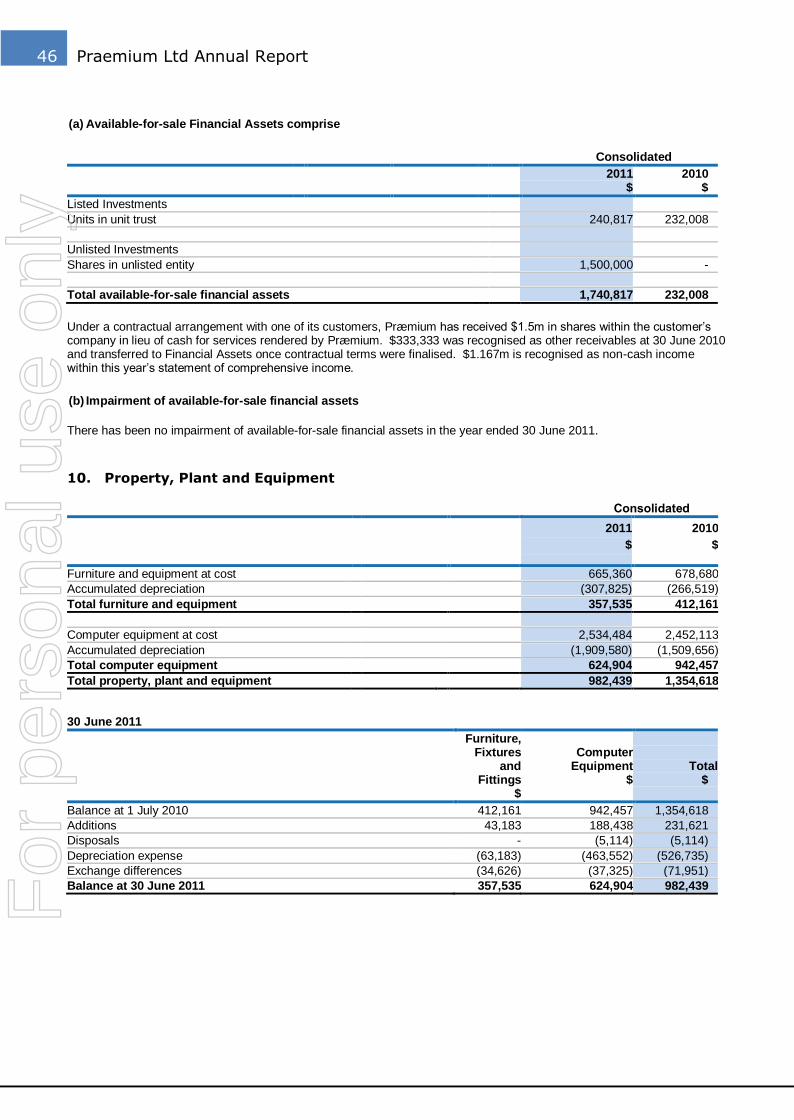
46 Praemium Ltd Annual Report
(a) Available-for-sale Financial Assets comprise
Consolidated
2011 $
2010 $
Listed Investments
Units in unit trust 240,817 232,008
Unlisted Investments
Shares in unlisted entity 1,500,000 -
Total available-for-sale financial assets 1,740,817 232,008
Under a contractual arrangement with one of its customers, Præmium has received $1.5m in shares within the customer‘s company in lieu of cash for services rendered by Præmium. $333,333 was recognised as other receivables at 30 June 2010 and transferred to Financial Assets once contractual terms were finalised. $1.167m is recognised as non-cash income within this year‘s statement of comprehensive income.
(b) Impairment of available-for-sale financial assets
There has been no impairment of available-for-sale financial assets in the year ended 30 June 2011.
10. Property, Plant and Equipment
Consolidated
2011
$
2010
$
Furniture and equipment at cost 665,360 678,680
Accumulated depreciation (307,825) (266,519)
Total furniture and equipment 357,535 412,161
Computer equipment at cost 2,534,484 2,452,113
Accumulated depreciation (1,909,580) (1,509,656)
Total computer equipment 624,904 942,457
Total property, plant and equipment 982,439 1,354,618
30 June 2011
Furniture, Fixtures
and Fittings
$
Computer
Equipment $
Total $
Balance at 1 July 2010 412,161 942,457 1,354,618
Additions 43,183 188,438 231,621
Disposals - (5,114) (5,114)
Depreciation expense (63,183) (463,552) (526,735)
Exchange differences (34,626) (37,325) (71,951)
Balance at 30 June 2011 357,535 624,904 982,439
For
per
sona
l use
onl
y
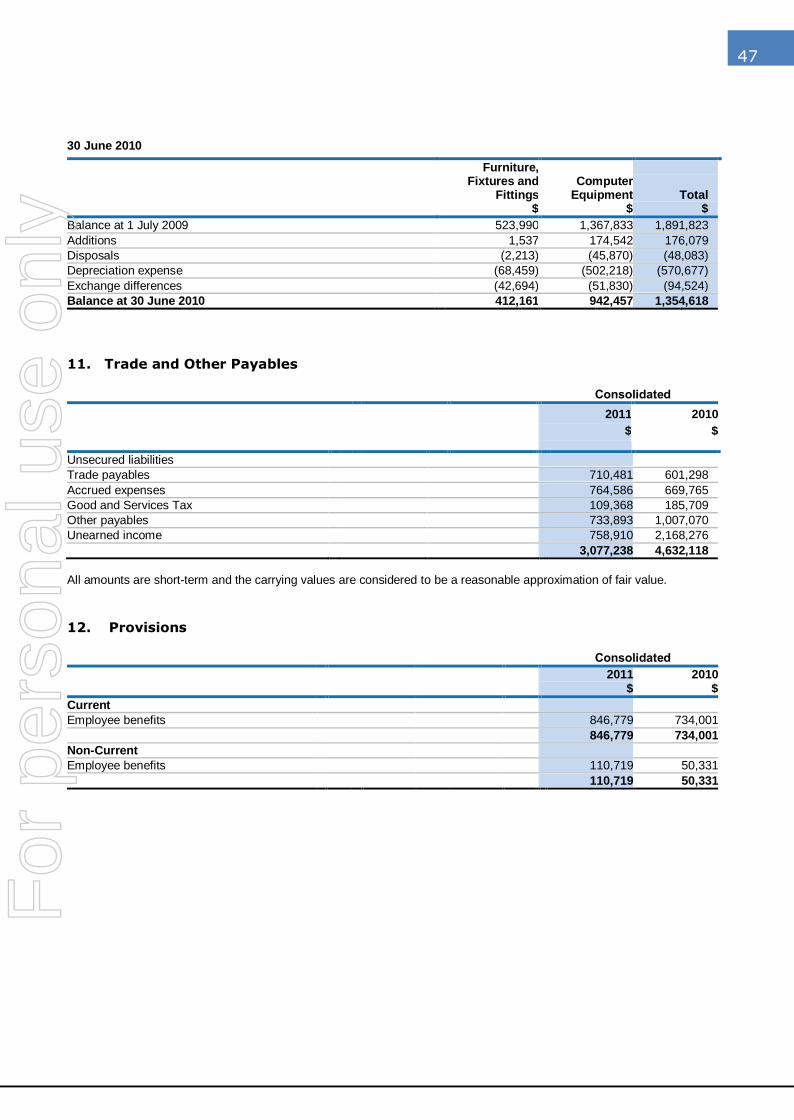
47
30 June 2010
Furniture, Fixtures and
Fittings $
Computer
Equipment $
Total $
Balance at 1 July 2009 523,990 1,367,833 1,891,823
Additions 1,537 174,542 176,079
Disposals (2,213) (45,870) (48,083)
Depreciation expense (68,459) (502,218) (570,677)
Exchange differences (42,694) (51,830) (94,524)
Balance at 30 June 2010 412,161 942,457 1,354,618
11. Trade and Other Payables
Consolidated
2011
$
2010
$
Unsecured liabilities
Trade payables 710,481 601,298
Accrued expenses 764,586 669,765
Good and Services Tax 109,368 185,709
Other payables 733,893 1,007,070
Unearned income 758,910 2,168,276
3,077,238 4,632,118
All amounts are short-term and the carrying values are considered to be a reasonable approximation of fair value.
12. Provisions
Consolidated
2011
$ 2010
$
Current
Employee benefits 846,779 734,001
846,779 734,001
Non-Current
Employee benefits 110,719 50,331
110,719 50,331
For
per
sona
l use
onl
y
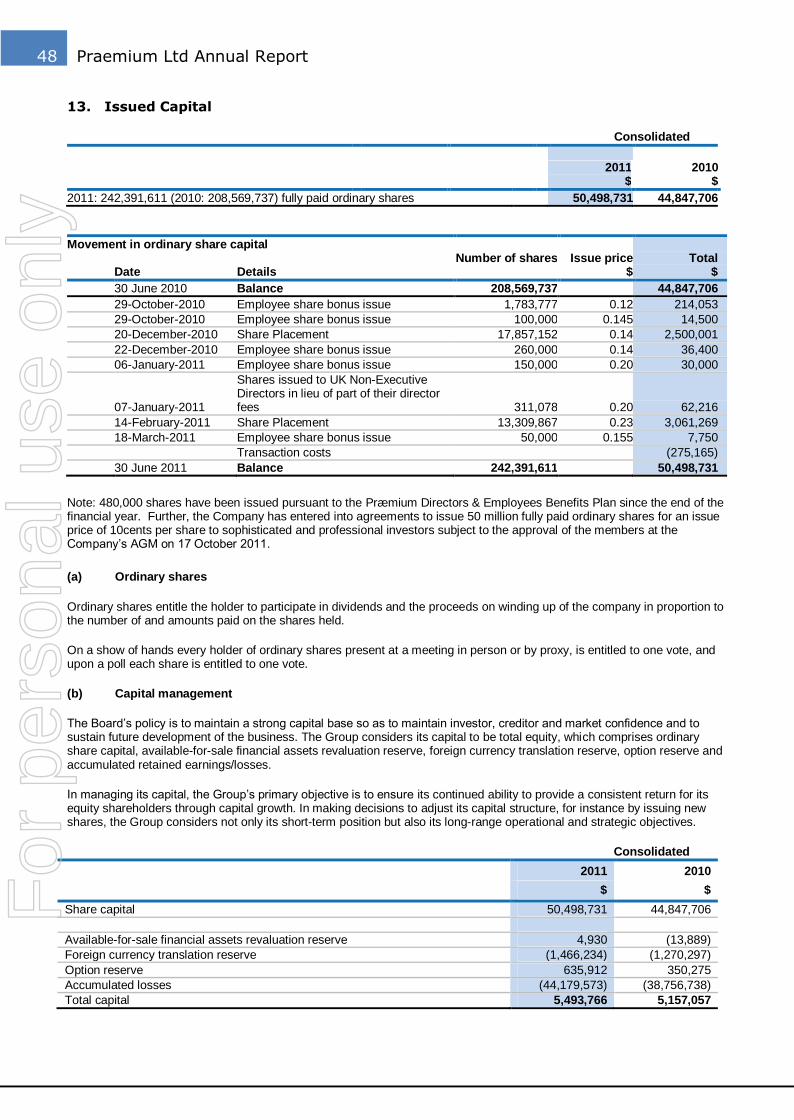
48 Praemium Ltd Annual Report
13. Issued Capital
Consolidated
2011
$ 2010
$
2011: 242,391,611 (2010: 208,569,737) fully paid ordinary shares 50,498,731 44,847,706
Movement in ordinary share capital
Date Details Number of shares Issue price
$ Total
$
30 June 2010 Balance 208,569,737 44,847,706
29-October-2010 Employee share bonus issue 1,783,777 0.12 214,053
29-October-2010 Employee share bonus issue 100,000 0.145 14,500
20-December-2010 Share Placement 17,857,152 0.14 2,500,001
22-December-2010 Employee share bonus issue 260,000 0.14 36,400
06-January-2011 Employee share bonus issue 150,000 0.20 30,000
07-January-2011
Shares issued to UK Non-Executive Directors in lieu of part of their director fees 311,078 0.20 62,216
14-February-2011 Share Placement 13,309,867 0.23 3,061,269
18-March-2011 Employee share bonus issue 50,000 0.155 7,750
Transaction costs (275,165)
30 June 2011 Balance 242,391,611 50,498,731
Note: 480,000 shares have been issued pursuant to the Præmium Directors & Employees Benefits Plan since the end of the financial year. Further, the Company has entered into agreements to issue 50 million fully paid ordinary shares for an issue price of 10cents per share to sophisticated and professional investors subject to the approval of the members at the Company‘s AGM on 17 October 2011.
(a) Ordinary shares
Ordinary shares entitle the holder to participate in dividends and the proceeds on winding up of the company in proportion to the number of and amounts paid on the shares held.
On a show of hands every holder of ordinary shares present at a meeting in person or by proxy, is entitled to one vote, and upon a poll each share is entitled to one vote.
(b) Capital management
The Board‘s policy is to maintain a strong capital base so as to maintain investor, creditor and market confidence and to sustain future development of the business. The Group considers its capital to be total equity, which comprises ordinary share capital, available-for-sale financial assets revaluation reserve, foreign currency translation reserve, option reserve and accumulated retained earnings/losses.
In managing its capital, the Group‘s primary objective is to ensure its continued ability to provide a consistent return for its equity shareholders through capital growth. In making decisions to adjust its capital structure, for instance by issuing new shares, the Group considers not only its short-term position but also its long-range operational and strategic objectives.
Consolidated
2011 2010
$ $
Share capital 50,498,731 44,847,706
Available-for-sale financial assets revaluation reserve 4,930 (13,889)
Foreign currency translation reserve (1,466,234) (1,270,297)
Option reserve 635,912 350,275
Accumulated losses (44,179,573) (38,756,738)
Total capital 5,493,766 5,157,057
For
per
sona
l use
onl
y
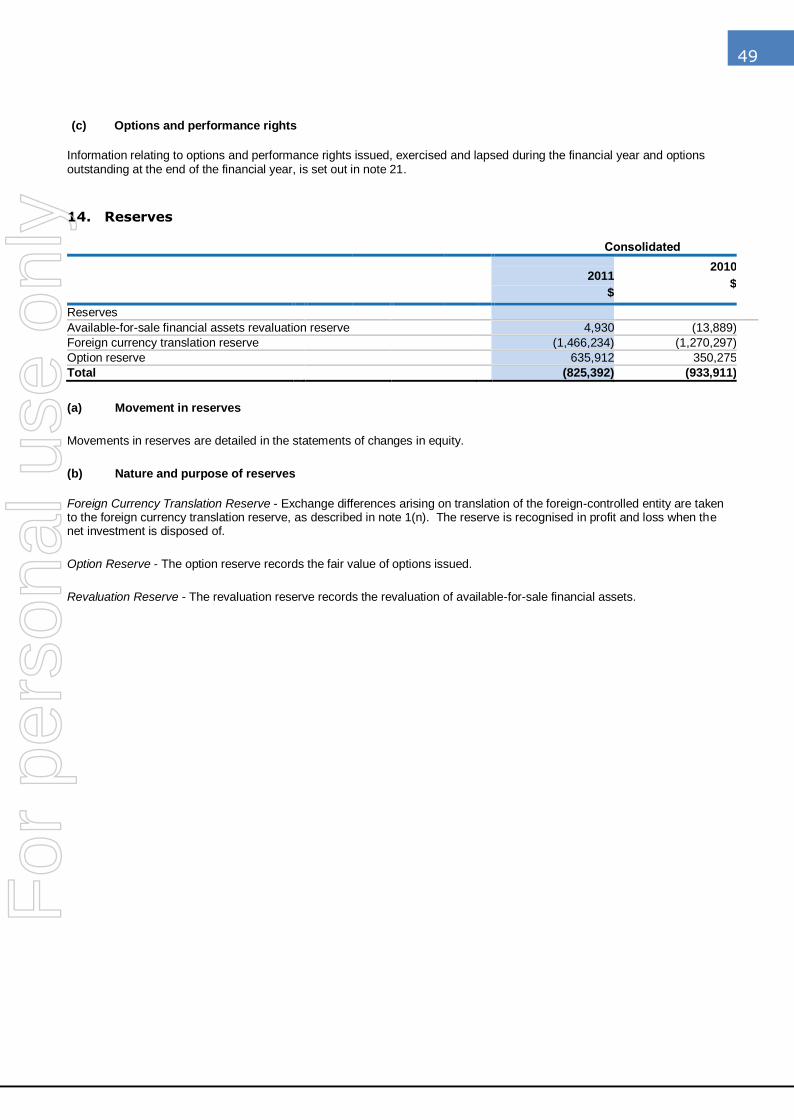
49
(c) Options and performance rights
Information relating to options and performance rights issued, exercised and lapsed during the financial year and options outstanding at the end of the financial year, is set out in note 21.
14. Reserves
Consolidated
2011
$
2010
$
Reserves
Available-for-sale financial assets revaluation reserve 4,930 (13,889)
Foreign currency translation reserve (1,466,234) (1,270,297)
Option reserve 635,912 350,275
Total (825,392) (933,911)
(a) Movement in reserves
Movements in reserves are detailed in the statements of changes in equity.
(b) Nature and purpose of reserves
Foreign Currency Translation Reserve - Exchange differences arising on translation of the foreign-controlled entity are taken to the foreign currency translation reserve, as described in note 1(n). The reserve is recognised in profit and loss when the net investment is disposed of.
Option Reserve - The option reserve records the fair value of options issued.
Revaluation Reserve - The revaluation reserve records the revaluation of available-for-sale financial assets.
For
per
sona
l use
onl
y
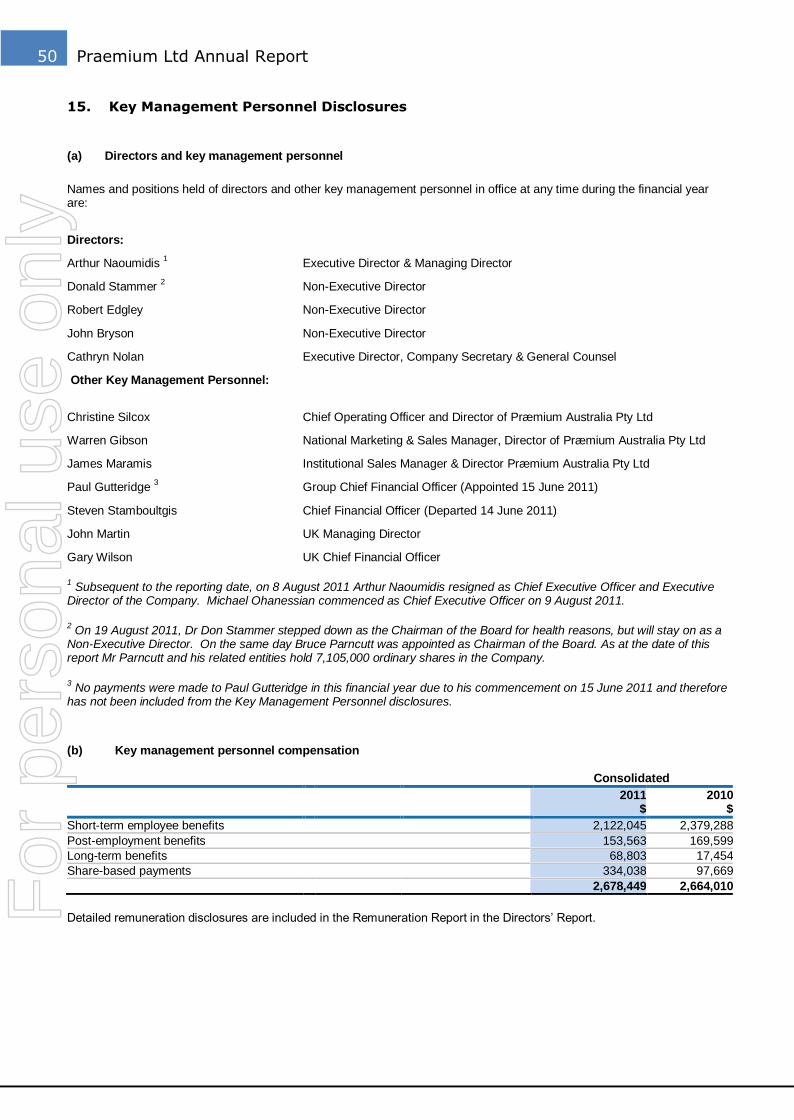
50 Praemium Ltd Annual Report
15. Key Management Personnel Disclosures
(a) Directors and key management personnel
Names and positions held of directors and other key management personnel in office at any time during the financial year are:
Directors:
Arthur Naoumidis 1 Executive Director & Managing Director
Donald Stammer 2 Non-Executive Director
Robert Edgley Non-Executive Director
John Bryson Non-Executive Director
Cathryn Nolan Executive Director, Company Secretary & General Counsel
Other Key Management Personnel:
Christine Silcox Chief Operating Officer and Director of Præmium Australia Pty Ltd
Warren Gibson National Marketing & Sales Manager, Director of Præmium Australia Pty Ltd
James Maramis Institutional Sales Manager & Director Præmium Australia Pty Ltd
Paul Gutteridge 3 Group Chief Financial Officer (Appointed 15 June 2011)
Steven Stamboultgis Chief Financial Officer (Departed 14 June 2011)
John Martin UK Managing Director
Gary Wilson UK Chief Financial Officer
1 Subsequent to the reporting date, on 8 August 2011 Arthur Naoumidis resigned as Chief Executive Officer and Executive
Director of the Company. Michael Ohanessian commenced as Chief Executive Officer on 9 August 2011.
2 On 19 August 2011, Dr Don Stammer stepped down as the Chairman of the Board for health reasons, but will stay on as a
Non-Executive Director. On the same day Bruce Parncutt was appointed as Chairman of the Board. As at the date of this report Mr Parncutt and his related entities hold 7,105,000 ordinary shares in the Company.
3 No payments were made to Paul Gutteridge in this financial year due to his commencement on 15 June 2011 and therefore
has not been included from the Key Management Personnel disclosures.
(b) Key management personnel compensation
Consolidated
2011
$ 2010
$
Short-term employee benefits 2,122,045 2,379,288
Post-employment benefits 153,563 169,599
Long-term benefits 68,803 17,454
Share-based payments 334,038 97,669
2,678,449 2,664,010
Detailed remuneration disclosures are included in the Remuneration Report in the Directors‘ Report.
For
per
sona
l use
onl
y
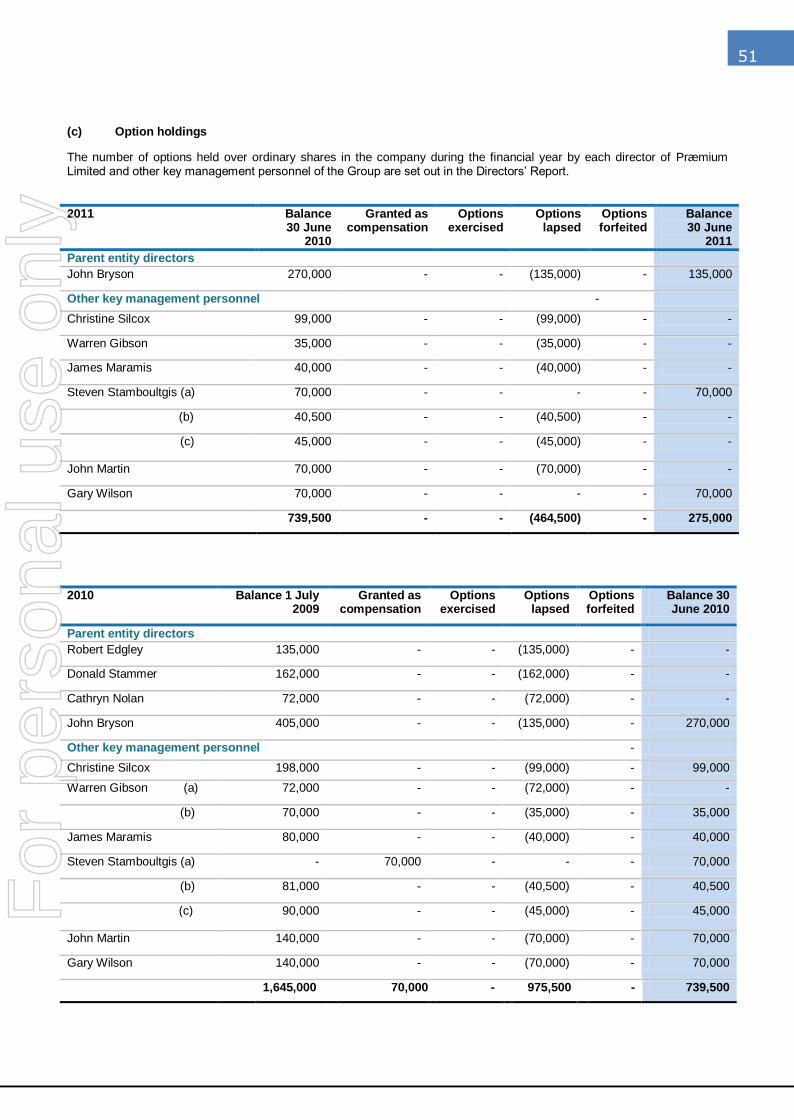
51
The number of options held over ordinary shares in the company during the financial year by each director of Præmium Limited and other key management personnel of the Group are set out in the Directors‘ Report.
2011 Balance 30 June
2010
Granted as compensation
Options exercised
Options lapsed
Options forfeited
Balance 30 June
2011
Parent entity directors
John Bryson 270,000 - - (135,000) - 135,000
Other key management personnel -
Christine Silcox 99,000 - - (99,000) - -
Warren Gibson 35,000 - - (35,000) - -
James Maramis 40,000 - - (40,000) - -
Steven Stamboultgis (a) 70,000 - - - - 70,000
(b) 40,500 - - (40,500) - -
(c) 45,000 - - (45,000) - -
John Martin 70,000 - - (70,000) - -
Gary Wilson 70,000 - - - - 70,000
739,500 - - (464,500) - 275,000
2010 Balance 1 July 2009
Granted as compensation
Options exercised
Options lapsed
Options forfeited
Balance 30 June 2010
Parent entity directors
Robert Edgley 135,000 - - (135,000) - -
Donald Stammer 162,000 - - (162,000) - -
Cathryn Nolan 72,000 - - (72,000) - -
John Bryson 405,000 - - (135,000) - 270,000
Other key management personnel -
Christine Silcox 198,000 - - (99,000) - 99,000
Warren Gibson (a) 72,000 - - (72,000) - -
(b) 70,000 - - (35,000) - 35,000
James Maramis 80,000 - - (40,000) - 40,000
Steven Stamboultgis (a) - 70,000 - - - 70,000
(b) 81,000 - - (40,500) - 40,500
(c) 90,000 - - (45,000) - 45,000
John Martin 140,000 - - (70,000) - 70,000
Gary Wilson 140,000 - - (70,000) - 70,000
1,645,000 70,000 - 975,500 - 739,500
(c) Option holdings
For
per
sona
l use
onl
y
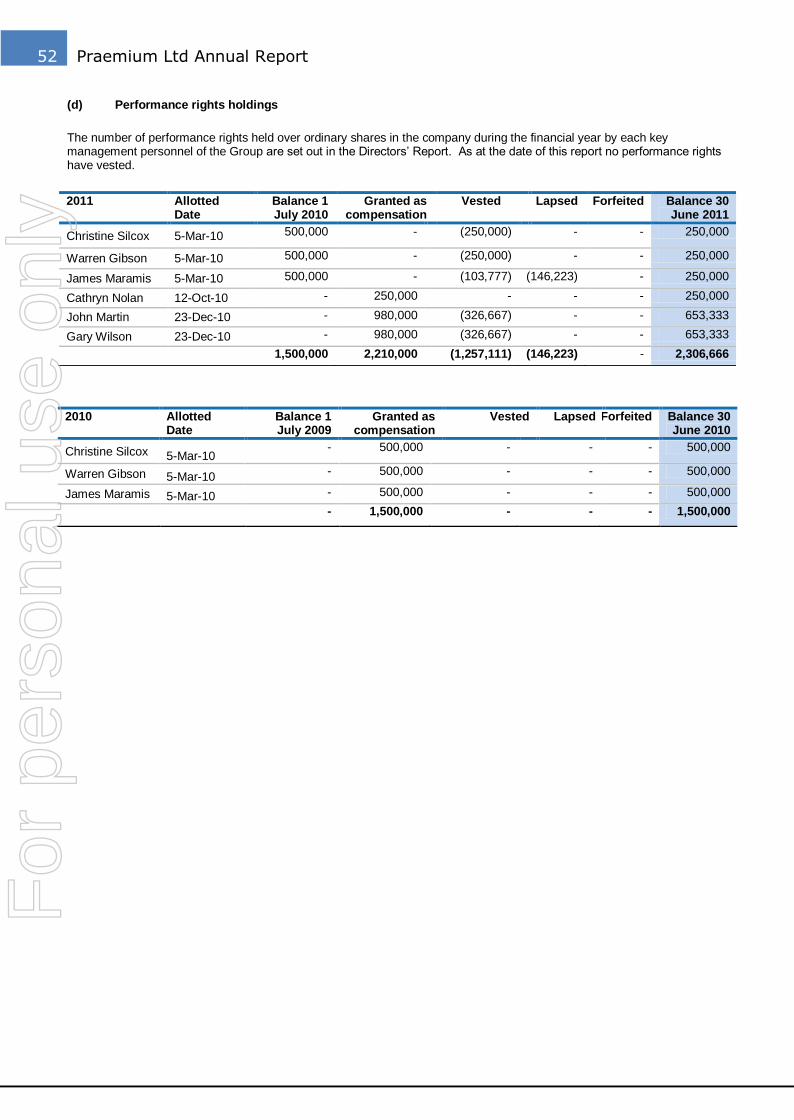
52 Praemium Ltd Annual Report
(d) Performance rights holdings
The number of performance rights held over ordinary shares in the company during the financial year by each key management personnel of the Group are set out in the Directors‘ Report. As at the date of this report no performance rights have vested.
2011 Allotted Date
Balance 1 July 2010
Granted as compensation
Vested Lapsed Forfeited Balance 30 June 2011
Christine Silcox 5-Mar-10 500,000 - (250,000) - - 250,000
Warren Gibson 5-Mar-10 500,000 - (250,000) - - 250,000
James Maramis 5-Mar-10 500,000 - (103,777) (146,223) - 250,000
Cathryn Nolan 12-Oct-10 - 250,000 - - - 250,000
John Martin 23-Dec-10 - 980,000 (326,667) - - 653,333
Gary Wilson 23-Dec-10 - 980,000 (326,667) - - 653,333
1,500,000 2,210,000 (1,257,111) (146,223) - 2,306,666
2010 Allotted Date
Balance 1 July 2009
Granted as compensation
Vested Lapsed Forfeited Balance 30 June 2010
Christine Silcox 5-Mar-10 - 500,000 - - - 500,000
Warren Gibson 5-Mar-10 - 500,000 - - - 500,000
James Maramis 5-Mar-10 - 500,000 - - - 500,000
- 1,500,000 - - - 1,500,000
For
per
sona
l use
onl
y
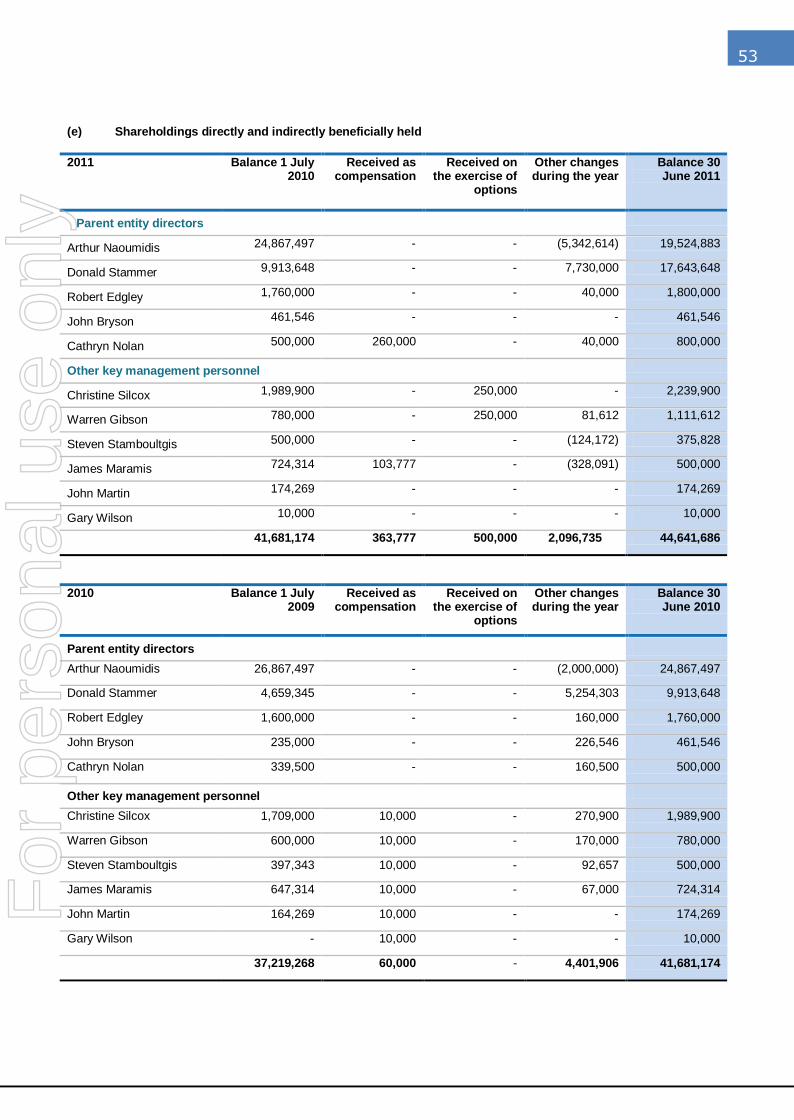
53
2011
Balance 1 July 2010
Received as compensation
Received on the exercise of
options
Other changes during the year
Balance 30 June 2011
Parent entity directors
Arthur Naoumidis 24,867,497 - - (5,342,614) 19,524,883
Donald Stammer 9,913,648 - - 7,730,000 17,643,648
Robert Edgley 1,760,000 - - 40,000 1,800,000
John Bryson 461,546 - - - 461,546
Cathryn Nolan 500,000 260,000 - 40,000 800,000
Other key management personnel
Christine Silcox 1,989,900 - 250,000 - 2,239,900
Warren Gibson 780,000 - 250,000 81,612 1,111,612
Steven Stamboultgis 500,000 - - (124,172) 375,828
James Maramis 724,314 103,777 - (328,091) 500,000
John Martin 174,269 - - - 174,269
Gary Wilson 10,000 - - - 10,000
41,681,174 363,777 500,000 2,096,735 44,641,686
2010 Balance 1 July 2009
Received as compensation
Received on the exercise of
options
Other changes during the year
Balance 30 June 2010
Parent entity directors
Arthur Naoumidis 26,867,497 - - (2,000,000) 24,867,497
Donald Stammer 4,659,345 - - 5,254,303 9,913,648
Robert Edgley 1,600,000 - - 160,000 1,760,000
John Bryson 235,000 - - 226,546 461,546
Cathryn Nolan 339,500 - - 160,500 500,000
Other key management personnel
Christine Silcox 1,709,000 10,000 - 270,900 1,989,900
Warren Gibson 600,000 10,000 - 170,000 780,000
Steven Stamboultgis 397,343 10,000 - 92,657 500,000
James Maramis 647,314 10,000 - 67,000 724,314
John Martin 164,269 10,000 - - 174,269
Gary Wilson - 10,000 - - 10,000
37,219,268 60,000 - 4,401,906 41,681,174
(e) Shareholdings directly and indirectly beneficially held
For
per
sona
l use
onl
y
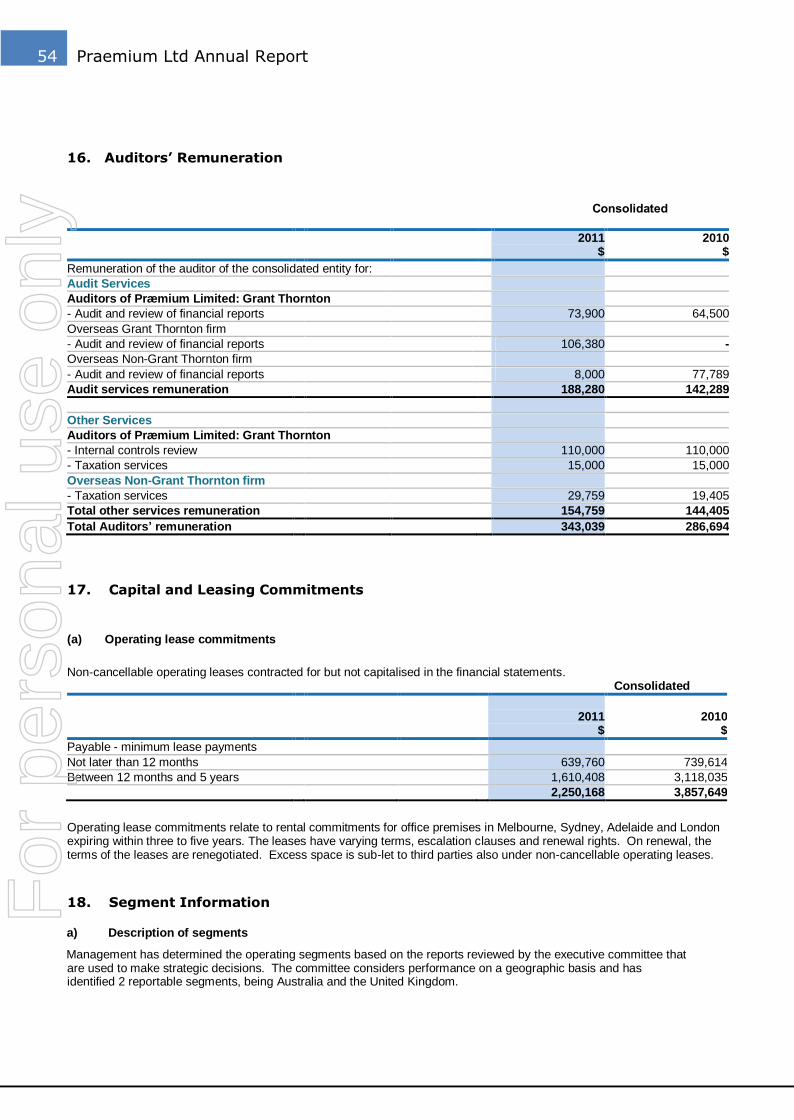
54 Praemium Ltd Annual Report
2011
$ 2010
$
Remuneration of the auditor of the consolidated entity for:
Audit Services
Auditors of Præmium Limited: Grant Thornton
- Audit and review of financial reports 73,900 64,500
Overseas Grant Thornton firm
- Audit and review of financial reports 106,380 -
Overseas Non-Grant Thornton firm
- Audit and review of financial reports 8,000 77,789
Audit services remuneration 188,280 142,289
Other Services
Auditors of Præmium Limited: Grant Thornton
- Internal controls review 110,000 110,000
- Taxation services 15,000 15,000
Overseas Non-Grant Thornton firm
- Taxation services 29,759 19,405
Total other services remuneration 154,759 144,405
Total Auditors’ remuneration 343,039 286,694
17. Capital and Leasing Commitments
(a) Operating lease commitments
Non-cancellable operating leases contracted for but not capitalised in the financial statements. Consolidated
2011
$
2010
$
Payable - minimum lease payments
Not later than 12 months 639,760 739,614
Between 12 months and 5 years 1,610,408 3,118,035
2,250,168 3,857,649
Operating lease commitments relate to rental commitments for office premises in Melbourne, Sydney, Adelaide and London expiring within three to five years. The leases have varying terms, escalation clauses and renewal rights. On renewal, the terms of the leases are renegotiated. Excess space is sub-let to third parties also under non-cancellable operating leases.
18. Segment Information
(a) Description of segments
Management has determined the operating segments based on the reports reviewed by the executive committee that are used to make strategic decisions. The committee considers performance on a geographic basis and has identified 2 reportable segments, being Australia and the United Kingdom.
16. Auditors’ Remuneration
Consolidated
For
per
sona
l use
onl
y
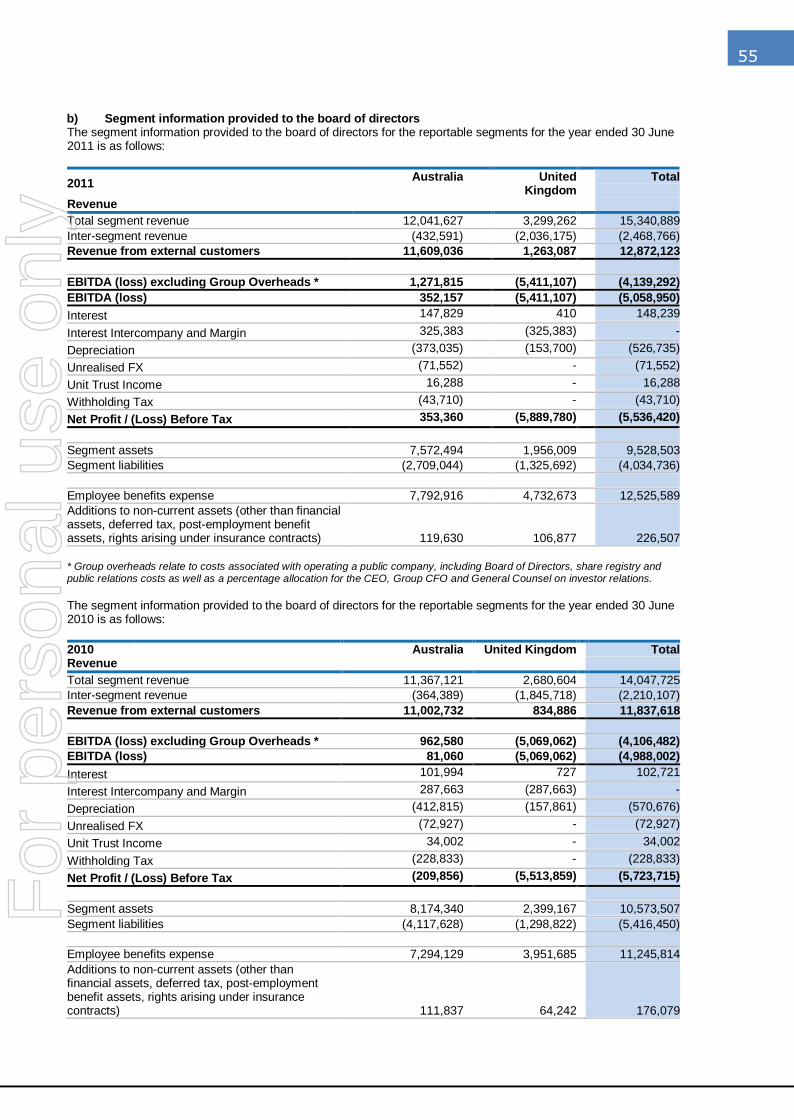
55
(b) Segment information provided to the board of directors The segment information provided to the board of directors for the reportable segments for the year ended 30 June 2011 is as follows:
2011 Australia United
Kingdom Total
Revenue
Total segment revenue 12,041,627 3,299,262 15,340,889
Inter-segment revenue (432,591) (2,036,175) (2,468,766)
Revenue from external customers 11,609,036 1,263,087 12,872,123
EBITDA (loss) excluding Group Overheads * 1,271,815 (5,411,107) (4,139,292)
EBITDA (loss) 352,157 (5,411,107) (5,058,950)
Interest 147,829 410 148,239
Interest Intercompany and Margin 325,383 (325,383) -
Depreciation (373,035) (153,700) (526,735)
Unrealised FX (71,552) - (71,552)
Unit Trust Income 16,288 - 16,288
Withholding Tax (43,710) - (43,710)
Net Profit / (Loss) Before Tax 353,360 (5,889,780) (5,536,420)
Segment assets 7,572,494 1,956,009 9,528,503
Segment liabilities (2,709,044) (1,325,692) (4,034,736)
Employee benefits expense 7,792,916 4,732,673 12,525,589
Additions to non-current assets (other than financial assets, deferred tax, post-employment benefit assets, rights arising under insurance contracts) 119,630
106,877
226,507
* Group overheads relate to costs associated with operating a public company, including Board of Directors, share registry and public relations costs as well as a percentage allocation for the CEO, Group CFO and General Counsel on investor relations.
The segment information provided to the board of directors for the reportable segments for the year ended 30 June 2010 is as follows:
2010 Australia United Kingdom Total Revenue
Total segment revenue 11,367,121 2,680,604 14,047,725
Inter-segment revenue (364,389) (1,845,718) (2,210,107)
Revenue from external customers 11,002,732 834,886 11,837,618
EBITDA (loss) excluding Group Overheads * 962,580 (5,069,062) (4,106,482)
EBITDA (loss) 81,060 (5,069,062) (4,988,002)
Interest 101,994 727 102,721
Interest Intercompany and Margin 287,663 (287,663) -
Depreciation (412,815) (157,861) (570,676)
Unrealised FX (72,927) - (72,927)
Unit Trust Income 34,002 - 34,002
Withholding Tax (228,833) - (228,833)
Net Profit / (Loss) Before Tax (209,856) (5,513,859) (5,723,715)
Segment assets 8,174,340 2,399,167 10,573,507
Segment liabilities (4,117,628) (1,298,822) (5,416,450)
Employee benefits expense 7,294,129 3,951,685 11,245,814
Additions to non-current assets (other than financial assets, deferred tax, post-employment benefit assets, rights arising under insurance contracts) 111,837
64,242
176,079
For
per
sona
l use
onl
y
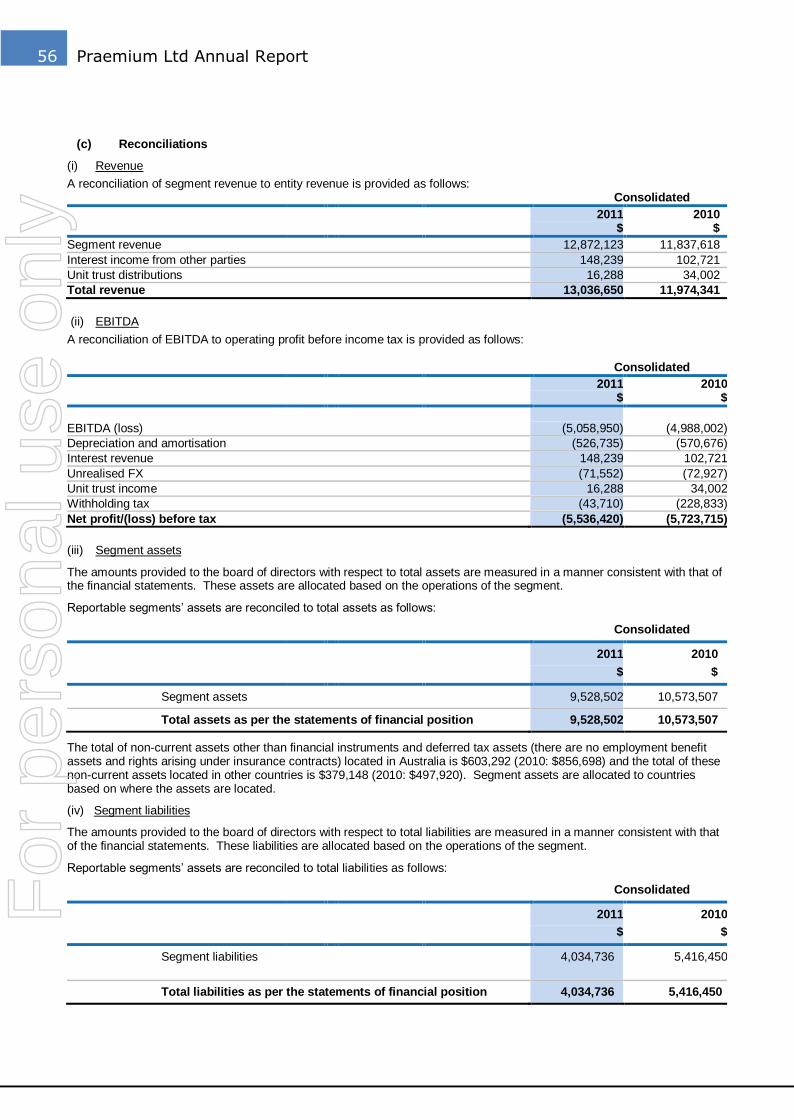
56 Praemium Ltd Annual Report
(c) Reconciliations
(i) Revenue
A reconciliation of segment revenue to entity revenue is provided as follows: Consolidated
2011
$ 2010
$
Segment revenue 12,872,123 11,837,618
Interest income from other parties 148,239 102,721
Unit trust distributions 16,288 34,002
Total revenue 13,036,650 11,974,341
(ii) EBITDA
A reconciliation of EBITDA to operating profit before income tax is provided as follows:
Consolidated
2011
$ 2010
$
EBITDA (loss) (5,058,950) (4,988,002)
Depreciation and amortisation (526,735) (570,676)
Interest revenue 148,239 102,721
Unrealised FX (71,552) (72,927)
Unit trust income 16,288 34,002
Withholding tax (43,710) (228,833)
Net profit/(loss) before tax (5,536,420) (5,723,715)
(iii) Segment assets
The amounts provided to the board of directors with respect to total assets are measured in a manner consistent with that of the financial statements. These assets are allocated based on the operations of the segment.
Reportable segments‘ assets are reconciled to total assets as follows:
Consolidated
2011
$
2010
$
Segment assets 9,528,502 10,573,507
Total assets as per the statements of financial position 9,528,502 10,573,507
The total of non-current assets other than financial instruments and deferred tax assets (there are no employment benefit assets and rights arising under insurance contracts) located in Australia is $603,292 (2010: $856,698) and the total of these non-current assets located in other countries is $379,148 (2010: $497,920). Segment assets are allocated to countries based on where the assets are located.
(iv) Segment liabilities
The amounts provided to the board of directors with respect to total liabilities are measured in a manner consistent with that of the financial statements. These liabilities are allocated based on the operations of the segment.
Reportable segments‘ assets are reconciled to total liabilities as follows:
Consolidated
2011
$
2010
$
Segment liabilities 4,034,736 5,416,450
Total liabilities as per the statements of financial position 4,034,736 5,416,450
For
per
sona
l use
onl
y
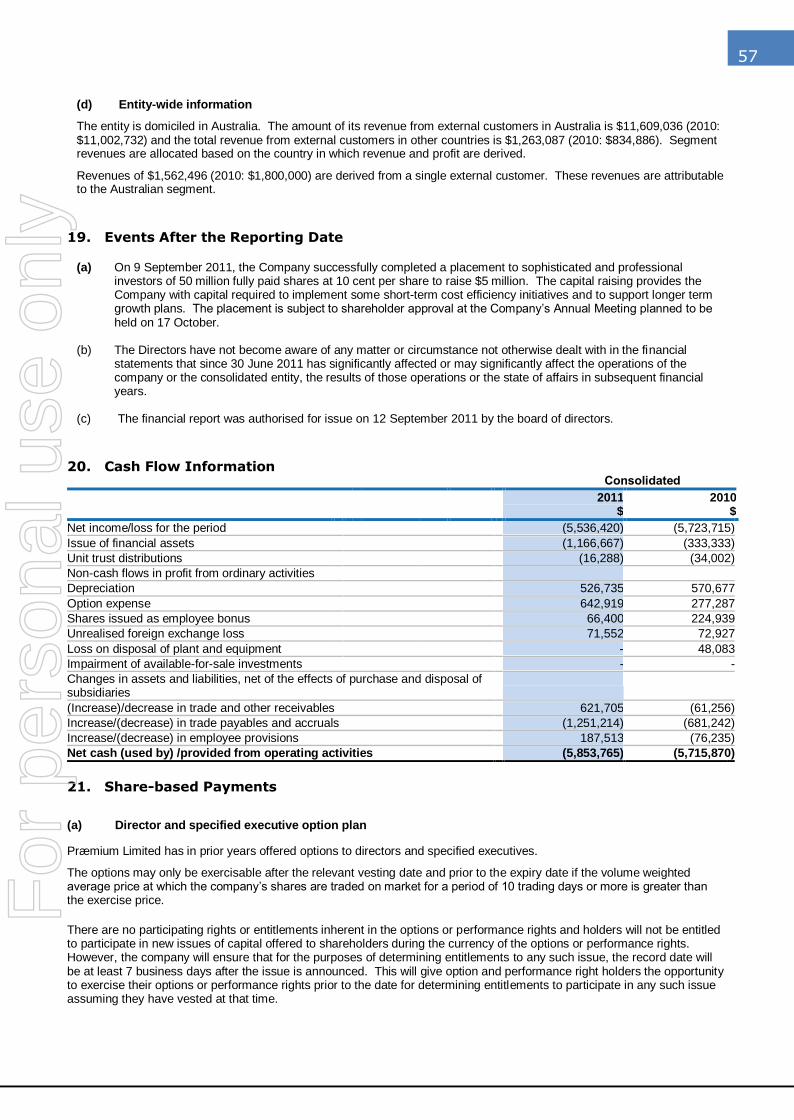
57
(d) Entity-wide information
The entity is domiciled in Australia. The amount of its revenue from external customers in Australia is $11,609,036 (2010: $11,002,732) and the total revenue from external customers in other countries is $1,263,087 (2010: $834,886). Segment revenues are allocated based on the country in which revenue and profit are derived.
Revenues of $1,562,496 (2010: $1,800,000) are derived from a single external customer. These revenues are attributable to the Australian segment.
19. Events After the Reporting Date
(a) On 9 September 2011, the Company successfully completed a placement to sophisticated and professional investors of 50 million fully paid shares at 10 cent per share to raise $5 million. The capital raising provides the Company with capital required to implement some short-term cost efficiency initiatives and to support longer term growth plans. The placement is subject to shareholder approval at the Company‘s Annual Meeting planned to be held on 17 October.
(b) The Directors have not become aware of any matter or circumstance not otherwise dealt with in the financial
statements that since 30 June 2011 has significantly affected or may significantly affect the operations of the company or the consolidated entity, the results of those operations or the state of affairs in subsequent financial years.
(c) The financial report was authorised for issue on 12 September 2011 by the board of directors.
20. Cash Flow Information Consolidated
2011
$ 2010
$
Net income/loss for the period (5,536,420) (5,723,715)
Issue of financial assets (1,166,667) (333,333)
Unit trust distributions (16,288) (34,002)
Non-cash flows in profit from ordinary activities
Depreciation 526,735 570,677
Option expense 642,919 277,287
Shares issued as employee bonus 66,400 224,939
Unrealised foreign exchange loss 71,552 72,927
Loss on disposal of plant and equipment - 48,083
Impairment of available-for-sale investments - -
Changes in assets and liabilities, net of the effects of purchase and disposal of subsidiaries
(Increase)/decrease in trade and other receivables 621,705 (61,256)
Increase/(decrease) in trade payables and accruals (1,251,214) (681,242)
Increase/(decrease) in employee provisions 187,513 (76,235)
Net cash (used by) /provided from operating activities (5,853,765) (5,715,870)
21. Share-based Payments
(a) Director and specified executive option plan
Præmium Limited has in prior years offered options to directors and specified executives.
The options may only be exercisable after the relevant vesting date and prior to the expiry date if the volume weighted average price at which the company‘s shares are traded on market for a period of 10 trading days or more is greater than the exercise price.
There are no participating rights or entitlements inherent in the options or performance rights and holders will not be entitled to participate in new issues of capital offered to shareholders during the currency of the options or performance rights. However, the company will ensure that for the purposes of determining entitlements to any such issue, the record date will be at least 7 business days after the issue is announced. This will give option and performance right holders the opportunity to exercise their options or performance rights prior to the date for determining entitlements to participate in any such issue assuming they have vested at that time.
For
per
sona
l use
onl
y
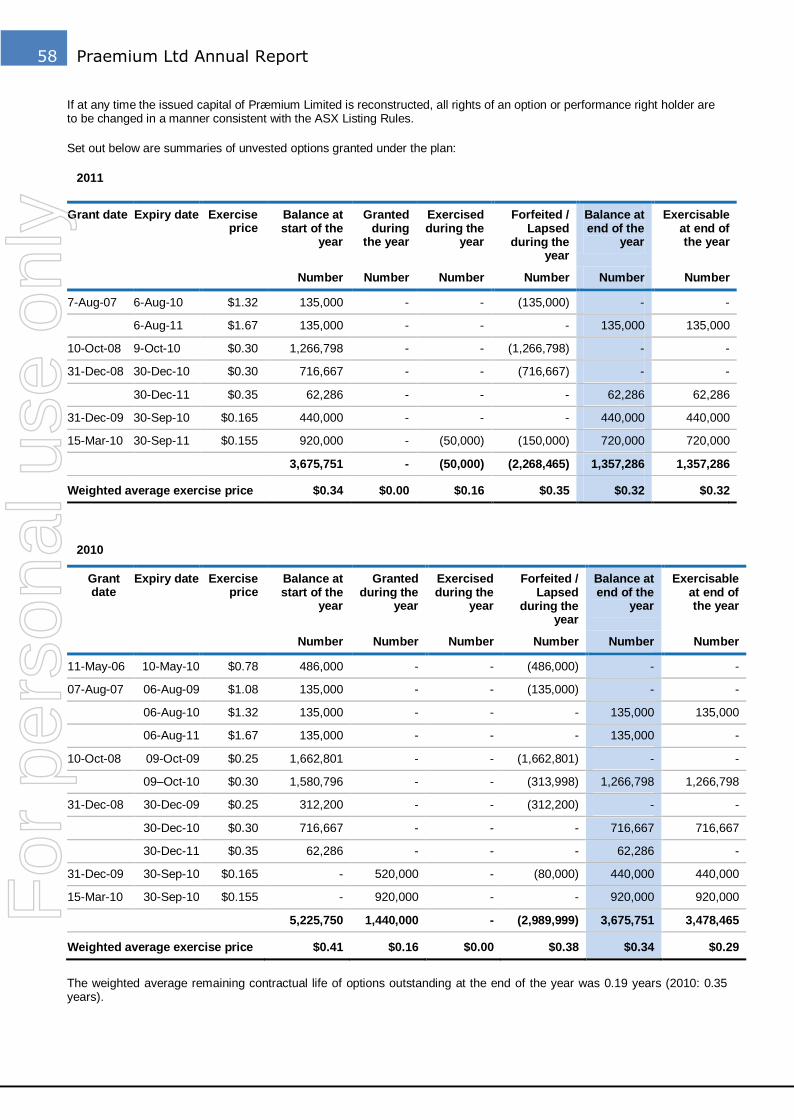
58 Praemium Ltd Annual Report
If at any time the issued capital of Præmium Limited is reconstructed, all rights of an option or performance right holder are to be changed in a manner consistent with the ASX Listing Rules.
Set out below are summaries of unvested options granted under the plan:
2011
Grant date Expiry date Exercise price
Balance at start of the
year
Granted during
the year
Exercised during the
year
Forfeited / Lapsed
during the year
Balance at end of the
year
Exercisable at end of the year
Number Number Number Number Number Number
7-Aug-07 6-Aug-10 $1.32 135,000 - - (135,000) - -
6-Aug-11 $1.67 135,000 - - - 135,000 135,000
10-Oct-08 9-Oct-10 $0.30 1,266,798 - - (1,266,798) - -
31-Dec-08 30-Dec-10 $0.30 716,667 - - (716,667) - -
30-Dec-11 $0.35 62,286 - - - 62,286 62,286
31-Dec-09 30-Sep-10 $0.165 440,000 - - - 440,000 440,000
15-Mar-10 30-Sep-11 $0.155 920,000 - (50,000) (150,000) 720,000 720,000
3,675,751 - (50,000) (2,268,465) 1,357,286 1,357,286
Weighted average exercise price $0.34 $0.00 $0.16 $0.35 $0.32 $0.32
2010
Grant date
Expiry date Exercise price
Balance at start of the
year
Granted during the
year
Exercised during the
year
Forfeited / Lapsed
during the year
Balance at end of the
year
Exercisable at end of the year
Number Number Number Number Number Number
11-May-06 10-May-10 $0.78 486,000 - - (486,000) - -
07-Aug-07 06-Aug-09 $1.08 135,000 - - (135,000) - -
06-Aug-10 $1.32 135,000 - - - 135,000 135,000
06-Aug-11 $1.67 135,000 - - - 135,000 -
10-Oct-08 09-Oct-09 $0.25 1,662,801 - - (1,662,801) - -
09–Oct-10 $0.30 1,580,796 - - (313,998) 1,266,798 1,266,798
31-Dec-08 30-Dec-09 $0.25 312,200 - - (312,200) - -
30-Dec-10 $0.30 716,667 - - - 716,667 716,667
30-Dec-11 $0.35 62,286 - - - 62,286 -
31-Dec-09 30-Sep-10 $0.165 - 520,000 - (80,000) 440,000 440,000
15-Mar-10 30-Sep-10 $0.155 - 920,000 - - 920,000 920,000
5,225,750 1,440,000 - (2,989,999) 3,675,751 3,478,465
Weighted average exercise price $0.41 $0.16 $0.00 $0.38 $0.34 $0.29
The weighted average remaining contractual life of options outstanding at the end of the year was 0.19 years (2010: 0.35 years).
For
per
sona
l use
onl
y
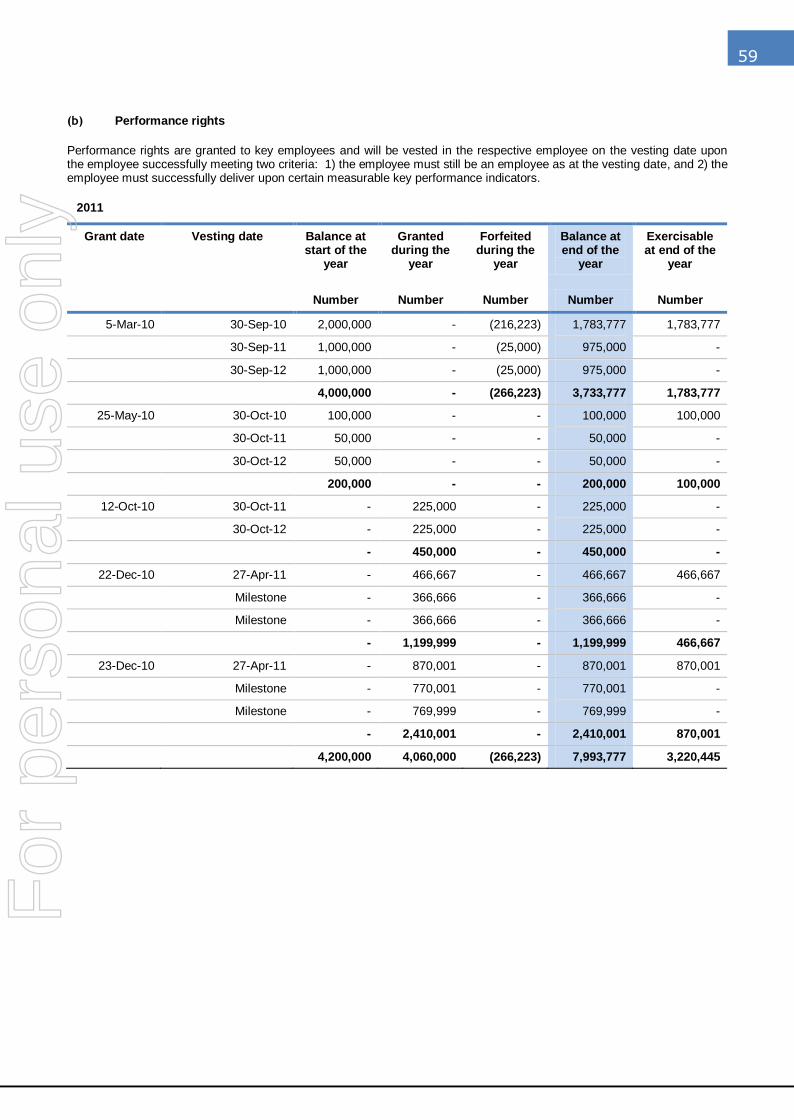
59
(b) Performance rights
Performance rights are granted to key employees and will be vested in the respective employee on the vesting date upon the employee successfully meeting two criteria: 1) the employee must still be an employee as at the vesting date, and 2) the employee must successfully deliver upon certain measurable key performance indicators.
2011
Grant date
Vesting date Balance at start of the
year
Granted during the
year
Forfeited during the
year
Balance at end of the
year
Exercisable at end of the
year
Number Number Number Number Number
5-Mar-10 30-Sep-10 2,000,000 - (216,223) 1,783,777 1,783,777
30-Sep-11 1,000,000 - (25,000) 975,000 -
30-Sep-12 1,000,000 - (25,000) 975,000 -
4,000,000 - (266,223) 3,733,777 1,783,777
25-May-10 30-Oct-10 100,000 - - 100,000 100,000
30-Oct-11 50,000 - - 50,000 -
30-Oct-12 50,000 - - 50,000 -
200,000 - - 200,000 100,000
12-Oct-10 30-Oct-11 - 225,000 - 225,000 -
30-Oct-12 - 225,000 - 225,000 -
- 450,000 - 450,000 -
22-Dec-10 27-Apr-11 - 466,667 - 466,667 466,667
Milestone - 366,666 - 366,666 -
Milestone - 366,666 - 366,666 -
- 1,199,999 - 1,199,999 466,667
23-Dec-10 27-Apr-11 - 870,001 - 870,001 870,001
Milestone - 770,001 - 770,001 -
Milestone - 769,999 - 769,999 -
- 2,410,001 - 2,410,001 870,001
4,200,000 4,060,000 (266,223) 7,993,777 3,220,445
For
per
sona
l use
onl
y
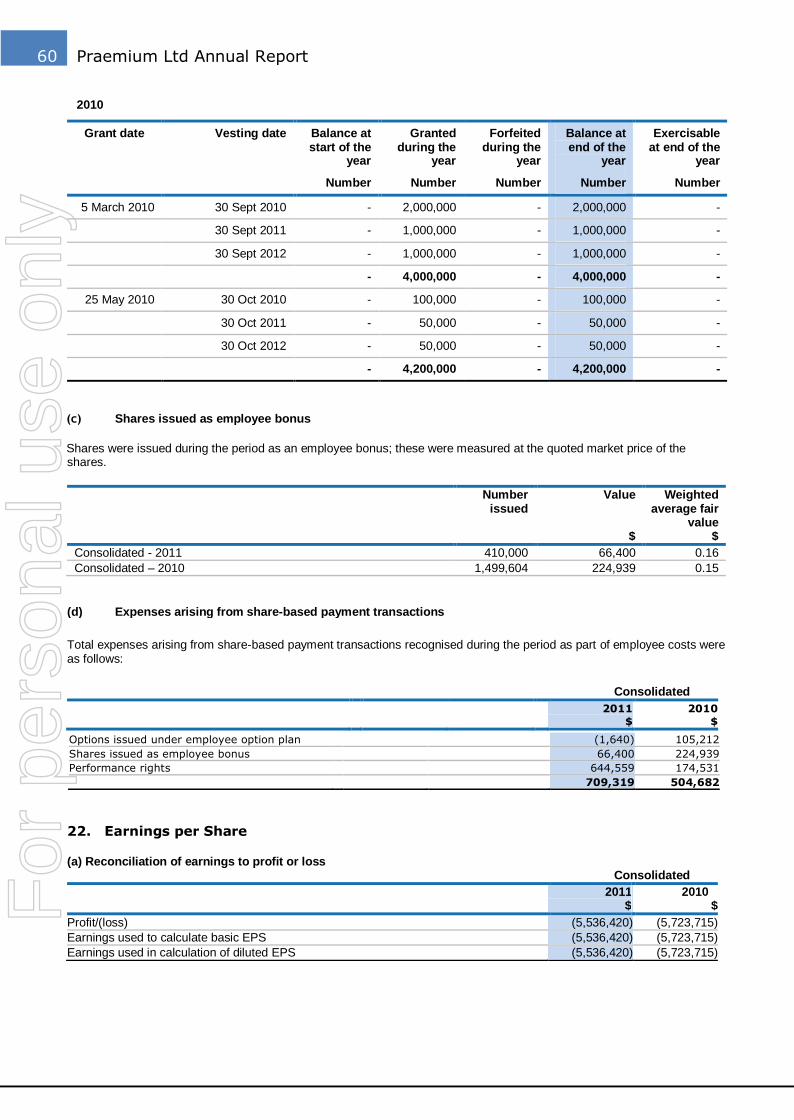
60 Praemium Ltd Annual Report
2010
Grant date Vesting date Balance at start of the
year
Granted during the
year
Forfeited during the
year
Balance at end of the
year
Exercisable at end of the
year
Number Number Number Number Number
5 March 2010 30 Sept 2010 - 2,000,000 - 2,000,000 -
30 Sept 2011 - 1,000,000 - 1,000,000 -
30 Sept 2012 - 1,000,000 - 1,000,000 -
- 4,000,000 - 4,000,000 -
25 May 2010 30 Oct 2010 - 100,000 - 100,000 -
30 Oct 2011 - 50,000 - 50,000 -
30 Oct 2012 - 50,000 - 50,000 -
- 4,200,000 - 4,200,000 -
(c) Shares issued as employee bonus
Shares were issued during the period as an employee bonus; these were measured at the quoted market price of the shares.
Number issued
Value Weighted average fair
value $ $
Consolidated - 2011 410,000 66,400 0.16
Consolidated – 2010 1,499,604 224,939 0.15
(d) Expenses arising from share-based payment transactions
Total expenses arising from share-based payment transactions recognised during the period as part of employee costs were as follows:
Consolidated
2011
$ 2010
$
22. Earnings per Share
(a) Reconciliation of earnings to profit or loss Consolidated
2011
$ 2010
$
Profit/(loss) (5,536,420) (5,723,715)
Earnings used to calculate basic EPS (5,536,420) (5,723,715)
Earnings used in calculation of diluted EPS (5,536,420) (5,723,715)
Options issued under employee option plan (1,640) 105,212
Shares issued as employee bonus 66,400 224,939
Performance rights 644,559 174,531
709,319 504,682
For
per
sona
l use
onl
y
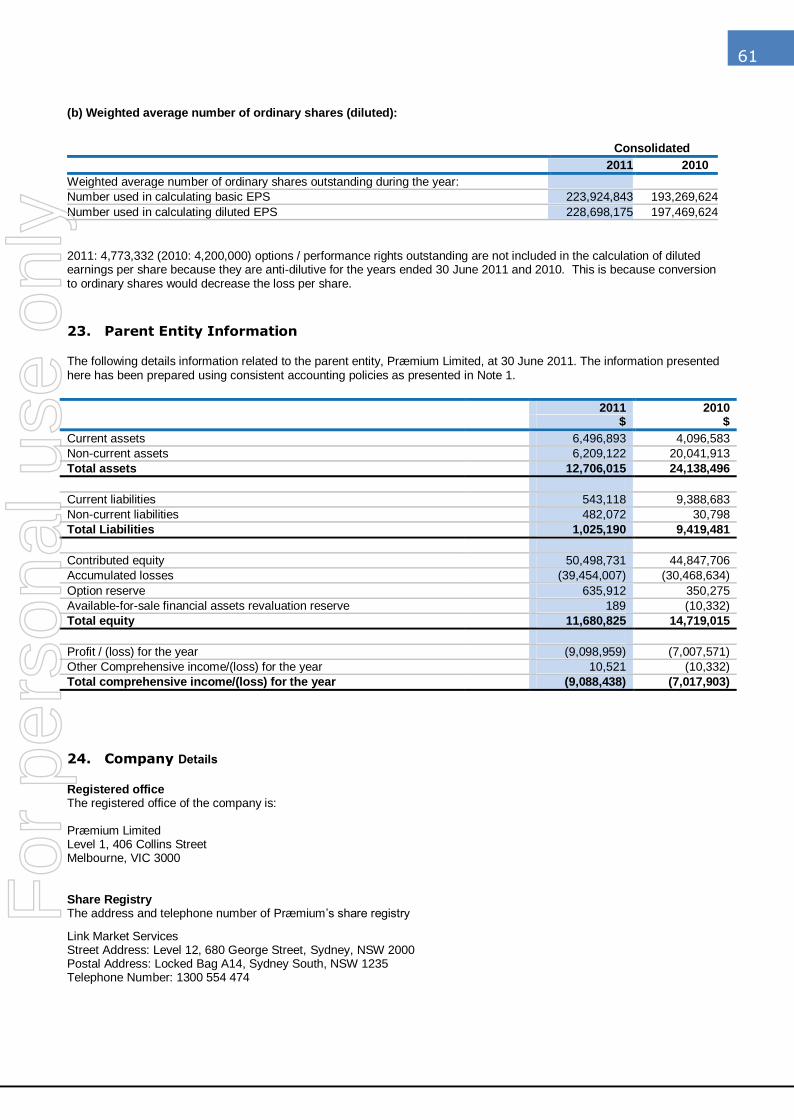
61
(b) Weighted average number of ordinary shares (diluted):
Consolidated
2011 2010
Weighted average number of ordinary shares outstanding during the year:
Number used in calculating basic EPS 223,924,843 193,269,624
Number used in calculating diluted EPS 228,698,175 197,469,624
2011: 4,773,332 (2010: 4,200,000) options / performance rights outstanding are not included in the calculation of diluted earnings per share because they are anti-dilutive for the years ended 30 June 2011 and 2010. This is because conversion to ordinary shares would decrease the loss per share.
23. Parent Entity Information
The following details information related to the parent entity, Præmium Limited, at 30 June 2011. The information presented here has been prepared using consistent accounting policies as presented in Note 1.
2011 2010 $ $
Current assets 6,496,893 4,096,583
Non-current assets 6,209,122 20,041,913
Total assets 12,706,015 24,138,496
Current liabilities 543,118 9,388,683
Non-current liabilities 482,072 30,798
Total Liabilities 1,025,190 9,419,481
Contributed equity 50,498,731 44,847,706
Accumulated losses (39,454,007) (30,468,634)
Option reserve 635,912 350,275
Available-for-sale financial assets revaluation reserve 189 (10,332)
Total equity 11,680,825 14,719,015
Profit / (loss) for the year (9,098,959) (7,007,571)
Other Comprehensive income/(loss) for the year 10,521 (10,332)
Total comprehensive income/(loss) for the year (9,088,438) (7,017,903)
24. Company Details
Registered office The registered office of the company is: Præmium Limited Level 1, 406 Collins Street Melbourne, VIC 3000 Share Registry The address and telephone number of Præmium‘s share registry
Link Market Services Street Address: Level 12, 680 George Street, Sydney, NSW 2000 Postal Address: Locked Bag A14, Sydney South, NSW 1235 Telephone Number: 1300 554 474
For
per
sona
l use
onl
y
62 Praemium Ltd Annual Report
Grant Thornton Audit Pty Ltd ACN 130 913 594
Level 2 215 Spring Street
Melbourne Victoria 3000 GPO Box 4984
Melbourne Victoria 3001
T +61 3 8663 6000 F +61 3 8663 6333
E [email protected] W www.grantthornton.com.au
Auditor’s Independence Declaration
Auditor’s Independence Declaration
To the Directors of Praemium Limited
In accordance with the requirements of section 307C of the Corporations Act 2001, as lead auditor for the audit of Praemium Limited for the year ended 30 June 2011, I declare that, to the best of my knowledge and belief, there have been:
a. no contraventions of the auditor independence requirements of the Corporations Act 2001 in relation to the audit; and
b. no contraventions of any applicable code of professional conduct in relation to the audit.
GRANT THORNTON AUDIT PTY LTD
Chartered Accountants
M. A. Cunningham
Director - Audit & Assurance
Melbourne, 12 September 2011
Grant Thornton Australia Limited is a member firm within Grant Thornton International Ltd. Grant Thornton International Ltd and the member firms are not a worldwide partnership. Grant Thornton Australia Limited, together with
its subsidiaries and related entities, delivers its services independently in Australia.
Liability limited by a scheme approved under Professional Standards Legislation
For
per
sona
l use
onl
y
63
Grant Thornton Audit Pty Ltd ACN 130 913 594
Level 2 215 Spring Street
Melbourne Victoria 3000 GPO Box 4984
Melbourne Victoria 3001
T +61 3 8663 6000 F +61 3 8663 6333
E [email protected] W www.grantthornton.com.au
Independent Audit Report
Independent Auditor’s Report
To the Members of Praemium Limited
Report on the financial report
We have audited the accompanying financial report of Praemium Limited (the “Company”), which comprises the consolidated statement of financial position as at 30 June 2011, and the consolidated statement of comprehensive income, consolidated statement of changes in equity and consolidated statement of cash flows for the year ended on that date, a summary of significant accounting policies, other explanatory notes to the financial report and the directors’ declaration of the consolidated entity comprising the Company and the entities it controlled at the year’s end or from time to time during the financial year.
Directors’ responsibility for the financial report
The directors of the Company are responsible for the preparation and fair presentation of the financial report in accordance with Australian Accounting Standards and the Corporations Act 2001. This responsibility includes establishing and maintaining internal controls relevant to the preparation and fair presentation of the financial report that are free from material misstatement, whether due to fraud or error. The directors also state, in the notes to the financial report, in accordance with Accounting Standard AASB 101 Presentation of Financial Statements, that compliance with the Australian equivalents to International Financial Reporting Standards ensures that the financial report, comprising the financial statements and notes, complies with International Financial Reporting Standards.
Auditor’s responsibility
Our responsibility is to express an opinion on the financial report based on our audit. We conducted our audit in accordance with Australian Auditing Standards which require us to comply with relevant ethical requirements relating to audit engagements and plan and perform the audit to obtain reasonable assurance whether the financial report is free from material misstatement.
Grant Thornton Australia Limited is a member firm within Grant Thornton International Ltd. Grant Thornton International Ltd and the member firms are not a worldwide partnership. Grant Thornton Australia Limited, together with
its subsidiaries and related entities, delivers its services independently in Australia
Liability limited by a scheme approved under Professional Standards Legislation
For
per
sona
l use
onl
y
64 Praemium Ltd Annual Report
An audit involves performing procedures to obtain audit evidence about the amounts and disclosures in the financial report. The procedures selected depend on the auditor’s judgement, including the assessment of the risks of material misstatement of the financial report, whether due to fraud or error.
In making those risk assessments, the auditor considers internal control relevant to the Company’s preparation and fair presentation of the financial report in order to design audit procedures that are appropriate in the circumstances, but not for the purpose of expressing an opinion on the effectiveness of the Company’s internal control. An audit also includes evaluating the appropriateness of accounting policies used and the reasonableness of accounting estimates made by the directors, as well as evaluating the overall presentation of the financial report.
We believe that the audit evidence we have obtained is sufficient and appropriate to provide a basis for our audit opinion.
Electronic presentation of audited financial report
This auditor’s report relates to the financial report of Praemium Limited and controlled entities for the year ended 30 June 2011 included on Praemium Limited’s web site. The Company’s directors are responsible for the integrity of Praemium Limited’s web site. We have not been engaged to report on the integrity of Praemium Limited’s web site. The auditor’s report refers only to the statements named above. It does not provide an opinion on any other information which may have been hyperlinked to/from these statements. If users of this report are concerned with the inherent risks arising from electronic data communications they are advised to refer to the hard copy of the audited financial report to confirm the information included in the audited financial report presented on this web site.
Independence
In conducting our audit, we have complied with the independence requirements of the Corporations Act 2001.
Auditor’s opinion
In our opinion:
a the financial report of Praemium Limited is in accordance with the Corporations Act 2001,
including:
i giving a true and fair view of the consolidated entity’s financial position as at 30 June 2011 and
of its performance for the year ended on that date; and
ii complying with Australian Accounting Standards (including the Australian Accounting
Interpretations) and the Corporations Regulations 2001; and
b the financial report also complies with International Financial Reporting Standards as disclosed in
the notes to the financial statements.
For
per
sona
l use
onl
y
65
Report on the remuneration report
We have audited the remuneration report included in pages 15 to 22 of the directors’ report for the year ended 30 June 2011. The directors of the Company are responsible for the preparation and presentation of the remuneration report in accordance with section 300A of the Corporations Act 2001. Our responsibility is to express an opinion on the remuneration report, based on our audit conducted in accordance with Australian Auditing Standards.
Auditor’s opinion on the remuneration report
In our opinion, the remuneration report of Praemium Limited for the year ended 30 June 2011, complies with section 300A of the Corporations Act 2001.
GRANT THORNTON AUDIT PTY LTD
Chartered Accountants
M. A. Cunningham
Director - Audit & Assurance
Melbourne, 12 September 2011
For
per
sona
l use
onl
y

66 Praemium Ltd Annual Report
For
per
sona
l use
onl
y