Embed Size (px)
Citation preview
Präsenz und Selbststudium im eLearning
Indizien für eine besondere Rolle der Präsenz
Rolf Schulmeister 2016 — http://rolf.schulmeister.com
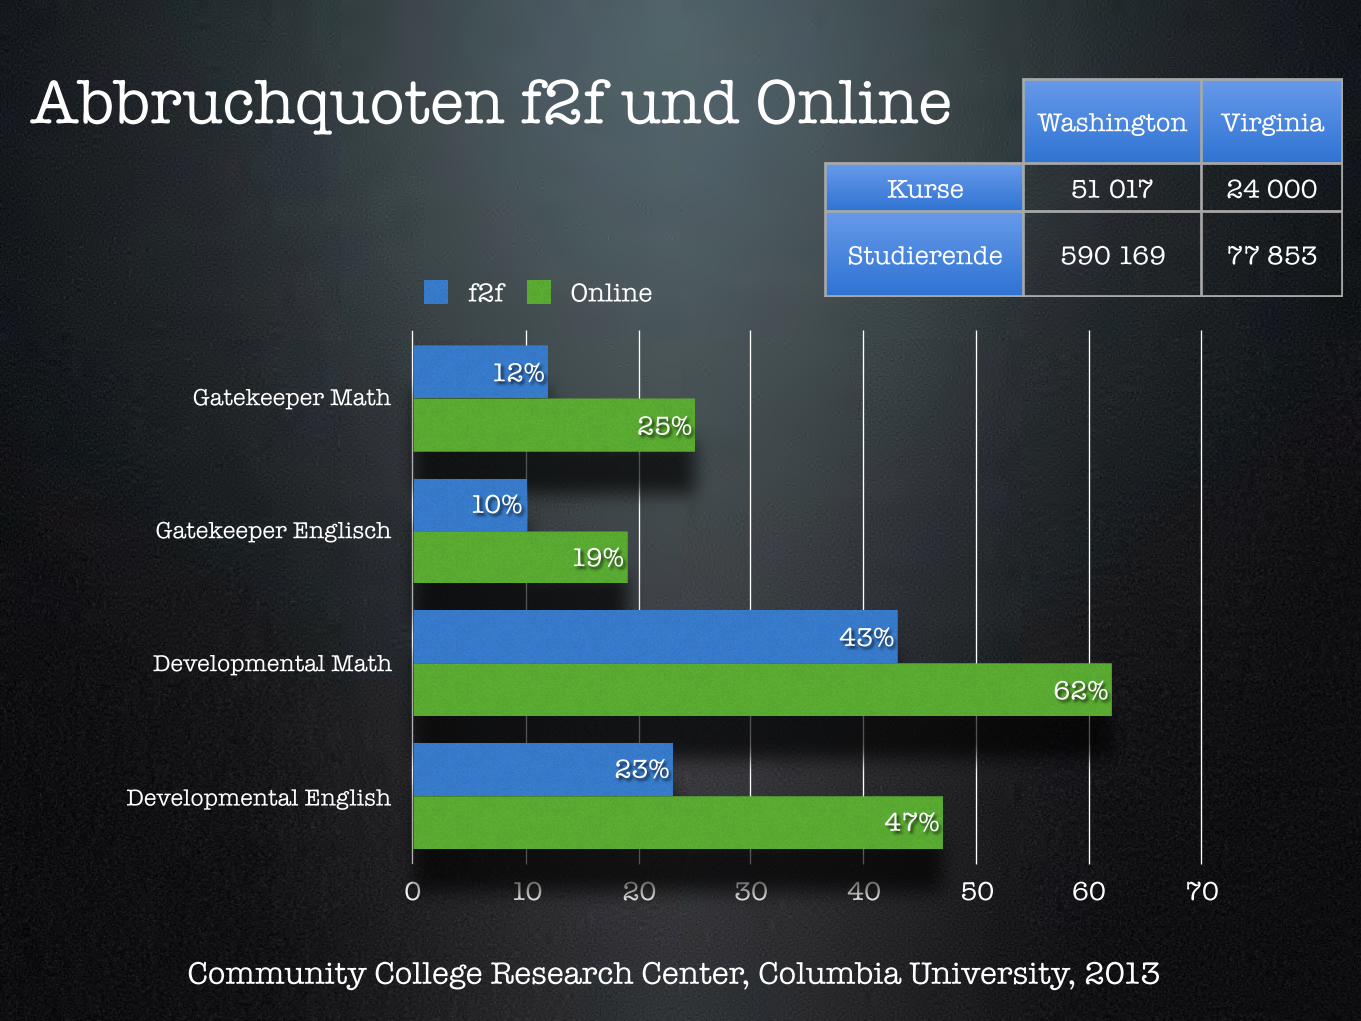
Gatekeeper Math
Gatekeeper Englisch
Developmental Math
Developmental English
0 10 20 30 40 50 60 70
47%
62%
19%
25%
23%
43%
10%
12%
f2f Online
Community College Research Center, Columbia University, 2013
Abbruchquoten f2f und Online Washington Virginia
Kurse 51 017 24 000
Studierende 590 169 77 853
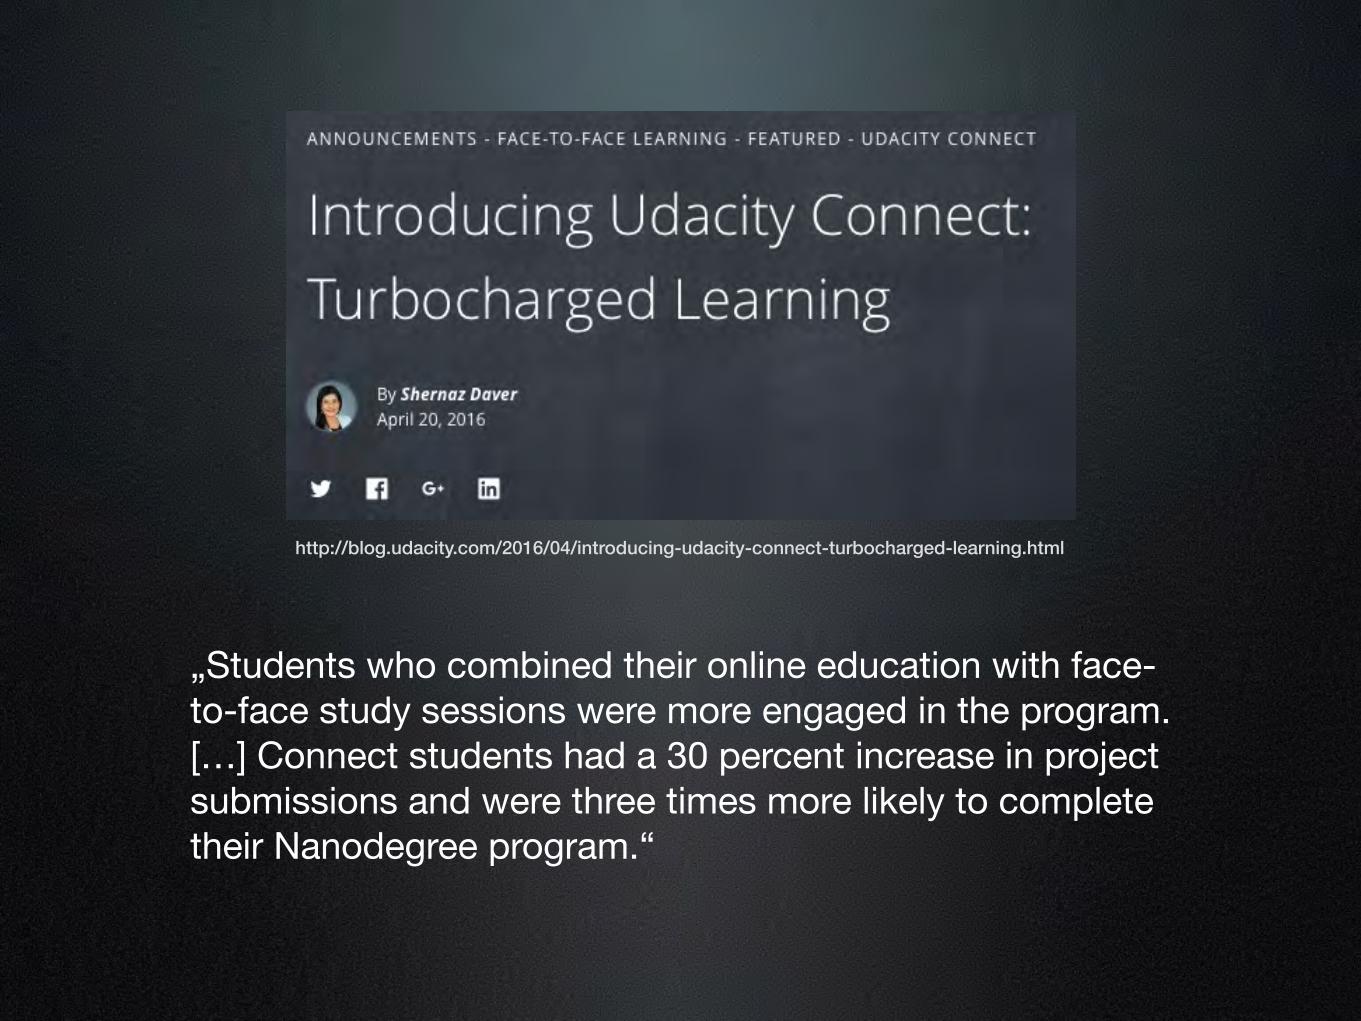
„Students who combined their online education with face-to-face study sessions were more engaged in the program. […] Connect students had a 30 percent increase in project submissions and were three times more likely to complete their Nanodegree program.“
http://blog.udacity.com/2016/04/introducing-udacity-connect-turbocharged-learning.html
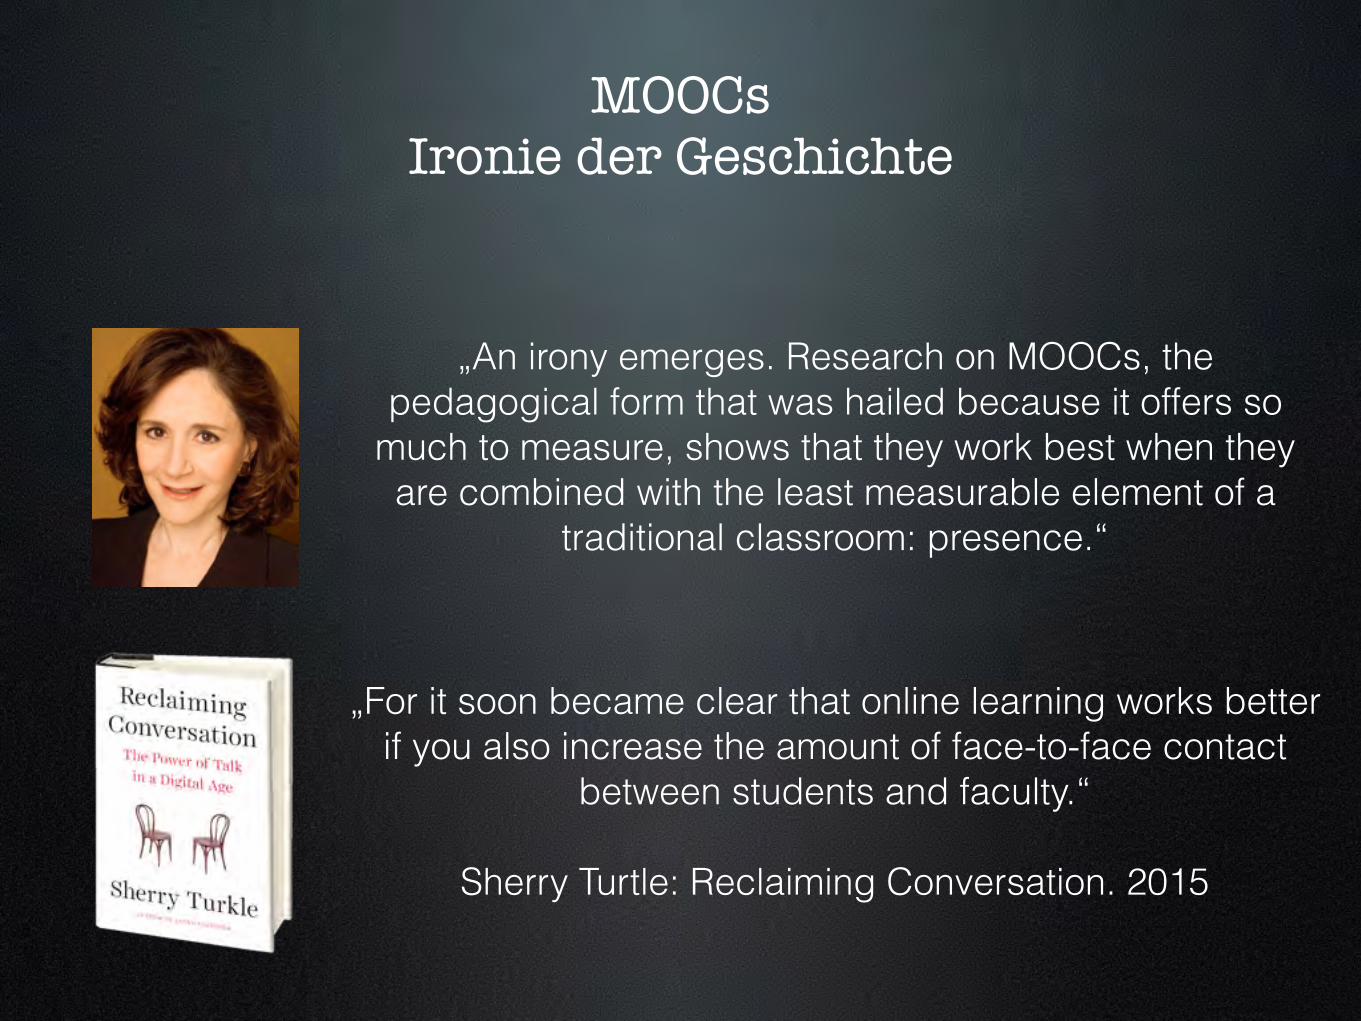
MOOCs Ironie der Geschichte
„An irony emerges. Research on MOOCs, the pedagogical form that was hailed because it offers so
much to measure, shows that they work best when they are combined with the least measurable element of a
traditional classroom: presence.“
„For it soon became clear that online learning works better if you also increase the amount of face-to-face contact
between students and faculty.“
Sherry Turtle: Reclaiming Conversation. 2015
Workload als Basis der Hypothesenprüfung
Eignen sich Zeitdaten als Prädiktor für Studienerfolg?
Schulmeister & Metzger 2011
Stun
den
pro
Stud
ent
in 5
Mon
aten
0
400
800
1200
1600
2000
2400
2800
3200
3600
4000
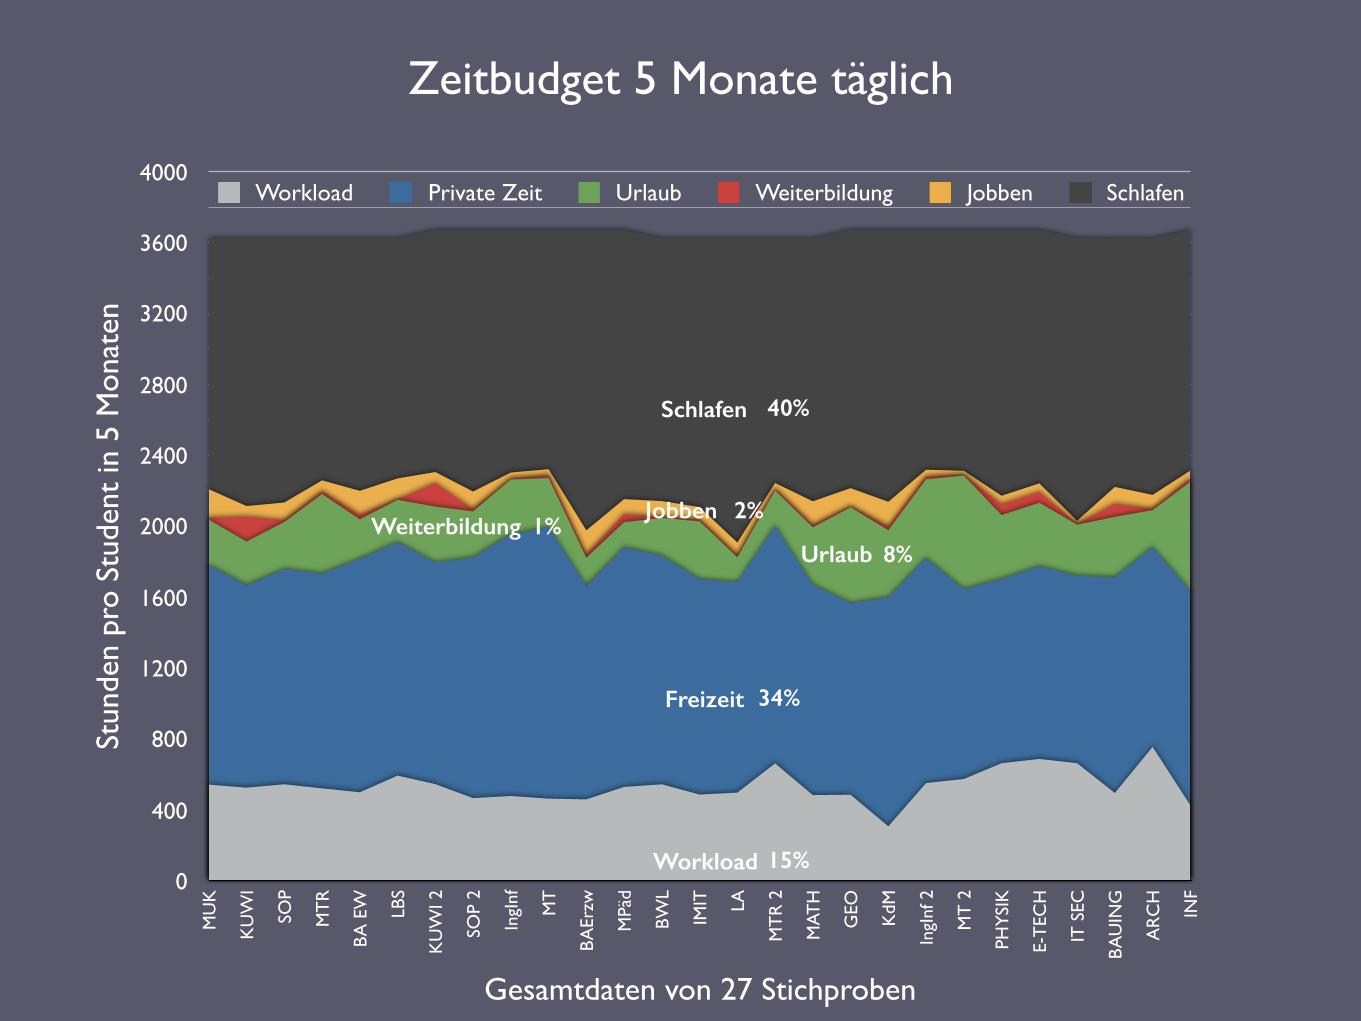
Gesamtdaten von 27 Stichproben
MU
K
KU
WI
SOP
MT
R
BA
EW LB
S
KU
WI 2
SOP
2
IngI
nf
MT
BA
Erzw
MPä
d
BWL
IMIT LA
MT
R 2
MAT
H
GEO
KdM
IngI
nf 2
MT
2
PHY
SIK
E-T
ECH
IT S
EC
BA
UIN
G
AR
CH
INF
Workload Private Zeit Urlaub Weiterbildung Jobben Schlafen
Zeitbudget 5 Monate täglich
Workload
Freizeit
Urlaub
Jobben
Schlafen
Weiterbildung
15%
34%
8%1%
2%
40%
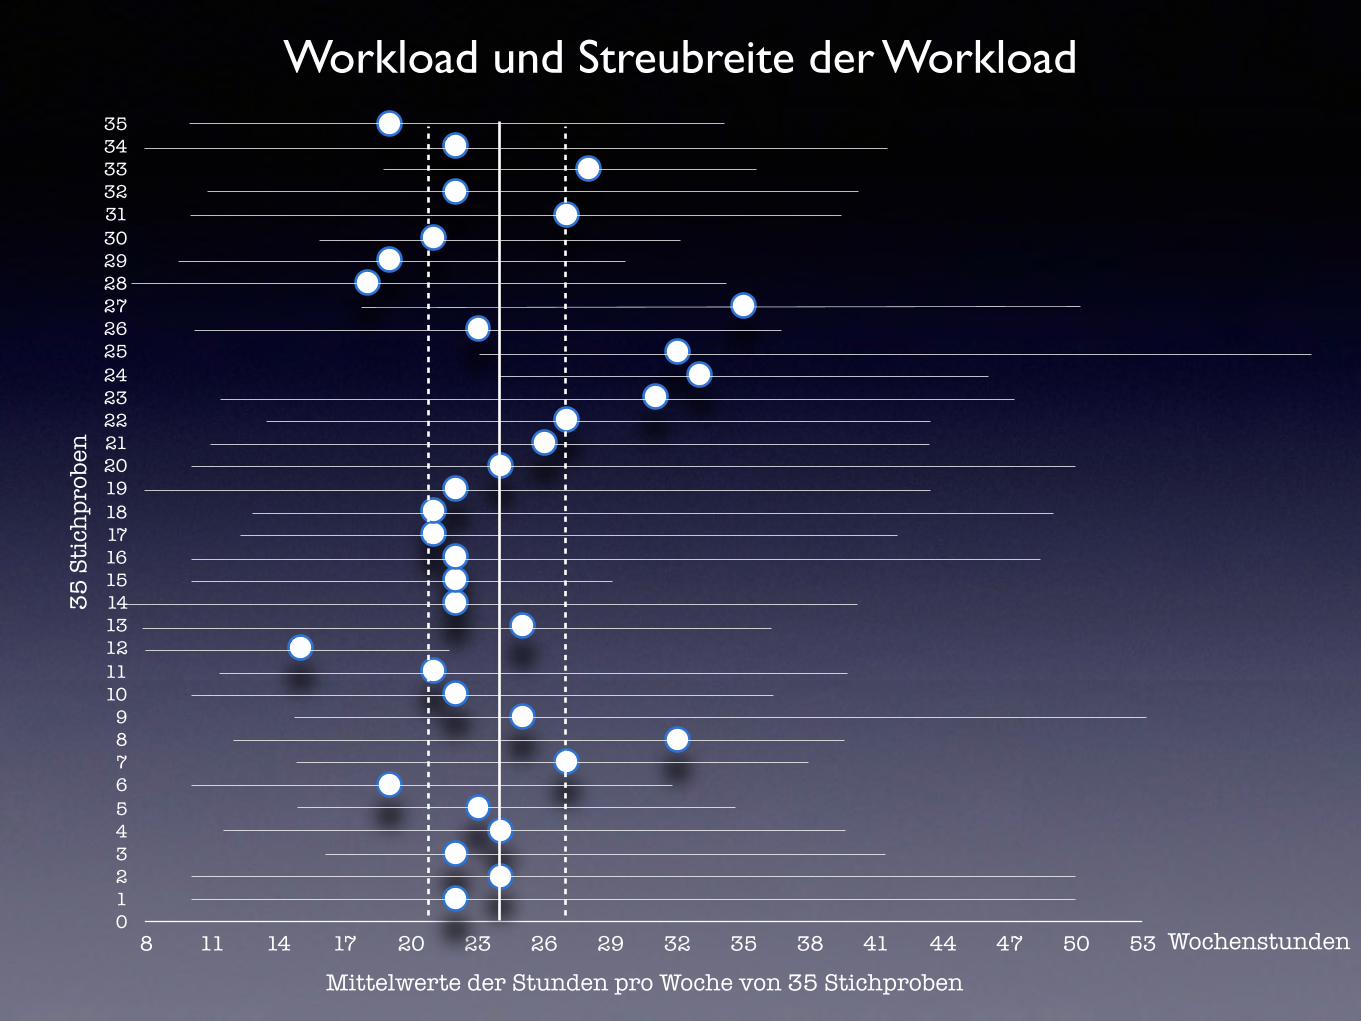
Workload und Streubreite der Workload35
Sti
chpr
oben
0123456789
1011121314151617181920212223242526272829303132333435
Mittelwerte der Stunden pro Woche von 35 Stichproben8 11 14 17 20 23 26 29 32 35 38 41 44 47 50 53 Wochenstunden
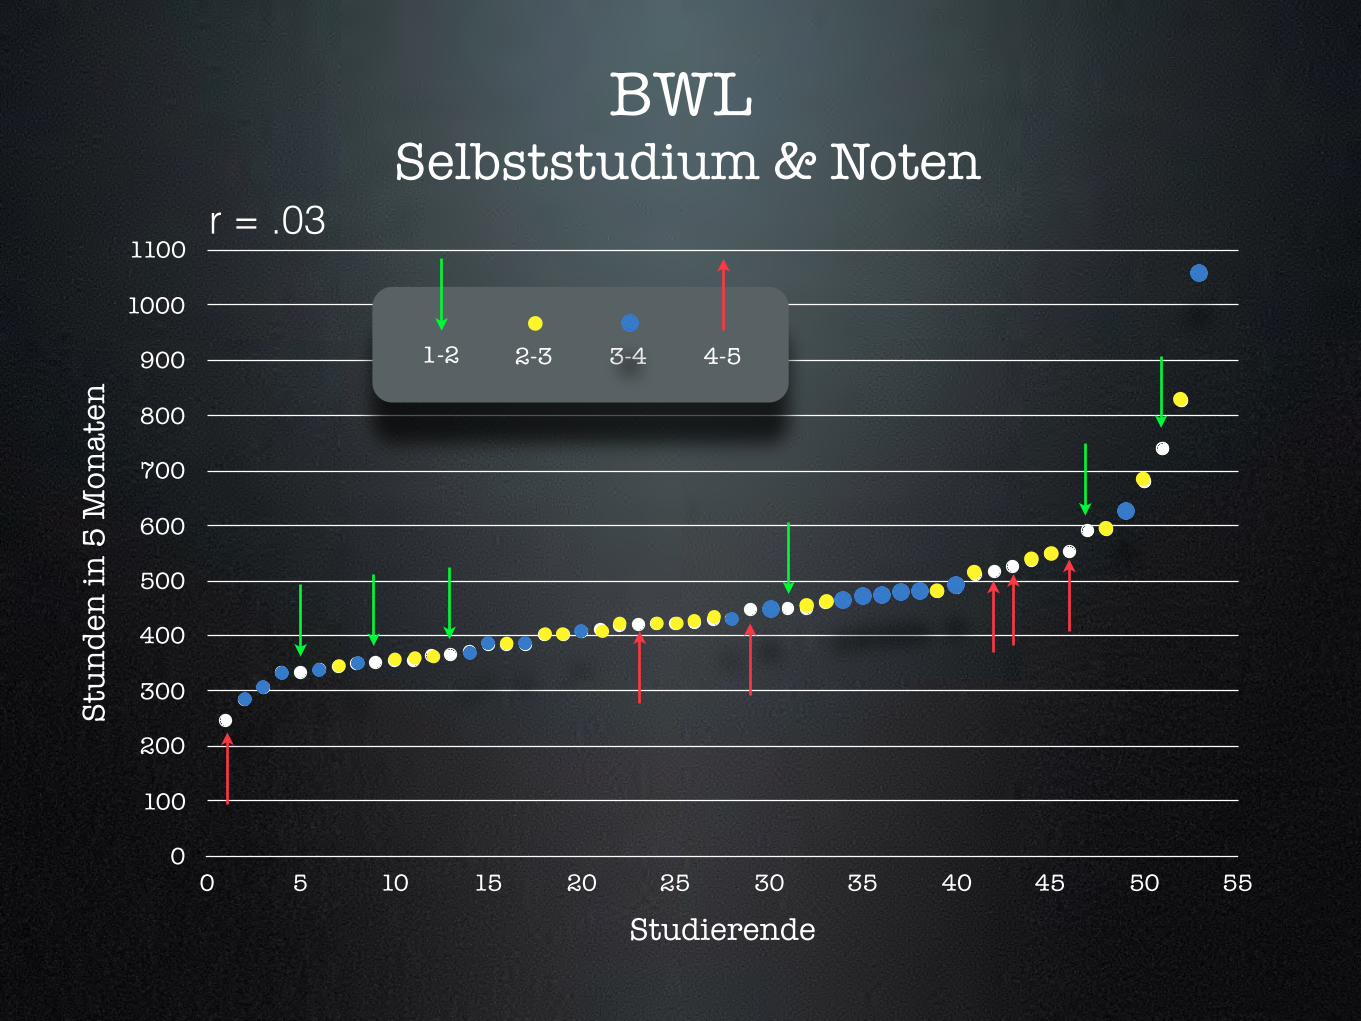
BWL Selbststudium & Noten
Stun
den
in 5
Mon
aten
0
100
200
300
400
500
600
700
800
900
1000
1100
Studierende0 5 10 15 20 25 30 35 40 45 50 55
1-2 2-3 3-4 4-5
r = .03
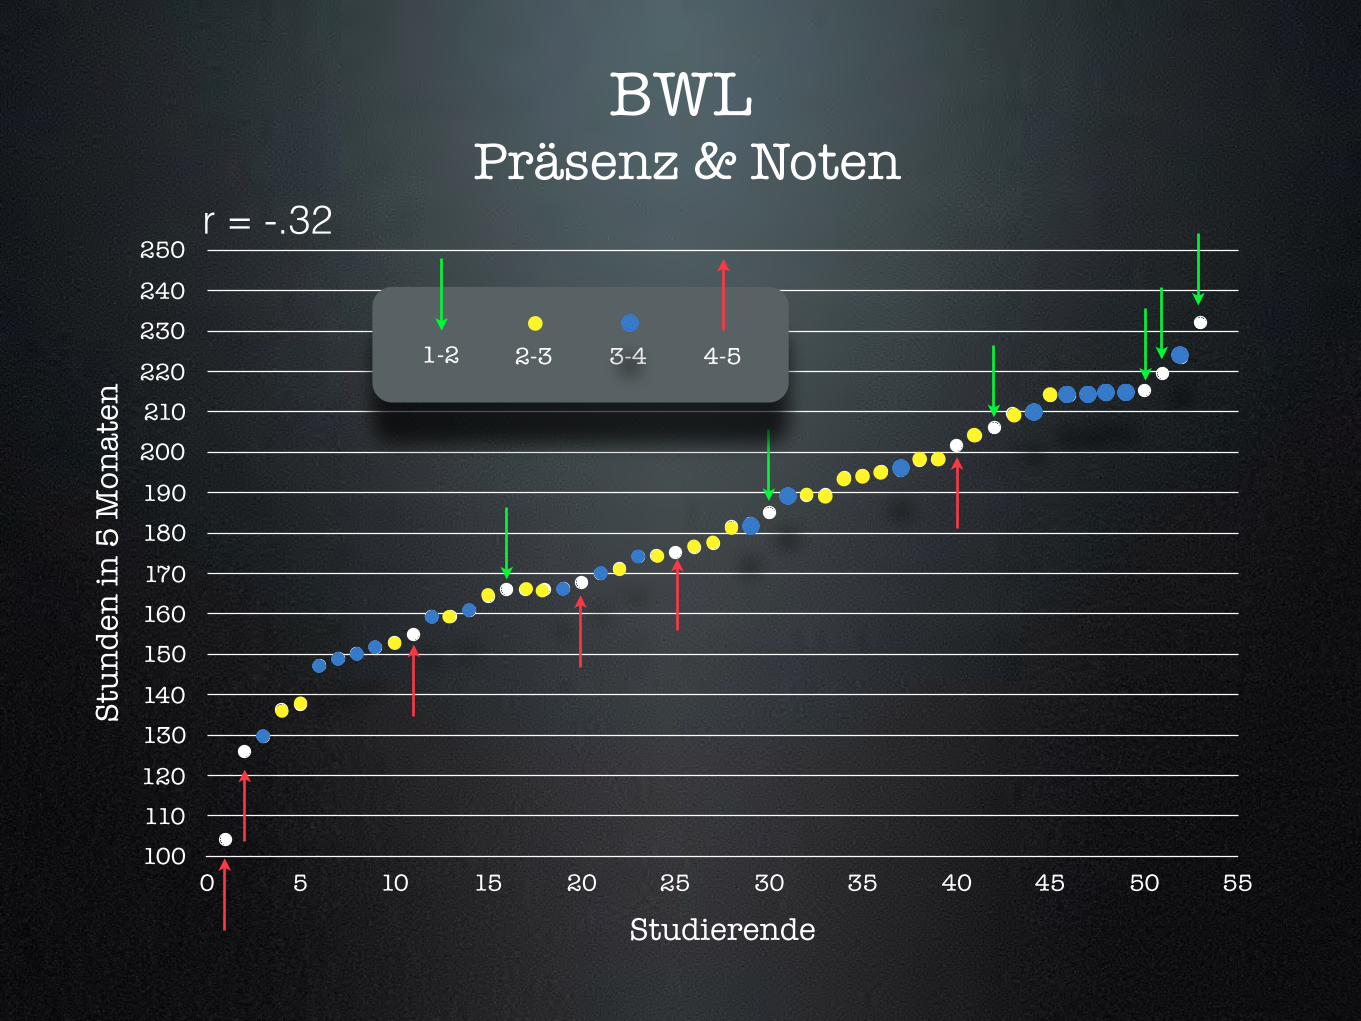
BWL Präsenz & Noten
Stun
den
in 5
Mon
aten
100110120
130140
150160170
180190
200210220
230240
250
Studierende0 5 10 15 20 25 30 35 40 45 50 55
1-2 2-3 3-4 4-5
r = -.32
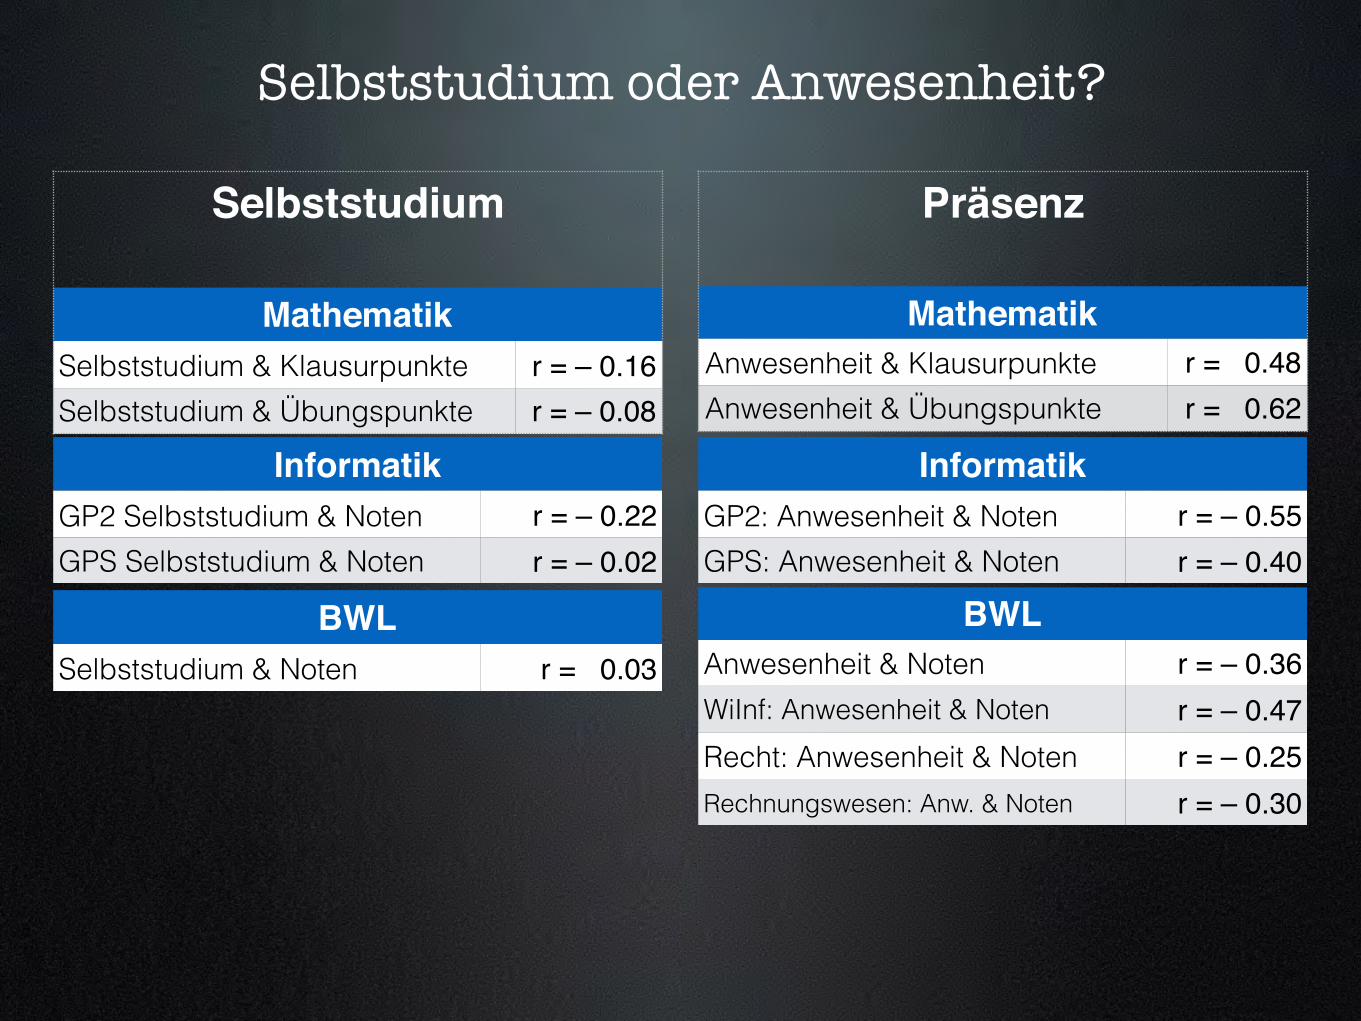
Selbststudium oder Anwesenheit?
Präsenz
MathematikAnwesenheit & Klausurpunkte r = 0.48Anwesenheit & Übungspunkte r = 0.62
BWLAnwesenheit & Noten r = – 0.36WiInf: Anwesenheit & Noten r = – 0.47Recht: Anwesenheit & Noten r = – 0.25Rechnungswesen: Anw. & Noten r = – 0.30
InformatikGP2 Selbststudium & Noten r = – 0.22GPS Selbststudium & Noten r = – 0.02
Selbststudium
MathematikSelbststudium & Klausurpunkte r = – 0.16Selbststudium & Übungspunkte r = – 0.08
InformatikGP2: Anwesenheit & Noten r = – 0.55GPS: Anwesenheit & Noten r = – 0.40
BWLSelbststudium & Noten r = 0.03
Abwesenheit Studierender vom Unterricht
Korrelative Studien und Regressionsanalysen
Schulmeister 2015
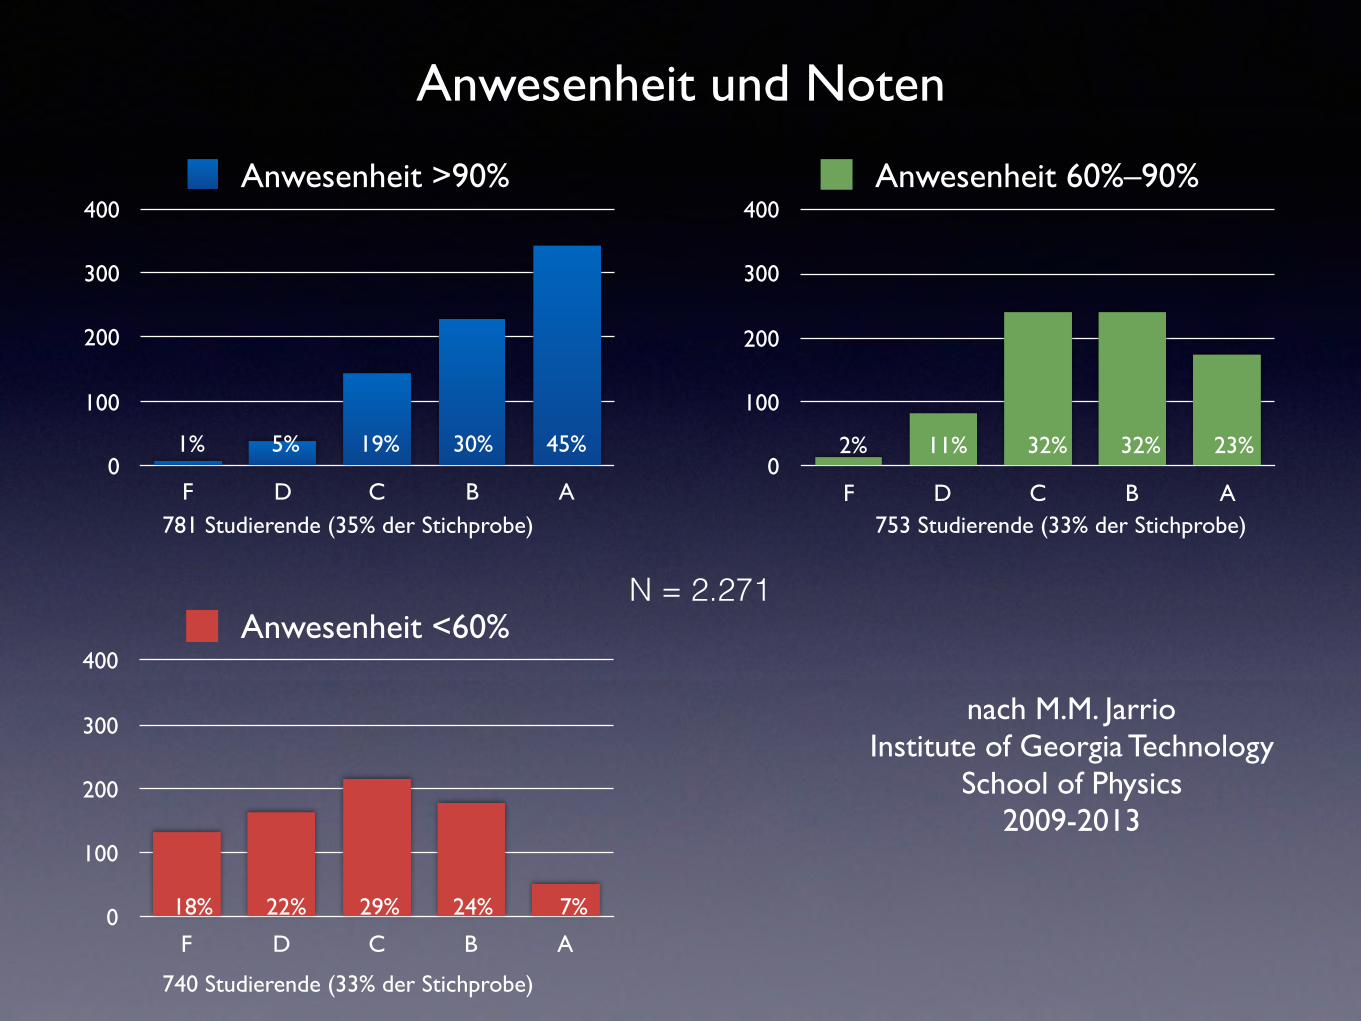
Anwesenheit und Noten
0
100
200
300
400
F D C B A
Anwesenheit >90%
1% 5% 19% 30% 45%
781 Studierende (35% der Stichprobe)
0
100
200
300
400
F D C B A
Anwesenheit 60%–90%
2% 11% 32% 32% 23%
753 Studierende (33% der Stichprobe)
0
100
200
300
400
F D C B A
Anwesenheit <60%
18% 22% 29% 24% 7%
740 Studierende (33% der Stichprobe)
nach M.M. JarrioInstitute of Georgia Technology
School of Physics2009-2013
N = 2.271
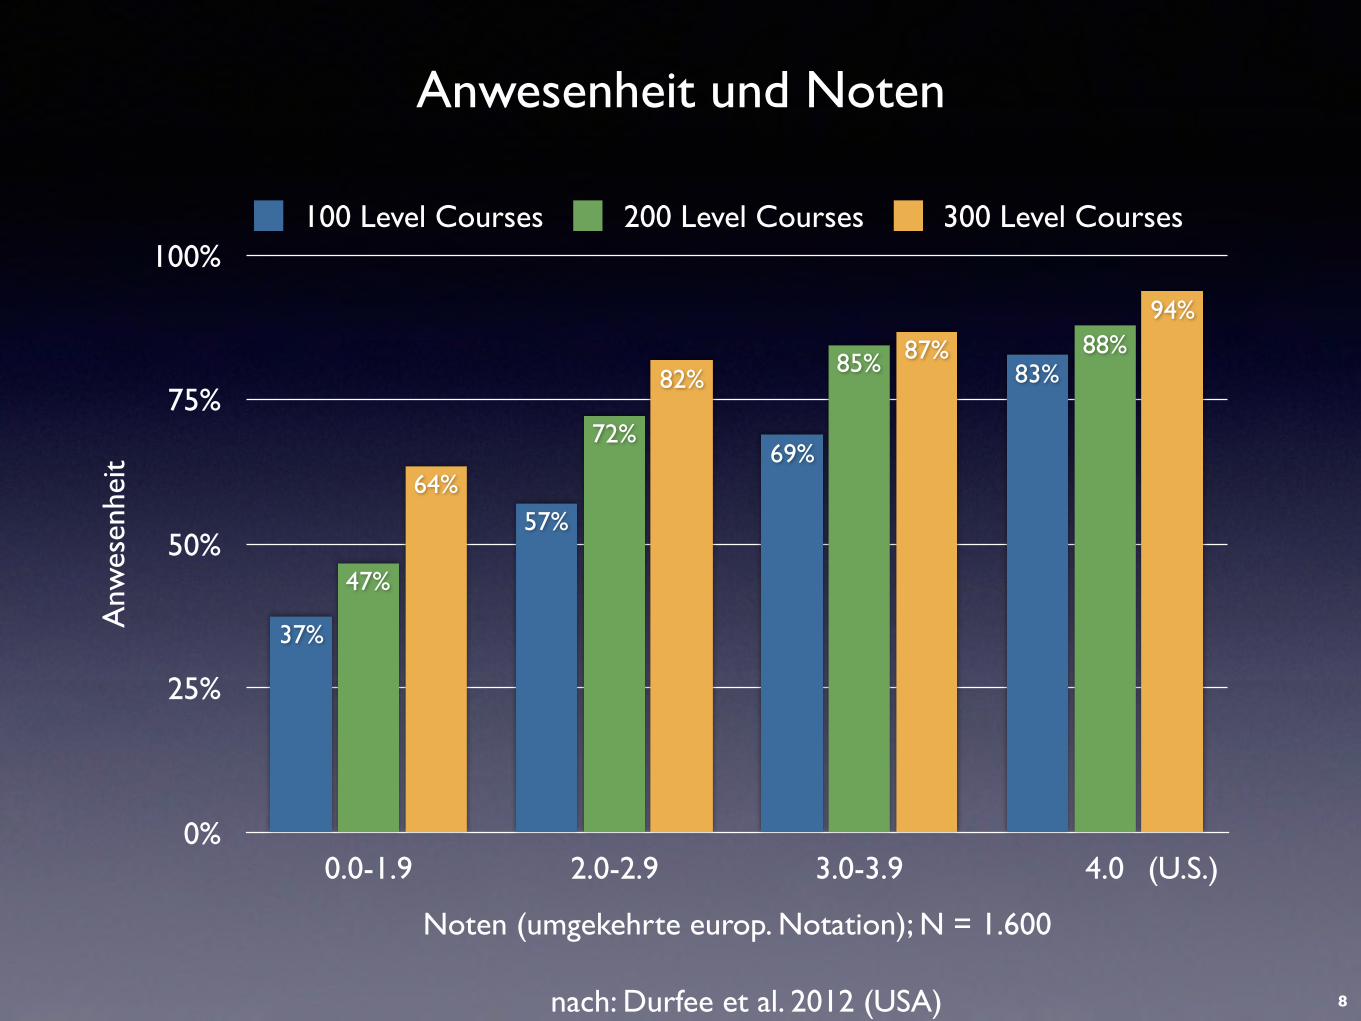
Anwesenheit und NotenA
nwes
enhe
it
0%
25%
50%
75%
100%
Noten (umgekehrte europ. Notation); N = 1.600
0.0-1.9 2.0-2.9 3.0-3.9 4.0
94%
87%82%
64%
88%85%
72%
47%
83%
69%
57%
37%
100 Level Courses 200 Level Courses 300 Level Courses
nach: Durfee et al. 2012 (USA)
(U.S.)
8
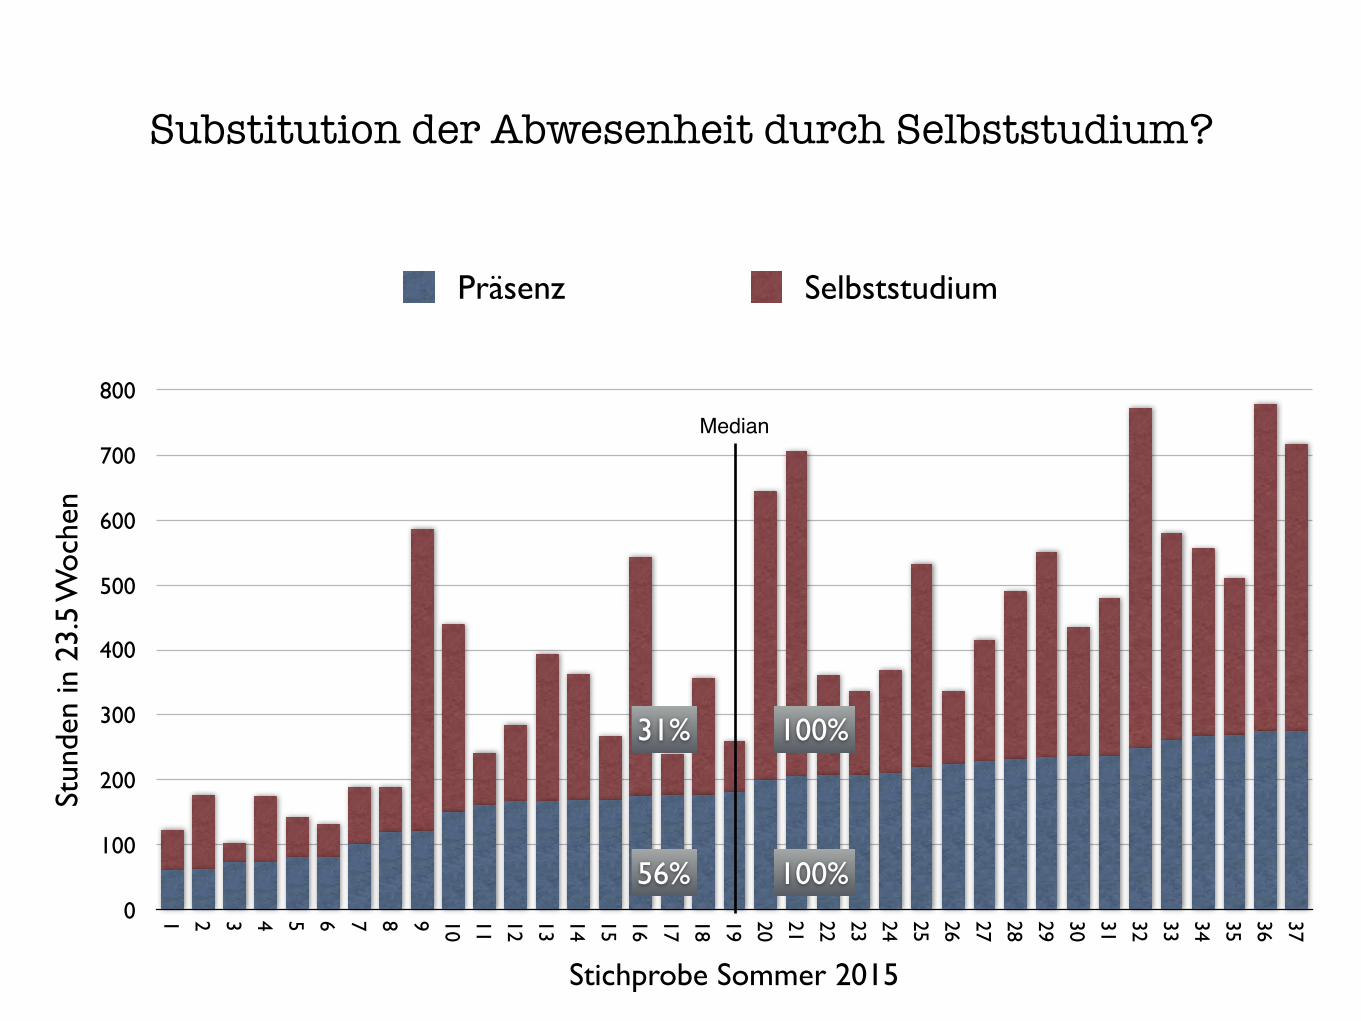
Substitution der Abwesenheit durch Selbststudium?St
unde
n in
23.
5 W
oche
n
0
100
200
300
400
500
600
700
800
Stichprobe Sommer 2015
1 2 3 4 5 6 7 8 9 10 11 12 13 14 15 16 17 18 19 20 21 22 23 24 25 26 27 28 29 30 31 32 33 34 35 36 37
Präsenz Selbststudium
Median
100%
100%56%
31%
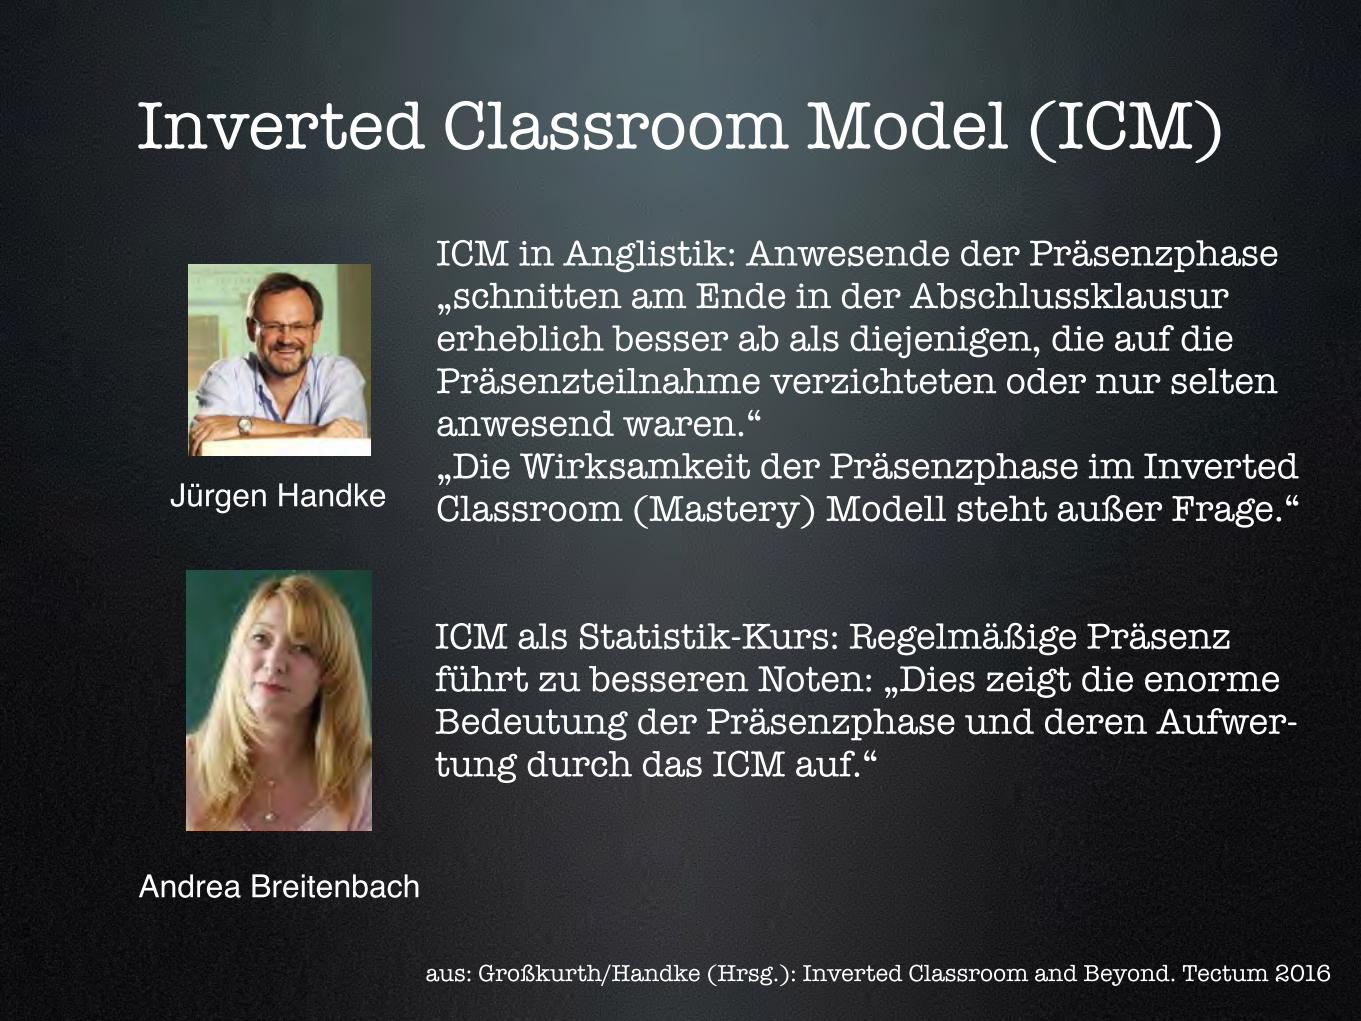
Inverted Classroom Model (ICM)
ICM in Anglistik: Anwesende der Präsenzphase „schnitten am Ende in der Abschlussklausur erheblich besser ab als diejenigen, die auf die Präsenzteilnahme verzichteten oder nur selten anwesend waren.“ „Die Wirksamkeit der Präsenzphase im Inverted Classroom (Mastery) Modell steht außer Frage.“
ICM als Statistik-Kurs: Regelmäßige Präsenz führt zu besseren Noten: „Dies zeigt die enorme Bedeutung der Präsenzphase und deren Aufwer- tung durch das ICM auf.“
Jürgen Handke
Andrea Breitenbach
aus: Großkurth/Handke (Hrsg.): Inverted Classroom and Beyond. Tectum 2016
Determinanten des Studienerfolgs
300 empirische Studien zu Motivation und Studierverhalten
Schulmeister 2014
0
1
2
3
4
5
6
7
Sich
erhe
itswa
hrne
hmun
g
Erge
bnis-
Erwa
rtung
Kom
pete
nzer
wartu
ng
Absc
hirm
ung
Selb
stko
ngru
ent Z
iel
Emot
ionsr
egula
tion
Gewi
ssen
hafti
gkeit
Anst
reng
ungs
bere
itsch
aft
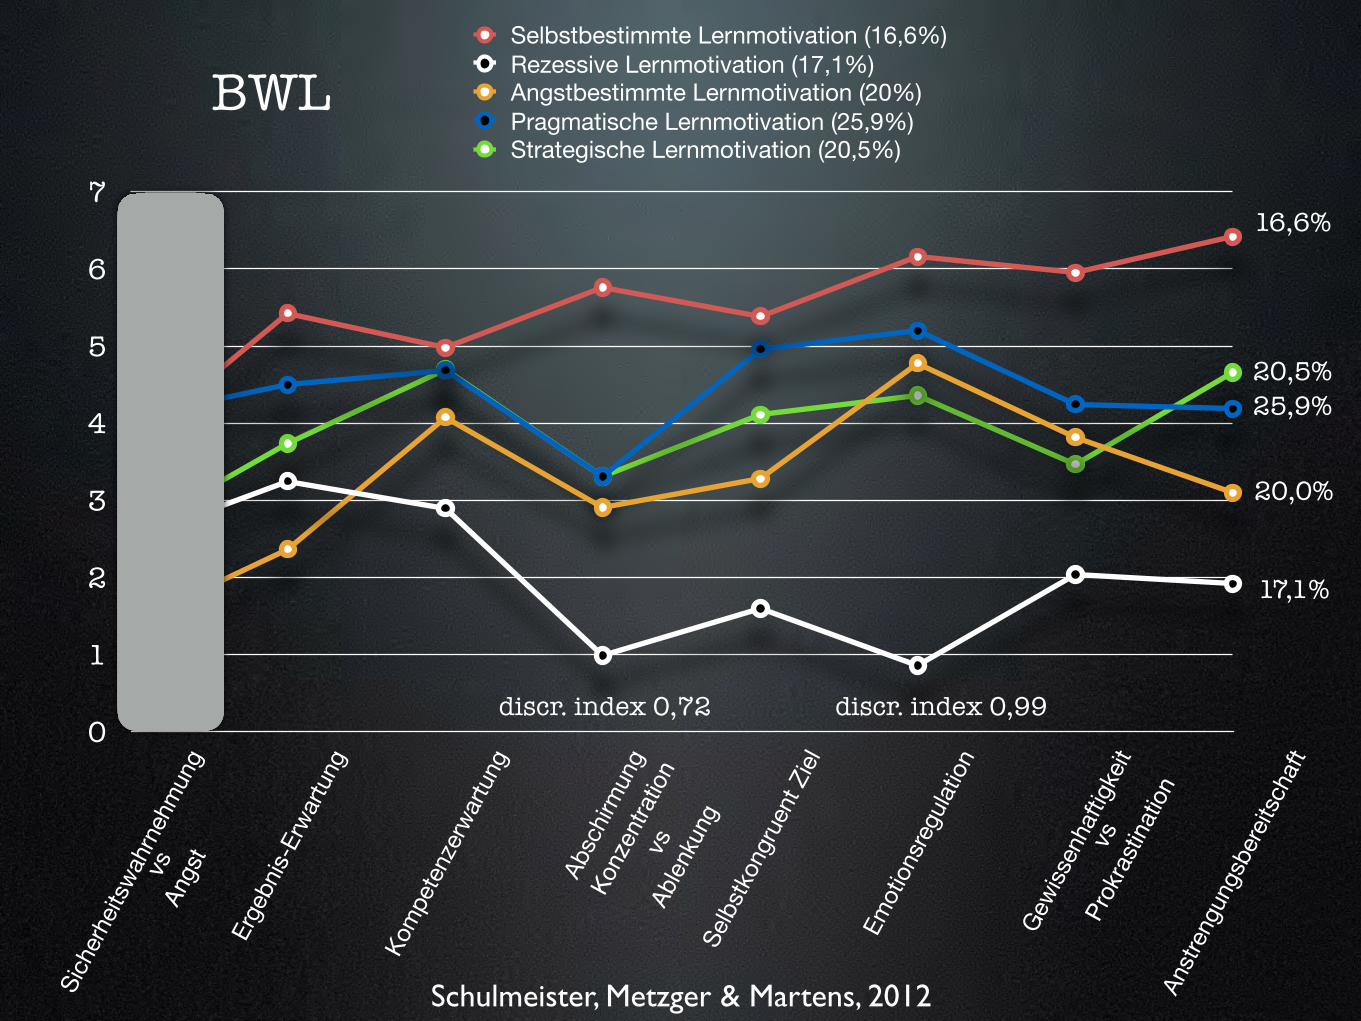
Selbstbestimmte Lernmotivation (16,6%)Rezessive Lernmotivation (17,1%)Angstbestimmte Lernmotivation (20%)Pragmatische Lernmotivation (25,9%)Strategische Lernmotivation (20,5%)
25,9%
16,6%
20,5%
20,0%
17,1%
discr. index 0,99discr. index 0,72
BWL
Schulmeister, Metzger & Martens, 2012
vs
Prok
rasti
natio
n
vsAn
gst
Konz
entra
tion
vsAb
lenku
ng
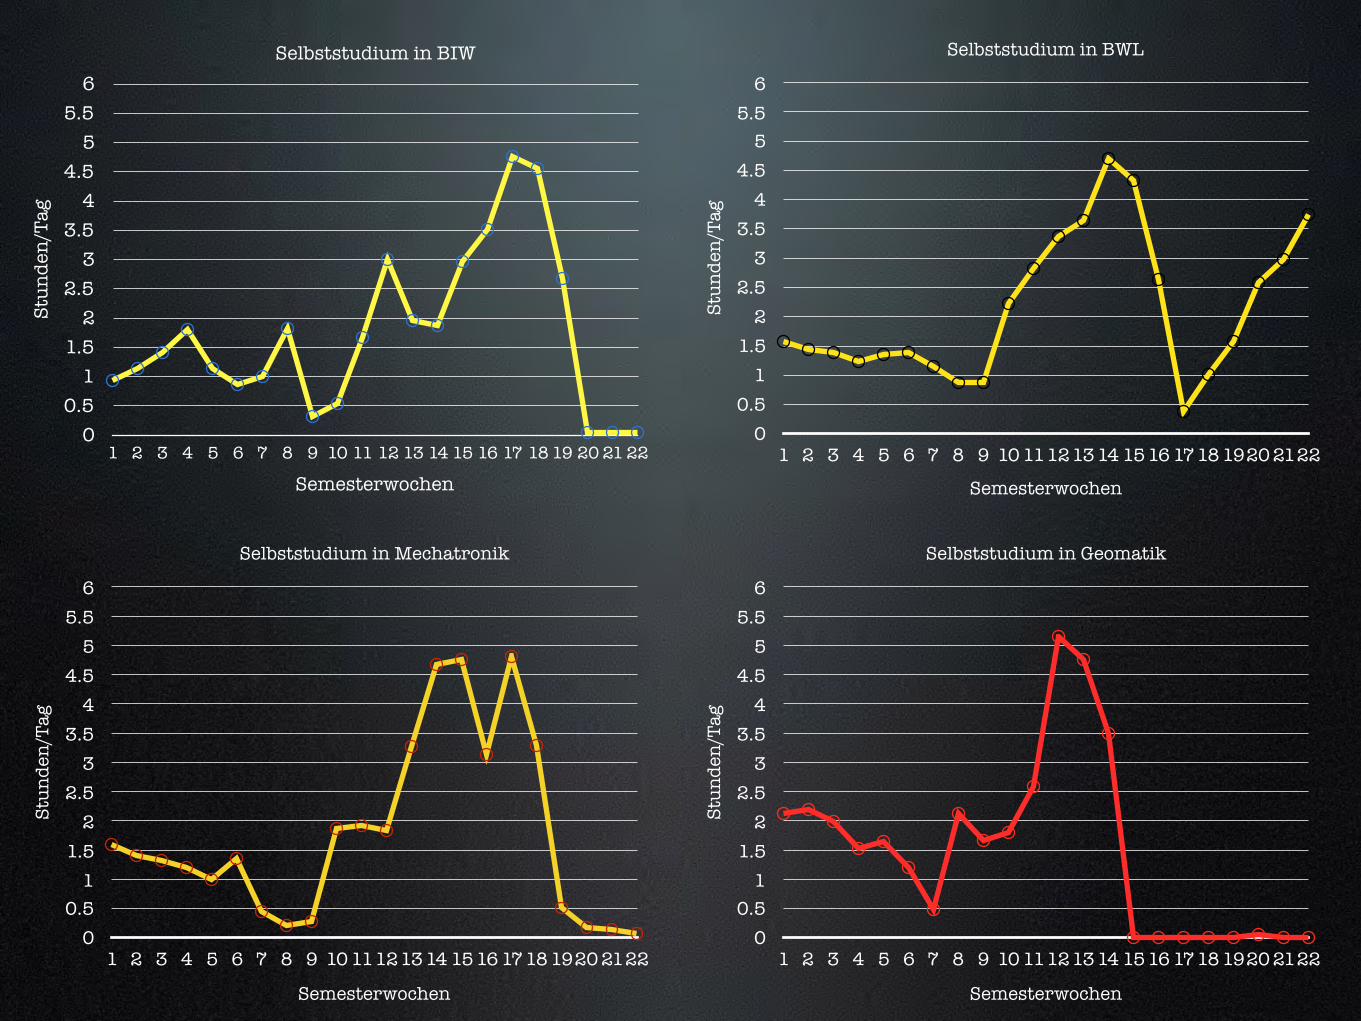
Selbststudium in BIWSt
unde
n/Ta
g
00.5
11.5
22.5
33.5
44.5
55.5
6
Semesterwochen1 2 3 4 5 6 7 8 9 10 11 12 13 14 15 16 17 18 19 20 21 22
Selbststudium in BWL
Stun
den/
Tag
00.5
11.5
22.5
33.5
44.5
55.5
6
Semesterwochen
1 2 3 4 5 6 7 8 9 10 1112 13 14 15 16 17 18 1920 2122
Selbststudium in Mechatronik
Stun
den/
Tag
00.5
11.5
22.5
33.5
44.5
55.5
6
Semesterwochen
1 2 3 4 5 6 7 8 9 10 1112 13 14 15 16 17 18 1920 2122
Selbststudium in Geomatik
Stun
den/
Tag
00.5
11.5
22.5
33.5
44.5
55.5
6
Semesterwochen
1 2 3 4 5 6 7 8 9 10 1112 13 14 15 16 17 18 1920 2122
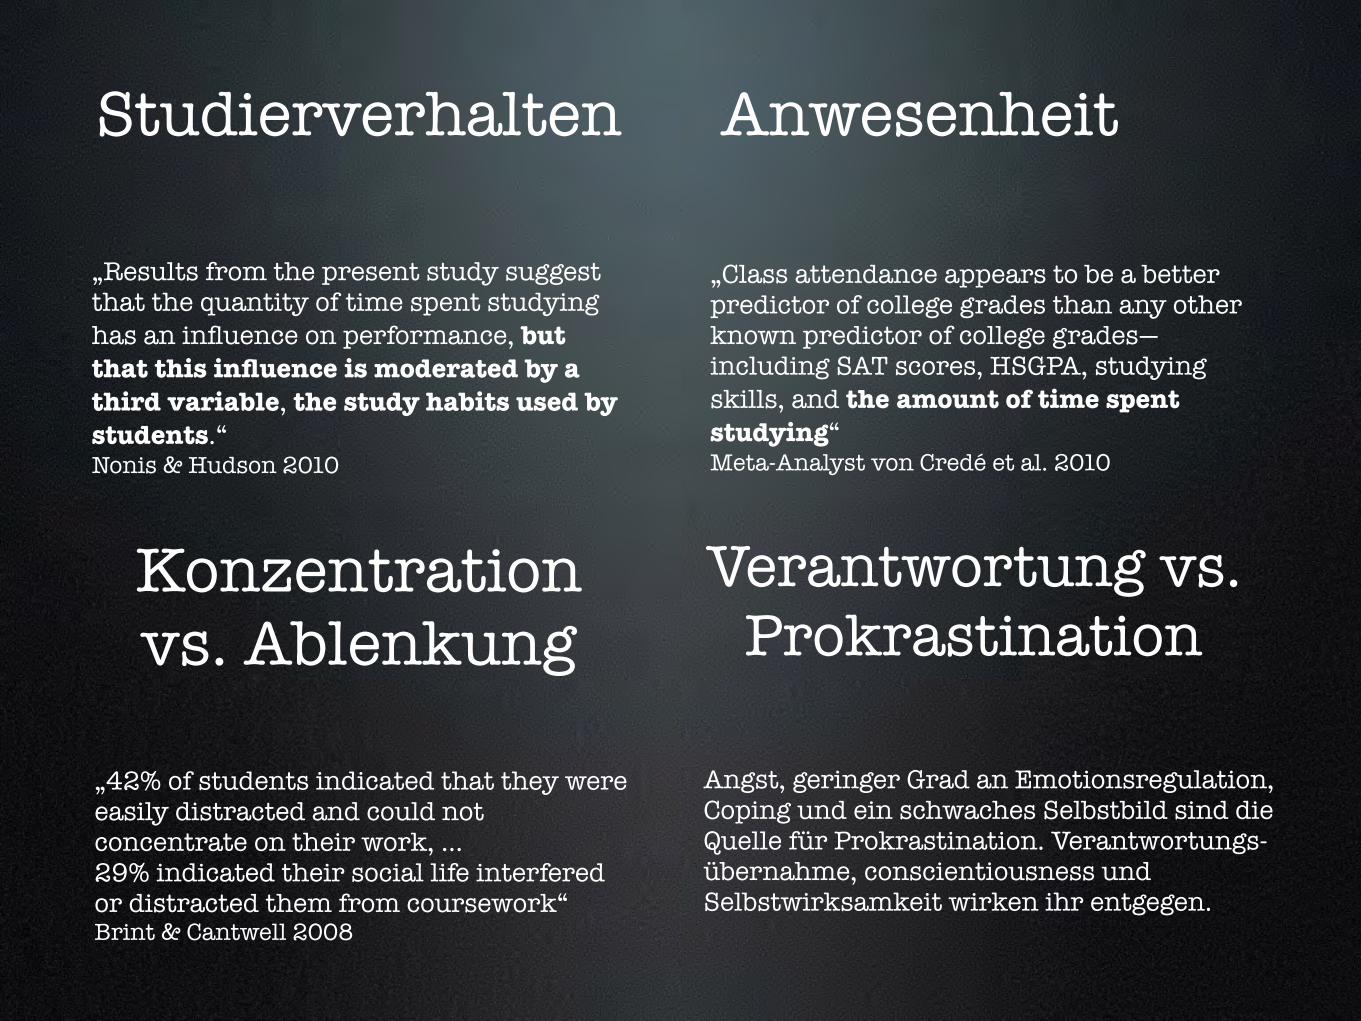
„Results from the present study suggest that the quantity of time spent studying has an influence on performance, but that this influence is moderated by a third variable, the study habits used by students.“ Nonis & Hudson 2010
Anwesenheit
„Class attendance appears to be a better predictor of college grades than any other known predictor of college grades—including SAT scores, HSGPA, studying skills, and the amount of time spent studying“ Meta-Analyst von Credé et al. 2010
Konzentration vs. Ablenkung
„42% of students indicated that they were easily distracted and could not concentrate on their work, … 29% indicated their social life interfered or distracted them from coursework“ Brint & Cantwell 2008
Verantwortung vs. Prokrastination
Angst, geringer Grad an Emotionsregulation, Coping und ein schwaches Selbstbild sind die Quelle für Prokrastination. Verantwortungs-übernahme, conscientiousness und Selbstwirksamkeit wirken ihr entgegen.
Studierverhalten
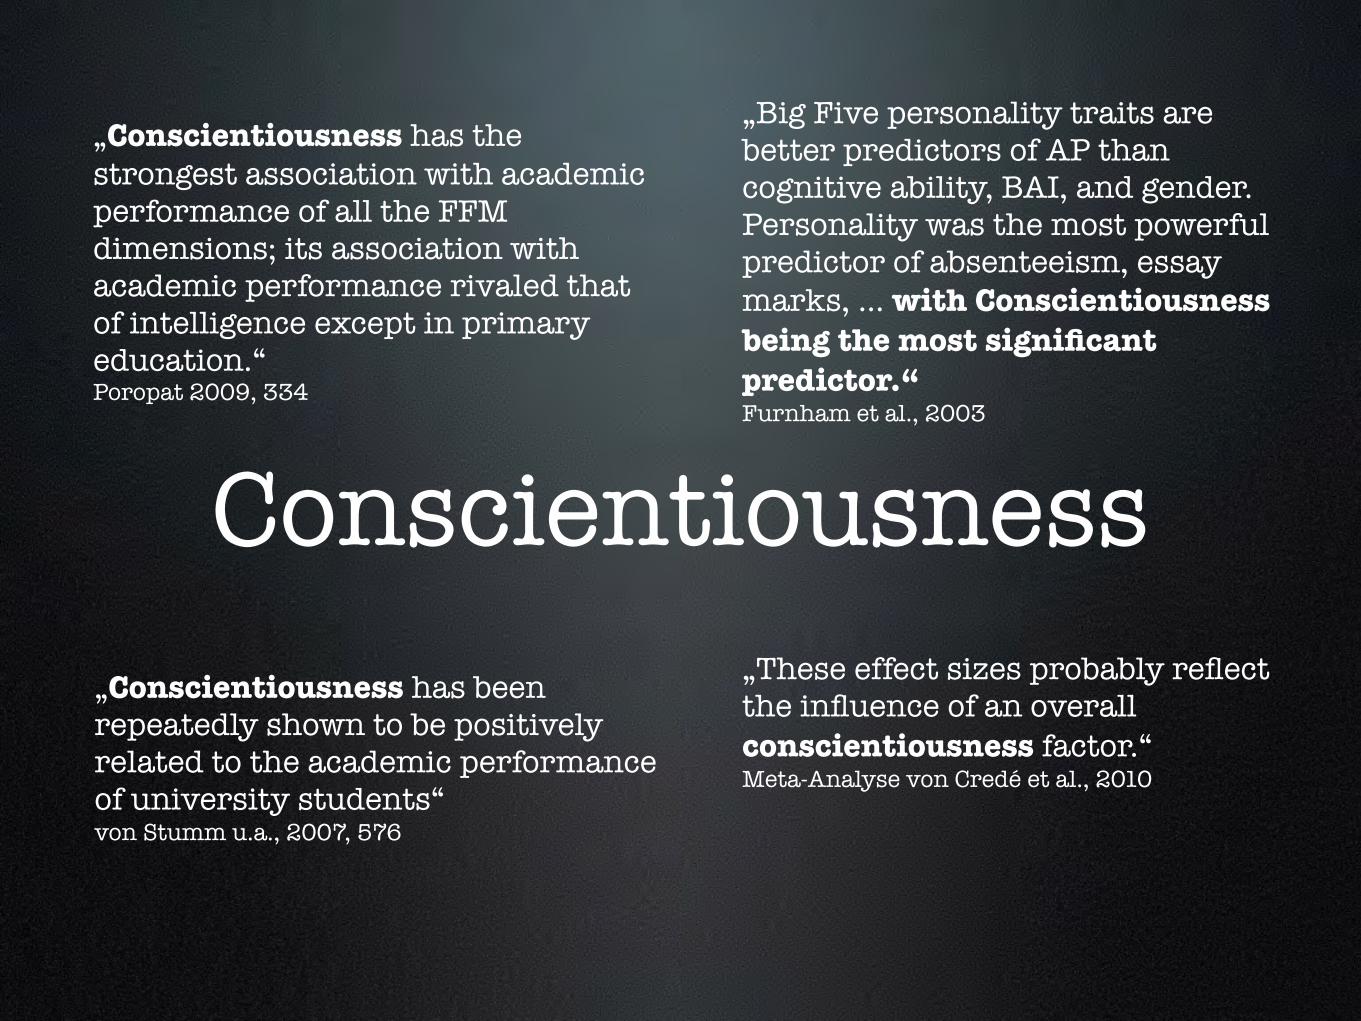
Conscientiousness
„Conscientiousness has the strongest association with academic performance of all the FFM dimensions; its association with academic performance rivaled that of intelligence except in primary education.“ Poropat 2009, 334
„Conscientiousness has been repeatedly shown to be positively related to the academic performance of university students“ von Stumm u.a., 2007, 576
„Big Five personality traits are better predictors of AP than cognitive ability, BAI, and gender. Personality was the most powerful predictor of absenteeism, essay marks, … with Conscientiousness being the most significant predictor.“ Furnham et al., 2003
„These effect sizes probably reflect the influence of an overall conscientiousness factor.“ Meta-Analyse von Credé et al., 2010
0
5
10
15
20
25
30
35
40
45
50KW
18KW
19KW
20KW
21KW
22KW
23KW
24KW
25KW
26KW
27KW
28KW
29KW
30KW
31KW
32KW
33KW
34KW
35KW
36KW
37KW
38KW
39
0
5
10
15
20
25
30
35
40
45
50
KW44
KW45
KW46
KW47
KW48
KW49
KW50
KW51
KW52
KW1
KW2
KW3
KW4
KW5
KW6
KW7
KW8
KW9
KW10
KW11
KW12
KW13
0
5
10
15
20
25
30
35
40
45
50
KW45
KW46
KW47
KW48
KW49
KW50
KW51
KW52
KW53
KW1
KW2
KW3
KW4
KW5
KW6
KW7
KW8
KW9
KW10
KW11
KW12
KW13
0
5
10
15
20
25
30
35
40
45
50
kw44kw
45kw
46kw
47kw
48kw
49kw
50kw
51kw
52kw1kw
2kw
3kw
4kw
5kw
6kw
7kw
8kw
9kw
10kw
11kw
12kw
13
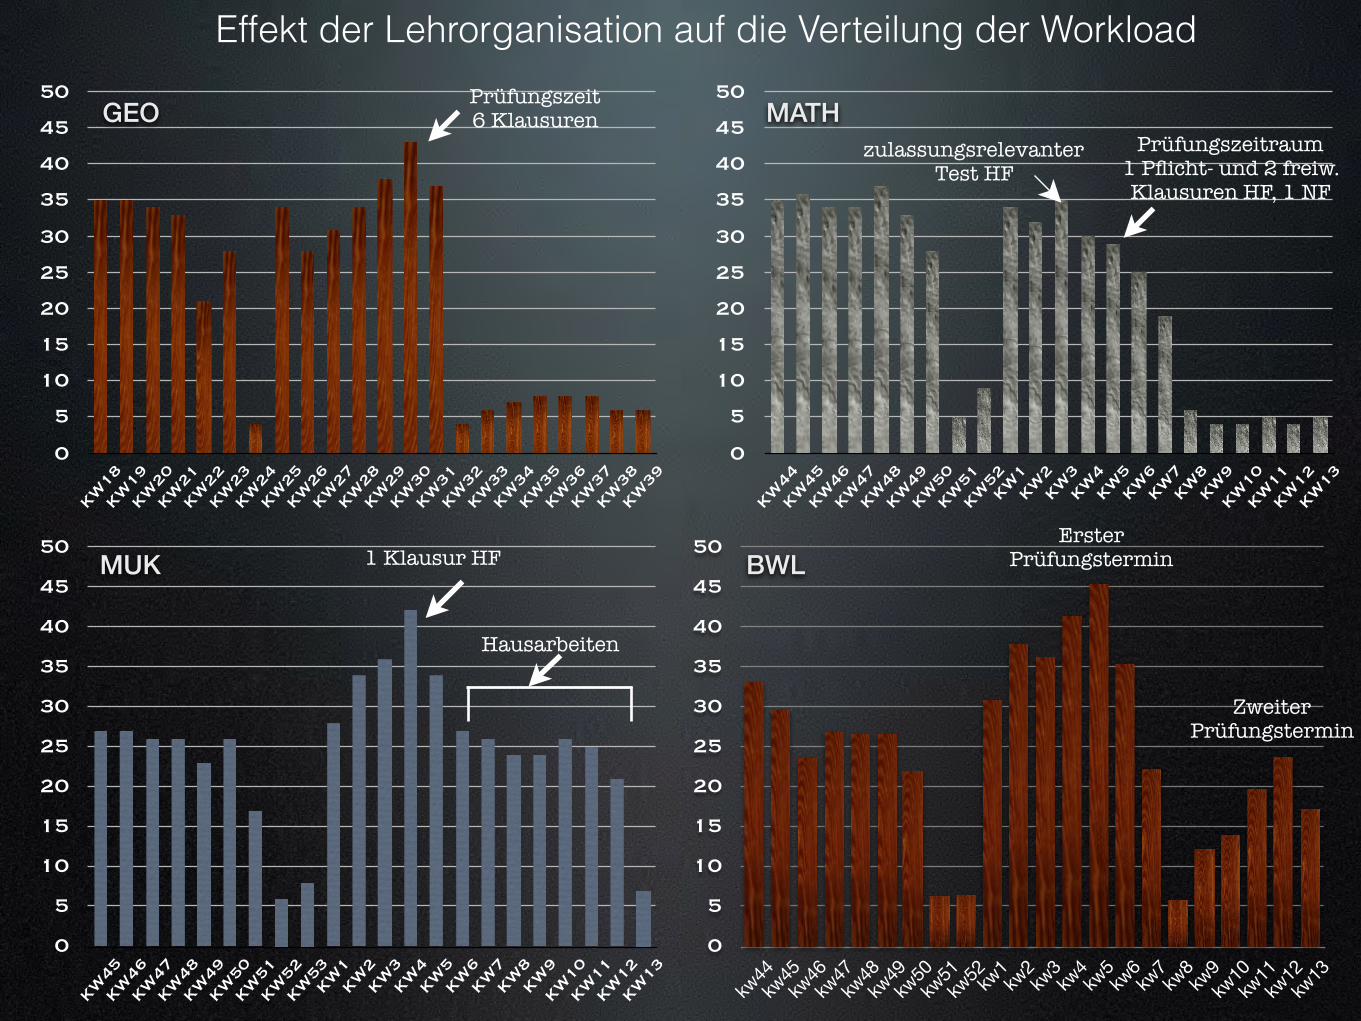
Prüfungszeit 6 Klausuren
zulassungsrelevanter Test HF
Prüfungszeitraum 1 Pflicht- und 2 freiw. Klausuren HF, 1 NF
1 Klausur HF
Hausarbeiten
Erster Prüfungstermin
Zweiter Prüfungstermin
GEO
BWLMUK
MATH
Effekt der Lehrorganisation auf die Verteilung der Workload
Stun
den
pro
Woc
he
0
11
22
33
44
55
66
77
88
99
110
Kw17Kw18
Kw19Kw20
Kw21Kw22
Kw23Kw24
Kw25Kw26
Kw27Kw28
Kw29Kw30
Kw31Kw32
Kw33Kw34
Kw35Kw36
Kw37Kw38
KW39
Kw 40
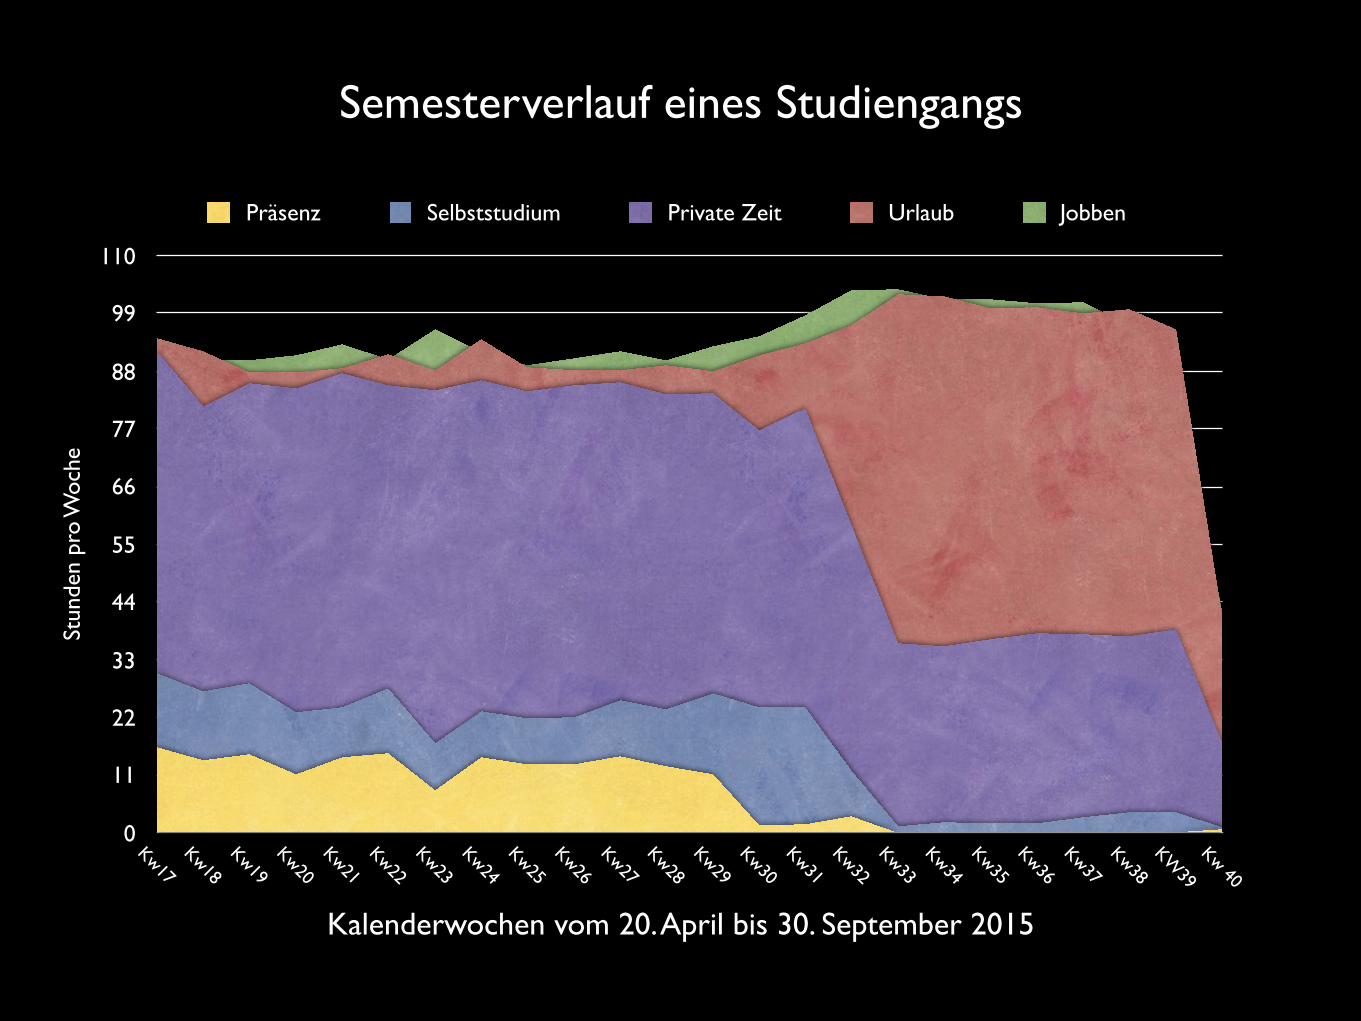
Präsenz Selbststudium Private Zeit Urlaub Jobben
Semesterverlauf eines Studiengangs
Kalenderwochen vom 20. April bis 30. September 2015
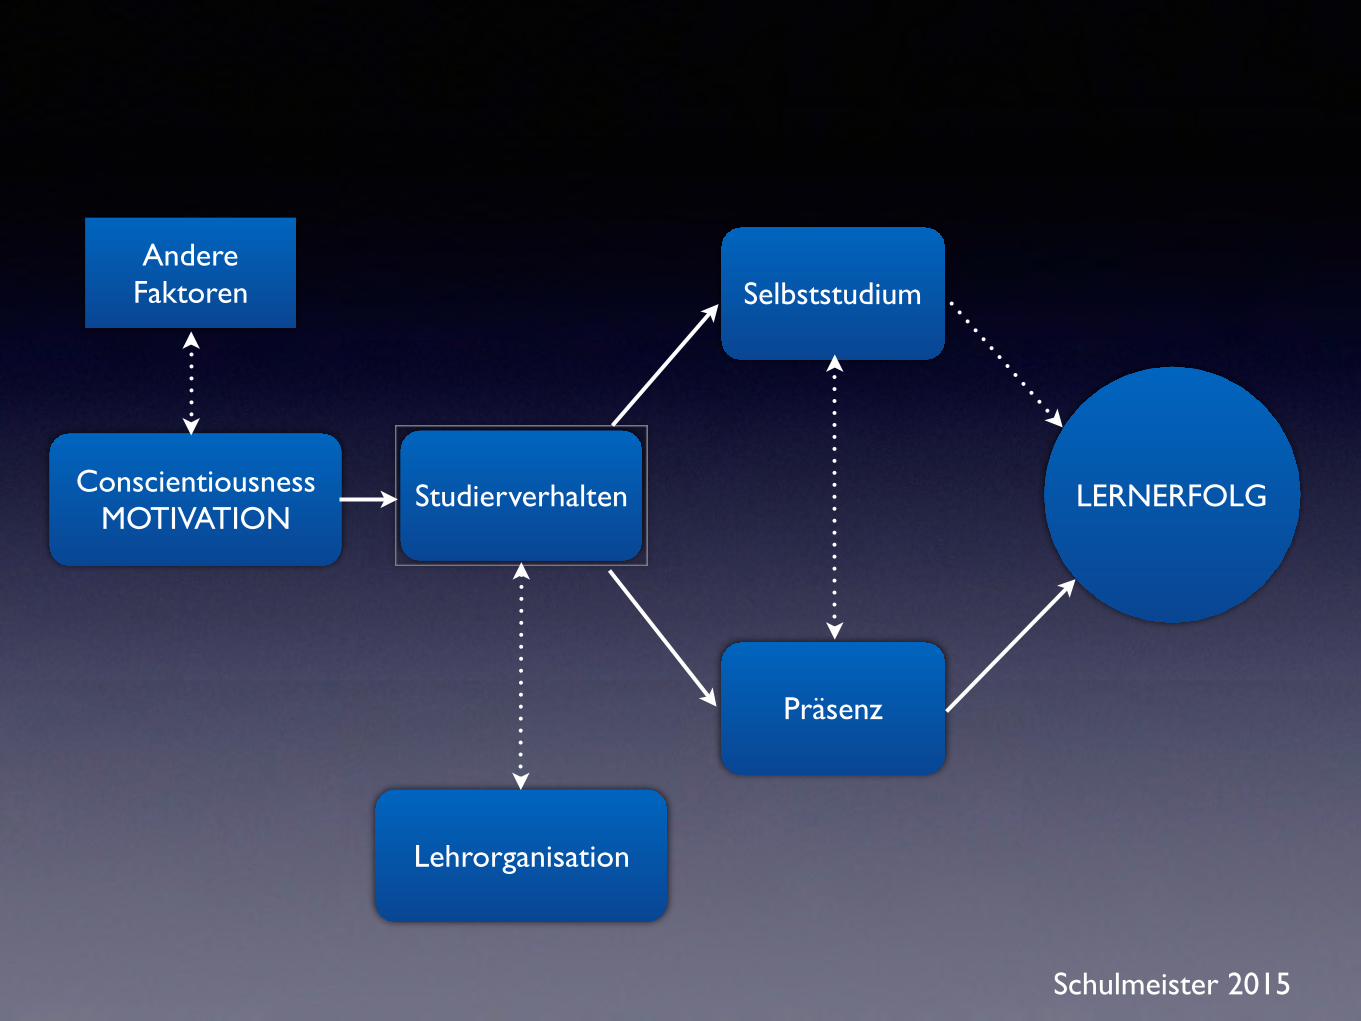
LERNERFOLGConscientiousnessMOTIVATION
Präsenz
Andere Faktoren Selbststudium
Studierverhalten
Lehrorganisation
Schulmeister 2015
Der „heimliche“ Effekt der Präsenz
Versuch einer Erklärung

Effekte der Präsenz 1: Sozialisation
Kontakt untereinander und zum Lehrenden
Eingebunden in Peer Group
Freunde gewinnen
Sozialer Vergleich
Campus-Kultur erfahren
Erwerb sozialer Rituale
Moralische Entwicklung
Politische Entwicklung
Festinger 1957; Perry 1970, 1981; Kohlberg 1981, 1983; Kuh u.a. 2006; Pascarella & Terenzini 1991, 2006
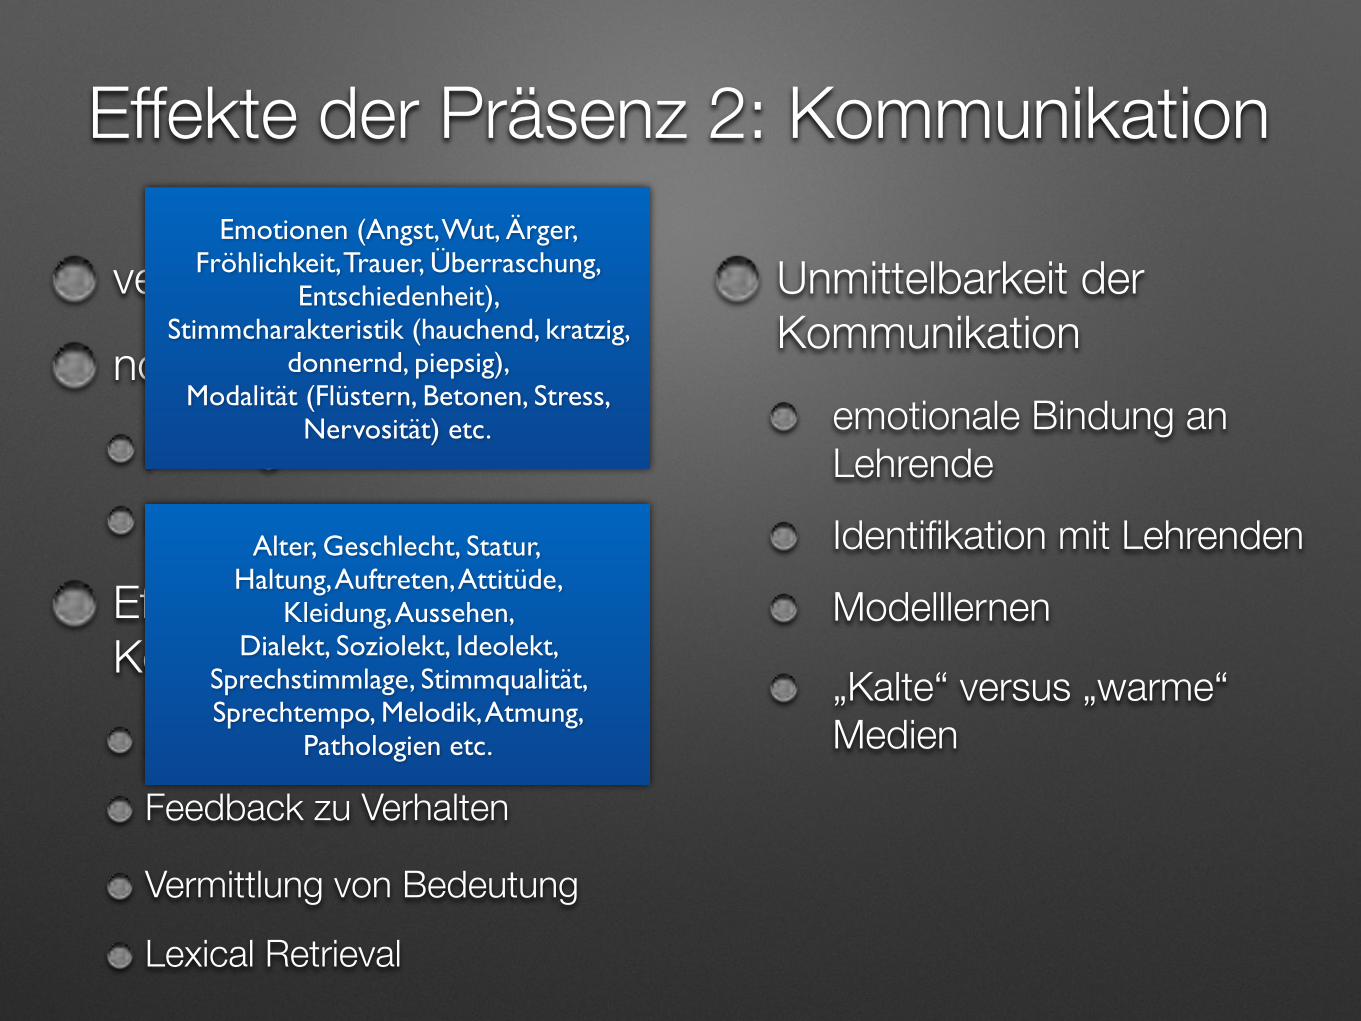
Effekte der Präsenz 2: Kommunikation
verbale Kommunikation
nonverbale Kommunikation paralinguistisch extralinguistisch
Effekte der nonverbalen Kommunikation
Aufmerksamkeit sichern
Feedback zu Verhalten
Vermittlung von Bedeutung
Lexical Retrieval
Unmittelbarkeit der Kommunikation
emotionale Bindung an Lehrende Identifikation mit Lehrenden Modelllernen
„Kalte“ versus „warme“ Medien
Emotionen (Angst, Wut, Ärger, Fröhlichkeit, Trauer, Überraschung,
Entschiedenheit), Stimmcharakteristik (hauchend, kratzig,
donnernd, piepsig), Modalität (Flüstern, Betonen, Stress,
Nervosität) etc.
Alter, Geschlecht, Statur,Haltung, Auftreten, Attitüde,
Kleidung, Aussehen, Dialekt, Soziolekt, Ideolekt,
Sprechstimmlage, Stimmqualität, Sprechtempo, Melodik, Atmung,
Pathologien etc.


![[Begleitetes] [Selbststudium und] [Selbststudium an ... · nünftiges Mass nicht überschreitet, empfahl die KFH z.B. ein Verhältnis von 40% Kon-takt- zu 60% Selbststudium (KFH 2004,](https://img.pdfslide.net/doc/110x75/5f89255096e05c4d2c0cc805/begleitetes-selbststudium-und-selbststudium-an-nnftiges-mass-nicht-berschreitet.jpg)