Embed Size (px)
Citation preview

Pre-Feasibility Study NI43-101 Technical Report
Cerro del Gallo Heap Leach Project Guanajuato, Mexico
Prepared for:
Prepared by:
Report Effective Date: 31 January 2020 Mineral Reserve Effective Date: 24 October 2019
Authors:
Carl Defilippi, Kappes, Cassiday & Associates, RM SME Thomas Dyer, Mine Development Associates, PE
Todd Minard, Golder Associates, PE (NV) Brian Arkel, Argonaut Gold, CPG
Neb Zurkic, Independent Consultant, CPG
Kappes, Cassiday & Associates 7950 Security Circle
Reno, NV 89506

Cerro del Gallo Heap Leach Project NI 43-101 Technical Report
January 31, 2020 Page i
Table of Contents 1 Summary ......................................................................................................................... 1-1
1.1 Introduction ............................................................................................................ 1-1
1.2 Property Description and Location ......................................................................... 1-1
1.3 Ownership ............................................................................................................. 1-2
1.4 Geology and Mineralization ................................................................................... 1-3
1.5 Drilling and Sample Analysis ................................................................................. 1-4
1.6 Mineral Processing and Metallurgical Test Work ................................................... 1-5
1.7 Mineral Resources ................................................................................................. 1-6
1.8 Mineral Reserves ................................................................................................... 1-8
1.9 Mining Methods ..................................................................................................... 1-9
1.10 Heap Leach Recovery Methods ........................................................................... 1-10
1.11 Infrastructure ....................................................................................................... 1-11
Power ......................................................................................................... 1-11
Water .......................................................................................................... 1-12
Project Buildings ......................................................................................... 1-12
Security ....................................................................................................... 1-13
1.12 Waste Disposal .................................................................................................... 1-13
Sewage ....................................................................................................... 1-13
Solid Waste ................................................................................................. 1-13
1.13 Environmental Studies, Permitting and Social Impact .......................................... 1-13
1.14 Capital and Operating Costs ................................................................................ 1-14
1.15 Economic Analysis ............................................................................................... 1-17
1.16 Conclusions ......................................................................................................... 1-22
1.17 Recommendations ............................................................................................... 1-24
2 Introduction and Terms of Reference ............................................................................... 2-1
2.1 Technical Report Preparation ................................................................................ 2-1
2.2 Qualified Persons and Site Visits ........................................................................... 2-3
2.3 Units of Measure ................................................................................................... 2-4
3 Reliance on Other Experts ............................................................................................... 3-1
4 Property Description and Location ................................................................................... 4-1

Cerro del Gallo Heap Leach Project NI 43-101 Technical Report
January 31, 2020 Page ii
4.1 Location ................................................................................................................. 4-1
4.2 Concessions .......................................................................................................... 4-2
4.3 Net Smelter Return Royalties ................................................................................ 4-4
5 Accessibility, Climate, Local Resources and Physiography .............................................. 5-1
Accessibility ........................................................................................................... 5-1
Physiography ......................................................................................................... 5-2
Climate .................................................................................................................. 5-3
6 History ............................................................................................................................. 6-1
6.1 Project History ....................................................................................................... 6-1
6.2 Historical Heap Leach Facility and Waste Rock Dump Geotechnical ..................... 6-5
Site Soil and Bedrock Geotechnical Characterization .................................... 6-5
Site Seismicity ............................................................................................. 6-11
7 Geological Setting and Mineralization .............................................................................. 7-1
7.1 Tectonic Setting ..................................................................................................... 7-1
7.2 Regional Geology .................................................................................................. 7-2
7.3 Local Geology ........................................................................................................ 7-3
Clastic Sedimentary and Volcanoclastic Sedimentary Host Rocks ................ 7-3
Felsic Intrusive Host Rocks ........................................................................... 7-4
7.4 Structural Geology ................................................................................................. 7-6
Post-mineral faulting ..................................................................................... 7-7
7.5 Mineralization ........................................................................................................ 7-7
7.6 Hydrothermal Alteration and Wall Rocks ................................................................ 7-9
8 Deposit Types .................................................................................................................. 8-1
8.1 Nearby Deposits .................................................................................................... 8-2
9 Exploration ....................................................................................................................... 9-1
10 Drilling ........................................................................................................................ 10-1
10.1 Type and Extent of Drilling ................................................................................... 10-1
10.2 Drilling, and Sampling Procedures ....................................................................... 10-1
Reverse Circulation (RC) Drilling – Cerro Resources (2004 -2008) ............. 10-1
Diamond Core Drilling – Cerro Resources (2004-2008), Primero ....................... Resources (2013-2014), & Argonaut (2018) ................................................ 10-2
10.3 Drilling Configuration ........................................................................................... 10-3
10.4 Survey Methods ................................................................................................... 10-4
Surface Survey Methods ............................................................................. 10-4

Cerro del Gallo Heap Leach Project NI 43-101 Technical Report
January 31, 2020 Page iii
Topography and Basement (Resource Volume) .......................................... 10-5
Down-hole Survey Methods ........................................................................ 10-5
Oriented Core ............................................................................................. 10-5
10.5 Geological Logging .............................................................................................. 10-5
11 Sample Preparation, Analyses and Security ............................................................... 11-1
11.1 Sample Security .................................................................................................. 11-1
11.2 Sample Preparation ............................................................................................. 11-1
11.3 Analytical Procedures .......................................................................................... 11-2
December 2004 to October 2013 ................................................................ 11-2
January 2013 to Present ............................................................................. 11-3
11.4 In-situ Bulk Density .............................................................................................. 11-4
11.5 QAQC results ...................................................................................................... 11-5
Duplicate Samples ...................................................................................... 11-5
Standards ................................................................................................. 11-11
Blanks ....................................................................................................... 11-24
Check Assays ........................................................................................... 11-28
11.6 QP Statement .................................................................................................... 11-30
12 Data Verification ......................................................................................................... 12-1
12.1 Pre-2013 Drill Hole Data ...................................................................................... 12-1
12.2 2019 Data Verification ......................................................................................... 12-2
Assays ........................................................................................................ 12-2
Drill Hole Collar Locations ........................................................................... 12-3
Downhole Surveys ...................................................................................... 12-3
12.3 QP’s Opinion ....................................................................................................... 12-3
12.4 Heap Leach Facility and Waste Rock Dump Geotechnical Information ................ 12-3
12.5 Metallurgical Test Data ........................................................................................ 12-4
13 Mineral Processing and Metallurgical Testing ............................................................. 13-1
13.1 Mineral Processing Summary .............................................................................. 13-1
13.2 Metallurgical Test Work Summary ....................................................................... 13-2
13.3 Historical Testing ................................................................................................. 13-3
13.4 Metallurgical Testing Pre-2015 ............................................................................ 13-3
13.4.1 Comminution Test Work .............................................................................. 13-4
13.4.2 High Pressure Grinding Roll (HPGR) Test Work ......................................... 13-4
13.4.3 Flotation Test Work ..................................................................................... 13-5

Cerro del Gallo Heap Leach Project NI 43-101 Technical Report
January 31, 2020 Page iv
13.4.4 Gravity Separation Test Work ..................................................................... 13-6
13.4.5 Agitated Cyanide Leach Test Work ............................................................. 13-6
13.4.6 Intermittent Bottle Roll Leach Test Work ..................................................... 13-6
13.4.7 Percolation Test Work ................................................................................. 13-7
13.4.8 Column Leach Test Work ............................................................................ 13-7
13.4.9 Merrill Crowe Test Work .............................................................................. 13-9
13.4.10 Carbon Adsorption Test Work ..................................................................... 13-9
13.4.11 SART Test Work ....................................................................................... 13-10
13.5 Metallurgical Testing 2018 and 2019 ................................................................. 13-11
13.6 On-Going Metallurgical Testing.......................................................................... 13-29
13.6.1 Bottle Roll Tests ........................................................................................ 13-29
13.6.2 Column Leach Tests ................................................................................. 13-32
13.6.3 SART Tests .............................................................................................. 13-33
13.7 Metal Recovery and Reagent Consumption Projections .................................... 13-35
13.7.1 Sulfur Overview ......................................................................................... 13-39
13.7.2 Head Grades versus Metal Extraction ....................................................... 13-42
14 Mineral Resource Estimate ......................................................................................... 14-1
14.1 Project Limits & Model Construction .................................................................... 14-1
14.2 Drill Hole Assay Statistics .................................................................................... 14-2
Univariate .................................................................................................... 14-4
Bivariate ...................................................................................................... 14-7
14.3 High-Grade Outlier Treatment ............................................................................. 14-7
14.4 Drill Hole Compositing ....................................................................................... 14-14
14.5 Spatial Analysis – Variography .......................................................................... 14-14
14.6 Digital Data ........................................................................................................ 14-19
Topography ............................................................................................... 14-20
14.7 Block Model Construction .................................................................................. 14-20
Model Extents ........................................................................................... 14-21
Model Coding ............................................................................................ 14-21
Bulk Density .............................................................................................. 14-21
14.8 Block Gold Grade Estimation ............................................................................. 14-22
Estimation Domains .................................................................................. 14-22
Interpolation Methods ................................................................................ 14-25
Parameter Array ........................................................................................ 14-25

Cerro del Gallo Heap Leach Project NI 43-101 Technical Report
January 31, 2020 Page v
Search Strategy ........................................................................................ 14-26
Oxidation Profiles ...................................................................................... 14-27
Volume...................................................................................................... 14-27
14.9 Model Validation ................................................................................................ 14-27
Swath Plots ............................................................................................... 14-28
14.10 Resource Classification ..................................................................................... 14-33
14.11 Mineral Resources ............................................................................................. 14-34
Cut-off Grades .......................................................................................... 14-34
Mining and Selectivity ............................................................................... 14-34
Mineral Resources .................................................................................... 14-37
14.12 General Discussion – Recommendations .......................................................... 14-39
Reduce Risk ............................................................................................. 14-39
To Increase Resource ............................................................................... 14-39
15 Mineral Reserve Estimate .......................................................................................... 15-1
15.1 Introduction .......................................................................................................... 15-1
15.2 Pit Optimization ................................................................................................... 15-1
Economic Parameters ................................................................................. 15-2
Slope Parameters ....................................................................................... 15-2
Pit Limitations.............................................................................................. 15-2
Pit-Optimization Results .............................................................................. 15-3
Pit-Shell Selection for Ultimate Pit Limits and Resources ............................ 15-4
15.3 Pit Designs .......................................................................................................... 15-6
Bench Height .............................................................................................. 15-6
Pit Slopes .................................................................................................... 15-7
Haulage Roads ........................................................................................... 15-8
Ultimate Pit ................................................................................................. 15-9
Pit Phasing ................................................................................................ 15-10
15.4 Cutoff Grade ...................................................................................................... 15-13
15.5 Dilution .............................................................................................................. 15-14
15.6 Reserves and Resources ................................................................................... 15-15
16 Mining Methods .......................................................................................................... 16-1
16.1 Mining Method ..................................................................................................... 16-1
16.2 Mine Waste Facilities ........................................................................................... 16-1
16.3 Mine-Production Schedule ................................................................................... 16-3

Cerro del Gallo Heap Leach Project NI 43-101 Technical Report
January 31, 2020 Page vi
16.4 Equipment Requirements .................................................................................... 16-7
16.5 Mine Personnel .................................................................................................. 16-10
17 Recovery Methods ..................................................................................................... 17-1
17.1 Summary ............................................................................................................. 17-1
17.2 Processing ........................................................................................................... 17-5
Crushing ..................................................................................................... 17-5
Heap Conveying and Stacking .................................................................... 17-6
Heap Leaching ............................................................................................ 17-6
Heap Leach Facility Design ......................................................................... 17-7
Process Water Balance ............................................................................. 17-12
SART ........................................................................................................ 17-16
Metal Recovery ......................................................................................... 17-21
Reagents .................................................................................................. 17-25
18 Project Infrastructure .................................................................................................. 18-1
18.1 Roads .................................................................................................................. 18-1
Site Roads .................................................................................................. 18-1
18.2 Power Supply and Distribution ............................................................................. 18-2
Estimated Power Consumption ................................................................... 18-2
18.3 Water Supply and Distribution ............................................................................. 18-3
Process Water ............................................................................................ 18-4
Raw Water .................................................................................................. 18-5
Potable Water ............................................................................................. 18-5
Fire Water ................................................................................................... 18-5
18.4 Project Buildings .................................................................................................. 18-5
18.5 Explosives Storage .............................................................................................. 18-5
18.6 Security ............................................................................................................... 18-6
18.7 Waste Disposal .................................................................................................... 18-6
Sewage ....................................................................................................... 18-6
Solid Waste ................................................................................................. 18-6
19 Market Studies and Contracts .................................................................................... 19-1
20 Environmental Studies, Permitting and Social Impact ................................................. 20-1
20.1 Waste Management ............................................................................................. 20-1
20.1.1 Mining Waste .............................................................................................. 20-1
20.1.2 Hazardous and Non-Hazardous Waste Management ................................. 20-2
Cerro del Gallo Heap Leach Project NI 43-101 Technical Report
January 31, 2020 Page vii
20.1.3 Waste Water ............................................................................................... 20-3
20.1.4 Air Emissions .............................................................................................. 20-3
20.2 Water Management ............................................................................................. 20-3
20.3 Environmental Regulatory Framework ................................................................. 20-4
20.4 Social Management Plan and Community Relations ............................................ 20-7
20.5 Closure and Reclamation Plan............................................................................. 20-8
20.6 Site Monitoring ..................................................................................................... 20-9
21 Capital and Operating Costs ....................................................................................... 21-1
21.1 Summary ............................................................................................................. 21-1
21.2 Capital Costs ....................................................................................................... 21-2
Mine Capital Costs ...................................................................................... 21-4
Process & Infrastructure .............................................................................. 21-5
Spare Parts ............................................................................................... 21-11
Indirect Costs ............................................................................................ 21-11
Other Owner’s Construction Costs ............................................................ 21-11
Initial Fills Inventory................................................................................... 21-12
Engineering and Construction ................................................................... 21-12
Contingency .............................................................................................. 21-12
Sustaining Capital Costs ........................................................................... 21-13
Working Capital ......................................................................................... 21-15
Exclusions ................................................................................................. 21-15
21.3 Operating Costs ................................................................................................. 21-15
Mine Operating Costs ............................................................................... 21-16
Process and G&A Operating Costs ........................................................... 21-24
General and Administrative ....................................................................... 21-29
22 Economic Analysis ..................................................................................................... 22-1
Summary ............................................................................................................. 22-1
Methodology ........................................................................................................ 22-4
General Assumptions .................................................................................. 22-4
Capital Expenditures ............................................................................................ 22-6
Royalties .............................................................................................................. 22-6
Operating Costs ................................................................................................... 22-6
Closure Costs ...................................................................................................... 22-6
Taxation ............................................................................................................... 22-6

Cerro del Gallo Heap Leach Project NI 43-101 Technical Report
January 31, 2020 Page viii
Value Added Tax (IVA) ............................................................................... 22-6
Federal Income Tax .................................................................................... 22-7
Special Mining Tax ...................................................................................... 22-7
Depreciation ................................................................................................ 22-7
Loss Carry Forward..................................................................................... 22-7
Economic Model & Cash Flow ............................................................................. 22-7
Sensitivity ............................................................................................................ 22-9
23 Adjacent Properties .................................................................................................... 23-1
24 Other Relevant Data and Information ......................................................................... 24-1
24.1 Hydrology and Hydrogeology ............................................................................... 24-1
24.2 Project Implementation ........................................................................................ 24-5
24.3 Opportunities and Risks ....................................................................................... 24-8
Mineral Resource Growth and Mineral Resource Conversion ..................... 24-8
Metallurgy and Processing .......................................................................... 24-8
Mining ....................................................................................................... 24-10
Water Supply ............................................................................................ 24-10
Power Supply ............................................................................................ 24-10
24.4 Cautionary Statements ...................................................................................... 24-11
Forward Looking Information ..................................................................... 24-11
Non-IFRS Measures ................................................................................. 24-12
25 Interpretations and Conclusions ................................................................................. 25-1
26 Recommendations ..................................................................................................... 26-1
26.1 KCA Recommendations....................................................................................... 26-1
26.2 Argonaut Recommendations ............................................................................... 26-1
26.3 Golder Recommendations ................................................................................... 26-2
27 References ................................................................................................................. 27-1
28 Date and Signature Page ........................................................................................... 28-1

Cerro del Gallo Heap Leach Project NI 43-101 Technical Report
January 31, 2020 Page ix
Table of Tables Table 1.5.1 Drilling Campaigns by Year, Company and Type ................................................ 1-4 Table 1.6.1 Cerro del Gallo Recoveries by Material Type ...................................................... 1-5 Table 1.6.2 Cerro del Gallo Reagent Consumptions by Material Type ................................... 1-6 Table 1.7.1 Undiluted Contained Mineral Resources with $1,600 Conceptual Pit ................... 1-7 Table 1.8.1 Proven and Probable Reserves ........................................................................... 1-9 Table 1.10.1 Summary of Metal Production by Year ............................................................ 1-11 Table 1.14.1 Summary of Pre-Production Capital Costs by Area ......................................... 1-15 Table 1.14.2 Capital Cost Summary - LOM .......................................................................... 1-16 Table 1.14.3 LOM Operating Cost Summary ....................................................................... 1-16 Table 1.15.1 Key Economic Parameters .............................................................................. 1-18 Table 1.15.2 Economic Analysis Summary .......................................................................... 1-19 Table 1.15.3 After-Tax Sensitivity Analysis Results .............................................................. 1-20 Table 2.1.1 Cerro del Gallo Technical Report Contributors .................................................... 2-2 Table 2.3.1 Cerro del Gallo Units of Measure and Abbreviations ........................................... 2-4 Table 4.2.1 Concession Status .............................................................................................. 4-3 Table 5.3.1 Cerro del Gallo Average and Extreme Precipitation ............................................. 5-3 Table 6.2.1 Summary of Probabilistic Seismic Hazard Assessment for Project Site ............. 6-12 Table 10.1.1 Drilling Campaigns by Year, Company and Type ............................................ 10-1 Table 11.4.1 Density Measurements within Block Model Project Limits................................ 11-5 Table 11.5.1 Certified Values of Standard Samples ........................................................... 11-12 Table 11.5.2 Certified Values of Standard Samples ........................................................... 11-20 Table 13.2.1 Cerro del Gallo Recoveries by Material Type .................................................. 13-2 Table 13.2.2 Cerro del Gallo Reagent Consumptions by Material Type ............................... 13-3 Table 13.4.1 Cerro del Gallo Comminution Test Work Results ............................................. 13-4 Table 13.4.2 Cerro del Gallo Bond Ball Mill Work Index Results Summary .......................... 13-4 Table 13.4.3 Cerro del Gallo Single Pass HPGR Test Work ................................................ 13-5 Table 13.4.4 Cerro del Gallo Closed Circuit HPGR Test Work Results ................................ 13-5 Table 13.4.5 Cerro del Gallo HPGR Wear Rate Test Work Results ..................................... 13-5 Table 13.4.6 Cerro del Gallo Average Cleaner Flotation Test Results .................................. 13-5 Table 13.4.7 Cerro del Gallo Average Gravity Separation Results ....................................... 13-6 Table 13.4.8 Cerro del Gallo Average Agitated Cyanide Leaches ........................................ 13-6 Table 13.4.9 Cerro del Gallo Intermittent Bottle Roll Cyanide Leach Results ....................... 13-7 Table 13.4.10 Cerro del Gallo Column Leach Results .......................................................... 13-7 Table 13.4.11 Cerro del Gallo Column Leach – Conventional versus HPGR Crushing ........ 13-9 Table 13.4.12 Cerro del Gallo Column Leach – Ore Types .................................................. 13-9 Table 13.4.13 Cerro del Gallo Carbon Contact Results Summary ...................................... 13-10 Table 13.4.14 Cerro del Gallo SART Results ..................................................................... 13-10 Table 13.4.15 Cerro del Gallo SART Solution Carbon Adsorption ...................................... 13-11 Table 13.5.1 Cerro del Gallo KCA Laboratory Gold and Silver Head Assays ..................... 13-11 Table 13.5.2 Cerro del Gallo KCA Laboratory Copper, Lead and Zinc ............................... 13-12 Table 13.5.3 Cerro del Gallo KCA Laboratory Carbon and Sulfur....................................... 13-12

Cerro del Gallo Heap Leach Project NI 43-101 Technical Report
January 31, 2020 Page x
Table 13.5.4 Cerro del Gallo KCA Laboratory Mercury and Copper ................................... 13-13 Table 13.5.5 Cerro del Gallo KCA Laboratory Multi-Element Analysis (1 of 2) ................... 13-14 Table 13.5.6 Cerro del Gallo KCA Laboratory Multi-Element Analysis (2 of 2) ................... 13-15 Table 13.5.7 Cerro del Gallo KCA Laboratory Whole Rock Analyses (1 of 2) ..................... 13-16 Table 13.5.8 Cerro del Gallo KCA Laboratory Whole Rock Analyses (2 of 2) ..................... 13-17 Table 13.5.9 Cerro del Gallo KCA Comminution Test Results ............................................ 13-18 Table 13.5.10 Cerro del Gallo KCA HPGR Crushing Test Results ..................................... 13-19 Table 13.5.11 Cerro del Gallo KCA Laboratory Bottle Roll Leach Tests – Gold and Silver . 13-20 Table 13.5.12 Cerro del Gallo KCA Laboratory Bottle Roll Leach Tests – Copper ............. 13-21 Table 13.5.13 Cerro del Gallo KCA Laboratory Compacted Permeability Test Results ...... 13-23 Table 13.5.14 Cerro del Gallo KCA Laboratory Column Leach Test Summary ................... 13-25 Table 13.5.15 Cerro del Gallo Current Test Work Conventional versus HPGR Crushing ... 13-25 Table 13.5.16 Cerro del Gallo Historical Test Work Conventional versus HPGR Crushing 13-26 Table 13.6.1 Cerro del Gallo KCA Laboratory Bottle Roll Test Results .............................. 13-30 Table 13.6.2 Cerro del Gallo KCA Laboratory Bottle Roll Test Results Comparison........... 13-31 Table 13.6.3 Cerro del Gallo KCA Laboratory Column Leach Test Interim Results ............ 13-32 Table 13.6.4 Cerro del Gallo KCA Laboratory Column Leach Test Interim Results ..................... Comparison ................................................................................................... 13-32 Table 13.6.5 Cerro del Gallo KCA Laboratory SART Interim Results ................................. 13-33 Table 13.6.6 Cerro del Gallo KCA Laboratory SART Copper Precipitate Results ............... 13-34 Table 13.7.1 Cerro del Gallo Leach Test Work Overall Summary – Conventional Crush ... 13-36 Table 13.7.2 Cerro del Gallo Leach Test Work Overall Summary – HPGR Crush .............. 13-37 Table 13.7.3 Cerro del Gallo Heap Leach Recovery Projections ........................................ 13-38 Table 13.7.4 Cerro del Gallo Heap Leach Projected Reagent Consumptions .................... 13-38 Table 14.7.1 Model Extents ................................................................................................ 14-21 Table 14.7.2 Block Model Items ......................................................................................... 14-21 Table 14.7.3 Number of Composites Used in Estimate ...................................................... 14-22 Table 14.8.1 Other Relevant Parameters Used in Estimate ............................................... 14-26 Table 14.11.1 Conceptual Resource Pit Parameters .......................................................... 14-37 Table 14.11.2 Undiluted Contained Mineral Resources with $1,600 Conceptual Pit ........... 14-38 Table 15.2.1 Economic Parameters ..................................................................................... 15-2 Table 15.2.2 Whittle Pit Optimization Results ....................................................................... 15-4 Table 15.2.3 Pit by Pit Results ............................................................................................. 15-5 Table 15.3.1 Pit Design Slope Parameters ........................................................................... 15-7 Table 15.4.1 Cutoff Grades ................................................................................................ 15-14 Table 15.6.1 Proven and Probable Reserves ..................................................................... 15-17 Table 15.6.2 Proven and Probable Reserves by Pit Phase ................................................ 15-18 Table 16.2.1 Waste Placement Volumes .............................................................................. 16-2 Table 16.2.2 Waste Rock Dump Design Criteria .................................................................. 16-3 Table 16.3.1 Annual Mine Production Schedule ................................................................... 16-4 Table 16.3.2 Process Production Schedule .......................................................................... 16-5 Table 16.3.3 Stockpile Balance ............................................................................................ 16-6 Table 16.4.1 Annual Equipment Requirements .................................................................... 16-9 Table 16.5.1 Mine Personnel Requirements ...................................................................... 16-11

Cerro del Gallo Heap Leach Project NI 43-101 Technical Report
January 31, 2020 Page xi
Table 17.1.1 Cerro del Gallo Process Design Criteria Summary .......................................... 17-2 Table 17.2.1 Total Required Storage Volumes ................................................................... 17-14 Table 17.2.2 Designed Pond Storage Volumes .................................................................. 17-15 Table 17.2.3 Make-up Water During Average Climate Conditions ...................................... 17-15 Table 17.2.4 Make-up Water During the 1 in 100 Dry Year Climate Conditions.................. 17-16 Table 18.2.1 Project Electrical Power Consumption – LOM Average ................................... 18-3 Table 18.3.1 Water Rights and Volumes .............................................................................. 18-3 Table 21.1.1 LOM Capital Cost Summary ............................................................................ 21-1 Table 21.1.2 LOM Operating Cost Summary ....................................................................... 21-1 Table 21.2.1 Summary of Pre-Production Capital Costs by Area ......................................... 21-3 Table 21.2.2 Mine Annual Capital Costs (000’s USD) .......................................................... 21-4 Table 21.2.3 Summary of Process & Infrastructure Pre-Production Capital Costs by .................. Discipline ......................................................................................................... 21-6 Table 21.2.4 Cerro del Gallo Earthworks/Liners/Materials Unit Costs .................................. 21-7 Table 21.2.5 Cerro del Gallo Buildings ............................................................................... 21-10 Table 21.2.6 Process Mobile Equipment ............................................................................ 21-11 Table 21.2.7 Process and Infrastructure Contingency ........................................................ 21-13 Table 21.2.8 Sustaining Capital Costs by Year .................................................................. 21-14 Table 21.3.1 Contract Proposal Unit Rates ........................................................................ 21-17 Table 21.3.2 Annual Mine Operating Costs ........................................................................ 21-20 Table 21.3.3 Contractor Mine Production Summary ........................................................... 21-20 Table 21.3.4 Annual Drilling Costs ..................................................................................... 21-21 Table 21.3.5 Annual Blasting Costs ................................................................................... 21-21 Table 21.3.6 Annual Loading Costs ................................................................................... 21-21 Table 21.3.7 Annual Haulage Costs ................................................................................... 21-22 Table 21.3.8 Annual Mine Support Costs ........................................................................... 21-22 Table 21.3.9 Re-Handle Tonnages and Costs.................................................................... 21-22 Table 21.3.10 Annual Mine General Services Costs .......................................................... 21-23 Table 21.3.11 LOM Average Process, Support & G&A Operating Costs ............................ 21-24 Table 21.3.12 Cerro del Gallo Staffing Levels and Salary Schedules ................................. 21-29 Table 22.1.1 Key Economic Parameters .............................................................................. 22-2 Table 22.1.2 Economic Analysis Summary .......................................................................... 22-3 Table 22.8.1 Cashflow Model Summary ............................................................................... 22-8 Table 22.9.1 After-Tax Sensitivity Analysis Results ............................................................ 22-10 Table 24.2.1 Cerro del Gallo Average Precipitation .............................................................. 24-1 Table 24.2.2 Cerro del Gallo Well (450-meter Depth) Pump Test Results ............................ 24-3 Table 24.2.3 Cerro del Gallo Well (204m Depth) Pump Test Results ................................... 24-4

Cerro del Gallo Heap Leach Project NI 43-101 Technical Report
January 31, 2020 Page xii
Table of Figures Figure 1.2.1 Location Map of the Cerro del Gallo Property in Guanajuato .............................. 1-2 Figure 1.15.1 After Tax Sensitivity – IRR .............................................................................. 1-21 Figure 1.15.2 After Tax Sensitivity – NPV @ 5% .................................................................. 1-21 Figure 4.1.1 Location Map of the Cerro del Gallo Property in Guanajuato .............................. 4-2 Figure 4.2.1 Argonaut Concessions ....................................................................................... 4-3 Figure 5.1.1 Cerro del Gallo Accessibility ............................................................................... 5-1 Figure 5.2.1 View looking Southwest at Cerro del Gallo ......................................................... 5-2 Figure 7.1.1 Tectono-stratigraphic Terranes .......................................................................... 7-1 Figure 7.2.1 Regional Geology ............................................................................................... 7-3 Figure 7.3.1 Oxidized Outcrop along Intrusive Margin (1 to 3 g/t Au) ..................................... 7-4 Figure 7.3.2 Mineralized Quartz Veining in Weathered Zone Outward from ................................ Intrusive(+/-0.7 g/t Au) ....................................................................................... 7-5 Figure 7.3.3 Local Geology .................................................................................................... 7-6 Figure 7.6.1 Mineralization Trend by Directional Domains ................................................... 7-10 Figure 10.3.1 Plan (2,120m level) 0.2 & 0.7 g/t Au Leapfrog Shells, Intrusive (grey) & ................ NW Structures ............................................................................................... 10-4 Figure 11.5.1 Field Re-splits – Gold ..................................................................................... 11-7 Figure 11.5.2 Field Re-splits – Silver .................................................................................... 11-8 Figure 11.5.3 Field Re-splits – Copper ................................................................................. 11-9 Figure 11.5.4 Lab Re-splits – Gold ..................................................................................... 11-10 Figure 11.5.5 Lab Re-splits – Silver ................................................................................... 11-10 Figure 11.5.6 Lab Re-splits – Copper ................................................................................. 11-11 Figure 11.5.7 CRM Standard Graphs - Cerro 2004-2008 ................................................... 11-13 Figure 11.5.8 CRM Standard Graphs - Cerro 2004-2008 (Continued) ................................ 11-14 Figure 11.5.9 CRM Standard Graphs - Cerro 2004-2008 (Continued) ................................ 11-15 Figure 11.5.10 CRM Standard Graphs - Cerro 2004-2008 (Continued) .............................. 11-16 Figure 11.5.11 CRM Standard Graphs - Cerro 2004-2008 (Continued) .............................. 11-17 Figure 11.5.12 CRM Standard Graphs - Cerro 2004-2008 (Continued) .............................. 11-18 Figure 11.5.13 CRM Standard Graphs - Cerro 2004-2008 (Continued) .............................. 11-19 Figure 11.5.14 CRM Standard Graphs – Primero 2013 ...................................................... 11-20 Figure 11.5.15 CRM Standard Graphs – Primero 2013 (Continued) .................................. 11-21 Figure 11.5.16 CRM Standard Graphs – Primero 2013 (Continued) .................................. 11-22 Figure 11.5.17 CRM Standard Graphs – Primero 2013 (Continued) .................................. 11-23 Figure 11.5.18 CRM Standard Graphs – Primero 2013 (Continued) .................................. 11-24 Figure 11.5.19 CRM Blank Graphs – Primero 2013 ........................................................... 11-26 Figure 11.5.20 Check Assay Graphs – Primero 2013......................................................... 11-29 Figure 11.5.21 Check Assay Graphs – Primero 2013 (Continued) ..................................... 11-30 Figure 13.4.1 Cerro del Gallo Column Leach Graphs ........................................................... 13-8 Figure 13.5.1 Cerro del Gallo KCA Laboratory HPGR Outline ............................................ 13-18 Figure 13.5.2 Cerro del Gallo KCA Laboratory Column Leach Tests Curves – Gold .......... 13-27 Figure 13.5.3 Cerro del Gallo KCA Laboratory Column Leach Tests Curves – Silver ......... 13-28

Cerro del Gallo Heap Leach Project NI 43-101 Technical Report
January 31, 2020 Page xiii
Figure 13.7.1 Cerro del Gallo Sulfide Content versus Recovery (HPGR) – Gold ................ 13-39 Figure 13.7.2 Cerro del Gallo Sulfide Content versus Recovery (HPGR) – Silver .............. 13-40 Figure 13.7.3 Cerro del Gallo Sulfide Content versus Recovery (Conventional) – Gold ..... 13-41 Figure 13.7.4 Cerro del Gallo Sulfide Content versus Recovery (Conventional) – Silver .... 13-42 Figure 13.7.5 Cerro del Gallo Head Grade versus Recovery – Gold .................................. 13-43 Figure 13.7.6 Cerro del Gallo Head Grade versus Recovery – Silver ................................. 13-44 Figure 13.7.7 Cerro del Gallo Head Grade versus Recovery – Copper .............................. 13-45 Figure 14.2.1 Gold 3m Composites Data – inside 0.05 g/t Au Model .................................... 14-4 Figure 14.2.2 Gold 3m Composite Data – inside 0.05 g/t Au Model – cut to 6 g/t Au ............ 14-5 Figure 14.2.3 Silver 3m Composite Data ............................................................................. 14-5 Figure 14.2.4 Silver 3m Composite Data – cut to 65 g/t Ag .................................................. 14-6 Figure 14.2.5 Copper 3m Composite Data ........................................................................... 14-6 Figure 14.2.6 Copper 3m Composite Data – cut to 1% Cu ................................................... 14-7 Figure 14.3.1 All Gold Assay Data Histogram ...................................................................... 14-8 Figure 14.3.2 Gold Assay Data – Sample Interval Length .................................................... 14-9 Figure 14.3.3 Gold Assay Data – Intrusive ........................................................................... 14-9 Figure 14.3.4 Gold Assay Data – non-Intrusive .................................................................. 14-10 Figure 14.3.5 Gold Assay Data – Oxide ............................................................................. 14-10 Figure 14.3.6 Gold Assay Data – Oxide/Sulfide Mix ........................................................... 14-11 Figure 14.3.7 Gold Assay Data – Sulfide/Oxide Mix ........................................................... 14-11 Figure 14.3.8 Gold Assay Data – Sulfide ............................................................................ 14-12 Figure 14.3.9 Silver Assay Data – All ................................................................................. 14-12 Figure 14.3.10 Silver Assay Data – minus Year 2013 ........................................................ 14-13 Figure 14.3.11 Copper Assay Data – All ............................................................................ 14-13 Figure 14.3.12 Copper Assay Data – minus Year 2013 ...................................................... 14-14 Figure 14.5.1 Plan View of 3-meter Composite Data .......................................................... 14-16 Figure 14.5.2 Plan View of 3-meter Composite Data Transformed into 8 x Overlapping ............. Sectors ........................................................................................................ 14-17 Figure 14.5.3 Plan View of Close Up of One Overlapping Sector ....................................... 14-17 Figure 14.5.4 Spherical Variogram Models (MEDS rotations) and Final Pass Search ................. Arrays – Gold ............................................................................................... 14-18 Figure 14.5.5 Spherical Variogram Models (MEDS rotations) and Final Pass Search ................. Arrays – Silver ............................................................................................. 14-18 Figure 14.5.6 Spherical Variogram Models (MEDS rotations) and Final Pass Search ................. Arrays – Copper ........................................................................................... 14-19 Figure 14.7.1 Typical Bench 2,120: Density data, In-situ Bulk Density Estimate; Intrusive . 14-22 Figure 14.8.1 Plan View: Intrusive, 36 x Sectors for Interpolation Control and Selected .............. Ellipsoids ..................................................................................................... 14-23 Figure 14.8.2 Oblique View: Intrusive & Selected Ellipsoids to Control Radial Search ...... 14-24 Figure 14.8.3 Bench 2,120m: Gold Block Estimate and Structures .................................... 14-25 Figure 14.9.1 Average Block Gold Tonnes-Grades – by Bench (1=2,345m, 111=1,795m) . 14-29 Figure 14.9.2 Average Block Gold Tonnes-Grades – by 0300 X-Section ..................................... (1=SE most, 26=NW most) .......................................................................... 14-29 Figure 14.9.3 Average Block Silver Tonnes-Grades – by Bench (1=2,345m, 111=1,795m) 14-30

Cerro del Gallo Heap Leach Project NI 43-101 Technical Report
January 31, 2020 Page xiv
Figure 14.9.4 Average Block Silver Tonnes-Grades – by 0300 X-Section .................................... (1=SE most, 26=NW most) .......................................................................... 14-30 Figure 14.9.5 Average Block Copper Tonnes-Grades – by Bench .............................................. (1=2,345m, 111=1,795m) ............................................................................. 14-31 Figure 14.9.6 Average Block Copper Tonnes-Grades – by 0300 X-Section ................................. (1=SE most, 26=NW most ........................................................................... 14-31 Figure 14.9.7 Gold Grade-Tonnage Plot - Final OK (red) vs De-clustered (black) vs................... Three Variants – MII only ............................................................................. 14-32 Figure 14.9.8 Silver Grade-Tonnage Plot - Final OK (red) vs De-clustered (black) vs ................. IDW2(yellow) – MII only ................................................................................ 14-32 Figure 14.9.9 Copper Grade-Tonnage Plot - Final OK (red) vs De-clustered (black) vs .............. IDW2(yellow) – MII only ................................................................................ 14-33 Figure 14.11.1 Typical EW Cross-section (looking 2700). Drilling, OK Gold Block ....................... Estimate, Modelled Intrusive ....................................................................... 14-35 Figure 14.11.2 Typical EW Cross-section (looking 2700). Drilling, OK Silver Block ...................... Estimate, Modelled Intrusive ....................................................................... 14-35 Figure 14.11.3 Typical EW Cross-section (looking 2700). Drilling, OK Copper Block ................... Estimate, Modelled Intrusive ....................................................................... 14-36 Figure 14.11.4 Typical Bench 2,120m. Drilling and OK Block Estimate; Gold (left), .................... Silver (center), Copper (right) ..................................................................... 14-36 Figure 14.12.1 Cross-section Looking West. Areas of Sparse Drilling. ............................... 14-40 Figure 15.2.1 Drainage Boundary and Optimized Pit............................................................ 15-3 Figure 15.2.2 Feasibility Case Whittle Pit by Pit Graph ........................................................ 15-6 Figure 15.3.1 Slope Sectors Provided by Mines Group, 2019 .............................................. 15-8 Figure 15.3.2 Ultimate Pit Design ....................................................................................... 15-10 Figure 15.3.3 Phase 1 Pit Design – Waste Pit .................................................................... 15-11 Figure 15.3.4 Phase 2 Pit Design ....................................................................................... 15-12 Figure 15.3.5 Phase 3 Pit Design ....................................................................................... 15-13 Figure 17.1.1 Cerro del Gallo Overall Process Flowsheet .................................................... 17-3 Figure 17.1.2 Cerro del Gallo General Arrangement Drawing .............................................. 17-4 Figure 17.2.1 HLF and WRD Layout .................................................................................... 17-9 Figure 22.9.1 After Tax Sensitivity – IRR ............................................................................ 22-11 Figure 22.9.2 After Tax Sensitivity – NPV @ 5% ................................................................ 22-11 Figure 23.1 Cerro del Gallo Adjacent Properties .................................................................. 23-2 Figure 24.2.1 Cerro del Gallo IDEAS Proposed Test Water Well Locations ......................... 24-5 Figure 24.3.1 Cerro del Gallo Project Schedule to Production .............................................. 24-7

Cerro del Gallo Heap Leach Project NI 43-101 Technical Report
January 31, 2020 Page 1-1
1 Summary
1.1 Introduction
The Cerro del Gallo (CdG) Project, part of the San Antón property, is located in the state of Guanajuato, Mexico, and is wholly owned by San Antón de Las Minas SA de CV (San Antón) a resident Mexican company owned 100% by Argonaut Gold, Inc. (Argonaut), a Canadian company with corporate offices in Reno, Nevada, USA. At the request of Argonaut, this Technical Report was prepared by Kappes, Cassiday and Associates (KCA), Mine Development Associates (MDA), Golder Associates (Golder), Zurkic Mining Consultants (ZMC) and Argonaut with input from other consultant groups. This Technical Report presents the results of a Pre-Feasibility Study (PFS) on the Cerro del Gallo Project and has been prepared in accordance with disclosure and reporting requirements set forth in the Canadian Securities Administrators’ current “Standards of Disclosure for Mineral Projects” under the provisions of National Instrument 43-101 (NI 43-101), Companion Policy 43-101 CP and Form 43-101F1. The Cerro del Gallo Project considers open pit mining of approximately 92 million tonnes of ore with an estimated grade of 0.56 grams per tonne (g/t) gold, 13.2 g/t silver and 0.09% copper. Ore from the pit will be crushed to 80% passing 5mm, agglomerated with cement, conveyor stacked onto a heap leach pad and leached using a low concentration sodium cyanide solution. Pregnant solution from the heap leach will be processed in a Sulfidization, Acidification, Recirculation, Thickening (SART) plant where a copper - silver precipitate product will be produced, followed by a carbon adsorption-desorption-recovery (ADR) plant to produce a doré product. The processing throughput for the Project is 6 million tonnes of ore per year after the second year, with the first year at 4.5 million tonnes. The scope of the PFS includes a mine production schedule, as well as costing for all process components and infrastructure required for the operation. This report is based on the oxide, mixed oxide, mixed sulfide and sulfide portions of the Proven and Probable Reserves for the Project.
1.2 Property Description and Location
The CdG deposit is located in the state of Guanajuato in central Mexico, approximately 30 kilometers east of Guanajuato City and 55 kilometers east of the international airport of Leon in an active mining district. The property is accessible by road, rail and air

Cerro del Gallo Heap Leach Project NI 43-101 Technical Report
January 31, 2020 Page 1-2
services. Additionally, there is availability of a skilled local workforce, grid power, water, sealed roads, equipment suppliers and established transport routes.
Figure 1.2.1 Location Map of the Cerro del Gallo Property in Guanajuato
Source: Argonaut (2019)
1.3 Ownership
The San Antón Property covers privately owned land. Argonaut, through their wholly owned subsidiary San Antón de Las Minas SA de CV, owns the portion on which the project described in this report will be built. There are no ejidos (community owned lands) present in the San Antón de las Minas community. San Antón de Las Minas SA de CV owns freehold title and has surface rights to land totaling 445 hectares, including the CdG Project, a core shack warehouse in San Antón (6,927 m2), and the Dolores Shaft office (29,209 m2). Land access and compensation agreements have been obtained with the relevant landowners for access and exploration.

Cerro del Gallo Heap Leach Project NI 43-101 Technical Report
January 31, 2020 Page 1-3
The CdG Project is subject to a Net Smelter Return (NSR) royalty of 4% on one mineral concession and 3% on five other concessions. The overall average is calculated to be 3.75% for the reserves outlined in this study.
1.4 Geology and Mineralization
The CdG deposit is located in central Mexico within the Mesa Central physiographic province that includes the Guerrero Composite Terrane. The Guerrero Composite Terrane is characterized by submarine and subaerial volcanic and sedimentary successions that range in age from Jurassic to Middle–Late Cretaceous. The oldest rocks in the CdG region are a deformed and regionally metamorphosed volcano-sedimentary sequence of Triassic to Cretaceous age. Consejo de Recursos Minerales referred to these rocks as the Esperanza Formation, described as carbonaceous and calcareous shale interbedded with arenite, limestone and andesite to basaltic flows, all weakly metamorphosed to phyllites, slates and marble. In the CdG Project area, the Esperanza Formation consists of layered sediments of argillaceous and silty argillaceous composition, and fragmental volcanic rocks of intermediate composition, including ash tuffs, lithic to crystal tuffs and some volcanic breccias and agglomerates. In the Project area, the Esperanza Formation is locally surrounded by Tertiary age rhyolitic flows, rhyolitic tuffs, trachyte-andesite and andesites. At CdG, mineralization is hosted in both felsic intrusive and surrounding volcano-sedimentary wall-rock of the Esperanza Formation. Mineralization is present as both disseminated and fracture controlled veins, and extends from 200 meters to 400 meters outward from the mineralizing intrusive complex. The strongest gold mineralization at CdG is associated with intense quartz stockwork veining and silicification within a wall-rock annulus around the outer limits of the felsic stock. The system loses intensity outward from this annulus with a decrease in stockwork and quartz veining density. There are less than 2% by volume of sulfide minerals in the host rock. Gold-copper mineralization is zoned concentrically around the felsic intrusive with higher grade gold mineralization proximal to and within an outer annulus of the intrusion. The highest copper grades are found outward from the gold zone. Zinc mineralization is locally anomalous outside the copper zone. Metal zonation boundaries are gradational and there is an overlap in the gold-copper zone and the copper-zinc zone. Silver mineralization occurs related to the gold-copper mineralization as well as later structurally controlled epithermal vein system that overprints the intrusive related copper-gold system.
Cerro del Gallo Heap Leach Project NI 43-101 Technical Report
January 31, 2020 Page 1-4
1.5 Drilling and Sample Analysis
All drill data utilized in this Technical Report to calculate the current resource and reserves was generated by previous owners, Cerro Resources (Cerro) between 2004 and 2008, and Primero Mining Corp (Primero) in 2013. Argonaut carried out limited drilling in 2018, solely for the purposes of obtaining metallurgical samples for test work. The drilling campaigns are summarized in Table 1.5.1 below.
Table 1.5.1 Drilling Campaigns by Year, Company and Type
Company Year RC DD Total Holes Meters Holes Meters Holes Meters
2004 3 335.28 - - 3 335.28 2005 80 14,884.92 9 5,402.95 89 20,287.87 Cerro 2006 109 24,005.97 31 12,935.80 140 36,941.77 2007 63 13,838.33 30 15,452.17 93 29,290.50 2008 27 7,036.30 7 3,569.05 34 10,605.35 Primero 2013 - - 51 12,829.16 51 12,829.16 Argonaut 2018 - - 18 1,484.50 18 1,484.50
Total (04-08) 282 60,100.80 77 37,359.97 359 97,460.77 Total 282 60,100.80 146 51,673.63 428 111,774.43
% DH Type of Total 65.9% 53.8% 34.1% 46.2% 100.0% 100.0% Source: Argonaut (2019)
All core drilling from 2004 through 2008 by Cerro utilized oriented core and was carried out by an Atlas Copco CS-1500 truck-mounted core drill. Normally the hole was started with HQ (63.5 mm) sized core and, if necessary, reduced to NQ sized core. From 2013 through 2014, under Primero, the core drilling program was carried out by Major Drilling with a Major 50 truck mounted drill. These holes were positioned in areas requiring closer spaced drilling, often because the original RC holes were not completed and were lost in mineralization. Primero’s drilling also included PQ sized core holes to twin mineralized RC drill holes. Core handling and logging procedures for Primero were identical to those of Cerro. In 2018 Argonaut conducted a core drilling program using PQ size core. This program, totaling 1,484.5 meters, was designed to obtain mineralized material for metallurgical studies. Argonaut utilized a UDR 200 drill rig supplied by Major Drilling. This core drilling program was intended entirely to produce metallurgical test samples. As such, Argonaut twinned existing drill holes, and sent whole PQ core to the metallurgical testing lab.

Cerro del Gallo Heap Leach Project NI 43-101 Technical Report
January 31, 2020 Page 1-5
Standard core handling procedures initiated by Cerro Resources were utilized throughout all three core drilling campaigns at CdG. Core cutting was done by saw, followed by industry standard sampling procedures. Argonaut, however, did not sample the core for standard assays as noted above. Logging criteria included: lithology, alteration, degree of oxidation, and mineralization. Drill hole data was recorded on handwritten logs onto a pre-printed log sheet template database and eventually merged with assay results. Drill data also included hole identification, coordinates (in NAD27 for Mexico), depth, and sample number, including duplicates, blanks and standards.
1.6 Mineral Processing and Metallurgical Test Work
The laboratory testing program has included comminution and flotation studies along with column, bottle roll and agitated (shake) cyanide leach tests. The leach tests were further differentiated by crush size and type (conventional and HPGR). Historical test work included laboratory work prior to 2015 performed by others. Current test work includes results from 2018 and 2019 performed by KCA. Historical test work was conducted on three main ore types: Weathered/Oxide, Mixed, and Fresh/Sulfide. The current test work further differentiates the Mixed category into two separate material types: Mixed Oxide and Mixed Sulfide. In total there are four separate material ore type categories that were considered in the recent test work and in this study: Oxide, Mixed Oxide, Mixed Sulfide and Sulfide. The projected field gold, silver and copper recoveries are summarized in Table 1.6.1, and the estimated cyanide and cement consumptions presented in Table 1.6.2.
Table 1.6.1 Cerro del Gallo Recoveries by Material Type
Ore Type (HPGR)
Feed Distribution
LOM Average
Projected Field Recoveries
Au, % Ag, % Cu% Weathered (Oxide) 9.2% 74 60 22 Mixed Oxide 5.8% 70 79 46 Mixed Sulfide 38.0% 59 59 59 Fresh (Sulfide) 47.0% 58 40 34
Life of Mine (LOM) Average 60 52 43 Source: KCA (2019)

Cerro del Gallo Heap Leach Project NI 43-101 Technical Report
January 31, 2020 Page 1-6
Table 1.6.2 Cerro del Gallo Reagent Consumptions by Material Type
Ore Type (HPGR)
Feed Distribution
LOM Average
Projected Field Reagents, kg/t
NaCN Cement Lime
Weathered (Oxide) 9.2% 0.87 10.0 – Mixed Oxide 5.8% 0.34 10.0 – Mixed Sulfide 38.0% 0.87 10.0 – Fresh (Sulfide) 47.0% 0.60 10.0 –
Life of Mine (LOM) Average 0.71 10.0 – Source: KCA (2019)
1.7 Mineral Resources
Mr. Neb Zurkic, president of ZMC, was contracted to prepare an updated estimate of mineral resources for the CdG Project. Mr. Zurkic collaborated with Argonaut’s geological staff to create wireframes to constrain the gold and conducted various statistical and geostatistical analyses prior to estimating block grades for gold, silver and copper. Preliminary design and economic parameters were used to calculate cutoff grades for the different material types. These parameters were utilized with the estimated block grades to generate a constraining pit to use for declaration of the CdG project resources. Table 1.7.1 summarizes the undiluted Measured, Indicated, and Inferred Mineral Resources constrained to the USD$1,600 Au-EQ conceptual pit at a 0.25 g/t AuEQ cut-off grade for the oxide and mixed oxide material types, and at a 0.30 g/t AuEQ cut-off grade for the mixed-sulfide and sulfide material types. The stated resources are inclusive of reserves.

Cerro del Gallo Heap Leach Project NI 43-101 Technical Report
January 31, 2020 Page 1-7
Table 1.7.1 Undiluted Contained Mineral Resources with $1,600 Conceptual Pit
MEASURED MINERAL RESOURCES
Material Type Tonnes (000's)
Au (g/t)
Ag (g/t)
Cu %
Au ozs (000's)
Ag ozs (000's)
Cu t (000's)
Oxide 7.1 0.47 15.8 0.10 107 3,607 7 Mixed Oxide 5.0 0.43 10.3 0.07 70 1,658 4 Mixed Sulfide 37.8 0.53 13.1 0.10 645 15,917 36 Sulfide 71.7 0.47 13.0 0.10 1,077 29,904 74 Total - All Material Types 121.6 0.49 13.1 0.10 1,899 51,086 121
INDICATED MINERAL RESOURCES
Material Type Tonnes (000's)
Au (g/t)
Ag (g/t)
Cu %
Au ozs (000's)
Ag ozs (000's)
Cu t (000's)
Oxide 3.2 0.36 15.3 0.08 38 1,592 3 Mixed Oxide 8.8 0.28 10.8 0.07 79 3,033 6 Mixed Sulfide 22.8 0.40 11.5 0.09 296 8,436 20 Sulfide 45.5 0.38 10.2 0.08 552 14,956 38 Total - All Material Types 80.4 0.37 10.8 0.08 965 28,017 66
MEASURED + INDICATED MINERAL RESOURCES
Material Type Tonnes (000's)
Au (g/t)
Ag (g/t)
Cu %
Au ozs (000's)
Ag ozs (000's)
Cu t (000's)
Oxide 10.3 0.44 15.7 0.09 145 5,199 9 Mixed Oxide 13.8 0.33 10.6 0.07 148 4,691 9 Mixed Sulfide 60.7 0.48 12.5 0.09 941 24,353 56 Sulfide 117.2 0.43 11.9 0.10 1,629 44,859 112 Total - All Material Types 201.9 0.44 12.2 0.09 2,864 79,103 187
INFERRED MINERAL RESOURCES
Material Type Tonnes (000's)
Au (g/t)
Ag (g/t)
Cu %
Au ozs (000's)
Ag ozs (000's)
Cu t (000's)
Oxide 0.1 0.36 13.1 0.09 1 22 0 Mixed Oxide 0.5 0.18 13.2 0.07 3 214 0 Mixed Sulfide 3.6 0.50 12.7 0.10 58 1,455 4 Sulfide 1.0 0.32 8.1 0.06 10 255 1 Total - All Material Types 5.1 0.43 11.9 0.09 71 1,947 5
Note: Totals may not add due to rounding. Source: ZMC (2019)

Cerro del Gallo Heap Leach Project NI 43-101 Technical Report
January 31, 2020 Page 1-8
1.8 Mineral Reserves
Measured and Indicated resources were used as the basis to define Proven and Probable reserves for the CdG project. Reserve definition began by identifying ultimate pit limits using economic parameters and pit optimization techniques. The resulting optimized pit shells were then used for guidance in pit design to allow access for equipment and personnel. MDA then considered mining, processing, metallurgical, infrastructure, economic, marketing, legal, environmental, social and governmental factors as modifying factors for defining the estimated reserves. Pit optimization was conducted using Geovia’s Whittle software (version 4.7) to define pit limits with input for economic and slope parameters from Argonaut and their consultants. Initial mining costs were based on Argonaut’s experience with mining at their operations elsewhere in Mexico. The final mining costs as provided by a mining contractor quote for this study were used to re-run the pit optimizations and confirm the economic viability of the pits that were designed. CdG has limited space for 52 million tonnes of waste in waste dumps and 92 million tonnes for leach processing. After running the optimization, the $1,200 pit shell was selected as the ultimate pit limit as it is near these capacity limits. Pit designs were completed for the CdG ultimate pit and internal pit phases. The Phase 1 pit was designed primarily to provide waste material needed for construction. Phase 2 and 3 pits are within the ultimate pit and were designed to enhance the project by mining higher-value material earlier in the mine life. Table 1.8.1 reports the Proven and Probable reserves based on the pit designs. These reserves are shown to be economically viable based on cash-flows provided by KCA. MDA has reviewed the cash-flows and believes that they are reasonable for the statement of Proven and Probable reserves

Cerro del Gallo Heap Leach Project NI 43-101 Technical Report
January 31, 2020 Page 1-9
Table 1.8.1 Proven and Probable Reserves
Source: MDA (2019)
1.9 Mining Methods
The CdG Project has been planned as an open-pit mine utilizing conventional truck and loader operations. The truck and loader method provides reasonable cost benefits and selectivity for this type of deposit. Mine production schedules were created using MineSched (version 9.1). Proven and Probable reserves along with associated waste material were scheduled for transport to various destinations in order to create a mine production schedule. The mine production schedule was designed to provide the crusher with sufficient daily material for processing at a rate of 6.0 million tonnes per year. Mine waste facilities were designed by Golder and are appropriate in capacity and design for waste rock storage. The ultimate life-of-mine (LOM) strip ratio was calculated at 0.63:1 (waste:ore).
Units Oxide Mixed Oxide Mixed Sulfide Fresh Rock TotalProven K Tonnes 5,799 2,566 26,563 35,499 70,427
g Au/t 0.55 0.55 0.61 0.57 0.59 K Ozs Au 103 45 524 653 1,326
g Ag/t 15.70 10.81 13.81 13.56 13.73 K Ozs Ag 2,927 892 11,790 15,479 31,088
Cu% 0.09 0.07 0.09 0.10 0.10 Tonnes Cu 5,097 1,785 24,923 36,156 67,961
Probable K Tonnes 2,626 2,722 8,259 7,719 21,327 g Au/t 0.41 0.25 0.48 0.51 0.46
K Ozs Au 35 22 129 128 313 g Ag/t 15.40 12.92 12.52 9.09 11.68
K Ozs Ag 1,300 1,131 3,325 2,256 8,012 Cu% 0.07 0.08 0.08 0.09 0.08
Tonnes Cu 1,751 2,081 6,874 7,115 17,821 Proven & Probable K Tonnes 8,425 5,289 34,822 43,218 91,754
g Au/t 0.51 0.39 0.58 0.56 0.56 K Ozs Au 138 67 653 781 1,638
g Ag/t 15.60 11.90 13.50 12.76 13.25 K Ozs Ag 4,227 2,023 15,115 17,736 39,099
Cu% 0.08 0.07 0.09 0.10 0.09 Tonnes Cu 6,848 3,866 31,797 43,271 85,782

Cerro del Gallo Heap Leach Project NI 43-101 Technical Report
January 31, 2020 Page 1-10
1.10 Heap Leach Recovery Methods
Test work results have indicated that the CdG ore is amenable to heap leaching for the recovery of gold, silver and copper. The CdG ore contains cyanide soluble copper that results in high cyanide consumption during the heap leaching process. A SART plant is included that releases cyanide associated with the copper-cyanide complex, allowing a significant portion of it to be recycled back to the leach process as free cyanide, and produces a copper-silver precipitate that can be sold. The ore will be mined by standard open-pit mining methods, fine crushed using a 3-stage system incorporating jaw, cone, and high-pressure-grinding-roll (HPGR) crushers, agglomerated with cement and conveyor stacked on the heap leach pad in 8-meter lifts. The heap leach pad was designed by Golder. The pad will be constructed in four phases and will hold approximately 92 million tonnes. The heap leach pad will have a composite liner consisting of clay/GCL and smooth/textured HDPE. Ore will be single-stage leached with a dilute cyanide solution at a high solution application rate for the first 40 days and a lower application rate for the remaining 80 days for a total leach cycle of 120 days. The gold, silver, and copper bearing solution will be collected in the pregnant solution pond and pumped to the SART plant. Pregnant solution will be acidified with sulfuric acid, then copper and silver will be precipitated as sulfides by the addition of sodium sulfide. The precipitate will be thickened and filtered to produce a copper-silver filter cake for shipment to a smelter. The barren solution from the SART plant will be processed in a carbon adsorption-desorption-recovery (ADR) plant to recover gold. The gold will be periodically stripped from the carbon using a desorption process. The gold will be plated on stainless steel cathodes, removed by washing, filtered, dried and then smelted to produce a doré bar. Based on the total ore reserve of approximately 92 million tonnes and an established processing rate of 16,667 tonnes per day (first year at 4.5 million tonnes, and 6 million tonnes per year thereafter), the project has an estimated life of about 15.5 years. The projected metal recovered by year for gold, silver and copper is presented in Table 1.10.1.

Cerro del Gallo Heap Leach Project NI 43-101 Technical Report
January 31, 2020 Page 1-11
Table 1.10.1 Summary of Metal Production by Year
Source: KCA (2019)
1.11 Infrastructure
Existing infrastructure for CdG includes a site office, dirt and gravel roads, and limited power line throughout the Project site. Internet and cellular communications are currently available, though these systems will need to be expanded for operations. Access to the Project site is by the paved Mexican Highway 110, then a secondary dirt road that goes to San Antón de las Minas community. A private road will enter into the mine property approximately 2 km before reaching the San Antón de las Minas community. This road will provide access to the administration offices, mine, process plant and other Project facilities. An existing community road will be relocated. Internal site roads will be established to serve as mine haul roads, service roads and in-plant roads which connect the facilities for access purposes
Power
Power supply to the CdG Project will initially be generated by on site natural gas generator units operating, with an additional unit on standby. It is assumed that in Year 1 of operations, power supply from a 115KV power line will be available by connecting to the national grid and power generation at site will no longer be needed. Two of the temporary generators and their associated fuel tanks will remain at the project to be utilized as emergency power backup for the process plants.
YearTotal Gold
Produced, ozTotal Silver
Produced, ozTotal Copper Produced, t
1 44,035 1,225,907 1,1002 67,564 1,508,848 2,1143 60,776 1,320,702 2,1964 66,200 1,499,882 2,5735 63,677 1,538,798 2,5666 65,848 1,418,085 2,4777 72,667 1,395,760 2,5818 81,514 1,348,455 2,3579 71,415 1,545,515 2,765
10 62,451 1,246,835 2,31211 50,742 1,231,323 2,57412 51,632 1,043,318 2,50013 59,633 1,057,565 2,47714 65,155 1,111,185 2,50215 63,041 1,021,331 2,19316 40,583 632,494 1,388
Total 986,932 20,146,001 36,677

Cerro del Gallo Heap Leach Project NI 43-101 Technical Report
January 31, 2020 Page 1-12
Water
The project will require water supply for the following uses:
• Mining operations for dust control, drilling, etc.; • Crushing for dust control; • Makeup water for the heap leach; • Process plant and laboratory; • Modular offices and other site facilities.
San Antón owns water rights for 1.44 Mm3 per year. The project is expected to consume an annual average of 628,000 – 900,000 m3 per year, depending on the amount of leach pad in the circuit. San Antón currently has two wells that tests indicate will provide approximately half of the maximum project demand. Additional wells will be drilled to provide the remainder of the estimated maximum demand of 55 L/s. Solution from the heap leach pad will drain to a pregnant solution pond, where it will be pumped through the processing facility to recover precious metals and then pumped back to the leach pad in a continuous cycle. An emergency event solution pond will be located adjacent to the pregnant solution pond to allow containment of excess process solution during precipitation events, which will add additional water to the contained system. A satellite pond will also be included where excess water can be transferred for containment. Process water requirements are first met by pumping collected waters from the emergency event ponds; after that resource is exhausted, make-up requirements will be met by well water. Raw water for the project will be pumped directly from the water wells to raw water tanks located next to the administration area and a secondary water tank located near the crushing area. Potable water will be bottled and delivered to the project site. The raw water tank located near the administration area will be a dual-purpose tank. A portion of this tank will be designated for fire water use.
Project Buildings
The project facilities will be supplied in the form of a modular office and shipping containers will be used for warehouse storage. The refinery will be constructed with masonry walls and a structural steel roof while the motor control centers (MCC) are assumed to be modified shipping containers. Prefabricated steel buildings will be used for the administration building, laboratory, guard house, clinic, dining room, and a training room.

Cerro del Gallo Heap Leach Project NI 43-101 Technical Report
January 31, 2020 Page 1-13
Security
Access to the project will be limited by perimeter fencing around the entire site. A guardhouse at the primary entry point to the project will serve as a security check point that will be manned 24 hours per day, 7 days a week for identification control, random checks, drug and alcohol monitoring and vehicle check-in/out. A security contractor will be used for general site security and protection of mine assets.
1.12 Waste Disposal
Sewage
Wastewater and sewage will be handled by subsurface local septic tanks and centralized leach-fields.
Solid Waste
Solid waste will be disposed of in a manner complying with local regulations.
1.13 Environmental Studies, Permitting and Social Impact
Exploration and mining activities in Mexico are subject to control by the Federal agency of the Secretaria del Medio Ambiente y Recursos Naturales (Secretary of the Environment and Natural Resources), known by its acronym SEMARNAT, which has authority over the 2 principal Federal permits:
i. A Manifesto de Impacto Ambiental (Environmental Impact Statement), known by its acronym as an MIA accompanied by an Estudio de Riesgo (Risk Study, hereafter referred to as ER); and
ii. A Cambio de Uso de Suelo (Land Use Change) permit, known by its acronym as a CUS, supported by an Estudio Tecnico Justificativo (Technical Justification Study, known by its acronym ETJ).
Argonaut has active community and government relations programs and is working diligently with local and regional entities to keep all interested and affected personnel informed on planned activities at CdG. Argonaut has initiated a scholar training program, has hired a community relations coordinator, and is continuing to strengthen relations and participation with local governments, the academic community and the mining sector. Argonaut continues to have the full support of the Director of Mines of Guanajuato and the Assistant Secretary of the Economy.

Cerro del Gallo Heap Leach Project NI 43-101 Technical Report
January 31, 2020 Page 1-14
1.14 Capital and Operating Costs
Capital and operating costs for the mining, process and general and administration components of the CdG Project were estimated by KCA and MDA with significant input from Argonaut. Costs for the mining components are based on contract mining. The estimated costs are considered to have an accuracy of +/-20%. Pre-production capital costs required for the CdG Project by area are presented in Table 21.2.1 and are expressed in 3rd quarter 2019 US dollars.
Cerro del Gallo Heap Leach Project NI 43-101 Technical Report
January 31, 2020 Page 1-15
Table 1.14.1 Summary of Pre-Production Capital Costs by Area
Source: KCA (2019)
Plant Totals Direct Costs Total Supply Cost Install Grand Total
US$ US$ US$Area 000 - Mobile Equipment $2,708,000 $0 $2,708,000Area 001 - Site & Utilities General $2,008,000 $879,000 $2,887,000Area 005 - Power Generation & Site Distribution $8,578,000 $109,000 $8,687,000Area 010 - Primary Crushing $3,481,000 $389,000 $3,870,000Area 011 - Secondary Crushing $6,275,000 $520,000 $6,796,000Area 012 - Tertiary Crushing $10,096,000 $571,000 $10,667,000Area 020 - Agglomeration $2,832,000 $290,000 $3,122,000Area 030 - Stacking System $5,072,000 $331,000 $5,403,000Area 031 - Heap Solution Handling $5,568,000 $13,861,000 $19,429,000Area 035 - SART Plant $10,453,000 $853,000 $11,306,000Area 040 - Recovery $7,018,000 $4,438,000 $11,456,000Area 050 - Refining $166,000 $0 $166,000Area 080 - Reagents $1,214,000 $184,000 $1,398,000Area 090 - Water Distribution System $2,748,000 $83,000 $2,831,000Area 100 - Laboratory $1,392,000 $380,000 $1,772,000
Total Direct Costs $69,609,000 $22,889,000 $92,498,000Spare Parts $4,786,000 $4,786,000
Sub Total with Spare Parts $97,284,000Contingency $16,432,000 $16,432,000
Total Direct Costs with Contingency $113,716,000
$5,051,000
$3,906,000
$3,550,000
$7,960,000
$134,183,000
$638,000
$10,509,000
$145,329,000
Initial Fills
Sub Total Costs Pre-Production
TOTAL COSTS (excluding IVA)
Other Owner's Costs
Indirect Costs
Mining Costs
EPCM
Working Capital (60 days)

Cerro del Gallo Heap Leach Project NI 43-101 Technical Report
January 31, 2020 Page 1-16
The total Life of Mine (LOM) capital cost for the Project is US$184.6 million, not including reclamation and closure costs, IVA (value added tax) or other taxes; all IVA is applied to all capital costs at 16% and is assumed to be fully refundable. Table 1.14.2 the capital requirements for the CdG Project.
Table 1.14.2 Capital Cost Summary - LOM
Description Cost (US$M) Pre-Production Capital $134.2 Working Capital & Initial Fills $ 11.1 Sustaining Capital – Mine & Process $ 39.2 Total excluding IVA $184.6
Source: KCA (2019)
The average life of mine operating cost for the Project is US$10.51 per tonne of ore processed. Table 1.14.3 presents the LOM operating cost requirements for the CdG Project. The operating costs presented are based upon the ownership of all process production equipment and site facilities, including the onsite laboratory. The owner will employ and direct all process operations, maintenance and support personnel for all site activities.
Table 1.14.3 LOM Operating Cost Summary
Description LOM Cost (US$/t Processed)
Mine $ 2.81 Process & Support Services $ 6.99 Site G & A $ 0.71 Total $10.51
Source: KCA (2019) The operating costs were estimated based on 3rd quarter 2019 US dollars and are presented with no added contingency based upon the design and operating criteria described in this report. IVA is not included in the operating cost estimate. Closure and reclamation will include chemically stabilizing the heap and waste rock storage facility, physically stabilizing these facilities, control of surface waters and removal or re-purposing of all other project facilities. The open pit is expected to stay dry. It is assumed that low permeability material will be placed over the heap and waste rock storage facilities. The LOM costs for closure and reclamation are estimated to be US$ 36.7 million.

Cerro del Gallo Heap Leach Project NI 43-101 Technical Report
January 31, 2020 Page 1-17
1.15 Economic Analysis
Based on the estimated production schedule, capital costs, operating costs, royalties and taxes, a cash flow model was prepared by KCA for the economic analysis of the CdG Project. All of the information used in this economic evaluation has been taken from work completed by KCA and other consultants working on this Project as described in this Report. The Project economics were evaluated using a discounted cash flow (DCF) method, which measures the Net Present Value (NPV) of future cash flow streams. The final economic model was developed by KCA with input from Argonaut based on the following assumptions:
• The cash flow model is based on the mine production schedule developed by MDA.
• The period of analysis is 21 years including two years of investment and pre-production, 16 years of production and three years for reclamation and closure.
• Gold price of US$1,350/oz. • Silver prize of US$16.75/oz. • Copper price of US$6,000/t. • Average processing rate of 16,667 tpd (4.5 million tonnes for the first year, and 6
million tonnes per year thereafter). • Overall recoveries of 60% for gold, 52% for silver, and 43% for copper. • Capital and operating costs as developed in Section 21 of this Report.
The key economic parameters are presented in Table 1.15.1 and the economic summary is presented in Table 1.15.2.
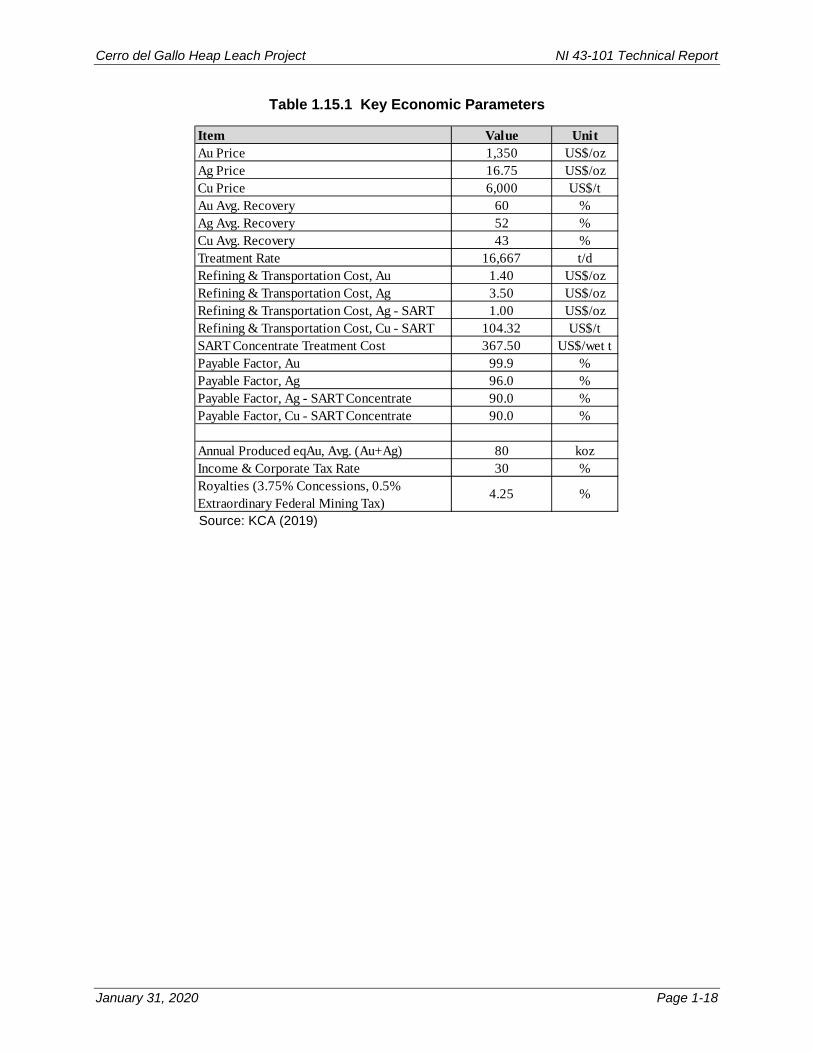
Cerro del Gallo Heap Leach Project NI 43-101 Technical Report
January 31, 2020 Page 1-18
Table 1.15.1 Key Economic Parameters
Source: KCA (2019)
Item Value UnitAu Price 1,350 US$/ozAg Price 16.75 US$/ozCu Price 6,000 US$/tAu Avg. Recovery 60 %Ag Avg. Recovery 52 %Cu Avg. Recovery 43 %Treatment Rate 16,667 t/dRefining & Transportation Cost, Au 1.40 US$/ozRefining & Transportation Cost, Ag 3.50 US$/ozRefining & Transportation Cost, Ag - SART 1.00 US$/ozRefining & Transportation Cost, Cu - SART 104.32 US$/tSART Concentrate Treatment Cost 367.50 US$/wet tPayable Factor, Au 99.9 %Payable Factor, Ag 96.0 %Payable Factor, Ag - SART Concentrate 90.0 %Payable Factor, Cu - SART Concentrate 90.0 %
Annual Produced eqAu, Avg. (Au+Ag) 80 kozIncome & Corporate Tax Rate 30 %Royalties (3.75% Concessions, 0.5% Extraordinary Federal Mining Tax)
4.25 %
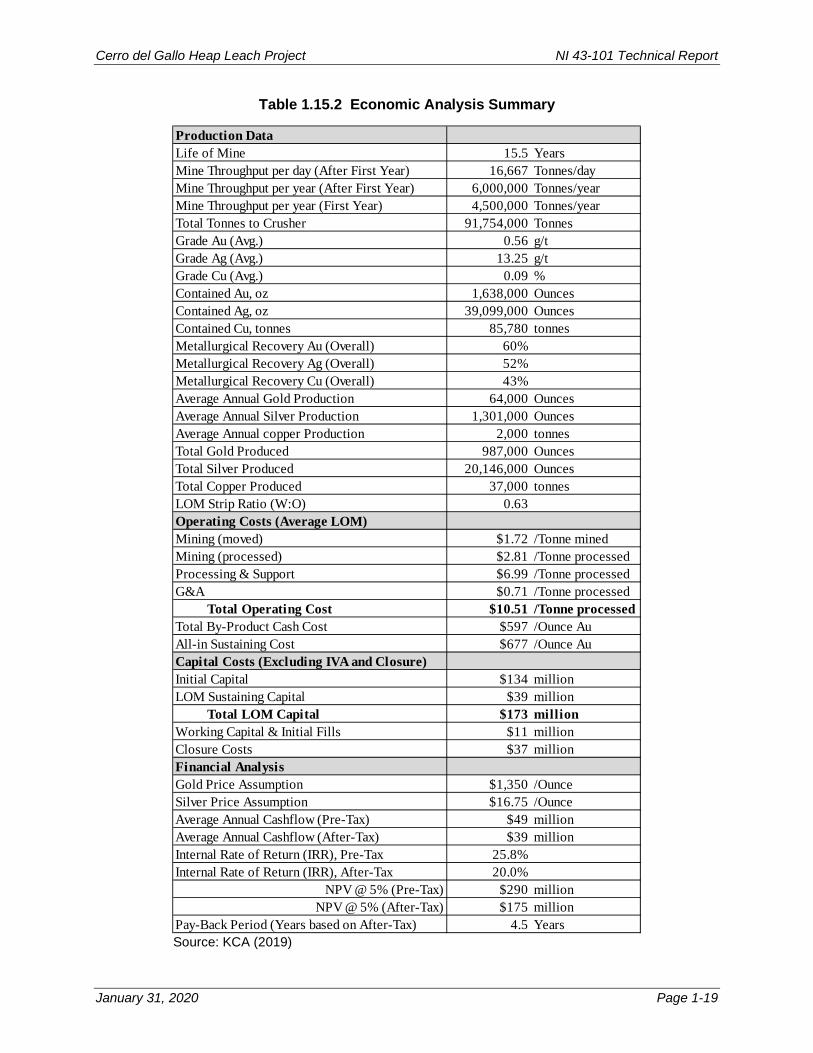
Cerro del Gallo Heap Leach Project NI 43-101 Technical Report
January 31, 2020 Page 1-19
Table 1.15.2 Economic Analysis Summary
Source: KCA (2019)
Production DataLife of Mine 15.5 YearsMine Throughput per day (After First Year) 16,667 Tonnes/dayMine Throughput per year (After First Year) 6,000,000 Tonnes/yearMine Throughput per year (First Year) 4,500,000 Tonnes/yearTotal Tonnes to Crusher 91,754,000 TonnesGrade Au (Avg.) 0.56 g/tGrade Ag (Avg.) 13.25 g/tGrade Cu (Avg.) 0.09 %Contained Au, oz 1,638,000 OuncesContained Ag, oz 39,099,000 OuncesContained Cu, tonnes 85,780 tonnesMetallurgical Recovery Au (Overall) 60%Metallurgical Recovery Ag (Overall) 52%Metallurgical Recovery Cu (Overall) 43%Average Annual Gold Production 64,000 OuncesAverage Annual Silver Production 1,301,000 OuncesAverage Annual copper Production 2,000 tonnesTotal Gold Produced 987,000 OuncesTotal Silver Produced 20,146,000 OuncesTotal Copper Produced 37,000 tonnesLOM Strip Ratio (W:O) 0.63Operating Costs (Average LOM)Mining (moved) $1.72 /Tonne minedMining (processed) $2.81 /Tonne processedProcessing & Support $6.99 /Tonne processedG&A $0.71 /Tonne processed Total Operating Cost $10.51 /Tonne processedTotal By-Product Cash Cost $597 /Ounce AuAll-in Sustaining Cost $677 /Ounce AuCapital Costs (Excluding IVA and Closure)Initial Capital $134 millionLOM Sustaining Capital $39 million Total LOM Capital $173 millionWorking Capital & Initial Fills $11 millionClosure Costs $37 millionFinancial AnalysisGold Price Assumption $1,350 /OunceSilver Price Assumption $16.75 /OunceAverage Annual Cashflow (Pre-Tax) $49 millionAverage Annual Cashflow (After-Tax) $39 millionInternal Rate of Return (IRR), Pre-Tax 25.8%Internal Rate of Return (IRR), After-Tax 20.0%
NPV @ 5% (Pre-Tax) $290 millionNPV @ 5% (After-Tax) $175 million
Pay-Back Period (Years based on After-Tax) 4.5 Years

Cerro del Gallo Heap Leach Project NI 43-101 Technical Report
January 31, 2020 Page 1-20
To estimate the relative economic strength of the Project, base case sensitivity analyses have been completed analyzing the economic sensitivity to several parameters including changes in gold and silver prices, capital costs, and average operating cash cost per tonne of ore processed and exchange rate. The sensitivities are based on +/- 25% of the base case for capital costs and operating costs and select gold and silver prices. The sensitivity analysis results are shown in Table 1.15.3, Figure 1.15.1 and Figure 1.15.2 below.
Table 1.15.3 After-Tax Sensitivity Analysis Results
Source: KCA (2019)
Gold and Silver Price IRR 0% 5% 10%
Au, US$/oz Ag, US$/oz$1,350 $16.75 19.4% $325,557,000 $166,327,000 $78,080,000
85% $1,150 $14.25 12.7% $189,984,000 $81,018,000 $20,740,00093% $1,250 $15.50 16.5% $265,165,000 $128,231,000 $52,434,000
100% $1,350 $16.75 20.0% $340,347,000 $175,252,000 $83,845,000107% $1,450 $18.00 23.2% $415,528,000 $222,117,000 $115,021,000115% $1,550 $19.25 26.3% $490,709,000 $268,915,000 $146,090,000
Variation IRR 0% 5% 10%Gold Price US$
$1,350 20.0% $340,347,000 $175,252,000 $83,845,00085% $1,150 14.2% $218,113,000 $99,108,000 $33,155,00093% $1,250 17.2% $279,234,000 $137,220,000 $58,558,000
100% $1,350 20.0% $340,347,000 $175,252,000 $83,845,000107% $1,450 22.6% $401,459,000 $213,174,000 $108,966,000115% $1,550 25.1% $462,580,000 $251,098,000 $134,085,000
Capital Costs US$$212,833,000 20.0% $340,347,000 $175,252,000 $83,845,000
75% $171,587,000 26.5% $368,464,000 $203,809,000 $111,593,00090% $196,335,000 22.2% $351,594,000 $186,675,000 $94,944,000
100% $212,833,000 20.0% $340,347,000 $175,252,000 $83,845,000110% $229,332,000 18.0% $329,100,000 $163,807,000 $72,713,000125% $254,080,000 15.6% $312,229,000 $146,549,000 $55,877,000
Operating Costs US$$964,240,000 20.0% $340,347,000 $175,252,000 $83,845,000
75% $723,180,000 26.4% $496,433,000 $271,710,000 $147,550,00090% $867,816,000 22.6% $402,781,000 $213,867,000 $109,377,000
100% $964,240,000 20.0% $340,347,000 $175,252,000 $83,845,000110% $1,060,665,000 17.1% $277,912,000 $136,518,000 $58,133,000125% $1,205,301,000 12.5% $184,260,000 $78,185,000 $19,224,000
Exchange Rate MXN/US$19.3 20.0% $340,347,000 $175,252,000 $83,845,000
75% 19.3 14.5% $253,107,000 $115,556,000 $39,783,00090% 19.3 18.1% $311,266,000 $155,419,000 $69,256,000
100% 19.3 20.0% $340,347,000 $175,252,000 $83,845,000110% 19.3 21.5% $364,142,000 $191,411,000 $95,679,000125% 19.3 23.5% $392,709,000 $210,815,000 $109,892,000
NPV
Variation
NPV

Cerro del Gallo Heap Leach Project NI 43-101 Technical Report
January 31, 2020 Page 1-21
Figure 1.15.1 After Tax Sensitivity – IRR
Source: KCA (2019)
Figure 1.15.2 After Tax Sensitivity – NPV @ 5%
Source: KCA (2019)
0%
5%
10%
15%
20%
25%
30%
75% 80% 85% 90% 95% 100% 105% 110% 115% 120% 125%
IRR
Percentage of Base Case
After Tax IRR
Gold Price
Gold and Silver Price
Capital Costs
Operating Costs
Exchange Rate
$0
$50
$100
$150
$200
$250
$300
75% 80% 85% 90% 95% 100% 105% 110% 115% 120% 125%
NPV
, Mill
ion
US
$
Percentage of Base Case
After Tax NPV @ 5%
Gold Price
Gold and Silver Price
Capital Costs
Operating Costs
Exchange Rate

Cerro del Gallo Heap Leach Project NI 43-101 Technical Report
January 31, 2020 Page 1-22
1.16 Conclusions
The work that has been completed to date has demonstrated that the CdG open pit mine and heap leach facility is a technically feasible and economically viable Project. It is the conclusion of the QP’s that the work completed in preparation of this technical report included adequate detail and information to declare Mineral Reserves. Standard industry practices, equipment and design methods were used in the PFS.
• The base case for the Project has been developed with sufficient detail to underpin a decision to continue to move the Project through subsequent stages of development.
• The production schedule targeted a consistent total mine tonnage of approximately
six million tonnes per year after the first year. The first year is approximately four and a half million tonnes. At this rate the expected mine life will be about 15.5 years.
• The mine life and total tonnes processed are limited by land constraints for the heap leach and waste dump facilities.
• For the four material types, results of the metallurgical testing show average gold recoveries in the range of 58% to 74%, silver recoveries range from 40% to 79%, and copper recoveries range from 22% to 59%.
• Tertiary crushing with two stages of conventional crushing and one tertiary stage HPGR crushing is used to produce the final crush size of 80% passing 4 to 6 mm.
• Based on the production schedule and field adjusted recovery for the four material types projected gold, silver and copper recoveries are 60%, 52% and 43%, respectively.
• Copper and silver will be recovered in a SART plant by sulfide precipitation; gold and some silver will be recovered by conventional carbon adsorption.
• During operations, control of cyanide levels and careful monitoring of copper in pregnant and barren leach solutions will be required to minimize cyanide consumption and maximize gold and silver recoveries.

Cerro del Gallo Heap Leach Project NI 43-101 Technical Report
January 31, 2020 Page 1-23
• Cement for agglomeration constitutes a significant portion of the operating costs. Careful monitoring of heap permeability and ongoing test programs at site will be required.
• The CdG Project requires supplies and infrastructure items such as administration buildings, laboratory, warehouse, roads, powerline and MCC, water wells and water line, reagent storage, a complete service truck shop; and dining area.
• The economic analysis indicates that the profitability of the potential operation will be driven by gold price, operating costs and capital costs. Given the lower grade nature of the deposit and the strip ratio, well over half of the revenues are consumed by the operating costs. Therefore, a focus on controlling costs will be important in maintaining robust project economics.
• The PFS design of the heap leach facility (HLF) consists of a geomembrane lined pad and process ponds and is intended to operate as a zero-discharge system to groundwater and surface water. The HLF is designed with a geomembrane lined satellite pond that is available to store solution if necessary, during above average climate conditions.
• The HLF provides suitable capacity to store and leach the 92 Mt of ore identified through this study. The ultimate HLF configuration is geotechnically stable and all stability sections analyzed meet the minimum factors of safety shown in the design criteria.
• For the planned HLF design, the 92 Mt of ore storage capacity requires a maximum heap height of 80 meters. The heap leach pad, as conceptually designed, is at its limit with respect to storage capacity for the proposed site, constrained by surrounding topography and the planned location of the proposed pit and the waste rock disposal area (WRD). If additional ore is identified, beyond the 92 Mt, it will be difficult and likely economically prohibitive to increase the capacity of this leach pad.
• The PFS design of the WRD provides suitable capacity to store the 54.4 Mt of waste rock. The remaining 3.4 Mt of waste rock identified in this study is planned for use as structural fills for construction of the HLF. The ultimate WRD configuration is geotechnically stable and all stability sections analyzed meet the minimum factors of safety.

Cerro del Gallo Heap Leach Project NI 43-101 Technical Report
January 31, 2020 Page 1-24
• For the planned WRD design, the 55 Mt of waste rock storage capacity requires a maximum waste rock dump height of 100 meters. The WRD, as conceptually designed, is at its limit with respect to storage capacity for the proposed site, constrained by the property boundary to the north and east, the pit to the west, and the HLF to the south.
• The WRD, as designed, is progressively reclaimed during operations to reduce the amount of contact water that may need to be managed during operations. The HLF as designed is rinsed in an effort to remove unwanted constituents from the ore, which may include metals and cyanide prior to receiving the closure cover. The HLF and WRD closure cover system will be selected to limit the infiltration as needed to meet the environmental compliance criteria.
1.17 Recommendations
The following recommendations have been made to advance the CdG Project:
• A feasibility study should be conducted if the Owner wants to reduce the outlined risks and increase the accuracies of the cost estimates.
• A detailed geotechnical characterization of the available clays within the property limits of the CDG mine should be completed to evaluate if there are sufficient clayey materials on site to be used as the low permeable soil liner bedding beneath the leach pad and ponds geomembrane liner.
• The close proximity of the proposed HLF to the proposed pit may pose a stability
risk of the pit walls to the Phase 3 heap leach pad expansion as it is currently proposed. Further stability analyses will be needed to determine if the risk is acceptable or if further stabilization efforts will be needed.
• If the geochemical investigation identified ARD (acid rock drainage) as a potential
issue, then Golder recommends performing in-situ infiltration testing throughout the WRD foundation to characterize the permeability of the foundation soils.
• A meteorological station should be constructed at the leach pad site to gather
sufficient data to compare with the data from the weather station used for the water balance.
• The 2014 PH Consultores climate study should be updated.

Cerro del Gallo Heap Leach Project NI 43-101 Technical Report
January 31, 2020 Page 1-25
• To facilitate feasibility and detailed design of the HLF and WRD, additional geotechnical field investigation and laboratory testing programs are recommended.
• Further consideration should be given to evaluating the hydrogeologic conditions
that exist at the HLF and WRD sites.
• The hydrogeologic consultant, IDEAS, recommends a detailed groundwater investigation to determine suitable locations for additional water wells.
• Monitoring of existing stream flows should be considered to measure sediment
transportation in existing streams.
• Golder recommends that additional effort be made in developing a feasible, yet proactive reclamation plan for the HLF and WRD.
• Develop a trade-off study for the closure cover system to identify the optimal cover
system with respect to cost and functionality.
• Conduct additional SART tests to optimize reagent requirements and better define penalty elements associated with the final product.
• Conduct additional static and kinetic acid base accounting tests to better define
the rate of the contained sulfides in both the ore and waste to turn acidic. Discussions and costs on the recommendations are presented in Section 26.

Cerro del Gallo Heap Leach Project NI 43-101 Technical Report
January 31, 2020 Page 2-1
2 Introduction and Terms of Reference
2.1 Technical Report Preparation
Argonaut commissioned Kappes, Cassiday & Associates to prepare a Pre-Feasibility Study for the Cerro del Gallo Project. This Technical Report has been prepared in accordance with disclosure and reporting requirements set forth in the Canadian Securities Administrators’ current “Standards of Disclosure for Mineral Projects” under the provisions of National Instrument 43-101 (NI 43-101), Companion Policy 43-101 CP and Form 43-101F1 and supersedes a Technical Report prepared by Cerro Resources dated 29 June 2012 titled “Technical Report First Stage Heap Leach Feasibility Study Cerro del Gallo Gold Silver Project Guanajuato, Mexico”. This Technical Report is issued to Argonaut. Argonaut is listed on the TSX Exchange (TSX: AR) and holds a 100% interest in the CdG deposit. Argonaut is a producing company with three gold and silver mines currently in production in Mexico: San Agustin, El Castillo and La Colorada. This study commenced during July 2019 and has an effective date of 31 January 2020. The development option considered for the CdG project is an open pit mine utilizing a three-stage fine crushing circuit with tertiary HPGR crushing, conventional heap leaching, sulfidization-acidification-recirculation-thickening for copper and silver recovery, and an adsorption, desorption recovery plant for gold recovery from pregnant heap leach solution. Support from outside consultants was obtained from Golder Associates Inc. Mine Development Associates and Zurkic Mining Consultants. Argonaut has worked closely with the contributing companies, in addition to being a direct contributor, to develop this Technical Report. The contributing companies and their responsibilities are presented in Table 2.1.1.

Cerro del Gallo Heap Leach Project NI 43-101 Technical Report
January 31, 2020 Page 2-2
Table 2.1.1 Cerro del Gallo Technical Report Contributors
Section Section Title Responsible 1 Summary All Authors 2 Introduction C. Defilippi, KCA 3 Reliance on Other Experts C. Defilippi, KCA 4 Property Description and Location B. Arkel, Argonaut
5 Accessibility, Climate, Local Resources, Infrastructure and Physiography B. Arkel, Argonaut
6 History B. Arkel, Argonaut T. Minard, Golder
7 Geological Setting and Mineralization B. Arkel, Argonaut 8 Deposit Types B. Arkel, Argonaut 9 Exploration B. Arkel, Argonaut 10 Drilling B. Arkel, Argonaut 11 Sample Preparation, Analyses and Security B. Arkel, Argonaut
12 Data Verification B.Arkel, Argonaut T. Minard, Golder C. Defilippi, KCA
13 Mineral Processing and Metallurgical Testing C. Defilippi, KCA 14 Mineral Resource Estimates N. Zurkic, ZMC 15 Mineral Reserve Estimates T. Dyer, MDA
16 Mining Methods T. Dyer, MDA, T. Minard, Golder 16.2
17 Recovery Methods C. Defilippi, KCA T. Minard, Golder 17.2.4 and 17.2.5
18 Project Infrastructure C. Defilippi, KCA 19 Market Studies and Contracts C. Defilippi, KCA
20 Environmental Studies, Permitting and Social or Community Impact C. Defilippi, KCA
21 Capital and Operating Costs C. Defilippi, KCA T. Dyer, MDA
22 Economic Analyses C. Defilippi, KCA 23 Adjacent Properties B. Arkell, Argonaut 24 Other Relevant Data and Information All Authors 25 Interpretation and Conclusions All Authors 26 Recommendations All Authors 27 References C. Defilippi, KCA
Source: KCA (2019)

Cerro del Gallo Heap Leach Project NI 43-101 Technical Report
January 31, 2020 Page 2-3
2.2 Qualified Persons and Site Visits
Carl Defilippi, RM SME, of KCA was the overall author of the Report and was responsible for processing and infrastructure and associated costs, environmental issues and the financial analysis. Mr. Defilippi is an independent Qualified Person under NI 43-101. Mr. Defilippi visited the site on 4 September 2019. During the visit, Mr. Defilippi inspected drill core, reviewed locations of process and infrastructure facilities and met with local personnel to discuss the Project. Thomas L. Dyer, PE of MDA is responsible for the statement of Proven and Probable mineral reserves, mining methods, and mining capital and operating costs. Mr. Dyer is an independent Qualified Person under NI 43-101. Mr. Dyer visited the site in June, 2010. During his visit, Mr. Dyer reviewed core and the proposed mining and dumping sites. Brian Arkell, VP Exploration for Argonaut, is responsible for geological and exploration information along with validation of the drill hole and assay data. Mr. Arkell has visited site on numerous occasions in 2018 and 2019, reviewed surface geology, drill core and RC cuttings, sampling and assaying procedures, as well as preparation of the geological and resource models. Todd Minard, P.E. (Nevada and California), of Golder Associates Inc. is responsible for the design of the heap leach facility (HLF) and waste rock dump (WRD). Mr. Minard visited the site in February 2014 and October 2019. While on site Mr. Minard conducted visual examination of the HLF and WRD ground conditions and identified candidate liner bedding sources that will be evaluated in future geotechnical investigation. Neb Zurkic, president of Zurkic Mining Consultants, is responsible for the updated Mineral Resource Estimate. Mr. Zurkic conducted a three-day site visit in July 2018 in order to examine drill core, RC drill cuttings, and to examine the onsite geology. There is no affiliation between Mr. Defilippi, Mr. Dyer, Mr. Minard and Mr. Zurkic and Argonaut, except that of an independent consultant / client relationship. Mr. Arkell is the VP of Exploration for Argonaut. The effective date of the Mineral Resource is October 24, 2019. The effective date of the Mineral Reserve is October 24, 2019. The issue date of this Technical Report is January 31, 2020.

Cerro del Gallo Heap Leach Project NI 43-101 Technical Report
January 31, 2020 Page 2-4
2.3 Units of Measure
All currency amounts in this Technical Report are stated in terms of U.S. dollars (US$) unless otherwise stated. Units of measure are metric, unless otherwise specified. The costs were estimated based on quotes and cost data as of 3rd quarter 2019. Units of measure and abbreviations that may occur in this Technical Report are summarized in Table 2.3.1.
Table 2.3.1 Cerro del Gallo Units of Measure and Abbreviations
Abbreviation Description ALS ALS Chemex laboratory AQ Core diameter (usually ~ 2.7 cm diameter) Au Gold AuEq / AuEqV Gold equivalent Ag Silver BWI Bond ball mill work index Ca(OH)2 Calcium hydroxide, hydrated lime Cdn$ Canadian currency (dollars) CIM Canadian Institute of Mining, Metallurgy, and Petroleum cm3 Cubic centimeter cm2/s Centimeter per second CV Coefficient of variation DDH Diamond drill hole (core) g or gms Gram G&A General and administrative g/L Grams per liter g/t or g/mt Grams per metric tonne Grd-Thk Grade times thickness product Ha Hectare HDPE High-density polyethylene HQ Drill core diameter (~ 63.5 mm diameter) ICP Inductively coupled plasma analytical method ICP-AES Inductively coupled plasma analytical method ID2 Inverse distance squared ID3 Inverse distance cubed kg/t or kg/mt Kilogram per tonne km Kilometer km2 Square kilometers kW Kilowatt kWh Kilowatt-hour lb Pounds LLDPE Linear-low-density polyethylene L/Hr/m2 Liters per hour per square meter m Meter M Million

Cerro del Gallo Heap Leach Project NI 43-101 Technical Report
January 31, 2020 Page 2-5
Abbreviation Description Mµ Microns m2 Square meters m3 Cubic meters m3/hr Cubic meters per hour masl Meters above sea level mm Millimeter mg Milligram MXN Mexican currency (peso) NaCN Sodium cyanide NN Nearest neighbor model Nm3/hr Normal cubic meters per hour NQ Drill core diameter (~ 47.6 mm diameter) NSR Net smelter return oz Troy ounce approximately (31.1035 grams) PEA Preliminary economic assessment ppb Parts per billion ppm Parts per million ppmv Parts per million by volume PQ Drill core diameter (~ 85.0 mm diameter) QA/QC Quality assurance/quality control QQ Quantile-quantile plot RC Reverse circulation drilling method RPD Relative percent difference RQD Rock quality designation SMU Selective mining unit scfm Standard cubic feet per minute t Metric tonne (1,000 kg) Mt Million tonnes tpy or t/y Tonnes per year t/d Tonnes per day t/h Tonnes per hour t/m3 Tonnes per cubic meter US$ or USD US currency (dollars) US$M US currency (dollars) in millions UTM Universal Transverse Mercator % Percent
Source: KCA (2019)

Cerro del Gallo Heap Leach Project NI 43-101 Technical Report
January 31, 2020 Page 3-1
3 Reliance on Other Experts
The authors are not experts in Mexican legal, civil, environmental or tax matters. The authors of this report have relied on information from Argonaut pertaining to:
• the assessment of the legal validity of mining claims or concessions; private lands, mineral rights, royalties, property agreements;
• environmental and permitting legal issues; • social and community impacts of development of the Project; • guidance on actions and policies needed to ensure that Argonaut obtains and
maintains social license to operate the Project; and, • appropriate tax implications.

Cerro del Gallo Heap Leach Project NI 43-101 Technical Report
January 31, 2020 Page 4-1
4 Property Description and Location
4.1 Location
The CdG Project is wholly owned by San Antón de Las Minas S.A. de C.V. (San Antón) a resident Mexican company owned 100% by Argonaut, a Canadian company with corporate offices in Reno, Nevada. The CdG Project is located in the state of Guanajuato, approximately 270 km northwest of Mexico City. The Project is roughly centered on latitude 21° 04’ 28” N, longitude 101° 01’ 38” W and lies mainly within the Municipality of Dolores Hidalgo with some concessions extending westerly into the Guanajuato municipality. The project location is presented in Figure 4.1.1. The CdG Project lies within the San Antón de las Minas mining district and is only 23 km east-northeast of the historic Guanajuato Mining District which has recorded production of over 1.4 billion ounces of silver and 6.5 million ounces of gold. Production records for the San Antón district date back to the 1860’s but there was mining activity much earlier during Spanish colonial times with production coming from epithermal vein systems. The district lies within the central-southern segment of the world-class Mexican Gold-Silver Belt. The CdG Project is located on the Servicio Geológico Mexicano (SGM) and Instituto Nacional de Estadística Geografía e Informática (INEGI) Guanajuato 1:50,000 scale topographic/geologic map (F14-C43), and Guanajuato 1:250,000 scale topographic/geologic sheet 14-7. The coordinate system used for all maps and sections in this report is Universal Transverse Mercator (UTM) WGS84 Zone 14, Northern Hemisphere.

Cerro del Gallo Heap Leach Project NI 43-101 Technical Report
January 31, 2020 Page 4-2
Figure 4.1.1 Location Map of the Cerro del Gallo Property in Guanajuato
Source: Argonaut (2019)
4.2 Concessions
The following information on the mineral titles was compiled by Mr. Javier Tolano, Argonaut’s Land Manager. Argonaut currently has title to 14 concessions totaling 15,275.70 Ha, as listed in the following Figure 4.2.1 and Table 4.2.1. Concession taxes are due each year in the months of January and July. The total holding costs for 2019 translates to approximately USD$296,000. Mining concessions in Mexico also have a minimum annual investment which in 2019 at CdG will total approximately USD$2,160,000. Taxes and investment requirements are calibrated based on surface area and the age of the concessions.

Cerro del Gallo Heap Leach Project NI 43-101 Technical Report
January 31, 2020 Page 4-3
Figure 4.2.1 Argonaut Concessions
Source: Argonaut (2019)
Table 4.2.1 Concession Status
Concession Name Title Number
Surface (Hectares) Grant Date Expiry
Date La Libertad 198427 32 26/11/1993 25/11/2043 San Antón 205335 2,201 08/08/1997 07/08/2047 El Ciprés 210168 14 10/09/1999 09/09/2049 San Luis Rey 212914 186 13/02/2001 12/02/2051 Ave de Gracia 216707 64 17/05/2002 16/05/2052 Dolores 220922 1,665 28/10/2003 13/02/2052 San Antón KM Dos 224371 189 29/04/2005 28/04/2055 San Antón KM Tres 229340 3,462 11/04/2007 10/04/2057 La Libertad Dos 235551 18 19/01/2010 18/01/2060 San Antón KM Fracc 1 246141 5,869 28/02/2018 04/04/2055 San Antón KM Fracc 2 246142 385 28/02/2018 04/04/2055 Nuevo San Antón Fracc 1 246651 685 16/10/2018 26/10/2048 Nuevo San Antón Fracc 2 246652 135 16/10/2018 26/10/2048 Nuevo San Antón Fracc 3 246653 372 16/10/2018 26/01/2048 San Antón KM Cuatro Pending
Source: Argonaut (2019)

Cerro del Gallo Heap Leach Project NI 43-101 Technical Report
January 31, 2020 Page 4-4
4.3 Net Smelter Return Royalties
Some concessions making up the CdG Project are subject to Net Smelter Return (NSR) royalties as follows: The San Antón concession T-205335 is subject to a 4% NSR royalty to Servicio Geológico Mexicano (SGM). La Libertad T-198427, Nuevo San Antón T-208424, El Cipres T-210168, Ave De Gracia T-216707 and Dolores (T-220922) concessions are subject to a 3% NSR royalty to Nanjo Royalties S. de R.L. de C.V. The overall average is calculated to be 3.75% for the reserves outlined in this study.

Cerro del Gallo Heap Leach Project NI 43-101 Technical Report
January 31, 2020 Page 5-1
5 Accessibility, Climate, Local Resources and Physiography
Accessibility
The CdG Project is located in the central region of Guanajuato state, approximately mid-way between the cities of Guanajuato and Dolores Hidalgo (Figure 5.1.1). The Project lies 23 km east northeast of Guanajuato, the state capital, and 270 km northwest of Mexico City. The Project has year-round unrestricted access provided by a network of well-maintained roads. The principal access route to the area is by paved Federal Highway 110, then 17 km of well-maintained all-weather gravel road. Travel time from Dolores Hidalgo requires approximately 30 minutes and approximately one hour from Guanajuato. There is an international airport at the city of Leon, which is 30 minutes from Guanajuato.
Figure 5.1.1 Cerro del Gallo Accessibility
Source: Argonaut (2019)

Cerro del Gallo Heap Leach Project NI 43-101 Technical Report
January 31, 2020 Page 5-2
The CdG Project is located within a region of well-established infrastructure. The property area is well serviced by road, rail, and air services, power and water supplies, and skilled and semi-skilled local labor. Surrounding cities can provide nearly all of the services required for a major mining operation. Guanajuato municipality has a population of around 153,000 while Dolores Hidalgo has approximately 135,000 inhabitants. The small community of San Antón de las Minas, which is adjacent to the Project, has a population of nearly 500 and is a reliable source of semi-skilled and unskilled labor to assist in project support.
Physiography
The CdG Project is situated in the physiographic region known as the Sierra Madre Oriental. Elevations in the area range from 1,800 meters to 2,670 meters, with the top of CdG having an elevation of 2,310 meters. CdG is located along the flank of the San António Mountain Range which trends generally 20° NW. CdG itself is a distinct conical-shaped hill within an otherwise undulating landscape, as seen in Figure 5.2.1.
Figure 5.2.1 View looking Southwest at Cerro del Gallo
Source: Argonaut (2019)

Cerro del Gallo Heap Leach Project NI 43-101 Technical Report
January 31, 2020 Page 5-3
Climate
The municipality of Dolores Hidalgo is classified as semi-arid. The climate is generally dry with sporadic rainstorms in the summer months. Average annual precipitation is 586 mm mainly from June to September. The monthly average, 1 in 100 wet year, and 1 in 100 dry year precipitation depths are summarized in Table 5.3.1. The winter months are cool and dry. Temperatures range from a maximum of 36.5°C in summer to a minimum of 3.8°C in winter. The average yearly temperature is 17.4°C. The mine will be operated year-round.
Table 5.3.1 Cerro del Gallo Average and Extreme Precipitation
Month Average Precipitation
1 in 100 Wet Year
1 in 100 Dry Year
Jan 15.00 30.51 0.00
Feb 11.80 24.00 0.00
Mar 8.40 17.09 0.00
Apr 10.80 21.97 0.00
May 33.80 68.75 0.00
Jun 99.60 202.60 0.00
Jul 138.10 280.91 0.00
Aug 108.90 221.52 0.00
Sep 102.80 209.11 0.00
Oct 37.10 75.47 0.00
Nov 10.30 20.95 0.00
Dec 9.60 19.53 0.00
Annual 586.20 mm 1,192.40 mm 0.00 mm Source: (PHCA 2014)

Cerro del Gallo Heap Leach Project NI 43-101 Technical Report
January 31, 2020 Page 6-1
6 History
6.1 Project History
Within the San Antón de las Minas district (CdG Project) there is ample evidence of widespread prospecting activity and limited underground production, dating back to Colonial times. Little information is available for these early activities. The history during modern times is summarized as follows: In early 1977, as part of a combined federal and state government program to encourage new investment in the mining industry, the Consejo de Recursos Minerales (CRM, today Servicio Geológico Mexicano), the Mexican equivalent of a Department of Mines, began an assessment of the San Antón de las Minas area. This activity included an assessment of the Carmen-Providencia epithermal vein system and regional geological mapping, stream-sediment geochemistry, prospect evaluation, and airborne magnetics. The CRM were probably the first group to recognize intrusive related disseminated copper and gold mineralization at CdG. Starting in 1982, the Sociedad Cooperativa Minero Metalúrgica Santa Fe de Guanajuato S.C.L. (Cooperativa) conducted exploration activities in the area with a focus on the districts epithermal vein systems. This included evaluating the Carmen-Providencia vein system where they rehabilitated the Dolores shaft to the 90-meter level, re-opened the La Mora adit, and commenced development of the Carmen adit along a section of the Carmen vein near the Dolores shaft. Reportedly, two truckloads of ore totaling 20.9 tons grading 82 g/t silver and 2.15 g/t gold were mined. In 1983, the Cooperativa conducted the first drilling at CdG with the completion of six core holes for a total of 1,571 meters. This work focused on veins and only select vein intervals were assayed for gold and silver. In 1994, the Cooperativa sold two small contiguous claim blocks to Luismin S.A. de C.V. (Luismin). These concessions covered portions of CdG and the Ave de Gracia epithermal vein system. Luismin’s work included drilling 15 holes at CdG totaling 3,551 meters. Luismin was the first company to focus on the potential for an open pit mining operation at CdG. Subsequently, Luismin acquired five additional mining concessions referred to as La Libertad, Nuevo San Antón, El Cipres, Ave de Gracia and Dolores. During 2002, Wheaton River Minerals (Wheaton) acquired the Luismin gold/silver properties in Mexico, including the San Antón Project. Two years later, in 2004,

Cerro del Gallo Heap Leach Project NI 43-101 Technical Report
January 31, 2020 Page 6-2
Goldcorp acquired Wheaton which, at the time, held a 49% interest in CdG with San Antón holding 51%. In 2004, Wheaton entered into a Joint Venture Agreement with the Australian based company, Kings Minerals NL to form the operating company San Antón de las Minas S.A. de C.V. (San Antón). The Agreement gave Kings Minerals the right to earn a 51% interest in the project. This was accomplished by reimbursing Wheaton USD$510,000 and expending USD$3,000,000 over the first two years of the venture commencing in July of 2004. These expenditures were completed in November 2005, giving Kings Minerals a 51% interest in San Antón. During 2004, Wheaton also purchased the San Antón concession from Cooperativa. Later, after the joint venture with Cerro Resources was formed, an additional five mining concessions were granted, as follows: San Antón KM, San Antón KM Dos, San Antón KM Tres, San Antón KM Cuatro and La Libertad Dos. The San Luis Rey concession was also purchased. In December of 2006, Kings Minerals completed a business combination agreement with a publicly listed Canadian Company called Andaurex Industries (Andaurex), which resulted in a new entity called San Antón Resources Corporation. San Antón Resources Corporation was subsequently listed on the Toronto Stock Exchange. The main asset of this Company was the San Antón Project. As the result of this combination, Kings Minerals held a 71% interest in the 51% ownership of the San Antón Project under the San Antón JV with Goldcorp. In September of 2010, a business combination was completed with Andaurex whereby Kings Minerals acquired all of the San Antón common shares it did not already own, giving Kings Minerals 100% ownership of its portion of the San Antón Joint Venture. Prior to this, in 2008, the Company’s name on the Toronto Exchange was changed to Cerro Resources. At this time, Cerro Resources held a 65.7% interest in the San Antón JV, with the remaining 34.3% owned by Goldcorp. Goldcorp’s original 49% interest was diluted to 34.3% due to them electing not to participate in the 2007 and 2008 exploration programs funded 100% by Cerro Resources. Cerro Resources held the property until 2011 and carried out programs of reverse circulation and core drilling. Several geochemical sampling programs were also completed. While they held the property, Cerro Resources and their predecessor company San Antón completed 280 RC holes totaling 59,595 meters and 74 core holes totaling 36,384 meters. An early focus of Cerro Resources was exploring several epithermal vein systems in the district. Drilling on these was distributed as follows: 18 holes (4,069 meters) into the Dolores area (Dolores shaft), 26 holes (6,158 meters) into the Empalizada area, and 14

Cerro del Gallo Heap Leach Project NI 43-101 Technical Report
January 31, 2020 Page 6-3
holes (4,337 meters) into the Espiritu Santo area. A further 13 holes (1,768 meters) were drilled at San Luis Rey. Most holes tested the upper level of the epithermal vein systems to a depth of 150 to 300 meters. Although Cerro Resources did test some vein systems, their main focus was the evaluation of the CdG copper-gold system. This work included completion of technical reports in 2008, 2011 and 2012. The 2008 report is titled: Technical Report on the Cerro del Gallo deposit within the San Antón Property Mexico, Prepared by San Antón Resource Corporation Inc. Ottawa, Canada. This report envisioned a very large operation that included mining the entire copper-gold porphyry system and construction of a flotation mill. The M&I stated resource in this 2008 report totaled 461 million tonnes, grading 0.27 g/t Au, 11 g/t Ag and 0.11% Cu. The 2011 report titled: Technical Report, Feasibility Study and Preliminary Assessment, Cerro del Gallo Project, Guanajuato, Mexico (Feasibility level study on the heap leach and a Preliminary Assessment on a milling scenario), superseded previous works and focused only on the gold and silver resource. The Report envisioned a total open-pit mine-life of 14 years with the first seven years being a heap leach operation followed by construction of a CIL mill to process the un-oxidized mineralized material. In May of 2012, Cerro Resources completed another report titled: Technical Report, First Stage Heap Leach Feasibility Study, Cerro del Gallo Gold Silver Project, Guanajuato, Mexico. This report re- examined the economics of an open pit heap leach operation and did not include the additional study for a milling operation, as was presented in the 2011 Technical Report. In May of 2013, Primero Mining Corp. (Primero) announced the completion of a transaction with Cerro Resources whereby Primero acquired all of the issued and outstanding ordinary shares of Cerro Resources, thereby taking ownership of Cerro Resources 69.2% interest in the CdG Project. In December of 2013, Primero also announced that it had made arrangements to acquire Goldcorp’s then 30.8% interest in the project. Primero considered CdG as a potential long-life project and, in 2013, announced approximately 1.0 million ounces of gold-equivalent proven and probable reserves and 1.6 million ounces of gold-equivalent measured and indicated resources (exclusive of reserves). The heap leachable proven and probable reserves measured 32.2 million tonnes grading 0.69 g/t gold for 712,000 ounces. This tonnage also contained 15 million ounces of silver grading 14 g/t. Primero’s objective was to put the project into production in 2015. In 2013 Primero completed 50 core holes totaling 12,623 meters in

Cerro del Gallo Heap Leach Project NI 43-101 Technical Report
January 31, 2020 Page 6-4
the resource area. Of these, 13 were PQ sized twin holes for metallurgical study and 19 were infill holes. The rest were for condemnation and to test for acid generation. In general, the fill-in drilling confirmed the existing mineralization model and the resource did not materially change. The metallurgical drilling, among other things, identified the complexity of the oxide distribution. A large part of Primero’s focus during their time with the project was to better classify the degree of oxidation through the mixed-zone and predict heap leach recoveries. Primero did not complete a Technical Report, but in 2014 the consulting company BBA was engaged by Primero to complete a fairly extensive metallurgical program and authored a Technical Report titled “Cerro del Gallo Metallurgical Test work 2014.” In general, this work assigned different heap leach recoveries depending on ore type, with near surface weathered ore being 76%, high-oxidized mixed-ore at 60% and low-oxidized mixed-ore at 50%. In comparison, a 2012 resource study by Cerro Resources gave all of the mixed ore a gold recovery of 64%. In August of 2015, Primero engaged JDS Energy and Mining (JDS) to conduct an Open Pit Optimization study utilizing the above recoveries for the various ore types. This work was a relatively conservative look at the previous resource and mine-plan with an emphasis on the strongly oxidized weathered portion of the deposit and select areas of the mixed ore that lies immediately beneath the weathered zone. The JDS study resulted in a drop in grade and contained ounces but did incorporate a more selective mining plan that significantly decreased the strip ratio and lessened the risks of mining less oxidized material with low recoveries. Primero also went through the exercise of re-logging historic cuttings to better understand the distribution of oxidation and, in the process, divided the mixed oxide zone into highly oxidized (weathered and not part of the mixed zone) strong to medium oxide, weak oxide and fresh. In addition to advancing the CdG mineral system, Primero evaluated several of the known epithermal vein systems in the district. Their work included detail geological mapping, stream sediments sampling, extensive soil sampling, rock chip sampling and analyses of available geophysical data. They completed 25 drill holes in vein targets totaling 4,218 meters that were distributed as follows: 19 drill holes in the Carmen-Providencia vein system, two drill holes in the Ave de Gracia vein, two drill holes in the Espiritu Santo vein and one hole in the La Paz vein.

Cerro del Gallo Heap Leach Project NI 43-101 Technical Report
January 31, 2020 Page 6-5
In 2015, Primero elected not to put CdG into production and expenditures on the project were significantly reduced. The project became a low priority for the Company with limited activity during 2016 and 2017. In December of 2017, Argonaut made a cash purchase of the CdG Project. Argonaut recognized the complexities associated with the mixed oxide mineralization and completed a quantitative re-classification (in percentage) of oxide and sulfide material by examining RC drill cuttings contained in historical “chip trays.” This work utilized four oxidation domains with this data transferred to 50 meter spaced vertical cross-sections through the CdG deposit. This led to development of a three-dimensional model, generated by Leapfrog software. In mid-2018, utilizing its updated geologic and oxide distribution model, Argonaut designed and implemented a core drilling program to obtain additional material for metallurgical testing and to better refine its understanding of the mixed oxide mineralization. The program consisted of 18 PQ sized core holes totaling 1,484.5 meters. The core was combined into 11 composites representing both intrusive hosted mineralization and sediment hosted mineralization and made up of varied oxidation states and grade ranges. The material was sent to KCA in Reno, NV for column heap leach testing.
6.2 Historical Heap Leach Facility and Waste Rock Dump Geotechnical
The following geotechnical aspects of the HLF and WRD sites at the Project site have been characterized in accordance with NOM-155 (Norma Oficial Mexicana), Sections 5.3.2 and 5.3.3.
Site Soil and Bedrock Geotechnical Characterization
6.2.1.1 Geotechnical Investigations Starting in 2011, three geotechnical subsurface investigations were performed at the CdG site to support various technical studies. Refer to Golder 2019 for test pit and boring logs from the various field explorations. The investigations include:
• 2011: Knight Piésold (KP, 2012a): o Excavated 34 test pits (TP-01 through TP-39) o Drilled 4 borings (BH-01, BH-02, BH-03, and BH-05) o 8 Ripping trials
• 2013: Knight Piésold (KP, 2013): o Excavated 40 test pits (KPTP-01 through KPTP-40) o Drilled 11 borings (KPBH-01 through KPBH-08, KPBH-08A, KPBH-09,
and KPBH-10) • 2014: Golder Associates (Golder 2014):
o Excavated 15 test pits (TP-55 through TP-70)
Cerro del Gallo Heap Leach Project NI 43-101 Technical Report
January 31, 2020 Page 6-6
6.2.1.1.1 2011 Test Pits Test pits were excavated within areas of the proposed leach pad, the solution ponds, and crusher and to achieve general site coverage. Test pits were excavated to depths ranging from approximately 1½ to 7 meters. Subsurface conditions encountered in each test pit were logged and photographed, and representative samples were collected for laboratory testing.
6.2.1.1.2 2011 Geotechnical Borings Four borings were drilled to depths ranging between 12 meters and 26 meters. Each boring was drilled from the ground surface using HQ-size wireline diamond coring. Core was placed into boxes and geotechnically logged. Rock core samples were taken for laboratory testing to assist in the estimation of rock strength design parameters.
6.2.1.1.3 2011 Ripping Trials Ripping trials were performed at eight locations to ascertain the rip-ability of the near-surface bedrock. Each trial ran approximately 100 meters in length. In most cases, the ripping went smoothly with full tyne penetration and the bulldozer progressed without appreciable slowing. Ripping slowed somewhat in one location at the western boundary of the HLF (near Test Pit KP-CDG-TP-29) due to the presence of large granitic boulders up to one meter in diameter embedded in a clayey ash matrix.
6.2.1.1.4 2013 Geotechnical Borings Eleven geotechnical borings were drilled in 2013. Each boring was drilled from the ground surface using HQ size wireline diamond coring, with the exception of KPBH-08A. Boring KPBH-08A was drilled from the ground surface to a depth of 6 meters using a tri-cone rock roller and from 6 meters to 23 meters using diamond coring. Core was placed into core boxes and transported for logging, photographing, sampling and storage. Standard Penetration Tests (SPTs) were undertaken in four of the borings from between 1½ and 13½ meters depth at typical intervals of 1½ meters. Upon completion of the drilling program, KP requested that Primero grout the geotechnical borings. No groundwater monitoring installations were fitted to the geotechnical borings.
6.2.1.1.5 2013 Test Pits In 2013, a total of 40 test pits (KPTP-01 through KPTP-40) were excavated across the plant site areas, heavy vehicle workshop, dam sites and potential borrow areas. The test pits were excavated to depths ranging from ½ meters to about 6 meters with the final depth dependent on the available space, ground hardness and test pit target depth. The subsurface conditions encountered in each test pit were logged and photographed.

Cerro del Gallo Heap Leach Project NI 43-101 Technical Report
January 31, 2020 Page 6-7
Representative samples of the subsurface materials were collected for laboratory testing. All test pits were backfilled with excavated spoil on completion of excavation.
6.2.1.1.6 2014 Test Pits Golder excavated 15 test pits in 2014 within the footprint of the proposed waste dump area and along the perimeter of the WRD. Samples were collected and soil and rock descriptions were prepared. A backhoe was used at 11 of the sites. At four sites, exposures of soil and rock in natural slopes and cut slopes enabled direct observation of soil and rock conditions. Samples were sent to Golder’s soil testing laboratory in Houston, Texas for testing.
6.2.1.2 Geotechnical Laboratory Testing Representative samples of the subsurface materials were obtained from the test pits, borings, and from near-surface bulk sampling. Selected samples were tested between 2011 and 2014 to determine the critical engineering properties of the materials encountered. Samples were shipped to two laboratories; an independent testing laboratory, Segeomex in San Luis, Potosi, or to the Golder laboratory in Houston, Texas. Geotechnical Laboratory testing included the following:
• Natural water content determination (ASTM D2216) • Atterberg limits determination (ASTM D4318) • Particle size distribution analysis (ASTM D422/C136) • Moisture-density relationship [standard Proctor compaction] (ASTM D698) • Moisture-density relationship [modified Proctor compaction] (ASTM D1557) • Unconfined compressive strength (UCS) testing of rock (ASTM D2938/7012) • Unconfined compressive strength testing with measurement of Young’s modulus
(ASTM D3148) • Emerson dispersion analysis (ASTM D4229) • Flexible wall triaxial permeability on remolded soils (ASTM D5084 Method F) • Point load index testing (ASTM D5731) • Los Angeles Abrasion testing (ASTM C131) • Stage-loading permeability testing
Summaries of the above laboratory test results are presented in a December 2019 Golder design report.
6.2.1.3 Borrow Source Laboratory Testing
6.2.1.3.1 Liner Bedding Remolded permeability tests were performed on samples obtained by Knight Piésold (KP, 2012a) from within the upper colluvium and residual soils within the footprints of

Cerro del Gallo Heap Leach Project NI 43-101 Technical Report
January 31, 2020 Page 6-8
the HLF and WRD, as well as from a potential borrow area located approximately 1,800 meters northwest of the WRD. These soils were tested to evaluate their potential for use as a soil liner bedding beneath the leach pad geomembrane liner. Testing of soils sampled from potential off-site borrow areas indicate permeability values of 6.9 x 10⁻⁵ cm/sec (Silty Sand) to 1.8 x 10⁻⁵ cm/sec (Clayey Gravel). Laboratory tests performed on native on-site materials indicate permeability values of 2.17 x 10⁻⁴ cm/sec (Silty Gravel) to 4.64 x 10⁻⁶ cm/sec (Lean Clay). Golder performed permeability tests on native materials obtained from the footprint of the WRD at various confining pressures. Two tests were performed at a confining pressure of 69 kPa with results of 5.90 x 10⁻⁶ and 3.27 x 10⁻⁶ cm/sec. Three tests were performed at a confining pressure of 138 kPa and ranged from 1.5 x 10⁻⁶ to 9.38 x 10⁻⁷ cm/sec. Two tests were performed at confining pressures of 155 kPa and 172 kPa with results of 1.32 x 10⁻⁶ cm/sec and 1.18 x 10⁻⁶ cm/sec, respectively. These materials were classified as Clayey Sand or Lean Clay and meets the maximum required project permeability of 1 x 10⁻⁵ cm/sec. Additional investigations will be performed in 2020 to determine the volume of clay available beneath the WRD.
6.2.1.3.2 Overliner Material Point load strength index (Is) tests were performed on select rock core samples of low-grade ore to determine the materials suitability for use as overliner material. Point load tests performed by Golder’s Mississauga, Ontario laboratory in accordance with ASTM D5731 and the International Society of Rock Mechanics (ISRM) indicate that the intact strength of the rock material can be classified as strong rock (R4) with an estimated unconfined compressive strength ranging between 38 megapascals (MPa) and greater than 230 MPa. Two samples were selected from the point load test and crushed to a maximum particle size of 50 mm per the specification for overliner material. Crushed samples were shipped to Golder’s Denver, Colorado laboratory for durability and loaded–permeability testing. Durability of the overliner material was tested in accordance with ASTM C131. Test results indicated a loss between 22 and 23 percent using a grading designation of “A”. A mass loss less than 45 percent after 500 revolutions satisfies the minimum durability requirements for use as overliner, concrete aggregate, and riprap materials. Staged loading, constant head, rigid-wall permeability tests were performed on two samples of proposed overliner material. The samples were loaded to a pressure of 1520 kilopascals (kPa) to simulate overburden pressures from up to 80 meters of heap ore. The constant head permeability tests were performed using 380 kPa, 760 kPa, 1140 kPa, and 1520 kPa vertical pressures. Test results indicate that permeabilities
Cerro del Gallo Heap Leach Project NI 43-101 Technical Report
January 31, 2020 Page 6-9
ranged from 2.5 cm/sec to 4.4 cm/sec, which exceeds the minimum required project permeability of 0.1 cm/sec.
6.2.1.4 Subsurface Geotechnical Conditions The geotechnical profile of the foundation materials below the HLF and WRD sites is based on the findings of the investigations listed above and the geotechnical laboratory testing. Subsurface descriptions are based on the conditions encountered at the time of exploration. Soil and subsurface water conditions outside of the exploration locations may vary from those encountered during the field explorations.
6.2.1.4.1 Subsurface Soil and Bedrock Profile Geotechnical conditions at the HLF and WRD sites are relatively uniform, consisting of a sequence of shallow soils blanketing bedrock. Where exposed, bedrock conforms uniformly to the ground surface and there are few outcrops that extend above the ground surface. The ground is stable with no signs of instability or landslides, and Golder observed no signs of recent faulting. The risk of liquefaction in soil deposits is negligible due to the dense and dry nature of soil deposits. These conditions are well-suited to provide safe and stable support of the proposed HLF and WRD. From top to bottom, the geotechnical sequence with depth consists of:
• Topsoil • Colluvium and Alluvium Soils • Residual Soils • Highly- to Moderately-Weathered Bedrock
The soil cover above the Highly- to Moderately- to Highly-Weathered Bedrock was typically between 0.2 meters and 0.5 meters in depth, but extended as deep as 5 meters in valley slopes. Bedrock was exposed in the base of most drainages where soils had been eroded.
6.2.1.4.1.1 Topsoil A surficial topsoil layer blankets the WRD and HLF sites averaging about 0.1 to 0.2 meters in thickness. In general, the topsoil consisted of dry Silty to Clayey Sand, with minor fractions of Silt and Lean Clay and varying amounts of fine to coarse, angular gravels. The soil was generally non-plastic to low plasticity, though some soils exhibited moderate plasticity, and topsoil was classified as loose to medium dense and dry. Root growth and organic content was variable across the site due to the variability of vegetation. Where more densely vegetated, topsoil had a high root content, and plant and tree roots extended below the topsoil layer to depths of a meter or more.

Cerro del Gallo Heap Leach Project NI 43-101 Technical Report
January 31, 2020 Page 6-10
6.2.1.4.1.2 Colluvium and Alluvium Soils Most explorations encountered Colluvium beneath the topsoil predominantly on the slopes of hills and drainages, and Alluvium was encountered near the base of drainages. Colluvium was documented in thickness ranging from 0.2 to 0.9 meters, and Alluvium was observed in deposits as deep as 5 meters. The Colluvium classified similar to the Topsoil as a Silty to Clayey Sand or Silty Gravel, with plasticity varying from non-plastic to moderate plasticity. The fraction of angular to subangular gravel and cobbles increased with depth. Because of the relatively steep and hilly topography, Alluvium consisted of flood deposits and slope wash deposits, and classified as Silty to Clayey Sand and Gravel, with varying fractions of angular cobbles and small boulders. Colluvium and Alluvium were classified as medium dense to dense, and dry to moist.
6.2.1.4.1.3 Residual Soils and Highly-Weathered Bedrock Residual soils were observed in most explorations either directly below the topsoil or below the Alluvium and Colluvium deposits. Their mineralogy and soil descriptions were variable, reflecting the underlying volcani-clastic sedimentary rock and welded ash flow tuff bedrock, as well as degree of weathering. The Residual soil layer was thin, generally 0.2 meters to 0.4 meters in thickness. These soils were characterized as blends of angular gravels, sands, silts, and clays, with occasional angular cobble-sized fragments. Gravel and cobble-sized rock were typically weathered shale and siltstone fragments similar to the underlying bedrock. On ridges, these soils were more extensively weathered to contain a higher fraction of plastic fines (clays), with classifications of Clayey Sand with Gravel and Clayey Sand, and were dark brown or red brown in color. The Silty Sand, Silty Gravel, and Silty Sand with Gravel encountered on valley slopes were either non-plastic or had low plasticity, and were medium brown in color. Observed moisture was variably dry to moist.
6.2.1.4.1.4 Moderately- to Highly-Weathered Bedrock Three rock types associated with the Esperanza Formation were observed in the foundations of the HLF and WRD. Sedimentary deposits of siltstone and shale, with minor deposits of sandstone, dominate the HLF and WRD sites. At shallow depths, these deposits are highly fractured and highly-weathered, and become lease fractured and weathered with depth. This rock was platy when ripped or excavated, with rock dimension typically ranging from about 1 to 4 cm, but occasionally as large as 30 cm. While excavating test pits, backhoe refusal was typically encountered at depths of 2 to 5 meters. Rock strength was classified as medium to high strength, and color was described as variably orange, yellow, cream, gray, and green.

Cerro del Gallo Heap Leach Project NI 43-101 Technical Report
January 31, 2020 Page 6-11
A gneiss deposit underlying the sedimentary sequence has been exposed in the base of drainages of the HLF as observed in Test Pits KP-CDG-05, -20, and -22. The cream-colored rock is less weathered, less fractured, and of higher strength than the sedimentary sequence, and forms a relatively non-erosive channel bed where exposed. Where lightly weathered, test pit excavation was difficult. An exposure of hydrothermally altered tuff was mapped and identified by test pits in the footprint of the Stage 2 leach pad. Tan in color and soft, this deposit had indistinct thick bedding and appeared as a lightly- to moderately-cemented soil deposit predominated by silty to clayey sand. Zones contained gravel and cobbles, and the rock was blocky when excavated. The deposit was similar to the massive tuff deposits exposed in the proposed pit area and was observed to weather readily when exposed and to be highly erosive, resulting in deeply-incised outcrops. Laboratory testing indicated that the elastic modulus (Es) of the bedrock ranges from 38 to 7,465 megapascals (MPa) within the upper 10 meters of the subsurface profile with unconfined compressive strengths (UCS) ranging from 3.68 to 27.05 MPa. From depths of 10 to 20 meters, the UCS ranges from 2.71 to 78.65 MPa, and Es ranges from 908 to 14,798 MPa. From 20 to 40 meters, the UCS ranges from 1.74 to 20.62 MPa with Es ranging from 732 to 44,323 MPa.
6.2.1.4.2 Subsurface Water Based on a review of the referenced documents, subsurface water was generally not observed during drilling and test pit excavation activity, with the exception of Boring BH-01 (KPC 2012b). This boring was drilled within the limits of the HLF area with subsurface water encountered at an approximate depth of 8.9 meters below the ground surface. The project area is generally a rock site in hilly terrain and minor localized springs are present in the base of the drainages in the HLF and WRD footprint; however, the regional ground water table is deep with some perched flow through fractured rock and geologic contacts. It is anticipated that the ground water will not significantly affect the strengths of the bedrock below the WRD and HLF. However, groundwater conditions can fluctuate depending on seasonal precipitation, irrigation, and other factors.
Site Seismicity
The Project site is located in the Zone B, Peneseismic Region, as shown on NOM-155, Figure 3 Regiones Sísmicas en la República Mexicana. The Peneseismic Region of Mexico has low to moderate seismicity. Knight Piésold prepared a site-specific seismic hazard assessment of the project site in 2011 to more closely define seismic risks and to develop seismic parameters for use in facilities design (KP, 2013a). Their study developed seismic ground motion parameters for the Project site using both

Cerro del Gallo Heap Leach Project NI 43-101 Technical Report
January 31, 2020 Page 6-12
probabilistic seismic hazard assessment (PSHA) and deterministic seismic hazard assessment (DSHA). Their report includes a detailed discussion of potential earthquake sources, as well as their analyses and findings. Golder has reviewed the seismic hazard assessment performed by KP and feels that their conclusions and recommendations are acceptable, as discussed in Golder’s 2014 technical memorandum “Criterios de Diseño Sismorresistentes en México y Parámetros Sísmicos a ser Empleados para el Diseño de la Pila de Lixiviación del Proyecto Cerro del Gallo.” Their findings are summarized in the following sections.
6.2.2.1 Seismic Parameters for HLF and WRD Design The PSHA developed peak ground accelerations (PGA) for various return periods and annual risk as presented in Table 6.2.2.1. Table 6.2.1 Summary of Probabilistic Seismic Hazard Assessment for Project Site
Return Period (years)
Annual Frequency of Exceedance (%)
Peak Ground Acceleration (g)
(KP, 2013a) 100 1 0.05 475 0.2 0.08
1,000 0.1 0.10 2,500 0.04 0.12 5,000 0.02 0.14
Source: Golder (2014) The standard of practice in North America is to design HLFs and WRDs that have relatively low consequence of movement (typical of those for the CdG Project) using a PGA determined for a 475 year return period. This acceleration is applicable during both operation and after these facilities have been closed, assuming that the ore on the leach pad is rinsed and the leach pad and WRD remain drained. Under these conditions, potential movements of the rinsed ore in the heap and the rock in the WRD would provide negligible environmental impact and negligible risk to human safety. The PGA of 0.08g from the 475-year return period was adopted for stability analyses of the HLF and WRD for the Project site.
6.2.2.2 Seismic Parameters for Structural Design In accordance with the International Building Code (IBC), the maximum considered earthquake ground motion has been defined as the ground motion with a 2 percent probability of exceedance in 50 years (return period of about 2,500 years). Specifically, seismic parameters for use with the IBC are provided below for the site (Knight Piésold (2013):

Cerro del Gallo Heap Leach Project NI 43-101 Technical Report
January 31, 2020 Page 6-13
• Seismic coefficient, SS = 0.26g • Seismic coefficient, S1 = 0.32g • Peak ground acceleration = 0.12g
These acceleration values correspond to a reference ground condition of Site Class B (defined by the IBC as “Rock”). For geotechnical foundation design of mine site structures, a design earthquake of magnitude 7.0 is recommended for seismic design analyses.

Cerro del Gallo Heap Leach Project NI 43-101 Technical Report
January 31, 2020 Page 7-1
7 Geological Setting and Mineralization
7.1 Tectonic Setting
The CdG deposit is located in central Mexico within the Mesa Central physiographic province that includes the Guerrero Composite Terrane (Campa and Coney, 1983). The Guerrero Composite Terrane is characterized by submarine and subaerial volcanic and sedimentary successions that range in age from Jurassic to Middle–Late Cretaceous. Similar to other terranes of the North America Cordillera, the Guerrero Composite Terrane has been interpreted as an exotic crustal block accreted to what is now Mexico in Late Cretaceous time via a westward-dipping subduction zone that closed a major ocean basin (Lapierre et. al., 1992; Tardy et al., 1994; Dickinson and Lawton, 2001, etc.).
Figure 7.1.1 Tectono-stratigraphic Terranes
Source: Argonaut (2019)

Cerro del Gallo Heap Leach Project NI 43-101 Technical Report
January 31, 2020 Page 7-2
7.2 Regional Geology
The oldest rocks in the CdG region are a deformed and regionally metamorphosed volcano-sedimentary sequence of Triassic to Cretaceous age (Randall et al 1994; Consejo de Recursos Minerales 1992). Consejo de Recursos Minerales referred to these rocks as the Esperanza Formation, described as carbonaceous and calcareous shale interbedded with arenite, limestone and andesite to basaltic flows, all weakly metamorphosed to phyllites, slates and marble. In the CdG Project area, the Esperanza Formation consists of layered sediments of argillaceous and silty argillaceous composition, and fragmental volcanic rocks of broadly intermediate composition, included ash tuffs, lithic to crystal tuffs and some volcanic breccias and agglomerates. In the Project area the Esperanza Formation is locally surrounded by Tertiary age rhyolitic flows, rhyolitic tuffs, trachyte-andesite and andesites. A swarm of basaltic dykes intrude rocks of the Esperanza Formation predominantly along northwest trending fracture zones. The basaltic dykes contain olivine and xenoliths of altered felsic volcanogenic rock and some dioritic composition fragments, (Mason 2005a). The lack of overprinting metamorphic and hydrothermal alteration minerals confirms that these rocks were emplaced post peak regional deformation and felsic magmatism. The dykes are evident in airborne magnetic imagery as high amplitude discontinuous linear and circular magnetic anomalies often emplaced along the same structural zones as the larger epithermal silver-gold vein systems in the district. In addition to numerous gold, silver and some mercury occurrences in the district there are a number of tin occurrences which are concentrated in a northwest-southeast trending belt that includes CdG. These tin showings and mapped granitic intrusive bodies suggest the possibility of a magmatic province that may be prospective for further intrusion-related copper-gold deposits.

Cerro del Gallo Heap Leach Project NI 43-101 Technical Report
January 31, 2020 Page 7-3
Figure 7.2.1 Regional Geology
Source: Argonaut (2019)
7.3 Local Geology
Clastic Sedimentary and Volcanoclastic Sedimentary Host Rocks
The Esperanza Formation in the CdG Project area consists of a conformable sequence of siliciclastic sediments and fragmental volcanogenic rocks (Figure 7.3.1). The stratigraphy strikes broadly east-west and dips northerly at 30-40°, except in the vicinity of CdG where dips steepen to greater than 60° (Groves 2008). The stratigraphic thickness of the Esperanza Formation has not been determined. The formation is thought to be of Cretaceous age due to similar rocks within the Guanajuato district having been assigned to this age. Esperanza Formation basement rocks around CdG can be broadly subdivided into three litho-stratigraphic packages. To the south of the CdG intrusive complex a siliciclastic sedimentary sequence is recognized and consists dominantly of shale and interbedded arenite with minor lenses of conglomerate (Groves

Cerro del Gallo Heap Leach Project NI 43-101 Technical Report
January 31, 2020 Page 7-4
2008). This package is conformably overlain by a sequence of fragmental volcanogenic rocks of intermediate composition which are the host rocks for the CdG copper gold-silver deposit (Mason 2005a, Mason 2006a). The stratigraphy to the north and east of CdG is predominantly sedimentary with minor volcaniclastic horizons (Groves 2008). To the west, there is mostly volcanogenic sediments with consistent shallow to moderate northerly dips. The southern sides of CdG are dominated by siliciclastic sediments.
Felsic Intrusive Host Rocks
CdG (the actual hill) is cored by a steep sided stock of granodiorite to monzogranitic composition with a surface exposure measuring approximately 600 meters in a north-south direction and 300 meters wide. A subsidiary intrusive of more granodioritic composition was emplaced in the southeast side of this main intrusive and is likely a more intermediate phase of the same parent magma. Gold and copper are spatially and genetically associated with this intrusive complex occurring largely as an up-right quartz vein stockwork/breccia system formed peripheral to the intrusive. This gold rich zone varies in width but can be up to 50 meters wide and by volume is composed mostly of silicic material largely derived from the intrusive. Outward from this mineralized annulus veining and silicification continues into the country rock with decreasing intensity.
Figure 7.3.1 Oxidized Outcrop along Intrusive Margin (1 to 3 g/t Au)
Source: Argonaut (2019)

Cerro del Gallo Heap Leach Project NI 43-101 Technical Report
January 31, 2020 Page 7-5
Figure 7.3.2 Mineralized Quartz Veining in Weathered Zone Outward from Intrusive (+/-0.7 g/t Au)
Source: Argonaut (2019)
CdG fits well into a copper-gold porphyry mineralization model in that mineralization is related to volatile phases of a felsic intrusive complex. This mineralization is genetically and spatially associated with this intrusive and is proximally zoned concentrically around it. Copper locally overlaps the gold zone and spreads further outward from the intrusive than the gold system. Silver appears to be structurally related and occurs as overlapping epithermal veins and is clearly younger than the gold-copper system. The CdG intrusive complex is made up of multiple phases of calc-alkaline felsic intrusive rocks of granodioritic to rhyolitic composition emplaced at high crustal levels into a relatively flat lying volcanogenic tuff sequence. This suite of felsic intrusives indicates progressive fractionation of a magma chamber at depth. A sub-volcanic environment is postulated. An Oligocene age for intrusion emplacement is inferred based on the spatial and temporal association of similar felsic intrusive rocks with epithermal silver-gold mineralization at Guanajuato. The intrusive related mineral system is centered on CdG and forms an upright elongate stock of granodioritic to monzogranitic composition (Mason 2005b, Mason 2006b), which was previously described as a quartz monzonite (Consejo de Recursos Minerales 1992), and a quartz monzonite porphyry (Rowins 2000b). These observations are in accord with work of Perez (2018) who describes the rocks in thin sections as a quartz-monzonitic-hypabyssal intrusive.

Cerro del Gallo Heap Leach Project NI 43-101 Technical Report
January 31, 2020 Page 7-6
Figure 7.3.3 Local Geology
Source: Argonaut (2019)
A siliceous cap of bladed and lattice textured cherty quartz extends over the top of CdG giving the hill the appearance of a “rooster’s comb,” hence the name Cerro del Gallo or “Hill of the Rooster.” The siliceous cap extends along the axis of elongation of the outcropping main intrusive and is up to 100 meters wide and 400 meters long and centered on the peak of CdG. This siliceous cap represents the top of the intrusive system, and is at least partially made up of strongly silicified volcano-sedimentary wall rocks.
7.4 Structural Geology
The CdG Project has a long and complex structural history dating back to what are believed to be Jurassic aged volcaniclastic dominated basement rocks that have been

Cerro del Gallo Heap Leach Project NI 43-101 Technical Report
January 31, 2020 Page 7-7
intensively folded and regionally metamorphosed to more recent lithologic units that display relatively young fracturing and faulting.
Post-mineral faulting
Several post-mineral faults as noted in Figure 7.3.3 have been identified some of which cause local offsets to mineralization and can also act as hard boundaries to mineralization. The main post-mineral faults are described as follows:
a. Cerro Del Gallo fault The Cerro del Gallo fault cross cuts the CdG deposit and locally displaces the mineralized system. This structure has a general trend of 310º TN and is inclined around 80 degrees to the NE and locally forms a hard boundary to mineralization.
b. NE fault system The NE fault system does locally offset mineralization. It consists of at least five separate structures and trends between 030º-050º with dips between 75º-80º to the SE. Portions of this fault system were utilized in the geologic model as hard boundaries to mineralization.
c. NW fault system The NW fault system is located on the southern flanks of CdG and consists of a series of structures that trend to the NW and dip 50 to 60 degrees to the NE.
d. La Paz fault The La Paz fault trends northwest and dips steeply to the north. It acts as a local barrier to mineralization and also separates sedimentary rocks to the south from volcaniclastic rocks to the north. This fault also hosts a one-meter-wide epithermal vein with anomalous gold and silver.
7.5 Mineralization
This section is summarized from earlier Technical Reports completed by San Antón and Cerro Resources. The main copper-gold mineralizing event is considered to be intrusive related and referred to as a copper-gold porphyry system. Within the district there are also younger

Cerro del Gallo Heap Leach Project NI 43-101 Technical Report
January 31, 2020 Page 7-8
epithermal vein systems high in silver and lead. These are similar to the style of mineralization that makes up the Guanajuato Mining District. Additionally, there are recognized skarn type deposits associated with intrusive activity with occurrences of gold, copper, zinc, and lead. This skarn type mineralization has yet to produce an economic deposit mainly due to their small tonnage potential. At CdG mineralization is hosted in both felsic intrusive and volcanic tuff wall-rock. Mineralization is disseminated and vein or fracture controlled and extends from 200 meters to 400 meters outward from the mineralizing intrusive complex. The strongest gold mineralization at CdG is associated with intense quartz stockwork veining and silicification within a wall-rock annulus forming the outer limits of a felsic stock with the system losing intensity outward with a decrease in stockwork and quartz veining density. Sulfide make up less than 2% by volume of the mineralized rocks. Gold-copper mineralization is zoned concentrically around the felsic intrusive with higher grade gold mineralization proximal to and within an outer annulus of the intrusion. The highest copper grades are found outward from the gold zone. Zinc mineralization is locally anomalous outside the copper zone, metal zonation boundaries are gradational and there is an overlap in the gold-copper zone and the copper-zinc zone. Pyrite is the dominant iron sulfide mineral with accessory pyrrhotite and marcasite dispersed throughout the mineralized system. Pyrite occurs in two forms; as euhedral to subhedral cubic crystals and crystal aggregates in veins and disseminations of primary origin, and also as secondary fine-grained patches after pyrrhotite (Mason 2005a). Pyrrhotite is most common in the outer copper zone. It is magnetic and in high enough concentration to form a donut shaped magnetic anomaly around the CdG mineral system. Native gold occurs within vein quartz and inclusions within pyrite, chalcopyrite and bismuthinite. Gold grains range in size from generally 0.5-4 microns in diameter to rarely 10-20 microns (Mason 2005a; Mason 2006a; Townend 2006). Electron-probe microanalysis on a limited number of native gold grains indicates gold has a fineness of 860-880 with silver making up the rest (Mason 2006b, Mason 2007). In terms of geochemistry and all elements assayed, gold has the strongest correlation with bismuth.

Cerro del Gallo Heap Leach Project NI 43-101 Technical Report
January 31, 2020 Page 7-9
The majority of silver at CdG is related to late structurally controlled epithermal veins that overprint the intrusive related copper-gold system. Within the veins, Perez (2018) identified tetrahedrite and electrum as the main silver minerals associated with galena and sphalerite. Silver can also occur as small grains of native silver or ruby silver as either pyrargyrite or proustite. Within the CdG mineral system, chalcopyrite is the most common base metal sulfide phase and occurs in fracture veinlets often associated with intense silicification and as disseminations. Chalcopyrite is commonly closely associated with pyrite and marcasite, and rarely as inclusions in coarse arsenopyrite (Townend 2006). Traces of bornite have also been reported (Mason 2006b; Townend 2006), however this mineral is not volumetrically significant. Minor secondary copper minerals including malachite and azurite have formed through weathering processes and are locally present in surface outcrops. Native copper, covellite and chalcocite are found deeper in the regolith profile, and their formation is attributed to supergene weathering processes. Arsenopyrite is relatively common, occurring as coarse discrete grains often associated with chalcopyrite.
7.6 Hydrothermal Alteration and Wall Rocks
Hydrothermal alteration is zoned concentrically around the main intrusive complex and intensity decreases outwards. Overprinting hydrothermal events result in complex alteration patterns that are difficult to map as discrete areas. Within and outward from the main intrusive there is a general absence of primary textures due to high percentages of silica. Potassic alteration is the dominant style of alteration in the core of the hydrothermal system which is centered on the Main Intrusive.

Cerro del Gallo Heap Leach Project NI 43-101 Technical Report
January 31, 2020 Page 7-10
Figure 7.6.1 Mineralization Trend by Directional Domains
Source: Argonaut (2019)
The tuffaceous wall rocks in contact with the intrusive system have experienced pervasive hydrothermal alteration to form fine grained replacement assemblages of albite, K-feldspar, biotite, sericite, quartz, sphene, rutile and pyrite (Mason 2005b; Mason 2007). Much of the mineralization is fracture controlled and related to K-feldspar, biotite, pyrrhotite, and chalcopyrite, but can locally grade into thicker granular textured veins dominated by quartz with minor biotite, chlorite, calcite, pyrite, pyrrhotite, chalcopyrite, molybdenite and bismuthinite (Mason 2005b). Hydrothermal propylitic alteration overprints potassic alteration within both the felsic intrusives and surrounding wall-rocks and extends laterally beyond the zone of potassic alteration surrounding CdG.

Cerro del Gallo Heap Leach Project NI 43-101 Technical Report
January 31, 2020 Page 7-11
Propylitic alteration extends over a radius of up to one km from the peak of CdG (Figure 7.6.1). This alteration is more extensive to the west and consists mainly of fracture-controlled replacement assemblages of albite, chlorite, calcite and pyrite.

Cerro del Gallo Heap Leach Project NI 43-101 Technical Report
January 31, 2020 Page 8-1
8 Deposit Types
The CdG copper-gold-silver deposit can be considered to be a member of a distinct subclass of “reduced” porphyry-style copper-gold mineralization as first proposed by Rowins (2000c). These reduced porphyry copper-gold deposits lack primary hematite, magnetite and sulfate minerals, but contain abundant hypogene pyrrhotite, commonly have carbonic ore fluids, and are associated with ilmenite-bearing, reduced I-type granitoids (Rowins 2000c). CdG displays all these features. In addition, there is a consistent pattern of higher temperature potassic alteration overprinted by lower temperature propylitic-style mineral alteration. Propylitic alteration boundaries are gradational and irregular, and more widespread than potassic alteration. This alteration pattern is consistent with many other porphyry copper-gold deposits throughout the world. Tellurium-bearing minerals are also common in porphyry copper-gold deposits, as they are at CdG. The CdG copper-gold-silver deposit also has characteristics supporting an intrusion-related gold system (IRGS) model as proposed by Thompson et al 1999; Rowins 2000c; Champion 2005; Hart 2005. IRGS deposits are typically found in continental tectonic settings inboard of convergent plate boundaries, often where the regional metallogeny is characterized by tungsten-tin magmatic provinces. Felsic intrusives have an intermediate oxidation state between ilmenite and magnetite series with a gold-enriched metal assemblage derived from igneous fractionation, and a distinctive metallogenic signature of gold, bismuth, tin and tungsten. Hydrothermal fluids are carbonic, and pyrrhotite is common. The CdG Project has several epithermal veining systems, one of which, the Ave de Gracia, transects CdG. None of the vein systems has had chemical determination for classification of sulfidation type, although there are several geological characteristics similar to low sulfidation epithermal deposits, all of them determined by geological mapping and geological description. Some of these characteristics are: a) sericite or illite ± adularia, chlorite alteration minerals; b) filling cavities/porosities vein type, banding and hydrothermal breccias; c) carbonate replacement textures; d) low content of bulk sulfur, low presence base metals (Pb, Zn). In and around the CdG deposit there is also massive sulfide mineralization, however, these occurrences need further investigation. These rocks are composed of more than 60% sulfides, with variable quantities of pyrite, pyrrhotite, chalcopyrite, sphalerite, arsenopyrite and galena and are normally strata bound unless remobilized. In the

Cerro del Gallo Heap Leach Project NI 43-101 Technical Report
January 31, 2020 Page 8-2
earlier logging programs these occurrences of massive sulfides were described as skarns. Similar occurrences are reported in the Mesozoic rocks of the Guanajuato districts (Randall, et al., 1994).
8.1 Nearby Deposits
CdG is located 23 kilometers east northeast of the still active Guanajuato Mining District where historic production, beginning in 1700, is reported to be over 1.14 billion ounces of silver and 6.5 million ounces of gold. The Project also hosts multiple epithermal vein systems that saw limited historic development.

Cerro del Gallo Heap Leach Project NI 43-101 Technical Report
January 31, 2020 Page 9-1
9 Exploration
The majority of modern exploration on the CdG copper-gold system and the surrounding epithermal veins was accomplished by Cerro Resources and its predecessor companies between 2006 and 2008 and then by Primero from 2013 to 2018. During 2006-2008, multiple surface geochemical sampling programs were completed including stream sediment, BLEG, Niton® soil and conventional soil sampling. These geochemical programs are described in a 2008 Technical Report titled: Technical Report, 2008, Cerro del Gallo deposit within the San Antón Property Mexico, Prepared by San Antón Resource Corporation Inc. Ottawa, Canada 2008 From 2013 to 2018, under Primero’s ownership, exploration within the property included additional epithermal vein exploration, programs of detail geological mapping, stream sediments sampling, extensive soil sampling, rock chip sampling and analyses of available geophysical data. During 2014 Primero hired a consulting firm (Western Mining Services) based in Denver, CO to conduct a district target generation from the geological information available (Historical + Primero). A total of eighteen district-scale targets of different deposit types (epithermal, skarn and intrusive-related) were identified, of which, six were considered high priority. To date, these targets remain untested. Work by Argonaut, starting in December of 2017, included a detailed re-logging and re-classification (in percentage) of oxide and sulfide material in rock chips trays from historical RC drilling. This study focused on defining four separate oxide domains. This data, in addition to geologic information, was transferred to 50-meter spaced vertical cross sections through the deposit. This combined data was utilized to construct a three-dimensional model using Leapfrog software. The objective of the program was to determine the tonnage and grade of gold and silver mineralization within each geo-metallurgical zone (or oxidation zone). Argonaut also conducted detailed mapping of the deposit and limited surface exploration in the surrounding district. The deposit was mapped at 1:500 scale with a focus specifically on collecting structural data and detailed information with respect to the mineralization. During this time, Argonaut collected numerous surface samples of the veins and mineralized areas. In the district surrounding the main CdG deposit, Argonaut conducted reconnaissance exploration consisting primarily of selective

Cerro del Gallo Heap Leach Project NI 43-101 Technical Report
January 31, 2020 Page 9-2
sampling and 1:10,000 scale mapping of targets previously identified by Cerro Resources. To date, the district has yet to see detailed, dedicated exploration.
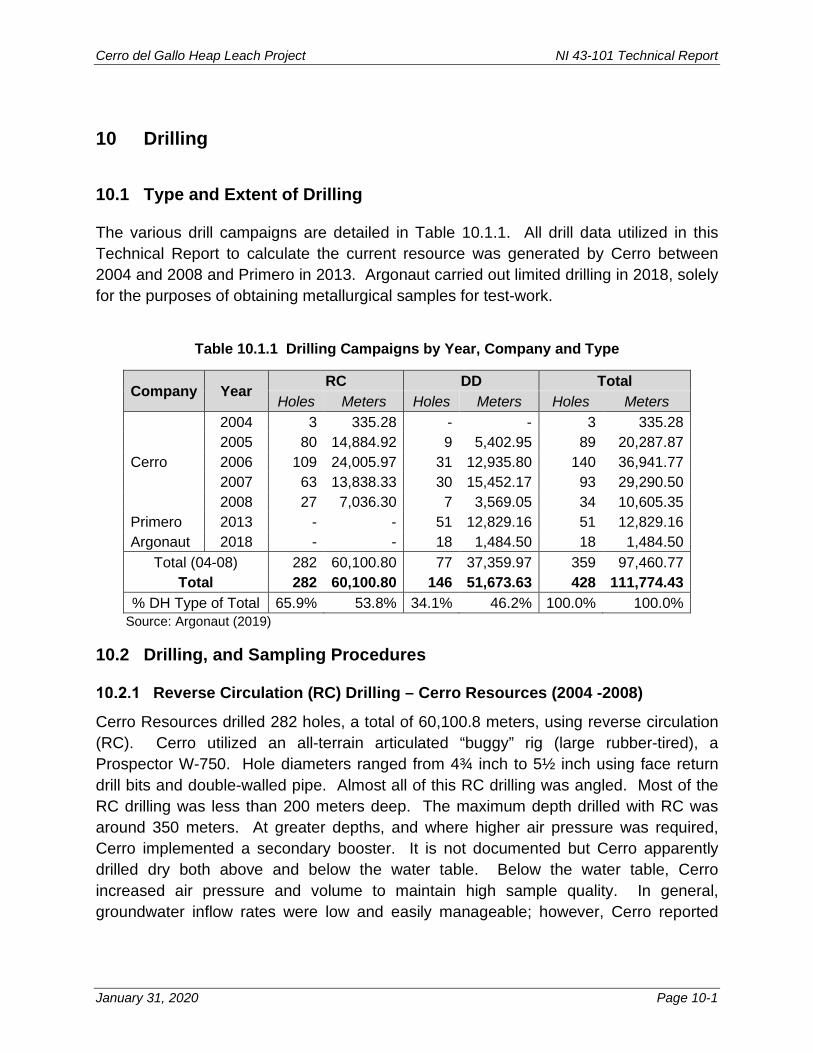
Cerro del Gallo Heap Leach Project NI 43-101 Technical Report
January 31, 2020 Page 10-1
10 Drilling
10.1 Type and Extent of Drilling
The various drill campaigns are detailed in Table 10.1.1. All drill data utilized in this Technical Report to calculate the current resource was generated by Cerro between 2004 and 2008 and Primero in 2013. Argonaut carried out limited drilling in 2018, solely for the purposes of obtaining metallurgical samples for test-work.
Table 10.1.1 Drilling Campaigns by Year, Company and Type
Company Year RC DD Total Holes Meters Holes Meters Holes Meters
2004 3 335.28 - - 3 335.28 2005 80 14,884.92 9 5,402.95 89 20,287.87 Cerro 2006 109 24,005.97 31 12,935.80 140 36,941.77 2007 63 13,838.33 30 15,452.17 93 29,290.50 2008 27 7,036.30 7 3,569.05 34 10,605.35 Primero 2013 - - 51 12,829.16 51 12,829.16 Argonaut 2018 - - 18 1,484.50 18 1,484.50
Total (04-08) 282 60,100.80 77 37,359.97 359 97,460.77 Total 282 60,100.80 146 51,673.63 428 111,774.43
% DH Type of Total 65.9% 53.8% 34.1% 46.2% 100.0% 100.0% Source: Argonaut (2019)
10.2 Drilling, and Sampling Procedures
Reverse Circulation (RC) Drilling – Cerro Resources (2004 -2008)
Cerro Resources drilled 282 holes, a total of 60,100.8 meters, using reverse circulation (RC). Cerro utilized an all-terrain articulated “buggy” rig (large rubber-tired), a Prospector W-750. Hole diameters ranged from 4¾ inch to 5½ inch using face return drill bits and double-walled pipe. Almost all of this RC drilling was angled. Most of the RC drilling was less than 200 meters deep. The maximum depth drilled with RC was around 350 meters. At greater depths, and where higher air pressure was required, Cerro implemented a secondary booster. It is not documented but Cerro apparently drilled dry both above and below the water table. Below the water table, Cerro increased air pressure and volume to maintain high sample quality. In general, groundwater inflow rates were low and easily manageable; however, Cerro reported
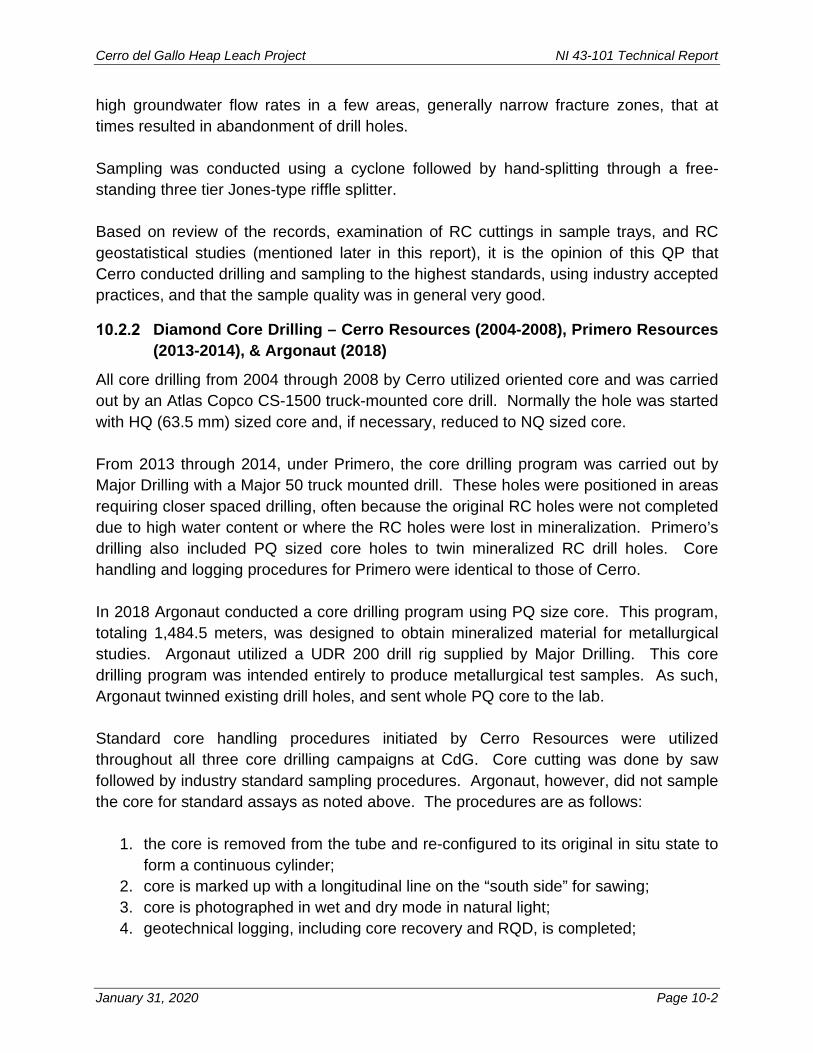
Cerro del Gallo Heap Leach Project NI 43-101 Technical Report
January 31, 2020 Page 10-2
high groundwater flow rates in a few areas, generally narrow fracture zones, that at times resulted in abandonment of drill holes. Sampling was conducted using a cyclone followed by hand-splitting through a free-standing three tier Jones-type riffle splitter. Based on review of the records, examination of RC cuttings in sample trays, and RC geostatistical studies (mentioned later in this report), it is the opinion of this QP that Cerro conducted drilling and sampling to the highest standards, using industry accepted practices, and that the sample quality was in general very good.
Diamond Core Drilling – Cerro Resources (2004-2008), Primero Resources (2013-2014), & Argonaut (2018)
All core drilling from 2004 through 2008 by Cerro utilized oriented core and was carried out by an Atlas Copco CS-1500 truck-mounted core drill. Normally the hole was started with HQ (63.5 mm) sized core and, if necessary, reduced to NQ sized core. From 2013 through 2014, under Primero, the core drilling program was carried out by Major Drilling with a Major 50 truck mounted drill. These holes were positioned in areas requiring closer spaced drilling, often because the original RC holes were not completed due to high water content or where the RC holes were lost in mineralization. Primero’s drilling also included PQ sized core holes to twin mineralized RC drill holes. Core handling and logging procedures for Primero were identical to those of Cerro. In 2018 Argonaut conducted a core drilling program using PQ size core. This program, totaling 1,484.5 meters, was designed to obtain mineralized material for metallurgical studies. Argonaut utilized a UDR 200 drill rig supplied by Major Drilling. This core drilling program was intended entirely to produce metallurgical test samples. As such, Argonaut twinned existing drill holes, and sent whole PQ core to the lab. Standard core handling procedures initiated by Cerro Resources were utilized throughout all three core drilling campaigns at CdG. Core cutting was done by saw followed by industry standard sampling procedures. Argonaut, however, did not sample the core for standard assays as noted above. The procedures are as follows:
1. the core is removed from the tube and re-configured to its original in situ state to form a continuous cylinder;
2. core is marked up with a longitudinal line on the “south side” for sawing; 3. core is photographed in wet and dry mode in natural light; 4. geotechnical logging, including core recovery and RQD, is completed;

Cerro del Gallo Heap Leach Project NI 43-101 Technical Report
January 31, 2020 Page 10-3
5. geological logging is completed including lithological, alteration, structural, and mineralization logging;
6. core is then sawed in half; 7. one half is sent for assay and the other half retained in the original core box.
10.3 Drilling Configuration
Drilling has been predominantly carried out on nominal 50-meter fences, oriented NNE-SSW to intersect a known north-westerly trending structural corridor. Holes were normally angled between 55 and 65 degrees, either to the northeast or southwest, depending on the position of the drill fence (or drill section). Specifically, drill fences were oriented to alternate every other section between NNE bearing and SSW bearing. These holes can locally crisscross at depth. Drill spacing within the resource area averages approximately 50 meters. Mineralization generally displays a concentric distribution around the carapace of the intrusive as can be seen in Figure 10.3.1. To a lesser extent, mineralization displays a secondary NNW orientation, following the dominant structural trend through the region. The drilling pattern utilized to define the CdG resource, the NNE-SSW fences, is well-oriented to the NNW mineralization trend and to a lesser extent, the concentric mineralization. During initial exploration activities the presence of a concentric mineralization is not only difficult to detect but also the intrusive centroid near impossible to define. The systematic drilling to date has proven advantageous in understanding the mineral distribution and geology. Now that the concentric orientation if confirmed, further definition drilling will consider a radial type drilling orientation (from the intrusive limbs towards the centroid) to more optimally intersect the direction of greatest grade variance.

Cerro del Gallo Heap Leach Project NI 43-101 Technical Report
January 31, 2020 Page 10-4
Figure 10.3.1 Plan (2,120m level) 0.2 & 0.7 g/t Au Leapfrog Shells, Intrusive (grey) & NW Structures
Source: Argonaut (2019)
10.4 Survey Methods
Surface Survey Methods
The CdG area lies within Universal Transverse Mercator (UTM) Zone 14 and all coordinates were based on North American Datum 1927 (NAD27) for Mexico through 2008. Starting in 2013 with Primero, coordinates were based on World Geodetic System 1984 (WGS84). Argonaut is also using the same coordinate system utilized by Primero. Drill collar positions are established by hand held GPS units. Drill directions and dip angles are set up using a Brunton compass. Upon completion of each drill hole, the collars are marked with a square concrete cap (approximately 40 by 40 cm) and inscribed with the drill hole number. Although drill collar positions are initially surveyed using a handheld GPS unit, hole locations are later more accurately determined by a contract surveyor using a total station device.

Cerro del Gallo Heap Leach Project NI 43-101 Technical Report
January 31, 2020 Page 10-5
Topography and Basement (Resource Volume)
Regional topography is modelled from a LIDAR aerial survey and ground control points. Final drill-hole collar locations are surveyed using a theodolite. The original, pre-mining topography was provided in DXF format from which a percentage block not in air is calculated and then this is used to estimate current Mineral Resources.
Down-hole Survey Methods
Down-hole surveys were completed for all core and RC holes on the project. Initially, down-hole surveying was done using an Eastman single shot camera. After 2004, a Reflex Ez-Shot electronic solid-state single shot survey tool was implemented. Surveys were normally completed just below casing and at various depths (depending on the rate of change in azimuth and/or inclination), and at the bottom of the hole. Core holes were surveyed as drilling proceeds at nominal 30-meter intervals.
Oriented Core
All core drilled by Cerro was oriented core using a Ballmark® orientation system. Core was collected from the drill site and taken to a logging facility located in proximity to the Dolores Shaft. The core was washed, photographed and “marked up” as described above. The core was then geotechnically and structurally logged to identify hardness, weathering, fractures, core dip angle and core dip direction. The Ballmark® imprints were used to assist in determining vein and fracture orientations (dip and strike) with the assistance of a goniometer. After geotechnical data collection, the core was geologically logged, cut and sampled as described elsewhere in this section.
10.5 Geological Logging
RC drill samples obtained by Cerro were logged at five-foot (1.52-meter) intervals on-site at the time of drilling. A split from each interval was sieved, washed and logged visually, using a hand lens. Logging criteria included: lithology, alteration, degree of oxidation, and mineralization. Summary log sheets were prepared on site at the conclusion of each hole. Representative chips from each five-foot (1.52-meter) interval were collected and retained in plastic sample chip trays stored at the San Antón field office. Drill hole data was recorded on handwritten logs onto a pre-printed log sheet template database and eventually merged with assay results. Drill data also included hole identification, coordinates (in NAD27 for Mexico), depth, and sample number, including duplicates, blanks and standards. Core handling and logging procedures for Primero were identical to those described above for Cerro.

Cerro del Gallo Heap Leach Project NI 43-101 Technical Report
January 31, 2020 Page 10-6
Argonaut continued using the same core handling and logging procedures set out by Cerro. Drill core went through standard logging procedures to obtain geotechnical and geologic data such as lithology, alteration, and mineralization. Special emphasis was given to recording the degree of oxidation of the core material. Bulk density samples (whole core) were collected at approximately 30-meter intervals in select holes, through the entire hole.

Cerro del Gallo Heap Leach Project NI 43-101 Technical Report
January 31, 2020 Page 11-1
11 Sample Preparation, Analyses and Security
Cerro and Primero used SGS Canada Minerals Services in Toronto, Ontario, as their primary laboratory for analysis of drill, rock-chip, soil, and stream sediment samples. The SGS-Toronto facility is ISO 9002 registered, and ISO/IEC 17025 accredited for Specific Tests under the Standards Council of Canada (SCC) No.456. Argonaut has continued to use SGS for many of their assay needs at CdG. In particular this included re-assaying Primero’s ICP pulps. Currently, Argonaut is also using ALS labs in Zacatecas for other analysis consisting mainly of surface rock chip samples.
11.1 Sample Security
All RC and DDH samples collected were bagged, and then sealed prior to transport. Samples were then securely stored until collected by SGS personnel. Samples collected during drilling were under constant surveillance until collected by SGS personnel. Samples collected from DDH core were stored at a secure core yard facility under constant surveillance until collected by SGS personnel. When drilling was in progress, samples were collected and transported by SGS personnel to Durango approximately twice weekly. SGS has a sample preparation facility in Durango, Mexico that is within a one-day drive of the property. Sample pulps were prepared in Durango prior to transporting via air-freight to the Toronto laboratory in Canada for analysis. Starting in November 2007, fire assays for gold were done at the same SGS Durango facility.
11.2 Sample Preparation
Sample preparation for all drill and surface samples generated by Cerro and Primero was completed at the SGS sample preparation facility in Durango, Mexico. When necessary, samples were oven dried at 105ºC. After drying, RC and core samples were crushed to 90% passing 2 mm. Once crushed to 2 mm, a 1,000 g sub-sample is split out for pulverizing. The 1,000 g sub-sample is then pulverized to 90% passing 75 μm (200#). From this, a pulp of approximately 200-250 g is taken that is utilized for analysis.

Cerro del Gallo Heap Leach Project NI 43-101 Technical Report
January 31, 2020 Page 11-2
11.3 Analytical Procedures
December 2004 to October 2013
Drill samples assayed from 2004 until October 2005 were analysed for gold, silver, copper, lead, zinc, molybdenum and bismuth. Gold was determined by fire assay using a 30 g sample pulp with instrumental Atomic Absorption Spectrometry (AAS) finish (SGS Method FAA313). The lower detection limit of this method is 5 ppb with an upper limit of 10,000 ppb. All samples assaying greater than 1,000 ppb gold were re-assayed by fire assay using a 30 g sample pulp with a gravimetric finish (SGS Method FAG303). This is an “ore grade” procedure for higher gold values. The lower detection limit for this method is 0.03 ppm. Up until October 2005, silver and copper values were determined using SGS Method AAS40E which incorporates multi-acid digestion and an AAS finish on a 2.0 g nominal weight sample. Since November 2005, silver and copper were determined using SGS method AAS21E consisting of a three-acid digestion with AAS finish on 2 g sample and is applicable for material containing less than 300 ppm silver and less than 10,000 ppm copper. This method has a lower detection limit for silver of 0.3 ppm. Silver values over 300 ppm are determined by one of two methods. One procedure is termed AAS21E consisting of 3-acid digestion with AAS finish on a 2 g sample. The other method, noted as AAA50, mainly applies to a silver range between 300-1,000 ppm. In this method a 2.0 g sample undergoes four acid digestion and is then analysed using AAS. If the sample has a value greater than 1,000 ppm silver, then the fire assay method is used (SGS Method FAG303). Up until November 2005, all silver analyses greater than 300 ppm were re-analysed by lead collection fire assay using a 30 g sample and finished by gravimetric weighing of the bead. The lower detection limit for silver using this method is 3 ppm. During this same period samples containing silver values greater than 300 ppm and up to 1,000 ppm were assayed by SGS Method AAA50. Copper values were also determined by the same method with a lower detection limit of 0.5 ppm and an upper range limit of 10,000 ppm. Copper values over 10,000 ppm (“ore grade”) are determined by sodium peroxide fusion/Inductively Coupled Plasma Optical Emission Spectrometry (ICP-OES) finish on the solution (SGS Method ICA50). Prior to October 2005 drill samples were routinely assayed for lead, zinc, molybdenum and bismuth with values determined by ICP-OES on a 0.2 g sample using SGS Method ICP40B which includes a four-acid digestion. This procedure has a lower detection limit for lead of 2 ppm, zinc 0.5 ppm, molybdenum 1 ppm, and bismuth 5 ppm. The upper limit for lead and zinc values using this method is 10,000 ppm. Over-range base metal elements, including copper, were re-assayed by ore grade analysis Method ICA50. This method has a lower detection limit of 0.01%, and no upper limit.

Cerro del Gallo Heap Leach Project NI 43-101 Technical Report
January 31, 2020 Page 11-3
Table 11.0 Timing of SGS analytical procedures
Notes: FAA313 - Gold - fire assay using a 30 g sample pulp with AAS finish. Lower detection limit 5 ppb, upper limit of 10,000 ppb. AAS40E – Silver and Copper - multi-acid digestion with AAS finish on a 2.0 g sample. AAS21E – Silver – over 300 ppm, 3-acid digestion with AAS finish on a 2 g sample. ICP14B - standard suite of 32 elements using ICP analysis. FAG303- Gold – plus 1,000 ppb fire assay using a 30 g sample pulp with a gravimetric finish. Lower detection limit of 0.03 ppm. AAA50 – Silver - 300-1,000 ppm, 2.0 g sample undergoes four acid digestion and AAS analysis. ICA50 - Copper – plus 10,000 ppm sodium peroxide fusion/Inductively Coupled Plasma Optical Emission Spectrometry (ICP-OES) finish. ICP90Q – Base metals greater than 10,000 ppm using ICP analysis, lower detection of 0.01%. Source: Argonaut (2019)
January 2013 to Present Since October 2005, drill samples were assayed for a standard suite of 32 elements using SGS Method ICP40B. More recently, over range base metals greater than 10,000 ppm have been analysed using the SGS ore grade analysis method ICP90Q, which has a lower detection of 0.01%. All 2013 drill core samples generated by Primero were assayed for gold using fire assay. SGS fire assay method FAA313 which utilizes a 30 g sample pulp an AAS finish. The lower detection limit for this method is 0.01 ppm and the upper limit is 10 ppm which covers the majority of gold values encountered at CdG. All samples with assays greater than 10 ppm gold were re-assayed by fire assay on a 30 g sample pulp using a gravimetric finish (SGS method FAG303). This is an “ore grade” method for high gold values. The

Cerro del Gallo Heap Leach Project NI 43-101 Technical Report
January 31, 2020 Page 11-4
lower detection limit for this method is 0.5 ppm and the upper detection limit is 10,000 ppm. Primero also assayed their 2013 core samples for silver and copper (35 element package) using an aqua regia (HNO3-HCl) digest with an ICP finish, (SGS method ICP14B). This method utilizes a 0.5-gram sample and is appropriate for material with organic or high sulfide mineral content. For silver, the lower detection limit is 2 ppm and the upper detection limit is 100 ppm. All samples with assays greater than 100 ppm silver were re-assayed by SGS method AAS21E (2 g sample, 3-acid digestion with AAS finish). The upper detection limit for this method is 300 ppm silver. All samples with assays greater than 300 ppm silver were re-assayed by fire assay on a 30 g sample pulp using a gravimetric finish (SGS method FAG313). This is an “ore-grade” method for high silver values. The lower detection limit for this method is 10 ppm and the upper detection limit is 10,000 ppm. For copper, the lower detection limit for SGS method ICP14B is 1 ppm and the upper detection limit is 10,000 ppm. All samples with greater than 10,000 ppm copper were re-assayed by SGS method ICP90Q. This “ore-grade” method utilizes a 0.5 g sample, sodium peroxide fusion digestion, and an ICP finish. The lower detection limit for this method is 0.1% and the upper detection limit is 30%. Check samples submitted to ALS Minerals in 2014 by Primero utilized comparable gold, silver, and copper analytical techniques as described above. Gold was analysed by ALS method AA23 (30 g sample, fire assay digestion, AAS finish). All samples with greater than 10 ppm gold were re-assayed by ALS method GRA21 (30 g sample, fire assay digestion, gravimetric finish). Silver and copper were analysed by ALS method ICP41 (0.5 g sample, aqua regia digestion, ICP finish). All silver and copper samples with values at the upper detection limit of method ICP41 were analysed by ALS method OG46. This “ore-grade” method utilizes a 0.4 g sample, aqua regia digestion, and ICP finish.
11.4 In-situ Bulk Density
In a 2012 Technical Report completed by Cerro, it was reported that 895 HQ core samples were selected for bulk density determination. Samples were selected to represent the main rock types that occur within the deposit. Samples (whole core) were collected at approximately 30 m intervals through select core holes with core sample lengths averaging 13 cm. The Calliper Method was used as follows:
1. The ends of the core were cut with a saw perpendicular to the longitudinal axis of the core;
2. The core was then dried; 3. The diameter of the core was measured with a digital calliper at three points and
averaged;

Cerro del Gallo Heap Leach Project NI 43-101 Technical Report
January 31, 2020 Page 11-5
4. The length of the core was measured with a steel tape measure; 5. The mass of the dry core was determined using scientific scales with a quoted
accuracy of ±0.01 gram. After preliminary re-modelling in 2018, Argonaut carried out further density measurements in the upper more oxidized profiles of the resource. This work consisted of collecting an additional 47 samples in 2018 – 2019 with the aim of increasing the number of density measurements in the near surface oxide profiles. Prior to this the oxide profile contained only two density measurements but potentially represented 5 – 10% of the resource ounces. Table 11.4.1 shows the number of data by oxidation profile and average densities. This data shows that the 2.65 g/cm3 applied value is approximately 1% lower than the average density for the deepest sulfide profile. The method used is more likely to result in a specific gravity measurement than the desired in-situ bulk density and so it is reasonable to assume a discount needs to be applied to the data for the resource estimate. With the aid of RQD, which is a reasonable measure of core breakage (and therefore potential in-situ voids), “porosity discounts” were deduced for the four oxidation profiles. Low RQD values in the oxide profiles lead to the greatest discount being applied near surface and then reducing with deeper profiles. The low number of density measurements in the oxide profile is due in part to the limited availability of solid core which further justifies that a void or porosity discount is required. The application of these discounts is further explained in the estimation section.
Table 11.4.1 Density Measurements within Block Model Project Limits
Oxidation Domain Number Density Standard
Deviation Coefficient
of Variation
Porosity Discount
Oxide 16 2.41 0.24 0.10 3.8% Oxide-mix 32 2.62 0.11 0.04 1.5% Sulfide-mix 120 2.64 0.12 0.05 1.2% Sulfide 612 2.68 0.13 0.05 1.0% Total 780 2.66 0.13 0.05 1.1%
Source: Argonaut (2019)
11.5 QAQC results
Duplicate Samples
The gold field duplicates are presented in Figure 11.5.1, which shows that the Half Absolute Relative Difference (HARD) target has not quite been met, but is acceptable for this style of mineralization and analytical detection limits. The silver field duplicates are

Cerro del Gallo Heap Leach Project NI 43-101 Technical Report
January 31, 2020 Page 11-6
shown in Figure 11.5.2, which show that the HARD target has not quite been met, but is acceptable for this style of mineralization and analytical detection limits. The copper field duplicates are shown in Figure 11.5.3, which show that the HARD target has been met. Lab duplicate (or lab re-split) samples were collected at the laboratory at a frequency of 1 in 12 samples or less. These are taken from the pulp sample and recorded as duplicates by the laboratory. The gold lab duplicates are presented in Figure 11.5.4, which shows that the HARD target has been met. The silver lab duplicates are shown in Figure 11.5.5, which show that the HARD target has been met. The copper lab duplicates are shown in Figure 11.5.6, which show that the HARD target has been met. Field duplicates were not part of the 2013 core drilling program. As an additional QC step, 5% of the 2013 reject samples were submitted again to SGS for re-assay.

Cerro del Gallo Heap Leach Project NI 43-101 Technical Report
January 31, 2020 Page 11-7
Figure 11.5.1 Field Re-splits – Gold
Source: Argonaut (2019)

Cerro del Gallo Heap Leach Project NI 43-101 Technical Report
January 31, 2020 Page 11-8
Figure 11.5.2 Field Re-splits – Silver
Source: Argonaut (2019)

Cerro del Gallo Heap Leach Project NI 43-101 Technical Report
January 31, 2020 Page 11-9
Figure 11.5.3 Field Re-splits – Copper
Source: Argonaut (2019)

Cerro del Gallo Heap Leach Project NI 43-101 Technical Report
January 31, 2020 Page 11-10
Figure 11.5.4 Lab Re-splits – Gold
Source: Argonaut (2019)
Figure 11.5.5 Lab Re-splits – Silver
Source: Argonaut (2019)
Cerro del Gallo Heap Leach Project NI 43-101 Technical Report
January 31, 2020 Page 11-11
Figure 11.5.6 Lab Re-splits – Copper
Source: Argonaut (2019)
Standards
11.5.2.1 Standards from Cerro 2004-2008
Standard reference samples were purchased by Cerro from Ore Research & Exploration Pty Ltd. Eight standards (certified reference materials or CRM) with different elements and grades were used by Cerro, plus a quartz blank. They are conventional pulped standards with a particle size of -20 µm to -75 µm. The standards were supplied with a detailed “Certificate of Analysis”. Results of the standards used during all Cerro’s San Antón drilling programs are shown below in Table 11.5.1 and graphs located in Figure 11.5.7 through Figure 11.5.13 CRM Standard Graphs - Cerro 2004-2008 (Continued). Standards were routinely inserted into the sample stream every 40 samples. From Figure 11.5.7 through Figure 11.5.13 CRM Standard Graphs - Cerro 2004-2008 (Continued) it can be seen that the gold standards were close to, or just above, the certified values, while the copper and silver standards were consistently slightly under the certified values. From the graphs in Figure 11.5.7 through Figure 11.5.13, which show the variation over time, with upper and lower limits defined as ±10% of the CRM, it can be seen that there is still some variability occurring for each standard that may, in part, be due to inhomogeneity of the CRM or imprecision of the analytical technique. Some misallocated CRM Codes have been identified. Some batches were re-assayed by the

Cerro del Gallo Heap Leach Project NI 43-101 Technical Report
January 31, 2020 Page 11-12
laboratory when multiple standards from one batch reported outside of the defined limits. The change in assay values for these batches was not significant.
Table 11.5.1 Certified Values of Standard Samples
CRM Code Element Submitted Certified Value
Mean value Difference
OREAS 15Pa Au ppm 268 1.02 1 -2% OREAS 15Pb Au ppm 213 1.06 1.11 5% OREAS 15Pc Au ppm 248 1.61 1.66 3% OREAS 50P Au ppb 143 727 712 -2%
Cu % - 0.691 0.69 0% OREAS 50Pb Au ppb 186 841 844 0%
Cu % - 0.744 0.697 -6% OREAS 51P Au ppb 312 430 426 -1%
Cu % - 0.728 0.704 -3% OREAS 52Pb Au ppb 45 307 314 2%
Cu % - 0.334 0.3 -10% OREAS 53P Au ppb 366 380 381 0%
Cu % - 0.413 0.384 -7% OREAS 53Pb Au ppb 31 623 633 2%
Cu % - 0.546 0.496 -9% OREAS 60P Au ppm 80 2.6 2.66 2%
Ag ppm - 4.9 4.7 -3% OREAS 62Pa Au ppm 78 9.64 9.22 -4%
Ag ppm - 18.4 17.6 -4% OREAS 22P Au ppb 737 <5 - - Quartz Blank Au ppb 93 - - -
Source: Argonaut (2019)

Cerro del Gallo Heap Leach Project NI 43-101 Technical Report
January 31, 2020 Page 11-13
Figure 11.5.7 CRM Standard Graphs - Cerro 2004-2008
Source: Argonaut (2019)

Cerro del Gallo Heap Leach Project NI 43-101 Technical Report
January 31, 2020 Page 11-14
Figure 11.5.8 CRM Standard Graphs - Cerro 2004-2008 (Continued)
Source: Argonaut (2019)

Cerro del Gallo Heap Leach Project NI 43-101 Technical Report
January 31, 2020 Page 11-15
Figure 11.5.9 CRM Standard Graphs - Cerro 2004-2008 (Continued)
Source: Argonaut (2019)

Cerro del Gallo Heap Leach Project NI 43-101 Technical Report
January 31, 2020 Page 11-16
Figure 11.5.10 CRM Standard Graphs - Cerro 2004-2008 (Continued)
Source: Argonaut (2019)
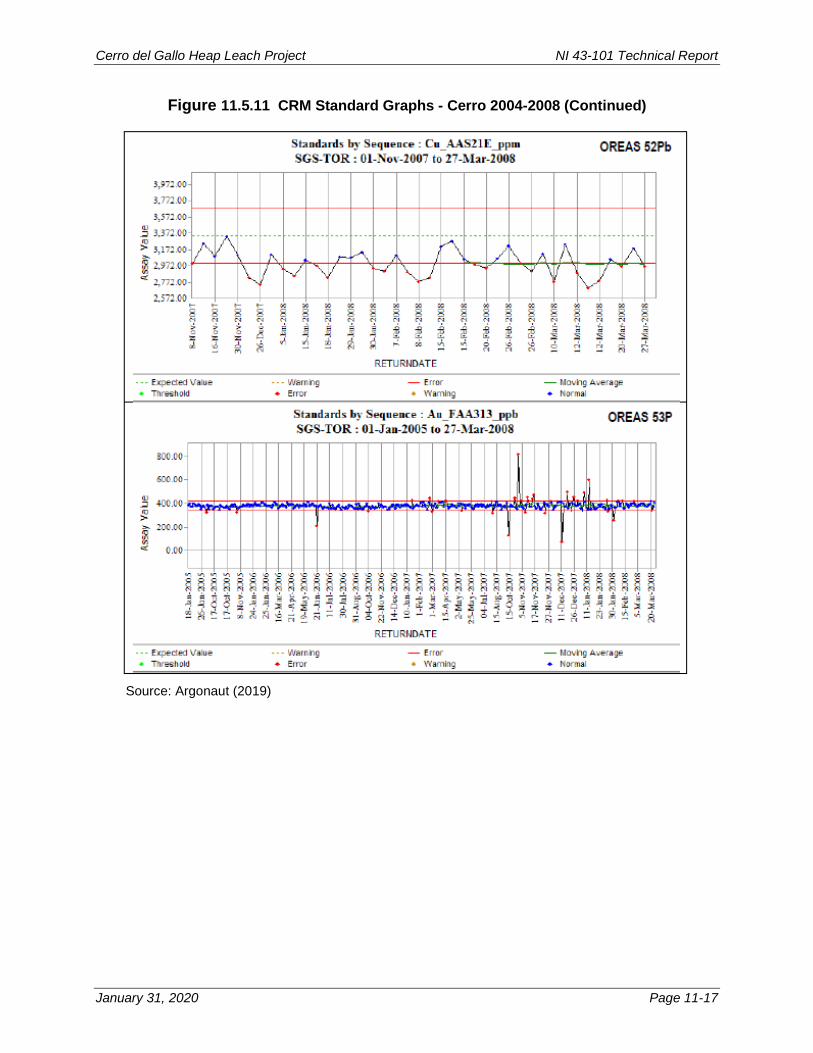
Cerro del Gallo Heap Leach Project NI 43-101 Technical Report
January 31, 2020 Page 11-17
Figure 11.5.11 CRM Standard Graphs - Cerro 2004-2008 (Continued)
Source: Argonaut (2019)

Cerro del Gallo Heap Leach Project NI 43-101 Technical Report
January 31, 2020 Page 11-18
Figure 11.5.12 CRM Standard Graphs - Cerro 2004-2008 (Continued)
Source: Argonaut (2019)

Cerro del Gallo Heap Leach Project NI 43-101 Technical Report
January 31, 2020 Page 11-19
Figure 11.5.13 CRM Standard Graphs - Cerro 2004-2008 (Continued)
Source: Argonaut (2019)
11.5.2.2 Standards from Primero 2013
CRM samples were purchased from CDN Resource Laboratories Ltd for use in the 2013 core drilling program. Four CRMs with different elements and grades were utilized. They are conventional pulped standards with a particle size of -20 µm to -75 µm. The standards were supplied with a detailed “Certificate of Analysis”. Results of the standards used during the 2013 drilling program are shown below in Table 11.5.2 and graphs located in Figure 11.5.14 through Figure 11.5.18. Standards were inserted at a frequency of every 5-20 samples. CDN-CM-30 was utilized the most of the four standards as it has certified gold, silver, and copper values. The other standards were used less frequently. In April of 2014, the CDN-GS-2K standard was replaced by CDN-GS-P due to the material being depleted and discontinued by the producing laboratory.

Cerro del Gallo Heap Leach Project NI 43-101 Technical Report
January 31, 2020 Page 11-20
Table 11.5.2 Certified Values of Standard Samples
CRM Code Element Submitted Certified Value
Mean Value Difference
CDN-CM-30 Au ppm 173 1.3 1.320 1.5% CDN-CM-30 Ag ppm 173 16 16.416 2.6% CDN-CM-30 Cu ppm 173 7300 7212 -1.2% CDN-CM-27 Au ppm 42 0.636 0.639 0.5% CDN-CM-27 Cu ppm 42 5930 5829 -1.7%
CDN-CGS-30 Au ppm 43 0.338 0.320 -5.3% CDN-CGS-30 Cu ppm 43 1540 1546 0.4% CDN-GS-2K Au ppm 44 1.97 1.971 0.1% CDN-GS-2P Au ppm 13 1.99 2.156 8.3%
Blank Au ppm 173 Blank Ag ppm 173 Blank Cu ppm 173
Source: Argonaut (2019)
Figure 11.5.14 CRM Standard Graphs – Primero 2013
Source: Argonaut (2019)

Cerro del Gallo Heap Leach Project NI 43-101 Technical Report
January 31, 2020 Page 11-21
Figure 11.5.15 CRM Standard Graphs – Primero 2013 (Continued)
Source: Argonaut (2019)

Cerro del Gallo Heap Leach Project NI 43-101 Technical Report
January 31, 2020 Page 11-22
Figure 11.5.16 CRM Standard Graphs – Primero 2013 (Continued)
Source: Argonaut (2019)

Cerro del Gallo Heap Leach Project NI 43-101 Technical Report
January 31, 2020 Page 11-23
Figure 11.5.17 CRM Standard Graphs – Primero 2013 (Continued)
Source: Argonaut (2019)

Cerro del Gallo Heap Leach Project NI 43-101 Technical Report
January 31, 2020 Page 11-24
Figure 11.5.18 CRM Standard Graphs – Primero 2013 (Continued)
Source: Argonaut (2019)
Blanks
11.5.3.1 Blanks from Cerro 2004-2008
Blanks were routinely inserted into the sample stream at every 100th sample. Generally, the blanks reported as below detection (less than 5 ppb), with 1% of the samples reporting above 50 ppb Au and up to a maximum of 190 ppb Au, which may imply minor cross-contamination or precision errors close to the detection limit.

Cerro del Gallo Heap Leach Project NI 43-101 Technical Report
January 31, 2020 Page 11-25
11.5.3.2 Blanks from Primero 2013
Blanks were inserted every 20 samples and/or after a visibly mineralized zone (usually veins and fault zones). Primero created blank material from drill core samples that were not mineralized. The material was inspected by a geologist and all assay results for gold, silver, and copper were at or near the lower detection limits of SGS methods described above. The upper limit in the blank control chart for gold is five times the lower detection limit of SGS method FAA313; the expected value is the lower detection limit. The upper limit in the blank control chart for silver is five times the lower detection limit of SGS method ICP14B; the expected value is the lower detection limit. A mean value of 10 ppm copper was used because very little drill core material was reported as <1 ppm. The upper limit in the blank control chart for copper is five times the mean, 50 ppm.

Cerro del Gallo Heap Leach Project NI 43-101 Technical Report
January 31, 2020 Page 11-26
Figure 11.5.19 CRM Blank Graphs – Primero 2013

Cerro del Gallo Heap Leach Project NI 43-101 Technical Report
January 31, 2020 Page 11-27
Source: Argonaut (2019)
Cerro del Gallo Heap Leach Project NI 43-101 Technical Report
January 31, 2020 Page 11-28
Check Assays
For the 2013 Primero core drilling program, ALS Minerals was chosen as a secondary lab, to verify sample values obtained from the primary laboratory, SGS. In April of 2014, 5% of the pulps from the 2013 campaign were randomly selected for check assay. Priority was given to samples with a gold grade above 1 ppm A total of 292 pulp samples were selected. Each sample was re-assayed for gold, silver and copper, then evaluated against the original assay from the SGS laboratory. Scatter plots and a slope of regression were created for each element (see Figure 11.5.20 and Figure 11.5.21).

Cerro del Gallo Heap Leach Project NI 43-101 Technical Report
January 31, 2020 Page 11-29
Figure 11.5.20 Check Assay Graphs – Primero 2013
Source: Argonaut (2019)

Cerro del Gallo Heap Leach Project NI 43-101 Technical Report
January 31, 2020 Page 11-30
Figure 11.5.21 Check Assay Graphs – Primero 2013 (Continued)
Source: Argonaut (2019)
11.6 QP Statement
Based on the results from standards, blanks, and duplicate samples, the Qualified Person responsible for this section believes that the drill hole assay samples generated by Cerro and Primero were adequately secured, properly prepared and assayed, and suitable for use in the estimation of resources and reserves.

Cerro del Gallo Heap Leach Project NI 43-101 Technical Report
January 31, 2020 Page 12-1
12 Data Verification
Argonaut provided drill hole databases for this Technical Report via their database consultant as CSV dumps with a final database received on 9 July 2019 for gold and 24 July 2019 for silver and copper. These databases contain drill collar coordinates, down-hole survey data, assay results, and information on rock density and geology. An external consultant, Mr. Matthew Sanford, carried out an audit of the database in preparation for the resource estimate. Zurkic Mining Consultants iteratively validated the data provided, communicating with Argonaut and Mr. Sanford any elements of concern in the database. Once the audited database was received further checks included but were not limited to:
• Overlapping Intervals; • Duplicate entries; • Missing data; • Assay values at nonsensical levels (e.g. beyond mineralogical possibility); • Calculated values at nonsensical levels (e.g. sample recovery beyond 100%); • Collar locations.
Once validated, the data was formatted and loaded to MineSight® file 11 and 12 project specific files. All missing entries were replaced with -99.
12.1 Pre-2013 Drill Hole Data
Golder (2006) previously verified the assay data integrity as used for the CdG resource estimate by undertaking a random comparison of approximately 5% of the database records against the original hard copy assay certificates. Only the Au (ppb), Au (g/t), Ag (g/t), and Cu (ppm) were compared. No discrepancies were found. A check was also done comparing the lithological logging to the core photos. No significant errors were found. As part of the implementation of the acQuire data management system, all original assay results as received from SGS were used to re-establish the assay database and a cross-check against the original MS Access database highlighted no significant errors.

Cerro del Gallo Heap Leach Project NI 43-101 Technical Report
January 31, 2020 Page 12-2
An extract from the acQuire drill hole database was supplied to Golder Associates who loaded and partially validated the data in MS Access. This partial validation primarily checked the structure of the database, such as gaps in the data and mismatches between collar, survey, assay and geology data. It also highlights outliers for each individual field. Only minor corrections to the drill hole database were required, which were completed prior to the data being used for resource estimation. During the re-log program assay values were plotted on new log sheets and cross checked with the original drill logs. At this same time, drill collars and surveys were also checked against in the data base before the data was imported into GEMS.
12.2 2019 Data Verification
Argonaut commissioned Sanford Information Systems (“SIS”) to carry out a database audit during July of 2019. Sections 12.2.1 to 12.2.3 are taken from that report.
Assays
Sanford Information Systems verified the database against signed assay certificates. Unit of measure errors were detected in Au in the database which appeared to be due to SGS changing reporting units from ppb to ppm. The database administrator did not account for the unit change and published Au ppm and Au ppb values in the same field. Additionally, a significant number of Au, Ag, and Cu values were missing from the database which were primarily determined to be lower detection limit values. Finally, Au ppm values had all been rounded to two decimals. Silver and copper assays were also subject to rounding issues. Due to the quality issues with the results in the assay table and the need for accuracy, all original assay csv files were recompiled by element, unit of measure, and analytical method into the database. During the recompilation, the csv files were verified against the signed assay certificates. No issues with assay integrity were identified in the csv files. Calculated ppm fields were created for Au, Ag, and Cu in the assay table (Au_ppm_Final, Ag_ppm_Final, Cu_ppm_Final). Top priority was given to analytical methods with the highest detection limits during processing (ore grade to trace level). To track the source of the data in the calculated fields, the analytical methods were stored in the element specific “source” fields. Strict rules on unit of measure conversions (ppb to ppm and percent to ppm) were adhered to and verified upon completion of the project.

Cerro del Gallo Heap Leach Project NI 43-101 Technical Report
January 31, 2020 Page 12-3
QC samples provided by Rafael Puente for the 2013 campaign were imported into the assay table and cataloged by sample type and CRM. The analysis of the QC sample data confirm that the guidelines are being followed. Most RC assay intervals contained small gaps which originated by dropping decimals after feet were converted to meters. All issues with interval gaps were resolved and no overlapping intervals were detected for the pre-2013 drilling. Sample gaps were recently identified in the 2013 core samples during the QC audit and a resolution is being discussed.
Drill Hole Collar Locations
Drill holes were checked for mis-alignment using high-resolution air photo imagery and a high-resolution topographic surface. All hole locations matched very well with disturbance observed on the imagery. No holes were more than 3 meters below the surface topography. Three holes were 2-3 meters below the surface topography. One hole was 3-4 meters above the surface topography. Two holes were 2-3 meters above the surface topography. A resurvey of all holes more than 3 meters from the surface topography was recommended. Only one hole within the resource area required a resurvey.
Downhole Surveys
Original downhole survey records were also checked against the database. A number of errors were detected and 50% of the dataset was recompiled in feet from the original datasheets. The primary issues were missing records and rounding errors in depth due to the conversion of feet to meters and dropping decimals. Only a few drill holes contained major deviations in azimuth or dip from the datasheet values which were corrected in the recompilation. From the new compilation, true north was recalculated using declination values published by NOAA. Annual variations and project location were used to determine declination values.
12.3 QP’s Opinion
In the opinion of the QP responsible for this section of this technical report, the CdG drill hole data are accurate and suitable for mineral resource estimation.
12.4 Heap Leach Facility and Waste Rock Dump Geotechnical Information
For the geotechnical information for the HLF and WRD in Section 6, Golder utilized its own data as well as historical data from Knight Piesold and Primero, the previous operator. In the opinion of the QP responsible for the geotechnical information contained in Section 6, the data is sufficient to use for the design of the WRD and HLF contained in this report.
Cerro del Gallo Heap Leach Project NI 43-101 Technical Report
January 31, 2020 Page 12-4
12.5 Metallurgical Test Data
KCA checked the metallurgical test procedures and results to ensure they met industry standards. Metallurgical sample locations were reviewed to ensure that there was material from throughout the resource area and that the samples were reasonably representative with regards to material type and grade with the material planned to be processed so as to support the selected process method and assumptions regarding recoveries and costs.
Cerro del Gallo Heap Leach Project NI 43-101 Technical Report
January 31, 2020 Page 13-1
13 Mineral Processing and Metallurgical Testing
13.1 Mineral Processing Summary
The CdG Project will be designed as an open-pit mine with a heap leach operation utilizing a multiple-lift, single-use leach pad. Test work evaluated heap leach recoveries with crushed material. Crushing will be accomplished using two stages of conventional crushing and one stage of high-pressure grinding roll (HPGR) crushing that will produce a 4 to 6 mm product (80% passing size or p80). The final product from the crushing circuit will be agglomerated with cement and conveyed to the heap leach pad where a conveyor/stacking system will place the material in discrete lifts. The stacked ore will be leached using a dilute cyanide solution to recover gold, silver and copper. Leaching will be conducted in two stages, or phases, that vary in time, solution flow, and cyanide concentration. The gold, silver, and copper bearing solution will be collected in the pregnant solution pond and pumped to a Sulfidization, Acidification, Recycle, Thickening plant (SART). Pregnant solution will be acidified with sulfuric acid in the SART plant. Copper and silver will be precipitated as sulfides by the addition of sodium sulfide. The precipitate will be thickened and filtered to produce a wet filter cake for shipment. The copper thickener overflow solution will be neutralized with slaked lime. Gypsum will precipitate during the neutralization process and will be removed in a thickener. The gypsum thickener underflow will be pumped to a collection pond during the early stages of the project, ultimately the gypsum byproduct is expected to be stored long-term in an unused area of the heap leach pad. Gypsum thickener overflow will gravity-flow to the ADR plant for gold recovery. The resulting barren solution will flow over a carbon safety screen, then to a barren solution storage tank. Make-up sodium cyanide will be added, and then the barren solution will be pumped back up to the heap. Gold will be produced as metal doré from a conventional activated carbon adsorption process (ADR) and shipped to a precious metal refiner. The copper and silver will be processed via SART and resulting products sold and shipped to smelters. Additional details on processing are presented in Section 17.

Cerro del Gallo Heap Leach Project NI 43-101 Technical Report
January 31, 2020 Page 13-2
13.2 Metallurgical Test Work Summary
The laboratory test work has included characterization, comminution, flotation, and cyanidation through column, bottle roll and agitated (shake) leach tests. Data was further differentiated by crush size and type (conventional and HPGR). Historical test work included laboratory work prior to 2015 performed by others. Current test work includes results from 2018 and 2019 performed by KCA. Historical test work included three main categories for the ore types (Weathered/Oxide, Mixed, Fresh/Sulfide) while the current test work further differentiates the Mixed category into two separate material types (Mixed Oxide, Mixed Sulfide). In total there are four separate material ore type categories that were considered in the recent test work and in this study: Oxide, Mixed Oxide, Mixed Sulfide, and Sulfide. The projected field recoveries and reagent consumptions for the four separate material ore types were derived from the current test work since the historic test work that matched the process criteria (column leached HPGR crushed material) were not able to be included in this analysis due to lack of information that connect the old samples to the mineralization breakdown selected for this project. However, the historical test results are generally in line with the current results. The projected field gold and silver recoveries based on the available test work results are summarized in Table 13.2.1 and the estimated reagent consumptions are presented in Table 13.2.2. CdG is estimated to use a 120-day leach cycle on the heap leach with a HPGR crush size from 4 to 6 mm (80% passing size or p80).
Table 13.2.1 Cerro del Gallo Recoveries by Material Type
Ore Type (HPGR)
Feed Distribution
LOM Average1
Column Test Recoveries Projected Field Recoveries2
Au, % Ag, % Au, % Ag, % Cu%
Weathered (Oxide) 9.2% 76 63 74 60 22 Mixed Oxide 5.8% 72 82 70 79 46 Mixed Sulfide 38.0% 61 62 59 59 59 Fresh (Sulfide) 47.0% 60 43 58 40 34
Life of Mine (LOM) Average 60 52 43 1 Based on MDA mine plan v9 18Oct2019 2 Gold Discount, % 2 2 Silver Discount, % 3 2 Copper Discount, % 0
Source: KCA (2019)

Cerro del Gallo Heap Leach Project NI 43-101 Technical Report
January 31, 2020 Page 13-3
Table 13.2.2 Cerro del Gallo Reagent Consumptions by Material Type
Ore Type (HPGR)
Feed Distribution
LOM Average1
Column Test Reagents, kg/t
Projected Field Reagents, kg/t
NaCN Cement2 Lime NaCN3 Cement Lime Weathered (Oxide) 9.2% 2.3 20.0 – 0.87 10.0 – Mixed Oxide 5.8% 2.7 10.0 – 0.34 10.0 – Mixed Sulfide 38.0% 3.3 10.0 – 0.87 10.0 – Fresh (Sulfide) 47.0% 2.4 7.5 – 0.60 10.0 –
Life of Mine (LOM) Average 0.71 10 – 1 Based on MDA mine plan v9 18Oct2019 2 Based on compacted permeability test work, 80 m 3 Based on METSIM simulation
Source: KCA (2019)
The material samples analyzed by KCA have demonstrated amenability to cyanide heap leaching. Elevated levels of copper in the ore material may have a significant effect on potential economic extraction if not managed properly.
13.3 Historical Testing
Historical test work included laboratory work prior to 2015 performed by others. Test work prior to 2015 was summarized from Technical Report First Stage Heap Leach Feasibility Study Cerro del Gallo Gold Silver Project issued by Sedgman Limited, Reserva International, and Mine Development Associates in June 2012. The historical test work includes comminution, HPGR, flotation, gravity separation, agitated leach, intermittent bottle roll cyanide leach, percolation, column leach, Merrill Crowe, carbon adsorption, and SART. Historical test work included three main categories of ore types Weathered/Oxide, Mixed, and Fresh/Sulfide.
13.4 Metallurgical Testing Pre-2015
Test work commenced in 2006 and was conducted by various metallurgical laboratories, including: Independent Metallurgical Laboratories (IML) in Welshpool, Australia, SGS Lakefield Oretest Pty Ltd (Oretest) in Malaga, Australia, ALS AMMTEC in Balcatta, Australia, JKTech of Brisbane Queensland, Australia, and Polysius Australia Pty Ltd (Polysius) of Henderson, Australia. The test work was performed on drill core samples and RC chip samples and included three main categories for the ore types (Weathered, Mixed, Fresh). Flotation test work

Cerro del Gallo Heap Leach Project NI 43-101 Technical Report
January 31, 2020 Page 13-4
was explored but not pursued. Subsequent test work was focused on cyanide leaching due to the potential economic viability.
13.4.1 Comminution Test Work The results of the comminution test work indicate that some of the ore types are somewhat abrasive and may require moderately high energy for grinding. Results summarized in Table 13.4.1.
Table 13.4.1 Cerro del Gallo Comminution Test Work Results
Abrasion Index
Bond Work Index (kWh/tonne)
(g) Rod Mill Ball Mill Rwi:Bwi Comp. Ball Mill 0.3974 24.9 17.5 1.42 12.9
Source: KCA (2019)
13.4.2 High Pressure Grinding Roll (HPGR) Test Work The HPGR test work included single pass and locked cycle crushing, a Polysius ATWAL wear test, and Bond ball mill work index tests. Results are summarized in Tables Table 13.4.2 through Table 13.4.5.
Table 13.4.2 Cerro del Gallo Bond Ball Mill Work Index Results Summary
Sample ID F80 (microns) P80 (microns) Work Index (kWh/t) Master Feed 2,374 75 14.9 Test 8 center product (-4mm) 2,153 85 14.6
Source: KCA (2019)

Cerro del Gallo Heap Leach Project NI 43-101 Technical Report
January 31, 2020 Page 13-5
Table 13.4.3 Cerro del Gallo Single Pass HPGR Test Work
Test No. Moisture Roll Speed
Specific Throughput
Specific Grinding
Force
Specific Energy Input
Net Feed (dry) (%) (m/s) (ts/hm3 (dry)) (N/mm2) (kWh/t) 1 3.0 0.2 214.8 3.94 1.90 2 3.0 0.2 221.8 3.08 1.46 3 3.0 0.5 214.7 4.02 1.96 4 3.0 0.2 207.1 3.84 2.14
Source: KCA (2019)
Table 13.4.4 Cerro del Gallo Closed Circuit HPGR Test Work Results
Test No. Moisture Specific
Throughput Specific Grinding
Force
Specific Energy Input
Net Feed (dry)
(%) (ts/hm3 (dry)) (N/mm2) (kWh/t) 5 3.0 222.3 3.74 1.78 6 3.0 222.7 3.80 1.65 7 3.0 218.3 3.80 1.64 8 3.0 222.2 3.71 1.60
Source: KCA (2019)
Table 13.4.5 Cerro del Gallo HPGR Wear Rate Test Work Results
Parameter Test 1 Test 2
Throughput (kg/h) 212.5 187.8 Specific throughput (ts/hm3) 164.7 145.6 Total wear rate (g/t) 41.0 60.5
Source: KCA (2019)
13.4.3 Flotation Test Work The flotation test work was conducted on Weathered/Oxide and Mixed Oxide sample material. Results indicated low recoveries with gold, silver, and copper. The test results are presented in Table 13.4.6.
Table 13.4.6 Cerro del Gallo Average Cleaner Flotation Test Results
Con. Wt Concentrate Grades Recoveries (%)
(%) % Cu Au g/t As g/t Cu Au As 0.70 4.90 55.8 4450 38.9 33.2 10.8
Source: KCA (2019)

Cerro del Gallo Heap Leach Project NI 43-101 Technical Report
January 31, 2020 Page 13-6
13.4.4 Gravity Separation Test Work The gravity separation test work indicated low performance in recovering gold, silver, and copper. Results are presented in Table 13.4.7.
Table 13.4.7 Cerro del Gallo Average Gravity Separation Results
Mass Assays (g/t) Distributions (%) (%) Au Ag Cu Au Ag Cu 0.34 28.2 436 3355 11.6 8.8 1.6
Source: KCA (2019)
13.4.5 Agitated Cyanide Leach Test Work Agitated cyanide leach tests were conducted. The campaign results were overall positive and indicated moderately high gold, silver dissolutions with moderate copper dissolution. The average agitated cyanide leach results are shown in Table 13.4.8.
Table 13.4.8 Cerro del Gallo Average Agitated Cyanide Leaches
Camp.
Reagents (kg/t) Assays (g/t) Dissolutions (%)
NaCN Added
NaCN Cons.
Lime Added
Calc. Head (Au)
Res (Au)
Calc. Head (Ag)
Res. (Ag)
Calc. Head (Cu)
Res. (Cu) Au Ag Cu
1 2.91 2.14 1.30 1.20 0.22 18 12 - - 80 33.0 - 2 1.93 1.41 1.99 1.17 0.21 13 6 774 383 83 63 37.4 3 2.25 2.25 1.55 1.31 0.14 12 4 775 324 89 72 57.1
Source: KCA (2019)
13.4.6 Intermittent Bottle Roll Leach Test Work The leach test work included intermittent bottle rolls, and generally observed increased recoveries of gold, silver, and copper with finer crush sizes. Results from the test campaign are presented in Table 13.4.9

Cerro del Gallo Heap Leach Project NI 43-101 Technical Report
January 31, 2020 Page 13-7
Table 13.4.9 Cerro del Gallo Intermittent Bottle Roll Cyanide Leach Results
Camp.
Reagents (kg/t) Assays (g/t) Dissolutions (%)
NaCN Added
NaCN Cons.
Lime Added
Calc. Head (Au)
Res (Au)
Calc. Head (Ag)
Res. (Ag)
Calc. Head (Cu)
Res. (Cu) Au Ag Cu
1-6.3mm 1.84 0.62 0.81 0.91 0.59 18 16 - - 35.8 12.4 -
1-3.35mm 2.75 1.56 2.03 1.49 0.58 20 12 - - 57.6 37.3 -
2-19mm 2.78 1.31 2.89 1.11 0.61 18 15 1038 723 43.1 29.3 29.4
2-6.3mm 3.16 1.57 3.28 1.15 0.53 19 12 985 655 52.1 40.0 33.9
3-8mmC 3.31 1.75 3.10 1.17 0.60 14 8 760 505 48.8 43.6 33.6
3-8mmH 2.72 1.19 2.78 1.31 0.54 13 6 638 313 59.5 54.7 49.7
4-8mmC 2.57 1.78 2.82 1.33 0.56 15 8 839 447 58.3 46.4 47.2
5-3.27mmH 1.25 0.96 2.34 1.69 0.63 11 6 596 358 62.8 47.6 39.9
6-3.27mmH 1.62 1.32 2.53 1.76 0.62 13 6 677 359 64.8 52.2 47.0 C = Conventional crushed H = HPGR crushed Source: KCA (2019)
13.4.7 Percolation Test Work The percolation test work included percolation and slump tests with cement addition. To achieve an acceptable slump below 10% and percolation rate above 10,000 L/m2/h, at a 6.3 mm crush size, 4 kg/t of cement addition was required.
13.4.8 Column Leach Test Work The initial column leach tests were conducted on Weathered/Oxide material at two separate crush sizes. In total the columns were leached for 61 days and increased recoveries were observed for the smaller crush size. Results are presented in Table 13.4.10 and illustrated in Figure 13.4.1.
Table 13.4.10 Cerro del Gallo Column Leach Results
Crush Size (mm)
Reagents (kg/t) Assays (g/t) Dissolutions (%)
NaCN Added
NaCN Cons.
Lime Added
Calc. Head (Au)
Res (Au)
Calc. Head (Ag)
Res. (Ag)
Calc. Head (Cu)
Res. (Cu) Au Ag Cu
-6.3 0.83 0.20 0.07 0.70 0.15 7.8 4.5 204 178 78.4 42.1 12.6 -12.5 0.90 0.27 0.11 0.71 0.18 8.1 5.5 205 181 75.0 32.4 12.1
Source: KCA (2019)

Cerro del Gallo Heap Leach Project NI 43-101 Technical Report
January 31, 2020 Page 13-8
Figure 13.4.1 Cerro del Gallo Column Leach Graphs
Source: KCA (2019)
Subsequent column leach tests were conducted on Weathered/Oxide and Mixed Oxide composite samples both conventionally and HPGR crushed. The columns leached for a total of 115 days each. Results are presented in Table 13.4.11 and show the HPGR crushed material with higher average metal dissolutions. Sample S2, conventionally crushed, was agglomerated with 6 kg/t of cement and resulted with higher cyanide consumption along with much higher copper recovery.

Cerro del Gallo Heap Leach Project NI 43-101 Technical Report
January 31, 2020 Page 13-9
Table 13.4.11 Cerro del Gallo Column Leach – Conventional versus HPGR Crushing
Crush Size (mm)
Reagents (kg/t) Assays (g/t) Dissolutions (%)
NaCN Added
NaCN Cons.
Lime Added
Calc. Head (Au)
Res (Au)
Calc. Head (Ag)
Res. (Ag)
Calc. Head (Cu)
Res. (Cu) Au Ag Cu
Conv. 1.36 1.08 1.28 1.20 0.58 13 8 786 553 52.2 38.0 31.5 HPGR 1.38 1.15 1.02 1.21 0.42 12 6 618 376 65.6 52.1 38.5 Conv.
S2 4.39 4.39 1.03 1.24 0.53 12 6 1355 348 57.6 49.9 73.4
Source: KCA (2019) Considering the column leach results with different ore types, no trend was observed between strongly, moderately, and weakly oxidized ore material types. Results are presented in Table 13.4.12.
Table 13.4.12 Cerro del Gallo Column Leach – Ore Types
Ore Type
Dissolutions (%) Conventional
Crush Dissolutions (%)
HPGR Crush Dissolutions (%)
Conventional Crush S2
Au Ag Cu Au Ag Cu Au Ag Cu Weathered 59.7 36.5 20.4 73.3 54.5 26.9 65.7 45.2 76.2 Strongly Oxidized 48.2 48.2 42.6 63.7 54.9 45.6 49.6 53.6 63.9
Moderately Oxidized 51.5 36.9 37.6 65.3 48.1 43.0 59.2 49.6 75.9
Weakly Oxidized 43.2 35.7 24.0 60.7 59.0 31.2 52.4 51.8 72.8 Source: KCA (2019)
13.4.9 Merrill Crowe Test Work The Merrill Crowe tests were conducted on filtered pregnant solution and resulted in gold extractions of 85.8%, silver extractions 99.9%, and copper extractions of 13.1%.
13.4.10 Carbon Adsorption Test Work The carbon adsorption test work was carried out to determine the Fleming and Nicol k and n values for gold, silver, and copper. Kinetics of adsorption were observed as moderate for gold, moderate to slow for silver, and slow to moderate for copper. On Series 2 there is a suspected assaying error with the copper carbon loading, maximum loading is approximated at 50,000 g/t. Results are summarized in Table 13.4.13.

Cerro del Gallo Heap Leach Project NI 43-101 Technical Report
January 31, 2020 Page 13-10
Table 13.4.13 Cerro del Gallo Carbon Contact Results Summary
Series
Gold Silver Copper
k n Carbon Loading
(g/t) k n
Carbon Loading
(g/t) k n
Carbon Loading
(g/t)
1 133.5 0.689 705 62.7 0.661 3,739 1.4 0.702 2,774 2 156.8 0.705 1,166 134.5 0.514 5,302 62.9 0.541 138,874
Source: KCA (2019)
13.4.11 SART Test Work The SART test work was conducted on filtered pregnant leach solution. Results of this study produced a high-grade precipitate that may be further processed or sold, but also contained significant amounts of gold, zinc, mercury and iron that may pose issues with marketing. The results are presented in Table 13.4.14.
Table 13.4.14 Cerro del Gallo SART Results
Sample
Assays
CN Total
(mg/L)
WADCN Calc.
(mg/L) SCN
(mg/L) CN
Free (mg/L)
Au (mg/L)
Ag (mg/L)
Cu (mg/L)
Zn (mg/L)
Fe (mg/L)
Preliminary Tests Feed Solution 550 547 180 240 1.00 4.48 285 30.8 1.0
Barren Solution 500 499 190 159 0.62 0.00 0.1 5.0 0.5
Precipitate - - - - - 0.29% 51.6% 4.0% 0.18%
Optimized Tests Feed Solution 560 560 210 150 1.12 5.56 317 21.9 <1
Barren Solution 440 440 225 285 0.62 0.02 11.6 7.0 <1
Precipitate - - - - 25.3 g/t 1.33% 58.3% 2.9% 0% Source: KCA (2019)
The solution discharged from the SART test work was further processed with activated carbon resulting in 96.8% gold adsorption. Results are shown in Table 13.4.15.

Cerro del Gallo Heap Leach Project NI 43-101 Technical Report
January 31, 2020 Page 13-11
Table 13.4.15 Cerro del Gallo SART Solution Carbon Adsorption
Product Solution Assays
(ppm) Carbon Assay
Gold Adsorption
Au Ag Cu Au (g/t (%) Feed solution 0.62 0.002 0.10 0 0
Barren solution 0.02 0.002 0.25 59 96.8 Source: KCA (2019)
13.5 Metallurgical Testing 2018 and 2019
KCA’s laboratory conducted test work on four main categories of ore types Weathered/Oxide, Mixed Oxide, Mixed Sulfide, and Fresh/Sulfide. The metallurgical test work included head analyses (assay and multi-element), agglomeration, percolation, compacted permeability, bottle roll and column leach on conventionally and HPGR crushed material. Comminution test work was performed by an external laboratory, Hazen Research Incorporated. The head analyses test work included head fire assays for gold and silver, head screen analysis with assays by size fraction, assays by quantitative methods for carbon, sulfur and mercury and semi-quantitative assays by means of an ICAP-OES for an additional series of elements and for whole rock constituents. Results of the head analyses are presented in Table 13.5.1 through Table 13.5.8.
Table 13.5.1 Cerro del Gallo KCA Laboratory Gold and Silver Head Assays
KCA Sample
No. Description Mineral
Type
Average Assay,
gms Au/MT
Average Assay,
gms Ag/MT
82512 B CO1 OX 0.270 14.09 82513 B CO2 MIX OX 1.143 12.51 82514 A CO3 MIX OX 0.732 20.35 82515 A CO4 MIX SULF 1 0.739 14.50 82516 A CO5 MIX SULF 1 0.375 29.71 82517 A CO6 MIX SULF 2 0.495 22.41 82518 B CO7 MIX SULF 2 0.835 6.51 82519 B CO8 SULF HG 1.694 2.40 82520 A CO9 SULF 1.903 5.79 82521 A CO10 OX HG 1.365 9.70 82522 A CO11 MIX SULF HG 3.064 3.39
Source: KCA (2019)

Cerro del Gallo Heap Leach Project NI 43-101 Technical Report
January 31, 2020 Page 13-12
Table 13.5.2 Cerro del Gallo KCA Laboratory Copper, Lead and Zinc
KCA Sample
No. Description Mineral
Type Copper, mg/kg
Lead, mg/kg
Zinc, mg/kg
82512 B CO1 OX 480 263 672 82513 B CO2 MIX OX 600 153 782 82514 A CO3 MIX OX 461 340 260 82515 A CO4 MIX SULF 1 691 188 911 82516 A CO5 MIX SULF 1 2310 713 803 82517 A CO6 MIX SULF 2 992 404 1300 82518 B CO7 MIX SULF 2 1200 347 844 82519 B CO8 SULF HG 711 17 419 82520 A CO9 SULF 731 123 560 82521 A CO10 OX HG 686 55 296 82522 A CO11 MIX SULF HG 671 11 229
Source: KCA (2019)
Table 13.5.3 Cerro del Gallo KCA Laboratory Carbon and Sulfur
KCA Sample
No. Description Mineral
Type
Total Carbon,
%
Organic Carbon,
%
Inorganic Carbon,
%
Total Sulfur,
%
Sulfide Sulfur,
%
Sulfate Sulfur,
% 82512 B CO1 OX <0.01 <0.01 <0.01 0.05 <0.01 0.04 82513 B CO2 MIX OX 0.02 0.02 <0.01 0.14 0.05 0.09 82514 A CO3 MIX OX 0.05 0.04 0.02 0.30 0.20 0.10 82515 A CO4 MIX SULF 1 0.02 0.02 <0.01 1.13 0.94 0.20 82516 A CO5 MIX SULF 1 0.06 0.04 0.02 1.80 1.60 0.20 82517 A CO6 MIX SULF 2 0.04 0.02 0.02 2.06 1.76 0.30 82518 B CO7 MIX SULF 2 0.04 0.02 0.02 1.29 1.13 0.16 82519 B CO8 SULF HG 0.16 0.07 0.09 1.47 1.23 0.25 82520 A CO9 SULF 0.04 0.03 0.01 0.95 0.84 0.11 82521 A CO10 OX HG 0.05 0.04 0.01 0.12 0.04 0.08 82522 A CO11 MIX SULF HG 0.02 <0.01 0.02 0.53 0.43 0.09
Source: KCA (2019)

Cerro del Gallo Heap Leach Project NI 43-101 Technical Report
January 31, 2020 Page 13-13
Table 13.5.4 Cerro del Gallo KCA Laboratory Mercury and Copper
KCA Sample
No. Description Mineral
Type
Total Mercury,
mg/kg
Total Copper, mg/kg
Cyanide Soluble Copper, mg/kg
Cyanide Soluble Copper,
% 82512 B CO1 OX <0.02 480 93.70 20% 82513 B CO2 MIX OX <0.02 600 81.60 14% 82514 A CO3 MIX OX 0.10 461 78.45 17% 82515 A CO4 MIX SULF 1 <0.02 691 78.40 11% 82516 A CO5 MIX SULF 1 <0.02 2310 167.40 7% 82517 A CO6 MIX SULF 2 <0.02 992 69.00 7% 82518 B CO7 MIX SULF 2 <0.02 1200 73.05 6% 82519 B CO8 SULF HG <0.02 711 58.30 8% 82520 A CO9 SULF <0.02 731 60.35 8% 82521 A CO10 OX HG <0.02 686 68.65 10% 82522 A CO11 MIX SULF HG 0.02 671 10.28 2%
Source: KCA (2019)

Cerro del Gallo Heap Leach Project NI 43-101 Technical Report
January 31, 2020 Page 13-14
Table 13.5.5 Cerro del Gallo KCA Laboratory Multi-Element Analysis (1 of 2)
Source: KCA (2019)
Constituent Unit
KCA Sample No.
82512 BCO1
KCA Sample No.
82513 BCO2
KCA Sample No.
82514 ACO3
KCA Sample No.
82515 ACO4
KCA Sample No.
82516 ACO5
KCA Sample No.
82517 ACO6
Al % 5.98 4.08 3.99 5.20 3.85 4.79As mg/kg 343 212 312 889 257 209Ba mg/kg 919 464 396 438 346 431Bi mg/kg 93 374 78 384 125 154
C(total) % <0.01 0.02 0.05 0.02 0.06 0.04C(organic) % <0.01 0.02 0.04 0.02 0.04 0.02
C(inorganic) % <0.01 <0.01 0.02 <0.01 0.02 0.02Ca % 0.03 0.25 0.03 0.38 0.04 0.17Cd mg/kg 9 12 8 32 22 44Co mg/kg 3 8 2 10 8 11Cr mg/kg 25 70 87 91 75 92
Cu(total) mg/kg 480 600 461 691 2310 992Cu(cyanide soluble)
1 mg/kg 93.7 81.6 78.5 78.4 167.4 69.0Fe % 3.32 3.25 2.6 4.18 4.11 5.16Hg mg/kg <0.02 <0.02 0.10 <0.02 <0.02 <0.02K % 3.65 2.46 3.37 3.41 2.37 2.3
Mg % 0.18 0.60 0.11 0.82 0.13 0.76Mn mg/kg 868 592 73 537 164 784Mo mg/kg 23 14 25 11 47 36Na % 0.19 0.37 0.16 0.55 0.18 0.58Ni mg/kg 4 17 15 41 11 27Pb mg/kg 263 153 340 188 713 404
S(total) % 0.05 0.14 0.3 1.13 1.8 2.06S(sulfide) % <0.01 0.05 0.2 0.94 1.6 1.76S(sulfate) % 0.04 0.09 0.1 0.2 0.2 0.3
Sb mg/kg 15 17 21 17 11 7Se mg/kg 9 14 17 50 16 17Sr mg/kg 133 57 61 99 53 92Te mg/kg 8 14 9 12 12 15Ti % 0.07 0.16 0.05 0.21 0.11 0.17V mg/kg 31 62 33 80 46 88W mg/kg 56 75 41 56 35 45Zn mg/kg 672 782 260 911 803 1300

Cerro del Gallo Heap Leach Project NI 43-101 Technical Report
January 31, 2020 Page 13-15
Table 13.5.6 Cerro del Gallo KCA Laboratory Multi-Element Analysis (2 of 2)
Source: KCA (2019)
Constituent Unit
KCA Sample No.
82518 BCO7
KCA Sample No.
82519 BCO8
KCA Sample No.
82520 ACO9
KCA Sample No.
82521 AC10
KCA Sample No.
82522 AC11
Al % 3.52 5.33 4.92 3.76 4.27As mg/kg 249 124 508 155 140Ba mg/kg 323 495 526 446 387Bi mg/kg 139 298 216 208 170
C(total) % 0.04 0.16 0.04 0.05 0.02C(organic) % 0.02 0.07 0.03 0.04 <0.01
C(inorganic) % 0.02 0.09 0.01 0.01 0.02Ca % 0.09 1.76 0.15 0.13 0.15Cd mg/kg 95 8 16 6 8Co mg/kg 9 14 7 4 6Cr mg/kg 100 88 69 94 75
Cu(total) mg/kg 1200 711 731 686 671Cu(cyanide soluble)
1 mg/kg 73.05 58.3 60.35 68.65 10.28Fe % 3.44 4.2 2.29 3.38 1.79Hg mg/kg <0.02 <0.02 <0.02 <0.02 0.02K % 2.55 2.87 3.71 1.69 3.6
Mg % 0.35 0.78 0.40 0.18 0.26Mn mg/kg 342 822 388 192 171Mo mg/kg 46 19 25 35 24Na % 0.35 1.46 0.79 0.46 0.49Ni mg/kg 12 23 7 10 7Pb mg/kg 347 17 123 55 11
S(total) % 1.29 1.47 0.95 0.12 0.53S(sulfide) % 1.13 1.23 0.84 0.04 0.43S(sulfate) % 0.16 0.25 0.11 0.08 0.09
Sb mg/kg 7 10 4 9 6Se mg/kg 6 12 <5 12 <5Sr mg/kg 67 151 105 74 89Te mg/kg 10 20 12 15 11Ti % 0.13 0.27 0.09 0.13 0.08V mg/kg 41 67 26 55 23W mg/kg 42 108 38 37 39Zn mg/kg 844 419 560 296 229

Cerro del Gallo Heap Leach Project NI 43-101 Technical Report
January 31, 2020 Page 13-16
Table 13.5.7 Cerro del Gallo KCA Laboratory Whole Rock Analyses (1 of 2)
Source: KCA (2019)
Constituent UnitSiO2 % 74.5 77.7 80.6 70.4 78.4 73.4
Si % 34.83 36.33 37.68 32.91 36.65 34.32Al2O3 % 11.4 8.56 8.64 11.4 8.24 9.86
Al % 6.03 4.53 4.57 6.03 4.36 5.22Fe2O3 % 4.56 4.92 3.91 6.62 5.71 7.02
Fe % 3.19 3.44 2.73 4.63 3.99 4.91CaO % 0.05 0.74 <0.01 0.96 <0.01 0.23Ca % 0.04 0.53 0.00 0.69 0.00 0.16
MgO % 0.33 1.13 0.18 1.56 0.23 1.39Mg % 0.20 0.68 0.11 0.94 0.14 0.84
Na2O % 0.22 0.51 0.14 0.73 0.20 0.75Na % 0.16 0.38 0.10 0.54 0.15 0.56
K2O % 4.34 3.05 4.32 4.12 3.13 2.80K % 3.60 2.53 3.59 3.42 2.60 2.32
TiO2 % 0.36 0.43 0.22 0.52 0.3 0.53Ti % 0.22 0.26 0.13 0.31 0.18 0.32
MnO % 0.13 0.09 0.01 0.08 0.02 0.11Mn % 0.10 0.07 0.01 0.06 0.02 0.09SrO % 0.01 <0.01 <0.01 <0.01 <0.01 <0.01Sr % 0.01 0.00 0.00 0.00 0.00 0.00
BaO % 0.11 0.06 0.05 0.05 0.04 0.05Ba % 0.10 0.05 0.04 0.04 0.04 0.04
Cr2O3 % <0.01 0.02 0.01 0.02 0.01 0.01Cr % 0.00 0.01 0.01 0.01 0.01 0.01
P2O5 % 0.10 0.11 0.08 0.11 0.07 0.09P % 0.04 0.05 0.03 0.05 0.03 0.04
LOI1090°C % 3.39 2.70 1.79 3.34 3.41 3.83SUM % 99.5 100.0 100.0 99.9 99.8 100.1
Note: The SUM is the total of the oxide constituents and the loss on ignition.
KCA Sample No.
82513 BCO2
KCA Sample No.
82514 ACO3
KCA Sample No.
82515 ACO4
KCA Sample No.
82516 ACO5
KCA Sample No.
82517 ACO6
KCA Sample No.
82512 BCO1

Cerro del Gallo Heap Leach Project NI 43-101 Technical Report
January 31, 2020 Page 13-17
Table 13.5.8 Cerro del Gallo KCA Laboratory Whole Rock Analyses (2 of 2)
Source: KCA (2019)
Comminution testing consisted of Bond ball mill work index (BWi) and Bond abrasion index (Ai) testing. Sample material was stage crushed to minus 6 mesh and utilized as the feed for the grindability tests. The results are presented in Table 13.5.9.
Constituent UnitSiO2 % 80.6 70.7 77.5 81.7 81.2
Si % 37.68 33.05 36.23 38.20 37.96Al2O3 % 7.36 11.2 10.3 7.2 8.25
Al % 3.90 5.93 5.45 3.81 4.37Fe2O3 % 4.61 5.71 3.32 4.62 2.50
Fe % 3.22 3.99 2.32 3.23 1.75CaO % 0.09 2.43 0.19 0.12 0.20Ca % 0.06 1.74 0.14 0.09 0.14
MgO % 0.62 1.53 0.75 0.31 0.46Mg % 0.37 0.92 0.45 0.19 0.28
Na2O % 0.45 1.68 1.15 0.68 0.67Na % 0.33 1.25 0.85 0.50 0.50
K2O % 3.29 3.66 4.66 2.12 4.83K % 2.73 3.04 3.87 1.76 4.01
TiO2 % 0.31 0.53 0.33 0.32 0.27Ti % 0.19 0.32 0.20 0.19 0.16
MnO % 0.05 0.12 0.05 0.03 0.02Mn % 0.04 0.09 0.04 0.02 0.02SrO % <0.01 0.01 <0.01 <0.01 <0.01Sr % 0.00 0.01 0.00 0.00 <0.01
BaO % 0.04 0.06 0.06 0.05 0.05Ba % 0.04 0.05 0.05 0.04 0.04
Cr2O3 % 0.02 0.01 <0.01 0.01 0.01Cr % 0.01 0.01 <0.01 0.01 0.01
P2O5 % 0.05 0.15 0.08 0.07 0.08P % 0.02 0.07 0.03 0.03 0.03
LOI1090°C % 2.44 2.45 1.98 2.97 1.66SUM % 99.9 100.2 100.4 100.2 100.2
Note: The SUM is the total of the oxide constituents and the loss on ignition.
KCA Sample No.
82518 B
KCA Sample No.
82519 B
KCA Sample No.
82520 A
KCA Sample No.
82521 A
KCA Sample No.
82522 A

Cerro del Gallo Heap Leach Project NI 43-101 Technical Report
January 31, 2020 Page 13-18
Table 13.5.9 Cerro del Gallo KCA Comminution Test Results
KCA Sample
No. Description Mineral
Type Ai BWi,
kWh/MT 82512 A CO1 OX 0.1777 9.3 82513 A CO2 MIX OX 0.5402 14.8 82515 A CO4 MIX SULF 1 0.3498 12.7 82516 A CO5 MIX SULF 1 0.4933 12.1 82520 A CO9 SULF 0.8189 14.2
Source: KCA (2019)
KCA also conducted HPGR test work. Material was crushed to 100% passing 19 mm with a Thyssenkrupp Pilotwal HPGR unit with no edge recycle, screened at 9.5 mm and oversize material re-crushed, as depicted in Figure 13.5.1. The crushing was done at one pressure and one moisture content. Results are presented in Table 13.5.10.
Figure 13.5.1 Cerro del Gallo KCA Laboratory HPGR Outline
Source: KCA (2019)
HPGR Feed
Pass 1 Center
Pass 1 Edge
Edge + Center
Pass 2 Center
Pass 2 Edge
+9.5mm -9.5mm
Screen9.5mm
HPGR Pass 2
Product

Cerro del Gallo Heap Leach Project NI 43-101 Technical Report
January 31, 2020 Page 13-19
Table 13.5.10 Cerro del Gallo KCA HPGR Crushing Test Results
Source: KCA (2019)
Cyanide bottle roll leach tests were run for a period of ninety-six (96) hours with solution sampling performed at 2, 4, 8, 24, 48, 72 and 96 hours. The tests utilized both pulverized (target 100% passing 0.150 millimeters) and milled material. NaCN was added and maintained at 1.0 grams per liter of solution. The pH of the solution was maintained at 10.5 to 11.0 with the addition of hydrated lime. Results of the cyanide bottle roll leach test work are summarized in Table 13.5.11 and Table 13.5.12.
Mineral Type OX MIX OX MIX S SULF HG SULF OX HG MIX SULF HGPOLYCOM size Pilotwal Pilotwal Pilotwal Pilotwal Pilotwal Pilotwal PilotwalRoll surface studs studs studs studs studs studs studsFeed material: 82512 A 82513-14 82515-18 82519 A 82520 A 82521 A 82522 A
Feed size: mm 0..20 0..20 0..20 0..20 0..20 0..20 0..20Moisture, Feed [% H2O] 1.0 1.0 1.0 1.0 1.0 1.0 1.0Moisture, Product [% H2O] 1.0 1.0 1.0 1.0 1.0 1.0 1.0Roll diameter D [m] 0.50 0.50 0.50 0.50 0.50 0.50 0.50Roll length L [m] 0.30 0.30 0.30 0.30 0.30 0.30 0.30Circumf. roll speed u [m/s] 0.20 0.20 0.20 0.20 0.20 0.20 0.20Zero gap s [mm] 1.5 1.6 1.6 1.5 1.6 1.6 1.6Initial hydraulic pressure p0 [bar] 105 104 103 103 102 103 103Preset nitrogen pressure pN2 [bar] 95 95 95 95 95 95 95Initial grinding force F0 [kN] 397.3 394.7 393.0 392.9 389.6 391.8 392.5Feed material, moist M [kg] 137.5 141.0 148.3 149.5 140.5 143.5 146.0Feed material, dry M [kg] 136 140 147 148 139 142 145Test time t [min] 1.22 1.10 1.22 1.17 1.07 1.19 1.16Throughput, moist M [t/h] 6.77 7.71 7.30 7.70 7.87 7.27 7.53Throughput, dry M [t/h] 6.70 7.63 7.23 7.62 7.79 7.19 7.45Specific. throughput (feed), moist m [ts/hm³] 230.9 263.0 248.8 262.1 266.9 247.9 256.8Specific. throughput (feed), dry m [ts/hm³] 228.6 260.3 246.3 259.5 264.2 245.5 254.2Working Gap sa [mm] 8.1 11.5 10.9 12.5 12.8 11.5 11.9Hydraulic pressure pB [bar] 120.7 130.6 128.2 133.9 133.7 130.0 131.6Grinding force F [kN] 459.0 496.6 487.5 508.9 508.1 494.1 500.3Spec. grinding force phi [N/mm²] 3.06 3.31 3.25 3.39 3.39 3.29 3.34Power @ counter - no load P [kW] 0.93 0.96 0.96 0.98 0.96 0.98 1.00Power @ counter - gross P [kW] 14.20 14.50 13.98 15.74 15.11 12.91 14.27Power @ counter, net Pw [kW] 13.27 13.54 13.02 14.77 14.15 11.93 13.27Power @ shaft, net Pw [kW] 12.14 12.39 11.91 13.51 12.95 10.92 12.14Specific energy input @ shaft, gross (moist feed) wsp [kWh/t] 1.96 1.77 1.79 1.92 1.80 1.64 1.76Specific energy input @ shaft, gross (dry feed) wsp [kWh/t] 1.98 1.78 1.80 1.94 1.82 1.66 1.78Specific energy input @ shaft, net (moist feed) wsp [kWh/t] 1.79 1.62 1.63 1.75 1.65 1.50 1.61Specific energy input @ shaft, net (dry feed) wsp [kWh/t] 1.81 1.63 1.65 1.77 1.66 1.52 1.63Distribution of material center [%] 80.4 76.9 76.1 75.9 75.8 76.3 75.0edge [%] 19.6 23.1 23.9 24.1 24.2 23.7 25.0Screen productsOversize (+9.5 mm) [%] 8.1 21.0 12.5 12.8 15.4 11.2 12.8Undersize (-9.5 mm) [%] 91.9 79.0 87.5 87.2 84.6 88.8 87.2

Cerro del Gallo Heap Leach Project NI 43-101 Technical Report
January 31, 2020 Page 13-20
Table 13.5.11 Cerro del Gallo KCA Laboratory Bottle Roll Leach Tests – Gold and Silver
KCA Sample
No. Description Mineral
Type Type Calculated p80, mm
Calculated Head,
gms Au/MT
Au Extracted,
%
Calculated Head, gms
Ag/MT
Ag Extracted,
%
Consumption NaCN, kg/MT
Addition Ca(OH)2,
kg/MT
82512 B CO1 OX Pulv. -- 0.280 88% 14.35 58% 0.40 2.75 82512 B CO1 OX Milled 0.074 0.300 88% 14.62 53% 1.48 2.00 82512 B CO1 OX Milled 0.053 0.219 91% 14.57 51% 0.77 2.25
Average : 0.266 89% 14.51 54% 0.88 2.33
82513 B CO2 MIX OX Pulv. -- 1.187 94% 12.82 79% 1.29 2.50 82513 B CO2 MIX OX Milled 0.093 1.216 92% 13.26 74% 1.51 1.75 82513 B CO2 MIX OX Milled 0.054 1.159 93% 12.93 77% 2.00 2.00
Average : 1.187 93% 13.00 77% 1.60 2.08
82514 A CO3 MIX OX Pulv. -- 0.810 93% 20.74 86% 1.46 1.50 82514 A CO3 MIX OX Milled 0.095 0.795 89% 20.61 84% 1.83 1.00 82514 A CO3 MIX OX Milled 0.054 0.769 90% 20.94 85% 2.09 1.25
Average : 0.791 91% 20.76 85% 1.79 1.25
82515 A CO4 MIX SULF 1 Pulv. -- 0.762 89% 14.73 82% 2.05 2.50 82515 A CO4 MIX SULF 1 Milled 0.107 0.685 82% 14.33 73% 1.82 2.00 82515 A CO4 MIX SULF 1 Milled 0.079 0.745 86% 14.46 76% 1.91 2.25
Average : 0.731 86% 14.51 77% 1.93 2.25
82516 A CO5 MIX SULF 1 Pulv. -- 0.401 81% 31.63 53% 5.58 2.00 82516 A CO5 MIX SULF 1 Milled 0.101 0.392 76% 34.11 45% 5.84 1.25 82516 A CO5 MIX SULF 1 Milled 0.071 0.424 81% 30.86 37% 6.40 2.00
Average : 0.406 79% 32.20 45% 5.94 1.75
82517 A CO6 MIX SULF 2 Pulv. -- 0.607 88% 23.03 67% 2.45 2.25 82517 A CO6 MIX SULF 2 Milled 0.106 0.467 79% 22.51 52% 2.06 1.50 82517 A CO6 MIX SULF 2 Milled 0.086 0.466 84% 22.70 53% 2.48 1.75
Average : 0.513 84% 22.75 57% 2.33 1.83
82518 B CO7 MIX SULF 2 Pulv. -- 0.826 87% 6.83 73% 2.90 1.75 82518 B CO7 MIX SULF 2 Milled 0.100 0.784 82% 6.74 58% 3.20 1.25 82518 B CO7 MIX SULF 2 Milled 0.063 0.821 85% 6.56 63% 3.22 1.50
Average : 0.810 85% 6.71 65% 3.11 1.50
82519 B CO8 SULF HG Pulv. -- 1.811 90% 2.42 67% 1.41 1.25 82519 B CO8 SULF HG Milled 0.203 1.828 77% 2.52 48% 0.88 1.00 82519 B CO8 SULF HG Milled 0.132 1.792 83% 2.42 50% 0.74 1.00
Average : 1.810 83% 2.45 55% 1.01 1.08
82520 A CO9 SULF Pulv. -- 1.936 93% 6.05 77% 1.67 1.25 82520 A CO9 SULF Milled 0.103 1.876 89% 6.17 61% 1.87 1.00 82520 A CO9 SULF Milled 0.070 1.833 91% 5.92 65% 2.18 1.00
Average : 1.882 91% 6.05 68% 1.91 1.08
82521 A CO10 OX HG Pulv. -- 1.471 95% 10.57 89% 1.18 3.25 82521 A CO10 OX HG Milled 0.098 1.461 91% 10.11 86% 1.91 2.50 82521 A CO10 OX HG Milled 0.065 1.410 93% 10.05 88% 1.96 2.75
Average : 1.447 93% 10.24 88% 1.68 2.83
82522 A CO11 MIX SULF HG Pulv. -- 3.215 96% 3.73 83% 1.74 1.50 82522 A CO11 MIX SULF HG Milled 0.116 3.243 93% 3.55 78% 1.59 1.00 82522 A CO11 MIX SULF HG Milled 0.068 3.053 94% 3.56 78% 1.99 1.25
Average : 3.170 94% 3.61 80% 1.77 1.25 Source: KCA (2019)

Cerro del Gallo Heap Leach Project NI 43-101 Technical Report
January 31, 2020 Page 13-21
Table 13.5.12 Cerro del Gallo KCA Laboratory Bottle Roll Leach Tests – Copper
KCASample No. Description MineralType Type Calculated
p80, mm
Head Copper,
mg Cu/kg
Est. Cu Extracted,
%
Consumption NaCN, kg/MT
Addition Ca(OH)2,
kg/MT 82512 B CO1 OX Pulv. -- 480 26% 0.40 2.75 82512 B CO1 OX Milled 0.074 480 23% 1.48 2.00 82512 B CO1 OX Milled 0.053 480 26% 0.77 2.25
Average : 480 25% 0.88 2.33
82513 B CO2 MIX OX Pulv. -- 600 60% 1.29 2.50 82513 B CO2 MIX OX Milled 0.093 600 64% 1.51 1.75 82513 B CO2 MIX OX Milled 0.054 600 86% 2.00 2.00
Average : 600 70% 1.60 2.08
82514 A CO3 MIX OX Pulv. -- 461 64% 1.46 1.50 82514 A CO3 MIX OX Milled 0.095 461 65% 1.83 1.00 82514 A CO3 MIX OX Milled 0.054 461 80% 2.09 1.25
Average : 461 70% 1.79 1.25
82515 A CO4 MIX SULF 1 Pulv. -- 691 78% 2.05 2.50 82515 A CO4 MIX SULF 1 Milled 0.107 691 69% 1.82 2.00 82515 A CO4 MIX SULF 1 Milled 0.079 691 74% 1.91 2.25
Average : 691 74% 1.93 2.25
82516 A CO5 MIX SULF 1 Pulv. -- 2310 59% 5.58 2.00 82516 A CO5 MIX SULF 1 Milled 0.101 2310 69% 5.84 1.25 82516 A CO5 MIX SULF 1 Milled 0.071 2310 60% 6.40 2.00
Average : 2310 63% 5.94 1.75
82517 A CO6 MIX SULF 2 Pulv. -- 992 69% 2.45 2.25 82517 A CO6 MIX SULF 2 Milled 0.106 992 53% 2.06 1.50 82517 A CO6 MIX SULF 2 Milled 0.086 992 60% 2.48 1.75
Average : 992 61% 2.33 1.83
82518 B CO7 MIX SULF 2 Pulv. -- 1200 75% 2.90 1.75 82518 B CO7 MIX SULF 2 Milled 0.100 1200 76% 3.20 1.25 82518 B CO7 MIX SULF 2 Milled 0.063 1200 72% 3.22 1.50
Average : 1200 74% 3.11 1.50
82519 B CO8 SULF HG Pulv. -- 711 42% 1.41 1.25 82519 B CO8 SULF HG Milled 0.203 711 23% 0.88 1.00 82519 B CO8 SULF HG Milled 0.132 711 25% 0.74 1.00
Average : 711 30% 1.01 1.08
82520 A CO9 SULF Pulv. -- 731 64% 1.67 1.25 82520 A CO9 SULF Milled 0.103 731 56% 1.87 1.00 82520 A CO9 SULF Milled 0.070 731 63% 2.18 1.00
Average : 731 61% 1.91 1.08
82521 A CO10 OX HG Pulv. -- 686 44% 1.18 3.25 82521 A CO10 OX HG Milled 0.098 686 39% 1.91 2.50 82521 A CO10 OX HG Milled 0.065 686 40% 1.96 2.75
Average : 686 41% 1.68 2.83
82522 A CO11 MIX SULF HG Pulv. -- 671 69% 1.74 1.50 82522 A CO11 MIX SULF HG Milled 0.116 671 63% 1.59 1.00 82522 A CO11 MIX SULF HG Milled 0.068 671 71% 1.99 1.25
Average : 671 68% 1.77 1.25 Source: KCA (2019)

Cerro del Gallo Heap Leach Project NI 43-101 Technical Report
January 31, 2020 Page 13-22
Compacted permeability test work was performed on tailings material from each column utilizing material previously crushed, conventional and HPGR, material. The purpose of the compacted permeability test work was to examine the permeability of the crushed material under compaction loading equivalent to heap heights of 10, 20, 40, and 80 meters of overall heap height. The flow rate, slump, pellet breakdown and solution color and clarity are all monitored to provide meaningful indications and to help judge what represents a “Pass” or “Fail.” The results are summarized in Table 13.5.13.
Notes on the pass/fail criteria:
1. In KCA’s compacted agglomeration tests, a slump of over 10% may be an indication of heap instability and may require additional cement. If things worked perfectly, a lower slump with higher cement levels could be expected.
2. A typical heap leach solution application rate of 10 to 12 liters per hour per square meter is utilized when examining the agglomeration data. When examining results from this type of agglomeration test a measured flow of ten times (10X) the heap design rate is considered a “pass.” A measured flow less than 10X the heap design flow is not necessarily a failure. If there are enough tests with enough consistency between tests, and all other points indicate a “pass,” and then sometimes a test will pass with less than the 10X flow. However, a test will not likely pass at 1X and probably not at 4X.
3. In examining the Pellet Breakdown, about 10% is marginally acceptable and anything higher is a failure. In general, a higher range is allowable in Pellet Breakdown as this is a subjective value based on the visual observation of the pellets after the test by the technicians performing the test. When the samples tested are not agglomerated using cement, this test is not applicable.
4. Solution color and clarity typically is an indicator of agglomerate failure and fines migration. This information is utilized in coordination with both slump as well as Pellet Breakdown to determine if the test passes.
The results of the compacted permeability test work indicate the potential need for additional controls during heap leach operation to monitor slump, which may lead to higher cement additions to achieve the design criteria of an 80 meter heap leach pad overall height. Cement addition for the process was chosen based on compacted permeability flow rate results.
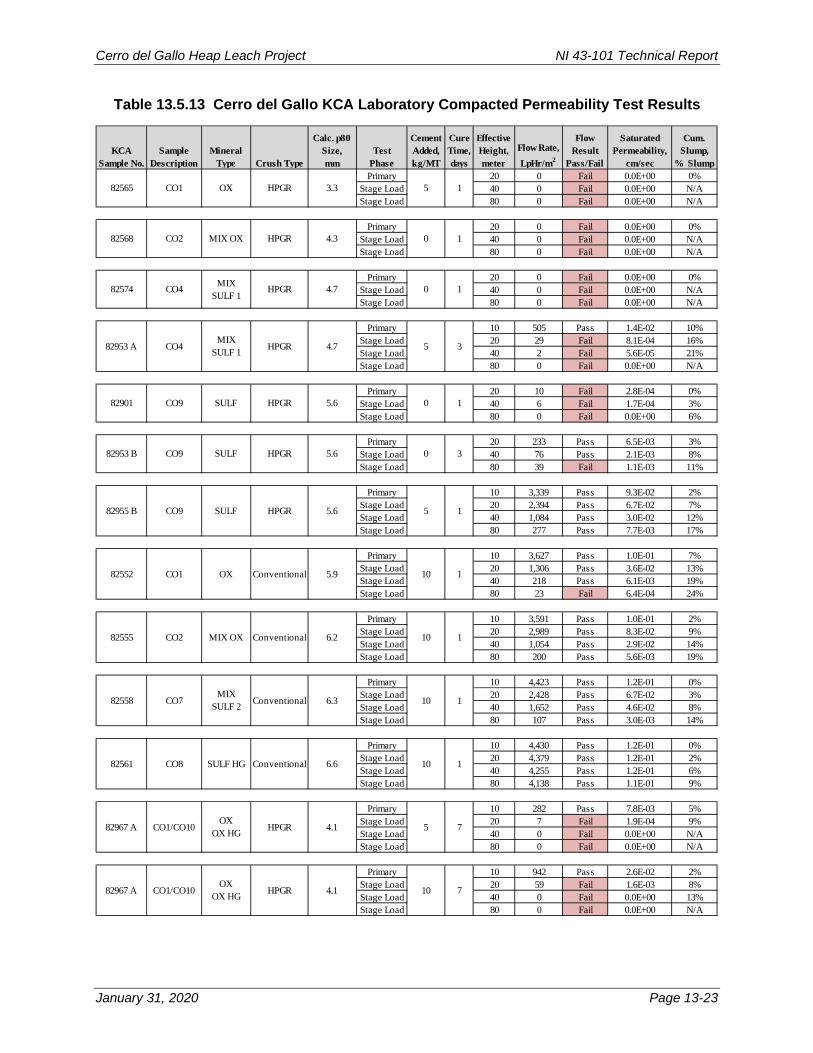
Cerro del Gallo Heap Leach Project NI 43-101 Technical Report
January 31, 2020 Page 13-23
Table 13.5.13 Cerro del Gallo KCA Laboratory Compacted Permeability Test Results
KCASample No.
SampleDescription
Mineral Type Crush Type
Calc. p80 Size,mm
TestPhase
Cement Added,kg/MT
CureTime, days
Effective Height,meter
Flow Rate,LpHr/m2
FlowResult
Pass/Fail
Saturated Permeability,
cm/sec
Cum.Slump,
% SlumpPrimary 20 0 Fail 0.0E+00 0%
Stage Load 40 0 Fail 0.0E+00 N/AStage Load 80 0 Fail 0.0E+00 N/A
Primary 20 0 Fail 0.0E+00 0%Stage Load 40 0 Fail 0.0E+00 N/AStage Load 80 0 Fail 0.0E+00 N/A
Primary 20 0 Fail 0.0E+00 0%Stage Load 40 0 Fail 0.0E+00 N/AStage Load 80 0 Fail 0.0E+00 N/A
Primary 10 505 Pass 1.4E-02 10%Stage Load 20 29 Fail 8.1E-04 16%Stage Load 40 2 Fail 5.6E-05 21%Stage Load 80 0 Fail 0.0E+00 N/A
Primary 20 10 Fail 2.8E-04 0%Stage Load 40 6 Fail 1.7E-04 3%Stage Load 80 0 Fail 0.0E+00 6%
Primary 20 233 Pass 6.5E-03 3%Stage Load 40 76 Pass 2.1E-03 8%Stage Load 80 39 Fail 1.1E-03 11%
Primary 10 3,339 Pass 9.3E-02 2%Stage Load 20 2,394 Pass 6.7E-02 7%Stage Load 40 1,084 Pass 3.0E-02 12%Stage Load 80 277 Pass 7.7E-03 17%
Primary 10 3,627 Pass 1.0E-01 7%Stage Load 20 1,306 Pass 3.6E-02 13%Stage Load 40 218 Pass 6.1E-03 19%Stage Load 80 23 Fail 6.4E-04 24%
Primary 10 3,591 Pass 1.0E-01 2%Stage Load 20 2,989 Pass 8.3E-02 9%Stage Load 40 1,054 Pass 2.9E-02 14%Stage Load 80 200 Pass 5.6E-03 19%
Primary 10 4,423 Pass 1.2E-01 0%Stage Load 20 2,428 Pass 6.7E-02 3%Stage Load 40 1,652 Pass 4.6E-02 8%Stage Load 80 107 Pass 3.0E-03 14%
Primary 10 4,430 Pass 1.2E-01 0%Stage Load 20 4,379 Pass 1.2E-01 2%Stage Load 40 4,255 Pass 1.2E-01 6%Stage Load 80 4,138 Pass 1.1E-01 9%
Primary 10 282 Pass 7.8E-03 5%Stage Load 20 7 Fail 1.9E-04 9%Stage Load 40 0 Fail 0.0E+00 N/AStage Load 80 0 Fail 0.0E+00 N/A
Primary 10 942 Pass 2.6E-02 2%Stage Load 20 59 Fail 1.6E-03 8%Stage Load 40 0 Fail 0.0E+00 13%Stage Load 80 0 Fail 0.0E+00 N/A
4.1 5
82967 A CO1/CO10 HPGR 4.1 10
82967 A CO1/CO10 HPGROX
OX HG
OXOX HG
HPGR
HPGR
HPGR
HPGR
HPGR
5
082953 B CO9 5.6
HPGR82955 B CO9 5.6
CO4 4.7 5
CO1 53.3HPGR 1OX82565
82568 CO2 4.3 0
82574 CO4 4.7 0
82901 CO9 5.6 0
82953 A
5.9 10
82555 CO2 Conventional 6.2 10
82552 CO1 Conventional
MIX OX
6.3 10
82561 CO8 Conventional 6.6 10
82558 CO7 ConventionalMIX
SULF 2
SULF HG
1
1
3
1
3
1
1
1
1
1
7
7
MIXSULF 1
SULF
MIX OX
MIXSULF 1
SULF
OX
SULF

Cerro del Gallo Heap Leach Project NI 43-101 Technical Report
January 31, 2020 Page 13-24
Source: KCA (2019)
KCASample No.
SampleDescription
Mineral Type Crush Type
Calc. p80 Size,mm
TestPhase
Cement Added,kg/MT
CureTime, days
Effective Height,meter
Flow Rate,LpHr/m2
FlowResult
Pass/Fail
Saturated Permeability,
cm/sec
Cum.Slump,
% SlumpPrimary 10 12,348 Pass 3.4E-01 2%
Stage Load 20 2,145 Pass 6.0E-02 8%Stage Load 40 231 Pass 6.4E-03 14%Stage Load 80 45 Fail 1.3E-03 20%
Primary 10 17,140 Pass 4.8E-01 2%Stage Load 20 12,305 Pass 3.4E-01 6%Stage Load 40 2,039 Pass 5.7E-02 13%Stage Load 80 140 Pass 3.9E-03 21%
Primary 10 2,181 Pass 6.1E-02 6%Stage Load 20 378 Pass 1.1E-02 13%Stage Load 40 107 Pass 3.0E-03 17%Stage Load 80 0 Fail 0.0E+00 21%
Primary 10 13,877 Pass 3.9E-01 2%Stage Load 20 4,628 Pass 1.3E-01 7%Stage Load 40 857 Pass 2.4E-02 13%Stage Load 80 142 Pass 3.9E-03 19%
Primary 10 16,864 Pass 4.7E-01 2%Stage Load 20 11,598 Pass 3.2E-01 6%Stage Load 40 2,628 Pass 7.3E-02 12%Stage Load 80 315 Pass 8.8E-03 19%
Primary 10 17,255 Pass 4.8E-01 0%Stage Load 20 16,308 Pass 4.5E-01 4%Stage Load 40 12,200 Pass 3.4E-01 10%Stage Load 80 4,158 Pass 1.2E-01 17%
Primary 10 3,312 Pass 9.2E-02 5%Stage Load 20 610 Pass 1.7E-02 11%Stage Load 40 172 Pass 4.8E-03 15%Stage Load 80 37 Fail 1.0E-03 20%
Primary 10 13,565 Pass 3.8E-01 3%Stage Load 20 4,121 Pass 1.1E-01 7%Stage Load 40 1,011 Pass 2.8E-02 13%Stage Load 80 195 Pass 5.4E-03 19%
Primary 10 16,989 Pass 4.7E-01 2%Stage Load 20 15,357 Pass 4.3E-01 5%Stage Load 40 10,259 Pass 2.8E-01 11%Stage Load 80 3,141 Pass 8.7E-02 17%
Primary 10 17,232 Pass 4.8E-01 1%Stage Load 20 16,374 Pass 4.5E-01 5%Stage Load 40 13,180 Pass 3.7E-01 10%Stage Load 80 4,792 Pass 1.3E-01 18%
Primary 10 12,815 Pass 3.6E-01 1%Stage Load 20 6,526 Pass 1.8E-01 6%Stage Load 40 2,648 Pass 7.4E-02 10%Stage Load 80 766 Pass 2.1E-02 14%
Primary 10 16,245 Pass 4.5E-01 0%Stage Load 20 14,525 Pass 4.0E-01 3%Stage Load 40 9,772 Pass 2.7E-01 8%Stage Load 80 3,894 Pass 1.1E-01 14%
Primary 10 16,361 Pass 4.5E-01 1%Stage Load 20 15,449 Pass 4.3E-01 3%Stage Load 40 12,959 Pass 3.6E-01 7%Stage Load 80 6,930 Pass 1.9E-01 13%
Primary 10 16,841 Pass 4.7E-01 1%Stage Load 20 16,295 Pass 4.5E-01 3%Stage Load 40 14,121 Pass 3.9E-01 8%Stage Load 80 8,588 Pass 2.4E-01 14%
4.7 15
82970 ACO8/CO9/
CO11 HPGR 4.7 20
82970 ACO8/CO9/
CO11 HPGRVSED/INT
VSED/INT
4.7 5
82970 ACO8/CO9/
CO11 HPGR 4.7 10
82970 ACO8/CO9/
CO11 HPGRVSED/INT
VSED/INT
4.6 15
82969 A CO6 HPGR 4.6 20
82969 A CO6 HPGRVSED
VSED
4.6 5
82969 A CO6 HPGR 4.6 10
82969 A CO6 HPGRVSED
VSED
4.7 15
82968 ACO4/CO5/
CO7 HPGR 4.7 20
82968 ACO4/CO5/
CO7 HPGR
MIX SULF 1
MIX SULF 2
MIX SULF 1
MIX SULF 2
4.7 5
82968 ACO4/CO5/
CO7 HPGR 4.7 10
82968 ACO4/CO5/
CO7 HPGR
MIX SULF 1
MIX SULF 2
MIX SULF 1
MIX SULF 2
4.1 15
82967 A CO1/CO10 HPGR 4.1 20
82967 A CO1/CO10 HPGROX
OX HG
OXOX HG
7
7
7
7
7
7
7
7
7
7
7
7
7
7

Cerro del Gallo Heap Leach Project NI 43-101 Technical Report
January 31, 2020 Page 13-25
Column leach tests were conducted utilizing both HPGR crushed material (p100 of 19 mm, average p80 of 4.7 mm) and conventionally crushed (p100 of 9.5 mm, average p80 of 6.3 mm). The results are presented in Table 13.5.14, Figure 13.5.2 and Figure 13.5.3.
Table 13.5.14 Cerro del Gallo KCA Laboratory Column Leach Test Summary
Source: KCA (2019) The recovery performance between the HPGR and Conventionally crushed samples is shown in Table 13.5.15 and varied by mineral type. Gold recoveries increased in the HPGR crushed material for Sulfide High Grade, Mixed Sulfide and Mixed Oxides but also decreased for the Oxide sample. Silver recovery was lower overall in the HPGR crushed material most likely due to kinetics which slowed due to the increased copper recoveries. The new ongoing test work addressed this issue by increasing the NaCN solution concentrations in the column leach tests and introducing SART to process pregnant solution and better mimic the expected production system.
Table 13.5.15 Cerro del Gallo Current Test Work Conventional versus HPGR Crushing
Source: KCA (2019)
KCASample No. Description
MineralType
CrushingType
HeadSulfide
Sulfur, %
Head Assay, mg
Cu/kgEst. Cu Ext., %1
Calculated Head,
gms Au/MTExtracted,
% Au
Calculated Head,gms
Ag/MTExtracted,
% Ag
Calculated Tail p80Size, mm
Days of Leach
Consumption NaCN,kg/MT
Addition Ca(OH)2,
kg/MT
Addition Cement, kg/MT
82512 B CO1 OX Conventional <0.01 440 13% 0.297 73% 8.31 60% 5.9 143 2.97 2.85 --82513 B CO2 MIX OX Conventional 0.05 540 45% 1.265 70% 8.87 77% 6.2 143 2.77 2.54 --82518 B CO7 MIX SULF 2 Conventional 1.13 960 58% 0.862 56% 4.14 62% 6.3 143 3.01 1.76 --82519 B CO8 SULF HG Conventional 1.23 635 14% 1.881 41% 1.52 40% 6.6 143 1.94 1.26 --
82537 A CO1 OX HPGR <0.01 430 11% 0.314 71% 11.11 51% 3.3 135 2.27 2.85 2.0782538 A CO2 MIX OX HPGR 0.05 553 44% 1.353 74% 10.65 74% 4.3 135 2.44 3.05 --82539 A CO3 MiX OX HPGR 0.20 338 48% 0.881 69% 25.04 89% 4.3 135 2.87 1.53 --82540 A CO4 MIX SULF 1 HPGR 0.94 625 58% 0.771 69% 12.02 82% 4.7 135 3.15 2.64 --82541 A CO5 MIX SULF 1 HPGR 1.60 1922 67% 0.372 61% 19.92 44% 5.0 128 5.15 2.52 --82542 A CO6 MIX SULF 2 HPGR 1.76 789 47% 0.474 55% 18.25 60% 4.4 128 2.88 2.29 --82543 A CO7 MIX SULF 2 HPGR 1.13 982 65% 0.905 62% 6.43 54% 5.0 128 3.28 2.13 --82544 A CO8 SULF HG HPGR 1.23 623 20% 1.893 54% 4.38 23% 5.3 128 2.07 1.26 --82545 A CO9 SULF HPGR 0.84 616 48% 1.634 65% 5.02 63% 5.6 128 2.67 1.26 --82546 A CO10 OX HG HPGR 0.04 566 33% 1.575 81% 9.39 75% 4.5 135 2.31 3.04 2.0382547 A CO11 MIX SULF HG HPGR 0.43 519 56% 3.262 60% 3.22 71% 5.7 122 2.03 1.52 2.03
MineralType
CrushingType
Head Assay, mg
Cu/kgEst. Cu Ext., %1
Calculated Head,
gms Au/MTExtracted,
% Au
Calculated Head,gms
Ag/MTExtracted,
% Ag
Calculated Tail p80Size, mm
Days of Leach
Consumption NaCN,kg/MT
Addition Ca(OH)2,
kg/MT
Addition Cement, kg/MT
OX Conventional 440 13% 0.297 73% 8.31 60% 5.9 143 2.97 2.85 --MIX OX Conventional 540 45% 1.265 70% 8.87 77% 6.2 143 2.77 2.54 --
MIX SULF 2 Conventional 960 58% 0.862 56% 4.14 62% 6.3 143 3.01 1.76 --SULF HG Conventional 635 14% 1.881 41% 1.52 40% 6.6 143 1.94 1.26 --
OX HPGR 430 11% 0.314 71% 11.11 51% 3.3 135 2.27 2.85 2.07MiX OX HPGR 446 46% 1.117 72% 17.85 82% 4.3 135 2.66 2.29
MIX SULF 2 HPGR 1080 59% 0.631 62% 14.16 60% 4.8 130 3.62 2.40SULF HG HPGR 623 20% 1.893 54% 4.38 23% 5.3 128 2.07 1.26 --
HPGR minus Converntional CrushingOX -2% -2% -9%
MIX OX -1% 4% -3%MIX SULF 2 -10% 13% 27%
SULF HG 32% 31% 42%

Cerro del Gallo Heap Leach Project NI 43-101 Technical Report
January 31, 2020 Page 13-26
Historic test work also supports the HPGR crushing over conventional crushing. Oxide and Mixed Oxides samples crushed to minus 8 mm and column leached 115 days were crushed with both conventional crushers and HPGR and compared. The results are presented in Table 13.5.16 and indicate that metal dissolutions for the HPGR crushed samples achieved higher average metal dissolutions. Note that Conventional S2 (Conv. S2) samples utilized higher cement during agglomeration (6 kg/t) and also included higher cyanide addition. Table 13.5.16 Cerro del Gallo Historical Test Work Conventional versus HPGR Crushing
Source: Primero (2012)
Given the test work results from the current and historic column leach tests, HPGR crushing will most likely achieve higher recoveries in the extraction of gold, silver and copper given the proper NaCN solution concentrations to aid in the dissolution kinetics.

Cerro del Gallo Heap Leach Project NI 43-101 Technical Report
January 31, 2020 Page 13-27
Figure 13.5.2 Cerro del Gallo KCA Laboratory Column Leach Tests Curves – Gold
Source: KCA (2019)
0%
10%
20%
30%
40%
50%
60%
70%
80%
90%
100%
0 20 40 60 80 100 120 140 160
Cum
ulat
ive P
erce
nt G
old
Extr
actio
n
Days of Leach
Cerro del Gallo Project
CO1 - Conventional Crush (82552) CO2 - Conventional Crush (82555) CO7 - Conventional Crush (82558) CO8 - Conventional Crush (82561)CO1 - HPGR Crush (82565) CO2 - HPGR Crush (82568) CO3 - HPGR Crush (82571) CO4 - HPGR Crush (82574)CO5 - HPGR Crush (82577) CO6- HPGR Crush (82580) CO7 - HPGR Crush (82583) CO8 - HPGR Crush (82586)CO9 - HPGR Crush (82901) CO10 - HPGR Crush (82904) CO11 - HPGR Crush (82907)
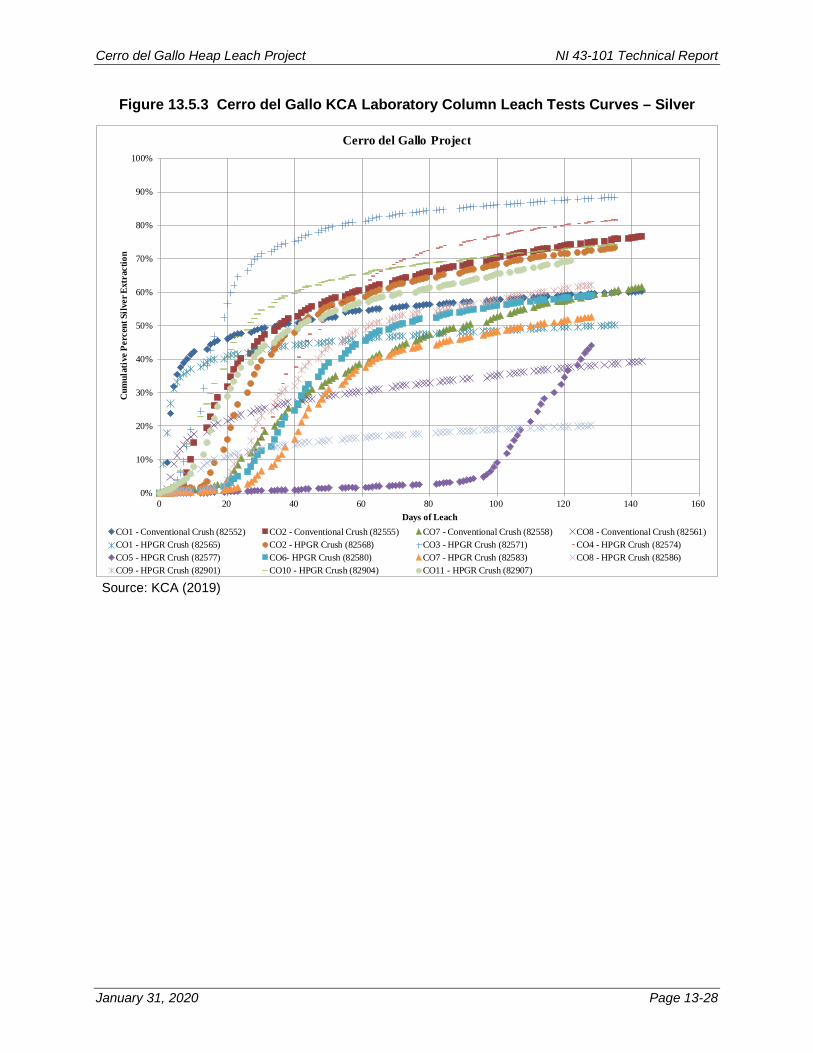
Cerro del Gallo Heap Leach Project NI 43-101 Technical Report
January 31, 2020 Page 13-28
Figure 13.5.3 Cerro del Gallo KCA Laboratory Column Leach Tests Curves – Silver
Source: KCA (2019)
0%
10%
20%
30%
40%
50%
60%
70%
80%
90%
100%
0 20 40 60 80 100 120 140 160
Cum
ulat
ive P
erce
nt S
ilver
Ext
ract
ion
Days of Leach
Cerro del Gallo Project
CO1 - Conventional Crush (82552) CO2 - Conventional Crush (82555) CO7 - Conventional Crush (82558) CO8 - Conventional Crush (82561)CO1 - HPGR Crush (82565) CO2 - HPGR Crush (82568) CO3 - HPGR Crush (82571) CO4 - HPGR Crush (82574)CO5 - HPGR Crush (82577) CO6- HPGR Crush (82580) CO7 - HPGR Crush (82583) CO8 - HPGR Crush (82586)CO9 - HPGR Crush (82901) CO10 - HPGR Crush (82904) CO11 - HPGR Crush (82907)

Cerro del Gallo Heap Leach Project NI 43-101 Technical Report
January 31, 2020 Page 13-29
13.6 On-Going Metallurgical Testing
The current on-going test work is being conducted by KCA and includes bottle roll tests at various NaCN concentrations (0.5, 1, 2 and 5, gpL NaCN), compacted permeability tests with varying cement additions (5, 10, 15 and 20 kg/t cement), and SART test work including additional column leach tests in closed cycle. Current tests are utilizing HPGR crushed material. The goal of the test work is to expand upon the successful results of the 2018 and 2019 metallurgical test work conducted by KCA and optimize process parameters for the project.
13.6.1 Bottle Roll Tests Cyanide bottle roll leach tests were run for a period of two-hundred and forty (240) hours with solution sampling performed at 2, 4, 8, 24, 48, 72, 96, 120, 144, 168, 192, 216, and 240 hours. The tests utilized HPGR crushed material. NaCN was added and maintained at 0.5, 1.0, 2.0, and 5.0 grams per liter of solution. The pH of the solution was maintained at 10.5 to 11.0 with the addition of hydrated lime. Results of the cyanide bottle roll leach test work are summarized in Table 13.6.1. The previous, pulverized bottle roll leach tests conducted by KCA as compared to the new HPGR crushed bottle roll tests give an idea of percent of recoverable gold extracted at HPGR product sizes. Table 13.6.2 shows the percent of cyanide recoverable gold that the HPGR product could potentially get, and the theoretical maximum recoverable gold shown in the pulverized samples.

Cerro del Gallo Heap Leach Project NI 43-101 Technical Report
January 31, 2020 Page 13-30
Table 13.6.1 Cerro del Gallo KCA Laboratory Bottle Roll Test Results
KCA Sample
No.
Mineral Type
Calc. p80 Size, mm
Target NaCN,
g/L
Calculated Head, gms
Au/MT
Au Extracted,
%
Calculated Head, gms
Ag/MT
Ag Extracted,
%
Calculated Head, gms
Cu/MT
Cu Extracted,
%
Cons-umption NaCN, kg/MT
Addition Ca(OH)2,
kg/MT
82537 A OX 6.45 0.50 0.281 79% 9.34 46% 425 23% 0.39 3.00 82537 A OX 6.45 1.00 0.231 70% 10.21 49% 455 23% 0.57 2.50 82537 A OX 6.45 2.00 0.438 84% 10.72 47% 491 22% 0.99 2.25 82537 A OX 6.45 5.00 0.283 71% 10.91 50% 463 22% 1.69 2.00
6.45 2.13 0.308 76% 10.30 48% 458 23% 0.91 2.44 82538 A MIX OX 6.81 0.50 1.170 69% 10.01 56% 590 44% 1.01 2.00 82538 A MIX OX 6.81 1.00 1.093 68% 10.50 59% 713 49% 1.16 2.00 82538 A MIX OX 6.81 2.00 1.268 63% 10.31 64% 693 56% 1.61 1.50 82538 A MIX OX 6.81 5.00 1.282 68% 9.71 75% 645 60% 2.41 1.25
82539 A MiX OX 6.26 0.50 0.769 58% 25.59 65% 365 50% 0.73 1.75 82539 A MiX OX 6.26 1.00 0.764 64% 26.24 79% 420 62% 0.92 1.75 82539 A MiX OX 6.26 2.00 0.717 65% 27.59 76% 456 60% 1.27 1.75 82539 A MiX OX 6.26 5.00 0.899 68% 25.20 78% 436 62% 1.95 1.00
6.57 2.13 0.995 65% 18.14 69% 540 55% 1.38 1.63 82540 A MIX SULF 1 7.26 0.50 0.683 59% 13.76 54% 695 57% 1.41 3.00 82540 A MIX SULF 1 7.26 1.00 0.690 60% 12.68 62% 731 62% 1.09 2.50 82540 A MIX SULF 1 7.26 2.00 0.716 56% 12.27 66% 803 64% 2.19 2.25 82540 A MIX SULF 1 7.26 5.00 0.759 68% 12.54 73% 773 70% 3.37 2.25
82541 A MIX SULF 1 5.72 0.50 0.332 44% 25.54 24% 2474 68% 4.46 2.75 82541 A MIX SULF 1 5.72 1.00 0.328 52% 27.66 33% 2509 73% 5.31 2.25 82541 A MIX SULF 1 5.72 2.00 0.332 49% 25.90 39% 2573 81% 6.39 1.75 82541 A MIX SULF 1 5.72 5.00 0.392 63% 28.38 65% 2562 87% 8.09 1.25
82542 A MIX SULF 2 5.88 0.50 0.428 42% 19.68 40% 939 46% 1.59 2.50 82542 A MIX SULF 2 5.88 1.00 0.461 43% 19.07 47% 966 53% 1.82 2.50 82542 A MIX SULF 2 5.88 2.00 0.469 47% 20.65 48% 1047 58% 2.53 2.25 82542 A MIX SULF 2 5.88 5.00 0.419 44% 20.14 51% 993 62% 3.91 1.50
82543 A MIX SULF 2 5.96 0.50 0.830 48% 6.21 39% 1110 59% 2.05 2.50 82543 A MIX SULF 2 5.96 1.00 0.838 50% 6.13 49% 1211 67% 2.81 2.25 82543 A MIX SULF 2 5.96 2.00 0.787 57% 4.95 57% 1160 69% 3.18 1.75 82543 A MIX SULF 5.96 5.00 0.971 52% 5.87 58% 1213 73% 4.83 1.25
6.22 2.13 0.590 52% 16.34 50% 1360 66% 3.44 2.16 82544 A SULF HG 5.99 0.50 1.866 44% 2.82 27% 680 19% 0.68 1.75 82544 A SULF HG 5.99 1.00 1.788 43% 2.81 24% 700 18% 0.78 1.50 82544 A SULF HG 5.99 2.00 1.859 48% 2.17 32% 776 19% 1.27 1.50 82544 A SULF HG 5.99 5.00 1.822 48% 2.04 36% 708 25% 2.36 1.00
5.99 2.13 1.834 46% 2.46 30% 716 20% 1.27 1.44 82545 A SULF 5.25 0.50 1.549 46% 4.11 50% 634 42% 1.08 1.75 82545 A SULF 5.25 1.00 1.706 46% 4.58 52% 695 48% 1.44 1.25 82545 A SULF 5.25 2.00 1.550 62% 5.19 59% 812 57% 2.05 1.25 82545 A SULF 5.25 5.00 1.613 58% 5.33 58% 795 62% 3.15 1.00
5.25 2.13 1.605 53% 4.80 55% 734 52% 1.93 1.31 82546 A OX HG 6.24 0.50 1.391 81% 8.65 64% 606 43% 0.93 3.50 82546 A OX HG 6.24 1.00 1.580 75% 10.13 60% 643 49% 1.18 3.00 82546 A OX HG 6.24 2.00 1.656 75% 8.07 74% 645 49% 1.65 2.75 82546 A OX HG 6.24 5.00 1.485 77% 9.76 72% 664 50% 2.41 2.25
6.24 2.13 1.528 77% 9.15 68% 639 48% 1.54 2.88 82547 A MIX SULF HG 5.55 0.50 3.139 47% 3.32 53% 568 60% 0.82 1.75 82547 A MIX SULF HG 5.55 1.00 3.005 53% 3.48 56% 634 67% 1.51 1.50 82547 A MIX SULF HG 5.55 2.00 3.116 54% 4.31 47% 680 69% 2.25 1.25 82547 A MIX SULF HG 5.55 5.00 3.118 55% 2.81 79% 660 73% 2.71 1.00
5.55 2.13 3.095 52% 3.48 59% 635 67% 1.82 1.38
Source: KCA (2019)
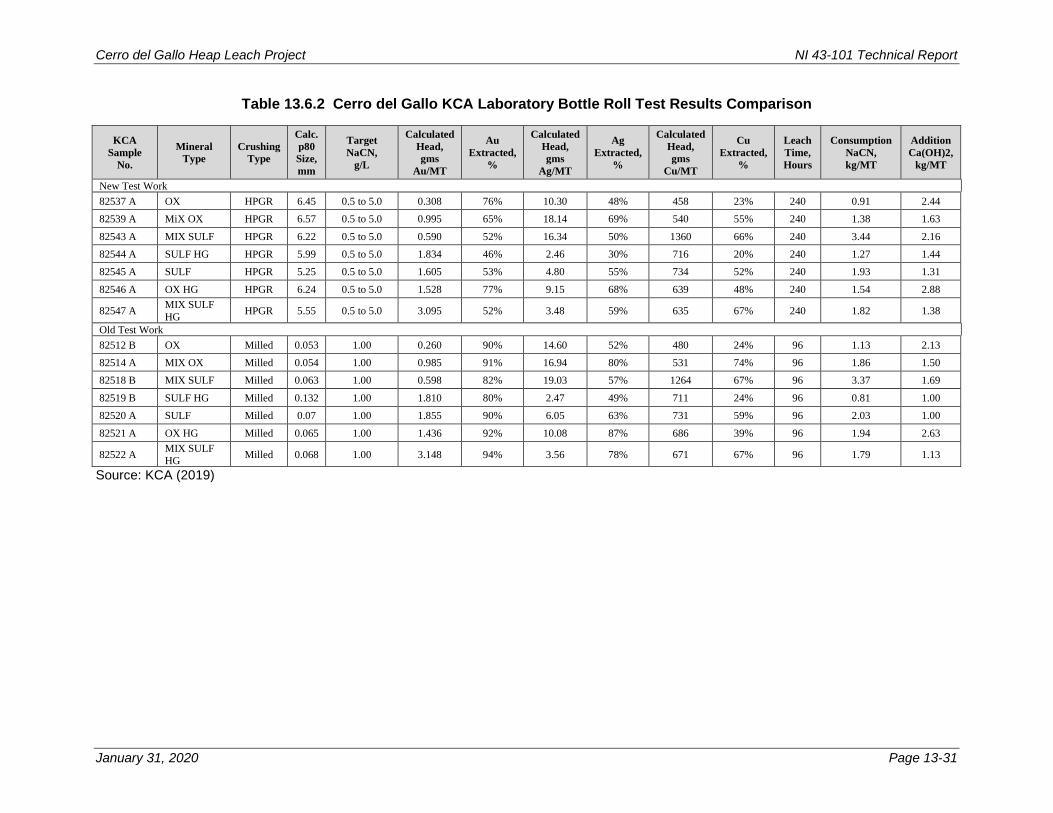
Cerro del Gallo Heap Leach Project NI 43-101 Technical Report
January 31, 2020 Page 13-31
Table 13.6.2 Cerro del Gallo KCA Laboratory Bottle Roll Test Results Comparison
KCA Sample
No.
Mineral Type
Crushing Type
Calc. p80 Size, mm
Target NaCN,
g/L
Calculated Head, gms
Au/MT
Au Extracted,
%
Calculated Head, gms
Ag/MT
Ag Extracted,
%
Calculated Head, gms
Cu/MT
Cu Extracted,
%
Leach Time, Hours
Consumption NaCN, kg/MT
Addition Ca(OH)2,
kg/MT
New Test Work 82537 A OX HPGR 6.45 0.5 to 5.0 0.308 76% 10.30 48% 458 23% 240 0.91 2.44 82539 A MiX OX HPGR 6.57 0.5 to 5.0 0.995 65% 18.14 69% 540 55% 240 1.38 1.63
82543 A MIX SULF HPGR 6.22 0.5 to 5.0 0.590 52% 16.34 50% 1360 66% 240 3.44 2.16 82544 A SULF HG HPGR 5.99 0.5 to 5.0 1.834 46% 2.46 30% 716 20% 240 1.27 1.44 82545 A SULF HPGR 5.25 0.5 to 5.0 1.605 53% 4.80 55% 734 52% 240 1.93 1.31
82546 A OX HG HPGR 6.24 0.5 to 5.0 1.528 77% 9.15 68% 639 48% 240 1.54 2.88
82547 A MIX SULF HG HPGR 5.55 0.5 to 5.0 3.095 52% 3.48 59% 635 67% 240 1.82 1.38
Old Test Work 82512 B OX Milled 0.053 1.00 0.260 90% 14.60 52% 480 24% 96 1.13 2.13 82514 A MIX OX Milled 0.054 1.00 0.985 91% 16.94 80% 531 74% 96 1.86 1.50 82518 B MIX SULF Milled 0.063 1.00 0.598 82% 19.03 57% 1264 67% 96 3.37 1.69
82519 B SULF HG Milled 0.132 1.00 1.810 80% 2.47 49% 711 24% 96 0.81 1.00 82520 A SULF Milled 0.07 1.00 1.855 90% 6.05 63% 731 59% 96 2.03 1.00
82521 A OX HG Milled 0.065 1.00 1.436 92% 10.08 87% 686 39% 96 1.94 2.63
82522 A MIX SULF HG Milled 0.068 1.00 3.148 94% 3.56 78% 671 67% 96 1.79 1.13
Source: KCA (2019)

Cerro del Gallo Heap Leach Project NI 43-101 Technical Report
January 31, 2020 Page 13-32
13.6.2 Column Leach Tests Column leach tests are in progress on HPGR crushed material. So far, they have leached for a total of 88 days, the interim results are presented in Table 13.6.3.
Table 13.6.3 Cerro del Gallo KCA Laboratory Column Leach Test Interim Results
KCA Sample
No.
Mineral Type
Overall Average,
gms Au/MT
Overall Extracted,
% Au
Overall Average,
gms Ag/MT
Overall Extracted,
% Ag
Overall Average,
gms Cu/kg
Overall Extracted,
% Cu
Days of
Leach
Overall Consumption
NaCN, kg/MT
Column Addition Ca(OH)2,
kg/MT
Addition Cement, kg/MT
82538 MIX OX 1.210 65% 12.02 57% 600 63% 88 1.66 0 10 82539 MIX OX 0.813 64% 21.94 93% 461 60% 88 1.31 0 10 82540 MIX SULF 1 0.747 62% 13.85 62% 691 68% 88 1.69 0 10 82541 MIX SULF 1 0.386 49% 27.83 46% 2310 78% 88 3.56 0 10 82544 SULF HG 1.778 43% 2.88 27% 711 22% 88 1.70 0 10
Source: KCA (2019) The ongoing column leach tests were compared to the previous column test work. The tests were compared by material type. Each material type was compared based on the current recoveries, extrapolated new recoveries vs. final solution assays, and extrapolated new recoveries vs. final carbon assays. The results indicate that the gold recoveries are similar for mixed oxide and mixed sulfide but the sulfide material has a lower gold recovery in the latest test work. The silver recoveries are similar for the mixed oxide material but are higher in the new test work for both the mixed sulfide and sulfide. The difference in the previous column leach test work conducted by KCA versus the new test work is presented in Table 13.6.4.
Table 13.6.4 Cerro del Gallo KCA Laboratory Column Leach Test Interim Results Comparison
Source: KCA (2019)
KCASample
No.Mineral
TypeCrush Type
Overall Average,
gms Au/MT
88 day Sol'n
Extraction, % Au
Final Sol'n Extraction1,
% Au
Final Carbon
Extraction1, % Au
Overall Average,
gms Ag/MT
88 Day Sol'n Extraction,
% Ag
Final Sol'n Extraction1,
% Ag
Final Carbon Extraction1,
% Ag
Days of
Leach
O'all Consumption
NaCN,kg/MT
Column Addition Ca(OH)2,
kg/MT
Addition Cement,kg/MT
82538 MIX OX HPGR 1.012 65% 66% 66% 16.98 73% 80% 80% 88 1.49 0 1082540 MIX SULF HPGR 0.566 55% 58% 58% 20.84 50% 63% 63% 88 1.63 0 1082544 SULF HG HPGR 1.778 43% 46% 46% 2.88 25% 30% 30% 88 1.70 0 10
Old Test Work82537 A OX HPGR 0.314 66% 69% 71% 11.11 46% 50% 51% 135 2.27 2.85 2.0782538 MIX OX HPGR 1.117 66% 69% 72% 17.85 70% 81% 82% 135 2.66 2.29 --82540 MIX SULF HPGR 0.631 54% 57% 62% 14.16 37% 59% 60% 130 3.62 2.40 --82544 SULF HG HPGR 1.893 50% 51% 54% 4.38 17% 20% 23% 128 2.07 1.26 --
- MIX OX H Only -0.105 -1% -3% -5% -0.87 3% -1% -2% -47 -1.17- MIX SULF H Only -0.064 1% 1% -4% 6.68 14% 4% 3% -42 -1.99- SULF HG H Only -0.115 -7% -5% -8% -1.50 8% 10% 7% -40 -0.371 - Projected recovery for the incomplete new test work, which has completed 88 days of leaching at the time of this report.
New Test Work
Difference (New minus Old) - HPGR Only

Cerro del Gallo Heap Leach Project NI 43-101 Technical Report
January 31, 2020 Page 13-33
13.6.3 SART Tests The SART test work is integrated with the column leach tests where the resulting pregnant solution from the columns is characterized and undergoes sulfidization, acidification, and neutralization. Columns are arranged in a closed-cycle with the solution recycling. Solution is sampled before and after the SART test work. While the column tests are ongoing, interim average solution assay results are presented in Table 13.6.5.
Table 13.6.5 Cerro del Gallo KCA Laboratory SART Interim Results
KCA Sample
No.
Mineral Type
Free NaCN Recovery,
%
SART Recovery,
% Au
SART Recovery,
% Ag
SART Recovery,
% Cu
Days of Leach
82538 MIX OX 89% 8% 97% 83% 60 82539 MIX OX 97% 11% 94% 85% 60 82540 MIX SULF 1 90% 8% 98% 88% 60 82541 MIX SULF 1 89% 3% 98% 90% 60 82544 SULF HG 89% 0% 89% 67% 60
Source: KCA (2019) These interim results of the SART solution are based on solution assays and will continue until the column leach tests conclude. Additional calculations will be done with head assay results. The results are based on about 40 solution samples for the Mixed Oxides and Mixed Sulfides each, and about 15 samples for the Sulfide High Grade. The process design criteria specifies 100% recovery for copper, 95% recovery for silver, and 0% recovery for gold. Following SART, pregnant solution will be sent to an ADR plant for recovery of remaining precious metals. There is a small risk of oversaturating the carbon columns in the ADR plant with an underperforming SART plant, which may be reduced by allowing for more carbon capacity or reduced carbon strip schedules.
While the test work is still ongoing there exists a potential risk that some gold may be present in the SART product, possibly due to poor washing. As such, the value received for any gold in the SART product may be lower than that received from the sale of dorè. Potential gold losses from treating pregnant solution are shown to be variable and may be in the range from 0.0-0.3% to 11.0%.
13.6.3.1 SART Copper Precipitate The SART test work included a copper precipitate analysis for smelter treatment. Solution samples from the bottle roll leach tests (1 and 2 g/L NaCN, 240-hour sample) were selected from the four material types (Oxide, Mixed Oxide, Mixed Sulfide, Sulfide) and blended together in unequal proportions that mimic the final feed distribution (8.5%, 3.1%, 36.6%, and 51.8%, respectively). Once blended into a single composite sample, the solution was processed with SART procedures to produce a copper concentrate. The concentrate was washed and analyzed. Results for the copper precipitate analysis are

Cerro del Gallo Heap Leach Project NI 43-101 Technical Report
January 31, 2020 Page 13-34
presented in Table 13.6.6. This analysis was distributed to smelter brokers for quote inquiries.
Table 13.6.6 Cerro del Gallo KCA Laboratory SART Copper Precipitate Results
Constituent Unit KCA Sample No. 85243 B (Precip)
Unit Average, % Whole Rock ICP Split A ICP Split B
Au mg/kg 10 12 % 0.001 Ag mg/kg 4770 4820 % 0.48 Al % 0.16 0.05 0.05 % 0.087 As mg/kg 62 59 % 0.006 Ba mg/kg 400 61 69 % 0.018 Bi mg/kg <2 <2 % -- Ca % 0.66 0.28 0.26 % 0.40 Cd mg/kg 1,830 1,890 % 0.19 Co mg/kg 22 22 % 0.002 Cr mg/kg 20 19 % 0.002 Cu % 52.7 52.8 % 53 Fe % 2.76 1.19 1.24 % 1.7 Hg mg/kg 293.4 317.9 % 0.031 K % 0.21 0.07 0.06 % 0.11
Mg % 0.04 0.02 0.01 % 0.023 Mn mg/kg 600 278 283 % 0.039 Mo mg/kg 50 50 % 0.005 Na % 0.72 0.16 0.16 % 0.35 Ni mg/kg 6 5 % 0.001 Pb mg/kg 92 96 % 0.009
S(total) % 16.1 -- % 16 S(sulfide) % 7.22 -- % -- S(sulfate) % 8.88 -- % --
Sb mg/kg <2 <2 % -- Se mg/kg 124 123 % 0.012 Si % 0.66 % 0.66 Sr mg/kg 11 9 % 0.001 Te mg/kg 138 140 % 0.014 Ti % 0.01 <0.01 <0.01 % -- V mg/kg 7 7 % 0.001 W mg/kg 231 229 % 0.023 Zn % 7.76 7.64 % 8
LOI¹ 1090°C 27.900 Total - 108.640 Source: KCA (2019)

Cerro del Gallo Heap Leach Project NI 43-101 Technical Report
January 31, 2020 Page 13-35
13.7 Metal Recovery and Reagent Consumption Projections
All the leach test work conducted by the various laboratories, historic (pre-2015) and recent (2018-2019), were compiled and analyzed to best determine field metal heap leach recoveries. Not all the results were included in the final tabulations due to the historical test work only included three main categories of the ore types (Weathered/Oxide, Mixed, Fresh/Sulfide) while the most current test work further differentiated the Mixed category into two separate material types (Mixed Oxide, Mixed Sulfide). For the projected field recoveries and reagent consumptions calculations there are four separate material ore type categories that were considered. The most current test work included all the ore type categories and parameters that matched the process criteria, which includes column leach tests utilizing HPGR crushed material. Historic test work that matched the process criteria (column leached HPGR crushed material) were not able to be included in this analysis due to lack of information that connect the old samples to the mineralization breakdown selected for this project. The test work material samples that were not associated with an ore type category are shown as “TBC” in the test work overall summary, presented in Table 13.7.1 and Table 13.7.2, and their results generally stayed within the range of the categorized samples. The resulting data from the test work was compiled and sorted by test type, sample category, crush size and crush type (conventional vs HPGR). Results are presented in Table 13.7.1 and Table 13.7.2.

Cerro del Gallo Heap Leach Project NI 43-101 Technical Report
January 31, 2020 Page 13-36
Table 13.7.1 Cerro del Gallo Leach Test Work Overall Summary – Conventional Crush
Source: KCA (2019)
CONV. CRUSH Recoveries Head Grades Calculated Head Consumptions
Column Leach Tests Au Ag Cu p80 # Tests Au Ag Cu Au Ag Cu NaCN Cement Lime Duration
Heap Leach - Coarse % % % mm COL g/t g/t g/t g/t g/t g/t kg/t kg/t kg/t days
WEATHERED 75.0 32.4 12.0 12.1 1 0.72 10.0 232 0.71 8.1 205 0.3 – 0.1 61
MIXED – – – – 0 – – – – – – – – – –
MIXED_O – – – – 0 – – – – – – – – – –
MIXED_S – – – – 0 – – – – – – – – – –
FRESH – – – – 0 – – – – – – – – – –
TBC – – – – 0 – – – – – – – – – –
Column Leach Tests Au Ag Cu p80 # Tests Au Ag Cu Au Ag Cu NaCN Cement Lime Duration
Heap Leach - Fine % % % mm COL g/t g/t g/t g/t g/t g/t kg/t kg/t kg/t days
WEATHERED 75.7 51.1 12.8 6.1 2 0.49 12.0 356 0.48 8.1 342 1.6 – 1.5 102
MIXED – – – – 0 – – – – – – – – – –
MIXED_O 70.0 77.0 45.0 6.2 1 1.14 12.5 600 1.15 8.8 600 2.8 – 2.5 143
MIXED_S 56.0 62.0 58.0 6.3 1 0.83 6.5 1200 0.77 4.1 1200 3.0 – 1.8 143
FRESH 41.0 40.0 14.0 6.6 1 1.69 2.4 711 1.76 1.5 711 1.9 – 1.3 143
TBC 55.0 44.8 53.0 6.4 13 1.24 15.4 672 1.22 12.7 1048 2.6 6.0 1.8 112
Bottle Roll Tests Au Ag Cu p80 # Tests Au Ag Cu Au Ag Cu NaCN Cement Lime Duration
Coarse Crush % % % mm BRT g/t g/t g/t g/t g/t g/t kg/t kg/t kg/t days
WEATHERED 59.3 34.6 36.7 14.2 4 1.11 15.2 1079 1.32 16.8 982 1.6 0.0 4.9 30
MIXED 37.4 34.2 34.2 14.2 3 1.07 23.4 1079 1.13 26.7 981 1.1 0.0 1.9 30
MIXED_O – – – – 0 – – – – – – – – – –
MIXED_S – – – – 0 – – – – – – – – – –
FRESH 19.1 11.6 7.7 15.4 2 0.62 13.0 1385 0.67 18.5 1238 0.9 0.0 0.4 30
TBC – – – – 0 – – – – – – – – – –
Bottle Roll Tests Au Ag Cu p80 # Tests Au Ag Cu Au Ag Cu NaCN Cement Lime Duration
Fine Crush % % % mm BRT g/t g/t g/t g/t g/t g/t kg/t kg/t kg/t days
WEATHERED 71.6 54.1 35.8 5.1 6 0.88 16.6 1079 0.97 13.5 952 1.6 0.0 4.7 34
MIXED 51.7 36.9 47.9 4.0 47 0.71 15.7 1079 0.67 29.0 424 2.6 0.0 2.5 39
MIXED_O – – – – 0 – – – – – – – – – –
MIXED_S – – – – 0 – – – – – – – – – –
FRESH 35.2 16.6 25.3 4.4 7 0.76 9.4 1385 0.84 15.0 791 3.0 0.0 2.9 41
TBC 51.6 37.6 34.3 5.6 24 1.24 17.0 870 1.25 16.5 909 1.5 0.0 2.4 4
Bottle Roll Tests Au Ag Cu p80 # Tests Au Ag Cu Au Ag Cu NaCN Cement Lime Duration
Mill % % % mm BRT g/t g/t g/t g/t g/t g/t kg/t kg/t kg/t days
WEATHERED 91.0 70.8 32.9 0.1 6 0.82 11.9 583 0.86 12.4 0 1.3 0.0 2.6 4
MIXED – – – – 0 – – – – – – – – – –
MIXED_O 91.8 80.8 69.8 0.1 6 0.94 16.4 531 0.99 16.9 0 1.7 0.0 1.7 4
MIXED_S 85.5 64.7 67.7 0.1 15 1.10 15.3 1173 1.13 16.0 0 3.0 0.0 1.7 4
FRESH 87.2 61.3 45.6 0.1 6 1.80 4.1 721 1.85 4.3 0 1.5 0.0 1.1 4
TBC 81.2 64.5 20.4 0.2 1 1.08 11.7 628 1.38 12.4 716 0.7 0.0 2.2 3
Cyanide Shake Tests Au Ag Cu p80 # Tests Au Ag Cu Au Ag Cu NaCN Cement Lime Duration
% % % mm LEACH g/t g/t g/t g/t g/t g/t kg/t kg/t kg/t days
WEATHERED 82.7 82.8 10.9 0.1 34 0.93 12.0 536 0.00 0.0 0 0.0 0.0 0.0 1
MIXED – – – – 0 – – – – – – – – – –
MIXED_O 85.0 84.7 13.7 0.1 28 0.98 16.2 542 0.00 16.2 542 0.0 0.0 0.0 1
MIXED_S 77.8 69.0 7.1 0.1 71 1.05 14.8 1209 0.00 14.8 1209 0.0 0.0 0.0 1
FRESH 82.9 60.6 9.0 0.1 27 1.81 5.0 727 0.00 5.0 727 0.0 0.0 0.0 1
TBC 80.2 38.7 31.8 0.1 37 1.24 18.9 1003 1.19 18.9 1003 2.0 0.0 1.5 2

Cerro del Gallo Heap Leach Project NI 43-101 Technical Report
January 31, 2020 Page 13-37
Table 13.7.2 Cerro del Gallo Leach Test Work Overall Summary – HPGR Crush
HPGR CRUSH Recoveries Head Grades Calculated Head Consumptions
Column Leach Tests Au Ag Cu p80 # Tests Au Ag Cu Au Ag Cu NaCN Cement Lime Duration
Heap Leach - Fine % % % mm COL g/t g/t g/t g/t g/t g/t kg/t kg/t kg/t days
WEATHERED 76.0 63.0 22.0 3.9 2 0.82 11.9 583 0.90 10.1 – 2.3 2.1 2.9 135
MIXED – – – – 0 – – – – – – – – – –
MIXED_O 71.5 81.5 46.0 4.3 2 0.94 16.4 531 1.02 17.4 – 2.7 – 2.3 135
MIXED_S 61.4 62.2 58.6 5.0 5 1.10 15.3 1173 1.06 11.7 – 3.3 2.0 2.2 128
FRESH 59.5 43.0 34.0 5.5 2 1.80 4.1 721 1.68 4.5 – 2.4 – 1.3 128
TBC 65.5 54.8 44.2 4.9 6 1.20 9.1 649 1.21 11.5 618 1.2 – 1.0 115
Bottle Roll Tests Au Ag Cu p80 # Tests Au Ag Cu Au Ag Cu NaCN Cement Lime Duration
Fine Crush % % % mm BRT g/t g/t g/t g/t g/t g/t kg/t kg/t kg/t days
WEATHERED 71.6 0.0 47.6 3.8 1 0.41 30.6 0 0.43 0.0 0 2.5 0.0 5.0 42
MIXED 49.9 0.0 45.0 3.9 12 0.78 15.1 0 0.84 0.0 0 2.5 0.0 3.2 42
MIXED_O – – – – 0 – – – – – – – – – –
MIXED_S – – – – 0 – – – – – – – – – –
FRESH – – – – 0 – – – – – – – – – –
TBC 59.5 54.7 49.7 4.9 6 1.20 9.1 649 1.31 13.1 638 1.2 0.0 2.8 2
Cyanide Shake Tests Au Ag Cu p80 # Tests Au Ag Cu Au Ag Cu NaCN Cement Lime Duration
% % % mm LEACH g/t g/t g/t g/t g/t g/t kg/t kg/t kg/t days
TBC 89.3 81.5 57.1 0.1 1 1.21 9.7 640 1.31 12.2 755 1.5 0.0 1.6 2 Source: KCA (2019)

Cerro del Gallo Heap Leach Project NI 43-101 Technical Report
January 31, 2020 Page 13-38
Heap leach field projections for gold and silver recovery were estimated based on a two and three percentage point deduction, respectively from laboratory results. Copper field projected recovery was not discounted. The projected field recoveries assume a well-managed heap leach operation and that agglomeration was completed correctly. Reagent consumptions for sodium cyanide and cement were also compiled and projected for the field; for field projections the sodium cyanide consumption was calculated in METSIM and cement was established from the compacted permeability test work. Lime was not expected to be utilized due to the high levels of cement and its neutralization potential. A summary table showing the overall recoveries for each sample category is presented in Table 13.7.3, and the projected reagent consumptions in Table 13.7.4.
Table 13.7.3 Cerro del Gallo Heap Leach Recovery Projections
Ore Type (HPGR)
Feed Distribution
LOM Average1
Column Test Recoveries Projected Field Recoveries2
Au, % Ag, % Au, % Ag, % Cu% Weathered (Oxide) 9.2% 76 63 74 60 22 Mixed Oxide 5.8% 72 82 70 79 46 Mixed Sulfide 38.0% 61 62 59 59 59 Fresh (Sulfide) 47.0% 60 43 58 40 34
Life of Mine (LOM) Average 60 52 43 1 Based on MDA mine plan v9 18Oct2019 2 Gold Discount, % 2 2 Silver Discount, % 3 2 Copper Discount, % 0
Source: KCA (2019)
Table 13.7.4 Cerro del Gallo Heap Leach Projected Reagent Consumptions
Ore Type (HPGR)
Feed Distribution
LOM Average1
Column Test Reagents, kg/t Projected Field Reagents, kg/t
NaCN Cement2 Lime NaCN3 Cement Lime
Weathered (Oxide) 9.2% 2.3 20.0 – 0.87 10.0 – Mixed Oxide 5.8% 2.7 10.0 – 0.34 10.0 – Mixed Sulfide 38.0% 3.3 10.0 – 0.87 10.0 – Fresh (Sulfide) 47.0% 2.4 7.5 – 0.60 10.0 –
Life of Mine (LOM) Average 0.71 10 – 1 Based on MDA mine plan v9 18Oct2019 2 Based on compacted permeability test work, 80 m 3 Based on METSIM simulation
Source: KCA (2019)

Cerro del Gallo Heap Leach Project NI 43-101 Technical Report
January 31, 2020 Page 13-39
13.7.1 Sulfur Overview The sulfide sulfur was analyzed and compared to the results of the latest column leach test work. Sample categories (Weathered/Oxide, Mixed Oxide, Mixed Sulfide, Fresh/Sulfide) were compared with sulfide sulfur content and metal extraction. The general trends indicate higher gold and silver metal extraction as the sulfide sulfur content decreases. More importantly, the four separate sample categories are less distinct where only a clear difference between oxide samples and sulfide samples is noticed. The sulfide content graphs are illustrated in Figure 13.7.1 through Figure 13.7.4.
Figure 13.7.1 Cerro del Gallo Sulfide Content versus Recovery (HPGR) – Gold
Source: KCA (2019)
0.01, 69% 0.05, 71%
0.20, 67% 0.94, 67%
1.60, 52%1.76, 50%
1.13, 58%
1.23, 51%
0.84, 64%
0.04, 80%
0.43, 57%
0%
10%
20%
30%
40%
50%
60%
70%
80%
90%
100%
0.0 0.2 0.4 0.6 0.8 1.0 1.2 1.4 1.6 1.8 2.0
Cum
ulat
ive P
erce
nt G
old
Extr
actio
n
Head Sulfide Sulfur, %
Cerro del Gallo Project
HPGR 4.7mm avg
O_HG
O_MixOxide
O_Mix
S_Mix_HG
SulfideS_Mix
S_Mix
S_HG S_MixS_Mix

Cerro del Gallo Heap Leach Project NI 43-101 Technical Report
January 31, 2020 Page 13-40
Figure 13.7.2 Cerro del Gallo Sulfide Content versus Recovery (HPGR) – Silver
Source: KCA (2019)
0.01, 50%
0.05, 73%
0.20, 88%
0.94, 81%
1.60, 43%
1.76, 59%
1.13, 52%
1.23, 20%
0.84, 62%
0.04, 74%
0.43, 69%
0%
10%
20%
30%
40%
50%
60%
70%
80%
90%
100%
0.0 0.2 0.4 0.6 0.8 1.0 1.2 1.4 1.6 1.8 2.0
Cum
ulat
ive P
erce
nt S
ilver
Ext
ract
ion
Head Sulfide Sulfur, %
Cerro del Gallo Project
HPGR 4.7mm avg
O_HG
O_Mix
Oxide
O_Mix
S_Mix_HG
Sulfide
S_Mix
S_Mix
S_HG
S_Mix
S_Mix
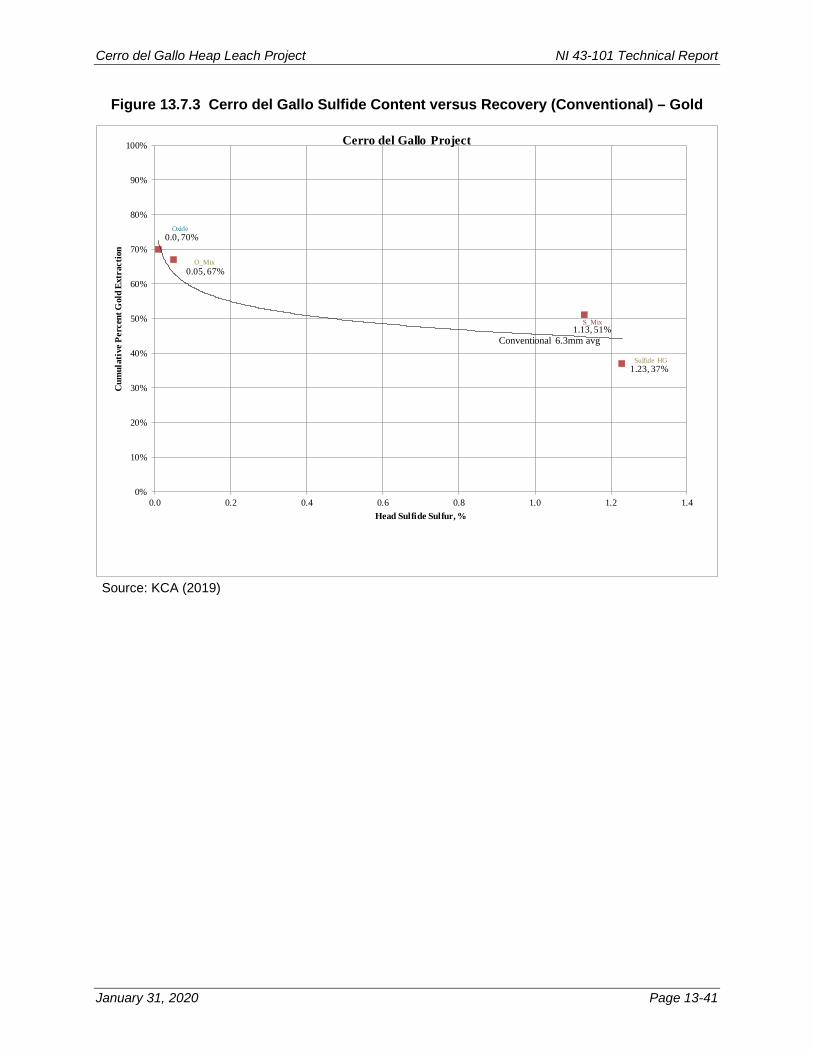
Cerro del Gallo Heap Leach Project NI 43-101 Technical Report
January 31, 2020 Page 13-41
Figure 13.7.3 Cerro del Gallo Sulfide Content versus Recovery (Conventional) – Gold
Source: KCA (2019)
0.0, 70%
0.05, 67%
1.13, 51%
1.23, 37%
0%
10%
20%
30%
40%
50%
60%
70%
80%
90%
100%
0.0 0.2 0.4 0.6 0.8 1.0 1.2 1.4
Cum
ulat
ive P
erce
nt G
old
Extr
actio
n
Head Sulfide Sulfur, %
Cerro del Gallo Project
Conventional 6.3mm avg
Oxide
O_Mix
Sulfide HG
S_Mix

Cerro del Gallo Heap Leach Project NI 43-101 Technical Report
January 31, 2020 Page 13-42
Figure 13.7.4 Cerro del Gallo Sulfide Content versus Recovery (Conventional) – Silver
Source: KCA (2019)
13.7.2 Head Grades versus Metal Extraction Head grades of the sample categories (Weathered/Oxide, Mixed Oxide, Mixed Sulfide, Fresh/Sulfide) were compared with metal extraction from the latest column leach test work. The resulting graphs for gold, silver, and copper are presented in Figure 13.7.5 through Figure 13.7.7, respectively. They include both conventionally and HPGR crushed material. No measurable trends were observed for gold, silver and copper.
0.0, 60%
0.05, 76%
1.13, 61%
1.23, 39%
0%
10%
20%
30%
40%
50%
60%
70%
80%
90%
100%
0.0 0.2 0.4 0.6 0.8 1.0 1.2 1.4
Cum
ulat
ive P
erce
nt S
ilver
Ext
ract
ion
Head Sulfide Sulfur, %
Cerro del Gallo Project
Conventional 6.3mm avg
Oxide
O_Mix
Sulfide HG
S_Mix

Cerro del Gallo Heap Leach Project NI 43-101 Technical Report
January 31, 2020 Page 13-43
Figure 13.7.5 Cerro del Gallo Head Grade versus Recovery – Gold
Source: KCA (2019)
OX (conv.)
MIX OX (conv.)
MIX SULF (conv.)
SULF HG (conv.)
OX (hpgr)MIX OX (hpgr)
MIX SULF (hpgr)SULF HG (hpgr)
SULF (hpgr)
OX HG (hpgr)
MIX SULF HG (hpgr)
30%
40%
50%
60%
70%
80%
90%
0.000 0.500 1.000 1.500 2.000 2.500 3.000 3.500
Gol
d Ext
ract
ion
Calc. Au Head, g/t
OX (conv.)
MIX OX (conv.)
MIX SULF (conv.)
SULF HG (conv.)
OX (hpgr)
MIX OX (hpgr)
MIX OX (hpgr)
MIX SULF (hpgr)
MIX SULF (hpgr)
MIX SULF (hpgr)
MIX SULF (hpgr)
SULF HG (hpgr)
SULF (hpgr)
OX HG (hpgr)
MIX SULF HG (hpgr)

Cerro del Gallo Heap Leach Project NI 43-101 Technical Report
January 31, 2020 Page 13-44
Figure 13.7.6 Cerro del Gallo Head Grade versus Recovery – Silver
Source: KCA (2019)
OX (conv.)
MIX OX (conv.)
MIX SULF (conv.)
SULF HG (conv.)
OX (hpgr)
MIX OX (hpgr)
MIX SULF (hpgr)
SULF HG (hpgr)
SULF (hpgr)
OX HG (hpgr)
MIX SULF HG (hpgr)
10%
20%
30%
40%
50%
60%
70%
80%
90%
100%
0 5 10 15 20 25 30
Silv
er E
xtra
ctio
n
Calc. Ag Head, g/t
OX (conv.)
MIX OX (conv.)
MIX SULF (conv.)
SULF HG (conv.)
OX (hpgr)
MIX OX (hpgr)
MIX OX (hpgr)
MIX SULF (hpgr)
MIX SULF (hpgr)
MIX SULF (hpgr)
MIX SULF (hpgr)
SULF HG (hpgr)
SULF (hpgr)
OX HG (hpgr)
MIX SULF HG (hpgr)

Cerro del Gallo Heap Leach Project NI 43-101 Technical Report
January 31, 2020 Page 13-45
Figure 13.7.7 Cerro del Gallo Head Grade versus Recovery – Copper
Source: KCA (2019)
OX (conv.)
MIX OX (conv.)
MIX SULF (conv.)
SULF HG (conv.)
OX (hpgr)
MIX OX (hpgr)
MIX SULF (hpgr)
SULF HG (hpgr)
SULF (hpgr)
OX HG (hpgr)
MIX SULF HG (hpgr)
0%
10%
20%
30%
40%
50%
60%
70%
80%
0 500 1000 1500 2000 2500
Copp
er E
xtra
ctio
n
Calc. Cu Head, g/t
OX (conv.)
MIX OX (conv.)
MIX SULF (conv.)
SULF HG (conv.)
OX (hpgr)
MIX OX (hpgr)
MIX OX (hpgr)
MIX SULF (hpgr)
MIX SULF (hpgr)
MIX SULF (hpgr)
MIX SULF (hpgr)
SULF HG (hpgr)
SULF (hpgr)
OX HG (hpgr)
MIX SULF HG (hpgr)

Cerro del Gallo Heap Leach Project NI 43-101 Technical Report
January 31, 2020 Page 14-1
14 Mineral Resource Estimate
Mr. Neb Zurkic, president of Zurkic Mining Consultants, was contracted by Argonaut to prepare an updated estimate of Mineral Resources for the CdG Project. Mr. Zurkic conducted a three-day site visit in July 2018 in order to examine drill core, RC drill cuttings, and to examine the onsite geology. Mr. Zurkic collaborated with Argonaut’s geologic staff to create wireframes to constrain the gold and conducted various statistical and geostatistical analyses prior to estimating block gold grades. The following sections detail various aspects concerned with the estimate of mineral resources for the Cerro del Gallo project.
14.1 Project Limits & Model Construction
The CdG project uses UTM NAD27 grid coordinates. The project limits for the CdG block model are as follows:
Min Max
DH EASTING 286,626.0 290,077.2 DH NORTHING 2,328,257.0 2,333,441.0
Argonaut constructed the CdG model using Leapfrog and MineSight® software. Prior to modelling, Argonaut conducted re-logging of select drill holes focused primarily on geo-metallurgical material types, alteration, and lithology. The logging was plotted on paper cross-sections, rectified, then digitized and imported into Leapfrog. Using Leapfrog, the sections were further rectified and 3D solids were created. Argonaut created 3D solids for lithology (one intrusive shape) and geo-metallurgical material types (oxide, mixed oxide, mixed sulfide, and sulfide). Alteration 3D solids were not created as the various alteration types have limited or no effect on mineral distribution. After construction of lithology shapes, Argonaut completed geostatistical and geological examination of gold, silver, and copper distribution versus lithology. Both the geostatistical and geological examination indicated clearly that there was no correlation of mineralization to lithology. Gold mineralization appears controlled primarily by fracture density related to the intrusive event. Silver mineralization appears related to both the gold event and a later cross-cutting Guanajuato-type veining event. Copper, though less clear, may be related to the gold mineralization event or perhaps a different, separate
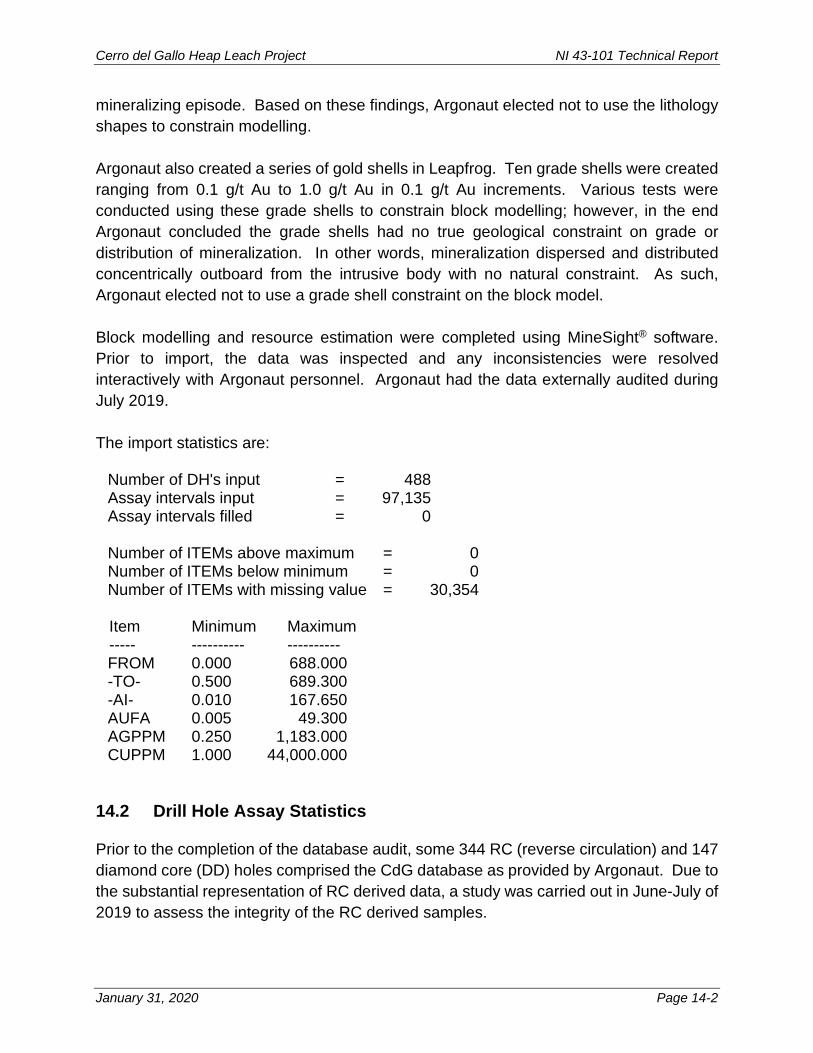
Cerro del Gallo Heap Leach Project NI 43-101 Technical Report
January 31, 2020 Page 14-2
mineralizing episode. Based on these findings, Argonaut elected not to use the lithology shapes to constrain modelling. Argonaut also created a series of gold shells in Leapfrog. Ten grade shells were created ranging from 0.1 g/t Au to 1.0 g/t Au in 0.1 g/t Au increments. Various tests were conducted using these grade shells to constrain block modelling; however, in the end Argonaut concluded the grade shells had no true geological constraint on grade or distribution of mineralization. In other words, mineralization dispersed and distributed concentrically outboard from the intrusive body with no natural constraint. As such, Argonaut elected not to use a grade shell constraint on the block model. Block modelling and resource estimation were completed using MineSight® software. Prior to import, the data was inspected and any inconsistencies were resolved interactively with Argonaut personnel. Argonaut had the data externally audited during July 2019. The import statistics are: Number of DH's input = 488 Assay intervals input = 97,135 Assay intervals filled = 0 Number of ITEMs above maximum = 0 Number of ITEMs below minimum = 0 Number of ITEMs with missing value = 30,354 Item Minimum Maximum ----- ---------- ---------- FROM 0.000 688.000 -TO- 0.500 689.300 -AI- 0.010 167.650 AUFA 0.005 49.300 AGPPM 0.250 1,183.000 CUPPM 1.000 44,000.000
14.2 Drill Hole Assay Statistics
Prior to the completion of the database audit, some 344 RC (reverse circulation) and 147 diamond core (DD) holes comprised the CdG database as provided by Argonaut. Due to the substantial representation of RC derived data, a study was carried out in June-July of 2019 to assess the integrity of the RC derived samples.
Cerro del Gallo Heap Leach Project NI 43-101 Technical Report
January 31, 2020 Page 14-3
Some 48,309 assay intervals were loaded from the RC drilling and 48,510 intervals from the diamond core drilling. Almost 100% of the RC samples were collected at 5-foot intervals which have been converted and rounded to 1.52-1.53 meters in the database. Some 87.5% of the DD was sampled at 1-meter intervals and some 6.3% at 1.5-meter intervals. RC dominates the near surface drilling with the deepest RC drilling recorded at some 370.3 meters below the surface, while the deepest DD drilling is recorded at 689.3 meters. With roughly half the database represented by RC drilling, it was considered important to investigate and attempt to assess the integrity of the RC derived data. The process taken was to review the protocols (where known) and equipment employed during the drilling campaigns and assess these relative to industry best practice. Statistical methods were also used to compare the RC data to the DD data. This was done globally, within mineralization and by specific areas spatially to ensure as close as possible “apples to apples” comparisons were being made. Instances do exist where DD holes have been drilled very close to RC holes, perhaps purposely by the various project owners to assess the quality of the RC drilling. These “twin” situations have been isolated and assessed to provide further comparative information. Although the study was neither exhaustive or definitive, no clear evidence was found to suggest that either the RC or DD data are materially flawed. While it does seem that the RC drilling has resulted in minor down-the-hole sample smearing, the effect is suspected to be immaterial to the global resource estimate. To reflect the apparent uncertainty resulting from this study, measures have been taken during resource estimation (see estimation section). The 2012 technical report did not provide direct comparisons between the drilling methods; however, the description of the drilling and sampling equipment suggest the drilling was done to high standards.

Cerro del Gallo Heap Leach Project NI 43-101 Technical Report
January 31, 2020 Page 14-4
Univariate
Data histograms of 3-meter composites by estimation domain are presented in Figure 14.2.1 to Figure 14.2.6.
Figure 14.2.1 Gold 3m Composites Data – inside 0.05 g/t Au Model
Source: ZMC (2019)
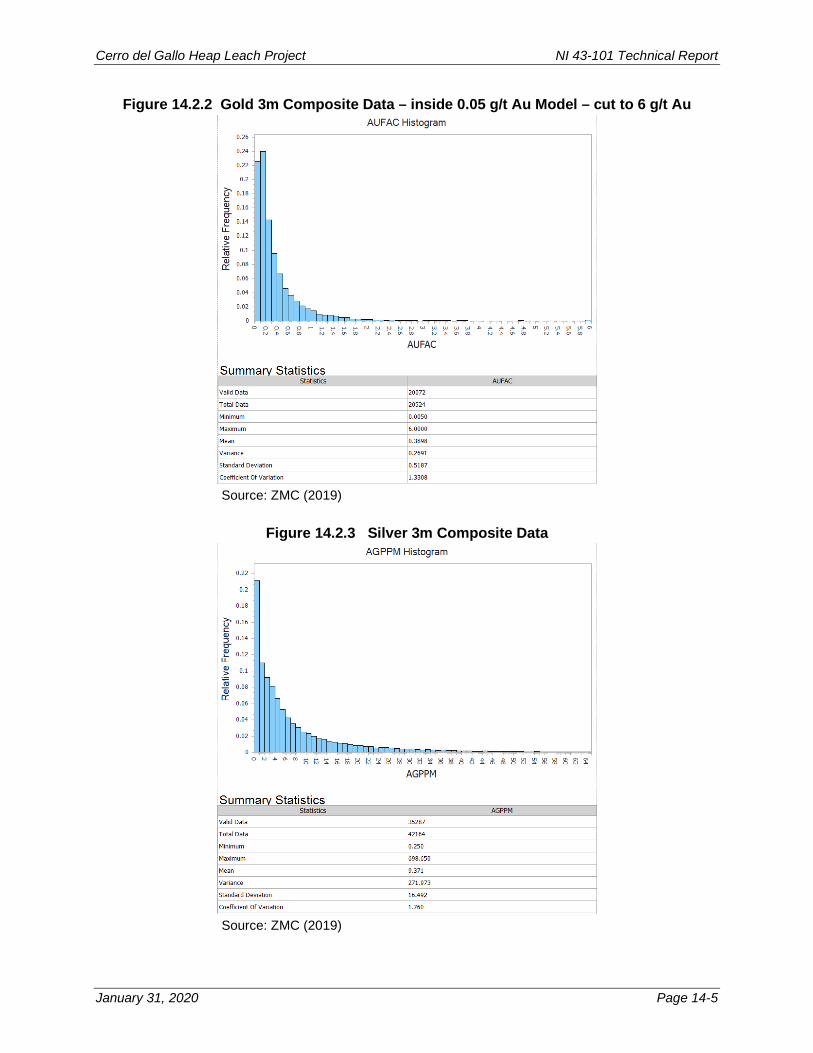
Cerro del Gallo Heap Leach Project NI 43-101 Technical Report
January 31, 2020 Page 14-5
Figure 14.2.2 Gold 3m Composite Data – inside 0.05 g/t Au Model – cut to 6 g/t Au
Source: ZMC (2019)
Figure 14.2.3 Silver 3m Composite Data
Source: ZMC (2019)

Cerro del Gallo Heap Leach Project NI 43-101 Technical Report
January 31, 2020 Page 14-6
Figure 14.2.4 Silver 3m Composite Data – cut to 65 g/t Ag
Source: ZMC (2019)
Figure 14.2.5 Copper 3m Composite Data
Source: ZMC (2019)

Cerro del Gallo Heap Leach Project NI 43-101 Technical Report
January 31, 2020 Page 14-7
Figure 14.2.6 Copper 3m Composite Data – cut to 1% Cu
Source: ZMC (2019)
Bivariate
A cursory assessment does not show obvious relationships between the three primary metals. Spatially silver is more anomalous to the NE of the intrusive, gold is highest on the carapace of the intrusive while copper increases in grade further outward from the intrusive. Subtle quasi relationships such as decreasing silver grades at increasing gold cut-off grades for particular ranges of grades appear to result due to these spatial differences.
14.3 High-Grade Outlier Treatment
To ensure what appear to be high grade outliers are not having undue influence on the estimate, the use of log-probability plots along with assessment of the coefficient of variation (“CV”) at reduced cut-off grades enabled the determination of appropriate upper limit thresholds for each of the estimated commodities. Compositing the data reduces the CV as is shown in Figure 14.2.1 to Figure 14.2.6 and Figure 14.3.1 to Figure 14.3.12. These charts also show gold inside the 0.05 g/t grade shell (although this is not used as a restriction, this area is the effective area for the estimate). Multiple mineralization phases provide an explanation for the very high grades and therefore are not outliers but rather a smaller sub-set of the data population caused by an event other than the primary intrusion. A restricted search is employed above the

Cerro del Gallo Heap Leach Project NI 43-101 Technical Report
January 31, 2020 Page 14-8
selected upper grade thresholds as stated in Table 14.8.1. Figure 14.2.1 to Figure 14.2.6 and Figure 14.3.1 to Figure 14.3.12 show the composite statistics top-cut to the grade threshold used in the restricted search during estimation as this is the effective CV where these high grades are not encountered during estimation. The restricted search is confined to one block for gold and copper and does not have an impact unless it is within 2.5 meters of the block center. The NW-SE structural corridor appears to have a far greater influence on the silver mineralization than it does on gold or copper. Therefore, this later phase of high-grade silver mineralization has been allowed to influence the block even when it lies on the far corners; one composite could in fact influence four blocks (over two benches) if it is located on the apex of those four blocks.
Figure 14.3.1 All Gold Assay Data Histogram
Source: ZMC (2019)

Cerro del Gallo Heap Leach Project NI 43-101 Technical Report
January 31, 2020 Page 14-9
Figure 14.3.2 Gold Assay Data – Sample Interval Length
Source: ZMC (2019)
Figure 14.3.3 Gold Assay Data – Intrusive
Source: ZMC (2019)

Cerro del Gallo Heap Leach Project NI 43-101 Technical Report
January 31, 2020 Page 14-10
Figure 14.3.4 Gold Assay Data – non-Intrusive
Source: ZMC (2019)
Figure 14.3.5 Gold Assay Data – Oxide
Source: ZMC (2019)

Cerro del Gallo Heap Leach Project NI 43-101 Technical Report
January 31, 2020 Page 14-11
Figure 14.3.6 Gold Assay Data – Oxide/Sulfide Mix
Source: ZMC (2019)
Figure 14.3.7 Gold Assay Data – Sulfide/Oxide Mix
Source: ZMC (2019)

Cerro del Gallo Heap Leach Project NI 43-101 Technical Report
January 31, 2020 Page 14-12
Figure 14.3.8 Gold Assay Data – Sulfide
Source: ZMC (2019)
Figure 14.3.9 Silver Assay Data – All
Source: ZMC (2019)

Cerro del Gallo Heap Leach Project NI 43-101 Technical Report
January 31, 2020 Page 14-13
Figure 14.3.10 Silver Assay Data – minus Year 2013
Source: ZMC (2019)
Figure 14.3.11 Copper Assay Data – All
Source: ZMC (2019)

Cerro del Gallo Heap Leach Project NI 43-101 Technical Report
January 31, 2020 Page 14-14
Figure 14.3.12 Copper Assay Data – minus Year 2013
Source: ZMC (2019)
14.4 Drill Hole Compositing
Sampling lengths vary from as little as 15 cm to as much as 5 meters, more than 40% of the data is sampled at the nominal 1m interval in the mineralized domains. Much of the RC sampling was completed on nominal 5 ft (1.524-meter) intervals; this sampling interval constitutes almost 55% of the data. Mining is proposed on 5-meter benches and therefore harnessing the variance at less than this in the block model is not needed. In order to ensure a similar sample support, and avoid excessive “splitting” of raw data, all samples were down-hole composited to 3.0 meters (<0.02% of the data is generated from sample intervals of >3 meters). While geology explains the mineralizing events, grade is diffuse across boundaries and therefore the compositing is not controlled by any geological boundary.
14.5 Spatial Analysis – Variography
Variographic analyses were conducted with the aid of MineSight® Data Analyst commercial software. Variographic analysis tools are based on a tangential system. Gold, silver, and copper distribution and grade correlation at CdG displays concentric radial control surrounding the intrusive. Therefore, in order to model variograms the 3-meter composite data is transformed. The composite data is transformed into eight

Cerro del Gallo Heap Leach Project NI 43-101 Technical Report
January 31, 2020 Page 14-15
sectors, each representing a 90o window with a 45o overlap. The composites are rotated such that each of the 8 sectors “points” West and is separated by 10 km. (see Figure 14.5.1 though Figure 14.5.3). Variography is calculated independently by sector and if the radial correlation is confirmed, a final variogram is modelled. The transformation is such that if the direction of greatest correlation is N-S, the radial/concentric correlation is confirmed. The data are “overlapped” to avoid abrupt terminations of the variogram long axis due to any arbitrary choice of sector location. Variograms use a spherical correlogram (referred to as a variogram throughout this literature) model with two nested structures. Variograms are calculated using:
• 50-meter lag (~drill spacing) +/-25 meters, for directional correlograms, • 3-meter lag (sample spacing) +/-1.5 meters, for down-hole correlogram, • 15 degree vertical and horizontal windows, for directional correlograms, • 5-10-meter bandwidth, for directional correlograms, • Upper grade limits set at grade restricted thresholds in estimate, • Lower grade limits set to avoid undue influence of numerous near zero data.
The models are generally well fitted in the principal directions; the “along strike” in this case is radial (concentric around the intrusive), down dip is down the limbs of the intrusive and across strike is outward away from the intrusive. Variography was assessed by oxidation domain however the results were not significantly different to the dataset as a whole. The NW-SE structural corridor influences all mineralization however the main source of the gold and copper mineralization appears to be correlated to the intrusive geometry while silver may be more influenced by the NW-SE structures. Gold variograms are more anisotropic than copper. The gold variogram models were used to interpolate density into the block model as the gold mineralizing fluids would also influence density. The resulting variogram models are typical for this style of mineralization. The silver nugget effect is higher than for gold which could be due to the very small samples used during the 2013 drilling campaign. The histograms presented in Figure 14.3.9 and Figure 14.3.10 show a lower CV for when the 2013 data are removed for silver which suggest that the nugget effect for silver has been affected by the 2013 data.

Cerro del Gallo Heap Leach Project NI 43-101 Technical Report
January 31, 2020 Page 14-16
Figure 14.5.1 Plan View of 3-meter Composite Data
Source: ZMC (2019)

Cerro del Gallo Heap Leach Project NI 43-101 Technical Report
January 31, 2020 Page 14-17
Figure 14.5.2 Plan View of 3-meter Composite Data Transformed into 8 x Overlapping Sectors
Source: ZMC (2019)
Figure 14.5.3 Plan View of Close Up of One Overlapping Sector
Source: ZMC (2019)

Cerro del Gallo Heap Leach Project NI 43-101 Technical Report
January 31, 2020 Page 14-18
Figure 14.5.4 Spherical Variogram Models (MEDS rotations) and Final Pass Search Arrays – Gold
Source: ZMC (2019)
Figure 14.5.5 Spherical Variogram Models (MEDS rotations) and Final Pass Search
Arrays – Silver
Source: ZMC (2019)

Cerro del Gallo Heap Leach Project NI 43-101 Technical Report
January 31, 2020 Page 14-19
Figure 14.5.6 Spherical Variogram Models (MEDS rotations) and Final Pass Search Arrays – Copper
Source: ZMC (2019)
14.6 Digital Data
In December 2007, acQuire Technology Solutions, assisted by Golder Associates, completed the implementation of the acQuire data management system. Up until then, the data from the field log sheets was entered into a digital database (primarily a MS Excel spreadsheet and then converted into a MS Access relational database) at the completion of the hole. The MS Excel spreadsheet was created with a series of validation criteria in the form of pull-down menus for each data entry that restricts what can be entered into each field and significantly reduces transcription errors, which were included as the coded libraries for the acQuire data management system. Assay results were received from SGS (Toronto) in electronic (by email) and hardcopy format. The electronic results were provided in CSV (comma delineated) format. The acQuire database had been established to import the CSV files directly, therefore minimizing the potential for any human error associated with entering assay data. This digital data was emailed from the laboratory to the site database manager at San Antón. Hard copies of the assay results were mailed from the laboratory to the Toronto office where they were collated and filed.

Cerro del Gallo Heap Leach Project NI 43-101 Technical Report
January 31, 2020 Page 14-20
Processing software utilized during the drill program included MapInfo, Discover, Vulcan and Gemcom. MapInfo and Discover are 2D geological software that were utilized in the production of maps, drill hole plans, and cross sections. Vulcan and Gemcom are 3D geological software that were utilized in the production of plans and cross-sections to facilitate the generation of the geological model used for resource estimation. Laboratory repeat sample assay values, laboratory second split sample assay values, SGS check and QAQC assay values, and field duplicate sample assay results form part of the quality control/quality assurance program and these values have not been used in resource calculations. In accordance with industry standard, 47 procedure only the original assay values, rather than the average values, have been incorporated into the database for resource calculations, although repeat, second split and duplicate assay values, together with the assay results of the quality control standards are preserved in the primary database. Sanford Information Systems utilized Microsoft Access for the 2019 database audit and recompilation. The database tables provided by Rafael Puente (site geologist) were imported and reviewed prior to the recompilation. For the recompilation, only original data provided by Rafael Puente were imported. Sources of the original data were the SGS and ALS assay certificates, downhole survey pdf files, and QC samples. The QC statistics and control charts for the standards, blanks, and check samples were all sourced by the Access database. This database was the source for the 2019 resource modeling.
Topography
Regional topography is modelled from a LIDAR aerial survey and ground control points. Final drill-holes collar locations are surveyed using a theodolite. The original, pre-mining topography was provided in DXF format from which a percentage block not in air is calculated and then this is used to estimate mineral resources.
14.7 Block Model Construction
The block model was centered around the coordinates E 288,630; N 2,331,970 which were deduced from the modelled intrusive; this centroid was also used for the variography data transformations. A project was set up with block model limit sizes as specified in Table 14.7.1. No rotation has been applied as in previous estimates where the block model was rotated to the NW-SE structural corridor. Due to the main mineralization control being the porphyry, no rotation is considered necessary. The previously defined bench height is considered appropriate for potential mining scale and has been kept as previously defined at 5

Cerro del Gallo Heap Leach Project NI 43-101 Technical Report
January 31, 2020 Page 14-21
meters. The lateral extents of 10x10 meters are a fifth the nominal drill-hole spacing which is at the limits of acceptable block size to drill-spacing ratio.
Model Extents Table 14.7.1 Model Extents
Minimum Maximum Block Size
# Blocks East (m) 287,900 289,400 10.0 150 North (m) 2,331,270 2,332,670 10.0 140 Reduced
1,750 2,350 5.0 120
Source: ZMC (2019)
Model Coding Table 14.7.2 Block Model Items
Item Min Max Precision Data Type Description AGN13 0 100 0.0010 Interpolated Silver grade – Ordinary Kriging (OK) – no 2013 data AGNN 0 500 0.0001 Assigned Silver grade - Nearest neighbor AGOK 0 100 0.0010 Interpolated Silver grade – Ordinary Kriging (OK) AU2MC 0 50 0.0010 Interpolated Gold grade – Ordinary Kriging (OK) – constrained by 0.05 g/t shell AU4MC 0 50 0.0010 Interpolated Gold grade – Ordinary Kriging (OK) – single pass only AUID2 0 50 0.0010 Interpolated Gold grade - Inverse distance weighting exponent 2 AUNN 0 100 0.0001 Assigned Gold grade - Nearest neighbor AUOK 0 50 0.0010 Interpolated Gold grade – Ordinary Kriging (OK) AVEDD 0 200 0.1000 Interpolated Average composite distance using 3 holes, 1 composite per hole DD AVERD 0 200 0.1000 Interpolated Average composite distance using 4 holes, 1 composite per hole CDISA 0 200 0.1000 Interpolated Average composite distance used for gold interpolation CDISC 0 200 0.1000 Interpolated Closest composite distance used for gold interpolation CDISF 0 200 0.1000 Interpolated Furthest composite distance used for gold interpolation CUID2 0 50 0.0010 Interpolated Copper grade - Inverse distance weighting exponent 2 CUN13 0 50 0.0010 Interpolated Copper grade – Ordinary Kriging (OK) – no 2013 data CUNN 0 100 0.0010 Assigned Copper grade - Nearest neighbor CUOK 0 50 0.0010 Interpolated Copper grade – Ordinary Kriging (OK) IGID2 0 50 0.0010 Interpolated Silver grade - Inverse distance weighting exponent 2 INDEN 0 4 0.0100 Interpolated SG data - Inverse distance squared, discounted for porosity. KVAG 0 80 0.0010 Interpolated Silver kriging variance KVAU 0 80 0.0010 Interpolated Gold kriging variance KVCU 0 80 0.0010 Interpolated Copper kriging variance MIIX 0 10 1.0000 Assigned Classification (1=Measured, 2=Indicated, 3=Inferred, 4=Min). NCMPX 0 50 1.0000 Interpolated Number of composites used for gold interpolation NHOLX 0 20 1.0000 Interpolated Number of holes used for gold interpolation PHASE 0 50 1.0000 Assigned PIT (40=Reserve, 45=Resource, 50=Beyond). SECTA 0 36 1.0000 Assigned 36 x 100 sector codes to control search rotation. TOPO 0 100 0.0100 Assigned % of block below surface topography ZONEC 0 20 1.0000 Assigned Oxidation code (1=oxide, 2=ox-sul 3=sul-ox, 4=sulfide).
Source: ZMC (2019)
Bulk Density
Inverse distance squared is used to estimate the density point data into the block model. The gold radial framework and parameters are used except for the number of data is greater (see Table 14.7.3). The resulting estimated density is then discounted by oxidation (see Table 11.4.1) to produce an in-situ bulk density. The resulting estimate sees a marginally lower in-situ bulk density inside the intrusive and higher in-situ bulk densities on the peripheries (see Figure 14.7.1) which conforms to the logging descriptions in the 2012 report.

Cerro del Gallo Heap Leach Project NI 43-101 Technical Report
January 31, 2020 Page 14-22
Table 14.7.3 Number of Composites Used in Estimate
Estimated Item
1st Pass 2nd Pass (overwrites 1st Pass) Per Block Per Hole Per Block Per Hole
Minimum Maximum Maximum Minimum Maximum Maximum Gold 4 21 7 7 7 3 Silver 4 30 5 Copper 4 30 5 Density 2 30 5
Source: ZMC (2019) Figure 14.7.1 Typical Bench 2,120: Density data, In-situ Bulk Density Estimate; Intrusive
Source: ZMC (2019)
14.8 Block Gold Grade Estimation
Estimation Domains
Estimates were assessed using grade shell restrictions as has been by previous practitioners. Grade shells are used to control the level of smoothing on the peripheries of the project; however, they have no geological basis as the mineralization is described as “diffuse” away from the porphyry. Using grade shells distorts the grade-tonnage curve and the choice of grade threshold could have a significant effect on the grade-tonnage distribution near the potential economic cut-offs.

Cerro del Gallo Heap Leach Project NI 43-101 Technical Report
January 31, 2020 Page 14-23
While some differences in the data populations are seen in the composite statistics when split out by oxidation domain, contact analysis (mean grade approaching the contacts) suggest that no hard contacts should be employed during estimation. The final estimate is not constrained by any grade shell or oxidation domain and relies on the variogram defined search array and data density to control the grade estimate. Incidentally any definition of a grade shell is also reliant on data density and robust interpretation. The radial framework estimates each 10o sector separately using the same kriging parameters incrementing the “strike” direction by 10o each time. Figure 14.8.1 and Figure 14.8.2 show the 36 sectors that divide the block model from the nominal center of the deposit and also selected ellipsoids in plan and oblique view to demonstrate how the estimation harnesses the radial correlation.
Figure 14.8.1 Plan View: Intrusive, 36 x Sectors for Interpolation Control and Selected Ellipsoids
Source: ZMC (2019)

Cerro del Gallo Heap Leach Project NI 43-101 Technical Report
January 31, 2020 Page 14-24
Figure 14.8.2 Oblique View: Intrusive & Selected Ellipsoids to Control Radial Search
Source: ZMC (2019)
Nearest neighbor block models were also constructed as were inverse distance squared estimates for comparative purposes. Due to previous estimates using isotropic interpolation within a grade shell, these were created as a point of reference but are not considered appropriate as the grade populations clearly display anisotropic relationships. Argonaut geologists created a structural model and there has been some suggestion that mineralization has been offset by post mineral structures and or has been influenced by less conducive host rock boundaries emplaced prior to the mineralizing event. If support can be found for this theory then statistical assessment of these areas as defined by displaced or impervious mineralized boundaries, is needed; potentially sub-domains may provide for improved resource estimates. Interestingly, the un-constrained block model estimate for gold shows indications of potential displacement in the mineralization. Figure 14.8.3 is an example showing what appears to be offsets in the gold mineralization along the modelled structures as well as distinct pods of grade within the structural “blocks.” The grade-tonnage curve, in Figure 14.9.7 through Figure 14.9.9, is the final proposed ordinary kriged estimate within the 2012 resource and reserve pits. (The 2012 pits were used to limit the influence to the core of the estimate).

Cerro del Gallo Heap Leach Project NI 43-101 Technical Report
January 31, 2020 Page 14-25
Figure 14.8.3 Bench 2,120m: Gold Block Estimate and Structures
Source: ZMC (2019)
Interpolation Methods
Composited 3-meter down-hole grade data was interpolated using ordinary kriging (OK) into the block model items AUOK, AGOK and CUOK. No preliminary de-clustering was performed on the data prior to block grade estimation as a regular characteristic of a block model is that it imparts de-clustering on the data; this is also aided by the limitation on maximum composites used per drill-hole (Table 14.7.3 and Table 14.8.1). Ordinary Kriging is considered an appropriate technique for the styles of mineralization at the CdG deposit due to the inherent low observed coefficient of variation.
Parameter Array
Apart from the variogram model, the kriging estimate is usually most sensitive to the composite numbers used. The minimum number of samples used to estimate a block is set to ensure blocks are not populated where too few composites are available; the minimum threshold selected here is based on the Qualified Person’s previous experiences. Various combinations of composite arrays were trailed in 2018, prior to concluding the maximum number of composites used and the maximum number of composites used per hole, in the estimation. To assess an appropriate level of grade “smoothing,” combinations were assessed with the final selections listed in Table 14.7.3. A second pass estimate is used to limit the level of smoothing where data density is greatest; the second pass uses a reduced search and number of composites to estimate
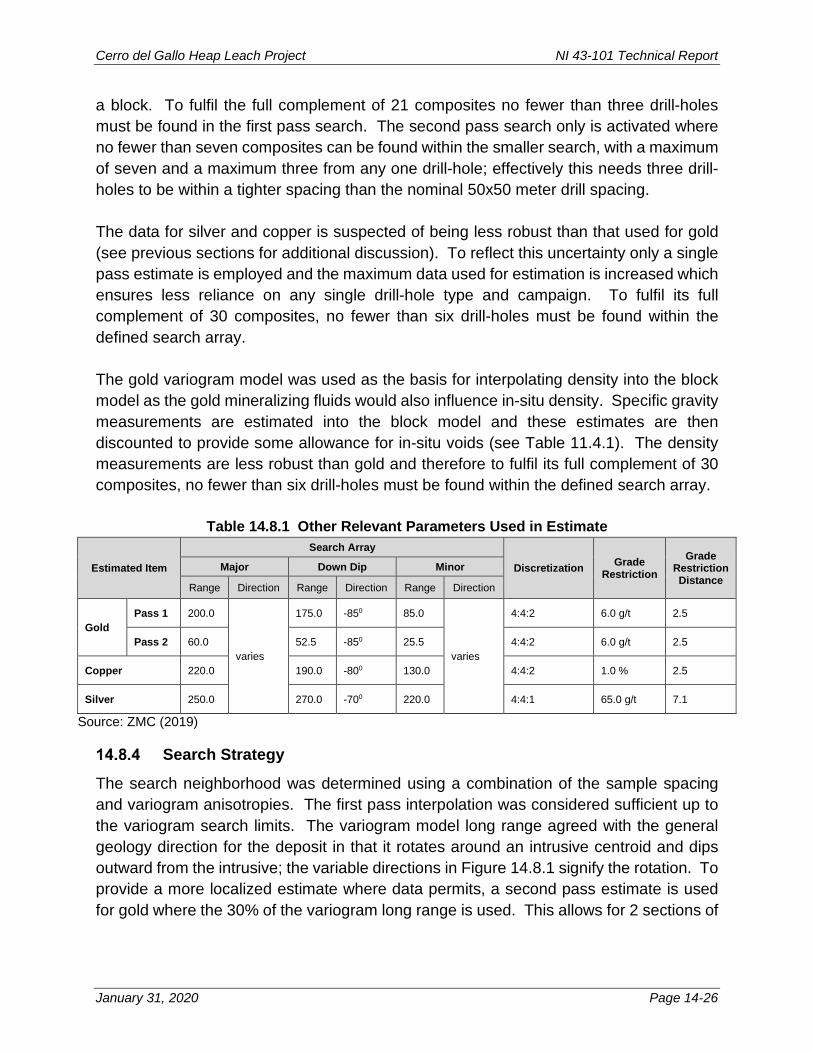
Cerro del Gallo Heap Leach Project NI 43-101 Technical Report
January 31, 2020 Page 14-26
a block. To fulfil the full complement of 21 composites no fewer than three drill-holes must be found in the first pass search. The second pass search only is activated where no fewer than seven composites can be found within the smaller search, with a maximum of seven and a maximum three from any one drill-hole; effectively this needs three drill-holes to be within a tighter spacing than the nominal 50x50 meter drill spacing. The data for silver and copper is suspected of being less robust than that used for gold (see previous sections for additional discussion). To reflect this uncertainty only a single pass estimate is employed and the maximum data used for estimation is increased which ensures less reliance on any single drill-hole type and campaign. To fulfil its full complement of 30 composites, no fewer than six drill-holes must be found within the defined search array. The gold variogram model was used as the basis for interpolating density into the block model as the gold mineralizing fluids would also influence in-situ density. Specific gravity measurements are estimated into the block model and these estimates are then discounted to provide some allowance for in-situ voids (see Table 11.4.1). The density measurements are less robust than gold and therefore to fulfil its full complement of 30 composites, no fewer than six drill-holes must be found within the defined search array.
Table 14.8.1 Other Relevant Parameters Used in Estimate
Estimated Item
Search Array
Discretization Grade Restriction
Grade Restriction Distance
Major Down Dip Minor
Range Direction Range Direction Range Direction
Gold Pass 1 200.0
varies
175.0 -850 85.0
varies
4:4:2 6.0 g/t 2.5
Pass 2 60.0 52.5 -850 25.5 4:4:2 6.0 g/t 2.5
Copper 220.0 190.0 -800 130.0 4:4:2 1.0 % 2.5
Silver 250.0 270.0 -700 220.0 4:4:1 65.0 g/t 7.1
Source: ZMC (2019)
Search Strategy
The search neighborhood was determined using a combination of the sample spacing and variogram anisotropies. The first pass interpolation was considered sufficient up to the variogram search limits. The variogram model long range agreed with the general geology direction for the deposit in that it rotates around an intrusive centroid and dips outward from the intrusive; the variable directions in Figure 14.8.1 signify the rotation. To provide a more localized estimate where data permits, a second pass estimate is used for gold where the 30% of the variogram long range is used. This allows for 2 sections of

Cerro del Gallo Heap Leach Project NI 43-101 Technical Report
January 31, 2020 Page 14-27
data to be used in the estimate and is similar (but not as restrictive) as the modelled variogram short range. The potentially less robust dataset for silver and copper, as described earlier, lead to the decision for no localized second pass to be used in the estimate. To ensure all blocks are interpolated, the gold search ellipsoid is increased four-fold to interpolate density as the density dataset is considerably smaller.
Oxidation Profiles
Argonaut provided Leapfrog generated oxidation models as follows: • Oxide; • Oxide – mixed (predominantly oxide); • Sulfide – mixed (predominantly sulfide); • Sulfide.
These domains are used for mineral resource reporting to accommodate the various processing options under review. The models have been assessed for suitability to aid resource estimation however subtle to no improvement is evident with the use of these models. Density estimates may benefit from the use of the models; however, there are limited data in the upper more oxidized profiles and contact analysis suggest statistics around the boundaries are similar and use of data across boundaries during estimation is beneficial.
Volume
Tonnage calculations include the block volume multiplied by the estimated in-situ bulk density for that block and discounted only near surface where a block is partially below the provided topographic surface. These are further sub-divided into the resource and reserve pit wireframes.
14.9 Model Validation
Nearest neighbor (NN) grade represents a de-clustered average grade of the composite data. The global average grade (0.0 g/t Au cut-off) for NN is checked against the kriged estimate to ensure no bias has been introduced. Grade tonnage curves are produced for alternative estimation methods to provide a check on the kriged estimate and to assess the level of grade smoothing for the kriged estimate compared to the alternatives and the de-clustered curve (Figure 14.9.7 through Figure 14.9.9).

Cerro del Gallo Heap Leach Project NI 43-101 Technical Report
January 31, 2020 Page 14-28
The gold curves are similar for the alternate methods with notable differences seen for the two pass (final) estimate and where a grade shell constraint was used. The two pass estimate results in increasingly higher grades at increasing cut-offs. A clear distortion is seen in the curve when a grade shell constraint is used; from previous work it was seen that the distortion changes position depending on the grade shell constraint used. For both silver and copper the inverse distance squared estimates are marginally less smooth than the ordinary kriged estimate.
Swath Plots
Swath plots (plots of average grade in directional “swaths”), shown in Figure 14.9.1 through Figure 14.9.6, are grouped by elevation and to reflect the NW-SE mineralizing corridor (radial swaths are not possible). This is a good way to investigate the global differences between the final estimate and the de-clustered data. The interpolated gold, silver and copper estimates are as expected smoother than the nearest neighbor (pseudo de-clustered composite) data with a general coherence between the input data and the block estimate.

Cerro del Gallo Heap Leach Project NI 43-101 Technical Report
January 31, 2020 Page 14-29
Figure 14.9.1 Average Block Gold Tonnes-Grades – by Bench (1=2,345m, 111=1,795m)
Source: ZMC (2019)
Figure 14.9.2 Average Block Gold Tonnes-Grades – by 0300 X-Section (1=SE most,
26=NW most)
Source: ZMC (2019)

Cerro del Gallo Heap Leach Project NI 43-101 Technical Report
January 31, 2020 Page 14-30
Figure 14.9.3 Average Block Silver Tonnes-Grades – by Bench (1=2,345m, 111=1,795m)
Source: ZMC (2019)
Figure 14.9.4 Average Block Silver Tonnes-Grades – by 0300 X-Section (1=SE most,
26=NW most)
Source: ZMC (2019)

Cerro del Gallo Heap Leach Project NI 43-101 Technical Report
January 31, 2020 Page 14-31
Figure 14.9.5 Average Block Copper Tonnes-Grades – by Bench (1=2,345m, 111=1,795m)
Source: ZMC (2019)
Figure 14.9.6 Average Block Copper Tonnes-Grades – by 0300 X-Section (1=SE most,
26=NW most
Source: ZMC (2019)

Cerro del Gallo Heap Leach Project NI 43-101 Technical Report
January 31, 2020 Page 14-32
Figure 14.9.7 Gold Grade-Tonnage Plot - Final OK (red) vs De-clustered (black) vs Three Variants – MII only
Source: ZMC (2019)
Figure 14.9.8 Silver Grade-Tonnage Plot - Final OK (red) vs De-clustered (black) vs IDW2(yellow) – MII only
Source: ZMC (2019)

Cerro del Gallo Heap Leach Project NI 43-101 Technical Report
January 31, 2020 Page 14-33
Figure 14.9.9 Copper Grade-Tonnage Plot - Final OK (red) vs De-clustered (black) vs IDW2(yellow) – MII only
Source: ZMC (2019)
14.10 Resource Classification
Classification considers the following: • Data density (drilling) and configuration (sampling direction and distance), • Sample quality, • Metallurgy, • Mining (selectivity), • Sensitivity to the alternative estimated grade distributions, • Depth economics.
The resource is classified as Measured, Indicated and Inferred in accordance with the Canadian Institute of Mining, Metallurgy and Petroleum (CIM) guidelines, as required by NI 43-101. The classification of the CdG resource was based on the average spacing of 3 diamond drill-holes that equates to a drill-spacing of up to 50 meters for Measured, or if RC data contributed to the estimation of the block, 4 drill-holes are required. For Indicated, the average spacing of 3 drill-holes (RC or diamond) is required to be between 50 and up to 100 meters. Inferred requires that the estimate uses 3 drill-holes (RC or diamond) with an average spacing of between 100 and 200 meters. The classification
0.0
0.1
0.2
0.3
0.4
0.5
0.6
0
200
400
600
800
1,000
1,2000.
000
0.02
5
0.05
0
0.07
5
0.10
0
0.12
5
0.15
0
0.17
5
0.20
0
0.22
5
0.25
0
0.27
5
0.30
0
0.32
5
0.35
0
0.37
5
0.40
0
0.42
5
0.45
0
0.47
5
0.50
0
Grad
e abo
ve cu
t-off
Tonn
esM
illio
ns
Cut-off Grade
2019 Copper - Estimation Variants
Tonnes Ordinary Kriging - 2019 2019 - Tonnes Nearest Neighbour 2019 - ID2 Tonnes - 1 pass Grade Ordinary Kriging - 2019 2019 - Grade Nearest Neighbour 2019 - ID2 Grade - 1 pass

Cerro del Gallo Heap Leach Project NI 43-101 Technical Report
January 31, 2020 Page 14-34
based on this criterion is reviewed visually in cross-section and plan to ensure the relevant level of support exists. It was considered appropriate to classify Indicated at twice the spacing of Measured and also Inferred resources at twice the spacing of Indicated. Interpolated blocks beyond the 200-meter spacing are only relevant for internal purposes. While geological continuity is reasonable beyond 200 meters, the majority of the mineralization is at depth where grades are low and current processing options may not be viable. A further, overriding restriction has been imposed with reporting of resources only within reserve and resource optimized cones which reflect current economic parameters and proposed processing options. The drill-spacing thresholds adopted here were based on geological assessment of the deposit and a review of the mineral continuity, as well as benchmarking against common spacing used at other porphyry mineralized deposits.
14.11 Mineral Resources
Cut-off Grades
The cut-off grade used to calculate mineral resource was determined by the mine planners using the parameters reported in Table 14.11.1. For the purposes of this estimate within the USD$1600 pit, the cut-off grade used was 0.25 g/t AuEQ for the two oxide material types and 0.30 g/t AuEQ cut-off grade for the two sulfide material types.
Mining and Selectivity
The CdG project has been planned as an open-pit truck and shovel operation. The truck and shovel method provide reasonable cost benefits and selectivity for this type of deposit. Mining operations are planned to consist of the drilling of blast-holes to a nominal 5-meter bench from which samples are taken for ore polygon definition (grade control). Front end loaders then mine the bench once it has been blasted. For grade interpolation, 3-meter down-hole composites are used reflecting the bench scale selectivity without excessively splitting sampling intervals. The effect of composited grades results in some internal and edge dilution being harnessed in the estimate and reflects the diffuse nature of the mineralization. The block size of 10 meters x 10 meters x 5.0 meters is considered appropriate for potential mining fleet and operations.

Cerro del Gallo Heap Leach Project NI 43-101 Technical Report
January 31, 2020 Page 14-35
Figure 14.11.1 Typical EW Cross-section (looking 2700). Drilling, OK Gold Block Estimate, Modelled Intrusive
Source: ZMC (2019)
Figure 14.11.2 Typical EW Cross-section (looking 2700). Drilling, OK Silver Block
Estimate, Modelled Intrusive
Source: ZMC (2019)

Cerro del Gallo Heap Leach Project NI 43-101 Technical Report
January 31, 2020 Page 14-36
Figure 14.11.3 Typical EW Cross-section (looking 2700). Drilling, OK Copper Block Estimate, Modelled Intrusive
Source: ZMC (2019)
Figure 14.11.4 Typical Bench 2,120m. Drilling and OK Block Estimate; Gold (left), Silver
(center), Copper (right)
Source: ZMC (2019)

Cerro del Gallo Heap Leach Project NI 43-101 Technical Report
January 31, 2020 Page 14-37
Mineral Resources
Mineral resources were tabulated inside a conceptual pit generated based on USD$1600 Au-Equivalent (AuEQ) price. The conceptual pit was generated using costs, Au and Ag prices, recoveries, and slope parameters listed in Table 14.11.1. Note that the conceptual pit was unconstrained for surface features such as drainage (see section on mine design) and no value was assigned to the copper resource.
Table 14.11.1 Conceptual Resource Pit Parameters Metal Price Value Units Au Price $1600 Per oz Ag Price $19.30 Per oz Cu Price None Slope Angle 45 degrees
Source: ZMC (2019)
Value Units Mining Cost - Weathered $ 1.50 $/t Mined Mining Cost - Other $ 1.50 $/t Mined Process Cost - Oxide $ 6.82 $/t Processed Process Cost - Mixed Oxide $ 6.27 $/t Processed Process Cost - Mixed Sulfide $ 7.08 $/t Processed Process Cost - Fresh $ 5.70 $/t Processed G&A Cost per Tonne $ 1.55 $/t Processed Environmental Cost $ - $/t Processed NSR Royalty 4.30%
Au Ag Cu Leach Recovery - Oxide 74.00% 60.00% 11.50% Leach Recovery - Mixed Oxides 69.50% 78.50% 27.50%
Leach Recovery - Mixed Sulfides 59.40% 63.80% 30.60%
Leach Recovery - Fresh 57.50% 40.00% 16.50% Refining Cost ($/oz Produced) $ 5.00 $ - $ - Payable 100% 100% 0%
Source: ZMC (2019) Table 14.11.2 summarizes the undiluted Measured, Indicated, and Inferred Mineral Resources constrained to the USD$1600 Au-EQ conceptual pit at a 0.25 g/t AuEQ cut-off grade for the two oxide material types and at a 0.30 g/t AuEQ cut-off grade for the two

Cerro del Gallo Heap Leach Project NI 43-101 Technical Report
January 31, 2020 Page 14-38
sulfide material types. That cut-off grade was determined using the price, recovery, and cost data summarized in Table 14.11.1.
Table 14.11.2 Undiluted Contained Mineral Resources with $1,600 Conceptual Pit MEASURED MINERAL RESOURCES
Material Type Tonnes (000's)
Au (g/t)
Ag (g/t)
Cu %
Au ozs (000's)
Ag ozs (000's)
Cu t (000's)
Oxide 7.1 0.47 15.8 0.10 107 3,607 7 Transitional (Oxide Mixed) 5.0 0.43 10.3 0.07 70 1,658 4 Transitional (Sulfide Mixed) 37.8 0.53 13.1 0.10 645 15,917 36 Sulfide 71.7 0.47 13.0 0.10 1,077 29,904 74 Total - All Material Types 121.6 0.49 13.1 0.10 1,899 51,086 121
INDICATED MINERAL RESOURCES
Material Type Tonnes (000's)
Au (g/t)
Ag (g/t)
Cu %
Au ozs (000's)
Ag ozs (000's)
Cu t (000's)
Oxide 3.2 0.36 15.3 0.08 38 1,592 3 Transitional (Oxide Mixed) 8.8 0.28 10.8 0.07 79 3,033 6 Transitional (Sulfide Mixed) 22.8 0.40 11.5 0.09 296 8,436 20 Sulfide 45.5 0.38 10.2 0.08 552 14,956 38 Total - All Material Types 80.4 0.37 10.8 0.08 965 28,017 66
MEASURED + INDICATED MINERAL RESOURCES
Material Type Tonnes (000's)
Au (g/t)
Ag (g/t)
Cu %
Au ozs (000's)
Ag ozs (000's)
Cu t (000's)
Oxide 10.3 0.44 15.7 0.09 145 5,199 9 Transitional (Oxide Mixed) 13.8 0.33 10.6 0.07 148 4,691 9 Transitional (Sulfide Mixed) 60.7 0.48 12.5 0.09 941 24,353 56 Sulfide 117.2 0.43 11.9 0.10 1,629 44,859 112 Total - All Material Types 201.9 0.44 12.2 0.09 2,864 79,103 187
INFERRED MINERAL RESOURCES
Material Type Tonnes (000's)
Au (g/t)
Ag (g/t)
Cu %
Au ozs (000's)
Ag ozs (000's)
Cu t (000's)
Oxide 0.1 0.36 13.1 0.09 1 22 0 Transitional (Oxide Mixed) 0.5 0.18 13.2 0.07 3 214 0 Transitional (Sulfide Mixed) 3.6 0.50 12.7 0.10 58 1,455 4 Sulfide 1.0 0.32 8.1 0.06 10 255 1 Total - All Material Types 5.1 0.43 11.9 0.09 71 1,947 5
Note: Totals may not add due to rounding. Source: ZMC (2019)

Cerro del Gallo Heap Leach Project NI 43-101 Technical Report
January 31, 2020 Page 14-39
14.12 General Discussion – Recommendations
Reduce Risk
• Review and assess the need to re-assay 2013 Ag and Cu assays done by the 0.5-gram ICP method. The re-assay should be done using the 5-gram AA method / 3 acid digestion (SGS AAS21E).
• If the re-assay above is completed, revise the geostatistics and update variogram models if necessary. The current high nugget effect seen in the silver data may be due to inclusion of the small sample sourcing the 2013 data which is shown to have a higher variance.
• Audit the remaining 75% of down-hole survey data. • Infill drill the NNE part of the deposit, in an around the peak of the hill. Access to
this area is challenging however the scale of the mineralization in this area is reliant on very few drill-holes yet it will be some of the first ore to be mined. Significant sections are designated to Inferred.
• Select an area of perceived higher-grade variance and reduce the drill spacing to say 25x25 meters or less to assess the short scale variance.
• Collect several hundred more density measurements in the oxide profile. The number of data in this profile are disproportionately low relative to the potential ore that it sources.
• The oxide domains, intrusive lithology and grade models generated in Leapfrog are overly complex given the nominal 50x50-meter drill-hole spacing. These need to be smoothed.
• Develop the structural planes into domains and assess the validity of the implied fault displacements using geostatistics.
• The surface topography should be extended, particularly to the east and NE where higher silver grades are not currently being captured in the reporting.
• Further assess the multi-variate statistics to better understand the relationship between the three potential economic metals.
• Further assess the level of grade smoothing in the estimate. Geostatistical methods are available to carry out this assessment.
• Even though silver has been estimated with the same radial framework as Au and Cu, the resulting block estimate shows the influence of the NW orientated structures. Further assessment is warranted of whether the current estimation framework is optimal.
To Increase Resource
• Infill drill the NNE part of the deposit, in and around the peak of the hill. Access to this area is challenging however the scale of the mineralization in this area is reliant on very few drill-holes yet it will be some of the first ore to be mined. Significant

Cerro del Gallo Heap Leach Project NI 43-101 Technical Report
January 31, 2020 Page 14-40
sections are designated to Inferred and could be upgraded with infill drilling or systematic trenching.
• As well as the peak of the hill, other parts of the deposit are estimated with several hundred meters between drill-intercepts that vary from medium/higher grades to lower grades. Infilling these areas could consolidate the higher grades in the block model (see Figure 14.12.1 below).
Figure 14.12.1 Cross-section Looking West. Areas of Sparse Drilling.
Source: ZMC (2019)

Cerro del Gallo Heap Leach Project NI 43-101 Technical Report
January 31, 2020 Page 15-1
15 Mineral Reserve Estimate
15.1 Introduction
Mr. Dyer has used Measured and Indicated resources as the basis to define reserves for the Cerro de Gallo project. Reserve definition was done by first identifying ultimate pit limits using economic parameters and pit optimization techniques. The resulting optimized pit shells were then used for guidance in pit design to allow access for equipment and personnel. Mr. Dyer then considered mining, processing, metallurgical, infrastructure, economic, marketing, legal, environmental, social and governmental factors as modifying factors for defining the estimated reserves. The mineral reserves are based on the mineral resource block model with an effective date of October 24, 2019 that was provided to MDA by Argonaut. The resource block model was created by Neb Zurkic of Zurkic Mining Consultants. Mr. Dyer has used the Measured and Indicated mineral resources, as provided, for conversion to Proven and Probable mineral reserves.
15.2 Pit Optimization
Pit optimization was conducted using Geovia’s Whittle software (version 4.7) to define pit limits with input for economic and slope parameters. Economic parameters are based on inputs from Argonaut and their consultants. Initial mining costs were based on Argonaut’s experience with mining at their operations elsewhere in Mexico. The final mining costs from this study were used to re-run the pit optimizations and confirm the economic viability of the pits that were designed. Optimization used only Measured and Indicated material for processing. All Inferred material was considered to be waste. Varying gold prices were used to evaluate the sensitivity of the deposit to the price of gold, as well as to develop a strategy for optimizing project cash flow. To achieve cash-flow optimization, mining phases or push backs were developed using the guidance of Whittle pit shells at lower gold prices. Note that copper is carried in the optimization but is given a 0% recovery and $0.00 per pound copper yielding zero value from copper for pit optimizations.

Cerro del Gallo Heap Leach Project NI 43-101 Technical Report
January 31, 2020 Page 15-2
Economic Parameters
Economic parameters are provided in Table 15.2.1. The mining cost shown is based on the initial estimates. The cost for weathered material was discounted in anticipation of reduced drilling and blasting costs due to the softer nature of the material. Final PFS mining costs were estimated at $1.75 per tonne mined. The cost shown in Table 15.2.1 was used only for the optimization.
Table 15.2.1 Economic Parameters
Source: MDA (2019)
Slope Parameters
Recommendations for slope parameters were provided by Ken Meyers of the Mines Group Inc. (“Mines Group”) of Reno, Nevada. The recommendations as used for pit design are shown in Table 15.2.2. The maximum inner-ramp angle (“IRA”) recommendations ranged from 45° to 49°. For pit optimization, a 45° angle was used for all sectors which resulted in an optimized pit shell that was reasonable for pit design with the inclusion of ramps.
Pit Limitations
A major drainage runs along the northwest side of the ultimate pit. For the purpose of the pit optimization, a boundary was designed that is offset approximately 8 to 10 meters from the center of the drainage toward the deposit. The boundary was used directly in Whittle as a constraint to ensure the pit would not encroach on the drainage. This boundary is shown in red with the ultimate pit design in Figure 15.2.1.
Value UnitsMining Cost - Weathered 1.50$ $/t MinedMining Cost - Other 1.50$ $/t MinedLeach Cost - Oxide 6.82$ $/t ProcessedLeach Cost - Mixed Oxide 6.27$ $/t ProcessedLeach Cost - Mixed Sulfide 7.08$ $/t ProcessedLeach Cost - Fresh 5.70$ $/t ProcessedG&A Cost per Tonne 1.55$ $/t ProcessedNSR Royatly 4.3%
Au Ag CuLeach Recovery - Oxide 74.0% 60.0% 0.0%Leach Recovery - Mixed Oxides 69.5% 78.5% 0.0%Leach Recovery - Mixed Sulfides 59.4% 63.8% 0.0%Leach Recovery - Fresh 57.5% 40.0% 0.0%Payable 100% 100% 0.0%

Cerro del Gallo Heap Leach Project NI 43-101 Technical Report
January 31, 2020 Page 15-3
Figure 15.2.1 Drainage Boundary and Optimized Pit
Source: MDA (2019)
Pit-Optimization Results
Pit optimizations were run using Whittle™ software (version 4.7). Inputs into Whittle included the resource block model along with the economic and geometric parameters previously discussed. Pit optimizations for mineral reserve definition used only Measured and Indicated resources for processing and all Inferred material was considered as waste. Ultimate pit shells were selected from the Whittle results for internal pit phase and final design. Pit optimizations were completed using gold prices of $300 to $2,000 per ounce Au in increments of $20 per ounce in order to analyze the deposit’s sensitivity to gold prices. Pit optimization results for $100 per ounce increments are shown in Table 15.2.2 with the $1,200 per ounce pit shell highlighted as a target price for the analysis. While copper is considered a resource, the value is not significant to the project. For this reason, a $0.00 metal price for copper was used for pit optimizations.

Cerro del Gallo Heap Leach Project NI 43-101 Technical Report
January 31, 2020 Page 15-4
Table 15.2.2 Whittle Pit Optimization Results
Source: MDA (2019)
Pit-Shell Selection for Ultimate Pit Limits and Resources
The selections of the ultimate pit and pit phases were done as a two-step process. The first step was to optimize a set of pit shells based on varying a revenue factor as described above. This was done in Whittle using a Lerchs-Grossman (“LG”) algorithm. The second step of the process was to use the Pit by Pit (“PbP”) analysis tool in Whittle to generate a discounted operating cash flow (note that capital is not included). This used a rough scheduling by pit phase for each pit shell to generate the discounted value for the pit. The program develops three different discounted values: best, worst, and specified. The best-case value uses each of the pit shells as pit phases or pushbacks. For example, when evaluating pit 20, there would be 19 pushbacks mined prior to pit 20, and the resulting schedule takes advantage of mining more valuable material up front to improve the discounted value. Evaluating pit 21 would have 20 pushbacks; pit 22 would have 21 pushbacks and so on. Note that this is not a realistic case as the incremental pushbacks would not have enough mining width between them to be able to mine appropriately, but this does help to define the maximum potential discounted operating cash flow. The worst case does not use any pushbacks in determining the discounted value for each of the pit shells. Thus, each pit shell is evaluated as if mining a single pit from top to bottom. This does not provide the advantage of mining more valuable material first, so it generally provides a lower discounted value than that of the best case.
Metal Prices Material Processed Waste Total StripPit $/oz Au $/oz Ag K Tonnes oz Au/t K Ozs Au oz Ag/t K Ozs Ag % Cu K Lbs Cu K Tonnes K Tonnes Ratio
1 300$ 3.63$ 95 1.64 5 12.71 39 0.096 91 19 114 0.20 6 400$ 4.83$ 1,093 1.32 47 14.49 509 0.069 751 544 1,638 0.50
11 500$ 6.04$ 4,088 1.12 147 13.54 1,780 0.070 2,873 1,912 6,001 0.47 16 600$ 7.25$ 11,204 0.96 347 13.47 4,852 0.076 8,500 6,171 17,375 0.55 21 700$ 8.46$ 28,412 0.84 763 13.55 12,379 0.083 23,482 23,847 52,259 0.84 26 800$ 9.67$ 38,911 0.77 960 13.64 17,060 0.085 32,915 27,440 66,351 0.71 31 900$ 10.88$ 48,868 0.71 1,111 13.71 21,547 0.087 42,364 29,155 78,023 0.60 36 1,000$ 12.08$ 60,983 0.65 1,278 13.57 26,614 0.088 53,715 33,285 94,268 0.55 41 1,100$ 13.29$ 78,688 0.60 1,526 13.13 33,210 0.092 72,202 48,591 127,279 0.62 46 1,200$ 14.50$ 93,965 0.56 1,684 13.21 39,920 0.093 87,523 55,319 149,284 0.59 51 1,300$ 15.71$ 114,602 0.52 1,914 13.05 48,081 0.095 108,571 77,558 192,160 0.68 56 1,400$ 16.92$ 139,303 0.48 2,131 12.89 57,726 0.093 129,019 90,477 229,780 0.65 61 1,500$ 18.13$ 157,617 0.45 2,281 12.68 64,232 0.092 144,978 97,464 255,081 0.62 66 1,600$ 19.33$ 171,761 0.43 2,387 12.50 69,049 0.092 157,462 103,690 275,451 0.60 71 1,700$ 20.54$ 184,080 0.42 2,470 12.36 73,172 0.092 168,868 105,786 289,865 0.57 76 1,800$ 21.75$ 195,547 0.40 2,543 12.22 76,843 0.092 179,303 108,074 303,620 0.55 81 1,900$ 22.96$ 207,134 0.39 2,613 12.09 80,514 0.092 189,873 111,222 318,356 0.54 86 2,000$ 24.17$ 217,381 0.38 2,668 11.99 83,788 0.092 199,678 112,096 329,477 0.52

Cerro del Gallo Heap Leach Project NI 43-101 Technical Report
January 31, 2020 Page 15-5
The specified case allows the user to specify pit shells to be used as pushbacks and then schedules the pushbacks and calculates the discounted cash flow. This is more realistic than the best case as it allows for more mining width, though the final pit design will have to ensure that appropriate mining width is available. The specified case helps to determine the ultimate pit limits to design to, as well as to specify guidelines for designing pit phases. CdG has limited space for waste dumps and leach processing. The limits provided to MDA are 92 million tonnes of leach and 52 million tonnes of waste with some give or take on these amounts. Thus, the ultimate pit limit is based on the selection of pit shells 45 and 46 that are near these limits. Table 15.2.3 shows the Pit by Pit results and Figure 15.2.2 shows the Pit by Pit graph for CdG.
Table 15.2.3 Pit by Pit Results
Source: MDA (2019)

Cerro del Gallo Heap Leach Project NI 43-101 Technical Report
January 31, 2020 Page 15-6
Figure 15.2.2 Feasibility Case Whittle Pit by Pit Graph
Source: MDA (2019)
15.3 Pit Designs
Pit designs were completed for the CdG project, including an ultimate pit and internal pits. The ultimate pit was designed to allow mining of economic material, identified by Whittle pit optimization, while providing safe access for people and equipment. The Phase 1 pit was designed primarily in waste. This was done to provide waste material needed for construction. Phase 2 and 3 pits are within the ultimate pit and were designed to enhance the project by mining higher-value blocks from the resource model earlier in the mine life. The following sections describe the parameters used for the pit designs and details the resulting designs and reserves.
Bench Height
Pit designs were created using five-meter benches for mining. This corresponds to the resource model block heights, and MDA believes this to be reasonable with respect to dilution and equipment anticipated to be used to mine the CdG deposit.

Cerro del Gallo Heap Leach Project NI 43-101 Technical Report
January 31, 2020 Page 15-7
Pit Slopes
Slope parameters were based on studies provided by Ken Meyers of the Mines Group. The recommendations were given for seven sectors around the anticipated pit in the form of maximum IRA, bench-face angle (“BFA”), bench heights (“BH”), and catch bench widths (“Berms”). In the case of these parameters, the BH is given as the height between catch benches. It is assumed that a catch bench will be added every third bench making the BH for slope parameters 15 meters. The berm widths were rounded to the nearest half meter, and the resulting net IRA was calculated from the BH, BFA, and berm. The slope parameters used for pit design are shown in Table 15.3.1 and Figure 15.3.1.
Table 15.3.1 Pit Design Slope Parameters
Sector BFA (⁰) Max IRA (⁰) BH Berms (m) Net IRA (⁰) A1 67 48 15 7.5 47.2 A2 72 49 15 8.0 49.4 A3 64 45 15 7.5 45.4 B1 79 48 15 10.5 48.2 B2 67 47 15 7.5 47.2 C1 75 49 15 9.0 49.0 C2 81 48 15 11.0 48.3
Source: MDA (2019)

Cerro del Gallo Heap Leach Project NI 43-101 Technical Report
January 31, 2020 Page 15-8
Figure 15.3.1 Slope Sectors Provided by Mines Group, 2019
Note: dark green line is the design pit limit; red lines show faults. Source: MDA (2019)
Haulage Roads
Ramps were designed to have a maximum centerline gradient of 10%. In areas where the ramps may curve along the outside of the pit, the inside gradient may be up to 11% or 12% for short distances. Mining will start in Phase 1 at the base of the hill in a relatively flat area. This will be done to provide waste material for construction purposes. Phase 2 mining will begin on top of the hill requiring downhill hauls as the upper portion is mined. The haul road will be cut into the side of the hill within the Phase 3 pit and allow access for both Phase 2 and 3. Phase 4 will use the phase 3 roads. While additional roads have not been

Cerro del Gallo Heap Leach Project NI 43-101 Technical Report
January 31, 2020 Page 15-9
designed to be left in the high-wall, it is anticipated that operations will maintain narrow pickup roads from berm to berm to maintain access to the top of the hill after mining. Ramp width considered the widest truck width to be used in mine planning. Mine plans use CAT 777 91-tonne capacity trucks, which have operating widths of 7.0 meters. For haul roads inside of the pit, a single safety berm on the pit side of the roadway will be required to be at least half the height of the tire of the largest vehicle that uses the road. MDA assumes that safety berms can be created at a 1.5 horizontal to 1 vertical slope using run-of-mine material. A flat top on the berms of 0.25 meters is assumed, and a berm height of 1.5 meters provides half of the truck tire heights plus 10% for CAT 777 trucks. The 10% addition is used to ensure that the berm height exceeds half of the truck tire height in all cases. A ramp design width of 28 meters was used inside of pits where two-way traffic is expected, which after subtracting for safety berms provides 3.32 times the truck width for running room. In lower portions of the pits where haulage requirements allow use of one-way traffic, haul roads are designed to a width of 17 meters. This provides 1.75 times the width of CAT 777 trucks for running width. Haul roads outside of pit designs have been designed to be 33 meters wide to account for an additional safety berm and 3.4 times the width of CAT 777 trucks for running room.
Ultimate Pit
As noted in section 15.2.5, pit shells 45 and 46 were selected based on the total tonnages of ore and waste. These pit shells were used for guidance when designing the ultimate pit. In addition, the block model grades were displayed while creating the design to aid in ramp placement and pit step-out decisions. The ultimate pit design is shown in Figure 15.3.2.

Cerro del Gallo Heap Leach Project NI 43-101 Technical Report
January 31, 2020 Page 15-10
Figure 15.3.2 Ultimate Pit Design
Source: MDA (2019)
Pit Phasing
As previously mentioned, Phase 1 was designed to create waste mining for construction purposes. Phases 2 and 3 were created to improve the project’s Net Present Value (“NPV”) and mine the higher portion of the hill. The ultimate pit is achieved by mining all three of the previous phases followed by the final Phase 4 pit. Phase 1, 2, and 3 are shown in Figure 15.3.3, Figure 15.3.4, and Figure 15.3.5, respectively. Phase 4 mining is shown as the ultimate pit in Figure 15.3.2.

Cerro del Gallo Heap Leach Project NI 43-101 Technical Report
January 31, 2020 Page 15-11
Figure 15.3.3 Phase 1 Pit Design – Waste Pit
Source: MDA (2019)
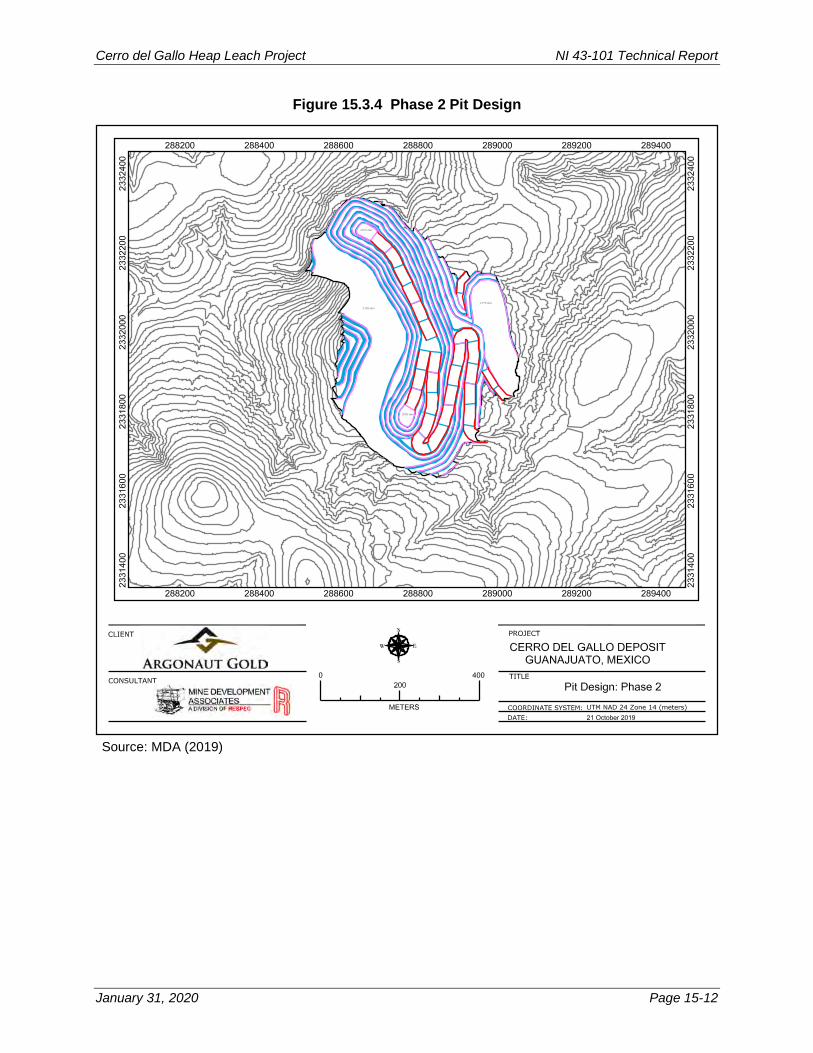
Cerro del Gallo Heap Leach Project NI 43-101 Technical Report
January 31, 2020 Page 15-12
Figure 15.3.4 Phase 2 Pit Design
Source: MDA (2019)

Cerro del Gallo Heap Leach Project NI 43-101 Technical Report
January 31, 2020 Page 15-13
Figure 15.3.5 Phase 3 Pit Design
Source: MDA (2019)
15.4 Cutoff Grade
Cutoff grades have been calculated using the economic parameters shown in Section 2.2.1 with $1,200 per ounce Au and $14.50 ounce Ag. Internal cutoff grades have been calculated for oxide, mixed oxide, mixed sulfide, and fresh material, and are shown in Table 15.4.1. The highlighted cutoff grades are used for scheduling and reporting of resources inside of the pit.

Cerro del Gallo Heap Leach Project NI 43-101 Technical Report
January 31, 2020 Page 15-14
Table 15.4.1 Cutoff Grades
Source: MDA (2019)
Cutoff grades were applied to gold equivalent (“AuEq”) grades. The AuEq grade calculation takes into consideration gold and silver recoveries and the price of metals. The AuEq grade is calculated as follows:
𝐴𝐴𝐴𝐴𝐴𝐴𝐴𝐴 = 𝑔𝑔 𝐴𝐴𝐴𝐴/𝑡𝑡 +𝑔𝑔 𝐴𝐴𝑔𝑔/𝑡𝑡
𝐴𝐴𝐴𝐴𝐴𝐴𝐴𝐴 𝐹𝐹𝐹𝐹𝐹𝐹𝑡𝑡
Where:
𝐴𝐴𝐴𝐴𝐴𝐴𝐴𝐴 𝐹𝐹𝐹𝐹𝐹𝐹𝑡𝑡 =𝐴𝐴𝐴𝐴𝐴𝐴𝐴𝐴𝐴𝐴𝐹𝐹𝐴𝐴 − 𝐴𝐴𝐴𝐴𝐴𝐴𝐴𝐴𝐴𝐴𝐴𝐴𝐴𝐴𝐴𝐴𝐴𝐴𝐴𝐴𝐴𝐴𝑡𝑡𝐴𝐴𝑔𝑔𝐴𝐴𝐴𝐴𝐴𝐴𝐹𝐹𝐴𝐴 − 𝐴𝐴𝑔𝑔𝐴𝐴𝐴𝐴𝐴𝐴𝐴𝐴𝐴𝐴𝐴𝐴𝐴𝐴𝐴𝐴𝐴𝐴𝑡𝑡
∗𝐴𝐴𝐴𝐴𝐴𝐴𝐴𝐴𝐹𝐹𝐴𝐴𝐴𝐴𝐴𝐴𝐴𝐴𝐴𝐴𝐴𝐴𝑔𝑔𝐴𝐴𝐴𝐴𝐹𝐹𝐴𝐴𝐴𝐴𝐴𝐴𝐴𝐴𝐴𝐴
The resulting factors are 102, 73, 77, and 119 for oxide, mixed oxide, mixed sulfide, and fresh rock, respectively. Note that no copper grades are considered in the calculation of AuEq grades.
15.5 Dilution
The resource block model used to report resources and reserves has block sizes of 10 meters (X) by 10 meters (Y) by 5 meters (Z). The model was estimated based on this block size, and this model was used to define the ultimate pit limit and to estimate Proven and Probable reserves. MDA considers the 10-meter by 10-meter by 5-meter block size to be reasonable for mining the deposit with the equipment that has been selected and believes that this represents an appropriate amount of dilution for statement of reserves.
COG (g Au/t) 6.0 Million TPY Au Price Oxide Mixed Oxide Mixed Sulfide Fresh
1,000$ 0.37 0.37 0.47 0.41 1,025$ 0.36 0.36 0.46 0.40 1,050$ 0.35 0.35 0.45 0.39 1,075$ 0.34 0.34 0.44 0.38 1,100$ 0.33 0.33 0.43 0.37 1,125$ 0.33 0.33 0.42 0.36 1,150$ 0.32 0.32 0.41 0.36 1,175$ 0.31 0.31 0.40 0.35 1,200$ 0.31 0.30 0.39 0.34 1,225$ 0.30 0.30 0.39 0.33 1,250$ 0.29 0.29 0.38 0.33 1,275$ 0.29 0.29 0.37 0.32 1,300$ 0.28 0.28 0.36 0.32

Cerro del Gallo Heap Leach Project NI 43-101 Technical Report
January 31, 2020 Page 15-15
15.6 Reserves and Resources
Mineral reserves for the project were developed by applying relevant economic criteria in order to define the economically extractable portions of the resources. Mr. Dyer developed the reserves to meet NI 43-101 standards. The NI 43-101 standards rely on the CIM Definition Standards on Mineral Resources and Mineral Reserves adopted by the CIM council. CIM standards define Proven and Probable Reserves as:
Mineral Reserve Mineral Reserves are sub-divided in order of increasing confidence into Probable Mineral Reserves and Proven Mineral Reserves. A Probable Mineral Reserve has a lower level of confidence than a Proven Mineral Reserve. A Mineral Reserve is the economically mineable part of a Measured and/or Indicated Mineral Resource. It includes diluting materials and allowances for losses, which may occur when the material is mined or extracted and is defined by studies at Pre-Feasibility or Feasibility level as appropriate that include application of Modifying Factors. Such studies demonstrate that, at the time of reporting, extraction could reasonably be justified. The reference point at which Mineral Reserves are defined, usually the point where the ore is delivered to the processing plant, must be stated. It is important that, in all situations where the reference point is different, such as for a saleable product, a clarifying statement is included to ensure that the reader is fully informed as to what is being reported. The public disclosure of a Mineral Reserve must be demonstrated by a Pre-Feasibility Study or Feasibility Study. Mineral Reserves are those parts of Mineral Resources which, after the application of all mining factors, result in an estimated tonnage and grade which, in the opinion of the Qualified Person(s) making the estimates, is the basis of an economically viable project after taking account of all relevant Modifying Factors. Mineral Reserves are inclusive of diluting material that will be mined in conjunction with the Mineral Reserves and delivered to the treatment plant or equivalent facility. The term ‘Mineral Reserve’ need not necessarily signify that extraction facilities are in place or operative or that all governmental approvals have been received. It does signify that there are reasonable expectations of such approvals.
Cerro del Gallo Heap Leach Project NI 43-101 Technical Report
January 31, 2020 Page 15-16
‘Reference point’ refers to the mining or process point at which the Qualified Person prepares a Mineral Reserve. For example, most metal deposits disclose mineral reserves with a “mill feed” reference point. In these cases, reserves are reported as mined ore delivered to the plant and do not include reductions attributed to anticipated plant losses. In contrast, coal reserves have traditionally been reported as tonnes of “clean coal.” In this coal example, reserves are reported as a “saleable product” reference point and include reductions for plant yield (recovery). The Qualified Person must clearly state the ‘reference point’ used in the Mineral Reserve estimate.
Probable Mineral Reserve A Probable Mineral Reserve is the economically mineable part of an Indicated, and in some circumstances, a Measured Mineral Resource. The confidence in the Modifying Factors applying to a Probable Mineral Reserve is lower than that applying to a Proven Mineral Reserve. The Qualified Person(s) may elect, to convert Measured Mineral Resources to Probable Mineral Reserves if the confidence in the Modifying Factors is lower than that applied to a Proven Mineral Reserve. Probable Mineral Reserve estimates must be demonstrated to be economic, at the time of reporting, by at least a Pre-Feasibility Study.
Proven Mineral Reserve A Proven Mineral Reserve is the economically mineable part of a Measured Mineral Resource. A Proven Mineral Reserve implies a high degree of confidence in the Modifying Factors. Application of the Proven Mineral Reserve category implies that the Qualified Person has the highest degree of confidence in the estimate with the consequent expectation in the minds of the readers of the report. The term should be restricted to that part of the deposit where production planning is taking place and for which any variation in the estimate would not significantly affect the potential economic viability of the deposit. Proven Mineral Reserve estimates must be demonstrated to be economic, at the time of reporting, by at least a Pre-Feasibility Study. Within the CIM Definition standards the term Proved Mineral Reserve is an equivalent term to a Proven Mineral Reserve.
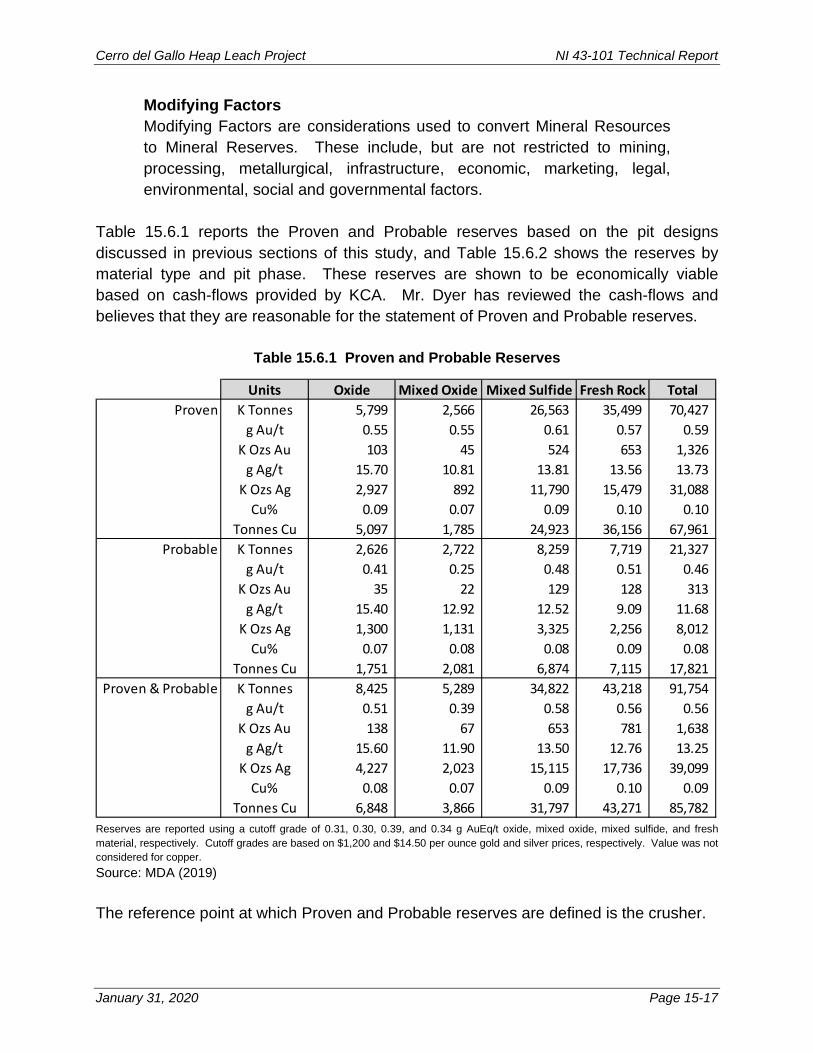
Cerro del Gallo Heap Leach Project NI 43-101 Technical Report
January 31, 2020 Page 15-17
Modifying Factors Modifying Factors are considerations used to convert Mineral Resources to Mineral Reserves. These include, but are not restricted to mining, processing, metallurgical, infrastructure, economic, marketing, legal, environmental, social and governmental factors.
Table 15.6.1 reports the Proven and Probable reserves based on the pit designs discussed in previous sections of this study, and Table 15.6.2 shows the reserves by material type and pit phase. These reserves are shown to be economically viable based on cash-flows provided by KCA. Mr. Dyer has reviewed the cash-flows and believes that they are reasonable for the statement of Proven and Probable reserves.
Table 15.6.1 Proven and Probable Reserves
Reserves are reported using a cutoff grade of 0.31, 0.30, 0.39, and 0.34 g AuEq/t oxide, mixed oxide, mixed sulfide, and fresh material, respectively. Cutoff grades are based on $1,200 and $14.50 per ounce gold and silver prices, respectively. Value was not considered for copper. Source: MDA (2019) The reference point at which Proven and Probable reserves are defined is the crusher.
Units Oxide Mixed Oxide Mixed Sulfide Fresh Rock TotalProven K Tonnes 5,799 2,566 26,563 35,499 70,427
g Au/t 0.55 0.55 0.61 0.57 0.59 K Ozs Au 103 45 524 653 1,326
g Ag/t 15.70 10.81 13.81 13.56 13.73 K Ozs Ag 2,927 892 11,790 15,479 31,088
Cu% 0.09 0.07 0.09 0.10 0.10 Tonnes Cu 5,097 1,785 24,923 36,156 67,961
Probable K Tonnes 2,626 2,722 8,259 7,719 21,327 g Au/t 0.41 0.25 0.48 0.51 0.46
K Ozs Au 35 22 129 128 313 g Ag/t 15.40 12.92 12.52 9.09 11.68
K Ozs Ag 1,300 1,131 3,325 2,256 8,012 Cu% 0.07 0.08 0.08 0.09 0.08
Tonnes Cu 1,751 2,081 6,874 7,115 17,821 Proven & Probable K Tonnes 8,425 5,289 34,822 43,218 91,754
g Au/t 0.51 0.39 0.58 0.56 0.56 K Ozs Au 138 67 653 781 1,638
g Ag/t 15.60 11.90 13.50 12.76 13.25 K Ozs Ag 4,227 2,023 15,115 17,736 39,099
Cu% 0.08 0.07 0.09 0.10 0.09 Tonnes Cu 6,848 3,866 31,797 43,271 85,782

Cerro del Gallo Heap Leach Project NI 43-101 Technical Report
January 31, 2020 Page 15-18
Table 15.6.2 Proven and Probable Reserves by Pit Phase
Reserves are reported using cutoff grades of 0.31, 0.30, 0.39, and 0.34 g AuEq/t for oxide, mixed oxide, mixed sulfide and fresh material, respectively. Cutoff grades are based on $1,200 and $14.50 per ounce gold and silver, respectively. Value was not considered for copper. Source: MDA (2019)
The reference point at which Proven and Probable reserves are defined is the crusher.
Poven and Probable Reserves and Associated WasteUnits Phase 1 Phase 2 Phase 3 Phase 4 Total
Oxide K Tonnes 242 6,610 1,564 10 8,425 g Au/t 0.12 0.53 0.47 0.07 0.51
K Ozs Au 1 114 24 0 138 g Ag/t 23.90 14.88 17.27 29.43 15.60
K Ozs Ag 186 3,163 868 9 4,227 Cu% 0.20 0.07 0.12 0.23 0.08
Tonnes Cu 472 4,437 1,916 22 6,848 Mixed Oxide K Tonnes - 2,861 595 1,833 5,289
g Au/t - 0.43 0.32 0.36 0.39 K Ozs Au - 40 6 21 67
g Ag/t - 12.63 14.34 9.95 11.90 K Ozs Ag - 1,162 274 587 2,023
Cu% - 0.07 0.07 0.08 0.07 Tonnes Cu - 1,991 444 1,431 3,866
Mixed Sulfide K Tonnes 62 22,780 4,763 7,217 34,822 g Au/t 0.11 0.61 0.58 0.51 0.58
K Ozs Au 0 445 88 118 653 g Ag/t 26.45 13.59 13.36 13.21 13.50
K Ozs Ag 53 9,951 2,046 3,065 15,115 Cu% 0.19 0.09 0.09 0.11 0.09
Tonnes Cu 120 19,503 4,513 7,660 31,797 Fresh Rock K Tonnes - 13,432 6,786 23,000 43,218
g Au/t - 0.63 0.54 0.53 0.56 K Ozs Au - 272 118 391 781
g Ag/t - 13.85 14.05 11.75 12.76 K Ozs Ag - 5,980 3,065 8,690 17,736
Cu% - 0.10 0.09 0.10 0.10 Tonnes Cu - 13,322 6,411 23,539 43,271
Total K Tonnes 304 45,684 13,708 32,059 91,754 Proven and g Au/t 0.12 0.59 0.54 0.51 0.56
Probable K Ozs Au 1 871 236 530 1,638 g Ag/t 24.42 13.79 14.19 11.98 13.25
K Ozs Ag 239 20,255 6,254 12,351 39,099 Cu% 0.19 0.09 0.10 0.10 0.09
Tonnes Cu 592 39,253 13,284 32,653 85,782 Waste K Tonnes 2,040 12,074 10,097 33,571 57,783
Total Mined K Tonnes 2,344 57,758 23,805 65,630 149,537 Strip Ratio W:O 6.70 0.26 0.74 1.05 0.63

Cerro del Gallo Heap Leach Project NI 43-101 Technical Report
January 31, 2020 Page 16-1
16 Mining Methods
16.1 Mining Method
The CdG project has been planned as an open-pit truck and shovel operation. The truck and shovel method provides reasonable cost benefits and selectivity for this type of deposit. Only open-pit mining methods are considered for mining at CdG. The open pit mining operation will require the stripping and disposal of waste rock. The total waste quantity is approximately 57.8 million tonnes with an overall mining waste-to-ore ratio of approximately 0.63:1. The bulk of the waste rock from the pit will be placed into a single external waste dump located to the east of the pit and north of the HLF and is named as the Waste Rock Dump (WRD).
16.2 Mine Waste Facilities
For the PFS and based on the waste rock quantities and maximum footprint area provided by others, Golder developed a WRD design in its 2019 Study referenced in Section 27 and summarized as follows. Due to the potential for acid waste rock drainage as described in Section 20, three geomembrane lined contact water ponds are designed at the base of the three natural drainages within the area of the WRD. The contact water ponds have been designed to collect seepage water from the Underdrains as well as surface storm water runoff. The ponds have been sized to store the average precipitation events and discharge the surface water from larger storm events. The contact water ponds will provide a location to monitor water quality and pump the water to the HLF, if appropriate. The WRD will be reclaimed progressively during operations to limit the amount of contact water that will need to be managed during operations. The initial waste that is extracted from the pit will be placed below the Phase 1 and 4 leach pad footprints as structural fill and select waste rock, thereafter the waste will be placed in the western drainage of the WRD. After the western drainage of the WRD is full to capacity, the WRD surface will be regraded to an overall slope of 3H:1V that will cover the contact water pond and the surface will receive a cover system to limit the infiltration as needed to meet the environmental compliance criteria. The same process will be conducted for the remaining two drainages that the WRD is sited in. Therefore, typically only one contact water pond will be active at one time during operations. The contact water ponds have been sized to contain (below the spillway) the 1 in 2-year, 24-hour precipitation event falling on the contributing WRD and undisturbed ground areas. The overflow spillways have been designed to convey the 1 in 20-year, 24-hour storm event precipitation event falling on the same areas.

Cerro del Gallo Heap Leach Project NI 43-101 Technical Report
January 31, 2020 Page 16-2
Storm water diversion channels around the perimeter of the WRD have been designed to protect the waste rock surface from erosion. The diversion channels are sized to contain the runoff from upstream basins resulting from the 1 in 100-year, 24-hour storm event. The diversion channels around the WRD are designed to convey this runoff in riprap-lined diversion channels. Sediment control structures are designed in the three drainages downstream of waste to control sediment from runoff conveyed in diversion channels and underdrain flows. Temporary diversion channels will need to be constructed within the WRD footprint to divert non-contact water prior to contact with mine waste. The size and location of the temporary diversion channels will be dependent on the annual development of the WRD. The waste dump is designed with a capacity of approximately 55.0 million tonnes using a dry waste rock density of 1.9 t/m3. Although the estimated waste rock generated during the life of mine is approximately 2.8 million tonnes more than the WRD capacity, approximately 3.4 million tonnes of waste rock will be used for leach pad construction. Therefore, the WRD provides some excess capacity if required. Table 16.2.1 provides a summary of the waste produced during the mine life and the volume of waste used for leach pad construction.
Table 16.2.1 Waste Placement Volumes
Total Waste (Mt)
Waste Volume (Mm3)
To HLF Construction
(Mm3) To WRD
(Mm3)
Total 57.8 30.4 1.8 28.6 Source: MDA (2019)
The WRD will be built in lifts to ensure overall geotechnical stability. The WRD is designed to meet minimum slope stability factor of safety criteria of 1.50 static and 1.05 pseudo-static. Golder provided the geotechnical design specifications for the waste dump, which are summarized in Table 16.2.2.

Cerro del Gallo Heap Leach Project NI 43-101 Technical Report
January 31, 2020 Page 16-3
Table 16.2.2 Waste Rock Dump Design Criteria
Parameter Description Lift Height 30 meters Total Dump Height 100 meters
Dump Crest Elevation 2240 meters aMSL
Lift Face Angle 1.5:1 (H:V) Lift Bench Width 45 meters
Overall Dump Slope 3:1 (H:V)
18.4º Source: Golder (2019)
16.3 Mine-Production Schedule
Mine production schedules were created using MineSched (version 9.1). Proven and Probable reserves along with associated waste material were scheduled for transport to various destinations in order to create a mine production schedule. The primary goal of the production schedule is to provide the crusher with sufficient daily material for processing at a yearly rate of 6.0 million tonnes per year. Material types were defined to differentiate the material that would be sent to the crusher and the waste facilities. Reserves were categorized using oxide, mixed oxide, mixed sulfide, and fresh material categories. The material types included codes to differentiate Proven and Probable material as well as Inferred material. All Inferred material was considered to be waste and sent to the waste storage facility. Table 16.3.1 shows the mine-production schedule of 16 years following one year of preproduction. Proven and Probable ore is to be sent from the pit directly to the crusher prior to heap leaching. A small stockpile may be maintained near the crusher so that trucks may dump and return to mining operations in the event of unexpected crusher down time. Table 16.3.2 shows the process production schedule. This is based on the material sent to the crusher and shows only the contained ounces of gold and silver sent. Haul trucks hauling material sent to the crusher will tip directly into the crusher feed hopper as available. There will be times where material will be stockpiled due to mining rates being faster than the ability to process, or because the crusher is undergoing maintenance, at the time the truck arrives. For this reason, some stockpiling ability will be required. Table 16.3.3 shows the annual stockpile balances. The balance will be minimized as much as possible during operations. The maximum size on an annual basis is estimated to be 482,000 tonnes.

Cerro del Gallo Heap Leach Project NI 43-101 Technical Report
January 31, 2020 Page 16-4
Table 16.3.1 Annual Mine Production Schedule
Source: MDA (2019)
Units Yr_-1 Yr_1 Yr_2 Yr_3 Yr_4 Yr_5 Yr_6 Yr_7 Yr_8 Yr_9 Yr_10 Yr_11 Yr_12 Yr_13 Yr_14 Yr_15 Yr_16 Yr_17 TotalPit to Stockpile K Tonnes 386 241 97 239 210 156 247 260 382 250 481 225 107 0 0 0 0 - 3,278
g Au/t 0.17 0.25 0.32 0.26 0.24 0.28 0.24 0.35 0.40 0.30 0.31 0.30 0.31 0.35 0.32 0.25 0.36 - 0.29 K Ozs Au 2 2 1 2 2 1 2 3 5 2 5 2 1 0 0 0 0 - 30
g Ag/t 22.21 15.19 12.25 16.77 17.06 15.49 17.02 14.14 11.77 17.60 13.41 15.08 10.29 16.78 12.90 13.99 6.73 - 15.59 K Ozs Ag 275 118 38 129 115 78 135 118 145 141 207 109 35 0 0 0 0 - 1,643
Cu% 0.16 0.08 0.10 0.11 0.11 0.10 0.11 0.10 0.11 0.15 0.09 0.12 0.11 0.11 0.11 0.10 0.09 - 0.11 Tonnes Cu 607 194 98 271 224 154 263 268 403 365 417 268 114 0 0 0 0 - 3,645
Pit to Crusher K Tonnes - 4,122 5,863 5,741 5,802 5,895 5,635 5,844 5,735 5,570 5,867 5,443 6,000 6,016 6,000 6,000 2,942 - 88,476 g Au/t - 0.49 0.56 0.60 0.57 0.55 0.59 0.65 0.73 0.62 0.55 0.44 0.46 0.54 0.58 0.55 0.54 - 0.57
K Ozs Au - 65 106 110 107 104 106 122 135 110 103 77 89 104 113 107 51 - 1,608 g Ag/t - 14.17 13.70 13.61 13.90 14.27 13.02 13.78 13.77 15.76 12.94 12.80 11.11 12.05 12.77 11.97 10.01 - 13.17
K Ozs Ag - 1,878 2,582 2,513 2,593 2,705 2,359 2,590 2,539 2,823 2,442 2,240 2,143 2,331 2,464 2,309 947 - 37,456 Cu% - 0.06 0.08 0.09 0.09 0.09 0.09 0.09 0.09 0.11 0.09 0.11 0.10 0.10 0.10 0.09 0.09 - 0.09
Tonnes Cu - 2,472 4,593 5,118 5,253 5,349 5,135 5,396 5,212 6,091 5,138 5,813 6,062 6,050 6,212 5,676 2,567 - 82,137 Total Ore Mined K Tonnes 386 4,363 5,960 5,980 6,012 6,051 5,882 6,104 6,117 5,820 6,347 5,668 6,107 6,016 6,000 6,000 2,942 - 91,754
g Au/t 0.17 0.48 0.56 0.58 0.56 0.54 0.57 0.64 0.71 0.60 0.53 0.44 0.46 0.54 0.58 0.55 0.54 - 0.56 K Ozs Au 2 67 107 112 109 105 108 125 140 113 108 79 90 104 113 107 51 - 1,638
g Ag/t 22.21 14.23 13.68 13.74 14.01 14.30 13.19 13.80 13.65 15.84 12.98 12.89 11.10 12.05 12.77 11.97 10.01 - 13.25 K Ozs Ag 275 1,995 2,620 2,642 2,708 2,783 2,494 2,708 2,684 2,964 2,649 2,349 2,178 2,331 2,464 2,309 947 - 39,099
Cu% 0.16 0.06 0.08 0.09 0.09 0.09 0.09 0.09 0.09 0.11 0.09 0.11 0.10 0.10 0.10 0.09 0.09 - 0.09 Tonnes Cu 607 2,666 4,691 5,389 5,477 5,503 5,398 5,664 5,615 6,456 5,555 6,081 6,175 6,050 6,212 5,676 2,567 - 85,782
*_wst K Tonnes 1,907 612 978 2,114 2,508 2,489 2,391 1,197 2,887 5,792 9,660 11,430 7,032 3,764 1,992 882 144 - 57,780 Total Mined K Tonnes 2,292 4,974 6,938 8,094 8,520 8,540 8,274 7,302 9,004 11,612 16,008 17,098 13,139 9,781 7,992 6,882 3,086 - 149,534 Strip Ratio W:O 4.95 0.14 0.16 0.35 0.42 0.41 0.41 0.20 0.47 1.00 1.52 2.02 1.15 0.63 0.33 0.15 0.05 0.63

Cerro del Gallo Heap Leach Project NI 43-101 Technical Report
January 31, 2020 Page 16-5
Table 16.3.2 Process Production Schedule
Source: MDA (2019)
Units Yr_-1 Yr_1 Yr_2 Yr_3 Yr_4 Yr_5 Yr_6 Yr_7 Yr_8 Yr_9 Yr_10 Yr_11 Yr_12 Yr_13 Yr_14 Yr_15 Yr_16 Yr_17 TotalOxide K Tonnes - 2,776 1,847 842 595 354 345 264 680 692 25 6 - - - - 1 - 8,425
g Au/t - 0.47 0.57 0.50 0.44 0.48 0.83 0.66 0.52 0.41 0.13 0.17 - - - - 0.16 - 0.51 K gs Au - 42 34 14 8 5 9 6 11 9 0 0 - - - - 0 - 138 g Ag/t - 14.59 13.19 14.89 18.45 24.70 16.85 13.51 13.64 21.69 22.67 19.40 - - - - 19.96 - 15.60 K gs Ag - 1,302 783 403 353 281 187 115 298 482 18 4 - - - - 0 - 4,227
Cu% - 0.06 0.07 0.08 0.08 0.10 0.11 0.10 0.11 0.15 0.19 0.19 - - - - 0.19 - 0.08 Tonnes Cu - 1,725 1,213 651 472 349 378 264 717 1,021 46 11 - - - - 1 - 6,848
Mixed Oxide K Tonnes - 14 113 318 519 659 706 336 190 227 283 709 326 188 144 230 326 - 5,289 g Au/t - 0.44 0.50 0.45 0.41 0.41 0.36 0.37 0.61 0.65 0.25 0.27 0.35 0.48 0.51 0.39 0.36 - 0.39 K gs Au - 0 2 5 7 9 8 4 4 5 2 6 4 3 2 3 4 - 67 g Ag/t - 16.51 13.48 15.21 13.85 12.16 12.74 11.01 10.26 12.59 13.84 13.39 9.77 7.78 8.31 7.37 8.19 - 11.90 K gs Ag - 8 49 155 231 258 289 119 63 92 126 305 102 47 39 54 86 - 2,023
Cu% - 0.05 0.08 0.07 0.07 0.07 0.07 0.07 0.08 0.08 0.07 0.09 0.07 0.08 0.08 0.06 0.07 - 0.07 Tonnes Cu - 7 92 232 347 439 490 239 146 190 198 626 241 147 113 142 218 - 3,866
Mixed Sulfide K Tonnes - 1,555 3,283 3,612 3,249 3,295 2,769 3,116 2,336 2,662 1,745 1,509 1,616 1,547 1,419 763 346 - 34,822 g Au/t - 0.45 0.56 0.63 0.60 0.55 0.56 0.68 0.75 0.62 0.51 0.41 0.46 0.58 0.64 0.56 0.47 - 0.58 K gs Au - 23 59 73 63 58 50 68 56 53 28 20 24 29 29 14 5 - 653 g Ag/t - 15.70 14.20 13.07 13.29 13.96 13.22 13.61 13.68 14.74 12.30 13.51 11.31 12.19 13.68 12.71 12.74 - 13.50 K gs Ag - 785 1,499 1,518 1,388 1,478 1,177 1,363 1,027 1,262 690 656 588 606 624 312 142 - 15,115
Cu% - 0.08 0.08 0.09 0.09 0.08 0.08 0.09 0.09 0.10 0.09 0.11 0.10 0.10 0.11 0.10 0.09 - 0.09 Tonnes Cu - 1,208 2,740 3,237 2,898 2,786 2,295 2,841 2,072 2,773 1,588 1,626 1,545 1,610 1,521 762 295 - 31,797
Fresh K Tonnes - 162 758 1,228 1,637 1,709 2,179 2,284 2,794 2,436 3,947 3,776 4,058 4,281 4,436 5,007 2,525 - 43,218 g Au/t - 0.51 0.51 0.54 0.58 0.59 0.60 0.62 0.74 0.61 0.58 0.47 0.47 0.53 0.57 0.56 0.54 - 0.56 K gs Au - 3 12 21 31 32 42 46 66 48 74 57 61 72 81 90 44 - 781 g Ag/t - 11.17 12.88 14.35 13.73 13.69 12.86 14.60 14.07 15.17 13.20 12.54 11.14 12.19 12.62 12.07 10.17 - 12.76 K gs Ag - 58 314 566 723 753 901 1,072 1,263 1,188 1,675 1,522 1,453 1,678 1,801 1,943 825 - 17,736
Cu% - 0.09 0.09 0.10 0.11 0.11 0.11 0.10 0.09 0.11 0.09 0.11 0.11 0.10 0.10 0.10 0.09 - 0.10 Tonnes Cu - 139 665 1,247 1,758 1,892 2,350 2,229 2,551 2,638 3,471 4,081 4,275 4,294 4,577 4,772 2,333 - 43,271
Total K Tonnes - 4,507 6,000 6,000 6,000 6,016 6,000 6,000 6,000 6,016 6,000 6,000 6,000 6,016 6,000 6,000 3,198 - 91,754 g Au/t - 0.46 0.56 0.58 0.56 0.54 0.57 0.64 0.72 0.60 0.54 0.43 0.46 0.54 0.58 0.55 0.51 - 0.56 K gs Au - 67 107 112 109 105 109 124 138 115 105 83 89 104 113 107 53 - 1,638 g Ag/t - 14.86 13.71 13.70 13.97 14.32 13.24 13.83 13.75 15.63 13.01 12.89 11.11 12.05 12.77 11.97 10.25 - 13.25 K gs Ag - 2,153 2,644 2,643 2,694 2,769 2,554 2,669 2,652 3,024 2,510 2,487 2,143 2,331 2,464 2,309 1,053 - 39,099
Cu% - 0.07 0.08 0.09 0.09 0.09 0.09 0.09 0.09 0.11 0.09 0.11 0.10 0.10 0.10 0.09 0.09 - 0.09 Tonnes Cu - 3,079 4,710 5,366 5,476 5,465 5,512 5,572 5,485 6,622 5,304 6,344 6,062 6,050 6,212 5,676 2,847 - 85,782

Cerro del Gallo Heap Leach Project NI 43-101 Technical Report
January 31, 2020 Page 16-6
Table 16.3.3 Stockpile Balance
Source: MDA (2019)
Units Yr_-1 Yr_1 Yr_2 Yr_3 Yr_4 Yr_5 Yr_6 Yr_7 Yr_8 Yr_9 Yr_10 Yr_11 Yr_12 Yr_13 Yr_14 Yr_15 Yr_16 Yr_17Added K Tonnes 386 241 97 239 210 156 247 260 382 250 481 225 107 0 0 0 0 -
g Au/t 0.17 0.25 0.32 0.26 0.24 0.28 0.24 0.35 0.40 0.30 0.31 0.30 0.31 0.35 0.32 0.25 0.36 - K gs Au 2 2 1 2 2 1 2 3 5 2 5 2 1 0 0 0 0 - g Ag/t 22.21 15.19 12.25 16.77 17.06 15.49 17.02 14.14 11.77 17.60 13.41 15.08 10.29 16.78 12.90 13.99 6.73 - K gs Ag 275 118 38 129 115 78 135 118 145 141 207 109 35 0 0 0 0 -
Cu%Tonnes Cu 607 194 98 271 224 154 263 268 403 365 417 268 114 0 0 0 0 -
Removed K Tonnes - 386 137 259 198 121 365 156 265 446 133 557 - - - - 256 - g Au/t - 0.17 0.31 0.27 0.25 0.30 0.24 0.36 0.38 0.34 0.26 0.31 - - - - 0.28 - K gs Au - 2 1 2 2 1 3 2 3 5 1 6 - - - - 2 - g Ag/t - 22.21 14.03 15.62 15.92 16.45 16.69 15.81 13.24 14.03 15.89 13.80 - - - - 12.96 - K gs Ag - 275 62 130 101 64 196 79 113 201 68 247 - - - - 107 -
Cu%Tonnes Cu - 607 116 249 223 116 377 176 273 531 166 531 - - - - 280 -
Balance K Tonnes 386 241 201 180 192 227 109 213 331 134 482 150 256 256 256 256 - - g Au/t 0.17 0.25 0.25 0.22 0.22 0.22 0.19 0.27 0.32 0.23 0.30 0.25 0.28 0.28 0.28 0.28 - - K gs Au 2 2 2 1 1 2 1 2 3 1 5 1 2 2 2 2 - - g Ag/t 22.21 15.19 14.57 15.98 17.21 16.44 16.92 14.34 12.26 16.30 13.54 14.85 12.96 12.96 12.96 12.96 - - K gs Ag 275 118 94 93 106 120 59 98 130 70 210 72 107 107 107 107 - -
Cu% 0.16 0.08 0.09 0.11 0.10 0.10 0.11 0.10 0.10 0.13 0.09 0.11 0.11 0.11 0.11 0.11 - - Tonnes Cu 607 194 176 198 199 236 122 214 344 177 429 166 280 280 280 280 - -

Cerro del Gallo Heap Leach Project NI 43-101 Technical Report
January 31, 2020 Page 16-7
16.4 Equipment Requirements
While it is assumed that the CdG property will be mined using a mining contractor, it has been planned as an open-pit mine using CAT 777 haul trucks and front-end loading equipment. Mine production assumes the use of a 13 cubic meter front-end loader and 91-tonne haul trucks. Final equipment selection will be determined by the contractor and may differ from the equipment specified in this study; however, it is assumed that the size and amount of equipment will be similar. Total equipment requirements were estimated by MDA and are shown in Table 16.4.1. Productivity estimates for primary mining equipment, including trucks, loaders, and drills, is based on a mining schedule of 24 hours per day with two shifts of 12 hours each. Standby time per shift assumes 0.5 hours for shift startup and shutdown, 0.50 hours for lunch breaks, 0.25 hours of other breaks, and 0.25 hours for operational standby. This adds up to a total of 1.5 hours per shift or 3 hours per day allowing for a total available working time of 21 hours per day. Based on a 24-hour day, this is a mine schedule efficiency rate of 87.5%. This is used to determine the potential available operating hours per period which is about 7,665 hours per year. These hours are used along with the number of pieces of equipment and availability to determine available operating hours. Equipment availabilities for primary equipment are assumed to be 90% during the first year and then decreased by 1% per year of operation to a minimum availability of 85%. Operating efficiencies of 83% were used, which is similar to a 50-minute hour. This accounts for operational inefficiencies that occur at the mine site. Loader maximum productivities were estimated using appropriate assumptions for mechanical availability, operating efficiencies, and fill factors along with the truck sizes to be loaded. Loader theoretical productivity was estimated to be 1,807 tonnes per hour. Using an efficiency of 83%, the operating productivity is 1,500 tonnes per hour. Loading time was estimated to be 2.9 minutes per truck. The production schedule anticipates the use of loaders and 91-tonne capacity haul trucks. Haul truck hours were estimated using MineSched haulage tools. This uses detailed 3-dimensional lines representing in-pit and ex-pit travel routes. Additional lines were used to represent travel on each of the benches in the pit. Travel speeds were estimated at each of the points on these lines based on the effective gradient and CAT 777 truck performance and retard curves. A 3% rolling resistance was used to estimate the effective gradients. MineSched uses the resulting speeds to calculate the truck hours required. These truck hours were considered to be “productive” truck hours as

Cerro del Gallo Heap Leach Project NI 43-101 Technical Report
January 31, 2020 Page 16-8
they did not consider any utilization, efficiencies, or availabilities. Operating hours were estimated in spreadsheets based on efficiency and availability values. Drilling requirements were based on pattern size, drilling penetration rates, and non-drilling time. Blast patterns were assumed for production, trim-row, and pioneer drilling. Production drilling is used for both waste and ore. The production drilling assumes 5.4-meter spacing and 5.4-meter burdens with 5.0-meter bench heights and an additional 1.5 meters of sub-drill. The pattern size is based on allowing for 3 meters of stemming and achieving a powder factor of approximately 0.25 kg of explosives for each tonne of rock. Bit diameter used is 196 mm and the penetration rate assumed is 31.6 meters per hour. A non-drilling time of 2.8 minutes per hole is used for drill moves between holes.
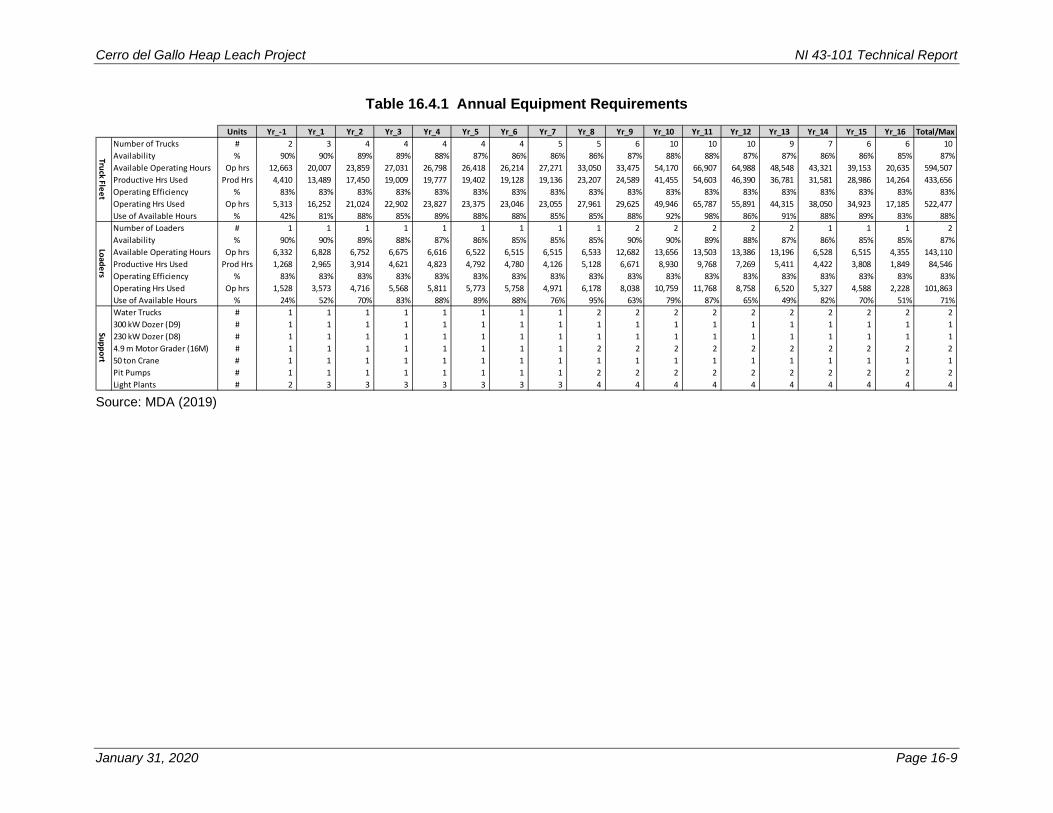
Cerro del Gallo Heap Leach Project NI 43-101 Technical Report
January 31, 2020 Page 16-9
Table 16.4.1 Annual Equipment Requirements
Source: MDA (2019)
Units Yr_-1 Yr_1 Yr_2 Yr_3 Yr_4 Yr_5 Yr_6 Yr_7 Yr_8 Yr_9 Yr_10 Yr_11 Yr_12 Yr_13 Yr_14 Yr_15 Yr_16 Total/MaxNumber of Trucks # 2 3 4 4 4 4 4 5 5 6 10 10 10 9 7 6 6 10 Availability % 90% 90% 89% 89% 88% 87% 86% 86% 86% 87% 88% 88% 87% 87% 86% 86% 85% 87%Available Operating Hours Op hrs 12,663 20,007 23,859 27,031 26,798 26,418 26,214 27,271 33,050 33,475 54,170 66,907 64,988 48,548 43,321 39,153 20,635 594,507 Productive Hrs Used Prod Hrs 4,410 13,489 17,450 19,009 19,777 19,402 19,128 19,136 23,207 24,589 41,455 54,603 46,390 36,781 31,581 28,986 14,264 433,656 Operating Efficiency % 83% 83% 83% 83% 83% 83% 83% 83% 83% 83% 83% 83% 83% 83% 83% 83% 83% 83%Operating Hrs Used Op hrs 5,313 16,252 21,024 22,902 23,827 23,375 23,046 23,055 27,961 29,625 49,946 65,787 55,891 44,315 38,050 34,923 17,185 522,477 Use of Available Hours % 42% 81% 88% 85% 89% 88% 88% 85% 85% 88% 92% 98% 86% 91% 88% 89% 83% 88%Number of Loaders # 1 1 1 1 1 1 1 1 1 2 2 2 2 2 1 1 1 2 Availability % 90% 90% 89% 88% 87% 86% 85% 85% 85% 90% 90% 89% 88% 87% 86% 85% 85% 87%Available Operating Hours Op hrs 6,332 6,828 6,752 6,675 6,616 6,522 6,515 6,515 6,533 12,682 13,656 13,503 13,386 13,196 6,528 6,515 4,355 143,110 Productive Hrs Used Prod Hrs 1,268 2,965 3,914 4,621 4,823 4,792 4,780 4,126 5,128 6,671 8,930 9,768 7,269 5,411 4,422 3,808 1,849 84,546 Operating Efficiency % 83% 83% 83% 83% 83% 83% 83% 83% 83% 83% 83% 83% 83% 83% 83% 83% 83% 83%Operating Hrs Used Op hrs 1,528 3,573 4,716 5,568 5,811 5,773 5,758 4,971 6,178 8,038 10,759 11,768 8,758 6,520 5,327 4,588 2,228 101,863 Use of Available Hours % 24% 52% 70% 83% 88% 89% 88% 76% 95% 63% 79% 87% 65% 49% 82% 70% 51% 71%Water Trucks # 1 1 1 1 1 1 1 1 2 2 2 2 2 2 2 2 2 2 300 kW Dozer (D9) # 1 1 1 1 1 1 1 1 1 1 1 1 1 1 1 1 1 1 230 kW Dozer (D8) # 1 1 1 1 1 1 1 1 1 1 1 1 1 1 1 1 1 1 4.9 m Motor Grader (16M) # 1 1 1 1 1 1 1 1 2 2 2 2 2 2 2 2 2 2 50 ton Crane # 1 1 1 1 1 1 1 1 1 1 1 1 1 1 1 1 1 1 Pit Pumps # 1 1 1 1 1 1 1 1 2 2 2 2 2 2 2 2 2 2 Light Plants # 2 3 3 3 3 3 3 3 4 4 4 4 4 4 4 4 4 4
Truck FleetLoaders
Support

Cerro del Gallo Heap Leach Project NI 43-101 Technical Report
January 31, 2020 Page 16-10
Trim rows are used to reduce the powder factor near high-walls and to reduce the damage caused by blasting. This drilling will be done using the production drills and will be accomplished by reducing the pattern size to 4.5 meters by 4.5 meters, and eliminating the sub-drilling. The sub-drill is eliminated so that the blasting does not impact the catch benches and the targeted powder factor is about 0.17 kg of explosives per tonne. Trim row rounds would be completed using three rows of drill holes following the perimeter of the pit. Final arrangement of trim row blasts will be done based on production requirements and high wall conditions. Pioneer mining will be done to gain initial access to the top of the hill. The surface rock is reasonably fractured; thus, it is assumed that the initial pioneering will be done using dozers and graders to provide drilling, loading, and haulage equipment access to the upper benches. Support equipment was assumed based on the need for water trucks, dozers, graders and other equipment. The hours on this equipment are based on assumed utilizations of around 50% for the majority of the equipment. The estimated number of support equipment is shown in Table 16.4.1, though the contractor will provide the amount of equipment deemed to be needed to maintain a safe and effective working environment.
16.5 Mine Personnel
Mine personnel estimates include both operating and mine-staff personnel. Operating personnel are estimated as the number of people required to operate drills, trucks, loading equipment, and support equipment to achieve the production schedule. This will vary with the contractor mining fleet configuration, mine-staffing levels include owner supervision and support for mine production. The estimated number of mine personnel required to execute the mine plan is shown in Table 16.5.1.

Cerro del Gallo Heap Leach Project NI 43-101 Technical Report
January 31, 2020 Page 16-11
Table 16.5.1 Mine Personnel Requirements
Source: MDA (2019)
Mining General Personnel Units Yr_-1 Yr_1 Yr_2 Yr_3 Yr_4 Yr_5 Yr_6 Yr_7 Yr_8 Yr_9 Yr_10 Yr_11 Yr_12 Yr_13 Yr_14 Yr_15 Yr_16 MaxMine Superintendent # 1 1 1 1 1 1 1 1 1 1 1 1 1 1 1 1 1 1
Mine Superintendent Assistant # 1 1 1 1 1 1 1 1 1 1 1 1 1 1 1 1 1 1 Mine Supervisor # 4 4 4 4 4 4 4 4 4 4 4 4 4 4 4 4 4 4
Tech Services Superintendent # 1 1 1 1 1 1 1 1 1 1 1 1 1 1 1 1 1 1 Chief Planner # 1 1 1 1 1 1 1 1 1 1 1 1 1 1 1 1 1 1
Surveyor # 1 1 1 1 1 1 1 1 1 1 1 1 1 1 1 1 1 1 Surveyor Assistant # 1 1 1 1 1 1 1 1 1 1 1 1 1 1 1 1 1 1
Geology Supervisor # 1 1 1 1 1 1 1 1 1 1 1 1 1 1 1 1 1 1 Samplers # 1 1 1 1 1 1 1 1 1 1 1 1 1 1 1 1 1 1
General Services Assistant # 1 1 1 1 1 1 1 1 1 1 1 1 1 1 1 1 1 1 Total Mine General # 13 13 13 13 13 13 13 13 13 13 13 13 13 13 13 13 13 13
Mine Operations Hourly PersonnelOperators
Drill Operators # 7 7 4 8 8 8 8 8 8 8 8 8 8 8 8 4 4 8 Loader Operators # 4 4 4 4 4 4 4 4 4 8 8 8 8 8 4 4 4 8
Haul Truck Operators # 8 12 16 16 16 16 16 20 20 24 40 40 40 36 28 24 24 40 Support Equipment Operators # 8 9 9 9 9 9 9 9 9 14 14 14 14 14 13 13 13 14
General Mine Labors # 1 1 1 1 1 1 1 2 2 2 2 2 2 2 2 2 2 2 Total Operators # 28 33 34 38 38 38 38 43 43 56 72 72 72 68 55 47 47 72
MechanicsMechanics - Drilling # 4 4 2 4 4 4 4 4 4 4 4 4 4 4 4 2 2 4 Mechanics - Loading # 2 2 2 2 2 2 2 2 2 4 4 4 4 4 2 2 2 4 Mechanics - Haulage # 4 6 8 8 8 8 8 10 10 12 20 20 20 18 14 12 12 20 Mechanics - Support # 4 5 5 5 5 5 5 5 5 7 7 7 7 7 7 7 7 7
Total Mechanics # 14 17 17 19 19 19 19 21 21 27 35 35 35 33 27 23 23 35
MaintenanceMaintenance Superintendent # 1 1 1 1 1 1 1 1 1 1 1 1 1 1 1 1 1 1
Maintenance Supervisor # 4 4 4 4 4 4 4 4 4 4 4 4 4 4 4 4 4 4 Maintenance Planners # 1 1 1 1 1 1 1 1 1 1 1 1 1 1 1 1 1 1
Light Vehicle Mechanic # 1 1 1 1 1 1 1 1 1 1 1 1 1 1 1 1 1 1 Welder # 2 2 2 2 2 2 2 2 2 2 2 2 2 2 2 2 2 2
Welder Assistant # 1 1 1 1 1 1 1 1 1 1 1 1 1 1 1 1 1 1 Servicemen # 2 2 2 2 2 2 2 2 2 2 2 2 2 2 2 2 2 2
Serviceman Assistant # 1 1 1 1 1 1 1 1 1 1 1 1 1 1 1 1 1 1 Tireman # 1 1 1 1 1 1 1 1 1 1 1 1 1 1 1 1 1 1
Maintenance Labor # - - - - - - - - - - - - - - - - - - Total Maintenance # 14 14 14 14 14 14 14 14 14 14 14 14 14 14 14 14 14 14
Total Personnel - Mining Personnel # 69 77 78 84 84 84 84 91 91 110 134 134 134 128 109 97 97 134

Cerro del Gallo Heap Leach Project NI 43-101 Technical Report
January 31, 2020 Page 17-1
17 Recovery Methods
17.1 Summary
Test work results have indicated that the CdG ore is amenable to heap leaching for the recovery of gold, silver and copper. The CdG ore is estimated to contain an average of 0.09% copper based on the mine plan used for this study. A portion of this copper is cyanide soluble and is expected to be extracted in the heap leach circuit. The cyanide soluble copper has an effect on the cyanide consumption. A SART plant that releases cyanide associated with the copper cyanide complex, allowing it to be recycled back to the leach process as free cyanide is included. The resulting copper and silver precipitate will be sold, bringing additional revenue to the project. The ore will be mined by standard open-pit mining methods, fine crushed using a system incorporating cone and high-pressure grinding roll (HPGR) crushers, agglomerated with cement and conveyor stacked on the heap leach pad in 8-meter lifts. The heap leach pad was designed by Golder. The pad will be constructed in four phases and will hold approximately 92 million tonnes. The heap leach pad will have a composite liner consisting of clay/GCL and textured HDPE geomembrane. Ore will be single-stage leached with a dilute cyanide solution at a high solution application rate for the first 40 days and a lower application rate for the remaining 80 days for a total leach cycle of 120 days. The gold, silver, and copper bearing solution will be collected in the pregnant solution pond and pumped to the SART plant. Pregnant solution will be acidified with sulfuric acid, then copper and silver will be precipitated as sulfides by the addition of sodium hydrosulfide. The precipitate will be thickened and filtered to produce a copper-silver filter cake for shipment to a smelter. The barren solution from the SART plant will be processed in a carbon adsorption-desorption-recovery (ADR) plant to recover gold. The gold will be periodically stripped from the carbon using a desorption process. The gold will be plated on stainless steel cathodes, removed by washing, filtered, dried and then smelted to produce a doré bar. Engineering and design of the processing plant was undertaken for complete crushing, leaching, and recovery systems. The criteria for the design of the processing circuit are summarized in Table 17.1.1.
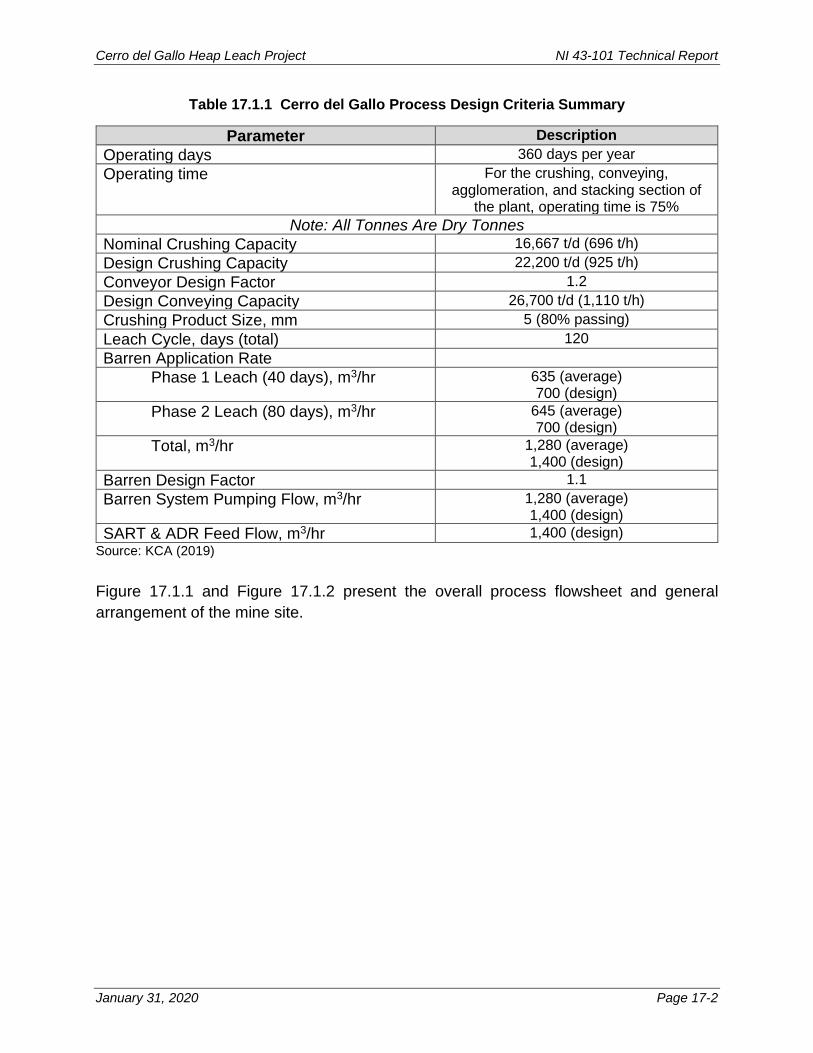
Cerro del Gallo Heap Leach Project NI 43-101 Technical Report
January 31, 2020 Page 17-2
Table 17.1.1 Cerro del Gallo Process Design Criteria Summary
Parameter Description Operating days 360 days per year Operating time For the crushing, conveying,
agglomeration, and stacking section of the plant, operating time is 75%
Note: All Tonnes Are Dry Tonnes Nominal Crushing Capacity 16,667 t/d (696 t/h) Design Crushing Capacity 22,200 t/d (925 t/h) Conveyor Design Factor 1.2 Design Conveying Capacity 26,700 t/d (1,110 t/h) Crushing Product Size, mm 5 (80% passing) Leach Cycle, days (total) 120 Barren Application Rate
Phase 1 Leach (40 days), m3/hr 635 (average) 700 (design)
Phase 2 Leach (80 days), m3/hr 645 (average) 700 (design)
Total, m3/hr 1,280 (average) 1,400 (design)
Barren Design Factor 1.1 Barren System Pumping Flow, m3/hr 1,280 (average)
1,400 (design) SART & ADR Feed Flow, m3/hr 1,400 (design)
Source: KCA (2019) Figure 17.1.1 and Figure 17.1.2 present the overall process flowsheet and general arrangement of the mine site.

Cerro del Gallo Heap Leach Project NI 43-101 Technical Report
January 31, 2020 Page 17-3
Figure 17.1.1 Cerro del Gallo Overall Process Flowsheet
Source: KCA (2019)

Cerro del Gallo Heap Leach Project NI 43-101 Technical Report
January 31, 2020 Page 17-4
Figure 17.1.2 Cerro del Gallo General Arrangement Drawing
Source: KCA (2019)

Cerro del Gallo Heap Leach Project NI 43-101 Technical Report
January 31, 2020 Page 17-5
17.2 Processing
Crushing
Crushing for the CdG project is accomplished by a three-stage crushing system with an open primary crushing circuit, closed secondary, and tertiary crushing circuits operating seven days per week, 24 hours per day. Run of mine (ROM) material will be delivered and direct dumped, as much as possible, by haul truck from the mine into the 200-tonne ROM feed bin. A permanent rock breaker will be installed to break any oversized material. ROM material from the coarse ore bin will be delivered by a vibrating grizzly feeder. Oversize material is crushed using a primary jaw crusher while the undersize material is combined with the primary jaw product on a primary crusher discharge conveyor. The primary jaw crusher is operated in open circuit and is designed to crush the vibrating grizzly oversize to 80% passing 145 mm. The primary crushing products is stockpiled by a coarse ore stockpile feed stacker conveyor. Material from the primary crushed stockpile is reclaimed using reclaim feeders and is conveyed to the secondary screen feed conveyor. The secondary crushing circuit includes two double deck vibrating screens and two cone crushers. The secondary crushing circuit is operated in closed circuit with a product size of 80% passing 36 mm. Primary crushed ore is combined with the secondary cone product and is fed to the secondary screen. The secondary screen oversize is transferred to the secondary cone crusher surge bin by conveyors and is fed to the secondary cone by a belt feeder. The secondary cone crusher discharge recycles back to the secondary screen. Secondary screen undersize material is conveyed to the secondary product storage bin, reclaimed using belt feeders and is transferred to the tertiary crushing circuit. The tertiary crushing circuit consists of an HPGR crusher operated in closed circuit with a fine screening plant. The design for the final crushed product is 80% passing 4 to 6 mm. Material from the secondary product storage bin is transferred to the HPGR crusher. The product from the HPGR is conveyed to a bin. The bin has multiple discharge points onto three triple-deck vibrating tertiary screens. The tertiary screen oversize is transferred to the HPGR recycle conveyor and recirculated to the HPGR feed conveyor. The tertiary screen undersize is stockpiled by the fine ore stacking conveyor. Material from the fine ore stockpile is reclaimed using reclaim feeders and conveyed to the agglomeration system by the fine ore reclaim conveyor. The fine ore reclaim conveyor discharges to a splitting chute to feed two parallel agglomeration feed conveyors. Cement is added to the ore on the agglomeration feed conveyors from the cement silos,

Cerro del Gallo Heap Leach Project NI 43-101 Technical Report
January 31, 2020 Page 17-6
depending on the material type. The cement addition rate is controlled by a weightometer mounted on the individual agglomeration feed conveyors. The agglomeration feed conveyors feed two parallel agglomeration drums where barren process solution is added and cement is blended in. The agglomeration drums discharge onto the agglomeration discharge conveyor and the material is transported to the stacking system.
Heap Conveying and Stacking
The heap leach will be constructed in eight-meter lifts using a mobile conveyor stacking system. The Phase 1 leach pad conveying and stacking system will consist of an overland conveyor, 23 mobile grasshopper conveyors, and index feed conveyor, a horizontal index conveyor and a radial stacker. The overland conveyor transfers the material from the agglomeration discharge conveyor to the mobile grasshopper conveyors, which feed the conveyor stacking system. As the radial stacker progresses, the system is periodically stopped to add or remove grasshopper conveyors as needed. Phases 2 through 4 will increase the leach area without any additional equipment required. Stacked material will consist of crushed and agglomerated ore. Once a lift has finished leaching, and is sufficiently drained, a new lift can be stacked over the top of the old lift. The old lift will be cross-ripped with a dozer prior to stacking the new lift to break up any compacted ore and to redistribute material that may have been winnowed by the irrigation solution or rainfall. Stacked lifts will progress in a stair-step manner.
Heap Leaching
Following stacking, the material is irrigated with a dilute sodium cyanide barren leach solution and the resulting gold, silver and copper bearing solutions are collected into the pregnant solution pond. The CdG Project has been designed as a single pass system with no intermediate solution used for heap application. The heap will be irrigated using a drip-tube irrigation system for solution application. PVC pipes are used to distribute the solution to the drip-tubes on top of the heap. Antiscale agent is added to the suction of the barren and pregnant solution pumps to reduce the potential for scaling problems within the system. The total leach cycle of 120 days has been designed for the heap leach system, which is based upon metallurgical test work completed to-date. The leach cycle is operated in two stages. The first stage of the leach cycle is 40 days and leach solutions will be applied to the ore at a nominal application rate of 12 L/h/m2. The second stage of the leach cycle has a duration of 80 days and the leach solutions will be applied to the ore at a nominal application rate of 6 L/h/m2. The leach solutions will have an approximate cyanide concentration of 1500 ppm when applied to the heap.

Cerro del Gallo Heap Leach Project NI 43-101 Technical Report
January 31, 2020 Page 17-7
Two horizontal centrifugal pumps, operating in parallel at the barren tank will be used for the barren solution application to the heap. The barren pumps will be mounted next to the barren tank along with process solution pumps and an agglomeration solution pump along the side of the tank. High-strength sodium cyanide solution and an antiscale agent will be added to the suction side of the barren leach solution pumps by metering pumps. The combined nominal flow to the heap is 1,280 m3/h. Gold, silver and copper bearing solutions draining from the leach pad are collected by a network of perforated drainage pipes that are directed to the pregnant solution pond. Pregnant solution is pumped from the pregnant solution pond by submersible pump to the SART circuit.
Heap Leach Facility Design
Ore from the CdG deposit will be processed by heap leaching. A single heap leach facility has been designed for the site by Golder. The Heap Leach Facility (HLF) has an ore capacity of approximately 92 million tonnes (Mt) using a dry ore density of 1.6 tonne/m3 (t/m3). The HLF design is described in detail in the Golder's report “Cerro Del Gallo PFS – Heap Leach Facility Design” (Golder 2019). The Pre-Feasibility design of the leach pad meets or exceed North American standards, such as the Nevada Administration Code 445A.434 for the lining system design and Mexican Standard NOM-155-SEMERNAT-2007 for the stability of the HLF, which are intended to lessen the risk of environmental impact to the local soils, surface water, and ground water. North American construction standards are intended to mitigate environmental impacts to surface and subsurface water sources. Actual standards used in subsequent stages should be carefully considered and implemented to ensure that environmental impacts are mitigated to the extent required under prevailing laws, regulations and international standards. The 139.8-hectare HLF has a maximum heap height of 80 meters. Ore is designed to be stacked at a rate of 16,667 tonnes per day (tpd). Once production crushers are operational, ore will be crushed and agglomerated, then placed on the leach pad using portable conveyors feeding a conveyor-stacker. Golder was informed that the ore is intended to be stacked in approximately 8-meter lifts with benches provided between lifts to create an average overall ore slope of 3H:1V (horizontal to vertical), which is necessary to provide geotechnical stability and help reduce grading during reclamation.

Cerro del Gallo Heap Leach Project NI 43-101 Technical Report
January 31, 2020 Page 17-8
The foundation of the HLF consists of an underdrain system within the natural drainages to capture spring water and transport it to the toe of the process pond fill. Fill material needed for perimeter roads, process ponds, and leach pad foundations are intended to be sourced from waste rock mined from the pit. The leach pad is a geomembrane lined pad that is divided into four separate construction phases. Each phase is constructed with a solution collection system that drains by gravity to the Pregnant Pond at the toe of the Phase 1 leach pad. During upset conditions, the Pregnant Pond overflows into an Event Pond located downstream of the Pregnant Pond. During wetter than average climate conditions described in Section 5, excess seasonal solution accumulation will be pumped to a Satellite Pond located within the drainage south of the Phase 2 leach pad expansion. The HLF is designed in four phases providing a total lined leach pad surface area of approximately 1.2 million square meters, as shown in Figure 17.2.1. Phase 1 consists of constructing the eastern portion of the leach pad, perimeter access road, underdrain system, pad geomembrane lining system, leak detection system, solution collection system, permanent and temporary stormwater diversion facilities, the Pregnant Pond and the Event Pond. Phase 2 consists of constructing the southern portion of the leach pad, perimeter access road, underdrain system, pad geomembrane liner system, leak detection system, solution collection system, and the Satellite Pond. Phase 3 consists of constructing the western portion of the leach pad, perimeter access road, underdrain system, pad geomembrane liner system, leak detection system, and solution collection system. Phase 4 consists of constructing the northern portion of the leach pad, perimeter access road, underdrain system, pad geomembrane liner system, leak detection system, and solution collection system.

Cerro del Gallo Heap Leach Project NI 43-101 Technical Report
January 31, 2020 Page 17-9
Figure 17.2.1 HLF and WRD Layout
Source: Golder (2019)

Cerro del Gallo Heap Leach Project NI 43-101 Technical Report
January 31, 2020 Page 17-10
This is a summary of materials used to construct the leach pad according to the standards described above. The leach pad is designed with a grading plan to meet minimum slope stability factor of safety criteria of 1.50 static and 1.05 pseudo-static and to promote positive gravity solution flow in the solution collection system above the leach pad liner. In general, this consists of localized grading along the lower portions of the pad to achieve a minimum design grade of 2%. Grading also includes general shaping of the leach pad site to provide smooth surfaces with local slopes no steeper than 2.5H:1V in preparation for liner system placement. The existing incised ravines that pass through the leach pad site are designed with an underdrain system extending beneath the leach pad liner and ponds consisting of a non-woven geotextile surrounding a perforated 300-mm diameter corrugated polyethylene (CPE) pipe bedded in drain gravel. The underdrain system is designed to capture seepage through the overlying leach pad structural fill as well as natural springs beneath the foundation. The ravine drains discharge into the Underdrain Monitoring Sump at the base of the leach pad and ponds. Phase 1 is located at the convergence of two natural drainages that make up the Phase 3 and 4 leach pads, therefore a temporary collection system is designed upstream of Phase 1, at the low spot of each natural drainage. The collection system ties into a solid wall 450 mm diameter HDPE DR11 pipe that discharges at the same location as the underdrains. The leach pad is designed with a composite liner system consisting of (from top to bottom):
• A 700-mm thick drainage layer overliner containing a network of solution collection pipes described below;
• A 1.5-mm thick, single-sided textured, high density polyethylene (HDPE) geomembrane;
• A 300-mm thick compacted soil liner bedding with a permeability of no greater than 1 x 10⁻⁵ centimeters per second (cm/sec) or a geosynthetic clay liner (GCL) with a permeability of no greater than 5 x 10⁻⁹ cm/sec where allowed according to the stability evaluation/criteria; and
• Prepared subgrade. The Pregnant and Event Ponds utilize a similar composite lining system as the HLF with an additional secondary 1.5 mm HDPE geomembrane and geonet layers above the soil bedding layer. These additional layers provide a synthetic dual-containment and leak detection system. The Satellite Pond is not expected to receive any fluids during average climate conditions and was therefore designed with a single geomembrane lined system without the secondary geomembrane and geonet layers. Material suitable for use as soil liner bedding appears to be sparse within the limits and immediate proximity of the HLF and WRD. Soil liner bedding may be either mine waste

Cerro del Gallo Heap Leach Project NI 43-101 Technical Report
January 31, 2020 Page 17-11
that meets the material requirements for soil liner bedding or it may need to be imported from local off-site sources. The drainage layer overliner material placed above the leach pad geomembrane is a free-draining crushed durable gravel with a minimum permeability of 1 x 10⁻¹ cm/sec. The overliner material is placed on lined leach pad slopes flatter than 10%. Lined slopes steeper than 10% rely on the ore to convey the solution into the solution collection pipes. The first lift of ore placed on the geomembrane liner needs to meet maximum particle size requirements and have a minimum permeability of 1 x 10⁻³ cm/sec. The minimum permeability requirement of the overliner is designed to prevent the maximum head on the liner exceeding 0.7 m. A small portable crusher operated by a contractor is planned to manufacture the overliner material by crushing and processing durable mine waste rock that has been mined from the mine pit, or durable rock developed through on-site excavation within the footprint of the leach pad or process facilities. The leach pad is divided into solution collection cells using geomembrane-lined cell separation berms. During leaching of the ore, solution is collected above the composite liner system by a network of perforated collection pipes within the drainage layer overliner material. The perforated solution collection piping network consists of 100 to 450 mm diameter N-12 corrugated polyethylene (CPE). The cell outlet pipes from each cell’s low spot consists of a 600 mm diameter HDPE solid wall pipe that conveys the leachate to the Pregnant Pond located at the down-gradient end of the leach pad. The pipe type and size are selected based on the expected amount of leachate solution and the expected maximum ore height that the pipe will experience. Solution will be applied to each lift of ore placed on the leach pad at a weighted average rate of 8 liters per hour per square meter (L/hr/m2) that consists of two leach cycles as described by KCA in Section 17.1. The first cycle is designed to be applied to the heap at 12 L/hr/m2 for 40 days and the second cycle is designed to be applied to the heap at 6 L/hr/m2 for 80 days. The leachate solution is planned to be pumped and applied to the ore at a maximum total volumetric flowrate of 1,400 m3/hr. Given this solution application rate and the minimum permeability of the overliner, the collection pipe size and spacing at the base of the heap have been designed to maintain a maximum 700 mm hydraulic head on the leach pad liner system During operations, a gypsum slurry will be produced as a by-product of the SART operations. To manage the gypsum slurry, a lined Gypsum Pond has been designed in the upper reaches of the eastern drainage of the WRD, as shown on Figure 17.2.1. Due to the potentially high concentration of cyanide in the gypsum slurry, the pond will consist of the same double liner system that has been designed for the Pregnant and Event

Cerro del Gallo Heap Leach Project NI 43-101 Technical Report
January 31, 2020 Page 17-12
Ponds. The Gypsum Pond is designed with a capacity to contain 2 years of gypsum produced. After two years of pumping gypsum slurry into the pond from the SART plant, the pond will either be capped with a single geomembrane liner system, or the crest will be raised using downstream construction to increase the storage capacity. During the first 2 years of operation the gypsum slurry volume and geotechnical properties will be monitored to explore other disposal and storage options. The natural topography within the leach pad ranges from about 2 percent to 50 percent grade. Substantial local grading is required for constructability and geotechnical stability including:
• A toe fill is required at the downhill end (eastern toe) of the leach pad to meet the minimum geotechnical factors-of-safety. The toe fill is designed with a maximum 2 percent grade sloping towards the west to promote drainage of the solution collection system above the geomembrane liner.
• A fill bench is required on the ridge between Phase 1 and 2, near the toe of the heap.
The leach pad is designed to have a maximum internal slope of no steeper than 2.5H:1V so typical construction equipment can be safely employed without additional controls. Storm water diversion channels are sized to contain the runoff from upstream basins resulting from the 1 in 100-year, 24-hour storm event that is a typical industry standard. The diversion channels around the HLF and process ponds are designed to convey this runoff in riprap-lined diversion channels. Sediment control structures are designed in drainages downstream of the facility to control sediment from runoff conveyed in diversion channels and underdrain flows.
Process Water Balance
A pre-feasibility level evaluation of process water management for the HLF and WRD was developed. This evaluation included development of a deterministic water balance that accounts for inflows such as rain and leach solution, outflows such as evaporation and consumptive loss due to ore and waste rock wetting. To estimate inflow and outflow water requirements, the following criteria were given by KCA unless otherwise stated:
• Average as-mined moisture content and specific moisture retention of the ore and waste rock;
• Nominal solution application rate to the leach pad is 8 l/hr/m²;

Cerro del Gallo Heap Leach Project NI 43-101 Technical Report
January 31, 2020 Page 17-13
• Average and maximum solution flow rate to the leach pad is 1,280 m3/hr and 1,400 m3/hr, respectively;
• Solution will be applied with drip irrigation emitters; • MDA has estimated the total waste rock produced during mining activities is
approximately 58 Mt. The WRD will store 55 Mt of waste using a dry waste rock density of 1.9 tonnes/m3. The remaining waste rock produced during mining (approximately 3 Mt) will be used for the construction of mine facilities, including HLF foundation;
To estimate inflow and outflow water requirements, the following criteria were assumed:
• Barren tank contains a negligible fluid storage capacity and was ignored in the water balance calculations;
• The WRD will be reclaimed progressively with a robust cover system immediately after each section of the dump is stacked to its ultimate configuration, moving west to east;
• Temporary diversion channels are designed upslope of each WRD lift to limit the amount of runoff from undisturbed areas that report to the contact water ponds.
• The HLF process and event ponds were sized using the ultimate configuration of the leach pad, which occurs from years 6 through 16 of operations.
• Phased leach pad areas; • Waste Rock Dump areas by year;
Solution Storage The HLF is designed to be a zero-discharge facility during average and wet annual climate conditions. The HLF utilizes a Pregnant, Event, and Satellite ponds to collect and store solution. The process ponds are designed to contain the leachate solution and stormwater runoff from the heap during the 1 in 100 wet year climate scenario when the Phase 4 leach pad is in operation. The HLF process ponds include provisions to accommodate the volume storage requirements from the following combined design conditions, below 0.6 meter of freeboard across all three ponds:
17.2.5.1.1 Pregnant Pond • Operational volume: 36 hr working volume at the average solution application rate
of 1,280 m3/hr; • Capacity for pump shutdown: 12 hr drain down at the maximum solution
application rate of 1,400 m3/hr;

Cerro del Gallo Heap Leach Project NI 43-101 Technical Report
January 31, 2020 Page 17-14
17.2.5.1.2 Combined Pregnant and Event Ponds • Operational volume: 36 hr working volume at the average solution application rate
of 1,280 m3/hr; • Capacity for pump shutdown: 12 hr drain down at the maximum solution
application rate of 1,400 m3/hr; • Maximum accumulation of water in the ponds resulting from the annual average
precipitation; • Runoff from the design storm event (1 in 100, 24 hr storm depth of 111.8 mm);
17.2.5.1.3 Combined Pregnant, Event and Satellite Ponds • Operational volume: 36 hr working volume at the average solution application rate
of 1,280 m3/hr; • Capacity for pump shutdown: 12 hr drain down at the maximum solution
application rate of 1,400 m3/hr; • Maximum accumulation of water in the ponds resulting from the 1 in 100 wet year
precipitation. Table 17.2.1 presents the required storage volume of the process ponds. The approximate volume of the process pond based on the storage criteria listed above. Table 17.2.2 presents the capacity of the ponds below freeboard.
Table 17.2.1 Total Required Storage Volumes
Criteria Pregnant Pond (m3)
Combined Pregnant and Event Ponds
(m3)
Combined Pregnant, Event, and Satellite
Ponds (m3)
36-hr Operating Volume 46,080 46,080 46,080
12-hr Draindown Volume 16,800 16,800 16,800
100-yr, 24-hr Storm Volume — 94,200 —
Average Annual Fluid Accumulation Volume
— 52,832 —
1 in 100 Wet Year Annual Fluid Accumulation Volume
— — 550,428
Total Scenario Storage Volume Required Below Freeboard
62,880 209,912 613,308
Source: Golder (2019)

Cerro del Gallo Heap Leach Project NI 43-101 Technical Report
January 31, 2020 Page 17-15
Table 17.2.2 Designed Pond Storage Volumes
Criteria
Pond Storage Volume Below Freeboard (m³)
Pregnant Pond
Event Pond
Satellite Pond
Individual Pond Storage 86,200 160,800 366,800 Total Combined Storage 613,800
Notes: 1. Pond storage capacities shown use a freeboard depth of 0.6m Source: Golder (2019)
Make-up Water Requirements
17.2.5.2.1 Average Climate Conditions During average climate conditions, the make-up water requirements are reduced with each subsequent phased expansion. Table 17.2.3 presents the approximate make-up water flow rates required for Phases 1 through 4 during average climate condition.
Table 17.2.3 Make-up Water During Average Climate Conditions
Month Phase 1 (m³/hr) Phase 2 (m³/hr) Phase 3 (m³/hr) Phase 4 (m³/hr) January 88.7 84.5 82.2 79.1 February 97.9 94.3 92.3 89.6 March 111.5 109.2 107.9 106.1 April 115.3 112.2 110.5 108.2 May 105.3 95.9 90.7 83.7 June 70.8 42.3 26.5 5.2 July 49.9 11.7 0.0 0.0 August 59.5 29.3 1.4 0.0 September 57.0 27.6 0.0 2.6 October 82.9 72.6 55.4 2.6 November 91.0 88.0 86.4 84.2 December 88.8 86.1 84.7 82.7 Average 84.9 71.1 61.5 53.7 Minimum 49.9 11.7 0.0 0.0 Maximum 115.3 112.2 110.5 108.2
Source: Golder (2019)
17.2.5.2.2 1 in 100 Dry Year Climate Conditions During the 1 in 100 dry year climate conditions, the make-up water requirements remain constant throughout operations. Make-up water requirements typically go down for each phased expansion due to the increased lined area that captures additional precipitation runoff that can be used in the process circuit. Since the 1 in 100 dry year annual precipitation is 0.0 mm, there is no additional runoff captured with the phased expansions. Table 17.2.4 presents the approximate make-up water flow rates required for Phases 1 through 4 during the 1 in 100 dry year climate condition.

Cerro del Gallo Heap Leach Project NI 43-101 Technical Report
January 31, 2020 Page 17-16
Table 17.2.4 Make-up Water During the 1 in 100 Dry Year Climate Conditions
Month Phase 1 through 4 (m³/hr)
January 114.5 February 125.0 March 139.7 April 145.9 May 144.8 June 136.8 July 128.6 August 125.7 September 121.2 October 118.4 November 115.1 December 111.8 Average 127.3 Minimum 111.8 Maximum 145.9
Source: Golder (2019)
Excess Water Treatment During Reclamation After the leach pad has been stacked to capacity or ore stacking has ceased, the heap will be rinsed in an effort to remove unwanted constituents from the ore, which may include metals and cyanide. The ore on the leach pad will be rinsed for a period of time that is necessary to bring the solution to an acceptable discharge quality. During this period, the drain down of rinsing solution and precipitation that drains down through the heap would exceed the capacity of the ponds during average and wet climate conditions. Therefore, a water treatment plant capable of removing 127,000 m3 and 620,000 m3 of annual excess water from the process ponds during the average and 1 in 100 wet year climate, respectively, has been incorporated into the process fluid system during this period.
SART
Pregnant solution will be treated in a SART plant for removal of copper and silver prior to entering the ADR plant for recovery of gold. Copper precipitation in the SART circuit also includes silver, as both are expected to precipitate together.
Copper Precipitation Copper precipitations operations include acidification of pregnant solution, precipitation of copper with sodium hydrosulfide in three agitated tanks, thickening copper precipitate, recycling thickener underflow solids to the precipitation tanks, neutralizing acidified thickener underflow prior to filtration and filtration. Filter cake will be conveyed to one of two drying pads with four days of capacity. The filter cake will be dried with air and construction heaters, if required. The dried copper precipitate will be sized to pass a

Cerro del Gallo Heap Leach Project NI 43-101 Technical Report
January 31, 2020 Page 17-17
5 mm screen and loaded in plastic lined 20-ton containers or 1-tonne bulk bags for shipment.
17.2.6.1.1 Pregnant Solution Acidification Concentrated sulfuric acid, 98 wt.%, will be mixed to 30 wt.% in a dilution tank. Pregnant solution will flow through an in-line mixer and be combined with 30 wt.% sulfuric acid to acidify the incoming pregnant solution to pH 4.0-4.5. The current design is for 1,400 m3/hr of pregnant solution (nominal flow of 1,280 m3/hr).
17.2.6.1.2 Copper Recycle Mix Tank Thickener U/F recycle slurry, 15-43 m3/hr at 10-25 wt% solids, is combined with fresh sodium hydrosulfide solution in the Copper Recycle Mix Tank before entering the first precipitation reactor. Sodium hydrosulfide, 25 wt%., is added to the Copper Recycle Mix Tank to condition the sulfide surface before entering the precipitation tank. The recycle mix tank will have a residence time of 2 minutes, diameter 1.7 meters and total height 4.2 meters, and constructed of 304 SS. The tank is agitated with dual A200/A510 impellers, 5.5 kW motor with shaft seal.
17.2.6.1.3 Copper Precipitation Tanks The acidified pregnant solution is combined with recycled, conditioned copper precipitate in the first of three agitated precipitation tanks. The solution overflows from the third precipitation tank into the Copper Sulfide Thickener. The precipitation tanks are sized for 1451 m3/hr at 1.1 wt% solids, with a residence time of 5 minutes per tank for a total of 15 minutes. The tank diameter is 5.7 meters and total height 7.2 meters and constructed of 304 SS. The tank is agitated with dual A510E impellers, 15 kW motor with shaft seal.
17.2.6.1.4 Copper Thickener Solution overflowing the third precipitation tank will be combined with flocculent in the Copper Sulfide Thickener. Copper Sulfide Thickener overflow solution will gravity flow to the Neutralization Reactor. Copper Sulfide Thickener underflow will be recycled to the Copper Rapid Mix Tank, and advanced to the Filter Feed Tank. The Copper Sulfide Thickener, 25 meters diameter x ~2.6 meters high, is high‐rate thickener constructed of 304 SS and is covered. The thickener rake mechanism has an 11 kW motor. The design pressure will be for -500 mm H20 to 700 mm H20. The slurry is flocculated with 5 g/m3 flocculent and thickened to an underflow percent solid from 10‐25% solids. The design thickener rise rate is 3.0 m/hr. Flocculent will be delivered dry and mixed in a standard mixing system and stored at a concentration of 0.5%. Flocculent will be diluted at the feed well to 0.02 wt.%.

Cerro del Gallo Heap Leach Project NI 43-101 Technical Report
January 31, 2020 Page 17-18
17.2.6.1.5 Copper Precipitate Filtration The Copper Thickener underflow will advance to the Filter Feed Tank and be filtered in the Copper Filters. The wet filter cake is conveyed to drying pads, dry material sizing, and conveyed to containers for bulk shipment to a smelter.
17.2.6.1.6 Copper Filter Feed Tank Copper Thickener underflow slurry advancing at 2.0-5.6 m3/hr at 10-25 wt.% solids will be stored in Copper Filter Feed Tank. The slurry at pH 4.0-4.5 will be neutralized with caustic solution 20 wt%, 0.027 m3/hr to pH 7-8. The Copper Filter Feed Tank provides a residence time of 12 hours. The tank diameter is 4.2 meters, total height 5.2 meters, and constructed of 304 SS. The tank is agitated with a single A510E impeller, 19 kW motor with shaft seal.
17.2.6.1.7 Copper Filtration Copper precipitate filtration cycles will operate manually every 4-8 hours. The batch cycle will be initiated by the operator, and the filter will be filled at a rate of 36 m3/hr. The filling cycle will be followed by filtrate removal with a core blow. The filter cake be subjected to a blow cycle, and will discharge with a cake moisture of 40 wt.%. A specific filtration rate of 33 kg/m2/hr, 15.9 mm per recessed plate, 30 mm cake thickness, and 10-16 bar operating pressure will give a filter with a total chamber volume of 3.5 m3. Two filters will be installed. Cake blow will be designed for 2 minutes at 1 m3/m2-min. Filtrate will be returned to the Neutralization Tank at a rate of 18 m3/hr.
17.2.6.1.8 Filter Cake Conveying Copper filter cake will be produced at a rate of 0.728 tph as a 40 wt% cake, 0.296 tph dry cake based on 90% copper precipitation and 95% silver precipitation. The filter cake may assay up to 61.6 wt% copper and 1.174% silver and may be contaminated with gypsum and sediments that may lower the metal grades. Copper filter cake batches will be conveyed away from the filter press over a 15-30 minute period at a rate of 6.1 wet tph to one of two drying pads. One drying pad will provide 4 days of residence time. Filter cake moisture will be reduced from 40 wt% to 15-20 wt%. The drying pads will be partially covered, with fans to blow air over the filter cake. Two construction type propane heaters rated for 1 million BTU/hr/each will provide heat for drying during winter nights. The dried filter cake will be sized to 100% minus 5 mm with a roll crusher/lump breaker and vibrating screen. The screen underflow product will be conveyed at a rate of 2 tph to 20-ton containers. The blended copper concentrate will be sampled from the conveyors as they fill the containers for concentrate settlement purposes. Two 20-ton containers will be filled every four days.

Cerro del Gallo Heap Leach Project NI 43-101 Technical Report
January 31, 2020 Page 17-19
17.2.6.1.9 Caustic Scrubber Systems The Copper Recycle Mix Tank, Copper Precipitation Tanks, Copper Sulfide Thickener, Copper Filter Feed Tank, NaSH Storage Area sumps and Copper Area sumps will be ventilated to a caustic scrubbing system. The caustic scrubbing system will consist of two scrubbers, both packed towers with integral pumps, instrumentation and fan on UPS and emergency power. All motors will have VFD drives. The scrubbing system will remove hydrogen sulfide and hydrogen cyanide from the vent gases with 10-20 wt% caustic solution. The scrubbing system design allows for a normal operating case and an emergency operating case. The normal operating case will treat 6,800 Nm3/hr (4,000 scfm) with assumed HCN and H2S concentrations of 100 ppmv. The scrubber efficiency of 99.8% will discharge 0.2 ppmv HCN and H2S. The emergency scrubber system will operate with caustic solution circulating to the top of the packing and back to the pump, but not through the packing. Continuous hydrogen cyanide and hydrogen sulfide monitors will divert Normal Scrubber Discharge gas to the emergency scrubber when a high concentration of either gas is detected and simultaneously open the valve to distribute solution to the emergency column packing. The emergency scrubber is designed to treat a burst of gas at 17,100 Nm3/hr (10,000 scfm), 76,800 ppmv H2S, and 61,300 ppmv HCN for 5 minutes. The scrubber will discharge 10 ppmv HCN and 15 ppmv H2S. The quantity and concentrations of gas for the emergency release case are based on complete acidification of one precipitation tank as a batch process, with release of all reactive gases. The gas burst duration was based on review of plant operating data in a metal sulfide leach process with concentrated sulfuric acid that generated large pulses of hydrogen sulfide gas. The Normal Operation Scrubber is 1.0 meters diameter and 6.4 meters high with 13.6 m3/hr circulation rate with a 3 minutes solution hold-up, and is constructed of FRP. The Emergency Scrubber is 1.0 meters diameter and 9.9 meters high with 17.0 m3/hr circulation rate with 8 minutes of solution hold-up, and is constructed of FRP. A single extension stack from the scrubbing system will vent gas from both scrubbers 20 meters above grade.
17.2.6.1.10 On-Line Analysis In order to minimize operator exposure to process streams containing HCN and H2S, timely respond to fluctuations in copper concentrations caused by normal operations and

Cerro del Gallo Heap Leach Project NI 43-101 Technical Report
January 31, 2020 Page 17-20
sudden rainfall, and reduce over and under feeding of reagents, an on-line analyzer is provided. On-line analysis of Cu, Zn, Cd, Ag, pH, redox and sulfuric acid will be determined from five streams, the pregnant solution, the acidified pregnant solution, and the discharge from each precipitation tank. The system includes stream sampling with a multiplexer, primary and secondary sample filtration, XRF analysis of Cu, Zn, Cd, and Ag, and analysis of pH, redox potential, and sulfuric acid with an automatic titrator.
17.2.6.1.11 Area Sump Pumps and Hydrogen Peroxide System Sump pumps in the sodium hydrosulfide area, and all acidic solution areas will be vented to the caustic scrubber system. The ventilated sumps will minimize accumulation of hydrogen sulfide gas in the sump areas. Hydrogen peroxide, 10 wt%, solution will be provided to sump areas and sample points in a ring-main type system to destroy hydrogen cyanide and hydrogen sulfide during upset process conditions.
Solution Neutralization Solution from the copper precipitate thickener will overflow by gravity to the Neutralization Tank. The acidified thickener overflow will be neutralized with slaked lime and recycled gypsum thickener underflow slurry. Slurry from the Neutralization Tank will discharge to the Gypsum Thickener. Gypsum thickener overflow solution will gravity flow to the ADR plant. Gypsum thickener underflow will be recycled and advanced to a storage pond the first year of operation and unused areas of the heap leach pad for the life of the mine.
17.2.6.2.1 Recycle Gypsum Mix Tank Recycle gypsum thickener underflow solids will be conditioned with slaked lime in the recycle mix tank to simulate a high-density sludge (HDS) process, and achieve higher underflow solids densities than typically generated by direct neutralization, which generates a low-density sludge. The recycle gypsum thickener underflow, 10.6 m3/hr, 25 wt% solids will be mixed with slaked lime, 5.8 m3/hr, 20 wt% solids in the Gypsum Thickener Recycle Mix Tank. The carbon steel/rubber lined tank will provide 5 minutes retention time and have a diameter of 1.5 meters and 2.0 meters total height. The tank will be agitated with a single A510E mixer with 3.7 kW installed power.
17.2.6.2.2 Neutralization Tank The acidified pregnant solution from the copper thickener, 1,407 m3/hr, is combined with recycled conditioned gypsum solids in the Gypsum Neutralization Tank, 16.4 m3/hr, caustic scrubber discharge, 0.1 m3/hr, and copper filter filtrate, 1.2 m3/hr. The solution overflows the Neutralization Tank through and upcomer to the Gypsum Thickener at a rate of 1425 m3/hr.
Cerro del Gallo Heap Leach Project NI 43-101 Technical Report
January 31, 2020 Page 17-21
The Neutralization Tank is sized for a residence time of ~5 minutes. The tank diameter is 5.7 meters and total height 7.2 meters, is constructed of carbon steel, and is rubber lined. The tank is agitated with a single A510E impellers, 3.75 kW motor.
17.2.6.2.3 Gypsum Thickener Solution overflowing the Neutralization Tank will be combined with flocculent in the Gypsum Thickener. Gypsum Thickener overflow solution will gravity flow to the ADR plant. Gypsum Thickener underflow will be recycled to the Recycle Gypsum Mix Tank, and advanced to a holding pond the first year of operation, and to unused areas of the heap leach pad thereafter. The Gypsum Thickener, 28.3 meters diameter x ~2.6 meters high is high‐rate thickener constructed of carbon steel. The thickener rake mechanism has a 15 kW motor. The slurry is flocculated with 5 g/m3 flocculent and thickened to an underflow percent solid from 10‐25% solids. The design thickener rise rate is 2.25 m/hr. Flocculent will be delivered dry and mixed in a standard mixing system and stored at a concentration of 0.5%. Flocculent will be diluted at the feed well to 0.02 wt.%.
Metal Recovery
The recovery plant is designed to recover gold and any silver not recovered by the SART plant by an adsorption-desorption-recovery (ADR) process. Precious metals in the heap leach pregnant solution will be adsorbed on to activated carbon in the carbon adsorption circuit (adsorption). Loaded carbon from the carbon adsorption circuit is then desorbed in a high-temperature elution process coupled to an electrowinning circuit (desorption), followed by drying and smelting of the resulting sludge to produce doré bullion (recovery). Prior to elution, each batch of carbon will be acid washed to remove any scale and other inorganic contaminants that might inhibit gold adsorption on carbon.
Adsorption The adsorption section of the ADR will consist of a single train of carbon columns consisting of five cascade type open-top up-flow carbon adsorption columns. Each of the carbon columns will have a capacity of 10 tonnes of activated carbon. Pregnant solution is pumped to the carbon adsorption columns by submersible pumps in the pregnant solution pond. Antiscale agent is added at the pump suctions to prevent scaling of the carbon that can affect carbon loading. Barren solution exiting the last carbon columns flow through a screen to separate and capture any floating carbon from the solution.
Cerro del Gallo Heap Leach Project NI 43-101 Technical Report
January 31, 2020 Page 17-22
Adsorption of gold from the pregnant solution is a continuous process. Periodically, the carbon contained in the lead column in the series becomes loaded with gold and is transferred to the acid wash and desorption circuit as a batch using carbon pumps. On average, approximately 5 tonnes of carbon per day are expected to be loaded and treated. The carbon columns hold a total of 10 tonnes of carbon so holding tank with retain 5 tonnes of loaded carbon while the remaining 5 tonnes are being stripped. Carbon in the remaining columns is then advanced, one at a time, and a batch of new (or stripped/regenerated) carbon is transferred into the final empty column from the unloaded carbon storage tank. Generally, the stripping of carbon will occur about 7 times each week with each strip lasting 12 to 16 hours.
Carbon Acid Wash Acid washing consists of circulating a dilute acid solution through the bed of carbon to dissolve and remove scale from the carbon. Acid washing is performed on a batch basis. After carbon is transferred into the acid wash column, but before any acid is introduced, fresh water is circulated through the bed of carbon to remove any entrained caustic cyanide solution. This rinse solution is pumped to a waste collection pipe with the acid wash circulation pump where it is transferred to the barren tank. A dilute acid solution is then prepared in the mix tank, and circulation is established between the acid wash vessel and the acid mix tank. Concentrated acid is injected into the recycle stream to achieve and maintain a pH ranging from 1.0 to 2.0. Completion of the cycle is indicated when the pH stabilizes around 2.0 without acid addition for a minimum of one full hour of circulation. After acid washing has been completed, the acid wash pump will transfer spent acid solution from the acid mix tank and wash vessel either to the acid recovery tank or directly to the waste collection pipe. The carbon is then rinsed with raw water followed by rinsing with dilute caustic solution to neutralize any residual acid. Total time required for acid washing a ten-tonne batch of carbon is four to six hours. After acid washing is complete, a carbon transfer pump will transfer the carbon to the desorption section.
Desorption A Zadra pressure elution, hot caustic desorption circuit has been selected for the CdG Project. This type of circuit requires 24 hours or less to complete a cycle and, for this reason, each strip batch is sized for ten tonnes of carbon. Each desorption cycle requires the transfer of a ten tonne batch from the acid wash circuit to the strip vessel.

Cerro del Gallo Heap Leach Project NI 43-101 Technical Report
January 31, 2020 Page 17-23
The desorption circuit is sized to elute, or “strip,” the gold from a ten-tonne batch of carbon into pregnant eluate solution. During the elution cycle, gold is continuously extracted by electrowinning from the pregnant eluate concurrently with desorption. A complete desorption cycle will require approximately 18 hours. After a batch of carbon has been transferred to the elution vessel, barren strip solution (eluant) containing sodium hydroxide and sodium cyanide is pumped through the heat recovery and primary heat exchangers, and introduced to the elution vessel at a temperature of 135°C and a nominal operating pressure of approximately 340 kPa (50 psig). Under normal operating conditions, barren eluant solution from the solution storage tank will pass through the heat recovery exchanger to be preheated by hot pregnant eluant leaving the elution column. The barren eluant solution then passes through the primary heat exchanger to raise the temperature up to 149 °C using pressurized hot water from the boiler system. The elution column contains internal stainless steel inlet screens to hold carbon in the column and to distribute incoming stripping solution evenly in the column. Pregnant eluant solution leaving the elution column passes through external stainless steel screens before passing the cooling heat exchanger to reduce the eluate temperature to about 75°C (to prevent boiling). The cooled pregnant eluate solution is sent to the electrowinning cells. After desorption is complete, half of the stripped carbon is pumped to carbon reactivation dewatering screens to remove water and carbon fines, and transferred to carbon regeneration. The other half of the carbon is screened to remove fines and transferred to the carbon storage tank.
Electrowinning and Refining The electrowinning circuit is operated in series with the elution circuit. Solution is pumped continuously from the barren eluant tank through the elution vessel, then through the electrowinning cells, and back to the barren eluant tank in a continuous closed loop process. The gold-laden solution exiting the elution column is filtered to trap any carbon escaping from the column; passes through the heat recovery exchanger and the cooling exchanger to reduce the solution temperature to 75ºC and flows to the electrowinning circuit. Gold is won from the eluant in the electrowinning cells using stainless steel cathodes and a current density of approximately 50 amperes per square meter of anode surface.

Cerro del Gallo Heap Leach Project NI 43-101 Technical Report
January 31, 2020 Page 17-24
Caustic soda (sodium hydroxide) in the eluate solution acts as an electrolyte to encourage free flow of electrons and promote the precious metal winning from solution. To keep the electrical resistance of the solution low during desorption and the electrowinning cycle, make-up caustic soda must sometimes be added to the barren eluant tank. Barren eluate solution leaving the electrolytic cells discharges to the E-cell discharge pump box where it is pumped back to the eluate storage tank for recycle through the elution column. Periodically, all or part of the barren eluant is dumped to the barren tank and new solution is added to the eluate storage tank. Typically, about one-third of the barren eluant is discarded after each elution or strip cycle. Sodium hydroxide and sodium cyanide are added as required from the reagent handling systems to the barren eluant tank during fresh solution make-up. The precious metal-laden cathodes in the electrolytic cells are removed about once or twice per week and processed to produce the final doré product. Loaded cathodes are transferred to a cathode wash box where precipitated precious metals are removed from the cathodes with a pressure washer. The resulting sludge is pumped to a plate-and-frame filter press to remove water and the filter cake is loaded into an electric dryer to remove moisture from the filter cake. After drying, the gold sludge will be mixed with fluxes and smelted in an electric furnace to produce doré bullion. Periodically, slag produced from the smelting operation is re-smelted on a batch basis to recover residual metal values, or will be crushed and manually added to the heap leach pad. A hood collects the furnace fumes which will pass through a bag house to remove particulates, then through an induced draft fan. The system will be designed to remove over 99.5% of the particulates present in the exhaust fumes.
Carbon Handling and Regeneration Thermal regeneration consists of drying the carbon thoroughly and heating it to approximately 750ºC for ten minutes. It is expected that thermal reactivation will be performed after every elution cycle to maintain carbon activity levels. The ten-tonne carbon batch to be thermally reactivated is dewatered on a static screen, transferred to the regeneration kiln feed hopper and fed to the regeneration kiln by a screw feeder. Hot, regenerated carbon leaving the kiln falls into a water-filled quench tank for cooling and storage. Carbon in the carbon quench tank is pumped to a vibrating

Cerro del Gallo Heap Leach Project NI 43-101 Technical Report
January 31, 2020 Page 17-25
screen; screen oversize is sent to the carbon storage tank and the screen undersize is collected in in the carbon fines tank, where periodically the carbon fines are dewatered using a filter press and stored in bulk bags. Ultimately, quenched regenerated carbon is pumped to the adsorption circuit dewatering screen to remove any fines and the coarse carbon is added to the adsorption circuit. New carbon is first added to the carbon conditioning tank which is equipped with an agitator and is used for attritioning new carbon. After attritioning, the new carbon is transferred to the unloaded carbon tank from which it is transferred to the adsorption circuit by a carbon transfer pump.
Reagents
Cyanide Sodium Cyanide is delivered as briquettes in 1,000 kg bulk bags or in ISO containers and is stored in a covered storage area with approximately 30 days of storage. Dual systems are installed to either mix the briquettes in an agitated tank or utilize a solid liquid system that pumps water through the ISO containers. Sodium cyanide is used to leach the gold and silver from the ore on the heap.
Cement Cement is delivered in bulk truckloads. Cement storage is in two 150-tonne silos with an estimated cement consumption in the range of 84 to 334 tonnes per day depending on sample type, with a LOM average of 166 tonnes per day. Cement from the silos is metered directly onto the agglomeration feed conveyors through variable speed feeders based on weightometer measurements. The cement silos will be equipped with bin activators and dust collectors.
Slaked Lime Pebble lime will be delivered and stored in a 150-tonne lime silo. The lime will be conveyed from the silo to a lime slaker system. Slaked lime will be stored in an agitated tank with 12 hours residence time at a solids density of 20 wt%. Slaked lime will be pumped to the Gypsum Thickener Mix Tank at a rate of 5.8 m3/hr. The Lime Storage Tank has a diameter 5.5 meters and total height 5.8 meters. The tank is agitated with dual A510E impellers with 5.6 kW installed power.
Sodium Hydroxide (Caustic) Sodium hydroxide will arrive as 50% solution in 10,000-liter containers. The caustic will be diluted to 20 wt% for storage. Storage will take place at the SART plant in a stainless tank, 2.7 meters diameter and 3.1 meters high. Caustic will be distributed from the SART plant to the ADR in a 55-gallon drum, or similar sized day tank.

Cerro del Gallo Heap Leach Project NI 43-101 Technical Report
January 31, 2020 Page 17-26
Concentrated Sulfuric Acid Concentrated sulfuric acid, 98 wt%, will arrive by truck in 20-ton batches. The truck will be unloaded into a single carbon steel tank 5.7 meters diameter, 5.7 meters high. The tank provides storage capacity for 3 days.
Sodium Hydrosulfide (NaHS) Sodium hydrosulfide will arrive in tanker truck at a 40 wt.% solution. The tanker truck will be unloaded into the Sodium Hydrosulfide Dilution Tank. The tanker contents will be sampled and diluted to 25 wt% for storage. The dilution tank is, 3.4 meters diameter and 4.0 meters high and is heat traced and insulated. The storage tank is 5.0 meters diameter and 5.4 meters high and is heat traced and insulated. The diluted storage tank provides 9 days of storage.
Flocculent Flocculent will arrive as a dry powder in 25 kg bags. Flocculent will be mixed in a flocculent mixing system, and transferred to a storage tank as 0.5 wt% solution. The flocculent storage tank provides 16 hours residence time and is 4.3 meters diameter and 4.8 meters high.
Antiscale Agent Antiscale Agent will be received in drums or plastic tote containers. Antiscale agent will be added by metering pumps at the barren solution and pregnant solution pump suction inlets. Antiscale agents will be used to prevent carbonate scaling in pumps, piping and on the carbon.
Hydrogen Peroxide Hydrogen peroxide, 10 wt.%, will be delivered to the SART plant in 10,000-liter containers and transferred into 304 SS storage tank. The design rate is for 100 L/hr, or 2.4 m3/day. The storage tank will be 2.5 meters diameter and 3.5 meters high and provide 12 m3 of storage, 5-days of storage. Hydrogen peroxide will be fed by pumps to sump areas and sample points in the SART plant area via a ring-main to destroy hydrogen cyanide and hydrogen sulfide as required.

Cerro del Gallo Heap Leach Project NI 43-101 Technical Report
January 31, 2020 Page 18-1
18 Project Infrastructure
Existing infrastructure for the CdG includes a site office, dirt and gravel roads, and limited power line throughout the Project site. Internet and cellular communications are currently available, though these systems will need to be expanded for operations.
18.1 Roads
Access to the Project site is by the paved Mexican Highway 110, and a secondary dirt road that goes to San Antón de las Minas community. A private road will enter into the mine property approximately 2 km before reaching the San Antón de las Minas community. This road will provide access to the administration offices, mine, process plant and other Project facilities. After the intersection of the private and community road, approximately 1.5 kilometers of the community road will be re-located a short distance to the south of the existing road.
Site Roads
Internal site roads are established to serve as mine haul roads, service roads and in-plant roads which connect the facilities for access purposes.
18.1.1.1 Haul Roads Haul roads have been designed for hauling ore and waste from the mine pit to either the crusher or to the waste rock disposal dumps. Haul roads are designed with a maximum percent grade of 10% and a 25-meter width. Maximum speed on these roads should be no more than 40 km/h. Haul roads will be constructed by the mining contractor.
18.1.1.2 Service Roads The site service roads are connected to the site access road and are used to join the site facilities. All service roads are designed at a maximum percent grade of 12.5% and a width of 8 meters. The combined service roads join the following areas:
• Administrative area; • Primary crushing; • Secondary and tertiary crushing; • Leach pad; • SART plant; • ADR plant.

Cerro del Gallo Heap Leach Project NI 43-101 Technical Report
January 31, 2020 Page 18-2
18.1.1.3 In-Plant Roads In-plant roads are required around the crushing area and are primarily for maintenance purposes. In-plant roads are designed at a maximum grade of 12.5% and a width of 6 meters for one-way access and 12 meters for two-way access.
18.2 Power Supply and Distribution
Power supply to the CdG Project will initially be generated on site using four each 2,500 KW diesel generator units operating, with an additional unit on standby. Power will be generated at 4,160 V, 3 phase, 60 Hz and stepped up to 13.8 kV by a transformer for site distribution. The generator system has been sized to meet the average power demand. It is assumed that in Year 1 of operations, power supply at 115KV will be available by connecting to the national grid and power generation at site will no longer be needed. Site power will be distributed using overhead power lines at 13.5 kV with the main substation be located near the largest power consumption area which will be the HPGR area. Power from the main substation will be stepped down to 13.8 kV and connected to the site distribution power line. Two of the temporary generators and their associated fuel tanks will remain at the project to be utilized as emergency power backup for the process plants.
Estimated Power Consumption
The estimated project power consumption is presented in Table 18.2.1. Required power for the operations and the facilities is approximately 6.1 MW on average for LOM, and 6.4 MW average excluding the first and last year of operation (4.8 MW and 3.4 MW power consumption for first and last years, respectively).

Cerro del Gallo Heap Leach Project NI 43-101 Technical Report
January 31, 2020 Page 18-3
Table 18.2.1 Project Electrical Power Consumption – LOM Average
Area Attached kW Annual kWh Consumed kWh/t Ore
Area 001 - Site & Utilities General 244 970,818 0.162 Area 005 - Power Generation & Site Distribution 15 55,741 0.009 Area 010 - Primary Crushing 408 1,896,219 0.316 Area 011 - Secondary Crushing 1031 4,790,778 0.798 Area 012 - Tertiary Crushing 4054 18,832,129 3.139 Area 020 - Agglomeration 477 2,211,334 0.369 Area 030 - Stacking System 992 3,881,043 0.647 Area 031 - Heap Solution Handling 2108 9,791,873 1.632 Area 035 - SART Plant 706 3,042,604 0.507 Area 040 - Recovery 288 1,337,440 0.223 Area 050 - Refining 144 667,719 0.111 Area 080 - Reagents 217 1,013,62 0.169 Area 090 - Water Distribution System 576 2,677,646 0.446 Area 100 – Laboratory 273 1,268,102 0.211 Total 11,260 52,437,070 8.740 Source: KCA (2019)
18.3 Water Supply and Distribution
The company San Antón de Las Minas S.A. de C.V. has a total of 8 water rights with different volumes to use on a yearly basis, totaling 1.44 million cubic meters, as shown in Table 18.3.1.
Table 18.3.1 Water Rights and Volumes
Concessionaire Title Number Granted Volume m3
San Antón de las Minas S.A. de C.V. 08GUA154831/12FMDL14 130,000 San Antón de las Minas S.A. de C.V. 08GUA154832/12FMDL14 130,000 San Antón de las Minas S.A. de C.V. 08GUA154833/12FMDL14 140,000 San Antón de las Minas S.A. de C.V. 08GUA123064/12FMDL16 300,000 San Antón de las Minas S.A. de C.V. 08GUA155423/12FMDL16 200,000 San Antón de las Minas S.A. de C.V. 08GUA110394/12FMDL16 140,000 San Antón de las Minas S.A. de C.V. 08GUA155418/12FMDL16 250,000 San Antón de las Minas S.A. de C.V. 08GUA155432/12FMDL16 150,000 1,440,000 Source: Argonaut (2019)
The project is expected to consume an annual average of 628,000 – 900,000 m3 per year, depending on the amount of leach pad in the circuit. San Antón currently has two wells that tests indicate will provide approximately half of the maximum project demand. Additional wells will be drilled to provide the remainder of the estimated maximum demand of 55 L/s.

Cerro del Gallo Heap Leach Project NI 43-101 Technical Report
January 31, 2020 Page 18-4
As discussed in further detail in Section 24.2, there are two water wells that belong to the CdG Project. The first water well is located about 4 km from the property boundary. It is completely closed, protected, and ready to install the pump and pipes. The power supply will be through the CFE power line that passes nearby. The second well is 7.5 km from the property boundary. This well is piped and already connected to the CFE power line. Flow tests on these two wells resulted in sustainable flows of 12 L/s and 16 L/s, respectively. There is a plan to drill more wells to reach the design, short term water requirement of 55 L/s. A current study was conducted to find the zones and targets to find water on the average of 25-30 L/s. The project will require water supply for the following uses:
• Mining operations for dust control, drilling, etc.; • Crushing for dust control; • Makeup water for the heap leach pad; • Process plant and laboratory; • Modular offices and other site facilities.
Process Water
Golder determined operational water requirements in conjunction with climatic conditions, as discussed in Section 17. The process water balance considers the water consumed by the Project and the water collected from precipitation events on the Project components in addition to seasonal evaporation. Solution from the heap leach pad will drain to the Pregnant Pond, where it will be pumped through the processing facility to recover precious metals and then pumped back to the leach pad in a continuous cycle. The Event Pond will be located adjacent to the pregnant solution pond to allow containment of excess process solution during precipitation events which will add additional water to the contained system. A Satellite Pond will also be included where excess water can be transferred for containment. The Pregnant, Satellite and Event Ponds were designed with a combined capacity to contain normal process volumes and contingent storage capacity for a total of 613,800 m3 below the freeboard level. Process water requirements are first met by pumping collected waters from the Event and Satellite Ponds; after that resource is exhausted, make-up requirements will be met by well water.

Cerro del Gallo Heap Leach Project NI 43-101 Technical Report
January 31, 2020 Page 18-5
Raw Water
Raw water for the project will be pumped directly from the water wells to raw water tanks. There are two raw water tanks included in the project; one tank located next to the administration area and a secondary water tank located near the crushing area. A pumping system will be included at the primary raw water tank to pump water directly into the secondary water tank so during normal operation, the water wells will only need to pump into the primary water tank. Water from the storage tanks will gravity flow to be utilized in the process facilities and for domestic uses.
Potable Water
Potable water will be bottled and delivered to the project site.
Fire Water
The raw water tank located near the administration area will be dual-purpose tank, a portion of this tank will be designated for fire water use.
18.4 Project Buildings
The project facilities will be supplied in the form of a modular office, shipping containers for warehouse storage, the refinery will be masonry walls with a structural steel roof, the motor control centers (MCC) are assumed to be modified shipping containers and prefabricated steel buildings will be used for the administration building, laboratory, guard house, clinic, dining room, training room.
18.5 Explosives Storage
Facilities for the proper storage and safekeeping of explosives are included. These facilities will be designed and located in compliance with Mexican regulations. Within a dedicated area fenced for explosives, there will be one ventilated silo and two CMU brick explosive magazines. The silo is designated for Ammonium Nitrate storage. The explosive storage silo will have a capacity of approximately 65 tons of ammonium nitrate. A 200 m2 CMU brick powder magazine will be used to store low explosive products, such as ANFO, emulsion packaging, boosters and detonation cord. A smaller 20 m2 magazine will be used to store the detonators and will have at least 300 meters separation from the larger magazine and silo.

Cerro del Gallo Heap Leach Project NI 43-101 Technical Report
January 31, 2020 Page 18-6
Approximate distances from the explosives storage to notable infrastructure are as follows:
• 600 meters north of the heap leach boundary; • 1,100 meters north of the primary crusher; • 200 meters north of the LOM waste rock dump limit; • 2,200 meters north of the admin building.
All of the above distances exceed the minimum safety distance requirements of the explosive regulations established by Secretaría de la Defensa Nacional (SEDENA) plus a natural barrier between some of the facilities.
18.6 Security
Access to the project will be limited by perimeter fencing around the entire site. A guardhouse at the primary entry point to the project will serve as a security check point that will be manned 24 hours per day, 7 days a week for identification control, random checks, drug and alcohol monitoring and vehicle check-in/out. A security contractor will be used for general site security and protection of mine assets.
18.7 Waste Disposal
Sewage
Wastewater and sewage will be handled by subsurface local septic tanks and centralized leach-fields.
Solid Waste
Special wastes such as waste oil, glycol coolant, solvent fluids, used oil filters, used batteries, and contaminated fuel, will be handled, stored, transported, and disposed of in accordance with appropriate Hazardous Waste Regulations. A certified transport and disposal company will collect all waste to transport offsite for final disposal. A fenced temporary storage facility for hazardous waste will be included. A roofed storage area will be designated for used batteries, used lubricants, coolant and other miscellaneous fluids, and used tires. A site for temporary storage of recyclable materials will be established. Such items as scrap metal, tires, glass, recyclable plastics and drink containers will be separated, containerized as appropriate, and temporarily stored until sufficient volumes are available for shipment to a recycling point.

Cerro del Gallo Heap Leach Project NI 43-101 Technical Report
January 31, 2020 Page 18-7
Non-recyclable and non-hazardous waste will be managed with a dedicated local company and waste sent to the Dolores Hildalgo municipal landfill. There currently exists waste disposal service in the San Antón de las Minas community on a weekly basis. The project will contract waste disposal services to the current established infrastructure. A location on the mine site will be designated as an outdoor storage or ‘boneyard’ area for placement of items that are not yet ready for disposal, but which may still be of use for spare parts. These items are likely to include equipment parts, vehicles, and pieces of equipment, and metal components. As much of this material as possible will be utilized during the mine life. Materials remaining in the boneyard at the end of mine life will either be shipped off site for salvage value, recycled, or disposed of in the landfill if they meet the criteria for disposal at that location.

Cerro del Gallo Heap Leach Project NI 43-101 Technical Report
January 31, 2020 Page 19-1
19 Market Studies and Contracts
No market studies for gold were completed and no contracts are in place in support of this Technical Report. Gold production can generally be sold to any of a number of financial institutions or refining houses and therefore no market studies are required. Multiple potential buyers were contacted for potential purchase of the SART precipitate. One company provided payment terms for the SART precipitate. Based on this response, the terms used for this study are as follows:
• Metal Payments o Copper – 90% of the concentrate content o Silver – 90% of the concentrate content o Gold – 90% of the concentrate content
• Deductions o Treatment Charge – US$230.00 per dry tonne of concentrate. Increase
by US$0.125 per dry tonne for each US$1 that copper is over US$5,300 per tonne.
o Copper Refining Charge – US$0.27 per pound of the payable copper. o Silver Refining Charge – US$1.00 per troy ounce of the payable silver. o Gold Refining Charge – US$10.00 per troy ounce of the payable gold.
The base case financial model for the CdG Project utilizes a gold price of US$1,350/oz, silver price of US$16.75/oz, and copper price of US$6,000/t. This study assumes that mining operations will be conducted by contractors working under the supervision of the chief mining engineer. The required contracts are:
• A general mining contractor; • A blasting agent/high explosives manufacturer that will also be responsible for
delivering the blasting products to the site, loading the blast holes and detonating the blasts;
• A specialty drilling contractor to drill small diameter holes for pre-splitting final pit walls and drilling holes for slope reinforcement if the general mining contractor cannot perform these tasks. (Quotations for these services have been received and were used to estimate costs for the study, but no contracts are currently in place.)

Cerro del Gallo Heap Leach Project NI 43-101 Technical Report
January 31, 2020 Page 20-1
20 Environmental Studies, Permitting and Social Impact
According to Mexican regulations, a project such as CdG requires the preparation, evaluation and approval of three distinct studies by the General Directorate of Impact and Environmental Risk (DGIRA) of SEMARNAT (Mexico´s environmental authority). These studies are: the environmental impact statement (MIA), the environmental risk assessment (ERA), and the justified technical study for land use change (ETJ). Depending on the level of risk and scope, these documents may be evaluated separately in Mexico City, at the state delegation of SEMARNAT where the project is located, or by filing in a unified technical document for land use change (DTU), which is evaluated exclusively at SEMARNAT main office in Mexico City. Argonaut retained the services of Hermosillo-based firm MC Terra to prepare the corresponding DTU for CdG. According to the General Act for Ecological Equilibrium and Environmental Protection (LGEEPA), this evaluating process can take up to 60 business days to be completed but it can be extended for an additional 60-day period at the discretion of DGIRA based on alleged project complexity. The DTU evaluation can also be stopped once during the compulsory period if clarifications and/or additional information are requested. The CdG DTU was filed at DGIRA on April 26, 2019. Additional information and clarifications were required by DGIRA on June 28, 2019 and the corresponding reply was filed in on August 29, 2019. On September 5, 2019, DGIRA resolved to extend the evaluation period for 60 additional business days. In late December, 2019, SEMARNAT informed Argonaut that it will not approve the DTU in its current form and requested that Argonaut make minor revisions and re-submit the application. Argonaut expects to re-submit a revised DTU that satisfies SEMARNAT’s requests during the first quarter of 2020 and, as per SEMARNAT’s stated policy, to receive a decision from SEMARNAT on the revised application within 60 working days of submission.
20.1 Waste Management
20.1.1 Mining Waste
Under SEMARNAT guidelines, waste rock with a neutralization potential ratio (NPR) value less than three is designated as potentially acid generating (PAG), where NPR is the ratio of the neutralization potential (NP) to the acid potential (AP). Waste rock
Cerro del Gallo Heap Leach Project NI 43-101 Technical Report
January 31, 2020 Page 20-2
samples (84 samples) were selected from available drill core for static testing (whole rock metals analysis and acid base accounting). The number and distribution of samples were selected to represent the lithologic and spatial distribution of waste rock. The goal of static testing is to provide an initial assessment of the acid generation and static leaching potential of waste rock interacting with the environment. Preliminary results from static testing show that 65% of samples are designated as PAG based on the NPR. The average NPR of all 84 samples is 1.5, and the median NPR is 0.7. Results from the whole rock metals analysis show that up to 21% of samples tested exceed SEMARNAT regulations for at least one analyte and may be at higher risk of metals leaching. Argonaut will continue testing in accordance with Mexican regulations to examine the lithological and spatial distribution of the static testing results. The following waste rock characterization testing will be conducted:
• Leach testing on material exceeding SEMARNAT whole rock metals concentrations;
• Kinetic testing by humidity cell tests.
The findings from the completed static test and the leach testing will be used to select samples for kinetic testing. Kinetic testing is recommended to address uncertainties identified during the static testing program and will also provide a detailed evaluation of sulfide oxidation and expected field behavior (lag time to acid generation, oxidation rates, long-term water quality) of PAG samples.
20.1.2 Hazardous and Non-Hazardous Waste Management
Special wastes such as waste oil, glycol coolant, solvent fluids, used oil filters, used batteries, and contaminated fuel, will be handled, stored, transported, and disposed of in accordance with appropriate Hazardous Waste Regulations. A certified transport and disposal company will collect all waste to transport offsite for final disposal. A fenced temporary storage facility for hazardous waste will be included. A roofed storage area will be designated for used batteries, used lubricants, coolant and other miscellaneous fluids, and used tires. A site for temporary storage of recyclable materials will be established. Such items as scrap metal, tires, glass, recyclable plastics and drink containers will be separated, containerized as appropriate, and temporarily stored until sufficient volumes are available for shipment to a recycling point.

Cerro del Gallo Heap Leach Project NI 43-101 Technical Report
January 31, 2020 Page 20-3
Non-recyclable and non-hazardous waste will be managed with a dedicated local company and waste sent to the Dolores Hildalgo municipally landfill. There currently exists waste disposal service in the San Antón de las Minas community on a weekly basis. The project will contract waste disposal services to the current established infrastructure. A location on the mine site will be designated as an outdoor storage or ‘boneyard’ area for placement of items that are not yet ready for disposal, but which may still be of use for spare parts. These items are likely to include equipment parts, vehicles, and pieces of equipment, and metal components. As much of this material as possible, will be utilized during the mine life. Materials remaining in the boneyard at the end of mine life will either be shipped off site for salvage value, recycled, or disposed of in the landfill if they meet the criteria for disposal at that location. “Land farming” is a commonly used method of soil remediation for hydrocarbon contaminated soil that relies on natural breakdown of hydrocarbons by microbial action. This is done by spreading a shallow layer of contaminated soil onto a lined "bermed" area referred to as a biocell. In the event of a minor hydrocarbon spill on site, the contaminated materials will be treated using a biocell, as authorized in the Hazardous Waste Regulation.
20.1.3 Waste Water
The wastewater disposal systems for the camp and office areas will be engineered, constructed, and maintained under the direction of a qualified professional and will comprise separate septic systems for the office and housing facilities.
20.1.4 Air Emissions
The primary potential effect on air quality will be because of dust. Costs for watering the road and for dust control in the crushing circuit have been included in this Report. An air quality monitoring program will be initiated to ensure worker health and the environment are not adversely affected by air quality.
20.2 Water Management
Surface waters in the project area are exclusively ephemeral streams with water flow only during storm events and sometimes during the rainy season. Small retaining ponds are built along the drainages as sources of water for livestock and agriculture. As part of project environmental baseline studies, water from monitor water wells, potable water wells to the different communities, waterwheels around the project, and some retention ponds were sampled. Sampling of surface waters draining in the project area and monitoring wells will be continued through the life of the mine, including

Cerro del Gallo Heap Leach Project NI 43-101 Technical Report
January 31, 2020 Page 20-4
reclamation period and post-closure until it has been determined that reclamation has been successful in preventing long-term effects on surface waters. Water diversion structures will be constructed to keep surface water from flowing into the heap leach pad, mine pits, waste dumps and other operational areas. Surface drainage from disturbed areas which have no potential to produce chemical or metal contamination will be directed into small ponds to allow sediments to settle out before discharging to the environment
20.3 Environmental Regulatory Framework
Exploration and mining activities in Mexico are subject to control by SEMARNAT, which has authority over the two principal Federal permits:
i. A MIA, accompanied by an ER; and ii. A CUS, supported by an ETJ.
Table 20.4.1 summarizes the Federal, State, and Municipal permits required for mine construction, and Table 20.4.2 for mine operation and closure.

Cerro del Gallo Heap Leach Project NI 43-101 Technical Report
January 31, 2020 Page 20-5
Table 20.4.1 Permits Required for Mine Construction
Mining Stage Required formality Agency Response time
(Aprox.) Comments
CO
NST
RU
CTI
ON
OPT
ION
1
Environmental Impact Manifest
(MIA)
SEMARNAT 3-6 months Baseline studies should be conducted to support the MIA. A comprehensive environmental manifest shall be prepared and submitted to SEMARNAT for evalutation and authorization.
Land Use Change Study (ETJ)
SEMARNAT 2-3 months A detailed forestry inventory and a technical study shall be prepared and submitted to SEMARNAT for evaluation and authorization.
Risk Analysis Study (ER)
SEMARNAT 3-6 months A risk analysis shall be prepared and submitted and will be evaluated together with the MIA, when high risk substances such as cyanide is used in the process.
OPT
ION
2 Documento Técnico
Unificado (DTU) SEMARNAT 3-6 months A comprehensive technical document that
integrates information of the MIA, ER and ETJ should be prepared and submited to SEMARNAT for evaluation and authorization.
Land Use/construction Licence
Municipality 1 month An application letter shall be submitted to the municipal authorities to obtain the authoriztion letter.
Permit for disposal of non-hazardous residues
Municipality 1 month An application letter needs to be submitted to the municipal authorities, specifying the expected type and amount of non-hazardous waste from the mine construction and operation.
Explosive handling SEDENA, Municipality and State
Government of Sonora
3 months An application letter shall be submitted to SEDENA. Also an endorsement letter shall be obtained from the State Government and the Municipality.
Archeological clearance INAH 1 to 8 months A request letter should be submitted to INAH. A survey will be done by INAH personnel and if there is some archeological interest a rescue and documenting program will be performed.
Water use concessions CONAGUA 3 months CONAGUA has granted to the project 8 water tittles or concessions, for a total volume of water use per year of 1.44 million cubic meters. CONAGUA will be notified once the water usage begins. The volume of water to be used in the mining activities should be measured and paid.
Source: KCA (2019)

Cerro del Gallo Heap Leach Project NI 43-101 Technical Report
January 31, 2020 Page 20-6
Table 20.4.2 Permits Required for Mine Operation and Closure
Mining Stage Required formality Agency Response time
(Aprox.) Comments O
PER
ATIO
N
Water discharge permit CONAGUA 3 months An application needs to be filed before CONAGUA with estimated annual volume and the quality of the discharge. This may
include the sanitary service water discharge or any other water discharge to septic tanks
or natural environment. Operation licence SEMARNAT 2 to 4 months Needs to do an inventory of all air
emissions, water discharges and solid wastes.
Accident prevention plan SEMARNAT None Based on the risk analysis, it is necessary to establish a plan and procedures to prevent and respond to emergencies and accidental events. SEMARNAT will register this plan.
Mining residues managament plan
SEMARNAT None Need to prepare this plan according to NOM-157-SEMARNAT-2009. SEMARNAT
will register this plan
Hazardous waste generator registry
SEMARNAT None It is required to keep records of any hazardous waste movement at the mine facilities and deliveries to an authorized
external company.
ABAN
DO
NM
ENT Closure and reclamation
plan SEMARNAT Not specified Need to submit a comprehensive closure
and reclamation plan, as early as possible before the closure of the mine.
Source: KCA (2019)

Cerro del Gallo Heap Leach Project NI 43-101 Technical Report
January 31, 2020 Page 20-7
20.4 Social Management Plan and Community Relations
At the end of May 2018, Argonaut’s Corporate Affairs department analyzed the social issues and initiated work with the community of San Antón de Las Minas, on behalf of Argonaut and with the government of the state of Guanajuato, as well as the municipal government of Dolores Hidalgo. In May, Argonaut created an engagement plan with the community that included the immediate application of a scholar training program, the hiring of a community relations coordinator, as well as strengthening relations and participation with local governments, academy and the mining sector, making Argonaut visible as a company that does things responsibly. This resulted in a very good relationship with the state government. Argonaut continues to have the full support of the Director of Mines of Guanajuato and the Assistant Secretary of Economy. Argonaut has strengthened its presence with the mining sector and has communications with other mining companies, including the neighboring companies Vitromex and Cominsa. Argonaut implemented a program of Earth Science Workshops in San Antón, in which geology students explain the importance of mining and how mining is done today. A good relationship with the priest of the church was also established. The priest is the main moral authority in the area. Support for traditional celebrations has been provided. Good communications with the kindergarten, elementary and the middle school principals have also been established. Communications with several government entities and personnel have been ongoing, including:
• Secretary of Environment and Urban Development. State of Guanajuato;
• Assistant Secretary of Political Affairs. State of Guanajuato;
• Guanajuato University;
• Mayor from Dolores Hidalgo City.
Discussions on the Project and the plans to develop it were held. A strategic plan to reinforce relations with the communities and government is under development to operate during this year, and continues with participation and support of the neighboring communities.

Cerro del Gallo Heap Leach Project NI 43-101 Technical Report
January 31, 2020 Page 20-8
20.5 Closure and Reclamation Plan
Reclamation will be undertaken during mining activities where possible, but the majority of work will occur after the completion of mining and final gold recovery. The reclamation land use objective will be to return the land to its traditional use. Closure objectives include securing the site to assure physical safety of people, protecting wildlife, protecting surface and groundwater quality and quantity, minimizing erosion and controlling fugitive dust. To accomplish these objectives, the following key elements will be included in the reclamation plan:
1. Chemical stabilization, accomplished through rinsing of the heap, and covering of potentially acid generating rock in the waste rock storage facility with a low permeability layer of soils;
2. Physical stabilization, accomplished through slope grooming, and the application of topsoil and revegetation;
3. Control of surface waters; and 4. Monitoring effluent chemistry from the pad and water draining the mine waste
areas. Closure will be accomplished in three stages:
1. Concurrent: measures implemented during the operating life of the Project; 2. Final: measures implemented after cessation of operations; and, 3. Post-closure: provides for short-term maintenance and long-term monitoring of
the closed facilities. An outline of the key components of the closure and reclamation plan is given in this section. Further detailing of these components will be required before construction commences. During operation, the closure and reclamation plan will be revised further. A portion of the closure plan takes place in the construction and early years of the project. The heap leach pad will have underdrains installed where the pH of water transported beneath the heap can be monitored and, if the pH begins to rise, it will be used for process make-up water. The waste rock dumps will also have under drains installed to minimize the contact time between the waste and water. Collection ponds will be installed at the base of the waste rock dump major drainages to monitor any seepage and, if necessary, pump the seepage to portions of the heap that are not under leach.

Cerro del Gallo Heap Leach Project NI 43-101 Technical Report
January 31, 2020 Page 20-9
The heap reclamation will consist of rinsing with fresh water, recontouring, compacting, and covering with a low permeability layer and a soil layer to support vegetation. It is possible for closure activities to begin on inactive portions of the heap during operations. The heap will be rinsed with fresh water to remove the majority of the contained metals and cyanide then allowed to drain. After draining, the side slopes of the heap will be recontoured. The recontoured surface will then be compacted to minimize water ingress into the heap. To further limit the ingress of water, a 0.6-meter thick low permeability layer will be placed over the compacted surface. A 1-meter thick cover with a 0.2-meter thick topsoil layer to support vegetation will then be placed over the low permeability layer to return the area to a more natural state. The vegetative cover helps with water management by minimizing erosion of the surface and minimizing water that can reach the low permeability layer. The reclamation plan for the waste dumps is similar to the heap. The waste dumps will be recontoured, covered with a low permeability layer, and covered with a soil layer to support vegetation. The pit is expected to stay dry. The completed drilling has indicated that the water table is below the bottom of the pit and water collected in the pit from precipitation is expected to evaporate.
20.6 Site Monitoring
A detailed monitoring plan will need to be developed during final design of the HLF and WRD to assure that these facilities are developed, operated, and monitored in accordance with the intent of the design. The facilities will be monitored to assure environmental protection during construction, operation, and closure of the facilities. With respect to the HLF and WRD, the monitoring plan will include:
• Monitoring of solution flows into and out of the process ponds, and monitoring of pond elevations, to allow adherence to the plan.
• Monitoring the Pregnant and Event Ponds leak detection systems to assure that fluids are not passing through the pond’s containment.
• Monitoring the leach pad leak detection system to assure that fluids are not passing through the primary pad containment.
• Monitoring the quality of surface water and ground water around the HLF and WRD to confirm that surrounding waters are not being impacted by mining and processing activities.

Cerro del Gallo Heap Leach Project NI 43-101 Technical Report
January 31, 2020 Page 20-10
Other geotechnical monitoring that may be determined as critical during the final design phase of the project which may include settlement monitoring of deep select waste rock fills or movement monitoring of critical slopes. After the completion of final closure, the site will require regular maintenance for approximately 10 years post-closure or until there is no further signs of changing conditions. During this period, the site will be inspected every three months and maintenance activities will be planned immediately following each wet season and following any unseasonal major storm events. The purpose of this is to ensure drainage and erosion control measures are working as planned, and to allow the recently revegetated areas to mature and properly take hold. Maintenance work will consist of light manual labor (ditch tending, rubble removal, and so forth), and light equipment (backhoe and bulldozer) work to regrade or groom any areas showing signs of distress or erosion. Once the site stops showing signs of seasonal distress and the functionality of the facilities has been field proofed, and when the geochemical performance matches predictive modeling, periodic inspection and maintenance activities can be reduced in frequency; initially to annually and eventually to only after unusually high rainfall periods. The quality of the water draining from the heap will require monitoring and comparison to the predicted chemistry and discharge standards. If the measured water quality significantly varies from that predicted, in an unfavourable manner, then the geochemical model will be revised and new forecasts prepared. In the extreme case, additional rinsing and neutralization of the heap may be required. More likely, it will only be required to extend the short-term maintenance period. During the initial, short-term drain down period, the ponds will remain in service for water management. Water collected in the ponds will be tested with each inspection cycle and if the water quality does not meet discharge standards then that water will be recirculated to the heap and/or evaporated. No discharge of solutions are expected. The ponds will likely accumulate sediments and precipitates as water accumulates and evaporates. These sediments will require periodic removal and can be buried within the heap. This will probably continue for at least one-year post-closure and may be needed for up to five years, depending upon the effectiveness of the erosion control measures and re-vegetation efforts.

Cerro del Gallo Heap Leach Project NI 43-101 Technical Report
January 31, 2020 Page 21-1
21 Capital and Operating Costs
21.1 Summary
Capital and operating costs for the process and general and administration components of the CdG Project were estimated by KCA with input from Argonaut. Costs for the mining components were provided by MDA and are based on contract mining. The estimated costs are considered to have an accuracy of +/-20% and are discussed in greater detail in this Section. All costs are expressed in 3rd quarter 2019 US dollars. The total Life of Mine (LOM) capital cost for the Project is US$184.6 million, not including reclamation and closure costs, IVA (value added tax) or other taxes; all IVA is applied to all capital costs at 16% and is assumed to be fully refundable. Table 21.1.1 presents the capital requirements for the CdG Project.
Table 21.1.1 LOM Capital Cost Summary
Description Cost (US$M) Pre-Production Capital $ 134.2 Working Capital & Initial Fills $ 11.1 Sustaining Capital – Mine & Process $ 39.2
Total excluding IVA $ 184.6 Source: KCA (2019)
The average life of mine operating cost for the Project is US$10.51 per tonne of ore processed. Table 21.1.2 presents the LOM operating cost requirements for the CdG Project.
Table 21.1.2 LOM Operating Cost Summary
Description LOM Cost (US$/t Processed)
Mine $ 2.81 Process & Support Services $ 6.99 Site G & A $ 0.71
Total $ 10.51 Source: KCA (2019)
IVA is not included in the operating costs.

Cerro del Gallo Heap Leach Project NI 43-101 Technical Report
January 31, 2020 Page 21-2
21.2 Capital Costs
The required capital cost estimates have been based on the design outlined in this report. The scope of these costs includes all expenditures for process facilities, infrastructure, construction indirect costs, mine contactor mobilization and owner mining capital costs assuming contract mining for the life of the Project. The costs presented have primarily been estimated by KCA with input from Argonaut for major construction contracts, construction unit rates, and infrastructure costs and by MDA on owner and contractor mining costs. Material take-offs for earthworks, concrete and major piping have been estimated by KCA with earthworks and liner quantities for the heap leach and waste rock facilities being provided by Golder. All equipment and material requirements are based on design information described in previous sections of this Report. Capital costs estimates have been made primarily using budgetary supplier quotes for all major and most minor equipment as well as contractor quotes for major construction contracts provided by Argonaut. Where Project specific quotes were not available a reasonable estimate or allowance was made based on recent quotes in KCA files or recent costs from Argonaut’s other mining operations. All equipment cost estimates are based on the purchase of equipment quoted new from the manufacturer or estimated to be fabricated new. The total pre-production capital cost estimate for the CdG Project is estimated at US$145.3 million, including all process equipment and infrastructure, construction indirect costs, mine contractor mobilization, mine pre-production, initial fills and working capital. All costs are presented in 3rd quarter 2019 US dollars. Where prices were quoted in Mexican Pesos and an exchange rate of 19.3 MXN:1 US$ was used. Pre-production capital costs required for the CdG Project by area are presented in Table 21.2.1.

Cerro del Gallo Heap Leach Project NI 43-101 Technical Report
January 31, 2020 Page 21-3
Table 21.2.1 Summary of Pre-Production Capital Costs by Area
Source: KCA (2019)
Plant Totals Direct Costs Total Supply Cost Install Grand Total
US$ US$ US$Area 000 - Mobile Equipment $2,708,000 $0 $2,708,000Area 001 - Site & Utilities General $2,008,000 $879,000 $2,887,000Area 005 - Power Generation & Site Distribution $8,578,000 $109,000 $8,687,000Area 010 - Primary Crushing $3,481,000 $389,000 $3,870,000Area 011 - Secondary Crushing $6,275,000 $520,000 $6,796,000Area 012 - Tertiary Crushing $10,096,000 $571,000 $10,667,000Area 020 - Agglomeration $2,832,000 $290,000 $3,122,000Area 030 - Stacking System $5,072,000 $331,000 $5,403,000Area 031 - Heap Solution Handling $5,568,000 $13,861,000 $19,429,000Area 035 - SART Plant $10,453,000 $853,000 $11,306,000Area 040 - Recovery $7,018,000 $4,438,000 $11,456,000Area 050 - Refining $166,000 $0 $166,000Area 080 - Reagents $1,214,000 $184,000 $1,398,000Area 090 - Water Distribution System $2,748,000 $83,000 $2,831,000Area 100 - Laboratory $1,392,000 $380,000 $1,772,000
Total Direct Costs $69,609,000 $22,889,000 $92,498,000Spare Parts $4,786,000 $4,786,000
Sub Total with Spare Parts $97,284,000Contingency $16,432,000 $16,432,000
Total Direct Costs with Contingency $113,716,000
$5,051,000
$3,906,000
$3,550,000
$7,960,000
$134,183,000
$638,000
$10,509,000
$145,329,000
Initial Fills
Sub Total Costs Pre-Production
TOTAL COSTS (excluding IVA)
Other Owner's Costs
Indirect Costs
Mining Costs
EPCM
Working Capital (60 days)
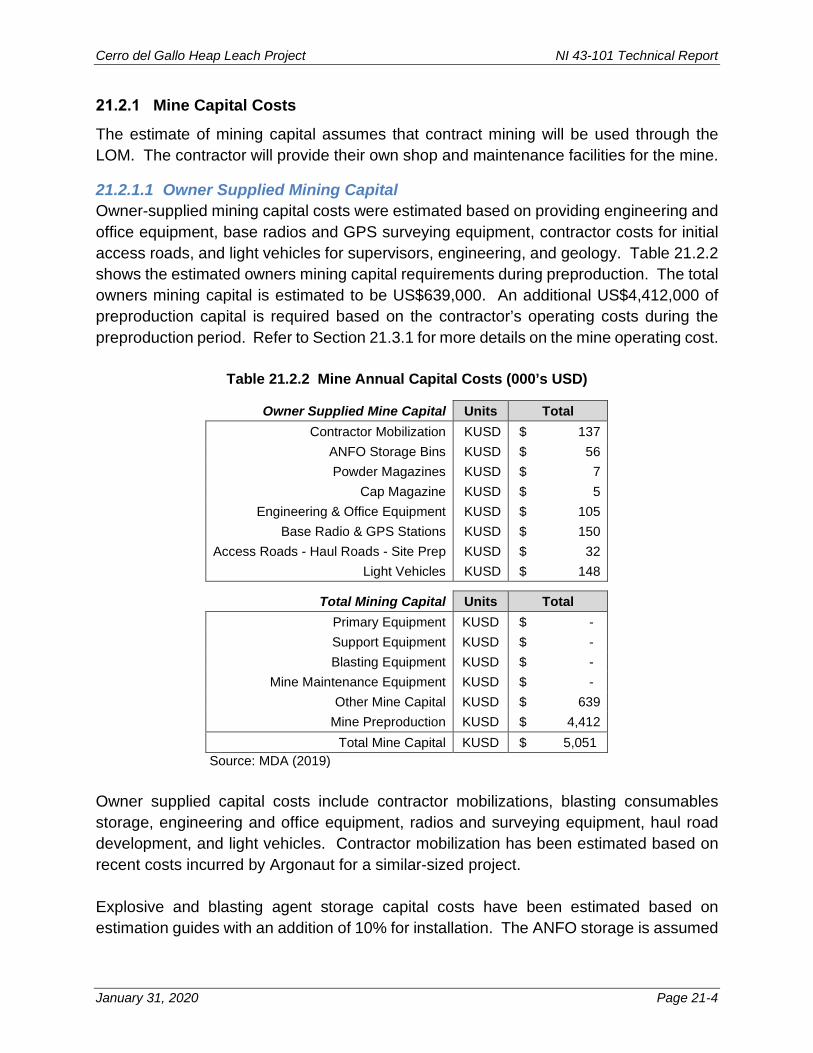
Cerro del Gallo Heap Leach Project NI 43-101 Technical Report
January 31, 2020 Page 21-4
Mine Capital Costs
The estimate of mining capital assumes that contract mining will be used through the LOM. The contractor will provide their own shop and maintenance facilities for the mine.
21.2.1.1 Owner Supplied Mining Capital Owner-supplied mining capital costs were estimated based on providing engineering and office equipment, base radios and GPS surveying equipment, contractor costs for initial access roads, and light vehicles for supervisors, engineering, and geology. Table 21.2.2 shows the estimated owners mining capital requirements during preproduction. The total owners mining capital is estimated to be US$639,000. An additional US$4,412,000 of preproduction capital is required based on the contractor’s operating costs during the preproduction period. Refer to Section 21.3.1 for more details on the mine operating cost.
Table 21.2.2 Mine Annual Capital Costs (000’s USD)
Owner Supplied Mine Capital Units Total Contractor Mobilization KUSD $ 137
ANFO Storage Bins KUSD $ 56 Powder Magazines KUSD $ 7
Cap Magazine KUSD $ 5 Engineering & Office Equipment KUSD $ 105
Base Radio & GPS Stations KUSD $ 150 Access Roads - Haul Roads - Site Prep KUSD $ 32
Light Vehicles KUSD $ 148
Total Mining Capital Units Total Primary Equipment KUSD $ - Support Equipment KUSD $ - Blasting Equipment KUSD $ -
Mine Maintenance Equipment KUSD $ - Other Mine Capital KUSD $ 639
Mine Preproduction KUSD $ 4,412 Total Mine Capital KUSD $ 5,051
Source: MDA (2019) Owner supplied capital costs include contractor mobilizations, blasting consumables storage, engineering and office equipment, radios and surveying equipment, haul road development, and light vehicles. Contractor mobilization has been estimated based on recent costs incurred by Argonaut for a similar-sized project. Explosive and blasting agent storage capital costs have been estimated based on estimation guides with an addition of 10% for installation. The ANFO storage is assumed

Cerro del Gallo Heap Leach Project NI 43-101 Technical Report
January 31, 2020 Page 21-5
to allow for one week’s total storage of ammonium nitrate. The silo will be able to store up to 45 tonnes of product. Powder magazines will be used to store up to 545 kg of boosters, and the cap magazine will store up to 270 kg of caps and detonation cord. The engineering and office equipment estimate allows for mine planning software and a large plotter for maps. The base radio and GPS equipment will be used for surveying requirements. Costs for haul roads and site preparation have been estimated based on using dozers and graders to be used in developing mine access to the top of the hill and to level sites for mine offices and shop areas. No drilling and blasting is anticipated to be required for this work. Light vehicle capital expenditure is estimated to be an initial US$148,000. A total of 4 units including pickup trucks for mine general personnel are included. Mine preproduction costs of US$4.4 million were estimated based on the operating costs during the preproduction period. This is described in the operating cost section (Section 21.3.1).
Process & Infrastructure
21.2.2.1 Process & Infrastructure Cost Basis Process and infrastructure costs have been estimated by KCA with input from Argonaut on major construction contracts and infrastructure and Golder for the heap leach and waste rock dump facilities earthworks material takeoffs. All equipment and material requirements are based on the design information described in previous sections of this Report. Budgetary capital costs have been estimated primarily based on Project specific quotes for all major and most minor equipment as well as contractor quotes provided by Argonaut for all major construction contracts. Where Project specific quotes were not available a reasonable estimate or allowance was made based on recent quotes in KCA’s files or cost information from Argonaut’s other mine operations. All capital cost estimates are based on the purchase of equipment quoted new from the manufacturer or to be fabricated new. Each area in the process cost build-up has been separated into the following disciplines, as applicable:
• Major earthworks & liner; • Civil (concrete); • Structural steel; • Platework;

Cerro del Gallo Heap Leach Project NI 43-101 Technical Report
January 31, 2020 Page 21-6
• Mechanical equipment; • Piping; • Electrical; • Instrumentation; • Infrastructure & Buildings; • Supplier Engineering; and • Commissioning & Supervision.
Pre-production process and infrastructure costs by discipline are presented in Table 21.2.3.
Table 21.2.3 Summary of Process & Infrastructure Pre-Production Capital Costs by Discipline
Discipline Totals Cost @ Source Freight
Customs Fees & Duties
Total Supply Cost
Install Grand Total
US$ US$ US$ US$ US$ US$ Major Earthworks $3,109,000 $14,765,000 $17,874,000 Civils (Supply & Install) $2,402,000 $2,402,000 $0 $2,402,000 Structural Steelwork (Supply & Install) $1,746,000 $1,746,000 $0 $1,746,000 Platework (Supply & Install) $1,780,000 $1,780,000 $135,000 $1,915,000 Mechanical Equipment $38,734,000 $2,275,000 $1,046,000 $42,055,000 $4,845,000 $46,900,000 Piping $3,283,000 $97,000 $43,000 $3,283,000 $296,000 $3,579,000 Electrical $4,764,000 $114,000 $51,000 $4,929,000 $654,000 $5,583,000 Instrumentation $954,000 $76,000 $34,000 $1,064,000 $109,000 $1,173,000 Infrastructure & Buildings $9,058,000 $125,000 $56,000 $9,240,000 $260,000 $9,499,000 Supplier Engineering $1,730,000 $1,730,000 Commissioning & Supervision $96,000 $96,000 Spare Parts $4,786,000 $4,786,000 Contingency $16,432,000 $16,432,000
Total Direct Costs $62,721,000 $2,687,000 $1,231,000 $90,826,000 $22,889,000 $113,715,000 Source: KCA (2019) Freight, customs fees and duties, and installation costs are also considered for each discipline. Freight costs are based on loads as bulk freight and have been estimated at 10% of the equipment cost. Where applicable, supplier quoted freight cost estimates for equipment were used in place of estimated freight. Installation costs are based on contractor unit rates provided by Argonaut and estimated installation hours or is included in turn-key supplier packages. Contractor costs include all labor, tools and minor support equipment required for proper placement and installation of equipment.
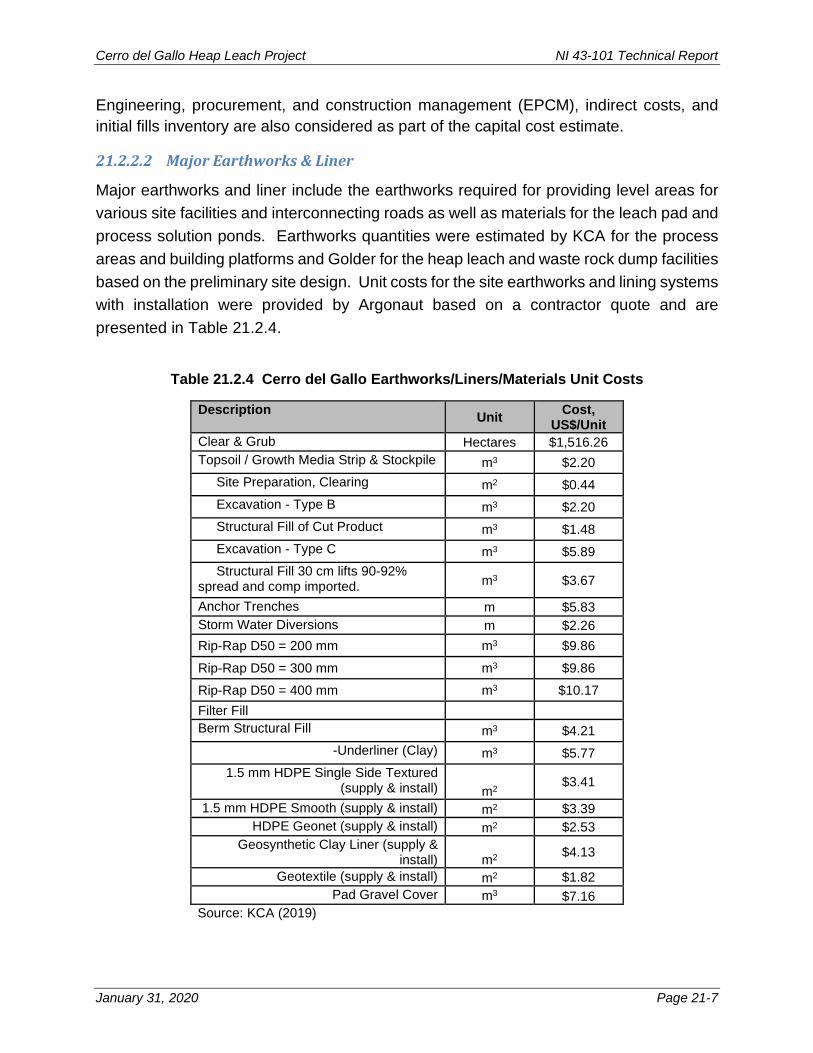
Cerro del Gallo Heap Leach Project NI 43-101 Technical Report
January 31, 2020 Page 21-7
Engineering, procurement, and construction management (EPCM), indirect costs, and initial fills inventory are also considered as part of the capital cost estimate.
21.2.2.2 Major Earthworks & Liner
Major earthworks and liner include the earthworks required for providing level areas for various site facilities and interconnecting roads as well as materials for the leach pad and process solution ponds. Earthworks quantities were estimated by KCA for the process areas and building platforms and Golder for the heap leach and waste rock dump facilities based on the preliminary site design. Unit costs for the site earthworks and lining systems with installation were provided by Argonaut based on a contractor quote and are presented in Table 21.2.4.
Table 21.2.4 Cerro del Gallo Earthworks/Liners/Materials Unit Costs
Description Unit Cost, US$/Unit
Clear & Grub Hectares $1,516.26 Topsoil / Growth Media Strip & Stockpile m3 $2.20 Site Preparation, Clearing m2 $0.44 Excavation - Type B m3 $2.20 Structural Fill of Cut Product m3 $1.48 Excavation - Type C m3 $5.89 Structural Fill 30 cm lifts 90-92% spread and comp imported. m3 $3.67
Anchor Trenches m $5.83 Storm Water Diversions m $2.26 Rip-Rap D50 = 200 mm m3 $9.86 Rip-Rap D50 = 300 mm m3 $9.86 Rip-Rap D50 = 400 mm m3 $10.17 Filter Fill Berm Structural Fill m3 $4.21
-Underliner (Clay) m3 $5.77 1.5 mm HDPE Single Side Textured
(supply & install) m2 $3.41
1.5 mm HDPE Smooth (supply & install) m2 $3.39 HDPE Geonet (supply & install) m2 $2.53
Geosynthetic Clay Liner (supply & install) m2 $4.13
Geotextile (supply & install) m2 $1.82 Pad Gravel Cover m3 $7.16
Source: KCA (2019)

Cerro del Gallo Heap Leach Project NI 43-101 Technical Report
January 31, 2020 Page 21-8
21.2.2.3 Civils
Civils include detailed earthworks and concrete. Concrete quantities were estimated based on layouts, similar equipment installations, major equipment weights and on slab areas. Unit costs for concrete supply and installation which includes production (supply of aggregates, water, cement, batching and mixing), delivery of concrete to the active work site and installation (excavations, formwork, rebar, placement and curing) were provided by Argonaut based on a contractor quote.
21.2.2.4 Structural Steel
Costs for structural steel, including grating, light, medium and heavy structural steel, and handrails for each area are based on material takeoffs estimated by KCA based on preliminary layouts and equipment weights and unit costs from a contractor quote received by Argonaut.
21.2.2.5 Platework Platework includes costs for the supply and installation of steel tanks, bins and chutes. Platework costs are primarily based on supplier quotes for shop fabricated tanks and contractor quotes for larger field erected tanks, or have been included as part of vendor supply packages.
21.2.2.6 Mechanical Equipment Costs for mechanical equipment are based on a detailed equipment list developed of all major equipment for the process. Costs for all major and most minor equipment items are based on budgetary quotes from suppliers. Where Project specific supplier quotes were not available, reasonable allowances were made based on recent quotes from KCA’s files and cost information from Argonaut’s other mining operations. All costs assume equipment purchased new from the manufacturer or to be fabricated new. The mechanical equipment costs consider a mostly turn-key bid for the ADR, Refinery and cyanide systems, complete equipment supply package for the crushing and reclaim systems (excluding the HPGR which was quoted separately) and various equipment supply packages by several different suppliers. Installation costs for mechanical equipment are based on contractor unit rates provided by Argonaut and estimated installation hours or are included as part of turn-key vendor packages.
21.2.2.7 Piping
Major piping, including the heap irrigation and gravity solution collection pipes have been costed based on material takeoffs and supplier quotes. All other piping, fittings and valve costs are estimated based on a percentage of the mechanical equipment costs or included as part of vendor supply packages. A piping supply rate varying from 0% to 30%

Cerro del Gallo Heap Leach Project NI 43-101 Technical Report
January 31, 2020 Page 21-9
of the mechanical equipment cost was used to estimate piping purchase costs for each area, depending on the complexity of the particular system. Piping included as part of equipment packages is included in the mechanical equipment cost.
21.2.2.8 Electrical
Major electrical equipment including transformers, substations, site powerlines, and motor control centers have been costed based on supplier quotes. Costs for miscellaneous electrical works, including supply and installation of electrical cable, cable trays, grounding and lightning protection are based on contractor quotes provided by Argonaut.
21.2.2.9 Instrumentation
Instrumentation costs have been estimated based on a percentage of the mechanical equipment costs. A rate ranging from 0% to 12% of the equipment cost was used to estimate instrumentation purchase costs for each area based upon recent KCA experience on similar projects. Instrumentation installation hours are estimated based on a factor of instrumentation equipment costs.
21.2.2.10 Infrastructure & Buildings
A list of the buildings is provided in Table 21.2.5 below. Building costs have been based on a combination of steel building costs, modular trailers supplied by vendors and shipping containers. Allowances have been made for office furnishings (which include desks, chairs, etc.), dining area furnishings and appliances, lockers, and tools for truck shop and mechanic and electrical use based on costs from Argonaut’s existing mining operations. Septic systems and leach fields costs have been provided by Argonaut and are included in the cost estimate.
The mining contractor will provide maintenance facilities for mining equipment.

Cerro del Gallo Heap Leach Project NI 43-101 Technical Report
January 31, 2020 Page 21-10
Table 21.2.5 Cerro del Gallo Buildings
Description Guard House Explosives Storage Magazine Modular Offices - Process Modular Offices - Mine Warehouse & Maintenance - Process Area General Warehouse Warehouse - Reagent Storage Modular Dining Area Modular Change Facility & Locker Storage Clinic Warehouse Storage Containers - Process Warehouse Storage Containers - Mine/Crusher Refinery Laboratory
Source: KCA (2019)
Power for the Project during the first year will be supplied by leased diesel generators at an estimated cost of $0.26/kWh. Grid power will then be delivered by a 115 kV powerline to the Project site starting in year 2, at an estimated cost of $0.10/kWh. Preliminary costs for the powerline have been estimated by CFE. It is assumed that half of the powerline costs will be spent during pre-production with the remaining balance being paid during the first year of operation.
Water supply will be by three water wells near the site. Costs for the water supply including drilling and constructing the wells, supply of the well pumps, and construction of the pipeline to the site raw water tanks is based on a contractor quote provided by Argonaut.
The perimeter of the entire site will be fenced with animal fencing. The process ponds and process facility will be fenced with 2-meter chain link fencing. Fencing costs have been provided by Argonaut based on their existing mining operations.
21.2.2.11 Supplier Engineering & Supervision
Supplier engineering and construction and commissioning supervision were quoted for the ADR and laboratory packages. Where not directly quoted, supplier engineering for equipment items are assumed to be included in the equipment supply cost.
21.2.2.12 Process Mobile Equipment Mobile equipment included in the capital cost estimate are detailed in Table 21.2.6.

Cerro del Gallo Heap Leach Project NI 43-101 Technical Report
January 31, 2020 Page 21-11
Table 21.2.6 Process Mobile Equipment
Item Description Qty. Light Vehicles ½ ton pickup truck 15 Leach Pad Truck ½ ton pickup truck 1 Service Truck ¾ ton 1 Forklift 2.5 ton 2 Crane (50t) 50 ton 1 Light Plants 1,000 Watt, diesel fired 4 Dozer CAT D6 or Equiv., LGP tracks 1 Boom Truck 17-20 tons 1 Fuel Truck Small Water Truck 3,000 gallons 1 Excavator CAT 321D or Equiv. 1 Backhoe 1 Bobcat 2 Ambulance 1 Source: KCA (2019)
Costs for process mobile equipment are based on cost guides or other published data. Mobile equipment costs are considered in the mechanical equipment cost estimate.
Spare Parts
Spare parts are budgeted at 4% of the mechanical equipment costs, based on KCA experience.
Indirect Costs
Indirect costs include costs for items such as temporary construction facilities and support, surveying, temporary communication systems, temporary warehousing, temporary power and water, quality control, fenced yards, construction office, support equipment, security, vendor representatives, etc., and have been estimated based on a construction period of 16 months and Argonaut’s experience on their past projects.
Other Owner’s Construction Costs
Other Owner’s construction costs are intended to cover the following items: • Owner’s costs for labor, offices, home office support, vehicles, travel and
consultants during construction; • Subscriptions, licence fees, etc.; • Taxes and Permits; • Work place health and safety costs during construction.
Other Owner’s construction costs are estimated based on Argonaut’s experience on past projects.

Cerro del Gallo Heap Leach Project NI 43-101 Technical Report
January 31, 2020 Page 21-12
Initial Fills Inventory
The initial fills inventory consists of a supply of consumable items stored on site at the outset of operations. The list of consumables includes cyanide, cement, carbon, caustic, hydrochloric acid, flocculant, sulfuric acid, NaSH, smelting fluxes and antiscalant.
Engineering and Construction
The estimated costs for engineering, procurement and construction management (EPCM) for the development, construction, and commissioning are based on a percentage of the direct capital cost and assume Argonaut managing EPCM services internally. The total EPCM cost is estimated at 7.0% of the process and infrastructure direct costs without any added contingency. The EPCM costs cover services and expenses for the following areas:
• Project Management; • Detailed Engineering; • Engineering Support; • Procurement; • Construction Management; • Commissioning; • Vendors Reps.
For some major equipment packages, costs associated with detailed engineering, commissioning, and installation supervision have been included in the vendor’s quotes; these costs are reflected in the supplier engineering estimate of the capital costs.
Contingency
Contingency for the process and infrastructure has been applied to the total direct costs by discipline. Contingencies varying from 10% to 25% were used depending on the confidence level and are detailed in Table 21.2.7.

Cerro del Gallo Heap Leach Project NI 43-101 Technical Report
January 31, 2020 Page 21-13
Table 21.2.7 Process and Infrastructure Contingency
Direct Costs Contingency % Major Earthworks 25% Civils (Supply & Install) 25% Structural Steelwork 20% Platework 15% Mechanical Equipment 15% Piping 15% Electrical 15% Instrumentation 20% Infrastructure & Buildings 20% Supplier Engineering 10% Commissioning & Supervision 10% Total Contingency on Direct Costs 17.8% Source: KCA (2019)
Contingency for Indirect and Other Owner’s costs have been applied at 20%.
Sustaining Capital Costs
Sustaining capital costs for the Project include costs to construct the second, third and fourth phases of the leach pad (in Years 1, 2 and 5, respectively) and to replace process area surface mobile equipment in years 5 and 11. Sustaining capital costs are approximately US$39.2 million and includes related contingencies. EPCM and construction indirect costs for the leach pad expansions are included. Sustaining capital costs are presented in Table 21.2.8.
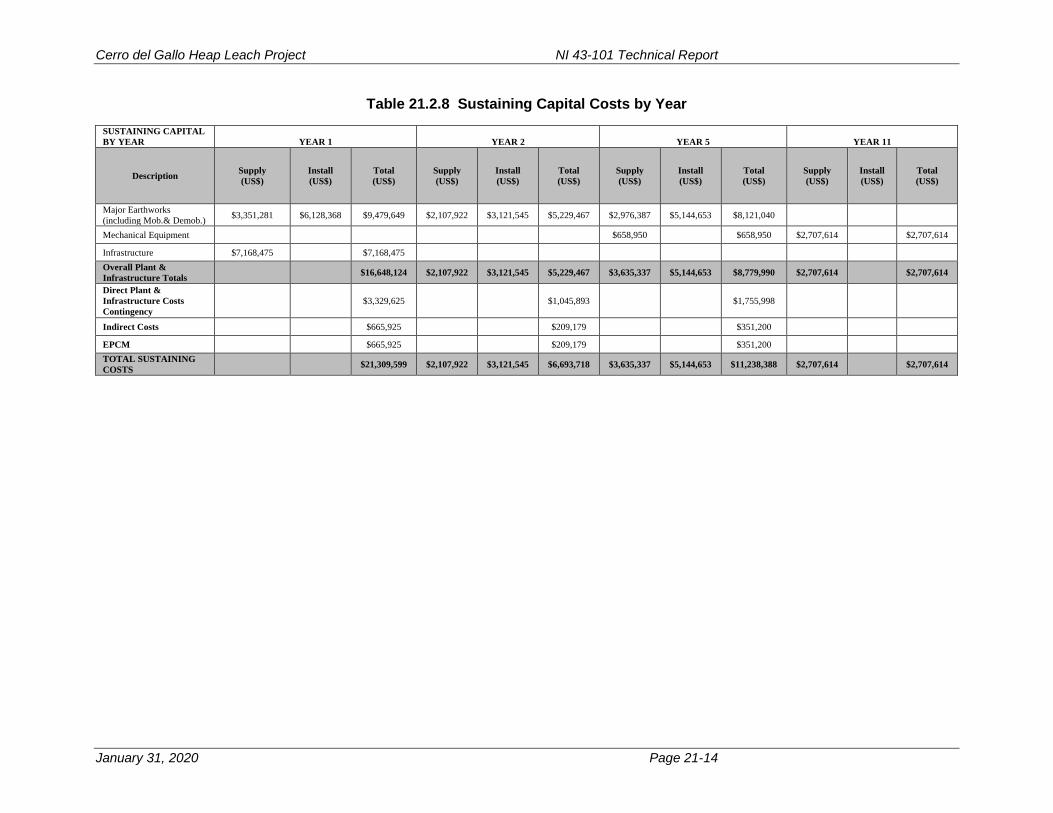
Cerro del Gallo Heap Leach Project NI 43-101 Technical Report
January 31, 2020 Page 21-14
Table 21.2.8 Sustaining Capital Costs by Year SUSTAINING CAPITAL BY YEAR YEAR 1 YEAR 2 YEAR 5 YEAR 11
Description Supply (US$)
Install (US$)
Total (US$)
Supply (US$)
Install (US$)
Total (US$)
Supply (US$)
Install (US$)
Total (US$)
Supply (US$)
Install (US$)
Total (US$)
Major Earthworks (including Mob.& Demob.) $3,351,281 $6,128,368 $9,479,649 $2,107,922 $3,121,545 $5,229,467 $2,976,387 $5,144,653 $8,121,040
Mechanical Equipment $658,950 $658,950 $2,707,614 $2,707,614
Infrastructure $7,168,475 $7,168,475
Overall Plant & Infrastructure Totals $16,648,124 $2,107,922 $3,121,545 $5,229,467 $3,635,337 $5,144,653 $8,779,990 $2,707,614 $2,707,614
Direct Plant & Infrastructure Costs Contingency
$3,329,625 $1,045,893 $1,755,998
Indirect Costs $665,925 $209,179 $351,200
EPCM $665,925 $209,179 $351,200 TOTAL SUSTAINING COSTS $21,309,599 $2,107,922 $3,121,545 $6,693,718 $3,635,337 $5,144,653 $11,238,388 $2,707,614 $2,707,614

Cerro del Gallo Heap Leach Project NI 43-101 Technical Report
January 31, 2020 Page 21-15
Working Capital
Working capital is money that is used to cover operating costs from start-up until a positive cash flow is achieved. Once a positive cash flow is attained, Project expenses will be paid from earnings. Working capital for the Project is estimated to be US$10.5 million based on 60 days of operation and includes all mine, process and G&A operating costs.
Exclusions
The following have been excluded: • Finance charges and interest during construction; • IVA (value added tax). IVA is applied to all capital costs at a rate of 16% in
the economic model and is considered to be fully refundable in the following year;
• Escalation costs; • Currency exchange fluctuations; and • Penalties or incentives.
21.3 Operating Costs
Process operating costs for CdG have been estimated based on information presented in earlier sections of this Report. Mining costs were provided by MDA at US$1.72 per tonne mined (LOM US$2.81 per tonne of ore) and are based on contract mining. Process operating costs have been estimated by KCA from first principles. Labor costs were estimated using project specific staffing and salary, wage and benefit requirements provided by Argonaut based on their existing mining operations in Mexico. Unit consumptions of materials, supplies, power, water and delivered supply costs were also estimated. LOM average processing costs are estimated at US$6.99 per tonne ore. General administrative costs (G&A) have been estimated by KCA with input from Argonaut. G&A costs include project specific labor and salary requirements and operating expenses including social contributions and land and water rights. G&A costs are estimated at US$0.71 per tonne ore. Operating costs were estimated at approximately US$10.51 overall and based on 3rd quarter 2019 US dollars, and presented with no added contingency based upon the design and operating criteria present in this report. IVA is not included in the operating cost estimate.

Cerro del Gallo Heap Leach Project NI 43-101 Technical Report
January 31, 2020 Page 21-16
The operating costs presented are based upon the ownership of all process production equipment and site facilities, including the onsite laboratory. The owner will employ and direct all operating maintenance and support personnel for all site activities except mining. Operating costs estimates have been based upon information obtained from the following sources:
• Contractor mining costs from MDA; • Owner’s mine general costs from MDA; • G&A costs estimated by KCA with input from Argonaut; • Project metallurgical test work and process engineering; • Supplier quotes for reagents and fuel provided by Argonaut; • Recent KCA project file data; and • Experience of KCA staff with other similar operations.
Where specific data do not exist, cost allowances have been based upon consumption and operating requirements from other similar properties for which reliable data exist. Freight costs have been estimated where delivered prices were not available.
Mine Operating Costs
Annual mining operating costs have been estimated based on contractor proposal rates summarized in Table 21.3.1, along with separate contract blasting rates and owner mining personnel requirements. Two contract proposals were used for mining cost estimates which include one for general mining of material and another for blasting. The overall mining costs are estimated to be $1.72 per tonne mined after capitalization of preproduction costs. Mine operating costs are summarized in Table 21.3.2 Annual Mine Operating Costs.
21.3.1.1 Contractor Production Requirements To assist the contractors in providing proposals, MDA provided a production summary sheet with tonnages, volumes, average haulage distances, and estimated cycle times. Table 21.3.3 Contractor Mine Production Summary summarizes the information provided.
21.3.1.2 General Mining Contract Proposal The general mining contractor proposal provides costs per tonne for drilling, loading, haulage, support equipment and re-handle of material at the crusher. These costs do not include fuel, which will be provided at Argonaut’s cost. The basic unit rates used are shown in Table 21.3.1 Contract Proposal Unit Rates.

Cerro del Gallo Heap Leach Project NI 43-101 Technical Report
January 31, 2020 Page 21-17
Table 21.3.1 Contract Proposal Unit Rates
Source: MDA (2019)
Note that the haulage unit costs were broken down into segments of roads depending on distance. A standard rate of US$0.33/t will apply to the first kilometer for all ore and waste hauled. For haulage that is greater than one kilometer, an increased cost of US$0.08/t is to be charged for each increment of 500 meters. In order to apply this, MDA summarized the average one-way haulage distances based on the mine production schedule. This summary was made for ore and waste for each pit phase and by month. MDA had also estimated the mining cost based on first principle costing, which includes an estimate of the equipment hours required along with fuel requirements. The estimated fuel requirement for primary mining equipment was used with a fuel price of US$0.92 per liter. The resulting fuel costs were added to the general mining contractor costs for the final operating cost estimate. Total LOM fuel consumption was estimated to be 72.0 million liters (not including blasting) adding about US$0.44/t to the overall mine operating cost. The cost of feeding ore to the rock box was applied to re-handle material based on the production schedule. Other ore is expected to be dumped directly into the feeder.
21.3.1.3 Blasting Contractor Proposal The blasting contractor proposal requires Argonaut to provide storage for explosives and blasting agents, as well as fuel for blending with ammonium nitrate. The cost of the blasting consumables will be charged directly to Argonaut. The blasting contractor will provide personnel and transportation for people involved with the blasting operations along with an explosives truck for use in loading holes. This will be done at a cost of US$35,600 per month. MDA estimated the number of holes and blasting agents required based on a powder factor of 0.23 kg of explosives per tonne of material blasted. The cost of ammonium
Ore WasteUSD/t USD/t
Drill 0.18$ 0.18$ Load 0.28$ 0.28$
Haul 1 km 0.33$ 0.33$ 500 mts segment 0.08$ 0.08$
Support Equipment 0.23$ 0.23$ Feed Ore to Rock box 0.23$
Sub Total 1.25$ 1.01$

Cerro del Gallo Heap Leach Project NI 43-101 Technical Report
January 31, 2020 Page 21-18
nitrate was assumed to be US$480 per tonne and the cost of blasting accessories including caps, boosters, and initiation devices was assumed to be US$26.00 per hole.
21.3.1.4 Drilling Costs Drilling costs were based on the contractor proposed US$0.18/t cost and MDA’s estimated cost of fuel, which totals US$0.05/t. The total drilling cost is estimated to be US$34.0 million for the LOM before allocation of US$0.5 million in preproduction costs. The total drilling cost is estimated to be US$0.23/t and is shown in Table 21.3.4 Annual Drilling Costs.
21.3.1.5 Blasting Costs MDA used the contract blasting proposal along with estimated blasting consumable and loading requirements to determine the project blasting costs. These are shown in Table 21.3.5 Annual Blasting Costs and total US$34.1 million over the LOM before allocation of preproduction costs. This accounts for US$0.23/t of the total operating cost.
21.3.1.6 Loading Costs Total loading costs were based on the contractor proposed unit costs along with fuel cost estimates provided by MDA. Total LOM costs of US$53.3 million, or US$0.36/t, were estimated prior to allocation of preproduction costs as shown in Table 21.3.6.
21.3.1.7 Haulage Costs Haulage costs were estimated based on the general mine contractor proposal, estimated haulage distances and MDA estimated fuel costs. The haulage costs are shown in Table 21.3.7 Annual Haulage Costs and total US$97.6 million, or US$0.65/t, before allocation of preproduction costs.
21.3.1.8 Mine Support Costs Mine support costs are based on the general mine contractor proposal. Fuel requirement costs were estimated by MDA but the resulting costs were deemed to be higher than what they would be in actual operations. The total fuel consumption for the overall project, without the support equipment, are considered to be in line with an operation of this size. Thus, MDA did not add in fuel costs for support equipment. MDA believes that there is enough conservatism in the fuel estimates to account for this through the LOM estimate. The overall support cost estimate is US$34.0 million, or US$0.23/t, before allocation of preproduction and is shown in Table 21.3.8 Annual Mine Support Costs.
21.3.1.9 Re-Handle Costs Re-handle costs were estimated based on the contractor proposed rate of US$0.23/t re-handled. This was applied to 3,278,000 tonnes for a total of US$765,000 through the LOM, or US$0.01/t for the overall cost per tonne mined as shown in Table 21.3.9 Re-Handle Tonnages and Costs.

Cerro del Gallo Heap Leach Project NI 43-101 Technical Report
January 31, 2020 Page 21-19
21.3.1.10 Owner’s Mine General Costs Mine general costs include personnel and supply costs for the owner’s employees including mine supervision, engineering, and geology/ore control. These costs total US$0.06/t and are shown in Table 21.3.10.

Cerro del Gallo Heap Leach Project NI 43-101 Technical Report
January 31, 2020 Page 21-20
Table 21.3.2 Annual Mine Operating Costs
Source: MDA (2019)
Table 21.3.3 Contractor Mine Production Summary
Source: MDA (2019)
Mining Cost Summary Units Yr_-1 Yr_1 Yr_2 Yr_3 Yr_4 Yr_5 Yr_6 Yr_7 Yr_8 Yr_9 Yr_10 Yr_11 Yr_12 Yr_13 Yr_14 Yr_15 Yr_16 Yr_17 TotalDrilling K USD 521$ 1,131$ 1,577$ 1,840$ 1,937$ 1,941$ 1,881$ 1,664$ 2,047$ 2,640$ 3,639$ 3,887$ 2,987$ 2,223$ 1,817$ 1,564$ 701$ -$ 33,996$
Blasting K USD 806$ 1,327$ 1,681$ 1,890$ 1,967$ 1,971$ 1,923$ 1,759$ 2,055$ 2,526$ 3,321$ 3,518$ 2,802$ 2,195$ 1,872$ 1,671$ 843$ -$ 34,130$ Loading K USD 814$ 1,794$ 2,474$ 2,893$ 3,040$ 3,041$ 2,964$ 2,604$ 3,216$ 4,156$ 5,694$ 6,112$ 4,666$ 3,473$ 2,838$ 2,444$ 1,114$ -$ 53,337$ Haulage K USD 1,265$ 3,161$ 4,229$ 4,778$ 5,006$ 4,972$ 4,853$ 4,549$ 5,598$ 6,570$ 9,891$ 11,667$ 9,459$ 7,312$ 6,158$ 5,513$ 2,634$ -$ 97,614$ Support K USD 521$ 1,130$ 1,576$ 1,838$ 1,935$ 1,939$ 1,879$ 1,658$ 2,045$ 2,637$ 3,635$ 3,883$ 2,984$ 2,221$ 1,815$ 1,563$ 701$ -$ 33,959$
Rehandle K USD -$ 90$ 32$ 60$ 46$ 28$ 85$ 36$ 62$ 104$ 31$ 130$ -$ -$ -$ -$ 60$ -$ 765$ Total Contract Mining Cost K USD 3,926$ 8,633$ 11,569$ 13,299$ 13,931$ 13,893$ 13,585$ 12,271$ 15,023$ 18,633$ 26,211$ 29,196$ 22,897$ 17,425$ 14,500$ 12,755$ 6,054$ -$ 253,802$
Owner Mine General K USD 485$ 510$ 510$ 510$ 510$ 510$ 510$ 510$ 510$ 510$ 510$ 510$ 510$ 510$ 510$ 510$ 340$ -$ 8,475$ Total Mining Cost K USD 4,412$ 9,143$ 12,079$ 13,809$ 14,441$ 14,403$ 14,095$ 12,781$ 15,533$ 19,143$ 26,721$ 29,706$ 23,407$ 17,935$ 15,010$ 13,265$ 6,394$ -$ 262,276$
Capitalized Pre-Production K USD 4,412$ -$ -$ -$ -$ -$ -$ -$ -$ -$ -$ -$ -$ -$ -$ -$ -$ -$ 4,412$ Net Mining Cost After Capital K USD -$ 9,143$ 12,079$ 13,809$ 14,441$ 14,403$ 14,095$ 12,781$ 15,533$ 19,143$ 26,721$ 29,706$ 23,407$ 17,935$ 15,010$ 13,265$ 6,394$ -$ 257,864$
Drilling $/t 0.23$ 0.23$ 0.23$ 0.23$ 0.23$ 0.23$ 0.23$ 0.23$ 0.23$ 0.23$ 0.23$ 0.23$ 0.23$ 0.23$ 0.23$ 0.23$ 0.23$ -$ 0.23$ Blasting $/t 0.35$ 0.27$ 0.24$ 0.23$ 0.23$ 0.23$ 0.23$ 0.24$ 0.23$ 0.22$ 0.21$ 0.21$ 0.21$ 0.22$ 0.23$ 0.24$ 0.27$ -$ 0.23$ Loading $/t 0.36$ 0.36$ 0.36$ 0.36$ 0.36$ 0.36$ 0.36$ 0.36$ 0.36$ 0.36$ 0.36$ 0.36$ 0.36$ 0.36$ 0.36$ 0.36$ 0.36$ -$ 0.36$ Haulage $/t 0.55$ 0.64$ 0.61$ 0.59$ 0.59$ 0.58$ 0.59$ 0.62$ 0.62$ 0.57$ 0.62$ 0.68$ 0.72$ 0.75$ 0.77$ 0.80$ 0.85$ -$ 0.65$ Support $/t 0.23$ 0.23$ 0.23$ 0.23$ 0.23$ 0.23$ 0.23$ 0.23$ 0.23$ 0.23$ 0.23$ 0.23$ 0.23$ 0.23$ 0.23$ 0.23$ 0.23$ -$ 0.23$
Rehandle $/t -$ 0.02$ 0.00$ 0.01$ 0.01$ 0.00$ 0.01$ 0.00$ 0.01$ 0.01$ 0.00$ 0.01$ -$ -$ -$ -$ 0.02$ -$ 0.01$ Total Mining Cost $/t 1.71$ 1.74$ 1.67$ 1.64$ 1.64$ 1.63$ 1.64$ 1.68$ 1.67$ 1.60$ 1.64$ 1.71$ 1.74$ 1.78$ 1.81$ 1.85$ 1.96$ -$ 1.70$
Owner Mine General $/t 0.21$ 0.10$ 0.07$ 0.06$ 0.06$ 0.06$ 0.06$ 0.07$ 0.06$ 0.04$ 0.03$ 0.03$ 0.04$ 0.05$ 0.06$ 0.07$ 0.11$ -$ 0.06$ Total Mining Cost $/t 1.92$ 1.84$ 1.74$ 1.71$ 1.69$ 1.69$ 1.70$ 1.75$ 1.73$ 1.65$ 1.67$ 1.74$ 1.78$ 1.83$ 1.88$ 1.93$ 2.07$ -$ 1.75$
Capitalized Pre-Production $/t 1.92$ -$ -$ -$ -$ -$ -$ -$ -$ -$ -$ -$ -$ -$ -$ -$ -$ -$ 0.03$ Net Mining Cost After Capital $/t -$ 1.84$ 1.74$ 1.71$ 1.69$ 1.69$ 1.70$ 1.75$ 1.73$ 1.65$ 1.67$ 1.74$ 1.78$ 1.83$ 1.88$ 1.93$ 2.07$ -$ 1.72$
Units Yr_-1 Yr_1 Yr_2 Yr_3 Yr_4 Yr_5 Yr_6 Yr_7 Yr_8 Yr_9 Yr_10 Yr_11 Yr_12 Yr_13 Yr_14 Yr_15 Yr_16 Yr_17 TotalPit to Stockpile K Tonnes 386 241 97 239 210 156 247 260 382 250 481 225 107 0 0 0 0 - 3,278
K cubic m 149 98 39 92 81 60 95 100 149 96 183 86 40 0 0 0 0 - 1,267 Avg Dist (km) 1.6 2.0 1.9 1.8 1.8 1.7 1.9 1.8 1.8 1.6 2.0 2.0 2.0 2.1 2.6 2.8 3.6 - 1.8
CT (min) 13.3 13.9 13.1 12.5 12.2 11.8 12.6 14.0 13.7 12.5 14.6 15.3 15.6 18.0 19.6 21.7 23.3 - 13.5 Pit to Crusher K Tonnes - 4,122 5,863 5,741 5,802 5,895 5,635 5,844 5,735 5,570 5,867 5,443 6,000 6,016 6,000 6,000 2,942 - 88,476
K cubic m - 1,682 2,321 2,240 2,243 2,269 2,165 2,243 2,208 2,135 2,236 2,068 2,277 2,277 2,266 2,273 1,119 - 34,019 Avg Dist (km) - 2.0 1.9 1.8 1.8 1.7 1.7 1.9 1.9 1.7 1.9 1.9 2.1 2.2 2.5 2.8 3.0 - 2.0
CT (min) - 14.2 13.2 12.6 12.3 11.9 12.7 14.0 14.8 13.1 14.2 15.0 16.3 18.0 19.7 21.5 23.6 - 15.2 Total Ore Mined K Tonnes 386 4,363 5,960 5,980 6,012 6,051 5,882 6,104 6,117 5,820 6,347 5,668 6,107 6,016 6,000 6,000 2,942 - 91,754
K cubic m 146 1,646 2,249 2,257 2,269 2,283 2,220 2,304 2,308 2,196 2,395 2,139 2,304 2,270 2,264 2,264 1,110 - 34,624 Avg Dist (km) 1.6 2.0 1.9 1.8 1.8 1.7 1.7 1.9 1.9 1.7 1.9 1.9 2.0 2.2 2.5 2.8 3.0 - 2.0
CT (min) 13.3 14.2 13.2 12.6 12.3 11.9 12.7 14.0 14.8 13.0 14.2 15.0 16.3 18.0 19.7 21.5 23.6 - 15.2 *_wst K Tonnes 1,907 612 978 2,114 2,508 2,489 2,391 1,197 2,887 5,792 9,660 11,430 7,032 3,764 1,992 882 144 - 57,780
K cubic m 712 241 388 825 970 958 920 461 1,101 2,194 3,641 4,286 2,641 1,418 749 335 55 - 21,896 Avg Dist (km) 0.8 1.6 1.7 1.6 1.8 1.9 1.9 2.0 1.8 1.5 1.9 2.4 2.8 2.9 3.0 3.1 3.2 - 2.1
CT (min) 8.8 11.5 11.5 10.9 11.4 11.4 10.2 11.1 9.8 8.8 12.9 17.4 20.1 21.9 22.5 22.8 24.7 - 14.7 Total Mined K Tonnes 2,292 4,974 6,938 8,094 8,520 8,540 8,274 7,302 9,004 11,612 16,008 17,098 13,139 9,781 7,992 6,882 3,086 - 149,534
K cubic m 865 1,877 2,618 3,054 3,215 3,223 3,122 2,755 3,398 4,382 6,041 6,452 4,958 3,691 3,016 2,597 1,164 - 56,428 Strip Ratio W:O 4.95 0.14 0.16 0.35 0.42 0.41 0.41 0.20 0.47 1.00 1.52 2.02 1.15 0.63 0.33 0.15 0.05 0.63

Cerro del Gallo Heap Leach Project NI 43-101 Technical Report
January 31, 2020 Page 21-21
Table 21.3.4 Annual Drilling Costs
Source: MDA (2019)
Table 21.3.5 Annual Blasting Costs
Source: MDA (2019)
Table 21.3.6 Annual Loading Costs
Source: MDA (2019)
Drilling Cost Units Yr_-1 Yr_1 Yr_2 Yr_3 Yr_4 Yr_5 Yr_6 Yr_7 Yr_8 Yr_9 Yr_10 Yr_11 Yr_12 Yr_13 Yr_14 Yr_17 TotalFuel K Liters 125 271 377 440 463 464 450 402 489 631 870 930 714 532 434 - 8,135 Fuel K USD 115$ 249$ 347$ 405$ 426$ 427$ 414$ 370$ 450$ 581$ 801$ 855$ 657$ 489$ 400$ -$ 7,484$
Ore Drilling Cost K USD 68$ 773$ 1,057$ 1,060$ 1,066$ 1,073$ 1,043$ 1,082$ 1,085$ 1,032$ 1,125$ 1,005$ 1,083$ 1,067$ 1,064$ -$ 16,268$ Waste Drilling Cost K USD 338$ 108$ 173$ 375$ 445$ 441$ 424$ 212$ 512$ 1,027$ 1,713$ 2,027$ 1,247$ 667$ 353$ -$ 10,244$
Total Drilling Cost K USD 521$ 1,131$ 1,577$ 1,840$ 1,937$ 1,941$ 1,881$ 1,664$ 2,047$ 2,640$ 3,639$ 3,887$ 2,987$ 2,223$ 1,817$ -$ 33,996$ Fuel $/t 0.05$ 0.05$ 0.05$ 0.05$ 0.05$ 0.05$ 0.05$ 0.05$ 0.05$ 0.05$ 0.05$ 0.05$ 0.05$ 0.05$ 0.05$ -$ 0.05$
Ore Drilling Cost $/t 0.03$ 0.16$ 0.15$ 0.13$ 0.13$ 0.13$ 0.13$ 0.15$ 0.12$ 0.09$ 0.07$ 0.06$ 0.08$ 0.11$ 0.13$ -$ 0.11$ Waste Drilling Cost $/t 0.15$ 0.02$ 0.02$ 0.05$ 0.05$ 0.05$ 0.05$ 0.03$ 0.06$ 0.09$ 0.11$ 0.12$ 0.09$ 0.07$ 0.04$ -$ 0.07$
Total Drilling Cost $/t 0.23$ 0.23$ 0.23$ 0.23$ 0.23$ 0.23$ 0.23$ 0.23$ 0.23$ 0.23$ 0.23$ 0.23$ 0.23$ 0.23$ 0.23$ -$ 0.23$
Blasting Cost Units Yr_-1 Yr_1 Yr_2 Yr_3 Yr_4 Yr_5 Yr_6 Yr_7 Yr_8 Yr_9 Yr_10 Yr_11 Yr_12 Yr_13 Yr_14 Yr_15 Yr_16 Yr_17 TotalHoles Loaded holes 5,826 12,662 17,623 20,560 21,643 21,694 21,018 19,019 22,872 29,497 40,664 43,433 33,375 24,846 20,302 17,483 7,839 - 380,355
Loaded Meters meters 20,393 44,334 61,682 71,961 75,749 75,928 73,563 66,863 80,051 103,240 142,322 152,017 116,814 86,961 71,055 61,190 27,437 - 1,331,557 AN Used tonnes 502 1,089 1,519 1,772 1,865 1,869 1,811 1,598 1,971 2,542 3,504 3,743 2,876 2,141 1,749 1,507 675 - 32,732
ANFO Cost K USD 241$ 523$ 729$ 850$ 895$ 897$ 869$ 767$ 946$ 1,220$ 1,682$ 1,796$ 1,380$ 1,028$ 840$ 723$ 324$ -$ 15,712$ Fuel Used K Liters 24 52 73 85 89 90 87 77 95 122 168 180 138 103 84 72 32 - 1,570
Fuel Cost (000's) K USD 22$ 48$ 67$ 78$ 82$ 82$ 80$ 71$ 87$ 112$ 155$ 165$ 127$ 94$ 77$ 66$ 30$ -$ 1,444$ Blasting Accessory K USD 151$ 329$ 458$ 535$ 563$ 564$ 546$ 494$ 595$ 767$ 1,057$ 1,129$ 868$ 646$ 528$ 455$ 204$ -$ 9,889$
Blasting Consumables K USD 414$ 900$ 1,254$ 1,463$ 1,540$ 1,544$ 1,496$ 1,332$ 1,628$ 2,099$ 2,894$ 3,091$ 2,375$ 1,768$ 1,445$ 1,244$ 558$ -$ 27,045$ Contractor Charge K USD 392$ 427$ 427$ 427$ 427$ 427$ 427$ 427$ 427$ 427$ 427$ 427$ 427$ 427$ 427$ 427$ 285$ -$ 7,084$ Total Blasting Cost K USD 806$ 1,327$ 1,681$ 1,890$ 1,967$ 1,971$ 1,923$ 1,759$ 2,055$ 2,526$ 3,321$ 3,518$ 2,802$ 2,195$ 1,872$ 1,671$ 843$ -$ 34,130$ Total Blasting Cost $/t 0.35$ 0.27$ 0.24$ 0.23$ 0.23$ 0.23$ 0.23$ 0.24$ 0.23$ 0.22$ 0.21$ 0.21$ 0.21$ 0.22$ 0.23$ 0.24$ 0.27$ -$ 0.23$

Cerro del Gallo Heap Leach Project NI 43-101 Technical Report
January 31, 2020 Page 21-22
Table 21.3.7 Annual Haulage Costs
Source: MDA (2019)
Table 21.3.8 Annual Mine Support Costs
Source: MDA (2019)
Table 21.3.9 Re-Handle Tonnages and Costs
Source: MDA (2019)
Haulage Cost Units Yr_-1 Yr_1 Yr_2 Yr_3 Yr_4 Yr_5 Yr_6 Yr_7 Yr_8 Yr_9 Yr_10 Yr_11 Yr_12 Yr_13 Yr_14 Yr_17 TotalFuel K Liters 527 1,613 2,086 2,272 2,364 2,319 2,287 2,288 2,774 2,939 4,956 6,527 5,546 4,397 3,775 - 51,841 Fuel K USD 485$ 1,484$ 1,919$ 2,091$ 2,175$ 2,134$ 2,104$ 2,105$ 2,552$ 2,704$ 4,559$ 6,005$ 5,102$ 4,045$ 3,473$ -$ 47,694$
Ore Haulage Cost K USD 150$ 1,454$ 1,968$ 1,974$ 1,987$ 1,997$ 1,944$ 2,022$ 2,050$ 1,934$ 2,119$ 1,887$ 2,025$ 1,998$ 1,993$ -$ 30,482$ Waste Haulage Cost K USD 630$ 223$ 342$ 713$ 844$ 840$ 805$ 423$ 996$ 1,932$ 3,212$ 3,774$ 2,333$ 1,268$ 692$ -$ 19,439$
Total Haulage Cost K USD 1,265$ 3,161$ 4,229$ 4,778$ 5,006$ 4,972$ 4,853$ 4,549$ 5,598$ 6,570$ 9,891$ 11,667$ 9,459$ 7,312$ 6,158$ -$ 97,614$ Fuel $/t 0.21$ 0.30$ 0.28$ 0.26$ 0.26$ 0.25$ 0.25$ 0.29$ 0.28$ 0.23$ 0.28$ 0.35$ 0.39$ 0.41$ 0.43$ -$ 0.32$
Ore Haulage Cost $/t 0.07$ 0.29$ 0.28$ 0.24$ 0.23$ 0.23$ 0.23$ 0.28$ 0.23$ 0.17$ 0.13$ 0.11$ 0.15$ 0.20$ 0.25$ -$ 0.20$ Waste Haulage Cost $/t 0.27$ 0.04$ 0.05$ 0.09$ 0.10$ 0.10$ 0.10$ 0.06$ 0.11$ 0.17$ 0.20$ 0.22$ 0.18$ 0.13$ 0.09$ -$ 0.13$
Total Haulage Cost $/t 0.55$ 0.64$ 0.61$ 0.59$ 0.59$ 0.58$ 0.59$ 0.62$ 0.62$ 0.57$ 0.62$ 0.68$ 0.72$ 0.75$ 0.77$ -$ 0.65$
Support Costs Units Yr_-1 Yr_1 Yr_2 Yr_3 Yr_4 Yr_5 Yr_6 Yr_7 Yr_8 Yr_9 Yr_10 Yr_11 Yr_12 Yr_13 Yr_14 Yr_17 TotalOre Support Cost K USD 88$ 991$ 1,353$ 1,358$ 1,365$ 1,374$ 1,336$ 1,386$ 1,389$ 1,322$ 1,441$ 1,287$ 1,387$ 1,366$ 1,363$ -$ 20,837$
Waste Support Cost K USD 433$ 139$ 222$ 480$ 570$ 565$ 543$ 272$ 656$ 1,315$ 2,194$ 2,596$ 1,597$ 855$ 452$ -$ 13,122$ Total Support Cost K USD 521$ 1,130$ 1,576$ 1,838$ 1,935$ 1,939$ 1,879$ 1,658$ 2,045$ 2,637$ 3,635$ 3,883$ 2,984$ 2,221$ 1,815$ -$ 33,959$
Ore Support Cost $/t 0.04$ 0.20$ 0.20$ 0.17$ 0.16$ 0.16$ 0.16$ 0.19$ 0.15$ 0.11$ 0.09$ 0.08$ 0.11$ 0.14$ 0.17$ -$ 0.14$ Waste Support Cost $/t 0.19$ 0.03$ 0.03$ 0.06$ 0.07$ 0.07$ 0.07$ 0.04$ 0.07$ 0.11$ 0.14$ 0.15$ 0.12$ 0.09$ 0.06$ -$ 0.09$
Total Support Cost $/t 0.23$ 0.23$ 0.23$ 0.23$ 0.23$ 0.23$ 0.23$ 0.23$ 0.23$ 0.23$ 0.23$ 0.23$ 0.23$ 0.23$ 0.23$ -$ 0.23$
Rehandle Costs Units Yr_-1 Yr_1 Yr_2 Yr_3 Yr_4 Yr_5 Yr_6 Yr_7 Yr_8 Yr_9 Yr_10 Yr_11 Yr_12 TotalRehandle K Tonnes - 386 137 259 198 121 365 156 265 446 133 557 - 3,278
Rehandle Cost K USD -$ 90$ 32$ 60$ 46$ 28$ 85$ 36$ 62$ 104$ 31$ 130$ -$ 765$ Rehandle Cost $/t Mined -$ 0.02$ 0.00$ 0.01$ 0.01$ 0.00$ 0.01$ 0.00$ 0.01$ 0.01$ 0.00$ 0.01$ -$ 0.01$

Cerro del Gallo Heap Leach Project NI 43-101 Technical Report
January 31, 2020 Page 21-23
Table 21.3.10 Annual Mine General Services Costs
Source: MDA (2019)
Mine General Services Units Yr_-1 Yr_1 Yr_2 Yr_3 Yr_4 Yr_5 Yr_6 Yr_7 Yr_8 Yr_9 Yr_10 Yr_11 Yr_12 Yr_13 Yr_14 Yr_17 TotalSupervision K USD 105$ 105$ 105$ 105$ 105$ 105$ 105$ 105$ 105$ 105$ 105$ 105$ 105$ 105$ 105$ -$ 1,756$
Hourly Personnel K USD -$ -$ -$ -$ -$ -$ -$ -$ -$ -$ -$ -$ -$ -$ -$ -$ -$ Total K USD 105$ 105$ 105$ 105$ 105$ 105$ 105$ 105$ 105$ 105$ 105$ 105$ 105$ 105$ 105$ -$ 1,756$
EngineeringSalaried Personnel K USD 105$ 108$ 108$ 108$ 108$ 108$ 108$ 108$ 108$ 108$ 108$ 108$ 108$ 108$ 108$ -$ 1,798$
Hourly Personnel K USD 58$ 63$ 63$ 63$ 63$ 63$ 63$ 63$ 63$ 63$ 63$ 63$ 63$ 63$ 63$ -$ 1,041$ Total K USD 162$ 171$ 171$ 171$ 171$ 171$ 171$ 171$ 171$ 171$ 171$ 171$ 171$ 171$ 171$ -$ 2,839$
Mine GeologySalaried Personnel K USD 41$ 41$ 41$ 41$ 41$ 41$ 41$ 41$ 41$ 41$ 41$ 41$ 41$ 41$ 41$ -$ 682$
Hourly Personnel K USD 19$ 20$ 20$ 20$ 20$ 20$ 20$ 20$ 20$ 20$ 20$ 20$ 20$ 20$ 20$ -$ 335$ Total K USD 59$ 61$ 61$ 61$ 61$ 61$ 61$ 61$ 61$ 61$ 61$ 61$ 61$ 61$ 61$ -$ 1,017$
Supplies & OtherMine General Services Supplies K USD 11$ 12$ 12$ 12$ 12$ 12$ 12$ 12$ 12$ 12$ 12$ 12$ 12$ 12$ 12$ -$ 202$
Engineering Supplies K USD 28$ 30$ 30$ 30$ 30$ 30$ 30$ 30$ 30$ 30$ 30$ 30$ 30$ 30$ 30$ -$ 504$ Geology Supplies K USD 34$ 37$ 37$ 37$ 37$ 37$ 37$ 37$ 37$ 37$ 37$ 37$ 37$ 37$ 37$ -$ 614$
Software Maintanance & Support K USD 27$ 29$ 29$ 29$ 29$ 29$ 29$ 29$ 29$ 29$ 29$ 29$ 29$ 29$ 29$ -$ 481$ Outside Services K USD 69$ 75$ 75$ 75$ 75$ 75$ 75$ 75$ 75$ 75$ 75$ 75$ 75$ 75$ 75$ -$ 1,244$
Office Power K USD -$ -$ -$ -$ -$ -$ -$ -$ -$ -$ -$ -$ -$ -$ -$ -$ -$ Light Vehicles K USD 16$ 18$ 18$ 18$ 18$ 18$ 18$ 18$ 18$ 18$ 18$ 18$ 18$ 18$ 18$ -$ 298$
Total K USD 185$ 202$ 202$ 202$ 202$ 202$ 202$ 202$ 202$ 202$ 202$ 202$ 202$ 202$ 202$ -$ 3,343$
Totals - Mining GeneralMine General K USD 228$ 240$ 240$ 240$ 240$ 240$ 240$ 240$ 240$ 240$ 240$ 240$ 240$ 240$ 240$ -$ 3,981$
Engineering K USD 190$ 201$ 201$ 201$ 201$ 201$ 201$ 201$ 201$ 201$ 201$ 201$ 201$ 201$ 201$ -$ 3,343$ Geology K USD 93$ 98$ 98$ 98$ 98$ 98$ 98$ 98$ 98$ 98$ 98$ 98$ 98$ 98$ 98$ -$ 1,631$
Totals K USD 512$ 539$ 539$ 539$ 539$ 539$ 539$ 539$ 539$ 539$ 539$ 539$ 539$ 539$ 539$ -$ 8,955$ Cost per Ton Mined
Mine General $/t 0.10$ 0.05$ 0.03$ 0.03$ 0.03$ 0.03$ 0.03$ 0.03$ 0.03$ 0.02$ 0.01$ 0.01$ 0.02$ 0.02$ 0.03$ -$ 0.03$ Engineering $/t 0.08$ 0.04$ 0.03$ 0.02$ 0.02$ 0.02$ 0.02$ 0.03$ 0.02$ 0.02$ 0.01$ 0.01$ 0.02$ 0.02$ 0.03$ -$ 0.02$
Geology $/t 0.04$ 0.02$ 0.01$ 0.01$ 0.01$ 0.01$ 0.01$ 0.01$ 0.01$ 0.01$ 0.01$ 0.01$ 0.01$ 0.01$ 0.01$ -$ 0.01$ Totals $/t 0.22$ 0.11$ 0.08$ 0.07$ 0.06$ 0.06$ 0.07$ 0.07$ 0.06$ 0.05$ 0.03$ 0.03$ 0.04$ 0.06$ 0.07$ -$ 0.06$

Cerro del Gallo Heap Leach Project NI 43-101 Technical Report
January 31, 2020 Page 21-24
Process and G&A Operating Costs
Average annual process and G&A operating costs are presented in Table 21.3.11.
Table 21.3.11 LOM Average Process, Support & G&A Operating Costs
OPERATING COST LOM Average
Unit Annual US$ per Units Cost Type Qty Costs, US$ Costs, US$ Tonne Ore
Labor Process ea Fixed 118 $2,869,159 $0.500 Laboratory ea Fixed 24 $565,508 $0.099 SUBTOTAL $3,434,666 $0.599 Primary Crushing Power kWh/yr Variable 1,728,046 $0.115 $197,985 $0.035 Wear & Maintenance Variable $573,465 $0.100 SUBTOTAL $771,450 $0.135 Secondary Crushing Power kWh/yr Variable 4,365,889 $0.115 $500,208 $0.087 Wear & Maintenance Variable $1,146,929 $0.200 SUBTOTAL $1,647,137 $0.287 Tertiary Crushing (HPGR) Power kWh/yr Variable 17,161,929 $0.115 $1,966,274 $0.343 Wear & Maintenance Variable $1,146,929 $0.200 SUBTOTAL $3,113,203 $0.543 Agglomeration Power kWh/yr Variable 2,015,214 $0.115 $230,887 $0.040 Cement kg/yr Variable 57,346,453 $0.12 $6,685,467 $1.166 Maintenance Supplies Lot Variable $286,732 $0.050 SUBTOTAL $7,203,086 $1.256 Conveyor Stacking Power kWh/yr Variable 2,975,575 $0.115 $340,917 $0.059 Maintenance Supplies Lot Variable $286,732 $0.050 SUBTOTAL $627,649 $0.109 Heap Leach Systems Power kWh/yr Variable 10,839,584 $0.115 $1,241,911 $0.217 D-6 Dozer h/yr Fixed 5,760 $44.85 $258,319 $0.045 Piping Lot Variable $172,039 $0.030 Maintenance Supplies Lot Variable $57,346 $0.010 SUBTOTAL $1,729,616 $0.302 SART

Cerro del Gallo Heap Leach Project NI 43-101 Technical Report
January 31, 2020 Page 21-25
OPERATING COST LOM Average
Unit Annual US$ per Units Cost Type Qty Costs, US$ Costs, US$ Tonne Ore
Power kWh/yr Variable 3,590,267 $0.115 $411,344 $0.072
H2SO4 kg/yr Variable 15,615,439 $0.174 $2,710,452 $0.473 NaSH kg/yr Variable 3,532,542 $0.984 $3,474,886 $0.606 Flocculant kg/yr Variable 103,224 $4.30 $443,862 $0.077 Lime kg/yr Variable 9,748,897 $0.143 $1,394,143 $0.243 Caustic kg/yr Variable 149,101 $0.396 $59,100 $0.010 Wear & Maintenance Lot Variable $57,346 $0.010 SUBTOTAL $8,551,132 $1.491 Recovery Power kWh/yr Variable 800,032 $0.115 $91,661 $0.016 Diesel (Boiler and Kiln) L/yr Variable 339,646 $0.902 $306,385 $0.053 Carbon kg/yr Variable 37,656 $4.70 $176,983 $0.031 Misc. Operating Supplies Lot Variable $114,693 $0.020 SUBTOTAL $689,722 $0.120 Refinery Power kWh/yr Variable 484,812 $0.115 $55,546 $0.010 Fluxes Lot Variable $14,053 $0.002 Misc. Operating Supplies Lot Variable $57,346 $0.010 Maintenance Supplies Lot Variable $57,346 $0.010 SUBTOTAL $184,292 $0.032 Reagents Power kWh/yr Variable 900,029 $0.115 $103,118 $0.018 Lime kg/yr Variable - $0.143 $0 $0.000 Cyanide (Ore) kg/yr Variable 4,088,283 $2.33 $9,525,700 $1.661 Cyanide (elution) kg/yr Variable 16,758 $2.33 $39,046 $0.007 Caustic (Elution) kg/yr Variable 62,041 $0.40 $24,591 $0.004 HCl kg/yr Variable 231,530 $0.31 $71,978 $0.013 Antiscalant kg/yr Variable 151,828 $2.04 $309,729 $0.054 Maintenance Supplies Lot Variable $57,346 $0.010 SUBTOTAL $10,131,509 $1.767 Water Supply & Distribution Power kWh/yr Variable 2,103,948 $0.115 $241,053 $0.042 Maintenance Supplies Lot Variable $114,693 $0.020 SUBTOTAL $355,746 $0.062 Laboratory Power kWh/yr Variable 1,155,636 $0.115 $132,403 $0.023 Assays, Solids No/yr Fixed 54,750 $7.00 $383,250 $0.067 Assays, Solutions No/yr Fixed 36,500 $3.00 $109,500 $0.019 Misc. Supplies Lot Variable $114,693 $0.020 SUBTOTAL $739,846 $0.129

Cerro del Gallo Heap Leach Project NI 43-101 Technical Report
January 31, 2020 Page 21-26
OPERATING COST LOM Average
Unit Annual US$ per Units Cost Type Qty Costs, US$ Costs, US$ Tonne Ore
Support Services / Facilities Power kWh/yr Variable 761,579 $0.096 $73,396 $0.013 Fork Lift, 2.5 t h/yr Fixed 2,160 $6.94 $14,991 $0.003 Fuel Truck h/yr Fixed 3,600 $23.31 $83,920 $0.015 Boom Truck 10 t h/yr Fixed 1,080 $13.85 $14,960 $0.003 Backhoe/loader h/yr Fixed 2,160 $11.71 $25,304 $0.004 Pickup Trucks (16) km/yr Fixed 292,000 $1.55 $452,075 $0.079 Maintenance Truck km/yr Fixed 36,500 $0.82 $29,764 $0.005 Crane - Rough Terrain h/yr Fixed 288 $38.58 $11,112 $0.002 Bobcat h/yr Fixed 2,160 $8.00 $17,280 $0.003 Water Truck h/yr Fixed 3,840 $14.05 $53,959 $0.009 Excavator h/yr Fixed 480 $23.70 $11,378 $0.002 Light Plant h/yr Fixed 11,520 $2.05 $23,669 $0.004 Maintenance Supplies Lot Variable $114,693 $0.020 SUBTOTAL $926,500 $0.162 TOTAL COST PROCESS & SUPPORT $40,105,555 $6.994 G&A G&A Labor ea 25 $1,097,173 $0.191 G&A Expenses $2,209,776 $0.385 Water Rights $736,000 $0.128 TOTAL COST G&A $4,042,949 $0.705 TOTAL COST $44,148,504 $7.699
Source: KCA (2019)
21.3.2.1 Consumable Items Operating supplies have been estimated based upon unit costs and consumption rates predicted by metallurgical tests and have been broken down by area. Freight costs are included in all operating supply and reagent estimates. Reagent consumptions have been derived from test work and from design criteria considerations. Other consumable items have been estimated by KCA based on KCA’s experience with other similar operations. Operating costs for consumable items have been distributed based on tonnage and metal production or smelting batches, as appropriate.
21.3.2.2 Heap Leach Consumables Pipes, Fittings and Emitters – The heap pipe costs include expenses for broken pipe, fittings and valves, and abandoned tubing. The heap pipe costs are estimated to be

Cerro del Gallo Heap Leach Project NI 43-101 Technical Report
January 31, 2020 Page 21-27
US$0.03/t ore, and are based on previous detailed studies conducted by KCA on similar projects. Sodium Cyanide (NaCN) – Delivered sodium cyanide is quoted at US$2.33/kg. Cyanide is primarily consumed in the heap leach with a portion of the consumed cyanide being regenerated as part of the SART process. Overall cyanide consumption is estimated at 0.71 kg/t ore. Cement – Cement is consumed at an average rate of 10 kg/t ore with a range of 5 – 20 kg/t depending on ore type and is used for pH control and agglomeration at the heap. A delivered price of US$0.117/t has been quoted. Antiscale Agent (Scale Inhibitor) – Antiscalant consumption is based on a dosage range of 0 to 20 ppm to the suctions of the barren and pregnant pumps. A delivered price of US$2.04/kg has been used based on recent supplier quotes in KCA’s files.
21.3.2.3 Recovery Plant and SART Consumables Carbon – Carbon is used in the adsorption circuit to adsorb metal values from pregnant leach solution and is assumed to be consumed at a rate of 4% per strip. Carbon is quoted at US$4.70/kg Caustic – Caustic consumption will be 336 kg per strip. Caustic will also be consumed in the SART plant and will be used at a rate of 0.03kg/t ore. Caustic has been quoted at US$0.396/kg. Hydrochloric Acid (HCl) – Hydrochloric acid is used in the acid washing circuit to remove scale from carbon which reduces the carbons activity and ability to adsorb metal. HCl is assumed to be consumed at a rate of 1,000 L/strip and had been quoted at US$0.31/L. Flocculant – Flocculant is used in the SART circuit at the copper precipitation and gypsum thickeners and is consumed at an average rate of 0.018 kg/t ore. Flocculant has been quoted at US$4.30/kg Sulfuric Acid (H2SO4) – Sulfuric acid is consumed at an average rate of 2.72 kg/t ore for as part of the SART process. Sulfuric acid is quoted at US$0.174/kg Lime – Will be consumed in the SART plant at a rate of 1.94 kg/t ore and was quoted at $0.143/kg. NaSH – NaSH is used as part of the SART process and is consumed at an average rate of 0.62 kg/t ore. NaSH has been quoted at US$0.98/kg

Cerro del Gallo Heap Leach Project NI 43-101 Technical Report
January 31, 2020 Page 21-28
21.3.2.4 Mobile Support Equipment Mobile and support equipment are required for the process and include two fork lifts, one 17 tonne boom truck, one backhoe, sixteen pickup trucks, one maintenance truck, one 50 tonne rough terrain crane, one excavator, two bobcats and an ambulance. The costs to operate and maintain each piece of equipment have been estimated primarily using published information and project specific fuel costs. Where published information was not available, allowances were made based on KCA’s experience from similar operations.
21.3.2.5 Wear, Overhaul, Maintenance and Maintenance Supplies Overhaul and maintenance of equipment along with miscellaneous operating supplies for each area have been estimated as allowances based on tonnes of ore processed. The allowances for each area were developed based on published data as well as KCA’s experience with similar operations.
21.3.2.6 Power Power usage for the process and process-related infrastructure was derived from estimated connected loads assigned to powered equipment from the mechanical equipment list. Equipment power demands under normal operation were assigned and coupled with estimated on-stream times to determine the average energy usage and cost. The total attached power for the process and infrastructure is estimated at 11.3 MW with an average demand of 6.2 MW. Power for the Project will be provided by a 115 kV powerline at an estimated average cost of US$0.10 per kWh.
21.3.2.7 Personnel and Staffing Staffing requirements for process and administration personnel have been estimated by KCA based on experience with similar sized operations with input from Argonaut on wages and salary information based on their existing mining operations. Staffing will be primarily by Mexican nationals with an emphasis of hiring workers from the local community. Total process personnel are estimated at 142 persons including 24 laboratory workers. G&A labor is estimated at 25 persons. Mining labor will be provided by the mining contractor and is considered in the mining cost estimate. Personnel requirements and costs are summarized in Table 21.3.12. For continuous operations, there will be three crews working 12-hour shifts. Supervision and technical staff will operate on a flexible schedule to suit operational requirements.

Cerro del Gallo Heap Leach Project NI 43-101 Technical Report
January 31, 2020 Page 21-29
Table 21.3.12 Cerro del Gallo Staffing Levels and Salary Schedules
Description Number of Workers Cost US$/yr Process Supervision 10 $497,000 Crushing & Reclaim 21 $440,000 Heap Leach 29 $648,000 Recovery Plant / SART 25 $519,000 Maintenance 33 $803.000 Subtotal Process 118 $2,907,000 Laboratory 24 $576,000 Subtotal Laboratory 24 $576,000 G&A 25 $1,109,000 Subtotal G&A 25 $1,109,000 TOTAL 167 $4,592,000 Source: KCA (2019)
General and Administrative
General and administrative costs (G&A) have been estimated by Argonaut based on their existing operations in Mexico. G&A operating costs include the following items:
• Land Payments; • Communications; • IT outside services; • Computers, printers, software; • Personnel transport - daily to/from site; • Travel Costs; • Personnel housing & meals; • Access roads maintenance; • Community relations; • Outside environmental support & lab services; • Environmental supplies; • Legal; • Outside accounting support – auditors; • Office supplies; • Outside consultants; • Portable toilet service; • Safety & clinic supplies; • Insurance; • Miscellaneous.

Cerro del Gallo Heap Leach Project NI 43-101 Technical Report
January 31, 2020 Page 22-1
22 Economic Analysis
Summary
Based on the estimated production schedule, capital costs, operating costs, royalties and taxes, a cash flow model was prepared by KCA for the economic analysis of the CdG Project. All of the information used in this economic evaluation has been taken from work completed by KCA and other consultants working on this Project as described in previous sections of this Report. The Project economics were evaluated using a discounted cash flow (DCF) method, which measures the Net Present Value (NPV) of future cash flow streams. The final economic model was developed by KCA with input from Argonaut based on the following assumptions:
• The cash flow model is based on the mine production schedule developed by MDA. • The period of analysis is 21 years including two years of investment and pre-production,
16 years of production and three years for reclamation and closure. • Gold price of US$1,350/oz. • Silver prize of US$16.75/oz. • Copper price of US$6,000/t. • Average processing rate of 16,667 tpd (4.5 million tonnes for the first year, and 6 million
tonnes per year thereafter). • Overall recoveries of 60% for gold, 52% for silver and 43% for copper. • Capital and operating costs as developed in Section 21 of this Report.
The key economic parameters are presented in Table 22.1.1 and the economic summary is presented in Table 22.1.2.

Cerro del Gallo Heap Leach Project NI 43-101 Technical Report
January 31, 2020 Page 22-2
Table 22.1.1 Key Economic Parameters
Source: KCA (2019)
Item Value UnitAu Price 1,350 US$/ozAg Price 16.75 US$/ozCu Price 6,000 US$/tAu Avg. Recovery 60 %Ag Avg. Recovery 52 %Cu Avg. Recovery 43 %Treatment Rate 16,667 t/dRefining & Transportation Cost, Au 1.40 US$/ozRefining & Transportation Cost, Ag 3.50 US$/ozRefining & Transportation Cost, Ag - SART 1.00 US$/ozRefining & Transportation Cost, Cu - SART 104.32 US$/tSART Concentrate Treatment Cost 367.50 US$/wet tPayable Factor, Au 99.9 %Payable Factor, Ag 96.0 %Payable Factor, Ag - SART Concentrate 90.0 %Payable Factor, Cu - SART Concentrate 90.0 %
Annual Produced eqAu, Avg. (Au+Ag) 80 kozIncome & Corporate Tax Rate 30 %Royalties (3.75% Concessions, 0.5% Extraordinary Federal Mining Tax)
4.25 %

Cerro del Gallo Heap Leach Project NI 43-101 Technical Report
January 31, 2020 Page 22-3
Table 22.1.2 Economic Analysis Summary
Source: KCA (2019)
Production DataLife of Mine 15.5 YearsMine Throughput per day (After First Year) 16,667 Tonnes/dayMine Throughput per year (After First Year) 6,000,000 Tonnes/yearMine Throughput per year (First Year) 4,500,000 Tonnes/yearTotal Tonnes to Crusher 91,754,000 TonnesGrade Au (Avg.) 0.56 g/tGrade Ag (Avg.) 13.25 g/tGrade Cu (Avg.) 0.09 %Contained Au, oz 1,638,000 OuncesContained Ag, oz 39,099,000 OuncesContained Cu, tonnes 85,780 tonnesMetallurgical Recovery Au (Overall) 60%Metallurgical Recovery Ag (Overall) 52%Metallurgical Recovery Cu (Overall) 43%Average Annual Gold Production 64,000 OuncesAverage Annual Silver Production 1,301,000 OuncesAverage Annual copper Production 2,000 tonnesTotal Gold Produced 987,000 OuncesTotal Silver Produced 20,146,000 OuncesTotal Copper Produced 37,000 tonnesLOM Strip Ratio (W:O) 0.63Operating Costs (Average LOM)Mining (moved) $1.72 /Tonne minedMining (processed) $2.81 /Tonne processedProcessing & Support $6.99 /Tonne processedG&A $0.71 /Tonne processed Total Operating Cost $10.51 /Tonne processedTotal By-Product Cash Cost $597 /Ounce AuAll-in Sustaining Cost $677 /Ounce AuCapital Costs (Excluding IVA and Closure)Initial Capital $134 millionLOM Sustaining Capital $39 million Total LOM Capital $173 millionWorking Capital & Initial Fills $11 millionClosure Costs $37 millionFinancial AnalysisGold Price Assumption $1,350 /OunceSilver Price Assumption $16.75 /OunceAverage Annual Cashflow (Pre-Tax) $49 millionAverage Annual Cashflow (After-Tax) $39 millionInternal Rate of Return (IRR), Pre-Tax 25.8%Internal Rate of Return (IRR), After-Tax 20.0%
NPV @ 5% (Pre-Tax) $290 millionNPV @ 5% (After-Tax) $175 million
Pay-Back Period (Years based on After-Tax) 4.5 Years

Cerro del Gallo Heap Leach Project NI 43-101 Technical Report
January 31, 2020 Page 22-4
Methodology
The CdG Project economics are evaluated using a discounted cash flow method. The DCF method requires that annual cash inflows and outflows are projected, from which the resulting net annual cash flows are discounted back to the Project evaluation date. Considerations for this analysis include the following:
• The cash flow model has been developed by KCA with input from Argonaut on taxes and depreciation.
• The cash flow model is based on the mine production schedule developed by MDA. • Gold and silver production and revenue in the model are delayed to reflect the time
required to recover values from the heap. • The period of analysis is 21 years including two years of investment and pre-production,
16 years of production and three years for reclamation and closure. • All cash flow amounts are in US dollars (US$). All costs are considered to be 3rd quarter
2019 costs. Inflation is not considered in this model. • The Internal Rate of Return (IRR) is calculated as the discount rate that yields a zero Net
Present Value (NPV). • The NPV is calculated by discounting the annual cash back to Year -2 at different discount
rates. All annual cash flows are assumed to occur at the end of each respective year. • The payback period is the amount of time, in years, required to recover the initial
construction capital cost. • Working capital and initial fills are considered in this model and include mining, processing
and general administrative operating costs. The model assumes working capital and initial fills are recovered during the final two years of operation.
• Royalties and government taxes are included in the model. • Salvage value for process equipment is considered and is applied at the end of the Project. • Reclamation and closure costs are included.
The economic analysis is performed on a before and after-tax basis in constant dollar terms, with the cash flows estimated on a project basis.
General Assumptions
General assumptions for the model, including cost inputs, parameters, royalties and taxes are as follows:
• Basic and detailed engineering would begin shortly after an approval to proceed while site construction is expected to begin within six months of the approval.
• First gold pour is expected to occur 19 to 20 months after approval to proceed. • Gold price of US$1,350/oz is used as the base case commodity price.

Cerro del Gallo Heap Leach Project NI 43-101 Technical Report
January 31, 2020 Page 22-5
• Silver price of US$16.75/oz as the base commodity price. • Copper price of US$6,000/t as the base commodity price. • Gold, silver and copper production and revenue in the model are delayed from the time
material is stacked to reflect the time required to recovery metal values from the heap. • LOM average operating costs of US$10.51/t ore including a mining cost of US$2.81/t ore
(US$1.72/ tonne mined), processing cost of US$6.99/t ore and G&A cost of US$0.71/t ore. • Pre-production capital costs for the Project are spent entirely in Years -2 and -1.
Sustaining capital for the heap leach pad expansions is spent in Years 1, 2, 5 and 11. • Working capital equal to 60 days of operating costs during the pre-production and ramp
up period is included for mining, process and G&A costs as well as initial fills for process reagents and consumables. The assumption is made that all working capital and initial fills can be recovered in the final years of operation and the effective sum of working capital and initial fills over the life of mine is zero.
• Depreciation allowances for eligible items are included in the model based on straight line depreciation schedules.
• IVA is applied at 16% to all capital costs as a part of this model and is assumed to be 100% refundable the following year. IVA is not applied to operating costs.
• A 3.75% NSR is included for royalty agreements with mining claim owners. • A 0.5% NSR is included and payable to the government as an “extraordinary mining duty.” • An income tax of 30% is considered. • A 7.5% mining tax is included and is based on EBITDA less exploration and deductible
earthworks costs. • A refinery and transportation cost of US$1.40/oz for gold and US$3.50/oz for silver and
US$104.32/t for copper is used in the model, including insurance. Gold and silver in doré are assumed to be 99.9% and 96% payable, respectively. Copper and silver in the SART concentrate are assumed to be 90.0% payable.
• SART precipitate treatment charges as detailed in Section 19 are applied. • A loss-carry-forward of US$14.2 million is included. • Pre-production exploration costs of US$19.3 million are included and are assumed to be
depreciable using the straight-line method at varying rates between 2% and 15% annually. • By-product cash operating costs per payable ounce represent the mine site operating
costs including mining, processing, metal transport, refining, administration costs and royalties with a credit for silver and copper produced. Operating costs are presented in greater detail in Section 21 of this report.
• All in sustaining costs per payable ounce represent the mine site operating costs including mining, processing, metal transport, refining, administration costs and royalties with a credit for silver and copper produced as well as the LOM sustaining capital and reclamation and closure costs.

Cerro del Gallo Heap Leach Project NI 43-101 Technical Report
January 31, 2020 Page 22-6
• The cash flow analysis evaluates the Project on a stand-alone basis. No withholding taxes or dividends are included. No head office or overheads for the parent company are included.
Capital Expenditures
Capital expenditures include initial capital (pre-production or construction costs), sustaining capital and working capital. The capital expenditures are presented in detail in Section 21 of this Report. The economic model assumes working capital and initial fills will be recovered at the end of the operation and are applied as credits against the capital cost. Working capital and initial fills are assumed to be recovered during Years 15 and 16. Salvage value for equipment is considered as taxable income and is applied during Years 16 through 18 after equipment items are no longer in service.
Royalties
Royalties payable for CdG include an average 3.75% to different claim owners and a 0.5% royalty due to the Mexican government as an “Extraordinary Mining Duty.” The mining claims royalties represents US$66.9 million over the life of the mine and the 0.5% extraordinary mining duty represents US$8.9 million.
Operating Costs
Operating costs were estimated by KCA for all process and support services. G&A operating costs were estimated by KCA with input from Argonaut. Mining costs were estimated by MDA. LOM operating costs for the CdG Project are summarized in Section 21 of this report.
Closure Costs
Reclamation and closure include costs for works to be conducted for the closure of the mine at the end of operations and have been estimated primarily by KCA with input from Golder on material takeoffs for re-contouring and covering the heap leach and waste rock facilities. Average reclamation and closure costs are estimated at US$0.40/t ore processed, or US$36.7 million.
Taxation
Value Added Tax (IVA)
The “Impuesto al Valor Agregado” (IVA) is a 16% value added tax applied to all goods and services and is considered to be fully refundable. For the economic model, a 16%

Cerro del Gallo Heap Leach Project NI 43-101 Technical Report
January 31, 2020 Page 22-7
IVA is applied to all capital costs in the year in which they occur with the IVA refund or credit being applied in the following year. IVA is not considered in the operating cost estimate as it is assumed that once in operation IVA paid vs. IVA credits will be a net zero value during the period in which they occur.
Federal Income Tax
Federal income tax is applied at 30% of the Project income after deductions of eligible expenses including depreciation of assets, earthworks and indirect construction costs, exploration costs, special mining tax, extraordinary mining duty and any losses carried forward.
Special Mining Tax
The special mining duty is applied at 7.5% of the Project income after deduction of eligible exploration, earthworks and indirect costs expenses. Income subject to the special mining tax does not allow deductions for depreciation or allow losses carried forward.
Depreciation
Depreciation of assets has been estimated based on a straight-line method with eligible cost items being depreciated at rates between 2% and 15% per year based on the depreciation schedule for the specific item, including pooled costs for exploration and pre-production development of the Project. All earthworks and indirect construction costs are assumed to be 100% depreciable in the year in which the expense occurred. Salvage value is not considered for the depreciation value of capital items, as salvage is considered as taxable income in the model
Loss Carry Forward
The Mexican tax law allows for the carry-forward of operating losses for the development of a property. The loss carry-forward is estimated at US$14.2 million based on information provided by Argonaut.
Economic Model & Cash Flow
The discounted cash flow model for the CdG Project is presented in Table 22.8.1 and is based on the inputs and assumptions detailed in this Section.

Cerro del Gallo Heap Leach Project NI 43-101 Technical Report
January 31, 2020 Page 22-8
Table 22.8.1 Cashflow Model Summary
Source: KCA (2019)
Assumptions OutputAu Price 1,350 $/oz Pre-Tax NPV i, % After-Tax NPVAg Price 16.75 $/oz $536,738,000 0% $340,347,000 Mine Life 15.5 yearsCu Price 6000 $/t $290,362,000 5% $175,252,000 Payback 4.5 yearsAu Recovery, Weathered 74.0 % $200,312,000 8% $114,347,000Ag Recovery, Weathered 60.0 % $155,369,000 10% $83,845,000Cu Recovery, Weathered 22.0 % $77,872,000 15% $31,160,000Au Recovery, Mixed Oxide 70.0 % 25.8% IRR 20.0%Ag Recovery, Mixed Oxide 79.0 %Cu Recovery, Mixed Oxide 46.0 %Au Recovery, Mixed Sulphide 59.0 % Total Au Recovered 986,932 Ounces Stripping Ratio 0.63 t/tAg Recovery, Mixed Sulphide 59.0 % Payable Ounces 986,192 OuncesCu Recovery, Mixed Sulphide 59.0 %Au Recovery, Sulphide 58.0 % Max Annual Au oz 81,514Ag Recovery, Sulphide 40.0 % By-Product Cash Cost, per ounce, $ $597.43Cu Recovery, Sulphide 34.0 % All-in Sustaining Cost per ounce, $ $677.18 LOM Tonnes 91,754,325
Treatment Rate 16,667 tpd
Exchange Rate: 19.3 MXN : 1 USD
Refining and Transport Cost Au 1.40 $/oz - AssumedRefining and Transport Cost Ag 3.50 %Refining and Transport Cost Cu - SART 104.32 $/t - GV MeralsRefining and Transport Cost Ag - SART 1.00 $/oz - GV MineralsTreatment Charge - SART 367.50 $/wmt
Gold Pay Factor 99.93% AssumedSilver Pay Factor 96.0% AssumedSilver Pay Factor - SART 90.0% GV mineralsCopper Pay Factor - SART 90.0% GV MineralsRoyalties 3.8%Extraordinary Mining Duty 0.50%Export Tax 0.00% N/AIncome Tax Rate 30.0%Special Mining Tax Rate 7.5%
Salvage Value Percentage (Mining Eq.) 15.0% AssumedSalvage Value Percentage (Process Eq.) 10.0% AssumedSalvage Value Percentage (Electrical Eq.) 5.0% Assumed
Item UNITS TOTAL Year -2 Year -1 Q1 Q2 Q3 Q4 Q1 Q2 Q3 Q4 Y1 Total Y2 Total Year 3 Year 4 Year 5 Year 6 Year 7 Year 8 Year 9 Year 10 Year 11 Year 12 Year 13 Year 14 Year 15 Year 16 Year 17 Year 18 Year 19Total MinedLeachable Tonnes 91,754,325 385,538 826,178 1,033,285 1,293,519 1,209,607 1,456,613 1,439,207 1,555,566 1,508,121 4,362,589 5,959,506 5,979,844 6,011,802 6,050,897 5,882,437 6,104,398 6,117,055 5,820,242 6,347,403 5,668,078 6,106,568 6,016,438 6,000,000 6,000,000 2,941,530Total mined 149,534,146 2,292,322 1,060,876 1,151,762 1,411,815 1,349,924 1,619,973 1,637,902 1,839,904 1,839,864 4,974,377 6,937,642 8,093,713 8,519,859 8,539,949 8,273,913 7,301,847 9,003,633 11,611,851 16,007,604 17,097,965 13,138,547 9,780,847 7,991,906 6,882,267 3,085,904Strip Ratio (W:O) 0.63 4.95 0.28 0.11 0.09 0.12 0.11 0.14 0.18 0.22 0.14 0.16 0.35 0.42 0.41 0.41 0.20 0.47 1.00 1.52 2.02 1.15 0.63 0.33 0.15 0.05Ore Processed
91,754,325 1,126,769 1,126,769 1,126,769 1,126,769 1,500,000 1,500,000 1,500,000 1,500,000 4,507,074 6,000,000 6,000,000 6,000,000 6,016,438 6,000,000 6,000,000 6,000,000 6,016,438 6,000,000 6,000,000 6,000,000 6,016,438 6,000,000 6,000,000 3,197,936 00.56 0.46 0.46 0.46 0.46 0.56 0.56 0.56 0.56 0.46 0.56 0.58 0.56 0.54 0.57 0.64 0.72 0.60 0.54 0.43 0.46 0.54 0.58 0.55 0.51
13.25 14.86 14.86 14.86 14.86 13.71 13.71 13.71 13.71 14.86 13.71 13.70 13.97 14.32 13.24 13.83 13.75 15.63 13.01 12.89 11.11 12.05 12.77 11.97 10.250.09 0.07 0.07 0.07 0.07 0.08 0.08 0.08 0.08 0.09 0.09 0.09 0.09 0.09 0.09 0.11 0.09 0.11 0.10 0.10 0.10 0.09 0.09
30,697 356 356 356 356 532 532 532 532 1,423 2,128 2,130 2,046 1,969 2,062 2,295 2,578 2,158 1,904 1,521 1,621 1,896 2,050 1,945 970626,601 9,904 9,904 9,904 9,904 11,804 11,804 11,804 11,804 39,615 47,215 46,244 46,723 48,062 43,409 43,413 41,681 49,198 36,942 38,537 31,376 33,161 34,808 31,230 14,98836,757 286 286 286 286 538 538 538 538 1,143 2,152 2,584 2,571 2,566 2,461 2,602 2,314 2,845 2,218 2,637 2,476 2,477 2,506 2,137 1,068
986,932 9,722 11,438 11,438 11,438 16,253 17,103 17,103 17,103 44,035 67,564 60,776 66,200 63,677 65,848 72,667 81,514 71,415 62,451 50,742 51,632 59,633 65,155 63,041 40,583 0 0 020,146,001 270,655 318,417 318,417 318,417 370,340 379,503 379,503 379,503 1,225,907 1,508,848 1,320,702 1,499,882 1,538,798 1,418,085 1,395,760 1,348,455 1,545,515 1,246,835 1,231,323 1,043,318 1,057,565 1,111,185 1,021,331 632,494 0 0 0
36,677 243 286 286 286 500 538 538 538 1,100 2,114 2,196 2,573 2,566 2,477 2,581 2,357 2,765 2,312 2,574 2,500 2,477 2,502 2,193 1,388986,192 9,715 11,429 11,429 11,429 16,241 17,091 17,091 17,091 44,001 67,513 60,731 66,150 63,629 65,798 72,613 81,453 71,361 62,404 50,704 51,593 59,589 65,106 62,993 40,553 0 0 0
18,191,839 244,401 287,531 287,531 287,531 334,417 342,691 342,691 342,691 1,106,994 1,362,490 1,192,593 1,354,394 1,389,535 1,280,530 1,260,371 1,217,655 1,395,600 1,125,892 1,111,885 942,116 954,981 1,003,400 922,262 571,142 0 0 033,009 219 257 257 257 450 484 484 484 1,976 2,316 2,310 2,229 2,323 2,122 2,489 2,081 2,317 2,250 2,229 2,252 1,973 1,249 0 0 0
$24,434,000 $165,000 $194,000 $194,000 $194,000 $335,000 $360,000 $360,000 $360,000 $1,465,000 $1,716,000 $1,712,000 $1,651,000 $1,719,000 $1,572,000 $1,843,000 $1,540,000 $1,711,000 $1,659,000 $1,644,000 $1,661,000 $1,457,000 $922,000 $0 $0 $0 Refining & Transportation Charge Cu $3,447,000 $23,000 $27,000 $27,000 $27,000 $47,000 $51,000 $51,000 $51,000 $206,000 $242,000 $241,000 $233,000 $242,000 $221,000 $260,000 $217,000 $242,000 $235,000 $233,000 $235,000 $206,000 $130,000 $0 $0 $0 Refining & Transportation Charge Au + Ag $23,946,000 $279,000 $328,000 $328,000 $328,000 $385,000 $396,000 $396,000 $396,000 $1,262,000 $1,572,000 $1,378,000 $1,562,000 $1,596,000 $1,481,000 $1,469,000 $1,435,000 $1,614,000 $1,308,000 $1,277,000 $1,094,000 $1,119,000 $1,179,000 $1,088,000 $676,000 $0 $0 $0NET REVENUE $1,785,131,000 $0 $18,053,000 $21,239,000 $21,239,000 $21,239,000 $29,461,000 $30,910,000 $30,910,000 $30,910,000 $76,682,000 $112,392,000 $110,772,000 $122,364,000 $119,484,000 $120,286,000 $129,644,000 $139,859,000 $130,929,000 $112,526,000 $97,746,000 $95,946,000 $106,821,000 $115,134,000 $109,578,000 $70,081,000 $0 $0 $0Operating CostsContract Mining Costs $2.72 $249,873,000 $1,933,000 $2,016,000 $2,395,000 $2,288,000 $2,720,000 $2,753,000 $3,047,000 $3,048,000 $8,633,000 $11,569,000 $13,299,000 $13,931,000 $13,893,000 $13,585,000 $12,271,000 $15,023,000 $18,633,000 $26,211,000 $29,196,000 $22,897,000 $17,425,000 $14,500,000 $12,755,000 $6,054,000Owner Mining Costs $0.09 $7,990,000 $127,000 $127,000 $128,000 $128,000 $127,000 $127,000 $128,000 $128,000 $510,000 $510,000 $510,000 $510,000 $510,000 $510,000 $510,000 $510,000 $510,000 $510,000 $510,000 $510,000 $510,000 $510,000 $510,000 $340,000Processing Cost $6.99 $641,692,000 $10,194,000 $10,194,000 $10,194,000 $10,194,000 $10,750,000 $10,750,000 $10,750,000 $10,750,000 $40,775,000 $42,999,000 $42,443,000 $41,931,000 $41,814,000 $41,337,000 $41,768,000 $41,666,000 $41,890,000 $40,683,000 $40,106,000 $40,468,000 $40,496,000 $40,558,000 $40,010,000 $22,746,000G&A Cost $0.71 $64,692,000 $1,014,000 $1,014,000 $1,014,000 $1,014,000 $1,014,000 $1,014,000 $1,014,000 $1,014,000 $4,055,000 $4,055,000 $4,055,000 $4,055,000 $4,055,000 $4,055,000 $4,055,000 $4,055,000 $4,055,000 $4,055,000 $4,055,000 $4,055,000 $4,055,000 $4,055,000 $4,055,000 $3,865,000TOTAL OPERATING COSTS $964,247,000 $0.00 $0.00 $13,268,000.00 $13,351,000.00 $13,731,000 $13,624,000 $14,611,000 $14,644,000 $14,939,000 $14,940,000 $53,974,000.00 $59,134,000.00 $60,307,000 $60,427,000 $60,272,000 $59,487,000 $58,604,000 $61,254,000 $65,088,000 $71,459,000 $73,867,000 $67,930,000 $62,486,000 $59,623,000 $57,330,000 $33,005,000 $0 $0 $0TaxesSpecialy Mining Tax $54,410,000 $308,000 $532,000 $503,000 -$59,000 $1,031,000 $1,133,000 $1,111,000 $835,000 $1,284,000 $4,109,000 $3,473,000 $4,301,000 $3,642,000 $4,222,000 $4,963,000 $5,502,000 $4,570,000 $2,764,000 $1,516,000 $1,831,000 $3,025,000 $3,564,000 $3,335,000 $2,308,000 $0 $0 $0Income Tax Payable $141,980,000 $0 $0 $0 $0 $0 $0 $0 $0 $0 $0 $1,626,000 $10,645,000 $8,103,000 $10,247,000 $13,001,000 $17,443,000 $15,582,000 $9,150,000 $5,167,000 $6,343,000 $10,855,000 $12,896,000 $12,078,000 $8,844,000 $0 $0 $0TOTAL TAXES $196,390,000 $0 $0 $308,000 $532,000 $503,000 -$59,000 $1,031,000 $1,133,000 $1,111,000 $835,000 $1,284,000 $4,110,000 $5,099,000 $14,946,000 $11,745,000 $14,469,000 $17,964,000 $22,945,000 $20,152,000 $11,914,000 $6,683,000 $8,174,000 $13,880,000 $16,460,000 $15,413,000 $11,152,000 $0 $0 $0Capital CostsDirect & Indirect Costs Total $176,132,000 $9,817,000 $124,365,000 $0 $0 $0 $21,310,000 $0 $0 $0 $6,694,000 $21,310,000 $6,694,000 $0 $0 $11,238,000 $0 $0 $0 $0 $0 $2,708,000 $0 $0 $0 $0 $0 $0 $0 $0Working Capital (Initial Fills) $638,000 $638,000Working Capital (60 days) $10,509,000 $10,509,000Process Preproduction $0Less: Working Capital Recovery $11,147,000 $3,716,000 $7,431,000Net Working Capital $0 $0 $11,147,000 $0 $0 $0 $0 $0 $0 $0 $0 $0 $0 $0 $0 $0 $0 $0 $0 $0 $0 $0 $0 $0 $0 -$3,716,000 -$7,431,000 $0 $0 $0Subtotal $176,132,000 $9,817,000 $135,512,000 $0 $0 $0 $21,310,000 $0 $0 $0 $6,694,000 $21,310,000 $6,694,000 $0 $0 $11,238,000 $0 $0 $0 $0 $0 $2,708,000 $0 $0 $0 -$3,716,000 -$7,431,000 $0 $0 $0IVA 16% $28,181,000 $1,571,000 $19,898,000 $0 $0 $0 $3,410,000 $0 $0 $0 $1,071,000 $3,410,000 $1,071,000 $0 $0 $1,798,000 $0 $0 $0 $0 $0 $433,000 $0 $0 $0 $0 $0 $0 $0 $0Less: IVA (Rebate) $28,181,000 $1,571,000 $0 $0 $0 $19,898,000 $0 $0 $0 $3,410,000 $19,898,000 $3,410,000 $1,071,000 $0 $0 $1,798,000 $0 $0 $0 $0 $0 $433,000 $0 $0 $0 $0 $0 $0 $0Net IVA $0 $1,571,000 $18,328,000 $0 $0 $0 -$16,489,000 $0 $0 $0 -$2,339,000 -$16,489,000 -$2,339,000 -$1,071,000 $0 $1,798,000 -$1,798,000 $0 $0 $0 $0 $433,000 -$433,000 $0 $0 $0 $0 $0 $0 $0Subtotal $176,133,000 $11,388,000 $153,840,000 $0 $0 $0 $4,821,000 $0 $0 $0 $4,355,000 $4,821,000 $4,355,000 -$1,071,000 $0 $13,037,000 -$1,798,000 $0 $0 $0 $0 $3,141,000 -$433,000 $0 $0 -$3,716,000 -$7,431,000 $0 $0 $0Reclaimation & Closure $0.40 $36,700,000 $3,670,000 $3,670,000 $3,670,000 $7,340,000 $9,175,000 $9,175,000TOTAL CAPITAL $212,834,000 $11,388,000 $153,840,000 $0 $0 $0 $4,821,000 $0 $0 $0 $4,355,000 $4,821,000 $4,355,000 ($1,071,000) $0 $13,037,000 ($1,798,000) $0 $0 $0 $0 $3,141,000 ($433,000) $0 $3,670,000 ($45,000) ($3,761,000) $7,340,000 $9,175,000 $9,175,000
PRE-TAX NET CASH FLOW Total Year -2 Year -1 Q1 Q2 Q3 Q4 Q1 Q2 Q3 Q4 Y1 Total Y2 Total Year 3 Year 4 Year 5 Year 6 Year 7 Year 8 Year 9 Year 10 Year 11 Year 12 Year 13 Year 14 Year 15 Year 16 Year 17 Year 18 Year 19Pre-Tax Net Cash FlowPre-tax net cash flow $608,063,000 -$11,388,000 -$153,840,000 $4,785,000 $7,889,000 $7,510,000 $2,796,000 $14,849,000 $16,267,000 $15,973,000 $11,617,000 $22,980,000 $58,706,000 $51,535,000 $61,939,000 $46,175,000 $62,598,000 $71,041,000 $78,605,000 $65,843,000 $41,067,000 $20,738,000 $28,449,000 $44,335,000 $51,841,000 $52,293,000 $40,836,000 -$7,340,000 -$9,175,000 -$9,175,000Royalty Payable 3.75% $66,943,000 $0 $0 $677,000 $796,000 $796,000 $796,000 $1,105,000 $1,159,000 $1,159,000 $1,159,000 $3,066,000 $4,582,000 $4,154,000 $4,589,000 $4,481,000 $4,511,000 $4,862,000 $5,245,000 $4,910,000 $4,220,000 $3,665,000 $3,598,000 $4,006,000 $4,318,000 $4,109,000 $2,628,000 $0 $0 $0Extraordianry Mining Duty 0.50% $8,926,000 $0 $0 $90,000 $106,000 $106,000 $106,000 $147,000 $155,000 $155,000 $155,000 $409,000 $611,000 $554,000 $612,000 $597,000 $601,000 $648,000 $699,000 $655,000 $563,000 $489,000 $480,000 $534,000 $576,000 $548,000 $350,000 $0 $0 $0Salvage Value $4,542,000 $0 $0 $1,363,000 $2,725,000 $454,000IVA Refund (Project Purchase + Pre-Prod. Exploration) $0Pre-tax net cash flow $536,736,000 -$11,388,000 -$153,840,000 $4,018,000 $6,987,000 $6,608,000 $1,894,000 $13,597,000 $14,953,000 $14,659,000 $10,303,000 $19,507,000 $53,512,000 $46,827,000 $56,738,000 $41,097,000 $57,486,000 $65,531,000 $72,661,000 $60,278,000 $36,284,000 $16,584,000 $24,371,000 $39,795,000 $46,947,000 $47,636,000 $39,221,000 -$4,615,000 -$8,721,000 -$9,175,000
-$11,388,000 -$153,840,000 $19,507,000 $53,512,000 $46,827,000 $56,738,000 $41,097,000 $57,486,000 $65,531,000 $72,661,000 $60,278,000 $36,284,000 $16,584,000 $24,371,000 $39,795,000 $46,947,000 $47,636,000 $39,221,000 -$4,615,000 -$8,721,000 -$9,175,000Cumulative -$11,388,000 -$165,227,000 -$161,209,000 -$154,222,000 -$147,614,000 -$145,720,000 -$132,123,000 -$117,170,000 -$102,511,000 -$92,208,000 -$145,720,000 -$92,208,000 -$45,381,000 $11,357,000 $52,454,000 $109,940,000 $175,471,000 $248,132,000 $308,410,000 $344,694,000 $361,278,000 $385,649,000 $425,444,000 $472,391,000 $520,027,000 $559,248,000 $554,633,000 $545,912,000 $536,737,000
After-TAX NET CASH FLOW Year -2 Year -1 Q1 Q2 Q3 Q4 Q1 Q2 Q3 Q4 Y1 Total Y2 Total Year 3 Year 4 Year 5 Year 6 Year 7 Year 8 Year 9 Year 10 Year 11 Year 12 Year 13 Year 14 Year 15 Year 16 Year 17 Year 18 Year 19After-Tax Net Cash Flow Income & Other Taxes $196,390,000 $0 $0 $308,000 $532,000 $503,000 -$59,000 $1,031,000 $1,133,000 $1,111,000 $835,000 $1,284,000 $4,110,000 $5,099,000 $14,946,000 $11,745,000 $14,469,000 $17,964,000 $22,945,000 $20,152,000 $11,914,000 $6,683,000 $8,174,000 $13,880,000 $16,460,000 $15,413,000 $11,152,000 $0 $0 $0After-Tax net annual Cash Flow, $ $340,346,000 -$11,388,000 -$153,840,000 $3,710,000 $6,455,000 $6,105,000 $1,953,000 $12,566,000 $13,820,000 $13,548,000 $9,468,000 $18,223,000 $49,402,000 $41,728,000 $41,792,000 $29,352,000 $43,017,000 $47,567,000 $49,716,000 $40,126,000 $24,370,000 $9,901,000 $16,197,000 $25,915,000 $30,487,000 $32,223,000 $28,069,000 -$4,615,000 -$8,721,000 -$9,175,000
$340,346,000 -$11,388,000 -$153,840,000 $18,223,000 $49,402,000 $41,728,000 $41,792,000 $29,352,000 $43,017,000 $47,567,000 $49,716,000 $40,126,000 $24,370,000 $9,901,000 $16,197,000 $25,915,000 $30,487,000 $32,223,000 $28,069,000 -$4,615,000 -$8,721,000 -$9,175,000Cumulative -$11,388,000 -$165,228,000 -$161,518,000 -$155,063,000 -$148,958,000 -$147,005,000 -$134,439,000 -$120,619,000 -$107,071,000 -$97,603,000 -$147,005,000 -$97,603,000 -$55,875,000 -$14,083,000 $15,269,000 $58,286,000 $105,853,000 $155,569,000 $195,695,000 $220,065,000 $229,966,000 $246,163,000 $272,078,000 $302,565,000 $334,788,000 $362,857,000 $358,242,000 $349,521,000 $340,346,000
Year 1 Year 2
$18,223,000 $49,402,000
Year 1 Year 2
$19,507,000 $53,512,000
Treatment Charge - SARTCopper payable, t
Recoverable Copper, t
Total Gold Produced, ozTotal Silver Produced, ozTotal Copper Produced, t
Gold payable, ozsilver payable, oz
Recoverable Gold, kgRecoverable Silver, kg
Year 1 Year 2
Ore Processed to Heap Leach Au grade, g/t Ag grade, g/t Cu grade, %

Cerro del Gallo Heap Leach Project NI 43-101 Technical Report
January 31, 2020 Page 22-9
The CdG cash flows are net of royalties and taxes. The Project yields an after-tax internal rate of return of 20.0%.
Sensitivity
To estimate the relative economic strength of the Project, base case sensitivity analyses have been completed analyzing the economic sensitivity to several parameters including changes in gold and silver prices, capital costs, and average operating cash cost per tonne of ore processed and exchange rate. The sensitivities are based on +/- 25% of the base case for capital costs and operating costs and select gold and silver prices. The after-tax analysis is presented in Table 22.9.1. Figure 22.9.1 and Figure 22.9.2 present graphical representations of the after-tax sensitivities. Variations in metals price and operating cost have the largest influence on the sensitivity of the Project. From these sensitivities it can be seen that the Project is economically robust. The economic indicators chosen for sensitivity evaluation are the internal rate of return (IRR) and NPV at 5% discount rate.

Cerro del Gallo Heap Leach Project NI 43-101 Technical Report
January 31, 2020 Page 22-10
Table 22.9.1 After-Tax Sensitivity Analysis Results
Source: KCA (2019)
Gold and Silver Price IRR 0% 5% 10%
Au, US$/oz Ag, US$/oz$1,350 $16.75 19.4% $325,557,000 $166,327,000 $78,080,000
85% $1,150 $14.25 12.7% $189,984,000 $81,018,000 $20,740,00093% $1,250 $15.50 16.5% $265,165,000 $128,231,000 $52,434,000
100% $1,350 $16.75 20.0% $340,347,000 $175,252,000 $83,845,000107% $1,450 $18.00 23.2% $415,528,000 $222,117,000 $115,021,000115% $1,550 $19.25 26.3% $490,709,000 $268,915,000 $146,090,000
Variation IRR 0% 5% 10%Gold Price US$
$1,350 20.0% $340,347,000 $175,252,000 $83,845,00085% $1,150 14.2% $218,113,000 $99,108,000 $33,155,00093% $1,250 17.2% $279,234,000 $137,220,000 $58,558,000
100% $1,350 20.0% $340,347,000 $175,252,000 $83,845,000107% $1,450 22.6% $401,459,000 $213,174,000 $108,966,000115% $1,550 25.1% $462,580,000 $251,098,000 $134,085,000
Capital Costs US$$212,833,000 20.0% $340,347,000 $175,252,000 $83,845,000
75% $171,587,000 26.5% $368,464,000 $203,809,000 $111,593,00090% $196,335,000 22.2% $351,594,000 $186,675,000 $94,944,000
100% $212,833,000 20.0% $340,347,000 $175,252,000 $83,845,000110% $229,332,000 18.0% $329,100,000 $163,807,000 $72,713,000125% $254,080,000 15.6% $312,229,000 $146,549,000 $55,877,000
Operating Costs US$$964,240,000 20.0% $340,347,000 $175,252,000 $83,845,000
75% $723,180,000 26.4% $496,433,000 $271,710,000 $147,550,00090% $867,816,000 22.6% $402,781,000 $213,867,000 $109,377,000
100% $964,240,000 20.0% $340,347,000 $175,252,000 $83,845,000110% $1,060,665,000 17.1% $277,912,000 $136,518,000 $58,133,000125% $1,205,301,000 12.5% $184,260,000 $78,185,000 $19,224,000
Exchange Rate MXN/US$19.3 20.0% $340,347,000 $175,252,000 $83,845,000
75% 19.3 14.5% $253,107,000 $115,556,000 $39,783,00090% 19.3 18.1% $311,266,000 $155,419,000 $69,256,000
100% 19.3 20.0% $340,347,000 $175,252,000 $83,845,000110% 19.3 21.5% $364,142,000 $191,411,000 $95,679,000125% 19.3 23.5% $392,709,000 $210,815,000 $109,892,000
NPV
Variation
NPV
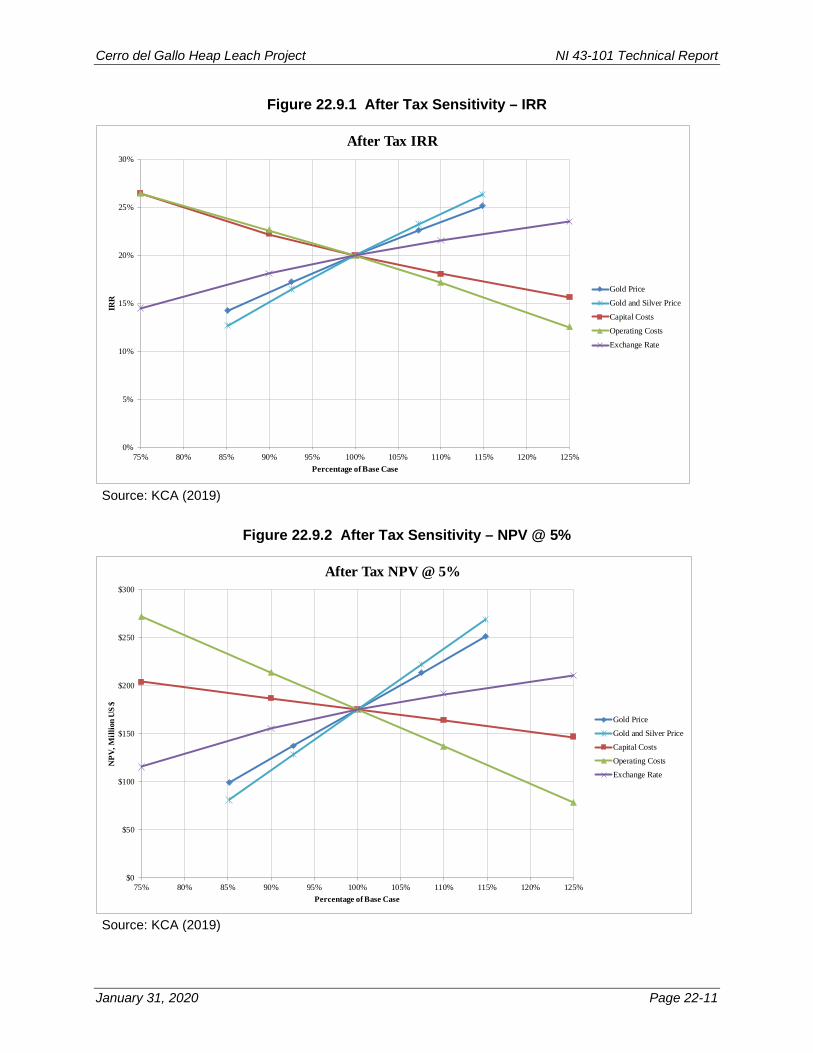
Cerro del Gallo Heap Leach Project NI 43-101 Technical Report
January 31, 2020 Page 22-11
Figure 22.9.1 After Tax Sensitivity – IRR
Source: KCA (2019)
Figure 22.9.2 After Tax Sensitivity – NPV @ 5%
Source: KCA (2019)
0%
5%
10%
15%
20%
25%
30%
75% 80% 85% 90% 95% 100% 105% 110% 115% 120% 125%
IRR
Percentage of Base Case
After Tax IRR
Gold Price
Gold and Silver Price
Capital Costs
Operating Costs
Exchange Rate
$0
$50
$100
$150
$200
$250
$300
75% 80% 85% 90% 95% 100% 105% 110% 115% 120% 125%
NPV
, Mill
ion
US
$
Percentage of Base Case
After Tax NPV @ 5%
Gold Price
Gold and Silver Price
Capital Costs
Operating Costs
Exchange Rate

Cerro del Gallo Heap Leach Project NI 43-101 Technical Report
January 31, 2020 Page 23-1
23 Adjacent Properties
Within the boundary belonging to San Antón de las Minas S.A. de S.V. (SAM), as presented in Figure 23.1, there exist some small-scale mining claims. In total there are four mining lots, which include:
• El Eden Title 212009 on behalf of the concessionaire Compañía Minera El Cubo SA de C.V.
o Surface area of 1675.8 hectares
• La Providencia Title 211859 on behalf of the concessionaire Compañía Minera El Cubo SA de C.V.
o Surface area of 254.6 hectares
• Virgan Title 214424 on behalf of the concessionaire Compañía Minera El Cubo SA de C.V.
o Surface area of 49 hectares
• Providencia Title 211859 on behalf of the concessionaire Lauro Gonzalez Ibarra o Surface area of 48 hectares
Argonaut has not done any prospecting work in any of the adjacent areas.
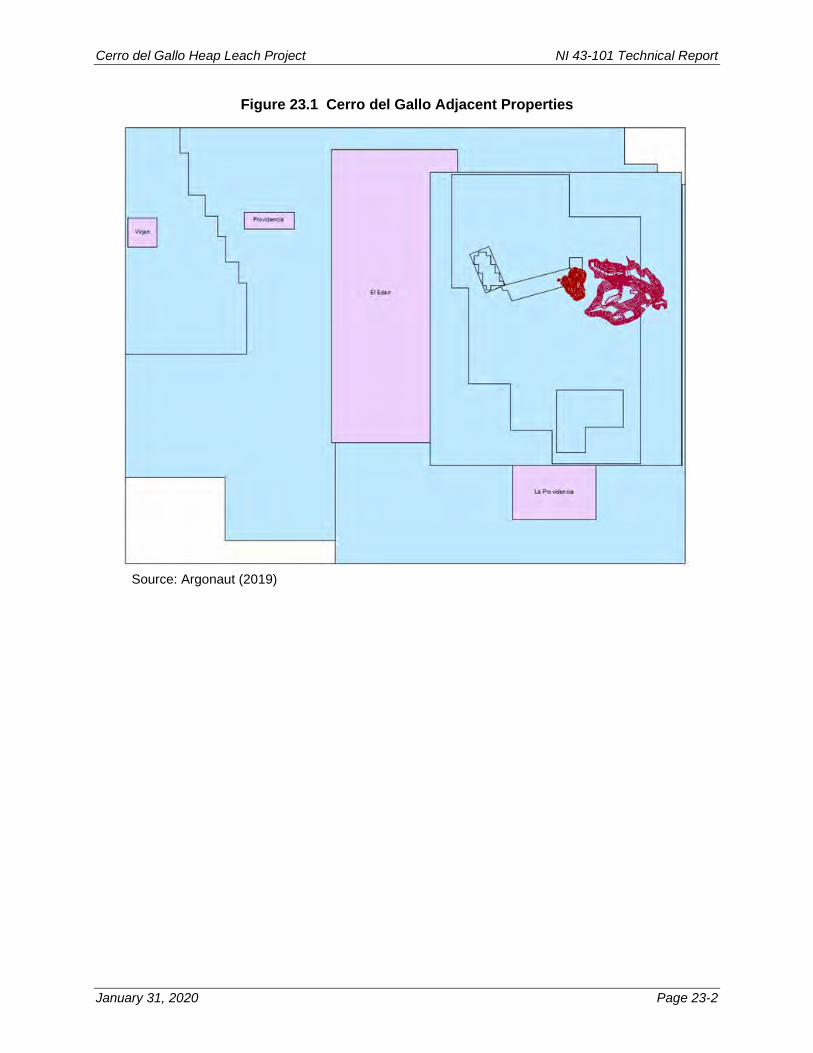
Cerro del Gallo Heap Leach Project NI 43-101 Technical Report
January 31, 2020 Page 23-2
Figure 23.1 Cerro del Gallo Adjacent Properties
Source: Argonaut (2019)

Cerro del Gallo Heap Leach Project NI 43-101 Technical Report
January 31, 2020 Page 24-1
24 Other Relevant Data and Information
24.1 Hydrology and Hydrogeology
The project is located within the Hydrological Region RH-12 “Lerma Santiago”, the RH-12 is made up of 6 Hydrological Sub-regions, and the project is part of the Hydrological Subregion of “La Laja.” The average monthly and annual precipitation, as well as their maximum and minimum values, are presented in Table 24.2.1.
Table 24.2.1 Cerro del Gallo Average Precipitation
Month Precipitation Average
More wet year Dryer Year
Jan 15.00 9.00 0.00
Feb 11.80 0.00 0.00
Mar 8.40 28.00 3.00
Apr 10.80 9.00 0.00
May 33.80 196.50 0.00
Jun 99.60 393.50 0.00
Jul 138.10 34.00 11.00
Aug 108.90 191.00 89.00
Sep 102.80 231.00 12.00
Oct 37.10 36.50 0.00
Nov 10.30 17.00 0.00
Dec 9.60 6.10 0.00
Anual 586.20 mm 1,151.60 mm 115.00 mm Source: Argonaut (2019)
In 2013, Primero, through SRK, requested the support of Cardona Benavides y Asociados S.C. to carry out exploration work to identify two or more sites for drilling wells. The regional structures that were identified in the study area of CdG and its immediate vicinity, included the fault system: i) NW-SE and ii) NE-SW. The conclusions of the study allowed the identification of a structure that controls the flow of groundwater in the study area. It trends NW-SE and is called “Graben de Dolores.” Based on the geological knowledge of the area of interest defined from the bibliographic analysis, geological and hydrogeological verification paths and geophysical exploration, from a qualitative point of view it is possible to propose that the following hydrogeological units exist for the analyzed area:

Cerro del Gallo Heap Leach Project NI 43-101 Technical Report
January 31, 2020 Page 24-2
1. Free aquifer composed of granular material (mainly sands); 2. Semiconfining aquifer composed of fine material (silt and clays mainly); 3. Semi-confined aquifer composed of granular material and/or fractured rock.
According to the objectives of the work plan, as well as the hydrogeological knowledge of the area, the groundwater yield potential is considered to be related to two main factors:
• Thickness of unconsolidated materials of good to high permeability; • Presence of areas with good fracture development in consolidated rocks.
The combination of these factors made it possible to identify the zones which, from the qualitative point of view, would offer the best conditions to capture groundwater. Information used for water table identification included hydrogeological, resistivity of geological materials at different depths, geological structures, and stream catchment areas. The results allowed to identify 3 zones with better possibilities for collecting groundwater, called NORTH, CENTER, and SOUTH. In 2014, Primero drilled a water well on the suggested target from the study and drilled the SAM # 1 well 450 meters deep with 12-inch steel casing and flow test of around 10 L/s. The water well location is 3.9 km from the proposed mine water tank location. Results for the well pump tests are presented in Table 24.2.2 and indicate stable flow of 10.8 L/s and 12.0 L/s for two separate tests conducted at 235 meters and 250 meters.

Cerro del Gallo Heap Leach Project NI 43-101 Technical Report
January 31, 2020 Page 24-3
Table 24.2.2 Cerro del Gallo Well (450-meter Depth) Pump Test Results
Well Pump Results to 235 m Depth
Stage
RPM
Consumption (L/s)
Pumping Level (m) A
Abatement (m) A
Specific Water Flow
(L/s/m)
Accrued Time (min)
Note
1 1200 6.2 153.35 41.73 0.15 252 (1) 2 1300 8.83 184.63 73.01 0.12 460 (1) 3 1400 15.08 (?) >
230.00 465 (2)
4 1350 10.81 219.24 107.62 0.10 620 (1) Nota (A) The pumping and abatement level data are already corrected with respect to the ground surface level. Note (1) Stage stabilized – complete. Nota (2) Stage not stabilized – not complete.
Stage RPM Consumption (L/s)
pH Temp (°C)
Electrical Conductivity
(μS/cm)
Observations
1 1200 6.2 7.1-7.3
27.8-32.9
514-476
Turbid water, no sand
2 1300 8.83 7.3-7.2
32.9-32.5
492-467
Turbid water, no sand
3 1400 ? 7.3-7.2
32.7-32.8
466-462
Clean water, no sand
4 1350 10.81 7.1-7.2
32.7-32.8
462 Clean water, no sand
Well Pump Results to 250 m Depth
Stage
RPM
Consumption (L/s)
Pumping Level (m) A
Abatement (m) A Specific
Water Flow (L/s/m)
Accrued
Time (min)
Note
1 1200 6.74 150.55 37.85 0.18 210 (1) 2 1300 8.45 172.25 59.55 0.14 225 (1) 3 1350 10.19 188.00 75.3 0.14 710 (1) 4 1500 21.93 233.05 120.35 0.18 5 (2) 5 1450 11.96 241.77 129.07 0.09 25 (2)
Nota (A) The pumping and abatement level data are already corrected with respect to the ground surface level. Note (1) Stage stabilized – complete. Nota (2) Stage not stabilized – not complete.
Source: Primero (2014)

Cerro del Gallo Heap Leach Project NI 43-101 Technical Report
January 31, 2020 Page 24-4
In 2015, Primero bought a parcel 7 km away from the footprint and within Zone South, this parcel has an existing water well with 204-meter depth and 12-inch casing and flow test of 16 L/s. Results for the well pump tests are presented in Table 24.2.3.
Table 24.2.3 Cerro del Gallo Well (204m Depth) Pump Test Results
Day Hour RPM Pump
Piezómeter In. M.
Consumption Lps
N.D. Abatement Orifice Observations
21 15:00 1500 5 17.00 130 10 5” Turbid water 21 16:00 1500 5 17.00 150 30 5” Turbid water 21 17:00 1500 0.32 14.19 151 31 5” Turbid water 21 18:00 1500 0.32 14.19 151 31 4” Turbid water 21 19:00 1500 0.32 14.19 151 31 4” Turbid water 21 20:00 1500 0.32 14.19 151 31 4” Turbid water 21 21:00 1500 0.32 13.03 151 31 4” Turbid water 21 22:00 1500 0.27 13.03 156 36 4” Turbid water 21 23:00 1500 0.27 13.03 156 36 4” Turbid water 22 00:00 1500 0.27 13.03 158 38 4” Turbid water 22 01:00 1500 0.27 13.03 158 38 4” Turbid water 22 02:00 1500 0.27 13.03 158 38 4” Turbid water 22 03:00 1600 5 17.00 168 48 5” Turbid water 22 04:00 1600 5 17.00 168 48 5” Turbid water 22 05:00 1600 5 17.00 168 48 5” Turbid water 22 06:00 1600 5 17.00 169 49 5” Turbid water 22 07:00 1600 5 17.00 169 49 5” Turbid water 22 08:00 1700 7 20.50 173 53 5” Less turbid
water 22 09:00 1700 7 20.50 185 65 5” Less turbid
water 22 10:00 1700 7 20.50 190 70 5” Clear water 22 11:00 Intermittent - - - - - 22 12:00 1500 0.41 16.06 190 70 4” Clear water 22 13:00 1500 0.41 16.06 190 70 4” Clear water 22 14:00 1500 0.41 16.06 190 70 4” Clear water 22 15:00 1500 0.41 16.06 190 70 4” Clear water
Source: Primero (2015) Argonaut has requested Investigación y Desarrollo de Acuíferos y Ambiente, S.A. DE C.V. (IDEAS), based in Hermosillo, Sonora, to review all the existing data and studies to define a third or even a fourth well with a single or combined capacity of about 25-30 L/s (additional water capacity required to meet project needs). The Technical Memo provided by IDEAS concluded that given the existing well flow capacities of 12 and 16 L/s, an additional 2 or 3 wells will be required to meet water flow needs. IDEAS recommended a detailed study using a type of magnetic resonance sounding imaging as a non-invasive geophysical method for groundwater investigation, which may yield more suitable locations for the water wells. The proposed test locations by IDEAS includes two separate zones with probe points every 500 meters, total of 73 points, as depicted in Figure 24.2.1.

Cerro del Gallo Heap Leach Project NI 43-101 Technical Report
January 31, 2020 Page 24-5
Figure 24.2.1 Cerro del Gallo IDEAS Proposed Test Water Well Locations
Source: IDEAS (2019)
24.2 Project Implementation
The project will be developed in a manner similar to most other heap leach projects. Initial design, including basic design and procurement of long lead time items such as the HPGR and crushers, will be conducted during the early stages. Detailed engineering and procurement will be followed by the construction phase. The project implementation will most likely start after permit authorizations. Argonaut has elected to manage development of this Project internally with assistance from external consultants. Typically, the detailed design phase of the project is separated into two parts: an initial basic and detailed engineering phase followed by final detailed engineering. The initial design phase of the project will include finalization of:
• P&ID’s; • Flow sheets;

Cerro del Gallo Heap Leach Project NI 43-101 Technical Report
January 31, 2020 Page 24-6
• General arrangement drawings; • Heap leach pad and pond earthworks; and • Control philosophy.
Specifications for long lead time equipment, a logistic study, finalization of site geotechnical work, detailed engineering for the leach pad and ponds, and detailed engineering for common infrastructure items will be completed early in this period. The heap leach facility and fresh water storage system earthworks will be designed to a level with sufficient detail to allow finalization of construction equipment requirements. Additionally, design of the power line will be completed in this period. Final detailed engineering work will progress in areas and disciplines in a similar sequence to the initial design phase. Typically, this will include: earthworks, plate work, structural, civil, mechanical, piping, electrical, and instrumentation. Earthworks represent a large portion of the work both during initial construction and during future construction. Emphasis will be placed on completion of the earthwork design to facilitate start of the earthworks. Final drawings for the various disciplines will be required. Some areas such as the crusher, process plant, the power generator package, and the stacking gear, will be packaged contracts. In these types of contracts, the vendor will supply detailed design and will also be responsible for a majority of the site work. Assuming no delays due to permitting or social issues, approximately 21 months from start of engineering to first gold pour is anticipated. A preliminary schedule to production for the project is shown in Figure 24.3.1.

Cerro del Gallo Heap Leach Project NI 43-101 Technical Report
January 31, 2020 Page 24-7
Figure 24.3.1 Cerro del Gallo Project Schedule to Production
Source: KCA (2019)

Cerro del Gallo Heap Leach Project NI 43-101 Technical Report
January 31, 2020 Page 24-8
24.3 Opportunities and Risks
There are opportunities and risks that have been identified in various areas of the project.
Mineral Resource Growth and Mineral Resource Conversion
Opportunities: • If additional land can be acquired, there is the potential to increase total reserves
as currently there are land constraints which limit the size of the heap leach and waste dump facilities.
Risks: • The leach pad, as proposed, is in close proximity to the planned pit. If the pit
limits are expanded toward the HLF as a result of subsequent mine planning, the volume capacity of the designed heap could fall below 92 Mt, requiring the development of a second HLF.
Metallurgy and Processing
Opportunities: • As designed, the leach pad lining system consists of a manufactured crushed
gravel overliner material placed above the geomembrane liner to promote solution flow into the gravity collection system. If the minimum permeability of the ore is at or above 1x10⁻¹ cm/sec, the ore may be used as overliner.
• The treatment rate of 6 Mt/yr used in the study results in a mine life approaching 16 years. There is an opportunity to expand the process rate at some time in the early years of the operation to enhance the project economics.
Risks: • Based on a limited geotechnical investigation, there is likely sufficient material
within the property limits to source adequate clayey low permeable soil liner bedding material needed to be placed beneath the geomembrane. However, this is based on visual observations and discussions with the site geologist. Golder did not complete an extensive investigation, including test pits or boreholes to estimate the quality or quantity of clayey materials. There are also two nearby clay mines providing clay for tile production that may be sources for some of the required liner bedding material. A geotechnical investigation to quantify the volume of clayey materials on/near site is scheduled for 2020. Golder has evaluated the design and a GCL is an acceptable replacement for soil liner bedding over the majority of the HLF. Procurement and transporting the GCL may increase the overall HLF PFS construction cost.

Cerro del Gallo Heap Leach Project NI 43-101 Technical Report
January 31, 2020 Page 24-9
• The HLF as designed is at its capacity within the CDG site. No additional capacity exists beyond the 92 Mt design, and an increase in leach feed will require purchasing additional property for the development of a second HLF.
• The WRD as designed is at its capacity within the CDG site. No additional capacity exists beyond the 54.4 Mt design, and an increase in waste rock mined will require purchasing additional property for the development of an additional waste storage capacity.
• Preliminary geochemical test results indicate that the mine waste may be acid generating and if this is confirmed and quantified with further testing, then additional design measures may need to be added to the WRD design, such as larger contact water ponds, and possibly a base liner.
• Sulfide in the heap leach facility could turn acidic due to the sulfide content. • Sodium cyanide starvation during initial leaching due to copper dissolution could
delay gold and silver production. • Potential need to lower the lift height from 8 m to 6 m due to possible cyanide
starvation, which would increase leach solution requirements. • Elevated levels of copper in the ore material may have a significant effect on
potential economic extraction if not managed properly. • Some gold may be present in the SART product due to poor washing. The value
received for any gold in the SART product may be lower than that received from the sale of doré.
• The level of penalty elements in the SART product may be higher than currently estimated which could lead to higher treatment costs.
• Agglomeration must be closely followed to maintain heap permeability; poor agglomeration techniques could lead to permeability issues and/or increased cement requirements.
• The SART plant will treat all of the pregnant leach solution. Potential gold losses from treating pregnant solution in SART are variable and it is difficult to predict the amount of loss from previous testwork.
• The cover system as designed for the HLF and WRD consists from top to bottom an approximate 0.2-meter thick layer of topsoil, 1.0-meter thick layer of cover, and a 0.6-meter thick layer of clay. Based on the existing geotechnical information at the site, there may be insufficient clayey material on site to supply the clay portion of the system.

Cerro del Gallo Heap Leach Project NI 43-101 Technical Report
January 31, 2020 Page 24-10
Mining
Opportunities: • The oxidized portion of the deposit near the surface is substantially fractured.
This may result in lower than expected drilling and blasting costs in that portion of the deposit, though blast hole drilling will be required for ore control purposes.
• A switch to owner-operated mining could reduce LOM mining costs. Risks:
• The steep terrain for mining in the upper benches may prove challenging for initial mining. This may delay some ore supply and increase development costs if not properly managed.
• Weather delays have not been included in the production estimate, and heavy rains may cause some delays with mining operations. Low spots on active benches should be maintained that can be used as sumps in case major rain events occur. Waste material inside the pit may be sought for use as gravel for haulage roads to help maintain traction during such events.
Water Supply
Risks: • Although the Owner has sufficient water rights, only two wells have been tested
and there is not sufficient water produced from these wells for the planned operation. Additional wells are required and a plan for the location and quantity of the wells needed is to be completed.
Power Supply
Opportunities: • The current plan is to use generated power for the first year of operation,
switching to line power in year two. If the supply of line power can be completed earlier, then there is the potential for savings in operating costs.
Risks: • If the supply of line power is delayed, then the overall operating costs could
increase due to extended site generation of power for the project.
Cerro del Gallo Heap Leach Project NI 43-101 Technical Report
January 31, 2020 Page 24-11
24.4 Cautionary Statements
Forward Looking Information
This document contains “forward-looking information” as defined in applicable securities laws. Forward looking information includes, but is not limited to, statements with respect to the PFS, including but not limited to future production, costs and expenses of the Project; estimates of Mineral Reserves and Mineral Resources; commodity prices and exchange rates; mine production plans; projected mining and process recovery rates; mining dilution assumptions; sustaining costs and operating costs; interpretations and assumptions regarding joint venture and potential contract terms; closure costs and requirements; government regulations and permitting timelines; requirements for additional capital; environmental, permitting and social risks; and general business and economic conditions. Often, but not always, forward-looking information can be identified by the use of words such as “plans”, “expects”, “is expected”, “budget”, “scheduled”, “estimates”, “continues”, “forecasts”, “projects”, “predicts”, “intends”, “anticipates” or “believes”, or variations of, or the negatives of, such words and phrases, or statements that certain actions, events or results “may”, “could”, “would”, “should”, “might” or “will” be taken, occur or be achieved. Forward-looking information is based on a number of assumptions which may prove to be incorrect, including, but not limited to, the availability of financing for production, development and exploration activities; the timelines for exploration and development activities on the Project; the availability of certain consumables and services; assumptions made in mineral resource and mineral reserve estimates, including geological interpretation grade, recovery rates, price assumption, and operational costs; and general business and economic conditions. Forward-looking information involves known and unknown risks, uncertainties and other factors which may cause the actual results, performance or achievements to be materially different from any of the future results, performance or achievements expressed or implied by the forward-looking information. These risks, uncertainties and other factors include, but are not limited to, the assumptions underlying the production estimates not being realized, changes to the cost of production, variations in quantity of mineralized material, grade or recovery rates, geotechnical or hydrogeological considerations during mining differing from what has been assumed, failure of plant, equipment or processes, changes to availability of power or the power rates used in the cost estimates, changes to salvage values, ability to maintain social license, changes to interest or tax rates, decrease of future gold prices, cost of labor, supplies, fuel and equipment rising, the availability of financing on attractive terms, actual results of current exploration, changes in project parameters, exchange rate fluctuations, delays and costs inherent to consulting and accommodating rights of local communities, environmental risks, reclamation expenses, title risks,
Cerro del Gallo Heap Leach Project NI 43-101 Technical Report
January 31, 2020 Page 24-12
regulatory risks and uncertainties with respect to obtaining necessary permits or delays in obtaining same, and other risks involved in the gold production, development and exploration industry, as well as those risk factors discussed in Argonaut’s latest Annual Information Form and its other SEDAR filings from time to time. All forward-looking information herein is qualified by this cautionary statement. Accordingly, readers should not place undue reliance on forward-looking information. Argonaut and the authors of this Technical Report undertake no obligation to update publicly or otherwise revise any forward-looking information whether as a result of new information or future events or otherwise, except as may be required by applicable law.
Non-IFRS Measures
Argonaut has included certain non-International Financial Reporting Standards (IFRS) performance measures as detailed below. In the gold mining industry, these are common performance measures but may not be comparable to similar measures presented by other issuers and the non-IFRS measures do not have any standardized meaning. Accordingly, it is intended to provide additional information and should not be considered in isolation or as a substitute for measures of performance prepared in accordance with IFRS. Cash Costs per Ounce – Argonaut calculated cash costs per ounce by dividing the sum of operating costs, royalty costs, production taxes, refining and shipping costs, net of by-product silver credits, by payable gold ounces. While there is no standardized meaning of the measure across the industry, Argonaut believes that this measure will be useful to external users in assessing operating performance. All-In Sustaining Costs (“AISC”) – Argonaut has disclosed an AISC performance measure that reflects all of the expenditures that are required to produce an ounce of gold from operations. While there is no standardized meaning of the measure across the industry, Argonaut’s definition conforms to the all-in sustaining cost definition as set out by the World Gold Council in its guidance dated 27 June 2013. Argonaut believes that this measure will be useful to external users in assessing operating performance and the ability to generate free cash flow from current operations.
Cerro del Gallo Heap Leach Project NI 43-101 Technical Report
January 31, 2020 Page 25-1
25 Interpretations and Conclusions
The work that has been completed to date has demonstrated that the CdG open pit mine and heap leach is a technically feasible and economically viable project. It is the conclusion of the QP’s that the work completed in preparation of this technical report included adequate detail and information to declare Mineral Reserves. Standard industry practices, equipment and design methods were used in the PFS. This report concludes:
• The base case for the Project has been developed with sufficient detail to underpin a decision to continue to move the Project through subsequent stages of development.
• The production schedule targeted a consistent total mine tonnage of
approximately six million tonnes per year after the first year. The first year is approximately four and a half million tonnes. At this rate the expected mine life will be about 15.5 years.
• Pit reserves are divided into four different materials for processing: oxide, mixed
oxide, mixed sulfide and sulfide.
• The mine life and total tonnes processed are limited by land constraints for the heap leach and waste dump facilities.
• For the four material types, results of the metallurgical testing show gold recoveries in the range of 58% to 74%, silver recoveries range from 40% to 79%, and copper recoveries range from 22% to 59%.
• Tertiary crushing with two stages of conventional crushing and one stage of HPGR crushing are used to produce the final crush size of 80% passing 4 to 6 mm.
• Based on the production schedule and field adjusted recovery for the four material types, the average projected gold, silver and copper recoveries are 60%, 52% and 43%, respectively.

Cerro del Gallo Heap Leach Project NI 43-101 Technical Report
January 31, 2020 Page 25-2
• Copper and silver will be recovered in a SART plant by sulfide precipitation; gold and some silver will be recovered by conventional carbon adsorption.
• During operations, control of cyanide levels and careful monitoring of copper in pregnant and barren leach solutions will be required to minimize cyanide consumption and maximize gold and silver recoveries.
• Cement for agglomeration constitutes a significant portion of the operating costs. Careful monitoring of heap permeability and ongoing test programs at site will be required.
• The CdG Project requires supplies and infrastructure items such as administration buildings, laboratory, warehouse, roads, powerline and MCC, water wells and water line, reagent storage, a complete service truck shop; and dining area.
• The economic analysis indicates that the profitability of the potential operation will be driven by gold price, operating costs and capital costs. Given the lower grade nature of the deposit and the strip ratio, well over half of the revenues are consumed by the operating costs. Therefore, a focus on controlling costs will be important in maintaining robust project economics.
• The PFS design of the HLF consists of a geomembrane lined pad and process ponds and is intended to operate as a zero-discharge system to groundwater and surface water. The HLF is designed with a geomembrane lined satellite pond that is available to store solution, if necessary, during the 1 in 100 wet year climate as described in Section 17.2.3.
• The HLF provides suitable capacity to store and leach the 92 Mt of ore identified through this study. The HLF is designed to North American standards used for the design of these facilities, as described in Section 17. The ultimate HLF configuration meets the minimum factors of safety contained in Section 17.2.4 with respect to geotechnical stability. The HLF has been designed to withstand a reasonably foreseeable earthquake.
• For the planned HLF design, the 92 Mt of ore storage capacity requires a maximum heap height of 80 meters. The heap leach pad, as designed, is at its limit with respect to storage capacity for the proposed site, constrained by surrounding topography and the planned location of the proposed pit and the WRD.

Cerro del Gallo Heap Leach Project NI 43-101 Technical Report
January 31, 2020 Page 25-3
• The PFS design of the WRD provides suitable capacity to store the 54.4 Mt of waste rock. The remaining 3.4 Mt of waste rock identified in this study is planned for use as structural fills for construction of the HLF. The ultimate WRD configuration meets the minimum factors of safety contained in Section 16.2 with respect to geotechnical stability
• For the planned WRD design, the 55 Mt of waste rock storage capacity requires
a maximum waste rock dump height of 100 meters. The WRD, as conceptually designed, is at its limit with respect to storage capacity for the proposed site, constrained by the property boundary to the north and east, the pit to the west, and the HLF to the south.
• The WRD, as designed, is assumed to be progressively reclaimed during operations to reduce the amount of contact water that may need to be managed during operations. The HLF as designed is assumed to be rinsed in order to remove unwanted constituents from the ore, which may include metals and cyanide prior to receiving the closure cover.
Cerro del Gallo Heap Leach Project NI 43-101 Technical Report
January 31, 2020 Page 26-1
26 Recommendations
Based on discussions with Argonaut's technical staff and the Qualified Persons responsible for this Technical Report, the following recommendations have been made to advance the CdG Project:
26.1 KCA Recommendations
• A feasibility study should be conducted if the Owner wants to reduce the outlined risks and increase the accuracies of the cost estimates. This study cost would be approximately US$750,000.
• Conduct additional SART tests to optimize reagent requirements and better define elements associated with the final product. The cost would be approximately US$100,000.
• The hydrogeologic consultant, IDEAS, recommends a detailed groundwater investigation to determine suitable locations for additional water wells. The current water well supply is not adequate to meet the projected water requirements for the project. The cost would be approximately US$25,000.
26.2 Argonaut Recommendations
Assay Database • Review 2013 Ag and Cu assays done by the 0.5g ICP method vs the 5g AA
method / 3 acid digestion (SGS AAS21E). Statistically compare the two methods by re-assaying some of the pulps using both methods. (This work is in progress.)
Drill Hole Database • Audit the remaining 75% of down-hole survey data. Cost approximately
US$5,000. Drilling
• Infill drill the NNE part of the deposit, in an around the peak of the hill. This cost is estimated to be US$80,000.
• Select an area of perceived higher-grade variance and reduce the drill spacing to 25 x 25m or less to assess the short scale variance. Recommend this area to be within the years 1 – 2 pit plan as an aid to mine planning and ore control

Cerro del Gallo Heap Leach Project NI 43-101 Technical Report
January 31, 2020 Page 26-2
reconciliation. This is estimated to be 2,000 to 3,000 m of RC drilling or approximately US$250,000.
Density
• Collect approximately one hundred more density measurements in the oxide profile. This program would cost approximately US$25,000.
Modeling
• The oxide domains, intrusive lithology and grade models generated in Leapfrog are overly complex given the nominal 50 x 50m drill-hole spacing. These need to be smoothed. This would cost less than US$5,000.
• Develop the structural planes into domains and assess the validity of the implied
fault displacements using geostatistics. This would cost roughly US$5,000 to $10,000.
• The surface topography should be extended, particularly to the east and NE
where higher silver grades are not currently being captured in the reporting. This could be done in-house for less than US$5,000.
• Model statistics could be further upgraded by: (1) further assess the multi-variate
statistics to better understand the relationship between the three potential economic metals; (2) complete further assessment of the level of grade smoothing in the estimate. This would likely cost less than US$5,000.
• Silver model: silver has been estimated with the same radial framework as Au and Cu, though it is known that there is a secondary late stage silver event. Further assessment is warranted of whether the current estimation framework is optimal. The initial review of this would cost about US$2,500.
26.3 Golder Recommendations
• Perform a detailed geotechnical characterization of the available clays within the property limits of the CDG mine to evaluate if there are sufficient clayey materials on site to be used as the low permeable soil liner bedding beneath the leach pad and ponds geomembrane liner. If future investigations identify an insufficient volume of clayey materials on site (liner bedding), then a geosynthetic clay liner (GCL) may be substituted over a majority of the leach pad. The use of a GCL instead of a locally sourced clayey soil material will likely increase the HLF’s construction cost. If the HLF PFS construction cost estimate is based on the use of soil liner bedding, then Golder recommends adding a 30% contingency to the

Cerro del Gallo Heap Leach Project NI 43-101 Technical Report
January 31, 2020 Page 26-3
HLF cost. If Argonaut elects to base the HLF PFS cost on the use of a GCL instead of soil liner, then Golder recommends reducing the contingency to 25%. The cost would be approximately US$70,000.
• The close proximity of the proposed HLF to the proposed pit may pose a stability
risk of the pit walls to the Phase 3 heap leach pad expansion as it is currently proposed. Further stability analyses will be needed to determine if the risk is acceptable or if further stabilization efforts will be needed. The cost would be approximately US$15,000.
• If the geochemical investigation identified ARD (acid rock drainage) as a potential issue, then Golder recommends performing in-situ infiltration testing throughout the WRD foundation to characterize the permeability of the foundation soils. The foundation soils permeabilities are necessary to characterize the amount of acid waste rock drainage that would infiltrate into the foundation soils and subsequently, the underlying aquifer. Based on this quantity of infiltration, alternative design measures may be necessary. The cost would be approximately US$50,000.
• A meteorological station should be constructed at the leach pad site to gather sufficient data to compare with the data from the weather station used for the water balance. The weather data will be used to better refine the predictions of the HLF process fluid water balance. More accurate precipitation and evaporation data for the site will provide a higher confidence in estimating process fluid consumption and pond storage capacities. This comparison is necessary to confirm the climate variables used for the study. A Class A pan and shielded weather station is recommended on site and recorded in time steps of days if possible. The cost would be approximately US$25,000.
• The 2014 PH Consultores climate study was based on 49 years of data between 1964 and 2012. This study should be updated with 7 subsequent years of additional climate data to provide a higher confidence of extreme and average climate years used in the water balance model. The cost would be approximately US$10,000.
• To facilitate feasibility and detailed design of the HLF and WRD, additional geotechnical field investigation and laboratory testing programs are recommended. Subsurface conditions should be characterized in sufficient detail to provide a high level of confidence in the stratigraphy, ground water, structure, and preferential paths of flow in the upper 30 meters of the subsurface and

Cerro del Gallo Heap Leach Project NI 43-101 Technical Report
January 31, 2020 Page 26-4
summarized in a feasibility study level geotechnical report. This can be accomplished through the advancement of geotechnical boreholes located within the footprint of the facility. The depth and quantity of boreholes will depend on the final design of the facilities. Additionally, a shallow subsurface investigation should be performed to characterize the near surface soil conditions across the entire site to better delineate vegetative root mass and depth, stripping depth of topsoil and weak soils, near surface bedrock, and mass grading requirements. This can be performed using a track-mounted excavator or by hand-excavation of exploratory test pits. The cost would be approximately US$150,000.
• Further consideration should be given to evaluating the hydrogeologic conditions that exist at the HLF and WRD sites. Golder proposes to install ground water monitoring wells through installation of slotted PVC well casings in future geotechnical boreholes. Additionally, a comprehensive ground water spring study is recommended to better delineate and quantify year-round or seasonal spring flows below the proposed HLF and WRD sites. This study will assist is adequately sizing underdrain collection piping installed below each facility’s foundation. The cost would be approximately US$140,000.
• Monitoring of existing stream flows should be considered to measure sediment transportation in existing streams. This will provide valuable input for designing sediment control structures downstream of proposed improvements. The cost would be approximately US$10,000.
• For feasibility study level planning, a feasible, yet proactive reclamation plan should be developed for the HLF and WRD. This plan will consist of a closure cover design, quantities necessary for closure, permanent stormwater facilities design, and monitoring requirements. Sediment and erosion control and storm water management will be challenging throughout operations. To reduce potential sediment transportation and erosion of operational slopes, Golder recommends implementing a concurrent reclamation plan to actively reclaim completed HLF and WRD slopes during operation. This will include re-sloping, placement of cover soil, placement of a low permeable soil liner, placement of topsoil, and revegetation. In addition to reducing sediment and erosion management efforts, placement of a low permeable cover over the HLF and WRD during operation will reduce the risk of excess solution to manage during rinsing. The cost would be approximately US$150,000.
Cerro del Gallo Heap Leach Project NI 43-101 Technical Report
January 31, 2020 Page 26-5
• Conduct additional static and kinetic acid base accounting tests to better define the rate of the contained sulfides in both the ore and waste to turn acidic. The test program would cost approximately US$30,000.

Cerro del Gallo Heap Leach Project NI 43-101 Technical Report
January 31, 2020 Page 27-1
27 References
ALS Ammtec, 2012, Metallurgical Testwork, Report No. A13846, Metallurgical Testwork conducted upon Gold Ore HPGR Feed Samples from Cerro del Gallo Project, March 2012, prepared for Kings Minerals NL/Sedgman ALS Ammtec, 2011, Heap Leach Amenability Testwork, Report No. A13259, Heap Leach Amenability Test work conducted upon Composites of Gold Ore Samples from Cerro Dal Gallo Gold/Silver Project, October 2011, prepared for King Minerals NL Campa, M.F., and Coney, P.J., 1983. Tectono-stratigraphic terranes and mineral resource distributions in Mexico, Canadian Journal of Earth Sciences, 1983, 20(6): 1040-1051 Champion, D., 2005. Prospects look good in North Queensland. AusGeo News September 2005, 79: pp3-6 Consejo de Recursos Minerales, 1992. Monografía geológico-minera del estado de Guanajuato. Secretaria de Energía, Minas E Industria Paraestatal 35, pp55-57 Dickinson and Lawton, 2001. Carboniferous to Cretaceous assembly and fragmentation of Mexico: Geological Society of America Bulletin, v. 113, p. 1142-1160 Golder, 2019. Pre-Feasibility Design Report: Heap Leach and Waste Rock Dump Facilities, Cerro del Gallo Project. Prepared for Argonaut Gold, Inc. by Golder Associates Inc. Dated December 2019. Groves, I., 2008. San Antón Project, Cerro del Gallo Cu-Au-Ag Deposit, Guanajuato State, Mexico. Unpublished report by Insight Geology Pty Ltd for San Antón de las Minas S.A. de C.V., January 2008 Hart, C.J.R., 2005. Classifying, distinguishing and exploring for intrusion-related gold systems. The Gangue 87:pp1-9 Independent Metallurgical Laboratories PTY LTD, 2006. Cerro del Gallo Testwork Program (SA002, SA007, SA010 & SA011), April 2006, prepared for Kings Minerals NL
Cerro del Gallo Heap Leach Project NI 43-101 Technical Report
January 31, 2020 Page 27-2
Independent Metallurgical Laboratories PTY LTD, 2006. Cerro del Gallo Testwork Program (SA057, SA058, SA061, SA062, SA071 & SA078), April 2006, prepared for Kings Minerals NL Kappes, Cassiday & Associates, Pending. Cerro del Gallo Project, HPGR Crushed Bottle Roll Leach Test Work, Report of Metallurgical Test Work. Report ID KCA0190035_CDG02_01 prepared for San Antón de Las Minas S.A. de C.V. Kappes, Cassiday & Associates, 2019. Cerro del Gallo Project, Locked Cycle HPGR and Conventional Crushing Test Work, Report of Metallurgical Test Work. July 2019. Report ID KCA0180034_CDG01_01 prepared for San Antón de Las Minas S.A. de C.V. Lapierre et. Al., 1992. A crustal section of an intra-oceanic island arc: The late Jurassic-early Cretaceous Guanajuato magmatic sequence, central Mexico: Earth and Planetary Sciences Letters, v. 108, p. 61-77, doi: 10.1016/0012-821X(92)90060-9 Mason, D.R., 2005a. Petrographic descriptions for eleven rock samples from the San Antón Project, Mexico. March 2005. Unpublished report no. 3064 by Mason Geoscience Pty Ltd for KMN NL Mason, D.R., 2005b. Petrographic descriptions for rock samples from Cerro del Gallo porphyry system (San Antón), and from Valenciana, central Mexico. August 2005. Unpublished report no. 3104 by Mason Geoscience Pty Ltd for KMN NL. Mason, D.R., 2006a. Petrographic descriptions and interpretation for four drill chip skarn rock samples from the Cerro del Gallo porphyry system (Mexico). January 2006. Unpublished report no. 3149 by Mason Geoscience Pty Ltd for KMN NL Mason, D.R., 2006b. Petrographic study of 12 drill core rock samples from the Cerro del Gallo gold prospect, Mexico. June 2006. Unpublished report no. 3196 by Mason Geoscience Pty Ltd for KMN NL Mason, D.R., 2007. Petrographic study of ten drill core rock samples from Cerro del Gallo porphyry system (San Antón). Unpublished report by Mason Geoscience Pty Ltd for KMN NL Mine Development Associates, 2012 Feasibility Mine Study Update, Cerro del Gallo, Guanajuato, Mexico. June 2012, prepared for Cerro Resources NL

Cerro del Gallo Heap Leach Project NI 43-101 Technical Report
January 31, 2020 Page 27-3
Perez, Efrain, 2018. Estudio petrograficas y minerografico Cerro del Gallo, Guanajuato, Mexico. Unpublished report by Dr. Efrain Perez Segura prepared for Argonaut Gold Co. PH Consultores Ambientales S de RL (PHCA). 2014. “Caracterización Climatológica Del Sitio Del Proyecto Minero Cerro Del Gallo”. April 27, 2014 Revision. Randall, J.A., Saldana, E.A., and Clark, K.F., 1994. Exploration in a volcano-plutonic center at Guanajuato, Mexico. Economic Geology. v.89, pp1722-1751 Rowins, S.M., 2000b. Preliminary results of a geochemical investigation of porphyry Cu-Au-Mo (Ag-Pb-Zn) and epithermal Ag-Au mineralization at the San Antón deposit, Guanajuato Mexico. Unpublished report to Luismin S.A. de C.V. August 2000. Rowins, S.M., 2000c. A model for the genesis of “reduced” porphyry copper-gold deposits. The Gangue: October 2000: Issue 67, 1-7 Sanford Information Systems August 2019. Unpublished internal report on the Cerro del Gallo database audit prepared for Argonaut Gold Co. Sedgman, 2012, Technical Report, First Stage Heap Leach Feasibility Study, Cerro del Gallo Gold Silver Project, Guanajuato, Mexico, June 2012 Sedgman, 2012, Definitive Feasibility Phase Report, Cerro del Gallo Gold Silver Project, May 2012, prepared for Cerro Resources NL SGS, 2015, An Investigation into the Recovery of Gold from the Cerro del Gallo Deposit, April 2015, prepared for Primero Mining SGS, 2013, Cerro del Gallo Testwork Job No: 0168BH, July 2013, prepared for Argonaut Gold Inc. SGS, 2011, High Pressure Grinding Rolls Testwork for Cerro Resources Cerro del Gallo Project, Job No: 10817, September 2011, prepared for Cerro Resources SGS, 2011, Heap Leaching Testwork on Cerro de Gallo Oxide Gold Ore Samples – Comparison of Crushing Techniques, Job No: 10652, May 2011, prepared for Kings Minerals NL SGS, 2009, Column Leach Testwork on Cerro del Gallo Composite SA-276, Job No: 10494, December 2009, prepared for Kings Minerals NL

Cerro del Gallo Heap Leach Project NI 43-101 Technical Report
January 31, 2020 Page 27-4
SGS, 2009, Cerro del Gallo Heap Leach Amenability Testwork, Job No: 10467, September 2009, prepared for Kings Minerals NL Tardy et. Al., 1994. The Guerrero Suspect Terrane (Western Mexico) and coeval arc terranes (the Greater Antilles and the Western Cordillera of Colombia) – a Late Mesozoic intraoceanic arc accreted to cratonal America during the Cretaceous: Tectonophysics, v. 230, p. 49-73 Technical Report, 2015, Cerro del Gallo Metallurgical Testwork 2014, BBA document no. 3221002-000000-40-ERA-001/R00. April 2015, prepared for Primero Mining Technical Report, 2012, First Stage Heap Leach Feasibility Study, Cerro del Gallo Gold Silver Project, Guanajuato, Mexico. June 2012, prepared for Cerro Resources NL Technical Report, 2011, Feasibility Study and Preliminary Assessment, Cerro del Gallo Project, Guanajuato, Mexico, May 2011, prepared for Cerro Resources NL Technical Report, 2010, Preliminary Assessment, Cerro del Gallo Project, Guanajuato, Mexico. April 2010, prepared for San Antón Resource Corporation Technical Report, 2008, Cerro del Gallo deposit within the San Antón Property Mexico, Prepared by San Antón Resource Corporation Inc. Ottawa, Canada 2008 The Mines Group, 2019, Cerro del Gallo Pit Slope Stability Review, Memorandum. September 2019, prepared for Argonaut Gold The Mines Group, 2011, Feasibility Level Pit Slope Stability Study, Cerro del Gallo Project, Guanajuato, Mexico. January 2011, prepared for San Antón Resources Thompson et. Al. 1999 Sanford Information Systems (“SIS”) to carry out a database audit during July of 2019 Townend, R., 2006. Screening, TBE separations of four composite samples, Optical/SEM examination of four polished sections and XRD of gangue. Unpublished report by Roger Townend and Associates, Consulting Mineralogists

Cerro del Gallo Heap Leach Project NI 43-101 Technical Report
January 31, 2020 Page 28-1
28 Date and Signature Page
This report, entitled Pre-Feasibility Study NI43-101 Technical Report Cerro del Gallo Heap Leach Project Guanajuato, Mexico has the following report dates: Report Date is: 31 January 2020 Mineral Resource Effective Date is: 24 October 2019 Mineral Reserve Effective Date is: 24 October 2019 The report was prepared as per the following signed Qualified Persons’ Certificates.

CERTIFICATE OF QUALIFIED PERSON
I, Carl E. Defilippi, RM SME, of Reno, Nevada, USA, Sr. Project Engineer at Kappes, Cassiday & Associates, as an author of this report entitled “Pre-Feasibility Study NI43-101 Technical Report Cerro del Gallo Heap Leach Project Guanajuato, Mexico”, dated 31 January 2020, prepared for Argonaut Gold, Inc. (the “Issuer”) do hereby certify that:
1. I am employed as a Sr. Project Engineer at Kappes, Cassiday & Associates, an independent metallurgical consulting firm, whose address is 7950 Security Circle, Reno, Nevada 89506.
2. This certificate applies to the technical report “Pre-Feasibility Study NI43-101 Technical Report Cerro del Gallo Heap Leach Project Guanajuato, Mexico”, dated 31 January 2020 (the “Technical Report”).
3. I am a Registered Member with the Society of Mining, Metallurgy and Exploration (SME) since 2011 and my qualifications include experience applicable to the subject matter of the Technical Report. In particular, I am a graduate of the University of Nevada with a B.S. in Chemical Engineering (1978) and a M.S. in Metallurgical Engineer (1981). I have practiced my profession continuously since 1982. Most of my professional practice has focused on the development of gold-silver leaching projects. I have successfully managed numerous studies at all levels on various cyanidation projects.
4. I am familiar with National Instrument 43-101 – Standards of Disclosure for Mineral Projects (“NI 43-101”) and by reason of education, experience and professional registration I fulfill the requirements of a “qualified person” as defined in NI 43-101.
5. I visited the Cerro del Gallo property for one day on 4 September 2019.
6. I am responsible for Sections 1.1, 1.6, 1.10, 1.11, 1.12, 1.13, 1.14, 1.15, 1.16, 1.17, 2, 3, 12.5, 13, 17 except for 17.2.3 through 17.2.5, 18, 19, 20, 21 except for 21.2.1 and 21.3.1, 22, 24.1, 24.2, 24.3.2, 24.3.4, 24.3.5, 24.4, 25, 26.1, 27 and 28 of the Technical Report.
7. I am independent of the Issuer as described in section 1.5 of NI 43-101.
8. I have had no prior involvement with the property that is the subject of the Technical Report.
9. I have read NI 43-101 and the Technical Report has been prepared in compliance with NI 43-101.
10. As of the effective date of the Technical Report, to the best of my knowledge, information and belief, the Technical Report contains all scientific and technical information that is required to be disclosed to make the Technical Report not misleading.
Dated this 31st day of January, 2020
“Carl E. Defilippi” Carl E. Defilippi, RM SME #775870 Sr. Project Engineer at Kappes, Cassiday & Associates

CERTIFICATE OF AUTHOR
Thomas Dyer, P. E.
MINE DEVELOPMENT ASSOCIATES – A Division of RESPEC Mine Engineering Services 210 South Rock Blvd. Reno, NV 89502 Ph +1-775-856-5700 Email: [email protected]
I, Thomas Dyer, P. E., do hereby certify that I am currently employed as Senior Engineer by Mine Development Associates, Inc., 210 South Rock Blvd., Reno, Nevada 89502 and:
1. I graduated with a Bachelor of Science degree in Mine Engineering from South Dakota School of Mines & Technology in 1996. I have worked as a Mining Engineer for 24 years since graduation.
2. I am registered as a Professional Engineer – Mining in the State of Nevada (# 15729). I am also a Registered Member of SME (# 4029995RM) in good standing.
3. I have read the definition of “qualified person” set out in National Instrument 43-101 (“NI 43- 101”) and certify that by reason of my education, affiliation with a professional association (as defined in NI 43-101) and past relevant work experience, I fulfil the requirements to be a “qualified person” for the purposes of NI 43-101. I am independent of Cerro Resources NL and all their subsidiaries as defined in Section 1.4 of NI 43-101 and in Section 3.5 of the Companion Policy to NI 43-101.
4. I am responsible for the preparation of sections 1.8, 1.9, 15 and 16 except 16.2, 21.2.1, 21.3.1 and 24.3.3 of this report titled “Pre-Feasibility Study NI43-101 Technical Report Cerro del Gallo Heap Leach Project Guanajuato, Mexico” and dated January 31st, 2020 (the “Technical Report”) relating to the Cerro del Gallo property.
5. I was previously involved with this project when I completed the Reserve and Mining Sections of the report entitled “Technical Report Feasibility Study & Preliminary Assessment Cerro del Gallo Project Guanajuato, Mexico” dated May 26th, 2011. I visited the Cerro del Gallo site during June, 2010.
6. To the best of my knowledge, information and belief, those sections for which I am responsible contain all the scientific and technical information that is required to be disclosed to make this technical report not misleading.
7. I have read National Instrument 43-101 and Form 43-101F1, and the Technical Report has been prepared in compliance with that instrument and form.
8. I consent to the filing of the Technical Report with any securities regulatory authority, stock exchange and other regulatory authority and any publication by them, including electronic publication in the public company files on their websites accessible by the public.
Dated this 31st day of January 2020.
Signed: Thomas Dyer
Thomas Dyer, P.E.
Print Name of Qualified Person


CERTIFICATE OF QUALIFIED PERSON I, Brian W Arkell, MSc, as an author of this report entitled “Pre-Feasibility Study NI43-101 Technical Report Cerro del Gallo Heap Leach Project Guanajuato, Mexico”, dated 31 January 2020 (the “Technical Report”), prepared for Argonaut Gold, Inc. (the “Issuer”) do hereby certify that:
1. I am a Senior Geologist and Vice President for Argonaut Gold Corporation.
2. I reside at 900 South Meadows Pkwy, #4323, Reno, NV, 89521 USA.
3. I graduated with a Master of Science degree in Economic Geology from New Mexico Institute of Mining & Technology in 1984, and a Bachelor of Science degree from the University of Maryland in 1979.
4. I am a Registered Member of the Society for Mining, Metallurgy, & Exploration, Member Number 04035051.
5. I am a Fellow of the Australian Institute of Mining & Metallurgy, Membership Number 225018.
6. I am a Fellow of the Society of Economic Geologists, Member Number 31764.
7. I have worked for over 30 years as a geologist in mining and exploration, worldwide for Newmont Mining Co, Argonaut Gold, Noranda Exploration, Rio Novo, Kerr-McGee, and NM Bureau of Mines.
8. I have not received, nor do I expect to receive, any interest, directly or indirectly in the Cerro del Gallo property.
9. I have read the National Instrument 43-101 and Form 43-101F1 and by reason of my education and past experience, I fulfil the requirements of a “Qualified Person” for the purposes of National Instrument 43-101 (“NI 43-101”).
10. I am responsible for preparation of Sections 1.2, 1.3, 1.4, 1.5, 4, 5, 6.1, 7, 8, 9, 10, 11, 12.1, 12.2, 12.3, 23, and 26.2 of the Technical Report.
11. I have visited the property on numerous occasions between January 2018 and November 2019.
12. I have previously been involved in assessing mineral properties and mineral resources and authoring reports to this affect.
13. As of the date of this certificate, to the best of my knowledge, information and belief, this Technical Update contains all scientific and technical information that is required to be disclosed to make the report accurate and not misleading.
Dated this 31st day of January, 2020
Brian W. Arkell, MSc

CERTIFICATE OF QUALIFIED PERSON
I, Nebojsa Zurkic B.App.Sc MSc. MAIG. MAusIMM, as an author of this report entitled “Pre-Feasibility Study NI43-101 Technical Report Cerro del Gallo Heap Leach Project Guanajuato, Mexico,” dated 31 January 2020, prepared for Argonaut Gold, Inc. (the “Issuer”) do hereby certify that:
1. I am a Principle Consultant for Zurkic Mining Consultants Pty Ltd., 2 Dendy Crt, Roxburgh Park, Victoria, Australia.
2. This certificate applies to the technical report "Pre-Feasibility Study NI43-101 Technical Report Cerro del Gallo Heap Leach Project Guanajuato, Mexico", dated 31 January 2020 (the "Technical Report").
3. I am a Member of the Australian Institute of Geoscientists and the Australasian Institute of Mining
and Metallurgy. As a result of my experience (19 years in porphyry copper-gold resource evaluation and mining, including Batu Hijua and Elang in Indonesia) and academic qualifications (B.App.Sc. and MSc.), am a Qualified Person as defined in National Instrument 43-101 (“NI 43-101”).
4. My most recent visit to the Cerro del Gallo Project was between 11 – 13 July, 2018. 5. I am responsible for the resource estimate and Sections 1.7, 14 and 24.3.1 of the Technical Report. 6. I am independent of Argonaut Gold and all its affiliates, in accordance with the application of Section
1.5 of National Instrument 43-101. 7. I have read National Instrument 43-101 and Form 43-101F1 and this report has been prepared in
compliance with same. 8. As of the effective date of this report, to the best of my knowledge, information and belief, the
technical report contains all scientific and technical information that is required to be disclosed to make the technical report not misleading.
Dated this 31st day of January, 2020
Nebojsa Zurkic B.App.Sc MSc. MAIG. MAusIMM Principle Consultant for Zurkic Mining Consultants Pty Ltd.