Embed Size (px)
Citation preview
RESEARCH ARTICLE
Pre-Holocene Origin for the Coronopusnavasii Disjunction: ConservationImplications from Its Long IsolationSara Martín-Hernanz1*, Alejandro G. Fernández de Castro2, Juan Carlos Moreno-Saiz1,Virginia Valcárcel1
1 Department of Biology (Botany), Universidad Autónoma de Madrid, Madrid, Spain, 2 Department ofBiodiversity and Conservation, Real Jardín Botánico, CSIC, Madrid, Spain
AbstractIntegration of unexpected discoveries about charismatic species can disrupt their well-
established recovery plans, particularly when this requires coordinate actions among the
different governments responsible. The Critically EndangeredCoronopus navasii (Brassica-ceae) was considered a restricted endemism to a few Mediterranean temporary ponds in a
high mountain range of Southeast Spain, until a new group of populations were discovered
500 km North in 2006. Ten years after this finding, its management has not been accommo-
dated due to limited information of the new populations and administrative inertia. In this
study, DNA sequences and species distribution models are used to analyse the origin of the
C. navasii disjunction as a preliminary step to reassess its recovery plan. Molecular results
placed the disjunction during Miocene-Pleistocene (6.30–0.49 Mya, plastid DNA; 1.45–0.03
Mya, ribosomal DNA), which discards a putative human-mediated origin. In fact, the haplo-
type network and the low gene flow estimated between disjunct areas suggest long-term
isolation. Dispersal is the most likely explanation for the disjunction as interpreted from the
highly fragmented distribution projected to the past. Particularly, a northward dispersal from
Southeast is proposed since C. navasii haplotype network is connected to the sister-group
through the southern haplotype. Although the reassessment of C. navasii conservation sta-
tus is more optimistic under the new extent of occurrence, its long-term survival may be
compromised due to the: (1) natural fragmentation and rarity of the species habitat, (2)
genetic isolation between the two disjunct areas, and (3) northward shift of suitable areas
under future climate change scenarios. Several ex-situ and in-situ conservation measures
are proposed for integrating Central East Spanish populations into the on-going recovery
plan, which still only contemplates Southeast populations and therefore does not preserve
the genetic structure and diversity of the species.
PLOS ONE | DOI:10.1371/journal.pone.0159484 July 27, 2016 1 / 23
a11111
OPEN ACCESS
Citation: Martín-Hernanz S, G. Fernández de CastroA, Moreno-Saiz JC, Valcárcel V (2016) Pre-HoloceneOrigin for the Coronopus navasii Disjunction:Conservation Implications from Its Long Isolation.PLoS ONE 11(7): e0159484. doi:10.1371/journal.pone.0159484
Editor: Tzen-Yuh Chiang, National Cheng-KungUniversity, TAIWAN
Received: September 29, 2015
Accepted: July 5, 2016
Published: July 27, 2016
Copyright: © 2016 Martín-Hernanz et al. This is anopen access article distributed under the terms of theCreative Commons Attribution License, which permitsunrestricted use, distribution, and reproduction in anymedium, provided the original author and source arecredited.
Data Availability Statement: DNA data are availablein the GenBank database: http://www.ncbi.nlm.nih.gov/genbank/. All relevant data are within the paperand its Supporting Information files.
Funding: The study was unfunded. The authorsreceived no specific funding for this work.
Competing Interests: The authors have declaredthat no competing interests exist.
Rare species are not invariably threatened with imminent extinction. However, those speciesthat are threatened are almost invariably rare.− Kevin Gaston
IntroductionSelection of flagship species is key for effective biodiversity conservation management sincethey attract the attention of the public and policy administrators. Flagships species normallyare endemic taxa restricted to a particular ecosystem, being mammals and birds the most com-mon candidates to play this role [1], with the occasional exception of some plants [2]. The ben-efits of flagships often go beyond their own conservation improvements since they can also beumbrella species under which protection other species or habitats are also preserved [1].
Well-known threatened species are easy targets of well-supported conservation statusassessments and more likely to become flagship species. The more conservation attentionreceived, the more probable new discoveries occurred and resulted in improving the conserva-tion status assessment. Reassessments in the conservation status force the adaptation of theconservation strategy to accommodate management actions. However, the implementation ofnew measures often faces researchers’ or politicians’ resistance delaying integration in the on-going recovery plans [3]. This is the case of Coronopus navasii Pau (Brassicaceae), one of themost charismatic species within the broad spectrum of the Spanish plant conservationism [4].It is an endemic species that has been legally protected under the maximum risk category sincethe first National Catalogue of Endangered Species published in 1982 [5]. Coronopus navasiiinhabits temporarily flooded clay ponds in xeric environments at high altitudes where it islocally abundant and dominant [5, 6]. Apart from its local abundance, C. navasii satisfies thetwo remaining features described by Rabinowitz [7] to be considered a rare species, it: (1)shows a high habitat specificity, and (2) was known from just a single metapopulation in theSierra de Gádormountain range (Andalusia, Southeast Spain). The species is not only a rareplant but it is under decline [8], legitimate condition to be considered as threatened [9]. Popu-lation size has been decreasing since the first censuses in the 70s and its local populations sufferfrom extinctions and severe demographic oscillations [5, 6]. The species decline has been asso-ciated to climate change and human impacts such as over-grazing, plowing or the practice ofoff-road driving. Indeed, C. navasii is catalogued under the ‘Critically Endangered’ IUCN cate-gory in both Regional and National Red Lists [8, 10] as well as ‘in Danger of Extinction’ in thecorresponding legal catalogues of protected flora [5, 11]. It is also included in the Bern Conven-tion [12] and as a priority species in the European Habitats Directive [13]. The species is alsoprotected through its habitat since Mediterranean temporary ponds are considered priorityhabitats belonging to the European Natura 2000 network (Natura 2000 code 3170). Withinthis legal context, an integrated conservation program was developed on the species and itshabitat including in situ, ex situ and legal measures. As a result, a range of ex situ conservationtechniques has already been done [14] including the implementation of population reinforce-ments [5, 15].
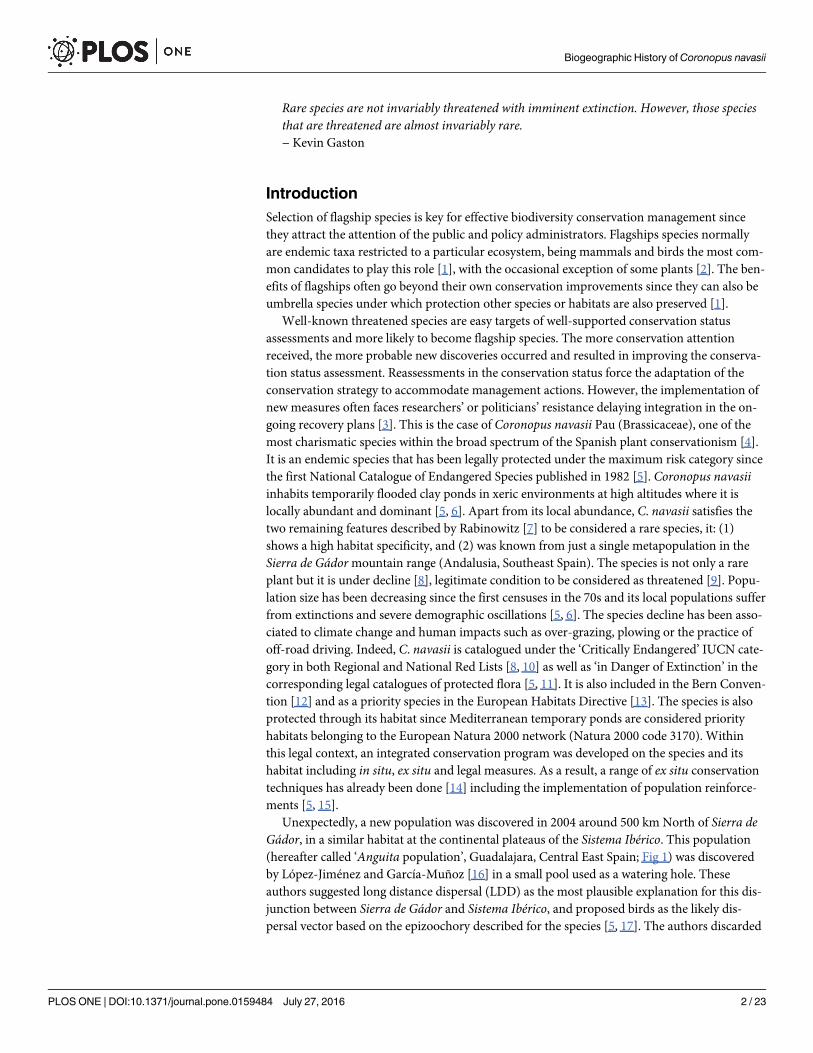
Unexpectedly, a new population was discovered in 2004 around 500 km North of Sierra deGádor, in a similar habitat at the continental plateaus of the Sistema Ibérico. This population(hereafter called ‘Anguita population’, Guadalajara, Central East Spain; Fig 1) was discoveredby López-Jiménez and García-Muñoz [16] in a small pool used as a watering hole. Theseauthors suggested long distance dispersal (LDD) as the most plausible explanation for this dis-junction between Sierra de Gádor and Sistema Ibérico, and proposed birds as the likely dis-persal vector based on the epizoochory described for the species [5, 17]. The authors discarded
Biogeographic History of Coronopus navasii
PLOSONE | DOI:10.1371/journal.pone.0159484 July 27, 2016 2 / 23
vicariance as a plausible explanation due to the natural scattered occurrence of the pondswhere C. navasii appears.
Interestingly, two new populations were found in the summer of 2014 in other localities atthe Sistema Ibérico (Fig 1). One of these recently discovered populations (hereafter called ‘Mar-anchón population’) is located barely 16 km east of the Anguita population in a similar tempo-rary pond (Julián García-Muñoz, pers. com.). The second one (hereafter called ‘Zaidapopulation’) is in Zaragoza, c 100 km east of Anguita andMaranchón populations, where itoccupies the temporary flooded shoulders of a farming path [18].
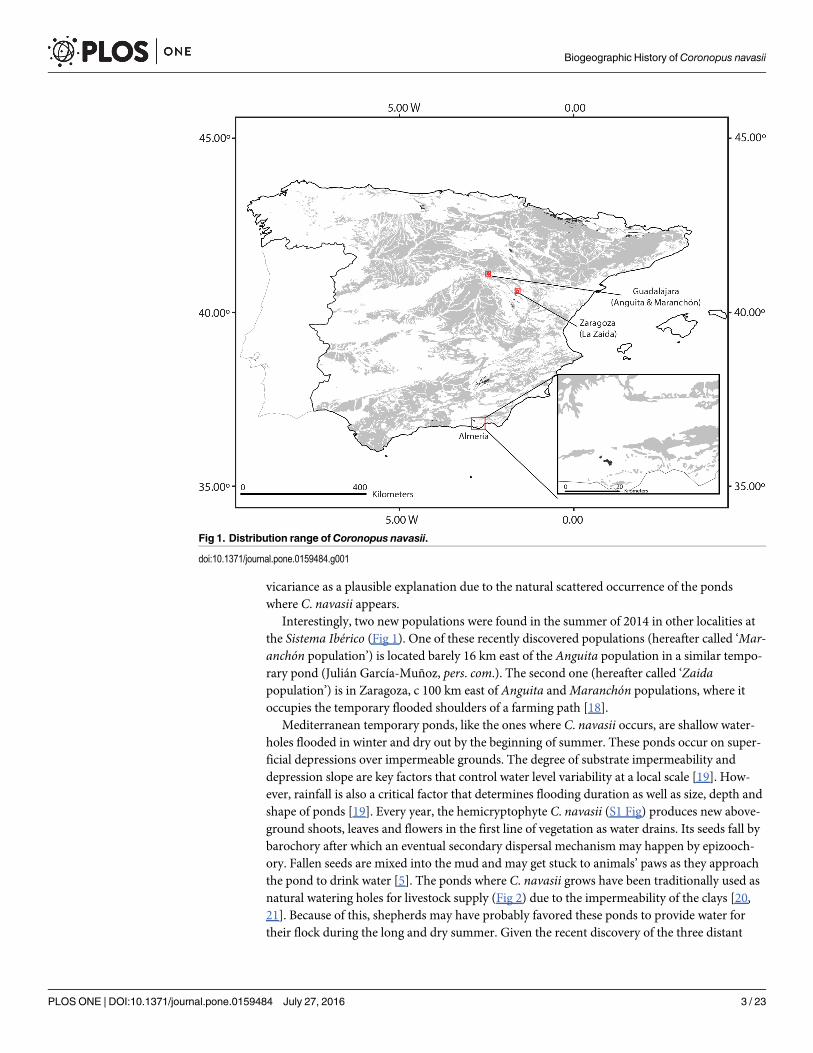
Mediterranean temporary ponds, like the ones where C. navasii occurs, are shallow water-holes flooded in winter and dry out by the beginning of summer. These ponds occur on super-ficial depressions over impermeable grounds. The degree of substrate impermeability anddepression slope are key factors that control water level variability at a local scale [19]. How-ever, rainfall is also a critical factor that determines flooding duration as well as size, depth andshape of ponds [19]. Every year, the hemicryptophyte C. navasii (S1 Fig) produces new above-ground shoots, leaves and flowers in the first line of vegetation as water drains. Its seeds fall bybarochory after which an eventual secondary dispersal mechanism may happen by epizooch-ory. Fallen seeds are mixed into the mud and may get stuck to animals’ paws as they approachthe pond to drink water [5]. The ponds where C. navasii grows have been traditionally used asnatural watering holes for livestock supply (Fig 2) due to the impermeability of the clays [20,21]. Because of this, shepherds may have probably favored these ponds to provide water fortheir flock during the long and dry summer. Given the recent discovery of the three distant
Fig 1. Distribution range ofCoronopus navasii.
doi:10.1371/journal.pone.0159484.g001
Biogeographic History of Coronopus navasii
PLOSONE | DOI:10.1371/journal.pone.0159484 July 27, 2016 3 / 23
northern populations in otherwise highly accessible localities related to traditional pastoraluses, coupled with their reduced population sizes, we could not help but wonder if the origin ofthese populations was human-mediated. This hypothesis is plausible since ‘transhumance’ hasbeen a traditional land use in Spain until recent years [22]. This practice consisted in the regu-lar displacement of cattle by shepherds to take advantage of spatial-temporal variations in landproductivity associated to seasonal climates such as the Mediterranean one. Transhumance hasa long history in the Iberian Peninsula, with some traces in pre-Roman times and its peak dur-ing the Middle Ages, when over 3 millionmerino sheep moved through the country going overup to 800 km distance [23]. The role of transhumance on plant dispersal has been experimen-tally evaluated revealing that seeds can be transported several hundreds of kilometers attachedto hooves of transhumant sheep, even in plants with no adaptation to epizoochory such asPlantago lagopus L. [24]. For the particular case of C. navasii, transhumance-migration seemslikely given that: (1) its individuals germinate in the first line of vegetation as water drains, (2)fruits phenology coincide with domesticated ungulates’ summer migrations and (3) ponds areused for flock drinking.
Despite C. navasii is one of the best documented cases of the Spanish endangered flora andone of the few with an integral conservation program already implemented, the recent findingof three distant populations changes the biogeographic scenario of the species questioning its
Fig 2. Natural habitat ofCoronopus navasii (Temporary Mediterranean pond). Sabinar pond (Sierra de Gádor).
doi:10.1371/journal.pone.0159484.g002
Biogeographic History of Coronopus navasii
PLOSONE | DOI:10.1371/journal.pone.0159484 July 27, 2016 4 / 23
conservation status and the efficiency of the on-going conservation program. Disclosing theevolutionary history that lead to C. navasii disjunction is essential to reassess the conservationstatus of the species and redefine its conservation strategy. In this study, we analyze DNAsequences and environmental data to evaluate whether the origin of the current disjunction ofC. navasii was human-mediated (‘transhumance hypothesis’) or not. Ultimately, we seek toknow if the occurrence of the species in Central East Spain is adventitious or the result of anold disjunction in order to reformulate the on-going species conservation plan to accommo-date the new biogeographic scenario. To address these goals, we analyzed haplotype variationfrom six DNA regions in seven populations representing the two main disjunct areas of C.navasii (four populations from Sierra de Gádor, three populations from Sistema Ibérico).Additional datasets were obtained from previous studies (Malvidae, [25]; Lepidium, [26]) toprovide a phylogenetic framework to estimate the divergence age for the origin of C. navasiiand its disjunction. Finally, species distribution models were generated for past, presentand future under different climate change scenarios. The specific goals were to: (1) test themonophyly of C. navasii, (2) explore the geographic structure of its haplotype variation, (3)disclose the temporal scenario for the origin of C. navasii and its disjunction, (4) describe anedaphic-climate niche modeling for the species at present time and evaluate niche perfor-mances under past and future climate scenarios, (5) propose conservation actions on the Sis-tema Ibérico populations and provide basic information to reevaluate the conservation statusof the species.
Materials and Methods
Ethics statementCoronopus navasii is an endangered species and no individual was collected. For this study, theminimum number of leaves was collected without compromising the survival of living plants.The environmental authorities of Andalusia, region where the species is protected under arecovery plan, granted the required permits for this study. Regional authorities from Aragónand Castilla-La Mancha are knowledgeable about this research and gave their formal approvalto the collection of plant material in their respective areas of competence. This study did notrequire ethical approval.
Study caseCoronopus navasii has between 8 and 10 local populations in Sierra de Gádor (Andalusia,Southeast Spain), occurring above 1,600 m.a.s.l. (Fig 1) and organized in a metapopulationdynamics [5]. Two local populations display a relatively large and constant population size: (1)Cortijo de Caparidán pond with around 37,000 individuals, and (2) Sabinar pond with nearly1,200 individuals [5]. The remaining 6–8 local populations include fewer than 20 individualseach and are affected by inter-annual demographic fluctuations [5]. The Sierra de Gádormeta-population is protected through: (1) its habitat since this mountain range is catalogued as a Siteof Community Importance in the European Natura 2000 network (European code:ES6110008), (2) the conservation program of the species already in progress, and (3) a set of insitu conservation actions recently considered within the Recovery Plan for ‘Andalusian HighSummit Species’ [27]. The three populations found in the surroundings of the Sistema Ibérico(Central East Spain) occur from 1,000 to 1,200 m.a.s.l. (Fig 1). Although, these altitudes cannotbe considered high, the climatic conditions are extreme and subject to high seasonal fluctuationsince this geographic area is a continental plateau considered a cold inland island in the IberianPeninsula. The Anguita andMaranchón populations (Guadalajara; Fig 1) inhabit similar pondhabitats as the ones described in the Sierra de Gádormetapopulation [16], whereas the Zaida
Biogeographic History of Coronopus navasii
PLOSONE | DOI:10.1371/journal.pone.0159484 July 27, 2016 5 / 23
population (Zaragoza; Fig 1) inhabits temporarily flooded sides of a country road that crosses alarge and semi-permanent pond [18]. Three censuses have been performed in the Anguita pop-ulation revealing a rather variable size ranging between< 100 reproductive individuals [16]and 800 [28]. Because of the recent discovery of the other two populations, only the respectiveinitial censuses are available consisting in 450 reproductive individuals atMaranchón and1,536 at Zaida [18]. In terms of management, the Anguita andMaranchón populations areprotected through their habitat since they are located within a Site of Community Importancein the European Natura 2000 network (European code ES4240017). The Zaida populationlacks any legal protection, although this locality is part of a Special Conservation Area underthe EU Birds Directive (European code ES0000017).
Molecular studyField and lab work strategy. Fifty-four individuals from seven populations of C. navasii
were sampled from the two disjunct areas where the species occurs (Fig 1, Table 1): 24 individ-uals from four local populations from Sierra de Gádor (Southeast Spain) and 30 from threepopulations of the continental plateaus of Sistema Ibérico (Central East Spain). The number ofindividuals per local population was ten except for two Sierra de Gádor locations (Mercurioand Balsilla Alta) where the population size was limited to two (Table 1). Leaf material wasimmediately stored in silica gel.
Total genomic DNA was isolated from leaf tissue using the extraction protocol DNAeasyPlant Mini Kiy (Qiagen, California, USA). Five plastid DNA regions as well as the nuclear ITSspacer were sequenced for all the 54 individuals of C. navasii, except for trnS-trnG and trnT-trnL from which only 51 and 50 individuals could be sequenced, respectively (Table 1). Theforward and reverse primers used for the amplification of each of the six DNA regions as wellas their respective PCR conditions were taken from the following studies: psbA and trnH [29]for trnH-psbA, trnS and trnG [30] for trnS-trnG, trne and trnf [31] for trnL-trnF, trna and trnb[31] for trnT-trnL, trnQ and rps16x1 [32] for rps16-trnQ, and 17SE and 26SE for the nrDNAITS [33]. Amplifications were done in a MyClycer thermal cycler. PCR products successfullyamplified were sequenced using the STABvida sequencing service (Big Dye Terminator v. 2.0,Applied Biosystem) and Secugen SL (Madrid, Spain). Sequences were edited using Geneious R8[34]. All the DNAmatrices were aligned using the windows interface MUSCLE [35] followedby further visual adjustments.
A comprehensive taxonomic sampling above the species-level was compiled to provide arobust phylogenetic framework to recover accurate estimates on divergence ages. Two datasets(nuclear ITS, plastid trnT-trnL) including 97 samples of Lepidium s.l. (Cardaria, Coronopus,Lepidium, Stroganowia, Stubendorffia,Winklera) plus Hornungia petraea as outgroup wereprovided by Klaus Mummenhoff based on Mummenhoff et al. 2009 (S1 Table) [26]. Four ofthe individuals of C. navasii from Southeast and Central East disjunct areas herein sequencedwere added to both datasets. Each of the resulting two DNAmatrices included 102 sequences(hereafter called ‘Lepidium nuclear matrix’ and ‘Lepidium plastid matrix’).
No feasible fossil record attributable to Lepidium s.l. is available. Consequently, a secondarycalibration approach was needed in order to obtain calibration points to estimate the diver-gence age of C. navasii and its disjunction. To this purpose, 60 Brassicales and twelve Malvalessequences of the plastidmatK gene were obtained from a previous study [25], as well as onefrom Crossosomatales and one from Huertales. All these 74 sequences were downloaded fromthe GenBank database (http://www.ncbi.nlm.nih.gov/genbank/). Since only one Lepidium sam-ple was included in Hernández-Hernández et al. (2013) [25], five additional Lepidium speciesand one sample of Coronopus squamatus (Forssk.) Asch. were also taken from previous studies
Biogeographic History of Coronopus navasii
PLOSONE | DOI:10.1371/journal.pone.0159484 July 27, 2016 6 / 23
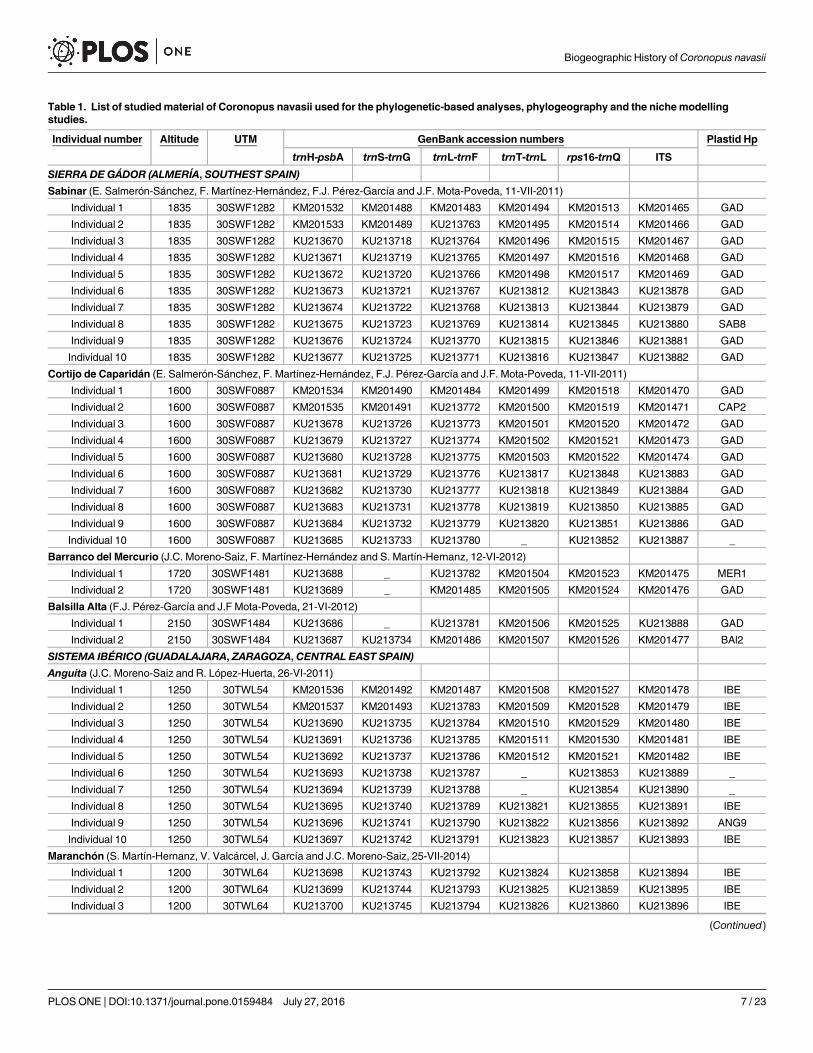
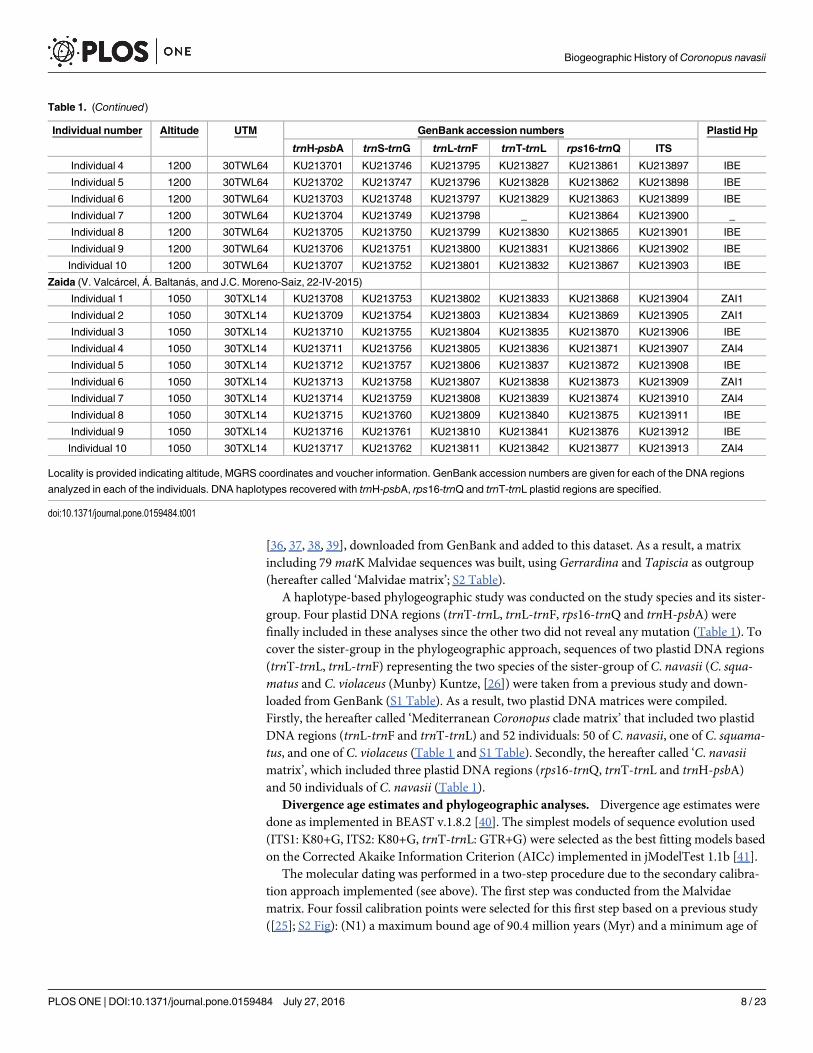
Table 1. List of studiedmaterial of Coronopus navasii used for the phylogenetic-based analyses, phylogeography and the nichemodellingstudies.
Individual number Altitude UTM GenBank accession numbers Plastid Hp
trnH-psbA trnS-trnG trnL-trnF trnT-trnL rps16-trnQ ITS
SIERRA DE GÁDOR (ALMERÍA, SOUTHEST SPAIN)Sabinar (E. Salmerón-Sánchez, F. Martínez-Hernández, F.J. Pérez-García and J.F. Mota-Poveda, 11-VII-2011)
Individual 1 1835 30SWF1282 KM201532 KM201488 KM201483 KM201494 KM201513 KM201465 GAD
Individual 2 1835 30SWF1282 KM201533 KM201489 KU213763 KM201495 KM201514 KM201466 GAD
Individual 3 1835 30SWF1282 KU213670 KU213718 KU213764 KM201496 KM201515 KM201467 GAD
Individual 4 1835 30SWF1282 KU213671 KU213719 KU213765 KM201497 KM201516 KM201468 GAD
Individual 5 1835 30SWF1282 KU213672 KU213720 KU213766 KM201498 KM201517 KM201469 GAD
Individual 6 1835 30SWF1282 KU213673 KU213721 KU213767 KU213812 KU213843 KU213878 GAD
Individual 7 1835 30SWF1282 KU213674 KU213722 KU213768 KU213813 KU213844 KU213879 GAD
Individual 8 1835 30SWF1282 KU213675 KU213723 KU213769 KU213814 KU213845 KU213880 SAB8
Individual 9 1835 30SWF1282 KU213676 KU213724 KU213770 KU213815 KU213846 KU213881 GAD
Individual 10 1835 30SWF1282 KU213677 KU213725 KU213771 KU213816 KU213847 KU213882 GAD
Cortijo de Caparidán (E. Salmerón-Sánchez, F. Martínez-Hernández, F.J. Pérez-García and J.F. Mota-Poveda, 11-VII-2011)
Individual 1 1600 30SWF0887 KM201534 KM201490 KM201484 KM201499 KM201518 KM201470 GAD
Individual 2 1600 30SWF0887 KM201535 KM201491 KU213772 KM201500 KM201519 KM201471 CAP2
Individual 3 1600 30SWF0887 KU213678 KU213726 KU213773 KM201501 KM201520 KM201472 GAD
Individual 4 1600 30SWF0887 KU213679 KU213727 KU213774 KM201502 KM201521 KM201473 GAD
Individual 5 1600 30SWF0887 KU213680 KU213728 KU213775 KM201503 KM201522 KM201474 GAD
Individual 6 1600 30SWF0887 KU213681 KU213729 KU213776 KU213817 KU213848 KU213883 GAD
Individual 7 1600 30SWF0887 KU213682 KU213730 KU213777 KU213818 KU213849 KU213884 GAD
Individual 8 1600 30SWF0887 KU213683 KU213731 KU213778 KU213819 KU213850 KU213885 GAD
Individual 9 1600 30SWF0887 KU213684 KU213732 KU213779 KU213820 KU213851 KU213886 GAD
Individual 10 1600 30SWF0887 KU213685 KU213733 KU213780 _ KU213852 KU213887 _
Barranco del Mercurio (J.C. Moreno-Saiz, F. Martínez-Hernández and S. Martín-Hernanz, 12-VI-2012)
Individual 1 1720 30SWF1481 KU213688 _ KU213782 KM201504 KM201523 KM201475 MER1
Individual 2 1720 30SWF1481 KU213689 _ KM201485 KM201505 KM201524 KM201476 GAD
Balsilla Alta (F.J. Pérez-García and J.F Mota-Poveda, 21-VI-2012)
Individual 1 2150 30SWF1484 KU213686 _ KU213781 KM201506 KM201525 KU213888 GAD
Individual 2 2150 30SWF1484 KU213687 KU213734 KM201486 KM201507 KM201526 KM201477 BAl2
SISTEMA IBÉRICO (GUADALAJARA, ZARAGOZA, CENTRAL EAST SPAIN)Anguita (J.C. Moreno-Saiz and R. López-Huerta, 26-VI-2011)
Individual 1 1250 30TWL54 KM201536 KM201492 KM201487 KM201508 KM201527 KM201478 IBE
Individual 2 1250 30TWL54 KM201537 KM201493 KU213783 KM201509 KM201528 KM201479 IBE
Individual 3 1250 30TWL54 KU213690 KU213735 KU213784 KM201510 KM201529 KM201480 IBE
Individual 4 1250 30TWL54 KU213691 KU213736 KU213785 KM201511 KM201530 KM201481 IBE
Individual 5 1250 30TWL54 KU213692 KU213737 KU213786 KM201512 KM201521 KM201482 IBE
Individual 6 1250 30TWL54 KU213693 KU213738 KU213787 _ KU213853 KU213889 _
Individual 7 1250 30TWL54 KU213694 KU213739 KU213788 _ KU213854 KU213890 _
Individual 8 1250 30TWL54 KU213695 KU213740 KU213789 KU213821 KU213855 KU213891 IBE
Individual 9 1250 30TWL54 KU213696 KU213741 KU213790 KU213822 KU213856 KU213892 ANG9
Individual 10 1250 30TWL54 KU213697 KU213742 KU213791 KU213823 KU213857 KU213893 IBE
Maranchón (S. Martín-Hernanz, V. Valcárcel, J. García and J.C. Moreno-Saiz, 25-VII-2014)
Individual 1 1200 30TWL64 KU213698 KU213743 KU213792 KU213824 KU213858 KU213894 IBE
Individual 2 1200 30TWL64 KU213699 KU213744 KU213793 KU213825 KU213859 KU213895 IBE
Individual 3 1200 30TWL64 KU213700 KU213745 KU213794 KU213826 KU213860 KU213896 IBE
(Continued)
Biogeographic History of Coronopus navasii
PLOSONE | DOI:10.1371/journal.pone.0159484 July 27, 2016 7 / 23
[36, 37, 38, 39], downloaded from GenBank and added to this dataset. As a result, a matrixincluding 79matKMalvidae sequences was built, using Gerrardina and Tapiscia as outgroup(hereafter called ‘Malvidae matrix’; S2 Table).
A haplotype-based phylogeographic study was conducted on the study species and its sister-group. Four plastid DNA regions (trnT-trnL, trnL-trnF, rps16-trnQ and trnH-psbA) werefinally included in these analyses since the other two did not reveal any mutation (Table 1). Tocover the sister-group in the phylogeographic approach, sequences of two plastid DNA regions(trnT-trnL, trnL-trnF) representing the two species of the sister-group of C. navasii (C. squa-matus and C. violaceus (Munby) Kuntze, [26]) were taken from a previous study and down-loaded from GenBank (S1 Table). As a result, two plastid DNAmatrices were compiled.Firstly, the hereafter called ‘Mediterranean Coronopus clade matrix’ that included two plastidDNA regions (trnL-trnF and trnT-trnL) and 52 individuals: 50 of C. navasii, one of C. squama-tus, and one of C. violaceus (Table 1 and S1 Table). Secondly, the hereafter called ‘C. navasiimatrix’, which included three plastid DNA regions (rps16-trnQ, trnT-trnL and trnH-psbA)and 50 individuals of C. navasii (Table 1).
Divergence age estimates and phylogeographic analyses. Divergence age estimates weredone as implemented in BEAST v.1.8.2 [40]. The simplest models of sequence evolution used(ITS1: K80+G, ITS2: K80+G, trnT-trnL: GTR+G) were selected as the best fitting models basedon the Corrected Akaike Information Criterion (AICc) implemented in jModelTest 1.1b [41].
The molecular dating was performed in a two-step procedure due to the secondary calibra-tion approach implemented (see above). The first step was conducted from the Malvidaematrix. Four fossil calibration points were selected for this first step based on a previous study([25]; S2 Fig): (N1) a maximum bound age of 90.4 million years (Myr) and a minimum age of
Table 1. (Continued)
Individual number Altitude UTM GenBank accession numbers Plastid Hp
trnH-psbA trnS-trnG trnL-trnF trnT-trnL rps16-trnQ ITS
Individual 4 1200 30TWL64 KU213701 KU213746 KU213795 KU213827 KU213861 KU213897 IBE
Individual 5 1200 30TWL64 KU213702 KU213747 KU213796 KU213828 KU213862 KU213898 IBE
Individual 6 1200 30TWL64 KU213703 KU213748 KU213797 KU213829 KU213863 KU213899 IBE
Individual 7 1200 30TWL64 KU213704 KU213749 KU213798 _ KU213864 KU213900 _
Individual 8 1200 30TWL64 KU213705 KU213750 KU213799 KU213830 KU213865 KU213901 IBE
Individual 9 1200 30TWL64 KU213706 KU213751 KU213800 KU213831 KU213866 KU213902 IBE
Individual 10 1200 30TWL64 KU213707 KU213752 KU213801 KU213832 KU213867 KU213903 IBE
Zaida (V. Valcárcel, Á. Baltanás, and J.C. Moreno-Saiz, 22-IV-2015)
Individual 1 1050 30TXL14 KU213708 KU213753 KU213802 KU213833 KU213868 KU213904 ZAI1
Individual 2 1050 30TXL14 KU213709 KU213754 KU213803 KU213834 KU213869 KU213905 ZAI1
Individual 3 1050 30TXL14 KU213710 KU213755 KU213804 KU213835 KU213870 KU213906 IBE
Individual 4 1050 30TXL14 KU213711 KU213756 KU213805 KU213836 KU213871 KU213907 ZAI4
Individual 5 1050 30TXL14 KU213712 KU213757 KU213806 KU213837 KU213872 KU213908 IBE
Individual 6 1050 30TXL14 KU213713 KU213758 KU213807 KU213838 KU213873 KU213909 ZAI1
Individual 7 1050 30TXL14 KU213714 KU213759 KU213808 KU213839 KU213874 KU213910 ZAI4
Individual 8 1050 30TXL14 KU213715 KU213760 KU213809 KU213840 KU213875 KU213911 IBE
Individual 9 1050 30TXL14 KU213716 KU213761 KU213810 KU213841 KU213876 KU213912 IBE
Individual 10 1050 30TXL14 KU213717 KU213762 KU213811 KU213842 KU213877 KU213913 ZAI4
Locality is provided indicating altitude, MGRS coordinates and voucher information. GenBank accession numbers are given for each of the DNA regions
analyzed in each of the individuals. DNA haplotypes recovered with trnH-psbA, rps16-trnQ and trnT-trnL plastid regions are specified.
doi:10.1371/journal.pone.0159484.t001
Biogeographic History of Coronopus navasii
PLOSONE | DOI:10.1371/journal.pone.0159484 July 27, 2016 8 / 23
88.5 Myr were applied to the divergence between Luehea clade and Bixa clade based on a fossilof Dressiantha bicarpellata [42], (N2) a maximum bound age of 61.9 Myr and a minimum ageof 61.5 Myr were applied to the divergence between Bretschneidera and Tropaeolum based on afossil of Akania sp. [43], (N3) a maximum bound age of 30.8 Myr and a minimum age of 29.2Myr were applied to the divergence between Thlaspi and Alliaria based on a fossil of Thlaspiprimaevum [43, 44], and (N4) 17 Myr and 16.3 Myr were applied as maximum and minimumbound ages to the divergence between Capparis and Apophyllum, based on a fossil of Cappari-doxylon holleisii [43, 45]. Cross-validation [46] was conducted to check for congruencebetween the four fossils selected. Variation in the sum of the squared differences (SS) of the agerecovered in the molecular estimate for a given node and its respective fossil age was computedwhen comparing the molecular estimates obtained using each of the four fossils as a single cali-bration point (S3 Fig). Capparidoxylon is the fossil with the greatest SS value, i.e. the one thatprovides the biggest deviation between molecular estimates and fossil ages, followed by Thlapsi(S3 Fig). However, removal of the most deviant fossil (Capparidoxylon) did not result in a sig-nificant difference in the variance (F = 2.09, d.f. = 11, P = 0.4). Therefore, the four fossils wereused for this first step of the molecular dating. In the second step, three well-supported nodesrecovered in the Malvidae chronogram (S2 Fig) were selected as secondary calibration pointsto reconstruct divergence age estimates within Lepidium s.l. Normal prior distributions wereused to calibrate the divergence between the following nodes (S4 Fig): (N1) Lepidium pedicello-sum clade and the remaining Lepidum s.l. (19.5 ± 3.0 Myr), (N2) L. perfoliatum and the L. rigi-dum—L. campestre clade with (12.35 ± 2.5 Myr), and (N3) L. campestre subclade and L. hirtumsubclade (mean = 8.7 ± 1.5 Myr). For the plastid analysis, the Mediterranean Coronopus cladewas constrained. Uncorrelated lognormal model distribution and the best fitting modelsselected by jModeltest were used. One hundred million generations were run, sampling every10,000th tree. Burn-in was determined based on the Likelihood convergence screened withTracer 1.4. [47]. Trees retrieved before reaching convergence were accordingly discarded. Treetopologies obtained from the BEAST analyses of Lepidium nuclear and plastid matrices werecompared by the Approximately Unbiased (AU) test [48], as implemented in Treefinder [49].105 replicates were performed and hypothesis rejection was set at a 0.05 threshold. Bayes Fac-tors (BF; [50, 51] were also estimated by using the stepping-stone sampling implemented inBEAST to provide additional test topology. The BF analysis allows comparing the strength ofevidence between a reference model (H0) and an alternative model (Hi) given the data. Thestepping-stone method provides more accurate marginal likelihood estimates than the har-monic mean method [52, 53]. Selection of the best competing hypotheses against the H0 isbased on the log BF (LBF = 2loge (BF)) and according to Kass and Raftery’s interpretation(Positive evidence, 2loge(BF) = 2–6; Strong evidence, 2loge(BF) = 6–10; Very Strong evidence,2loge (BF)> 10 [50]). Positive values of the LBF indicate preference for H1, while negative val-ues favor the H0.
Plastid haplotype networks were obtained using Statistical Parsimony [54] as implementedin TCS 1.21 [55] both for Mediterranean Coronopus clade and C. navasiimatrices. The maxi-mum number of differences among haplotypes, as a result of single substitutions, was calcu-lated with 95% confidence limits. Gaps were treated as missing data for the analysis of theCoronopus clade matrix to preserve the connection of the outgroup network to the one of C.navasii, whereas missing data were treated as the fifth character for the C. navasiimatrix toinclude indel information in the detection of haplotypes.
Gene flow and genetic differentiation estimates. Two analyses were conducted toaccount for the current gene flow and migration rates between the Southeast and Central Eastgroups of populations. Firstly, an analysis of molecular variance (AMOVA) was performedwith software Arlequin 3.0 [56]. Secondly, software dnaSP was used to obtain both genetic
Biogeographic History of Coronopus navasii
PLOSONE | DOI:10.1371/journal.pone.0159484 July 27, 2016 9 / 23
differentiation estimators (FST and GST) and the number of migrants (Nm) estimated withHudson et al. method [57].
Species distribution modelingCalibration and validation datasets. A dataset composed by the sampled populations
spanned to 14 presences at 1 km2 grid resolution. A dataset of 1,000 pseudo absence points wasrandomly generated, preventing them to fall within 1 km of C. navasii occurrence cells. Theseset of presence and pseudo absence points were used to calibrate the models.
Predictor variables. Bioclimatic variables for current conditions were obtained fromWorldclim project [58] at 30 seconds resolutions. The eight a priori, most meaningful speciesdistribution models (SDMs) were selected from the 19 bioclimatic variables available (Table 2).Two topographic predictors were incorporated: Slope was derived in ArcGIS 9.3 [59] from ahigh resolution DEM (20 meters) available from the National Geographic Center and rescaledto match climate layers resolution. Topographic index was developed with ArcInfo routinesavailable at Nicklaus Zimmerman website (http://bit.ly/1nSEhoO). The novel climate scenariosavailable in the Worldclim project [58] downscaled from the recent 5th report of IPCC [60]were used to project calibrated models for years 2050 and 2070. HadGEM2-ES was the GlobalCirculation Model selected, as it accounted for the whole range of Representative Concentra-tion Pathways (RCP) of greenhouse gases concentrations considered by the IPCC. Amongthem, we selected 2.6, 6.0 and 8.5 RCPs. For past climatic conditions, bioclimatic variables forthe Last Interglacial period (LIG, 120–140 kilo years (ky)) and CCSMmodel for Last GlacialMaximum (LGM, 21 ky) were used fromWorldclim.
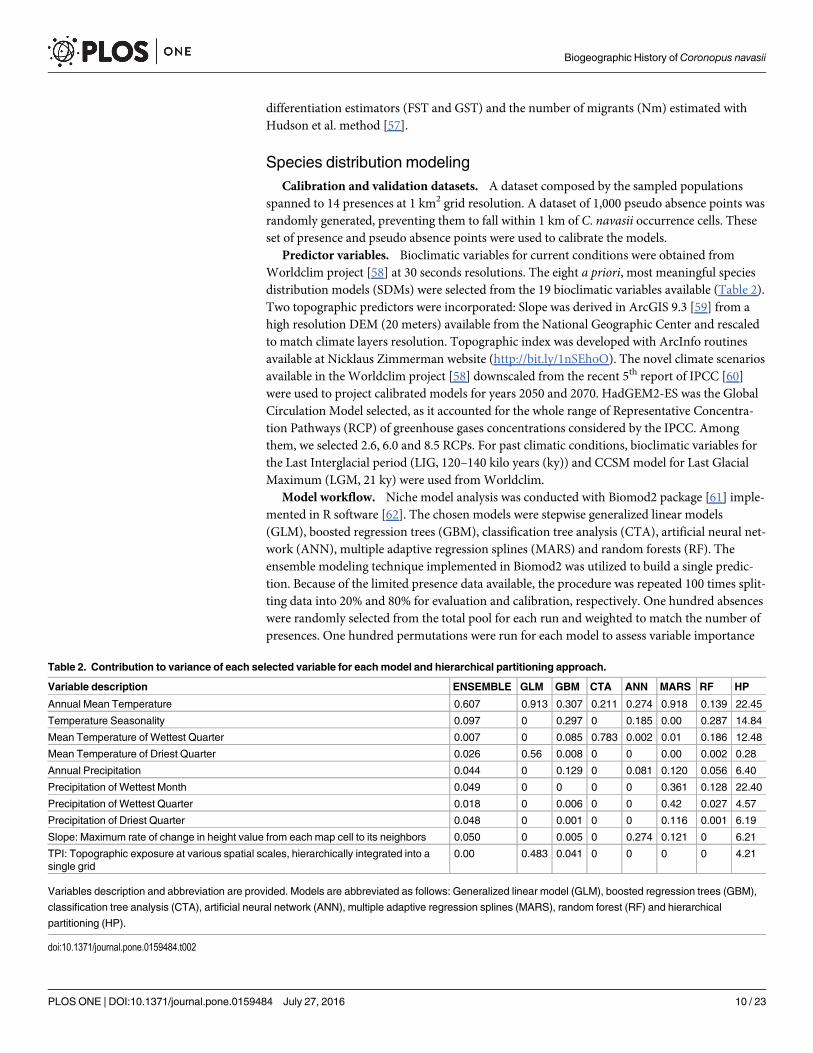
Model workflow. Niche model analysis was conducted with Biomod2 package [61] imple-mented in R software [62]. The chosen models were stepwise generalized linear models(GLM), boosted regression trees (GBM), classification tree analysis (CTA), artificial neural net-work (ANN), multiple adaptive regression splines (MARS) and random forests (RF). Theensemble modeling technique implemented in Biomod2 was utilized to build a single predic-tion. Because of the limited presence data available, the procedure was repeated 100 times split-ting data into 20% and 80% for evaluation and calibration, respectively. One hundred absenceswere randomly selected from the total pool for each run and weighted to match the number ofpresences. One hundred permutations were run for each model to assess variable importance
Table 2. Contribution to variance of each selected variable for eachmodel and hierarchical partitioning approach.
Variable description ENSEMBLE GLM GBM CTA ANN MARS RF HP
Annual Mean Temperature 0.607 0.913 0.307 0.211 0.274 0.918 0.139 22.45
Temperature Seasonality 0.097 0 0.297 0 0.185 0.00 0.287 14.84
Mean Temperature of Wettest Quarter 0.007 0 0.085 0.783 0.002 0.01 0.186 12.48
Mean Temperature of Driest Quarter 0.026 0.56 0.008 0 0 0.00 0.002 0.28
Annual Precipitation 0.044 0 0.129 0 0.081 0.120 0.056 6.40
Precipitation of Wettest Month 0.049 0 0 0 0 0.361 0.128 22.40
Precipitation of Wettest Quarter 0.018 0 0.006 0 0 0.42 0.027 4.57
Precipitation of Driest Quarter 0.048 0 0.001 0 0 0.116 0.001 6.19
Slope: Maximum rate of change in height value from each map cell to its neighbors 0.050 0 0.005 0 0.274 0.121 0 6.21
TPI: Topographic exposure at various spatial scales, hierarchically integrated into asingle grid
0.00 0.483 0.041 0 0 0 0 4.21
Variables description and abbreviation are provided. Models are abbreviated as follows: Generalized linear model (GLM), boosted regression trees (GBM),
classification tree analysis (CTA), artificial neural network (ANN), multiple adaptive regression splines (MARS), random forest (RF) and hierarchical
partitioning (HP).
doi:10.1371/journal.pone.0159484.t002
Biogeographic History of Coronopus navasii
PLOSONE | DOI:10.1371/journal.pone.0159484 July 27, 2016 10 / 23
as implemented in Biomod2. A final ensemble model was built with all the runs withAUC> 0.7. Output suitability maps were crossed with a soil layer of Iberian Peninsula in orderto account only for areas where clay soils were present. Complementarily, hierarchical parti-tioning approach [63] was conducted with the hier.part package [64] in R software to accountfor a linear method based on Ordinary Least Squares. In order to assess the changes in rangesizes (i.e., changes in total potential distribution area), the presence-absence distribution mapswere calculated from suitability maps from the threshold that maximized the AUC score.Changes in range sizes were calculated as the percentage of lost or gained cells with respect topresent period.
For past climate conditions, pure climate suitability models were calibrated under presentclimate conditions and projected into the past climatic scenarios, as no topographic informa-tion for the past is available. For the same reason, output maps were not crossed with clay soillayers.
Results
Molecular studyDivergence age estimates. The Malvidae matrix is 1,667 pair of bases (bp) length with a
total of 1,106 variable characters of which 751 are potentially parsimony-informative. The Lepi-dium nuclear matrix is 493 bp length with a total of 300 variable characters of which 184 arepotentially parsimony-informative. The Lepidium plastid matrix is 668 bp length with a total of203 variable characters of which 66 are potentially parsimony-informative. The topology of theBEAST chronogram resulting from the Malvidae matrix (S2 Fig) is mostly congruent with theone obtained by Hernández-Hernández et al. (2013) [25] except for between-genera relationshipswithin the Bixa clade (S2 Fig). The age inferred for the three nodes selected as calibration pointsfor the second step are as follow (S2 Fig): (N1) 27.74 Mya—12.72 Mya for the early divergence ofLepidium, (N2) 19.42 Mya—6.36 Mya for the divergence between L. perfoliatum and Cardariadraba clade, and (N3) 15.12 Mya—3.79Mya between Cardaria draba and L. campestre.
The topology of the MCC tree obtained from the BEAST analysis of the Lepidium nuclearmatrix is mostly congruent with previous results based on ITS DNA region [26] displayingidentical or higher clade supports (S4A Fig). The MCC tree obtained from the analysis of theLepidium plastid matrix displays a large basal polytomy with few well-supported lineages (S4BFig). Despite the low resolution of the plastid phylogeny, two incongruences were visuallydetected when compared to the nuclear phylogeny (S4A vs. S4B Fig). In fact, results from theAU and BF tests reveal significant incongruence between the nuclear and plastid trees topolo-gies (S3 Table), preventing us from conducting a concatenated analysis. Therefore, the resultswill be discussed independently. Coronopus navasii constitutes a well-supported monophyleticspecies in the MCC tree obtained from Lepidium nuclear matrix (1.00 Posterior Probability,PP; Fig 3A and S4A Fig) sister to C. squamatus and C. violaceus (hereafter called ‘Mediterra-nean Coronopus clade’; 1.00 PP; Fig 3A and S4A Fig), as already reported by Mummenhoffet al. (2009) [26]. The MCC tree (S4A Fig) recovers 3.11 Mya (95% High Posterior DensityConfidence Interval (95% CI): 5.23–1.42 Mya, Fig 3A and S4A Fig) for the early divergence ofthe Mediterranean Coronopus clade. The crown age recovered for C. navasii is 0.50 Mya (95%CI: 1.45–0.03 Mya; Fig 3A and S4A Fig). The MCC tree obtained from Lepidium plastid matrix(S4B Fig) recovers 5.61 Mya (95% CI): 9.10–1.60 Mya, Fig 3A and S4B Fig) for early divergenceof the Mediterranean Coronopus clade. The divergence between the Sierra de Gádor and Sis-tema Ibérico disjunct areas is 3.74 for Mya (95% CI: 6.30–0.49 Mya; Fig 3A and S4B Fig).
Genetic variability of C. navasii. No sequence variation was detected among all individu-als of C. navasii for the two plastid regions trnS-trnG and trnL-trnF and the nuclear ITS. The
Biogeographic History of Coronopus navasii
PLOSONE | DOI:10.1371/journal.pone.0159484 July 27, 2016 11 / 23
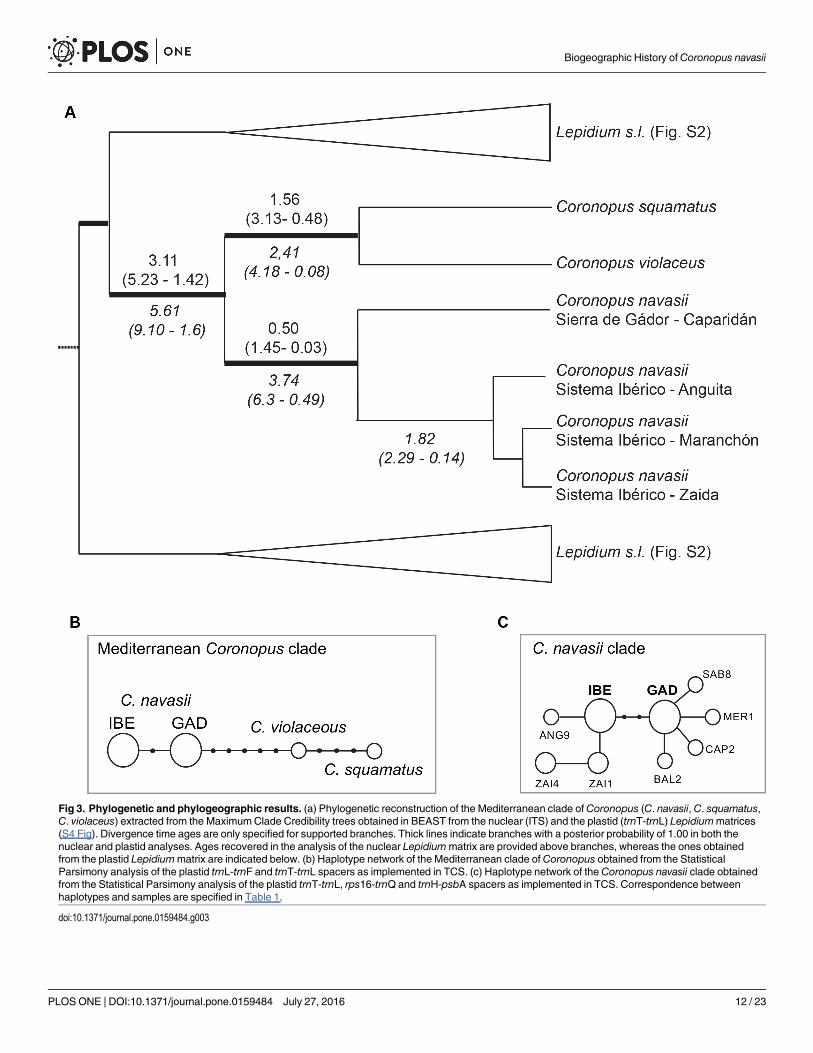
Fig 3. Phylogenetic and phylogeographic results. (a) Phylogenetic reconstruction of the Mediterranean clade ofCoronopus (C. navasii, C. squamatus,C. violaceus) extracted from the MaximumClade Credibility trees obtained in BEAST from the nuclear (ITS) and the plastid (trnT-trnL) Lepidiummatrices(S4 Fig). Divergence time ages are only specified for supported branches. Thick lines indicate branches with a posterior probability of 1.00 in both thenuclear and plastid analyses. Ages recovered in the analysis of the nuclear Lepidiummatrix are provided above branches, whereas the ones obtainedfrom the plastid Lepidiummatrix are indicated below. (b) Haplotype network of the Mediterranean clade of Coronopus obtained from the StatisticalParsimony analysis of the plastid trnL-trnF and trnT-trnL spacers as implemented in TCS. (c) Haplotype network of the Coronopus navasii clade obtainedfrom the Statistical Parsimony analysis of the plastid trnT-trnL, rps16-trnQ and trnH-psbA spacers as implemented in TCS. Correspondence betweenhaplotypes and samples are specified in Table 1.
doi:10.1371/journal.pone.0159484.g003
Biogeographic History of Coronopus navasii
PLOSONE | DOI:10.1371/journal.pone.0159484 July 27, 2016 12 / 23
sequence variation of the remaining three plastid regions is as follows: two variable and poten-tially informative sites in the trnT-trnL region, two variable and potentially informative sites inrps16-trnQ and one variable and potentially informative site in trnH-psbA. All the 24 individu-als from Sierra de Gádor display identical sequences for the three DNA regions in terms ofnucleotide substitutions. Only individual 8 from Sabinar pond displays a nucleotide substitu-tion in the trnH-psbA region. Four 1-pair base indels were detected within Sierra de Gádor,each of them exclusive to one individual in each population. The Sistema Ibérico populationsexhibit more variability than Sierra de Gádor in terms of nucleotide substitutions. Six individu-als (individuals 1, 2, 4, 6, 7, 10) in the Zaida population display one nucleotide substitution inrps16-trnQ region, and three of these six individuals display a further substitution in trnH-psbA region. An additional indel is detected in one individual of the Anguita population (indi-vidual 9). Individuals from Sierra de Gádor differ from those of Sistema Ibérico in three nucleo-tide substitutions.
Haplotype networks. The statistical parsimony analysis of the Mediterranean Coronopusclade matrix reveals a single substitution-based haplotype network with no loop (Fig 3B). Thir-teen haplotypes are recovered, four detected within the dataset and nine missing needed toconnect the detected haplotypes. Two geographically well-defined haplotypes are detectedwithin C. navasii connected through one missing haplotype (Fig 3B). Two haplotypes aredetected within the sister-group congruent with the two species included (C. squamatus and C.violaceous) and connected through three missing haplotypes. The remaining five missing hap-lotypes connect the Gádor haplotype of C. navasii to the North African C. violaceous (Fig 3B).
The statistical parsimony analysis of the C. navasiimatrix recovers a single haplotype net-work with nine haplotypes found within the C. navasii dataset and two missing haplotypes (Fig3C, Table 1). Nineteen of the 24 individuals from Sierra de Gádor share the same internal hap-lotype (GAD) while the remaining four, one from each population, display a different tip hap-lotype (BAL2, CAP2, MER1, SAB8, Table 1). Twenty individuals of the Sistema Ibérico sharethe same internal haplotype (IBE). Two additional haplotypes are detected in the Zaida popu-lation (ZAI1, ZAI4), shared by three individuals each and individual 9 from the Anguita popu-lation displays a different haplotype based on a single-base indel (ANG9). Two missinghaplotypes connect the widespread Sierra de Gádor haplotype (GAD) with the widespread IBEhaplotype from the Sistema Ibérico (Fig 3C).
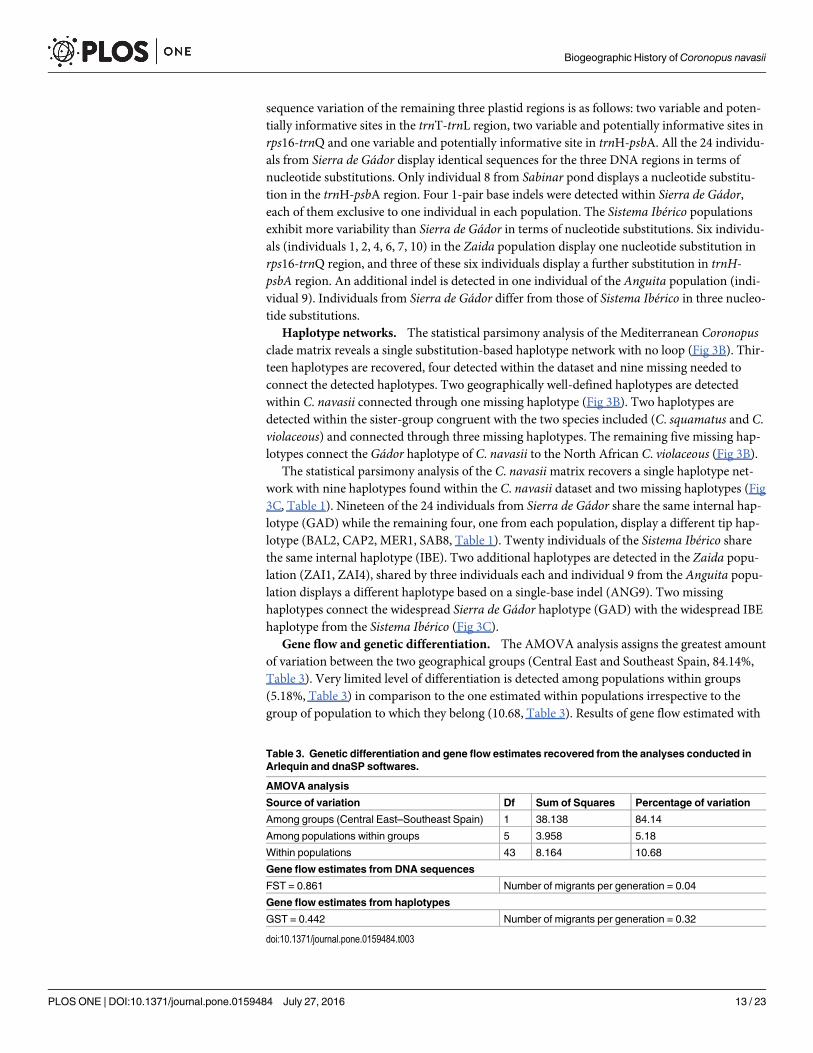
Gene flow and genetic differentiation. The AMOVA analysis assigns the greatest amountof variation between the two geographical groups (Central East and Southeast Spain, 84.14%,Table 3). Very limited level of differentiation is detected among populations within groups(5.18%, Table 3) in comparison to the one estimated within populations irrespective to thegroup of population to which they belong (10.68, Table 3). Results of gene flow estimated with
Table 3. Genetic differentiation and gene flow estimates recovered from the analyses conducted inArlequin and dnaSP softwares.
AMOVA analysis
Source of variation Df Sum of Squares Percentage of variation
Among groups (Central East–Southeast Spain) 1 38.138 84.14
Among populations within groups 5 3.958 5.18
Within populations 43 8.164 10.68
Gene flow estimates from DNA sequences
FST = 0.861 Number of migrants per generation = 0.04
Gene flow estimates from haplotypes
GST = 0.442 Number of migrants per generation = 0.32
doi:10.1371/journal.pone.0159484.t003
Biogeographic History of Coronopus navasii
PLOSONE | DOI:10.1371/journal.pone.0159484 July 27, 2016 13 / 23
dnaSP are consistent with the degree of genetic isolation inferred from AMOVA results. Geneflow estimation shows a very high genetic differentiation between groups (FST = 0.861) and alow number of migrants per generation (Nm = 0.04). Similarly, GST values are also high(GST = 0.442, Nm = 0.32), also supporting a high level of isolation.
Species distribution modelingThe six applied algorithms perform similarly with only marginal significant differencesbetween models (S4 Table). The minimum mean score obtained is 0.8155 in the ANNmodel.The presence-absence threshold for the ensemble model maximizes AUC (0.92) at a probabil-ity value of 0.55. The predictor importance according to each model is variable between models(Table 2). In general, models allocate more importance to temperature variables or to theirinteractions with precipitation. For instance, GLM concedes greater importance to annualmean temperature and mean temperature in the driest quarter together with topographic expo-sure, and much less relevance to hydric constraints. Annual precipitation is in general lessrelevant.
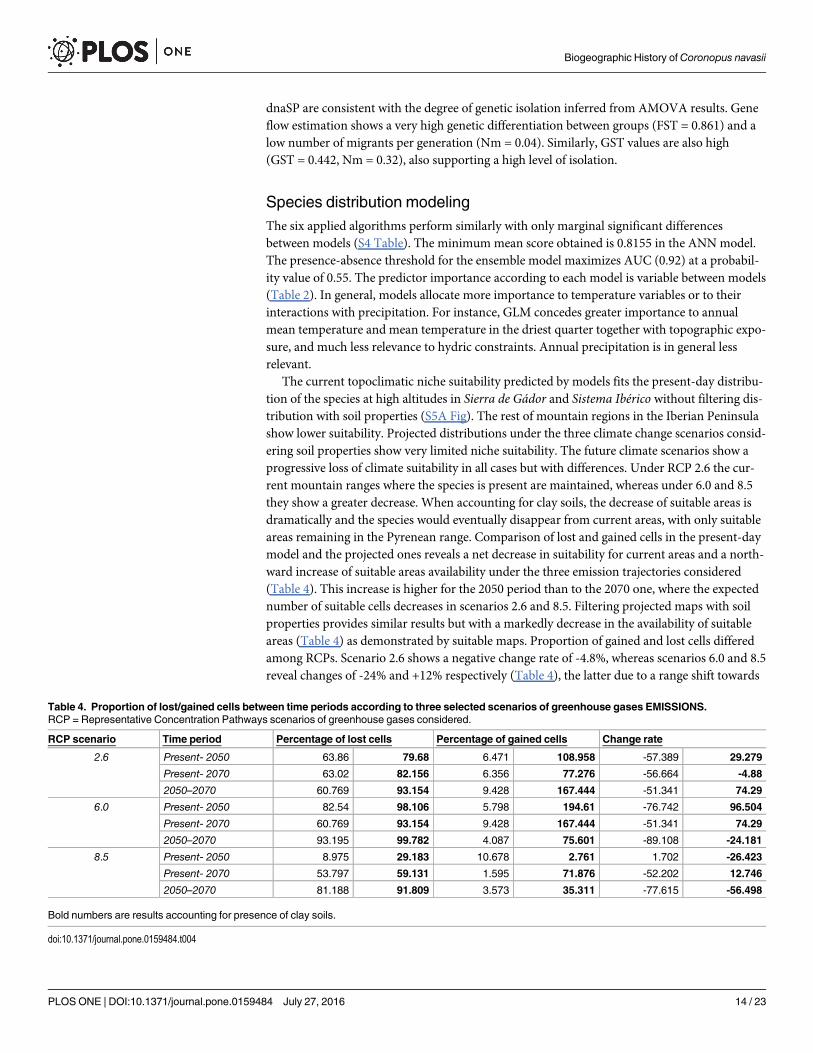
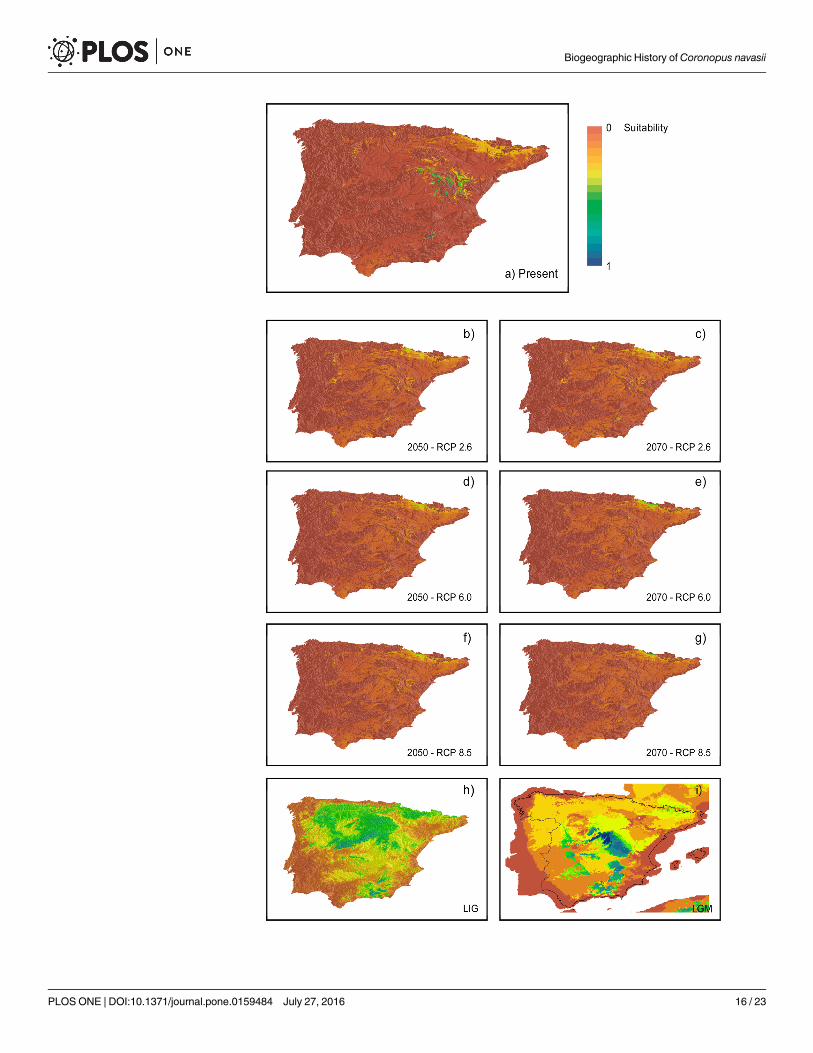
The current topoclimatic niche suitability predicted by models fits the present-day distribu-tion of the species at high altitudes in Sierra de Gádor and Sistema Ibérico without filtering dis-tribution with soil properties (S5A Fig). The rest of mountain regions in the Iberian Peninsulashow lower suitability. Projected distributions under the three climate change scenarios consid-ering soil properties show very limited niche suitability. The future climate scenarios show aprogressive loss of climate suitability in all cases but with differences. Under RCP 2.6 the cur-rent mountain ranges where the species is present are maintained, whereas under 6.0 and 8.5they show a greater decrease. When accounting for clay soils, the decrease of suitable areas isdramatically and the species would eventually disappear from current areas, with only suitableareas remaining in the Pyrenean range. Comparison of lost and gained cells in the present-daymodel and the projected ones reveals a net decrease in suitability for current areas and a north-ward increase of suitable areas availability under the three emission trajectories considered(Table 4). This increase is higher for the 2050 period than to the 2070 one, where the expectednumber of suitable cells decreases in scenarios 2.6 and 8.5. Filtering projected maps with soilproperties provides similar results but with a markedly decrease in the availability of suitableareas (Table 4) as demonstrated by suitable maps. Proportion of gained and lost cells differedamong RCPs. Scenario 2.6 shows a negative change rate of -4.8%, whereas scenarios 6.0 and 8.5reveal changes of -24% and +12% respectively (Table 4), the latter due to a range shift towards
Table 4. Proportion of lost/gained cells between time periods according to three selected scenarios of greenhouse gases EMISSIONS.RCP = Representative Concentration Pathways scenarios of greenhouse gases considered.
RCP scenario Time period Percentage of lost cells Percentage of gained cells Change rate
2.6 Present- 2050 63.86 79.68 6.471 108.958 -57.389 29.279
Present- 2070 63.02 82.156 6.356 77.276 -56.664 -4.88
2050–2070 60.769 93.154 9.428 167.444 -51.341 74.29
6.0 Present- 2050 82.54 98.106 5.798 194.61 -76.742 96.504
Present- 2070 60.769 93.154 9.428 167.444 -51.341 74.29
2050–2070 93.195 99.782 4.087 75.601 -89.108 -24.181
8.5 Present- 2050 8.975 29.183 10.678 2.761 1.702 -26.423
Present- 2070 53.797 59.131 1.595 71.876 -52.202 12.746
2050–2070 81.188 91.809 3.573 35.311 -77.615 -56.498
Bold numbers are results accounting for presence of clay soils.
doi:10.1371/journal.pone.0159484.t004
Biogeographic History of Coronopus navasii
PLOSONE | DOI:10.1371/journal.pone.0159484 July 27, 2016 14 / 23
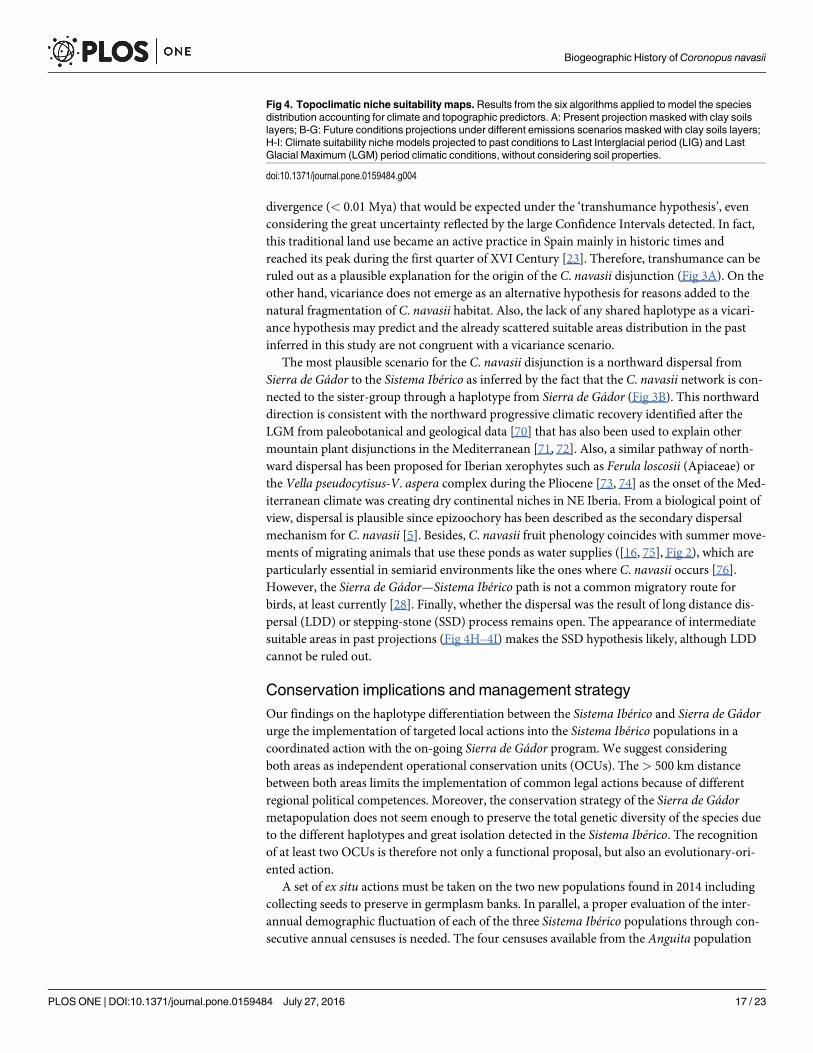
the Pyrenees. Regarding past climate suitability, the LIG projection shows a wide distribution ofavailable climatic niche including large but discontinuous area between Sistema Ibérico and Sierrade Gádor (Fig 4H). Conversely, the projection to the LGM period shows less suitable climaticareas in lower altitudes when compared to current predicted potential distribution (Fig 4I).
DiscussionThe pre-Holocene context estimated for the divergence between Sistema Ibérico and Sierra deGádor allows us rejecting the human-mediated ‘transhumance hypothesis’ for the origin of theC. navasii disjunction (Fig 3A). A long-term isolation and the need to consider at least twoindependently evolving (and conservation) units are suggested by (1) the haplotype differentia-tion between Sistema Ibérico and Sierra de Gádor without any detected shared haplotype andtwo missing haplotypes connecting the two disjunct areas (Fig 3B), and (2) the great geneticdifferentiation and low gene flow suggested by molecular estimates (Table 3) Future climatechange models do not predict a decrease of suitable areas but a severe shift in their location(Fig 4B–4G and S5B–S5G Fig) that may require the species migration to survive. This coupledwith the rarity of the species habitat and the intrinsic constraints superimposed by the naturalfragmentation of this habitat might compromise its long-term survival. These reasons force theimperative implementation of new actions in the Sistema Ibérico populations in order to con-template the whole genetic variability of this species and properly address the above-mentionedchallenges faced.
Pre-Holocene dispersal for Coronopus navasii disjunctionThe confirmed phylogenetic placement of C. navasii as sister to the Mediterranean species C.squamatus and C. violaceus [26] reflects an interesting biogeographic and environmental con-gruence (Fig 3A). Both the North African C. violaceous and the Iberian C. navasii are hemi-cryptophytes and restricted endemics to temporary ponds at medium to high altitudes [65].However, C. violaceus is more closely related to the annual and widely distributed C. squamatusthan to the alike C. navasii. Coronopus squamatus inhabits ruderal, open and xeric disturbedhabitats up to 1,200 m.a.s.l. across the Mediterranean Basin and C European areas [66, 67].The terminal placement of this widespread species could be interpreted as the acquisition ofkey innovation features (annuality and low environmental requirements) that may haveincreased chances of dispersal and population establishment success [66, 67]. The bio-geographical scenario under this hypothesis implies a geographically confined ancestor for theMediterranean clade of Coronopus with the range expansion occurring along the branch of C.squamatus. An alternative but less plausible explanation is that annuality and low environmen-tal requirements were ancestral in the clade, being hemicryptophyte habit and high habitatspecificity acquired independently both in the Iberian Peninsula (C. navasii) and North Africa(C. violaceus). This evolutionary path would resemble the general tendency observed amongthe California flora, where endemic specialists of 'vernal pools' are derived from 'terrestrialantecessors', although in these cases acquisition of annuality is linked to the ‘vernal pool’ spe-cialists [68, 69]. Under this hypothesis a widespread ancestor of the Mediterranean clade ofCoronopus would be expected. To address these questions with certainty, a comprehensivesample embracing the whole C. squamatus distribution and the inclusion of the fourth Medi-terranean species of Coronopus (C. lepidioides (Coss. & Durieu) Kuntze, North Africa) areneeded together with a comparative study of the phylogenetic signal of traits related to dis-persal capacity.
The Miocene-Pleistocene origin for the C. navasii internal divergence (6.30–0.49 Myaaccording to trnT-trnL and 1.45–0.03 Mya according to ITS; Fig 3A) does not fit the Holocene
Biogeographic History of Coronopus navasii
PLOSONE | DOI:10.1371/journal.pone.0159484 July 27, 2016 15 / 23
Biogeographic History of Coronopus navasii
PLOSONE | DOI:10.1371/journal.pone.0159484 July 27, 2016 16 / 23
divergence (< 0.01 Mya) that would be expected under the ‘transhumance hypothesis’, evenconsidering the great uncertainty reflected by the large Confidence Intervals detected. In fact,this traditional land use became an active practice in Spain mainly in historic times andreached its peak during the first quarter of XVI Century [23]. Therefore, transhumance can beruled out as a plausible explanation for the origin of the C. navasii disjunction (Fig 3A). On theother hand, vicariance does not emerge as an alternative hypothesis for reasons added to thenatural fragmentation of C. navasii habitat. Also, the lack of any shared haplotype as a vicari-ance hypothesis may predict and the already scattered suitable areas distribution in the pastinferred in this study are not congruent with a vicariance scenario.
The most plausible scenario for the C. navasii disjunction is a northward dispersal fromSierra de Gádor to the Sistema Ibérico as inferred by the fact that the C. navasii network is con-nected to the sister-group through a haplotype from Sierra de Gádor (Fig 3B). This northwarddirection is consistent with the northward progressive climatic recovery identified after theLGM from paleobotanical and geological data [70] that has also been used to explain othermountain plant disjunctions in the Mediterranean [71, 72]. Also, a similar pathway of north-ward dispersal has been proposed for Iberian xerophytes such as Ferula loscosii (Apiaceae) orthe Vella pseudocytisus-V. aspera complex during the Pliocene [73, 74] as the onset of the Med-iterranean climate was creating dry continental niches in NE Iberia. From a biological point ofview, dispersal is plausible since epizoochory has been described as the secondary dispersalmechanism for C. navasii [5]. Besides, C. navasii fruit phenology coincides with summer move-ments of migrating animals that use these ponds as water supplies ([16, 75], Fig 2), which areparticularly essential in semiarid environments like the ones where C. navasii occurs [76].However, the Sierra de Gádor—Sistema Ibérico path is not a common migratory route forbirds, at least currently [28]. Finally, whether the dispersal was the result of long distance dis-persal (LDD) or stepping-stone (SSD) process remains open. The appearance of intermediatesuitable areas in past projections (Fig 4H–4I) makes the SSD hypothesis likely, although LDDcannot be ruled out.
Conservation implications and management strategyOur findings on the haplotype differentiation between the Sistema Ibérico and Sierra de Gádorurge the implementation of targeted local actions into the Sistema Ibérico populations in acoordinated action with the on-going Sierra de Gádor program. We suggest consideringboth areas as independent operational conservation units (OCUs). The> 500 km distancebetween both areas limits the implementation of common legal actions because of differentregional political competences. Moreover, the conservation strategy of the Sierra de Gádormetapopulation does not seem enough to preserve the total genetic diversity of the species dueto the different haplotypes and great isolation detected in the Sistema Ibérico. The recognitionof at least two OCUs is therefore not only a functional proposal, but also an evolutionary-ori-ented action.
A set of ex situ actions must be taken on the two new populations found in 2014 includingcollecting seeds to preserve in germplasm banks. In parallel, a proper evaluation of the inter-annual demographic fluctuation of each of the three Sistema Ibérico populations through con-secutive annual censuses is needed. The four censuses available from the Anguita population
Fig 4. Topoclimatic niche suitability maps.Results from the six algorithms applied to model the speciesdistribution accounting for climate and topographic predictors. A: Present projection masked with clay soilslayers; B-G: Future conditions projections under different emissions scenarios masked with clay soils layers;H-I: Climate suitability niche models projected to past conditions to Last Interglacial period (LIG) and LastGlacial Maximum (LGM) period climatic conditions, without considering soil properties.
doi:10.1371/journal.pone.0159484.g004
Biogeographic History of Coronopus navasii
PLOSONE | DOI:10.1371/journal.pone.0159484 July 27, 2016 17 / 23
reveal significant oscillations in population size (<100 reproductive individuals in 2004 [16];ca. 800 in 2012 [28]; ca. 600 in 2014 and ca. 1000 in 2015). However, the limited number ofcensuses together with the eight years lasting between the first two makes any inference ratherspeculative. A targeted and effective sampling of suitable areas based on our niche modelingresults is recommended, given the occurrence of similar ponds in other places of the SistemaIbérico and surrounding areas.
Temporary ponds are waterholes subjected to extremely changing seasonal environmentalconditions that are particularly stressed in the area of study because of the inter-annual rainfallfluctuation superimposed by the unpredictable Mediterranean climate. The general importanceof environmental variables that niche models attribute to temperature, precipitation andtopography are consistent with this interpretation. Temperature variables scored higher thanprecipitation and topography across the majority of the models, suggesting that altitude, whichdetermines thermic conditions, can be a strong limiting factor for the species distribution. Thelower scores assigned to precipitation variables may be explained indeed by the mentionedhigher fluctuation in rainfall regimes, which lowers the explanatory ability of these constraints.Nevertheless, additional analyses at finer scales when spatial data are available would berequired to clarify the actual role of predictors. The application of a finer resolution is especiallyrelevant when local topography is an important constraint such as it is in the temporary pondsof C. navasii (e.g. [77]). Accounting for spatial autocorrelation would be important too becauseof the aggregated distribution of the individuals of C. navasii around the ponds. Our results onfuture projections confirm climate change as a likely driving force promoting extinction in C.navasii by: (1) accelerating local extinction and migration to higher altitudes or latitudes, and(2) altering the seasonal water system of the ponds where the species occurs due to the pre-dicted aridity and evapo-transpiration rates increase. Therefore, linking inter-annual climatevariability to demographic fluctuations might be critical to propose effective actions to face cli-mate change, since future projections predict northward shift in the species distribution cou-pled with a decrease in habitat suitability in current sites (Fig 4B–4G).
In addition to the demographic and genetic consequences derived from the annual andinter-annual environmental variation, C. navasii is constrained by the limited patch size andhabitat fragmentation that naturally characterized its habitat [78]. The higher levels of geneticvariation detected within populations (11%) than among populations (5%) is interpreted asevidence that both disjunct areas follow a metapopulation dynamics (Table 3). Description ofthe metapopulation dynamic in the Sistema Ibérico is key to determine the impact of localinter-annual demographic fluctuations to the overall system. Indeed, livestock have alreadybeen suggested as key factors to keep the metapopulation dynamics in Sierra de Gádor (Fig 2;[5]). Determining the actual impact of flock movements in C. navasii dispersal between localpopulations and new pond colonization rates would be interesting to design a sustainable man-agement of flock activity that ensures the long-term survival in both disjunct areas.
Mediterranean temporary ponds are isolated and uncommon habitats essential for migra-tory animals [75] that hold a high variety of rare endemic species. Only a few local studies onthe flora and vegetation of these ponds [21, 79] have been conducted to improve knowledgeand conservation information on plant biodiversity in these microhabitats [78, 80]. Thissharply contrasts with the large number of studies performed in other parts of the world on theflora of seasonal ponds in Mediterranean climates (Chile, Australia, California; [68]). Becauseof limited water availability in the Mediterranean climate, humans have traditionally usedthese ponds for agriculture, flock watering or domestic supply. The species living in theseponds and all the associated interaction networks depend on the hydrological annual cyclemaintenance. However, during last decades, drainage for extensive agriculture or non-con-trolled livestock watering is leading to a premature drying out of these ponds [81]. Artificial
Biogeographic History of Coronopus navasii
PLOSONE | DOI:10.1371/journal.pone.0159484 July 27, 2016 18 / 23
flooding of ponds during summer is also a common practice that has been reported as a nega-tive activity for the community survival [19, 82]. Considering individuals of C. navasii producetheir aerial parts as water drains, the maintenance of the annual water dynamics of the pond isessential. Artificial flooding leading to a permanent water level in ponds is therefore a harmfulpractice for C. navasii survival. However, controlled artificial flooding that ensures mainte-nance of the natural dynamics of water ponds would be a positive management practice sinceit will ensure the preservation of the species.
Supporting InformationS1 Fig. Coronopus navasii growing in the mud. A: detail of a reproductive individual inbloom (Sierra de Gádor); B: detail of the root and basal rosette (Sistema Ibérico).(TIF)
S2 Fig. Maximum Clade Credibility tree obtained from the Bayesian analysis implementedin BEAST of thematK plastid gene from 79 Malvidae sequences using Gerrardina (Huer-tales) and Tapiscia (Crossosomatales) as outgroup. Green circles highlight nodes selected ascalibration points for the Lepidum divergence age estimation. Nodes used as calibration points(red asterisks) in each analysis are numbered according to the text.(PDF)
S3 Fig. Histogram of the sum of squared deviation for each of the four fossil nodes whenused as single calibration point.(PDF)
S4 Fig. Maximum Clade Credibility tree obtained from the Bayesian analysis implementedin BEAST. Nodes used as calibration points (red asterisks) in each analysis are numberedaccording to the text. (a) Chronogram from the nrDNA ITS region of 106 samples of Lepidiums.l. plus Hornungia petraea as the outgroup. (b) Chronogram from the plastid trnT-trnL spacerof 106 samples of Lepidium s.l. plus Hornungia petraea as the outgroup.(PDF)
S5 Fig. Niche suitability maps resulting from the sixth algorithms applied to model the spe-cies distribution accounting only for climate and topographic predictors but not maskedwith clay soils layers. (a) Present projections. (f-g) Future conditions under different emissionsscenarios.(PDF)
S1 Table. List of the studied material of Lepidium s.l. used for the phylogenetic-based analy-ses.(DOCX)
S2 Table. List of the studied material of Malvidae used for the divergence age estimate.(DOCX)
S3 Table. Results from the Bayes Factor (BF) and Approximate Unbiased (AU) hypothesistest analyses. Bayes Factors for the competing hypotheses are provided. Difference in the Like-lihood between the competing hypotheses and the best topology as well as the p-valuesobtained from the AU test are given. Asterisks indicate evidence in favor to that hypothesis forthe BFs and not rejected hypotheses in the AU tests.(DOCX)
S4 Table. Mean ± SD of AUC scores for the six algorithms used in distribution models.(DOCX)
Biogeographic History of Coronopus navasii
PLOSONE | DOI:10.1371/journal.pone.0159484 July 27, 2016 19 / 23
AcknowledgmentsThe authors thank Carmen Rodríguez-Hiraldo and the Geodiversity and Biodiversity Serviceof Junta de Andalucía, the Aragonese Institute of Environmental Management (INAGA, Gov-ernment of Aragón) and the Department of Agriculture of the Government of Castilla-LaMancha for fieldwork permissions, Esteban Salmerón, Fabián Martínez and Juan Mota fortheir help with field sampling in Sierra de Gádor and highly valuable fieldwork assistance, theranger Angel Pardo and Julián García-Muñoz for their essential comments and help on thefieldwork carried out in Sistema Ibérico, and the staff of VAL and JACA herbaria for providingdried material, SEO/Birdlife for kindly supplying information about the Spanish ringing data-base, Juan Mota for his useful inputs on an earlier version of the manuscript, Omar Fiz-Pala-cios for advice on divergence age estimates, Klaus Mummenhoff for kindly providing LepidiumDNAmatrices, Javier Fuertes and lab-technician staff of the Real Jardín Botánico de Madridfor lab help, and Juli Caujapé and Ruth Jaén for their suggestions on sampling regions andfacilitating the primers. We also thank Nick Jensen for checking and correcting the English inthis article.
Author ContributionsConceived and designed the experiments: SMH AGF JCMS VV. Performed the experiments:SMH AGF JCMS VV. Analyzed the data: SMH AGF JCMS VV. Contributed reagents/materi-als/analysis tools: SMH AGF JCMS VV. Wrote the paper: SMH AGF JCMS VV.
References1. Caro T, O’Doherty G. On the use of surrogate species in conservation biology. Conserv Biol. 1999; 13:
805–814.
2. Clucas B, McHugh K, Caro T. Flagship species on covers of US conservation and nature magazines.Biodivers Conserv. 2008; 17: 1517–1528.
3. Clark TW, Crete R, Cada J. Designing and managing successful endangered species recovery pro-grams. J Environ Manage. 1989; 13: 159–170.
4. Gómez-Campo C, Malato-Beliz J. The Iberian Peninsula. In: Gómez-Campo C, editors. Plant Conser-vation in the Mediterranean Area, Dr. W. Junk Publishers, Dordrecht; 1985. pp. 47–70.
5. Mota JF, Aguilera AM, Garrido JA, Giménez-Luque E, Jiménez-Sánchez ML, Pérez-García FJ et al.Coronopus navasii Pau. In: Bañares Á, Blanca G, Güemes J, Moreno JC, Ortiz S, editors. Atlas y LibroRojo de la Flora Vascular Amenazada de España. Dirección General de Conservación de la Natura-leza, Madrid; 2003. pp. 204–205.
6. Vivero JL, Hernández-Bermejo J, Prados J.Coronopus navasii Pau. In: Blanca G, Cabezudo B, Her-nández Bermejo JE, Herrera CM, Molero Mesa J, Muñoz J et al., editors. Libro Rojo de la Flora Silves-tre Amenazada de Andalucía. Tomo I: Especies en Peligro de Extinción. Consejería de MedioAmbiente, Junta de Andalucía, Sevilla; 1999. pp. 90–93.
7. Rabinowitz D. Seven forms of rarity. In: Synge H, editors. The Biological Aspects of Rare Plant Conser-vation. JohnWiley and Sons, Chichester; 1981. pp. 205–217.
8. Moreno-Saiz JC, coord. Lista Roja 2008 de la flora vascular española. Ministerio de Medio Ambiente,Medio Rural y Marino–Sociedad Española de Biología de la Conservación de Plantas, Madrid; 2008.
9. Schemske DW, Husband BC, Ruckelshaus MH, Goodwillie C, Parker IM, Bishop JG. Evaluatingapproaches to the conservation of rare and endangered plants. Ecol. 1994; 75: 584–606.
10. Cabezudo B, Talavera S, Blanca G, Salazar C, Cueto M, Valdés B et al. Lista Roja de la flora vascularde Andalucía. Junta de Andalucía, Sevilla; 2005.
11. MARM, Ministerio de Medio Ambiente, Medio Rural y Marino. Real Decreto 139/2011, de 4 de febrero,para el desarrollo del Listado de Especies Silvestres en Régimen de Protección Especial y del Catá-logo Español de Especies Amenazadas; 2011. BOE 46: 20912–20951.
12. CE, Council of Europe. Convention on the Conservation of EuropeanWildlife and Natural Habitats,Bern; 1979.
13. EC, European Commission. Council Directive 92/43/EEC on the Conservation of Natural Habitats andof Wild Fauna and Flora, Brussels; 1992.
Biogeographic History of Coronopus navasii
PLOSONE | DOI:10.1371/journal.pone.0159484 July 27, 2016 20 / 23
14. Iriondo JM, De Hond LJ, Gómez-Campo C. Current research on the biology of threatened plant speciesof the Mediterranean Basin and Macaronesia: a database. Bocconea. 1994; 4: 403–407.
15. Sainz-Ollero H, Hernández-Bermejo JE. Experimental reintroductions of endangered plant species intheir natural habitats in Spain. Biol Conserv. 1979; 16: 195–206.
16. López-Jiménez N, García-Muñoz J.Coronopus navasii Pau (Brassicaceae) en el noroeste de Guadala-jara (España). Conservación Vegetal. 2006; 10: 13–15.
17. Melendo M, Giménez-Luque E, Cano E, Gómez-Mercado F, Valle F. The endemic flora in the south ofthe Iberian Peninsula: taxonomic composition, biological spectrum, pollination, reproductive mode anddispersal. Flora. 2003; 198: 260–276.
18. Pardo Gracia A, López Udías S, Fabregat Llueca, C, Gómez-García D. Coronopus navasii Pau (Brassi-caceae) novedad para la flora de Aragón. Flora Montiberica. 2014; 58: 103–108.
19. Zaccharias I, Zamparas M. Mediterranean temporary ponds. A disappearing ecosystem. BiodiversConserv. 2010; 19: 3827–3834.
20. Gómez-Mercado F, Giménez-Luque E. Análisis comparativo de la endemoflora de la Sierra de Gádor.Studia Botánica. 1998; 17: 53–68.
21. Giménez-Luque E, Delgado IC, Gómez-Mercado F. Comunidades vegetales de las balsas de la Sierrade Gádor (Almería). Lazaroa. 2006; 27: 79–88.
22. Valbuena-Carabaña M, López de Heredia U, Fuentes-Utrilla P, González-Doncel I, Gil L. Historical andrecent changes in the Spanish forests: A socio-economic process. Rev Palaeobot Palynol. 2010; 162:492–506.
23. Ruiz M, Ruiz JP. Ecological history of transhumance in Spain. Biol Conserv. 1986; 37: 73–86.
24. Manzano P, Malo JE. Extreme long-distance seed dispersal via sheep. Front Ecol Environ. 2006; 4:244–248.
25. Hernández-Hernández T, ColoradoWB, Sosa V. Molecular evidence for the origin and evolutionaryhistory of the rare American desert monotypic family Setchellanthaceae. Org Divers Evol. 2013; 13:485–496.
26. Mummenhoff K, Polster A, Muhlhausen A, Theiben G. Lepidium as a model system for studying theevolution of fruit development in Brassicaceae. J Exp Bot. 2009; 60: 1503–1513. doi: 10.1093/jxb/ern304 PMID: 19052256
27. CAA, Comunidad Autónoma de Andalucía. Acuerdo de 13 de marzo de 2012, del Consejo deGobierno, por el que se aprueban los planes de recuperación y conservación de determinadas espe-cies silvestres y hábitats protegidos. BOJA. 2012; 60: 164–172.
28. Martín-Hernanz S, González A, Moreno JC, Valcárcel V. Reevaluación de la estrategia de conserva-ción deCoronopus navasii. Conservación Vegetal. 2014; 18: 13–15.
29. Hamilton MB. Four primer pairs for the amplification of chloroplast intergenic regions with intraspecificvariation. Mol ecol. Primer Notes. 1999; 8: 513–525.
30. Shaw J, Lickey EB, Beck JT, Farmer SB, Liu W, Miller J, Siripun KC, Winder CT, Schilling EE, SmallRL. The tortoise and the hare II: relative utility of 21 noncoding chloroplast DNA sequences for phyloge-netic analysis. Am J Bot. 2005; 92: 142–166. doi: 10.3732/ajb.92.1.142 PMID: 21652394
31. Taberlet P, Gielly L, Pautou G, Bouvet J. Universal primers for amplification of three non-coding regionsof chloroplast DNA. Plant Mol Biol. 1991; 17: 1105–1109. PMID: 1932684
32. Shaw J, Lickey EB, Schilling EE, Small RL. Comparison of whole chloroplast genome sequences tochoose noncoding regions for phylogenetic studies in angiosperms: the tortoise and the hare III. Am JBot. 2007; 94: 275288.
33. Little DP, Schwarzbach AE, Adams RP, Hsieh CF. The circumscription and phylogenetic relationshipsof Callitropsis and the newly described genus Xanthocyparis (Cupressaceae). Am J Bot. 2004; 91:1872–1881. doi: 10.3732/ajb.91.11.1872 PMID: 21652334
34. Kearse M, Moir R, Wilson A, Stones-Havas S, Cheung M, Sturrock S, et al. Geneious Basic: an inte-grated and extendable desktop software platform for the organization and analysis of sequence data.Bioinform. 2012; 28 (12): 1647–1649. Available: http://www.geneious.com/. Accessed 2015.
35. Edgar RC. MUSCLE: multiple sequence alignment with high accuracy and high throughput. NucleicAcids Res. 2004; 32: 1792–1979. PMID: 15034147
36. Oyama RK, Clauss MJ, Formanova N, Kroymann J, Schmid KJ, Vogel H et al. The shrunken genomeof Arabidopsis thaliana. Plant Syst Evol. 2008; 273: 257–271.
37. Burgess KS, Fazekas AL, Kesanakurti PR, Graham SW, Husband BC et al. Discriminating plant spe-cies in a local temperate flora using the rbcL+matK DNA barcode. Methods Ecol Evol. 2011; 2: 333–340.
Biogeographic History of Coronopus navasii
PLOSONE | DOI:10.1371/journal.pone.0159484 July 27, 2016 21 / 23
38. Li DZ, Gao LM, Li HT, Wang H, Ge XJ, Liu JQ et al. Comparative analysis of a large dataset indicatesthat internal transcribed spacer (ITS) should be incorporated into the core barcode for seed plants.Proc Natl Acad Sci U S A. 2011; 108: 19641–19646. doi: 10.1073/pnas.1104551108 PMID: 22100737
39. de Vere N, Rich TCG, Ford CR, Trinder SA, Long C, Moore CM et al. DNA Barcoding the Native Flower-ing Plants and Conifers of Wales. PLoS ONE. 2012; 7: e37945. doi: 10.1371/journal.pone.0037945PMID: 22701588
40. Drummond AJ, Suchard MA, Xie D & Rambaut A. Bayesian phylogenetics with BEAUti and the BEAST1.7. Mol Biol Evol. 2012; 29: 1969–1973. Available: http://tree.bio.ed.ac.uk/software/beast/. Accessed2015. doi: 10.1093/molbev/mss075 PMID: 22367748
41. Posada D. JModelTest: phylogenetic model averaging. Mol Biol Evol. 2008; 25: 1253–1256. doi: 10.1093/molbev/msn083 PMID: 18397919
42. Gandolfo MA, Nixon KC, Crepet WL. A new fossil flower from the Turonian of New Jersey: DressianthabicarpellataGen. Et Sp. Nov. (Capparales). Am J Bot. 1998; 85: 964–974. PMID: 21684980
43. Beilstein MA, Nagalingum NS, Clements MD, Manchester SR, Mathews S. Dated molecular phyloge-netics indicate a Miocene origin for Arabidopsis thaliana. Proc Natl Acad Sci U S A. 2010; 107: 18724–18728. doi: 10.1073/pnas.0909766107 PMID: 20921408
44. Becker HF. Oligocene plants from the upper Ruby River Basin, southwestern Montana. GeologicalSociety of America Memoir. 1961; 82: 1–127.
45. Selmeier A. Capparidoxylon holleisii nov. spec., a silicifiedCapparis (Capparaceae) wood with insectcoprolites from the Neogene of southern Germany. Zitteliana. 2005; 45: 199–209.
46. Near TJ, Meylan PA, Shaffer HB. Assessing concordance of fossil calibration points in molecular clockstudies: An example using Turtles. Am Nat. 2005; 165: 137–146. PMID: 15729646
47. Rambaut A, Drummond AJ. Tracer v1.4. 2007. Available: http://beast.bio.ed.ac.uk/Tracer. Accessed2012.
48. Shimodaira H. An approximately unbiased test of phylogenetic tree selection. Syst Biol. 2002; 51:492–508. PMID: 12079646
49. Jobb G, Haeseler Av, Strimmer K. TREEFINDER: a powerful graphical analysis environment for molec-ular phylogenetics. BMC Evol Biol. 2004; 4: 18. PMID: 15222900
50. Kass RE, Raferty AE. Bayes factors. J Am Stat Assoc. 1995; 90: 773–795.
51. Suchard MA, Weiss RE, Sinsheimer JS. Bayesian selection of continuous-time Markov Chain evolu-tionary models. Mol Biol Evol. 2001; 18: 1001–1013. PMID: 11371589
52. Xie W, Lewis PO, Fan Y, Kuo L, ChenMH. Improving marginal likelihood estimation for Bayesian phylo-genteic model selection. Syst Biol. 2011; 60: 150–160. doi: 10.1093/sysbio/syq085 PMID: 21187451
53. Bergsten J, Nilsson AN, Ronquist F. Bayesian test topology hypotheses with an example from DivingBeetles. Syst Biol. 2013; 62: 660–673. doi: 10.1093/sysbio/syt029 PMID: 23628960
54. Templeton AR, Crandall KA, Sing SF. A cladistic analysis of the phenotypic associations with haplo-types inferred from restriction endonuclease mapping and DNA sequence data. III. Cladogram estima-tion. Genetics. 1992; 132: 619–633. PMID: 1385266
55. Clement M, Posada D, Crandall KA. TCS: a computer program to estimate gene genealogies. MolEcol. 2000; 9: 1657–1660. PMID: 11050560
56. Excoffier L, Laval G, Schneider S. Arlequin (version 3.0): An integrated software package for populationgenetics data analysis. Evolutionary Informatics Online. 2005. 1, 47–50.
57. Hudson RR, Slatkin M, Maddison P. Estimation of Levels of Gene Flow from DNA Sequence Data.Genetics. 1992; 132: 583–589 PMID: 1427045
58. Hijmans RJ, Cameron SE, Parra JL, Jones PG, Jarvis A. Very high resolution interpolated climate sur-faces for global land areas. Int J Climatol. 2005; 25: 1965–1978.
59. ESRI. ArcGIS 9.3. 2008
60. IPCC: Stocker TF, Qin D, Plattner GK, Tignor M, Allen SK, Boschung J et al. Climate Change 2013:The Physical Science Basis. Contribution of Working Group I to the Fifth Assessment Report of theIntergovernmental Panel on Climate Change. Cambridge University Press, Cambridge, United King-dom and New York; 2013.
61. Thuiller W, Lafourcade B, Engler R, Araújo MB. BIOMOD–A platform for ensemble forecasting of spe-cies distributions. Ecography. 2009; 32: 369–373.
62. R Development Core Team. R: A Language and Environment for Statistical Computing. Vienna, Aus-tria: the R Foundation for Statistical Computing. ISBN: 3-900051-07-0. 2011. Available: http://www.R-project.org/. Accessed 2014.
63. Chevan A, Sutherland M. Hierarchical Partitioning. Am Stat. 2011; 45: 90–96.
Biogeographic History of Coronopus navasii
PLOSONE | DOI:10.1371/journal.pone.0159484 July 27, 2016 22 / 23
64. Walsh C, Mac Nally R. The hier.part Package: Hierarchical Partitioning. (Part of: Documentation for R:A language and environment for statistical computing.) R Foundation for Statistical Computing,Vienna, Austria; 2003.
65. Rhazi L, Grillas P, Rhazi M. Lepidium violaceum. The IUCN Red List of Threatened Species; 2010.Available: http://www.iucnredlist.org. Accessed 2014.
66. Morales R. Coronopus Zinn. En: Castroviejo S., editors. Flora iberica. Volumen IV, Cruciferae-Monotro-paceae. Real Jardín Botánico, CSIC, Madrid; 2993. pp. 331–333.
67. Radulovic N, Zlatkovic B, Skropeta D, Palic R. Chemotaxonomy of the peppergrass Lepidium corono-pus (L.) Al-Shehbaz (syn. Coronopus squamatus) based on its volatile glucosinolate autolysis prod-ucts. Biochem Syst Ecol. 2008; 36: 807–811.
68. Keeley JE, Zedler PH. Characterization and global distribution of vernal pools. In Ecology, Conserva-tion, and Management of Vernal Pool Ecosystems. Witham CW, Bauder ET, Belk D, FerrenWR, Orn-duff R, editors. California Native Plant Society ( Sacramento, CA, USA); 1998. pp. 1–14.
69. Zedler PH. Vernal pools and the concept of “isolated wetlands”. Wetlands. 2003; 23: 597–607
70. Tichy G, Tomek C, Hsü KJ, Hofrichter S. Geologie und Entstehungsgeschichte. In: Hofrichter S, edi-tors. Das Mittelmeer: Fauna, Flora, Ökologie, Band 1, Allgemeiner Teil. Heidelberg, Germany: Spek-trum Akademischer Verlag. 2001; 56–101.
71. Kropf M, Comes HP, Kadereit JW. Long-distance dispersal vs. vicariance: the origin and genetic diver-sity of alpine plants in the Spanish Sierra Nevada. New Phytol. 2006; 172: 169–184. PMID: 16945099
72. Alarcón M, Vargas P, Sáez Ll, Molero J, Aldasoro JJ. Genetic diversity of mountain plants: two migra-tion episodes of Mediterranean Erodium (Geraniaceae). Mol Phylogenet Evol. 2012; 63: 866–876. doi:10.1016/j.ympev.2012.02.031 PMID: 22445449
73. Pérez-Collazos E, Sánchez-Gómez P, Jiménez JF, Catalán P. The phylogeographical history of theIberian steppe plant Ferula loscosii (Apiaceae): a test of the abundant-centre hypothesis. Mol Ecol.2009; 18: 848–861. doi: 10.1111/j.1365-294X.2008.04060.x PMID: 19207254
74. Simón-Porcar V, Pérez-Collazos E, Catalán P. Phylogeny and systematics of the western Mediterra-nean Vella pseudocytisus-V. aspera complex (Brassicaceae). Turk J Botany. 2015; 39: 472–486.
75. Céréghino R, Biggs J, Oertli B, Declerck S. The ecology of European ponds: defining the characteristicsof a neglected freshwater habitat. Hydrobiologia. 2008; 597: 1–6.
76. Alados CL, Puigdefábregas J, Martínez-Fernández J. Ecological and socio-economical thresholds ofland and plant-community degradation in semi-arid Mediterranean areas of southeastern Spain. J AridEnviron. 2011; 75: 1368–1376.
77. Slavich E, Warton DI, Ashcroft MB, Gollan JR, Ramp D. Topoclimate versus macroclimate: how doesclimate mapping methodology affect species distribution models and climate change projections?Divers Distrib. 2014; 20: 952–963.
78. Kirchner F, Ferdy JB, Andalo C. Role of corridors in plant dispersal: An example with the endangeredRanunculus nodiflorus. Conserv Biol. 2003; 17: 401–410.
79. Cirujano S, Medina L. Plantas acuáticas de las lagunas y humedales de Castilla-La Mancha. CSIC—Junta de Comunidades de Castilla-La Mancha, Madrid; 2002.
80. Fraga-Arguimbau P. International conference on Mediterranean temporary ponds: proceedings &abstracts, Menorca, 5–8 May. Col�lecció recerca, 14. Institut Menorqui d'Estudis, Maó; 2009.
81. Brendonck L, WilliamsW. Biodiversity in wetlands of dry regions (drylands). In Biodiversity in wetlands:assessment, function and conservation edition 1. Gopal B, JunkW, Davis J, editors. Backhuys Pub-lishers ( Leiden, The Netherlands); 2000. pp. 181–194.
82. Warwick NWM, Brock MA. Plant reproduction in temporary wetlands: the effects of seasonal timing,depth, and duration of flooding. Aquat Bot. 2003; 77: 153–167.
Biogeographic History of Coronopus navasii
PLOSONE | DOI:10.1371/journal.pone.0159484 July 27, 2016 23 / 23