Embed Size (px)
Citation preview
PRE-PRINT. FINAL VERSION IN IEEE TRANSACTIONS ON GEOSCIENCE AND REMOTE SENSING 1
RSVQA: Visual Question Answering for RemoteSensing Data
Sylvain Lobry, Member, IEEE, Diego Marcos, Jesse Murray, Devis Tuia, Senior Member, IEEE
This is the pre-acceptance version, to read the final version pub-lished in the journal IEEE Transactions on Geoscience and RemoteSensing, please go to: https://doi.org/10.1109/TGRS.2020.2988782.
Abstract—This paper introduces the task of visual questionanswering for remote sensing data (RSVQA). Remote sensingimages contain a wealth of information which can be usefulfor a wide range of tasks including land cover classification,object counting or detection. However, most of the availablemethodologies are task-specific, thus inhibiting generic and easyaccess to the information contained in remote sensing data. Asa consequence, accurate remote sensing product generation stillrequires expert knowledge. With RSVQA, we propose a system toextract information from remote sensing data that is accessible toevery user: we use questions formulated in natural language anduse them to interact with the images. With the system, imagescan be queried to obtain high level information specific to theimage content or relational dependencies between objects visiblein the images. Using an automatic method introduced in thisarticle, we built two datasets (using low and high resolution data)of image/question/answer triplets. The information required tobuild the questions and answers is queried from OpenStreetMap(OSM). The datasets can be used to train (when using supervisedmethods) and evaluate models to solve the RSVQA task. Wereport the results obtained by applying a model based onConvolutional Neural Networks (CNNs) for the visual part and ona Recurrent Neural Network (RNN) for the natural language partto this task. The model is trained on the two datasets, yieldingpromising results in both cases.
Index Terms—Visual Question Answering, Deep learning,Dataset, Natural Language, Convolution Neural Networks, Re-current Neural Networks, Very High Resolution, OpenStreetMap
I. INTRODUCTION
REMOTE sensing data is widely used as an indirectsource of information. From land cover/land use to
crowd estimation, environmental or urban area monitoring,remote sensing images are used in a wide range of tasksof high societal relevance. For instance, remote sensing datacan be used as a source of information for 6 of the 17 sus-tainable development goals as defined by the United Nations[1]. Due to the critical nature of the problems that can beaddressed using remote sensing data, significant effort hasbeen made to increase its availability in the last decade. Forinstance, Sentinel-2 satellites provide multispectral data witha relatively short revisiting time, in open-access. However,while substantial effort has been dedicated to improving themeans of direct information extraction from Sentinel-2 data
Sylvain Lobry, Diego Marcos, Jesse Murray and Devis Tuia are withLaboratory of Geo-Information Science and Remote Sensing, WageningenUniversity, The Netherlands email: [email protected]
Classification
Is it a rural or urban area?
Regression
How many buildings are there?
Detection
Is there a road?Cla
ssic
al t
asks
Regression
What is the area covered by smallbuildings?
Detection
Is there a road at the top of the image?
Spe
cifi
c ta
sks
Regression / Detection
What is the number of roads next to apark?
Detection
Is there a building next to a parking?
Mix
of
task
s
Fig. 1. Example of tasks achievable by a visual question answering modelfor remote sensing data.
in the framework of a given task (e.g. classification [2], [3]),the ability to use remote sensing data as a direct source ofinformation is currently limited to experts within the remotesensing and computer vision communities. This constraint,imposed by the technical nature of the task, reduces both thescale and variety of the problems that could be addressed withsuch information as well as the number of potential end-users.This is particularly true when targeting specific applications(detecting particular objects, e.g. thatched roofs or buildings ina developing country [4]) which would today call for importantresearch efforts. The targeted tasks are often multiple andchanging in the scope of a project calls for strong expertknowledge, limiting the information which can be extractedfrom remote sensing data. To address these constraints, weintroduce the problem of visual question answering (VQA)for remote sensing data.
arX
iv:2
003.
0733
3v2
[cs
.CV
] 1
4 M
ay 2
020
PRE-PRINT. FINAL VERSION IN IEEE TRANSACTIONS ON GEOSCIENCE AND REMOTE SENSING 2
VQA is a new task in computer vision, introduced in itscurrent form by [5]. The objective of VQA is to answer afree-form and open-ended question about a given image. Asthe questions can be unconstrained, a VQA model appliedto remote sensing data could serve as a generic solutionto classical problems involving remote sensing data (e.g.”Is there a thatched roof in this image?” for thatched roofdetection), but also very specific tasks involving relationsbetween objects of different nature (e.g. ”Is there a thatchedroof on the right of the river?”). Examples of potentialquestions are shown in Figure 1.
To the best of our knowledge, this is the first time (afterthe first exploration in [6]) that VQA has been applied toextract information from remote sensing data. It builds on thetask of generating descriptions of images through combiningimage and natural language processing to provide the userwith easily accessible, high-level semantic information. Thesedescriptions are then used for image retrieval and intelligencegeneration [7]. As seen in this introduction, VQA systems relyon the recent advances in deep learning. Deep learning basedmethods, thanks to their ability to extract high-level features,have been successfully developed for remote sensing data asreviewed in [8]. Nowadays, this family of methods is used totackle a variety of tasks; for scene classification, an early workby [9] evaluated the possibility to adapt networks pre-trainedon large natural image databases (such as ImageNet [10]) toclassify hyperspectral remote sensing images. More recently,[11] used an intermediate high level representation using recur-rent attention maps to classify images. Object detection is alsooften approached using deep learning methods. To this effect,[12] introduced an object detection dataset and evaluated clas-sical deep learning approaches. Methods taking into accountthe specificity of remote sensing data have been developed,such as [13] which proposed to modify the classical approachby generating rotatable region proposal which are particularlyrelevant for top-view imagery. Deep learning methods havealso been developed for semantic segmentation. In [14], theauthors evaluated different strategies for segmenting remotesensing data. More recently, a contest organized on the datasetof building segmentation created by [15] has motivated thedevelopment of a number of new methods to improve resultson this task [16]. Similarly, [17] introduced a contest includingthree tasks: road extraction, building detection and land coverclassification. Best results for each challenge were obtainedusing deep neural networks: [18], [19], [20].
Natural language processing has also been used in remotesensing. For instance, [21] used a convolutional neuralnetwork (CNN) to generate classification probabilities for agiven image, and used a recurrent neural network (RNN) togenerate its description. In a similar fashion, [7] used a CNNto obtain a multi semantic level representation of an image(object, land class, landscape) and generate a descriptionusing a simple static model. More recently, [22] uses anencoder/decoder type of architecture where a CNN encodesthe image and a RNN decodes it to a textual representation,while [23] projects the textual representation and the image toa common space. While these works are use cases of natural
language processing, they do not enable interactions with theuser as we propose with VQA.
A VQA model is generally made of 4 distinct components:1) a visual feature extractor, 2) a language feature extractor, 3)a fusion step between the two modalities and 4) a predictioncomponent. Since VQA is a relatively new task, an importantnumber of methodological developments have been publishedin both the computer vision and natural language processingcommunities during the past 5 years, reviewed in [24]. VQAmodels are able to benefit from advances in the computervision and automatic language processing communities forthe features extraction components. However, the multi-modalfusion has been less explored and therefore, an importantamount of work has been dedicated to this step. First VQAmodels relied on a non-spatial fusion method, i.e. a point-wisemultiplication between the visual and language feature vectors[5]. Being straightforward, this method does not allow everycomponent from both feature vectors to interact with eachother. This interaction would ideally be achieved by multiply-ing the first feature vector by the transpose of the other, butthis operation would be computationally intractable in practice.Instead, [25] proposed a fusion method which first selectsrelevant visual features based on the textual feature (attentionstep) and then, combines them with the textual feature. In [26],the authors used Tucker decomposition to achieve a similarpurpose in one step. While these attention mechanisms areinteresting for finding visual elements aligned with the wordswithin the question, they require the image to be divided in aregular grid for the computation of the attention, and this is notsuitable to objects of varying size. A solution is presented in[27], which learns an object detector to select relevant parts ofthe image. In this research, we use a non-spatial fusion step tokeep the model part relatively simple. Most traditional VQAworks are designed for a specific dataset, either composedof natural images (with questions covering an unconstrainedrange of topics) or synthetic images. While interesting forthe methodological developments that they have facilitated,these datasets limit the potential applications of such systemsto other problems. Indeed, it has been shown in [28] thatVQA models trained on a specific dataset do not generalizewell to other datasets. This generalization gap raises questionsconcerning the applicability of such models to specific tasks.
A notable use-case of VQA is helping visually impairedpeople through natural language interactions [29]. Imagesacquired by visually impaired people represent an importantdomain shift, and as such a challenge for the applicabilityof VQA models. In [30], the authors confirm that networkstrained on generic datasets do not generalize to their specificone. However, they manage to obtain much better resultsby fine-tuning or training models from scratch on theirtask-specific dataset.
In this study, we propose a new application for VQA,specifically for the interaction with remote sensing images.To this effect, we propose the first remote sensing-orientedVQA datasets, and evaluate the applicability of this task onremote sensing images. We propose a method to automatically
PRE-PRINT. FINAL VERSION IN IEEE TRANSACTIONS ON GEOSCIENCE AND REMOTE SENSING 3
Elements catalog
RoadWater areaCommercial buildingIndustrial building
Residential areaRetail
Religious area
Land usages...
Attributes catalog
Relations catalog
Positional
Size
Shape Count
Presence
Comparison
Area
Rural/Urban
Questions catalog
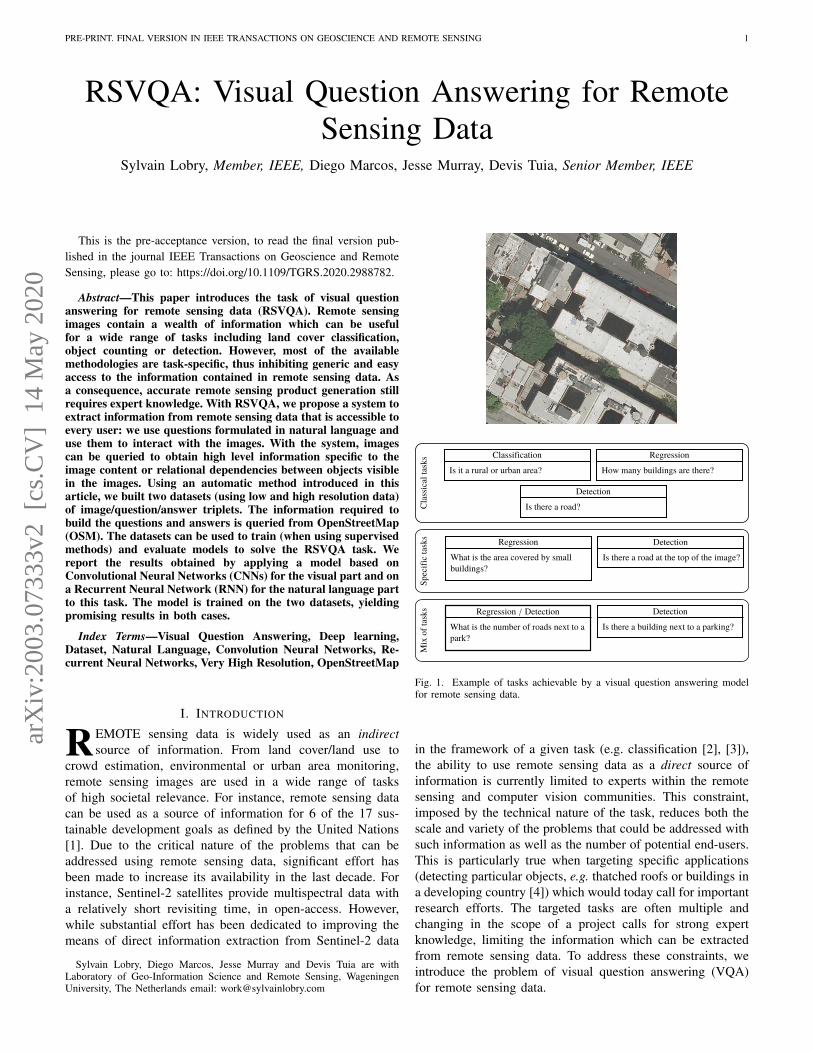
(a) Question construction procedure. Dash lines represent optional paths
Road
"How many roads are present in the image?"
"Is there a small retail place?"
"Is there more buildings at the top of a circular religious place than roads in the image?"
Road Count Base question
Retail Size Presence Base question
Building
Religious ShapePositional
Comparison Base question
(b) Construction path for sample questions.
Fig. 2. Illustration of the question construction procedure.
generate remote sensing-oriented VQA datasets from alreadyavailable human annotations in section II and generate twodatasets. We then use this newly-generated data to trainour proposed RSVQA model with a non-spatial fusion stepdescribed in section III. Finally, the results are evaluated anddiscussed in section IV.
Our contribution are the following:• a method to generate remote sensing-oriented VQA
datasets;• 2 datasets;• the proposed RSVQA model.
This work extends the preliminary study of [6] by consideringand disclosing a second larger dataset consisting of very highresolution images. This second dataset helps testing the spatialgeneralization capability of VQA and provides an extensivediscussion highlighting remaining challenges. The method togenerate the dataset, the RSVQA model and the two datasetsare available on https://rsvqa.sylvainlobry.com/.
II. DATASETS
A. Method
As seen in the introduction, a main limiting factor forVQA is the availability of task-specific datasets. As such,we aim at providing a collection of remote sensing imageswith questions and answers associated to them. To do so,we took inspiration from [31], in which the authors builda dataset of question/answer pairs about synthetic imagesfollowing an automated procedure. However, in this studywe are interested in real data (discussed in subsection II-B).Therefore, we use the openly accessible OpenStreetMap datacontaining geo-localized information provided by volunteers.By leveraging this data, we can automatically extract the
information required to obtain question/answer pairs relevantto real remotely sensed data and create a dataset made of(image, question, answer) triplets.
The first step of the database construction is to createthe questions. The second step is to compute the answersto the questions, using the OSM features belonging to theimage footprint. Note that multiple question/answer pairs areextracted for each image.
1) Question contruction: Our method to construct thequestions is illustrated in Figure 2. It consists of four maincomponents:
1) choice of an element category (highlighted in red inFigure 2(a));
2) application of attributes to the element (highlighted ingreen in Figure 2(a));
3) selection based on the relative location to another ele-ment (highlighted in green in Figure 2(a))
4) construction of the question (highlighted in blue inFigure 2(a)).
Examples of question constructions are shown in Figure 2(b).These four components are detailed in the following.
Element category selection: First, an element category is ran-domly selected from the element catalog. This catalog is builtby extracting the elements from one of the following OSMlayers: road, water area, building and land use. While roadsand water areas are directly treated as elements, buildingsand land use related objects are defined based on their ”type”field, as defined in the OSM data specification. Examples ofland use objects include residential area, construction area,religious places, . . . Buildings are divided in two categories:commercial (e.g. retail, supermarket, ...) and residential (e.g.house, apartments, . . . ).
Attributes application: The second (optional) step is torefine the previously selected element category. To do so,we randomly select from one of the two possible attributecategories:• Shape: each element can be either square, rectangular
or circular. Whether an element belongs to one of theseshape types is decided based on basic geometrical prop-erties (i.e. hard thresholds on area-to-perimeter ratio andarea-to-circumscribed circle area ratio).
• Size: using hard thresholds on the surface area, elementscan be considered ”small”, ”medium” or ”large”. As weare interested in information at different scales in thetwo datasets, we use different threshold values, whichare described in Table I.
Relative position: Another possibility to refine the element isto look at its relative position compared to another element.We define 5 relations: ”left of”, ”top of”, ”right of”, ”bottomof”, ”next to”. Note that these relative positions are understoodin the image space (i.e. geographically). The special case of
PRE-PRINT. FINAL VERSION IN IEEE TRANSACTIONS ON GEOSCIENCE AND REMOTE SENSING 4
Scale Small Medium LargeLow resolution < 3000m2 < 10000m2 ≥ 10000m2
High resolution < 100m2 < 500m2 ≥ 500m2
TABLE ITHRESHOLDS FOR SIZE ATTRIBUTES ACCORDING TO THE DATASET
SCALE. WHEN DEALING WITH LOW RESOLUTION DATA, VISIBLE OBJECTSOF INTEREST ARE LARGER. TO DEAL WITH THIS DISPARITY, WE ADAPT
THE SIZE THRESHOLDS TO THE RESOLUTION OF THE IMAGES.
”next to” is handled as a hard threshold on the relative distancebetween the two objects (less than 1000m). When looking atrelative positions, we select the second element following theprocedure previously defined.
Question construction: At this point of the procedure, wehave an element (e.g. road), with an optional attribute (e.g.small road) and an optional relative position (e.g. small roadon the left of a water area). The final step is to generatea ”base question” about this element. We define 5 types ofquestions of interest (”Question catalog” in Figure 2(a)), fromwhich a specific type is randomly selected to obtain a basequestion. For instance, in the case of comparison questions, werandomly choose among ”less than”, ”equals to” and ”morethan” and construct a second element.
This base question is then turned into a natural languagequestion using pre-defined templates for each question typeand object. For some question types (e.g. count), more thanone template is defined (e.g. ’How many are there?’,’What is the number of ?’ or ’What is the amount of ?’).In this case, the template to be used is randomly selected. Thestochastic process ensures the diversity, both in the questiontypes and the question templates used.
2) Answer construction: : To obtain the answer to theconstructed question, we extract the objects from the OSMdatabase corresponding to the image footprint. The objects bcorresponding to the element category and its attributes arethen selected and used depending on the question type:
• Count: In the case of counting, the answer is simply thenumber of objects b.
• Presence: A presence question is answered by comparingthe number of objects b to 0.
• Area: The answer to a question about the area is the sumof the areas of the objects b.
• Comparison: Comparison is a specific case for whicha second element and the relative position statement isneeded. This question is then answered by comparing thenumber of objects b to the ones of the second element.
• Rural/Urban: The case of rural/urban questions is han-dled in a specific way. In this case, we do not cre-ate a specific element, but rather count the number ofbuildings (both commercial or residential). This numberof buildings is then thresholded to a predefined numberdepending on the resolution of the input data (to obtaina density) to answer the question. Note that we are usinga generic definition of rural and urban areas but this canbe easily adapted using the precise definition of each
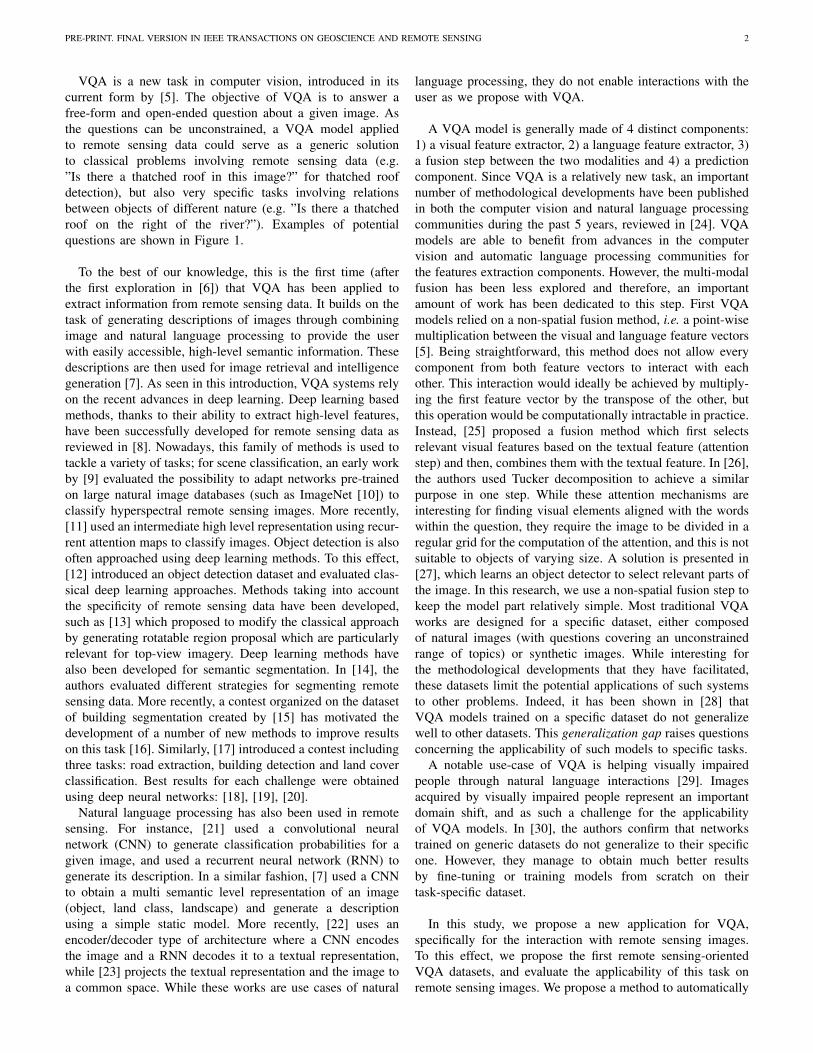
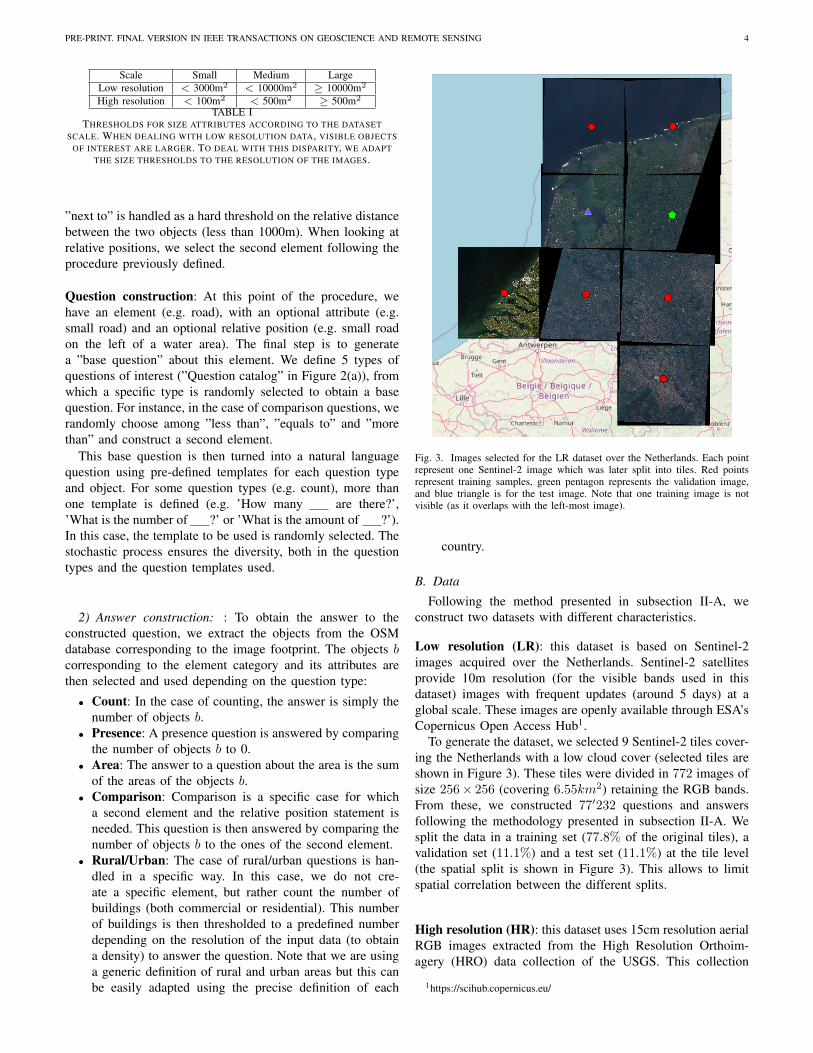
Fig. 3. Images selected for the LR dataset over the Netherlands. Each pointrepresent one Sentinel-2 image which was later split into tiles. Red pointsrepresent training samples, green pentagon represents the validation image,and blue triangle is for the test image. Note that one training image is notvisible (as it overlaps with the left-most image).
country.
B. Data
Following the method presented in subsection II-A, weconstruct two datasets with different characteristics.
Low resolution (LR): this dataset is based on Sentinel-2images acquired over the Netherlands. Sentinel-2 satellitesprovide 10m resolution (for the visible bands used in thisdataset) images with frequent updates (around 5 days) at aglobal scale. These images are openly available through ESA’sCopernicus Open Access Hub1.
To generate the dataset, we selected 9 Sentinel-2 tiles cover-ing the Netherlands with a low cloud cover (selected tiles areshown in Figure 3). These tiles were divided in 772 images ofsize 256× 256 (covering 6.55km2) retaining the RGB bands.From these, we constructed 77′232 questions and answersfollowing the methodology presented in subsection II-A. Wesplit the data in a training set (77.8% of the original tiles), avalidation set (11.1%) and a test set (11.1%) at the tile level(the spatial split is shown in Figure 3). This allows to limitspatial correlation between the different splits.
High resolution (HR): this dataset uses 15cm resolution aerialRGB images extracted from the High Resolution Orthoim-agery (HRO) data collection of the USGS. This collection
1https://scihub.copernicus.eu/
PRE-PRINT. FINAL VERSION IN IEEE TRANSACTIONS ON GEOSCIENCE AND REMOTE SENSING 5
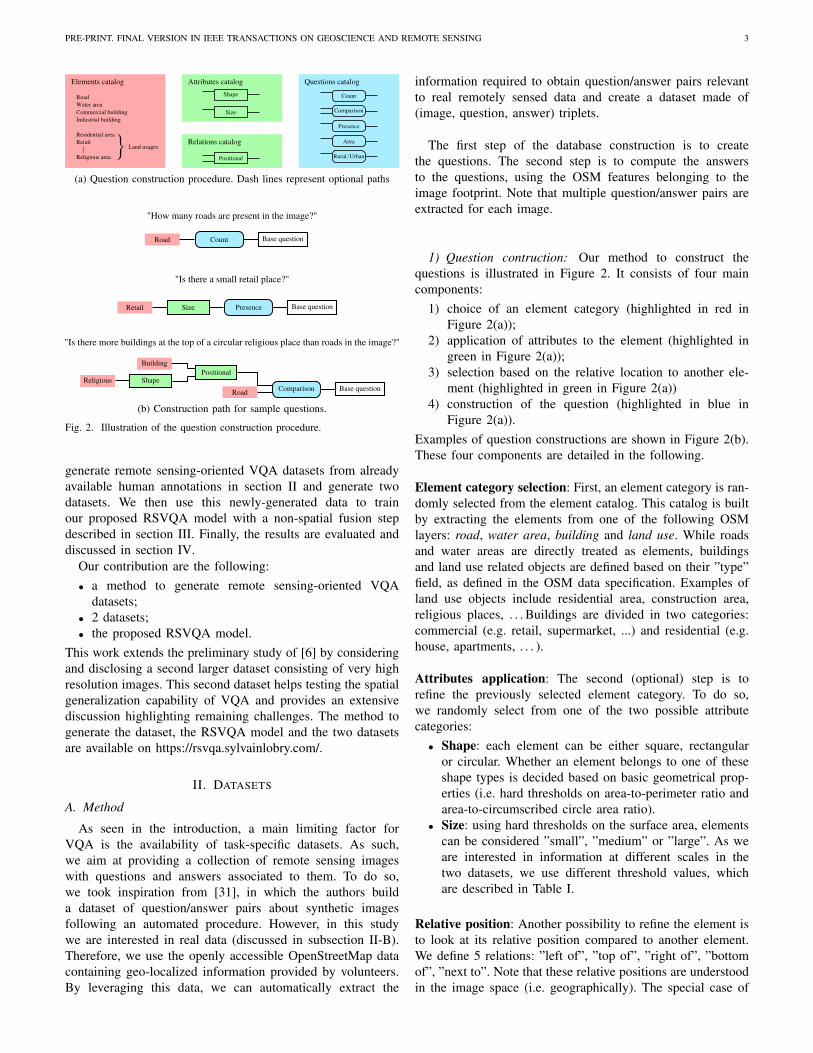
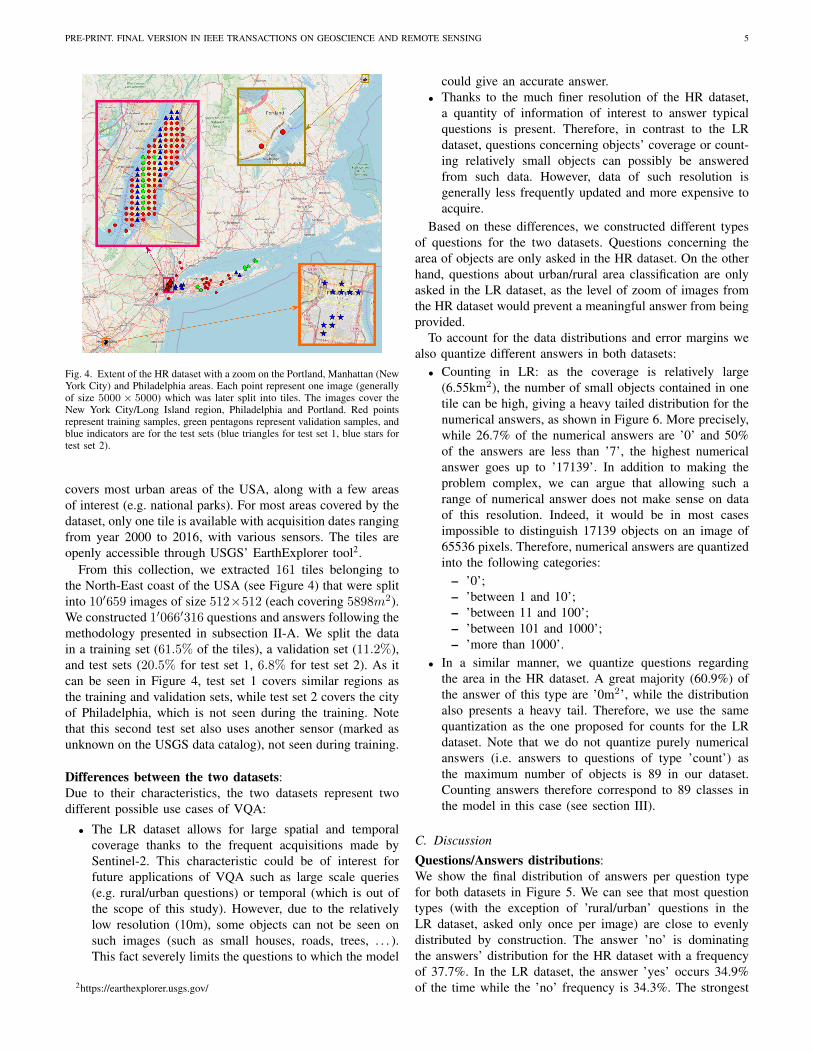
Fig. 4. Extent of the HR dataset with a zoom on the Portland, Manhattan (NewYork City) and Philadelphia areas. Each point represent one image (generallyof size 5000 × 5000) which was later split into tiles. The images cover theNew York City/Long Island region, Philadelphia and Portland. Red pointsrepresent training samples, green pentagons represent validation samples, andblue indicators are for the test sets (blue triangles for test set 1, blue stars fortest set 2).
covers most urban areas of the USA, along with a few areasof interest (e.g. national parks). For most areas covered by thedataset, only one tile is available with acquisition dates rangingfrom year 2000 to 2016, with various sensors. The tiles areopenly accessible through USGS’ EarthExplorer tool2.
From this collection, we extracted 161 tiles belonging tothe North-East coast of the USA (see Figure 4) that were splitinto 10′659 images of size 512×512 (each covering 5898m2).We constructed 1′066′316 questions and answers following themethodology presented in subsection II-A. We split the datain a training set (61.5% of the tiles), a validation set (11.2%),and test sets (20.5% for test set 1, 6.8% for test set 2). As itcan be seen in Figure 4, test set 1 covers similar regions asthe training and validation sets, while test set 2 covers the cityof Philadelphia, which is not seen during the training. Notethat this second test set also uses another sensor (marked asunknown on the USGS data catalog), not seen during training.
Differences between the two datasets:Due to their characteristics, the two datasets represent twodifferent possible use cases of VQA:
• The LR dataset allows for large spatial and temporalcoverage thanks to the frequent acquisitions made bySentinel-2. This characteristic could be of interest forfuture applications of VQA such as large scale queries(e.g. rural/urban questions) or temporal (which is out ofthe scope of this study). However, due to the relativelylow resolution (10m), some objects can not be seen onsuch images (such as small houses, roads, trees, . . . ).This fact severely limits the questions to which the model
2https://earthexplorer.usgs.gov/
could give an accurate answer.• Thanks to the much finer resolution of the HR dataset,
a quantity of information of interest to answer typicalquestions is present. Therefore, in contrast to the LRdataset, questions concerning objects’ coverage or count-ing relatively small objects can possibly be answeredfrom such data. However, data of such resolution isgenerally less frequently updated and more expensive toacquire.
Based on these differences, we constructed different typesof questions for the two datasets. Questions concerning thearea of objects are only asked in the HR dataset. On the otherhand, questions about urban/rural area classification are onlyasked in the LR dataset, as the level of zoom of images fromthe HR dataset would prevent a meaningful answer from beingprovided.
To account for the data distributions and error margins wealso quantize different answers in both datasets:• Counting in LR: as the coverage is relatively large
(6.55km2), the number of small objects contained in onetile can be high, giving a heavy tailed distribution for thenumerical answers, as shown in Figure 6. More precisely,while 26.7% of the numerical answers are ’0’ and 50%of the answers are less than ’7’, the highest numericalanswer goes up to ’17139’. In addition to making theproblem complex, we can argue that allowing such arange of numerical answer does not make sense on dataof this resolution. Indeed, it would be in most casesimpossible to distinguish 17139 objects on an image of65536 pixels. Therefore, numerical answers are quantizedinto the following categories:
– ’0’;– ’between 1 and 10’;– ’between 11 and 100’;– ’between 101 and 1000’;– ’more than 1000’.
• In a similar manner, we quantize questions regardingthe area in the HR dataset. A great majority (60.9%) ofthe answer of this type are ’0m2’, while the distributionalso presents a heavy tail. Therefore, we use the samequantization as the one proposed for counts for the LRdataset. Note that we do not quantize purely numericalanswers (i.e. answers to questions of type ’count’) asthe maximum number of objects is 89 in our dataset.Counting answers therefore correspond to 89 classes inthe model in this case (see section III).
C. Discussion
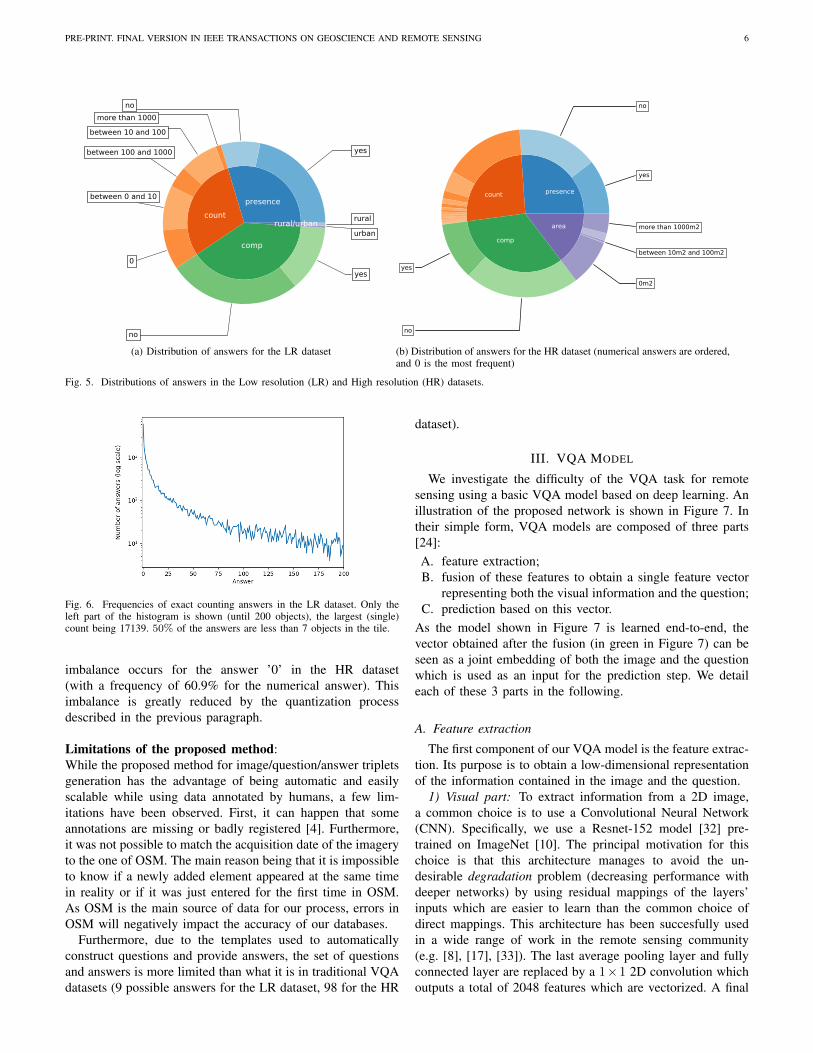
Questions/Answers distributions:We show the final distribution of answers per question typefor both datasets in Figure 5. We can see that most questiontypes (with the exception of ’rural/urban’ questions in theLR dataset, asked only once per image) are close to evenlydistributed by construction. The answer ’no’ is dominatingthe answers’ distribution for the HR dataset with a frequencyof 37.7%. In the LR dataset, the answer ’yes’ occurs 34.9%of the time while the ’no’ frequency is 34.3%. The strongest
PRE-PRINT. FINAL VERSION IN IEEE TRANSACTIONS ON GEOSCIENCE AND REMOTE SENSING 6
(a) Distribution of answers for the LR dataset
yes
no
yes
no
0m2
between 10m2 and 100m2
more than 1000m2
presencecount
comp
area
(b) Distribution of answers for the HR dataset (numerical answers are ordered,and 0 is the most frequent)
Fig. 5. Distributions of answers in the Low resolution (LR) and High resolution (HR) datasets.
Fig. 6. Frequencies of exact counting answers in the LR dataset. Only theleft part of the histogram is shown (until 200 objects), the largest (single)count being 17139. 50% of the answers are less than 7 objects in the tile.
imbalance occurs for the answer ’0’ in the HR dataset(with a frequency of 60.9% for the numerical answer). Thisimbalance is greatly reduced by the quantization processdescribed in the previous paragraph.
Limitations of the proposed method:While the proposed method for image/question/answer tripletsgeneration has the advantage of being automatic and easilyscalable while using data annotated by humans, a few lim-itations have been observed. First, it can happen that someannotations are missing or badly registered [4]. Furthermore,it was not possible to match the acquisition date of the imageryto the one of OSM. The main reason being that it is impossibleto know if a newly added element appeared at the same timein reality or if it was just entered for the first time in OSM.As OSM is the main source of data for our process, errors inOSM will negatively impact the accuracy of our databases.
Furthermore, due to the templates used to automaticallyconstruct questions and provide answers, the set of questionsand answers is more limited than what it is in traditional VQAdatasets (9 possible answers for the LR dataset, 98 for the HR
dataset).
III. VQA MODEL
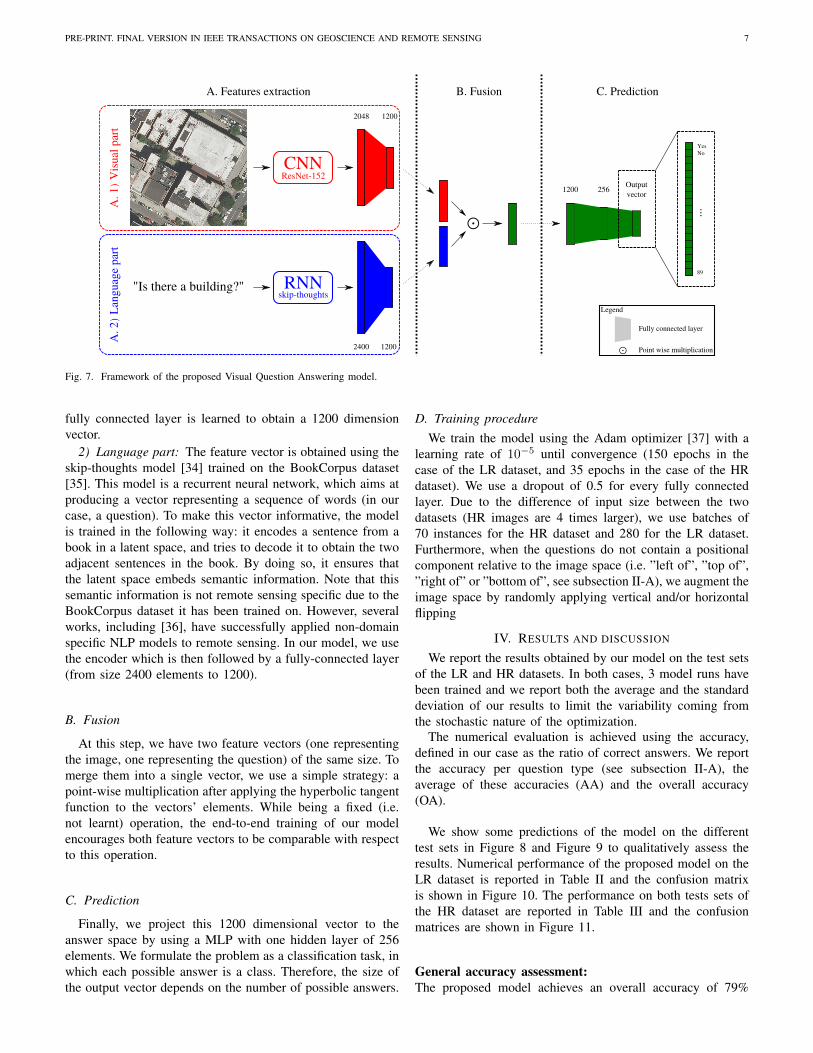
We investigate the difficulty of the VQA task for remotesensing using a basic VQA model based on deep learning. Anillustration of the proposed network is shown in Figure 7. Intheir simple form, VQA models are composed of three parts[24]:A. feature extraction;B. fusion of these features to obtain a single feature vector
representing both the visual information and the question;C. prediction based on this vector.
As the model shown in Figure 7 is learned end-to-end, thevector obtained after the fusion (in green in Figure 7) can beseen as a joint embedding of both the image and the questionwhich is used as an input for the prediction step. We detaileach of these 3 parts in the following.
A. Feature extraction
The first component of our VQA model is the feature extrac-tion. Its purpose is to obtain a low-dimensional representationof the information contained in the image and the question.
1) Visual part: To extract information from a 2D image,a common choice is to use a Convolutional Neural Network(CNN). Specifically, we use a Resnet-152 model [32] pre-trained on ImageNet [10]. The principal motivation for thischoice is that this architecture manages to avoid the un-desirable degradation problem (decreasing performance withdeeper networks) by using residual mappings of the layers’inputs which are easier to learn than the common choice ofdirect mappings. This architecture has been succesfully usedin a wide range of work in the remote sensing community(e.g. [8], [17], [33]). The last average pooling layer and fullyconnected layer are replaced by a 1×1 2D convolution whichoutputs a total of 2048 features which are vectorized. A final
PRE-PRINT. FINAL VERSION IN IEEE TRANSACTIONS ON GEOSCIENCE AND REMOTE SENSING 7
⊙
B. FusionA. Features extraction
CNNResNet-152
"Is there a building?" RNNskip-thoughts
2048 1200
12002400
1200 256Outputvector
YesNo
89
...A
. 1
) V
isu
al p
art
A.
2)
Lan
guag
e p
art
C. Prediction
⊙
Fully connected layer
Point wise multiplication
Legend
Fig. 7. Framework of the proposed Visual Question Answering model.
fully connected layer is learned to obtain a 1200 dimensionvector.
2) Language part: The feature vector is obtained using theskip-thoughts model [34] trained on the BookCorpus dataset[35]. This model is a recurrent neural network, which aims atproducing a vector representing a sequence of words (in ourcase, a question). To make this vector informative, the modelis trained in the following way: it encodes a sentence from abook in a latent space, and tries to decode it to obtain the twoadjacent sentences in the book. By doing so, it ensures thatthe latent space embeds semantic information. Note that thissemantic information is not remote sensing specific due to theBookCorpus dataset it has been trained on. However, severalworks, including [36], have successfully applied non-domainspecific NLP models to remote sensing. In our model, we usethe encoder which is then followed by a fully-connected layer(from size 2400 elements to 1200).
B. Fusion
At this step, we have two feature vectors (one representingthe image, one representing the question) of the same size. Tomerge them into a single vector, we use a simple strategy: apoint-wise multiplication after applying the hyperbolic tangentfunction to the vectors’ elements. While being a fixed (i.e.not learnt) operation, the end-to-end training of our modelencourages both feature vectors to be comparable with respectto this operation.
C. Prediction
Finally, we project this 1200 dimensional vector to theanswer space by using a MLP with one hidden layer of 256elements. We formulate the problem as a classification task, inwhich each possible answer is a class. Therefore, the size ofthe output vector depends on the number of possible answers.
D. Training procedureWe train the model using the Adam optimizer [37] with a
learning rate of 10−5 until convergence (150 epochs in thecase of the LR dataset, and 35 epochs in the case of the HRdataset). We use a dropout of 0.5 for every fully connectedlayer. Due to the difference of input size between the twodatasets (HR images are 4 times larger), we use batches of70 instances for the HR dataset and 280 for the LR dataset.Furthermore, when the questions do not contain a positionalcomponent relative to the image space (i.e. ”left of”, ”top of”,”right of” or ”bottom of”, see subsection II-A), we augment theimage space by randomly applying vertical and/or horizontalflipping
IV. RESULTS AND DISCUSSION
We report the results obtained by our model on the test setsof the LR and HR datasets. In both cases, 3 model runs havebeen trained and we report both the average and the standarddeviation of our results to limit the variability coming fromthe stochastic nature of the optimization.
The numerical evaluation is achieved using the accuracy,defined in our case as the ratio of correct answers. We reportthe accuracy per question type (see subsection II-A), theaverage of these accuracies (AA) and the overall accuracy(OA).
We show some predictions of the model on the differenttest sets in Figure 8 and Figure 9 to qualitatively assess theresults. Numerical performance of the proposed model on theLR dataset is reported in Table II and the confusion matrixis shown in Figure 10. The performance on both tests sets ofthe HR dataset are reported in Table III and the confusionmatrices are shown in Figure 11.
General accuracy assessment:The proposed model achieves an overall accuracy of 79%
PRE-PRINT. FINAL VERSION IN IEEE TRANSACTIONS ON GEOSCIENCE AND REMOTE SENSING 8
What is the area covered by residential buildings?
0 m² 0 m²
Ground truth Prediction
(a) HR, test set 1
What is the area covered by rectangular buildings?
Between 100 and
1000 m²Between 100 and
1000 m²
Ground truth Prediction
(b) HR, test set 1
Is there a residential building at the bottom
of the place of worship?
yes yes
Ground truth Prediction
(c) HR, test set 1
How many residential buildings at the bottom
of a road are there?
4 3
Ground truth Prediction
(d) HR, test set 1
What is the amount of large buildings?
3 1
Ground truth Prediction
(f) HR, test set 1
How many buildings on the left of a road
are there in the image?
38 0
Ground truth Prediction
(e) HR, test set 1
What is the area covered by rectangular parkings?
between 100m2 and
1000m2between 100m2 and
1000m2
Ground truth Prediction
(g) HR, test set 2
What is the amount of small buildings?
9 0
Ground truth Prediction
(h) HR, test set 2
What is the amount of large residential buildings?
2 1
Ground truth Prediction
(i) HR, test set 2
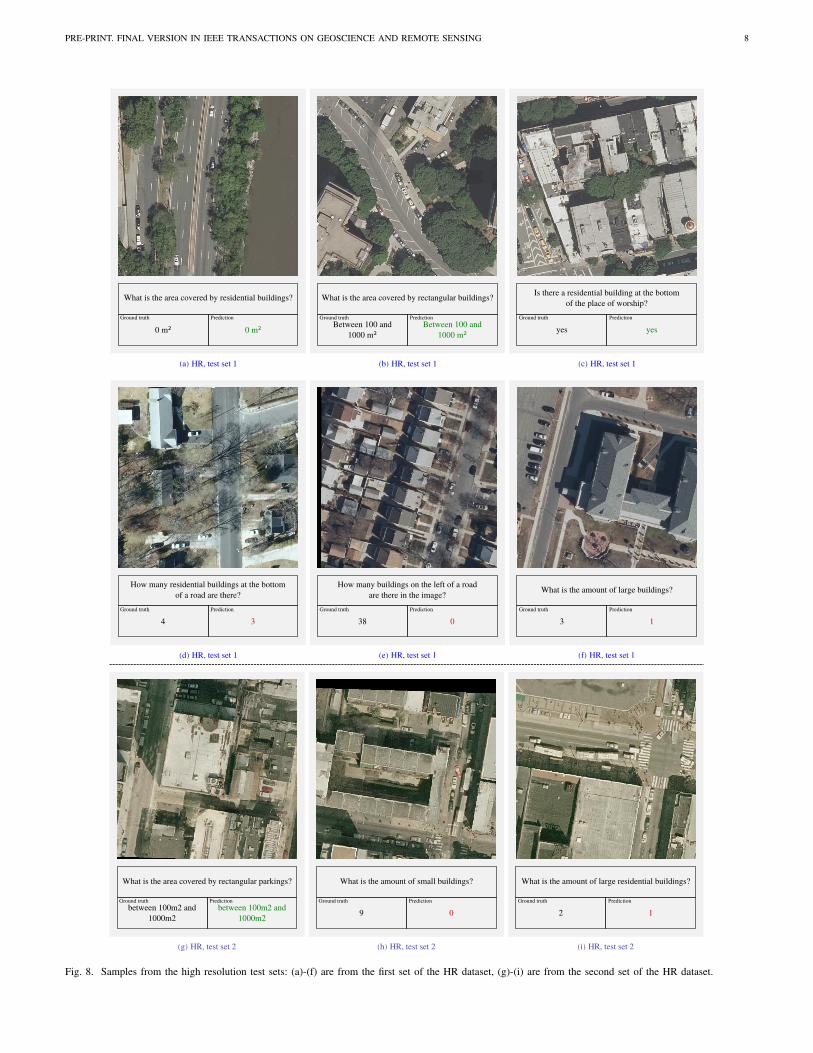
Fig. 8. Samples from the high resolution test sets: (a)-(f) are from the first set of the HR dataset, (g)-(i) are from the second set of the HR dataset.
PRE-PRINT. FINAL VERSION IN IEEE TRANSACTIONS ON GEOSCIENCE AND REMOTE SENSING 9
TABLE IIRESULTS ON THE TEST SET OF THE LOW RESOLUTION DATASET. THE
STANDARD DEVIATION IS REPORTED IN BRACKETS.
Type AccuracyCount 67.01% (0.59%)
Presence 87.46% (0.06%)Comparison 81.50% (0.03%)Rural/Urban 90.00% (1.41%)
AA 81.49% (0.49%)OA 79.08% (0.20%)
TABLE IIIRESULTS ON BOTH TEST SETS OF THE HIGH RESOLUTION DATASET. THE
STANDARD DEVIATION IS REPORTED IN BRACKETS.
Type Accuracy AccuracyTest set 1 Test set 2
Count 68.63% (0.11%) 61.47% (0.08%)Presence 90.43% (0.04%) 86.26% (0.47%)
Comparison 88.19% (0.08%) 85.94% (0.12%)Area 85.24% (0.05%) 76.33% (0.50%)AA 83.12% (0.03%) 77.50% (0.29%)OA 83.23% (0.02%) 78.23% (0.25%)
on the low resolution dataset (see Table II) and of 83% onthe first test set of the high resolution dataset (Table III),indicating that the task of automatically answering questionbased on remote sensing images is possible. When looking atthe accuracies per question type (in Tables II and III), it canbe noted that the model performs inconsistently with respectto the task the question is tackling: while a question about thepresence of an object is generally well answered (87.46% inthe LR dataset, 90.43% in the first test set of the HR dataset),counting questions gives poorer performances (67.01% and68.63% respectively). This can be explained by the fact thatpresence questions can be seen as simplified counting ques-tions to which the answers are restricted to two options: ”0”or ”1 or more”. Classical VQA models are known to strugglewith the counting task [38]. An issue which partly explainsthese performances in the counting task is the separation ofconnected instances. This problem has been raised for the caseof buildings in [33] and is illustrated in Figure 8(f), where theground truth is indicating three buildings, which could also beonly one. We found another illustration of this phenomenonin the second test set in Figure 8(i). This issue mostly ariseswhen counting roads or buildings.
Thanks to the answers’ quantization, questions regarding theareas of objects are generally well answered with an accuracyof 85.24% in the first test set of the HR dataset. This isillustrated in Figures 8(a,b), where presence of buildings (bythe mean of the covered area) is well detected.
However, we found that our model performs poorly withquestions regarding the relative positions of objects, suchas those illustrated in Figures 8(c-e). While Figure 8(c)is correct, despite the question being difficult, Figure 8(d)shows a small mistake from the model and Figure 8(e) iscompletely incorrect. These problems can be explained bythe fact that the questions are on high semantic level andtherefore difficult for a model considering a simple fusionscheme, as the one presented in section III.
Is it a rural or an urban area?
Rural Rural
Ground truth Prediction
Is it a rural or an urban area?
Urban Urban
Ground truth Prediction
(a) LR, test set (b) LR, test set
Are there more water areas thancommercial buildings?
Yes No
Ground truth Prediction
Are there less buildings than water areas?
No No
Ground truth Prediction
(c) LR, test set (d) LR, test set
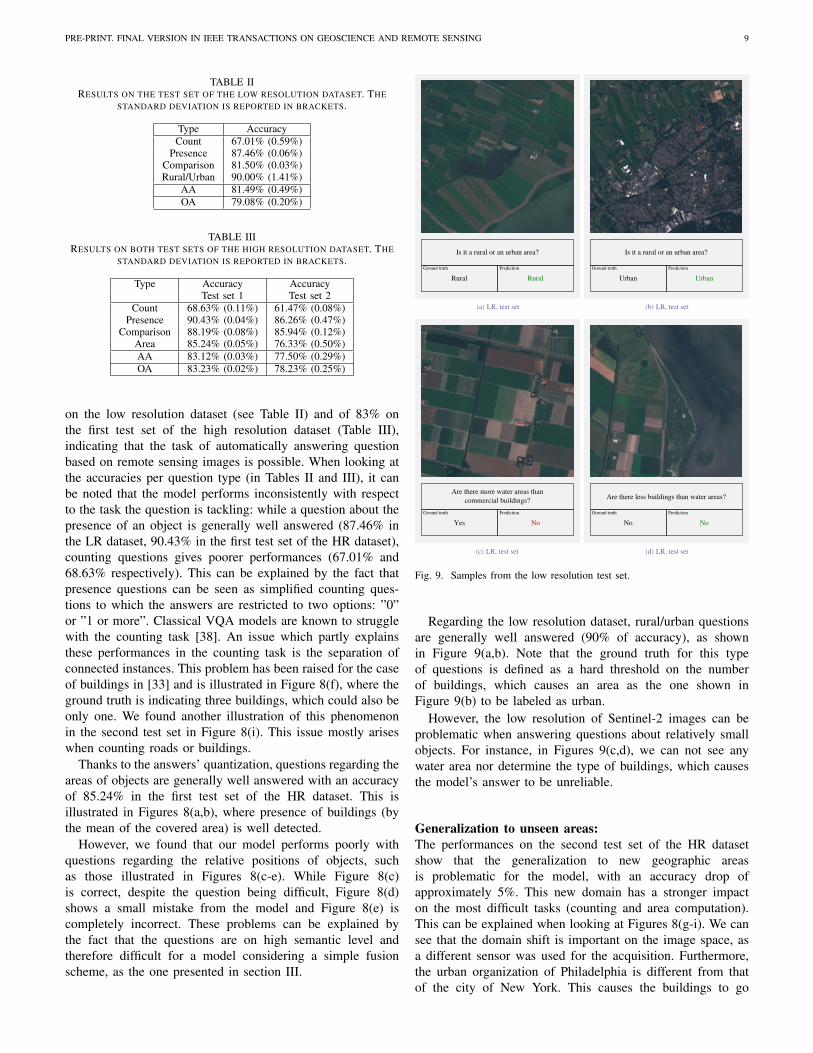
Fig. 9. Samples from the low resolution test set.
Regarding the low resolution dataset, rural/urban questionsare generally well answered (90% of accuracy), as shownin Figure 9(a,b). Note that the ground truth for this typeof questions is defined as a hard threshold on the numberof buildings, which causes an area as the one shown inFigure 9(b) to be labeled as urban.
However, the low resolution of Sentinel-2 images can beproblematic when answering questions about relatively smallobjects. For instance, in Figures 9(c,d), we can not see anywater area nor determine the type of buildings, which causesthe model’s answer to be unreliable.
Generalization to unseen areas:The performances on the second test set of the HR datasetshow that the generalization to new geographic areasis problematic for the model, with an accuracy drop ofapproximately 5%. This new domain has a stronger impacton the most difficult tasks (counting and area computation).This can be explained when looking at Figures 8(g-i). We cansee that the domain shift is important on the image space, asa different sensor was used for the acquisition. Furthermore,the urban organization of Philadelphia is different from thatof the city of New York. This causes the buildings to go
PRE-PRINT. FINAL VERSION IN IEEE TRANSACTIONS ON GEOSCIENCE AND REMOTE SENSING 10
Yes N
oRur
al
Urb
an
0 1-10
101-
1000
1000
+
Yes
No
Rural
Urban
0
1-10
11-100
101-1000
1000+
11-1
00
Tru
e
Predicted
0
6
54
402
2980
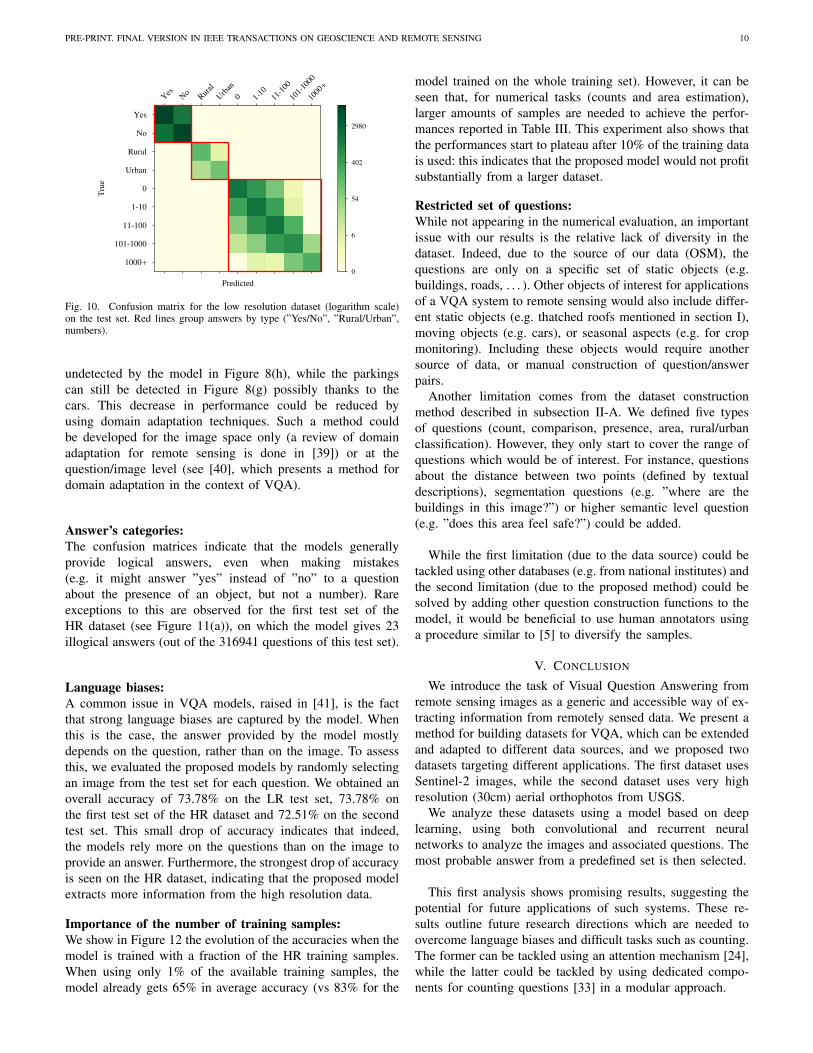
Fig. 10. Confusion matrix for the low resolution dataset (logarithm scale)on the test set. Red lines group answers by type (”Yes/No”, ”Rural/Urban”,numbers).
undetected by the model in Figure 8(h), while the parkingscan still be detected in Figure 8(g) possibly thanks to thecars. This decrease in performance could be reduced byusing domain adaptation techniques. Such a method couldbe developed for the image space only (a review of domainadaptation for remote sensing is done in [39]) or at thequestion/image level (see [40], which presents a method fordomain adaptation in the context of VQA).
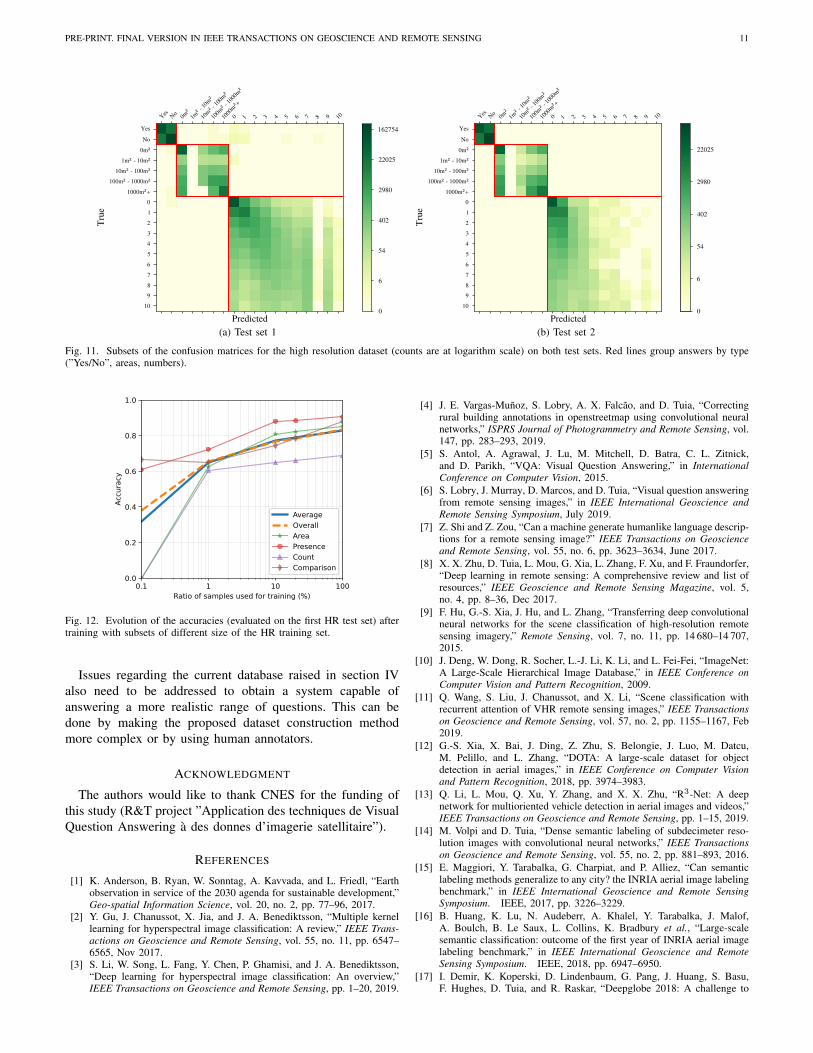
Answer’s categories:The confusion matrices indicate that the models generallyprovide logical answers, even when making mistakes(e.g. it might answer ”yes” instead of ”no” to a questionabout the presence of an object, but not a number). Rareexceptions to this are observed for the first test set of theHR dataset (see Figure 11(a)), on which the model gives 23illogical answers (out of the 316941 questions of this test set).
Language biases:A common issue in VQA models, raised in [41], is the factthat strong language biases are captured by the model. Whenthis is the case, the answer provided by the model mostlydepends on the question, rather than on the image. To assessthis, we evaluated the proposed models by randomly selectingan image from the test set for each question. We obtained anoverall accuracy of 73.78% on the LR test set, 73.78% onthe first test set of the HR dataset and 72.51% on the secondtest set. This small drop of accuracy indicates that indeed,the models rely more on the questions than on the image toprovide an answer. Furthermore, the strongest drop of accuracyis seen on the HR dataset, indicating that the proposed modelextracts more information from the high resolution data.
Importance of the number of training samples:We show in Figure 12 the evolution of the accuracies when themodel is trained with a fraction of the HR training samples.When using only 1% of the available training samples, themodel already gets 65% in average accuracy (vs 83% for the
model trained on the whole training set). However, it can beseen that, for numerical tasks (counts and area estimation),larger amounts of samples are needed to achieve the perfor-mances reported in Table III. This experiment also shows thatthe performances start to plateau after 10% of the training datais used: this indicates that the proposed model would not profitsubstantially from a larger dataset.
Restricted set of questions:While not appearing in the numerical evaluation, an importantissue with our results is the relative lack of diversity in thedataset. Indeed, due to the source of our data (OSM), thequestions are only on a specific set of static objects (e.g.buildings, roads, . . . ). Other objects of interest for applicationsof a VQA system to remote sensing would also include differ-ent static objects (e.g. thatched roofs mentioned in section I),moving objects (e.g. cars), or seasonal aspects (e.g. for cropmonitoring). Including these objects would require anothersource of data, or manual construction of question/answerpairs.
Another limitation comes from the dataset constructionmethod described in subsection II-A. We defined five typesof questions (count, comparison, presence, area, rural/urbanclassification). However, they only start to cover the range ofquestions which would be of interest. For instance, questionsabout the distance between two points (defined by textualdescriptions), segmentation questions (e.g. ”where are thebuildings in this image?”) or higher semantic level question(e.g. ”does this area feel safe?”) could be added.
While the first limitation (due to the data source) could betackled using other databases (e.g. from national institutes) andthe second limitation (due to the proposed method) could besolved by adding other question construction functions to themodel, it would be beneficial to use human annotators usinga procedure similar to [5] to diversify the samples.
V. CONCLUSION
We introduce the task of Visual Question Answering fromremote sensing images as a generic and accessible way of ex-tracting information from remotely sensed data. We present amethod for building datasets for VQA, which can be extendedand adapted to different data sources, and we proposed twodatasets targeting different applications. The first dataset usesSentinel-2 images, while the second dataset uses very highresolution (30cm) aerial orthophotos from USGS.
We analyze these datasets using a model based on deeplearning, using both convolutional and recurrent neuralnetworks to analyze the images and associated questions. Themost probable answer from a predefined set is then selected.
This first analysis shows promising results, suggesting thepotential for future applications of such systems. These re-sults outline future research directions which are needed toovercome language biases and difficult tasks such as counting.The former can be tackled using an attention mechanism [24],while the latter could be tackled by using dedicated compo-nents for counting questions [33] in a modular approach.
PRE-PRINT. FINAL VERSION IN IEEE TRANSACTIONS ON GEOSCIENCE AND REMOTE SENSING 11
0
6
54
402
2980
22025
162754
Tru
e
Predicted
Yes N
o0m
²1m
² - 1
0m²
10m² -
100
m²
100m
² - 1
000m
²
1000
m²+
0 1 2 3 4 5 6 7 8 9 10
Yes
No
0m²
1m² - 10m²
10m² - 100m²
1000m²+
0
1
2
3
4
5
6
7
8
9
10
100m² - 1000m²
(a) Test set 1
0
6
54
402
2980
22025
Tru
e
Predicted
Yes N
o0m
²1m
² - 1
0m²
10m² -
100
m²
100m
² - 1
000m
²
1000
m²+
0 1 2 3 4 5 6 7 8 9 10
Yes
No
0m²
1m² - 10m²
10m² - 100m²
1000m²+
0
1
2
3
4
5
6
7
8
9
10
100m² - 1000m²
(b) Test set 2
Fig. 11. Subsets of the confusion matrices for the high resolution dataset (counts are at logarithm scale) on both test sets. Red lines group answers by type(”Yes/No”, areas, numbers).
Fig. 12. Evolution of the accuracies (evaluated on the first HR test set) aftertraining with subsets of different size of the HR training set.
Issues regarding the current database raised in section IValso need to be addressed to obtain a system capable ofanswering a more realistic range of questions. This can bedone by making the proposed dataset construction methodmore complex or by using human annotators.
ACKNOWLEDGMENT
The authors would like to thank CNES for the funding ofthis study (R&T project ”Application des techniques de VisualQuestion Answering a des donnes d’imagerie satellitaire”).
REFERENCES
[1] K. Anderson, B. Ryan, W. Sonntag, A. Kavvada, and L. Friedl, “Earthobservation in service of the 2030 agenda for sustainable development,”Geo-spatial Information Science, vol. 20, no. 2, pp. 77–96, 2017.
[2] Y. Gu, J. Chanussot, X. Jia, and J. A. Benediktsson, “Multiple kernellearning for hyperspectral image classification: A review,” IEEE Trans-actions on Geoscience and Remote Sensing, vol. 55, no. 11, pp. 6547–6565, Nov 2017.
[3] S. Li, W. Song, L. Fang, Y. Chen, P. Ghamisi, and J. A. Benediktsson,“Deep learning for hyperspectral image classification: An overview,”IEEE Transactions on Geoscience and Remote Sensing, pp. 1–20, 2019.
[4] J. E. Vargas-Munoz, S. Lobry, A. X. Falcao, and D. Tuia, “Correctingrural building annotations in openstreetmap using convolutional neuralnetworks,” ISPRS Journal of Photogrammetry and Remote Sensing, vol.147, pp. 283–293, 2019.
[5] S. Antol, A. Agrawal, J. Lu, M. Mitchell, D. Batra, C. L. Zitnick,and D. Parikh, “VQA: Visual Question Answering,” in InternationalConference on Computer Vision, 2015.
[6] S. Lobry, J. Murray, D. Marcos, and D. Tuia, “Visual question answeringfrom remote sensing images,” in IEEE International Geoscience andRemote Sensing Symposium, July 2019.
[7] Z. Shi and Z. Zou, “Can a machine generate humanlike language descrip-tions for a remote sensing image?” IEEE Transactions on Geoscienceand Remote Sensing, vol. 55, no. 6, pp. 3623–3634, June 2017.
[8] X. X. Zhu, D. Tuia, L. Mou, G. Xia, L. Zhang, F. Xu, and F. Fraundorfer,“Deep learning in remote sensing: A comprehensive review and list ofresources,” IEEE Geoscience and Remote Sensing Magazine, vol. 5,no. 4, pp. 8–36, Dec 2017.
[9] F. Hu, G.-S. Xia, J. Hu, and L. Zhang, “Transferring deep convolutionalneural networks for the scene classification of high-resolution remotesensing imagery,” Remote Sensing, vol. 7, no. 11, pp. 14 680–14 707,2015.
[10] J. Deng, W. Dong, R. Socher, L.-J. Li, K. Li, and L. Fei-Fei, “ImageNet:A Large-Scale Hierarchical Image Database,” in IEEE Conference onComputer Vision and Pattern Recognition, 2009.
[11] Q. Wang, S. Liu, J. Chanussot, and X. Li, “Scene classification withrecurrent attention of VHR remote sensing images,” IEEE Transactionson Geoscience and Remote Sensing, vol. 57, no. 2, pp. 1155–1167, Feb2019.
[12] G.-S. Xia, X. Bai, J. Ding, Z. Zhu, S. Belongie, J. Luo, M. Datcu,M. Pelillo, and L. Zhang, “DOTA: A large-scale dataset for objectdetection in aerial images,” in IEEE Conference on Computer Visionand Pattern Recognition, 2018, pp. 3974–3983.
[13] Q. Li, L. Mou, Q. Xu, Y. Zhang, and X. X. Zhu, “R3-Net: A deepnetwork for multioriented vehicle detection in aerial images and videos,”IEEE Transactions on Geoscience and Remote Sensing, pp. 1–15, 2019.
[14] M. Volpi and D. Tuia, “Dense semantic labeling of subdecimeter reso-lution images with convolutional neural networks,” IEEE Transactionson Geoscience and Remote Sensing, vol. 55, no. 2, pp. 881–893, 2016.
[15] E. Maggiori, Y. Tarabalka, G. Charpiat, and P. Alliez, “Can semanticlabeling methods generalize to any city? the INRIA aerial image labelingbenchmark,” in IEEE International Geoscience and Remote SensingSymposium. IEEE, 2017, pp. 3226–3229.
[16] B. Huang, K. Lu, N. Audeberr, A. Khalel, Y. Tarabalka, J. Malof,A. Boulch, B. Le Saux, L. Collins, K. Bradbury et al., “Large-scalesemantic classification: outcome of the first year of INRIA aerial imagelabeling benchmark,” in IEEE International Geoscience and RemoteSensing Symposium. IEEE, 2018, pp. 6947–6950.
[17] I. Demir, K. Koperski, D. Lindenbaum, G. Pang, J. Huang, S. Basu,F. Hughes, D. Tuia, and R. Raskar, “Deepglobe 2018: A challenge to
PRE-PRINT. FINAL VERSION IN IEEE TRANSACTIONS ON GEOSCIENCE AND REMOTE SENSING 12
parse the earth through satellite images,” in IEEE/CVF Conference onComputer Vision and Pattern Recognition Workshops. IEEE, 2018.
[18] L. Zhou, C. Zhang, and M. Wu, “D-linknet: Linknet with pretrainedencoder and dilated convolution for high resolution satellite imageryroad extraction.” in IEEE/CVF Conference on Computer Vision andPattern Recognition Workshops, 2018, pp. 182–186.
[19] R. Hamaguchi and S. Hikosaka, “Building detection from satelliteimagery using ensemble of size-specific detectors,” in 2018 IEEE/CVFConference on Computer Vision and Pattern Recognition Workshops(CVPRW). IEEE, 2018, pp. 223–2234.
[20] C. Tian, C. Li, and J. Shi, “Dense fusion classmate network for landcover classification.” in IEEE/CVF Conference on Computer Vision andPattern Recognition Workshops, 2018, pp. 192–196.
[21] X. Zhang, X. Li, J. An, L. Gao, B. Hou, and C. Li, “Natural languagedescription of remote sensing images based on deep learning,” in IEEEInternational Geoscience and Remote Sensing Symposium, July 2017,pp. 4798–4801.
[22] X. Zhang, X. Wang, X. Tang, H. Zhou, and C. Li, “Description gener-ation for remote sensing images using attribute attention mechanism,”Remote Sensing, vol. 11, no. 6, p. 612, 2019.
[23] B. Wang, X. Lu, X. Zheng, and X. Li, “Semantic descriptions ofhigh-resolution remote sensing images,” IEEE Geoscience and RemoteSensing Letters, 2019.
[24] Q. Wu, D. Teney, P. Wang, C. Shen, A. Dick, and A. v.d. Hengel, “Visualquestion answering: A survey of methods and datasets,” Computer Visionand Image Understanding, 2017.
[25] A. Fukui, D. H. Park, D. Yang, A. Rohrbach, T. Darrell, andM. Rohrbach, “Multimodal compact bilinear pooling for visual questionanswering and visual grounding,” arXiv preprint arXiv:1606.01847,2016.
[26] H. Ben-Younes, R. Cadene, M. Cord, and N. Thome, “MUTAN: Multi-modal tucker fusion for Visual Question Answering,” in Proceedings ofthe IEEE international conference on computer vision, 2017, pp. 2612–2620.
[27] P. Anderson, X. He, C. Buehler, D. Teney, M. Johnson, S. Gould, andL. Zhang, “Bottom-up and top-down attention for image captioning andvisual question answering,” in Proceedings of the IEEE conference oncomputer vision and pattern recognition, 2018, pp. 6077–6086.
[28] R. Shrestha, K. Kafle, and C. Kanan, “Answer them all! toward universalvisual question answering models,” in IEEE Conference on ComputerVision and Pattern Recognition, 2019, pp. 10 472–10 481.
[29] J. P. Bigham, C. Jayant, H. Ji, G. Little, A. Miller, R. C. Miller, R. Miller,A. Tatarowicz, B. White, S. White et al., “VizWiz: nearly real-timeanswers to visual questions,” in ACM symposium on User interfacesoftware and technology. ACM, 2010, pp. 333–342.
[30] D. Gurari, Q. Li, A. Stangl, A. Guo, C. Lin, K. Grauman, J. Luo,and J. Bigham, “VizWiz Grand Challenge: Answering visual questionsfrom blind people,” IEEE Conference on Computer Vision and PatternRecognition, 2018.
[31] J. Johnson, B. Hariharan, L. van der Maaten, L. Fei-Fei, C. Zitnick, andR. Girshick, “CLEVR: A diagnostic dataset for compositional languageand elementary visual reasoning,” IEEE Conference on Computer Visionand Pattern Recognition, 2017.
[32] K. He, X. Zhang, S. Ren, and J. Sun, “Deep residual learning forimage recognition,” IEEE Conference on Computer Vision and PatternRecognition, 2016.
[33] S. Lobry and D. Tuia, “Deep Learning Models to Count Buildingsin High-Resolution Overhead Images,” in Joint Urban Remote SensingEvent, 2019.
[34] R. Kiros, Y. Zhu, R. Salakhutdinov, R. Zemel, A. Torralba, R. Urtasun,and S. Fidler, “Skip-thought vectors,” Neural Information ProcessingSystems, 2015.
[35] Y. Zhu, R. Kiros, R. Zemel, R. Salakhutdinov, R. Urtasun, A. Torralba,and S. Fidler, “Aligning books and movies: Towards story-like visualexplanations by watching movies and reading books,” in IEEE interna-tional conference on computer vision, 2015, pp. 19–27.
[36] A. Li, Z. Lu, L. Wang, T. Xiang, and J.-R. Wen, “Zero-shot sceneclassification for high spatial resolution remote sensing images,” IEEETransactions on Geoscience and Remote Sensing, vol. 55, no. 7, pp.4157–4167, 2017.
[37] D. Kingma and J. Ba, “Adam: A method for stochastic optimization,”International Conference on Learning Representations, 2015.
[38] Y. Zhang, J. Hare, and A. Prgel-Bennett, “Learning to count objectsin natural images for visual question answering,” in InternationalConference on Learning Representations, 2018.
[39] D. Tuia, C. Persello, and L. Bruzzone, “Domain adaptation for theclassification of remote sensing data: An overview of recent advances,”
IEEE Geoscience and Remote Sensing Magazine, vol. 4, no. 2, pp. 41–57, June 2016.
[40] W.-L. Chao, H. Hu, and F. Sha, “Cross-dataset adaptation for visualquestion answering,” in IEEE Conference on Computer Vision andPattern Recognition, 2018, pp. 5716–5725.
[41] Y. Goyal, T. Khot, D. Summers-Stay, D. Batra, and D. Parikh, “Makingthe V in VQA matter: Elevating the role of image understanding inVisual Question Answering,” in IEEE Conference on Computer Visionand Pattern Recognition, 2017.
Sylvain Lobry (S16 - M17) received the Engi-neering degree from Ecole pour l’Informatique etles Techniques Avancees (EPITA), Kremlin Bicetre,France in 2013, the Masters degree in science andtechnology from the University Pierre et Marie Cur-rie (Paris 6), Paris in 2014, and the Ph.D. degreefrom Telecom Paris, Paris, France, in 2017. He iscurrently a Post-Doctoral Researcher with the Geo-Information Science and Remote Sensing Labora-tory, Wageningen University, The Netherlands. Hisresearch interests include radar image processing
and multimodal processing of heterogeneous satellite data.
Diego Marcos Diego Marcos obtained an MScdegree on Computational Sciences and Engineeringfrom the Ecole Polytechnique Federale de Lausanne,Switzerland, in 2014 and a Ph.D. degree in environ-mental sciences from Wageningen University, TheNetherlands, in 2019. He is currently a Post-DoctoralResearcher with the Geo-Information Science andRemote Sensing Laboratory, at Wageningen Univer-sity. His research interests include computer visionand deep learning interpretability applied to geospa-tial data.
Jesse Murray received an MSc degree in Geo-Information Science from Wageningen University,Wageningen, The Netherlands, in 2019. He is cur-rently a Ph.D. candidate with the Geodetic Engineer-ing Laboratory, at the Ecole Polytechnique Fdralede Lausanne, Switzerland. His research interestsinclude image processing and 3D geometry recon-struction using computer vision and spatio-temporaldata.
Devis Tuia Devis Tuia (S07 - M09 - SM15) re-ceived the Ph.D. degree from the University ofLausanne, Lausanne, Switzerland, in 2009. He wasa Post-Doctoral Researcher in Valncia, Boulder, CO,USA, and Ecole polytechnique federale de Lausanne(EPFL), Lausanne. From 2014 to 2017, he was anAssistant Professor with the University of Zurich,Zrich, Switzerland. He is currently a Full Professorwith the Geo-Information Science and Remote Sens-ing Laboratory, Wageningen University, Wagenin-gen, The Netherlands. His research interests include
algorithms for data fusion of geospatial data (including remote sensing) usingmachine learning and computer vision.