Embed Size (px)
Citation preview

Catalysts 2011, 1, 175-190; doi:10.3390/catal1010175
catalystsISSN 2073-4344
www.mdpi.com/journal/catalysts
Article
Pre-Reduction of Au/Iron Oxide Catalyst for Low-Temperature Water-Gas Shift Reaction Below 150 °C
Shinji Kudo 1,2, Taisuke Maki 1, Takashi Fukuda 1 and Kazuhiro Mae 1,*
1 Department of Chemical Engineering, Graduate School of Engineering, Kyoto University,
Kyoto-daigaku Katsura, Nishikyo-ku, Kyoto 615-8510, Japan;
E-Mails: [email protected] (S.K.); [email protected] (T.M.);
[email protected] (T.F.) 2 Research and Education Center of Carbon Resources, Kyushu University, Kasuga 816-8580, Japan
* Author to whom correspondence should be addressed; E-Mail: [email protected];
Tel.: +81-75-383-2668; Fax: +81-75-383-2658.
Received: 6 October 2011; in revised form: 14 November 2011 / Accepted: 29 November 2011 /
Published: 9 December 2011
Abstract: Low-temperature water-gas shift reaction (WGS) using gold catalyst is expected
to be an attractive technique to realize an efficient on-site hydrogen production process. In
this paper, Au/Fe3O4 catalysts for promoting the WGS below 150 °C were developed by a
preliminary reduction of Au/iron oxide (Fe3+) catalyst utilizing high reactivity of Au
nano-particles. The reduction was conducted under a CO, H2, or CO/H2O stream at either
140 or 200 °C, and the effect of reduction conditions on the characteristics of the Au/Fe3O4
catalyst and on the catalytic activity in WGS at 80 °C was investigated. The reaction
progress during the pre-reduction treatment was qualitatively analyzed, and it was found
that the iron oxide in Au/Fe2O3 calcined at 200 °C was easily reduced to Fe3O4 phase in all
reduction conditions. The reduction conditions affected the characteristics of both Au and
iron oxide, but all of the reduced catalysts had small Fe3O4 particles of less than 20 nm
with Au particles on the surface. The surface area and content of cationic Au were high in
the order of CO, H2, CO/H2O, and 140, 200 °C. In the WGS test at 80 °C using the
developed catalysts, the activities of the catalysts pre-reduced by CO at 140 or 200 °C and
by H2 at 140 °C were very high with 100% CO conversion even at such a low temperature.
These results indicated that factors such as higher surface area, crystallized Fe3O4, and
cationic Au content contributed to the catalytic activity.
OPEN ACCESS
Catalysts 2011, 1
176
Keywords: water-gas shift; gold catalyst; iron oxide; pretreatment; reduction; activation
1. Introduction
On-site hydrogen production from liquid fuels such as methanol and DME (dimethyl ether) is
currently regarded as a promising technology for PEFC (Polymer electrolyte fuel cell) applications [1].
Methanol and DME are suitable for portable applications because of their high density and can be
reformed to H2 by catalytic steam reforming at relatively low temperatures. However, carbon
monoxide and methane are also produced via side reactions such as decomposition reactions, reverse
water-gas shift reaction, and methanation at high reaction temperatures above 300 °C. Because CO
contained as by-product in the fuel poisons an electrode in the fuel cell [2], the on-site H2 production
process typically involves a series of reaction steps to remove CO after the reforming step, which is
composed of water-gas shift reaction (WGS) and selective CO oxidation. In addition, methane has to
be removed using pressure swing adsorption (PSA) with large energy consumption before supplying to
PEFC. In this system, WGS is a key reaction that produces H2 and CO2 from H2O and CO, but is
governed by thermodynamic equilibrium. Reducing CO requires the operation of the WGS at a low
temperature. The present WGS process in on-site H2 production system has adopted Cu/ZnO/Al2O3 as
a catalyst. The Cu-type catalyst is often used at temperatures in the range of 180–300 °C, but has little
catalytic activity at lower temperatures, and the reactor is too big. Furthermore, the CO conversion is
not more than 90% even using a good Cu-type catalyst due to chemical equilibrium restriction [3].
Thus, the development of catalysts to accelerate the reaction rate at low temperatures below 150 °C is
desired to realize an efficient on-site H2 production system.
Gold catalysts have been widely studied since the discovery of catalytically active nano-sized Au
particles supported on metal oxides by Haruta et al. [4] This catalyst has an extremely high activity in
CO oxidation reaction even at room temperature. In addition, gold catalysts on various metal oxides
are highly active in many other reactions [5–13]. Andreeva et al. firstly applied the gold catalyst to the
WGS and showed the potential for high catalytic activity even below 180 °C [14–16]. Among gold
catalysts supported on various kinds of metal oxides, Au/Fe2O3 is one of the active catalysts for
low-temperature WGS due to the redox ability of Fe2O3 [17]. In WGS, Fe2O3 is easily reduced to the
magnetite, Fe3O4, because it is the stable oxidation state in equilibrium [18] It is well known that Fe3O4
is the catalytically active phase in high-temperature WGS, and this is applied to low-temperature WGS
using gold-loaded iron oxide catalysts as well [19,20]. In these studies, the effect of Au/iron oxide
catalysts was shown, but the state of catalyst structure was not strictly controlled because the reduction
of Fe2O3 and agglomeration of Au particles inevitably proceed during the reaction. If the Au particles
remain as nano-particles on crystallized Fe3O4 support with high surface area, it is expected that the
reaction rate of WGS increases even below 150 °C, and a drastic CO reduction can be brought about
with small reactor size.
To achieve this, the pre-reduction of Au/Fe2O3 at low temperature is important because the porous
structure of the iron oxide is easily destructured by heat. From this viewpoint, we first examined the
WGS using catalysts prepared by different conditions, and then developed a proper pre-reduction

Catalysts 2011, 1
177
method to maintain small Au and Fe3O4 nano-particles. Using these catalysts, the WGS reactivity at
80 °C was investigated, and the effect of the proposed pre-reduction method on the reduction of CO
was clarified.
2. Experimental Section
2.1. Preparation of Au/Iron Oxide Catalysts
Au/iron oxide (Fe3+) catalyst was prepared from Fe(NO3)3·9H2O (Wako Pure Chemical Industries,
Ltd.: Osaka, Japan) and HAuCl4·4H2O (Kojima Chemicals Co., Ltd.: Osaka, Japan) as precursor
materials. The preparation method has been described in detail in our previous report [21]. The
precursors were dissolved in distilled water to prepare 200 mL of 1.69–1.86 ×10² mmol L−1 iron nitrate
aqueous solution and 100 mL of 0.15–1.52 × 10 mmol L−1 chlorauric acid aqueous solution for the
synthesis of 3 g Au/iron oxide catalyst containing 1, 3, and 10 wt% Au. The pH value of the iron
nitrate solution was controlled at 8.2 by adding Na2CO3 powder (Wako Pure Chemical Industries, Ltd.:
Osaka, Japan) for hydrolysis, and the suspension was vigorously stirred in a water bath at 60 °C. After
1 h of aging, the chlorauric acid solution was added to the iron hydroxide solution, followed by
additional 0.5 h stirring. During the aging and mixing processes, the pH value was maintained within
8.0–8.4 by the addition of diluted nitric acid and sodium carbonate. The precipitates were filtered and
washed with 1 L of distilled water (60 °C) to eliminate Cl− and Na+. Finally, they were vacuum-dried
for 12 h at 80 °C, followed by calcination in a heater for 2 h at 200 or 400 °C. The prepared catalysts
were sieved to the particle size between 0.3 and 1.0 mm for catalytic activity tests. Following is a
summary of the catalysts prepared under different conditions: calcined at 200 °C with 1, 3, and 10 wt%
Au and calcined at 400 °C with 3 wt% Au. In addition, iron oxide calcined at 200 °C with no Au
content was also prepared by the same procedure as a reference. The catalysts, thus prepared, are
collectively denoted as Au/Fe2O3, although the iron oxide might contain other oxidation states such as
ferrihydrite, Fe5HO8·4H2O.
2.2. Catalyst Characterizations
X-ray diffraction (XRD) patterns of catalysts were measured by an X-ray diffractometer (RIGAKU,
multiflex) equipped with a Cu-Kα radiation source at a voltage of 40 kV and a current of 40 mA.
The BET surface area and the pore size distribution were obtained from N2 adsorption data at 77 K
(BELJAPAN, Belsorp-mini) using the BET equation and the BJH method, respectively. The morphology
and microstructure of catalysts were observed using a transmission electron microscope (TEM; JEOL,
JEM-1010) at an accelerating voltage of 100 kV. For the TEM observations, samples were ground to
fine powder and dispersed in ethanol using ultrasonic agitation. A drop of the suspension was then
transferred to a carbon-coated Cu mesh grid and dried at room temperature. X-ray photoelectron
spectroscopy (XPS) spectra were measured with SHIMADZU ESCA-3400 using an Al Kα radiation
source at an accelerating voltage of 10 kV and an emission current of 20 mA. The measurements were
performed under vacuum pressure of less than 5 × 10⁻⁶ Pa. A correction of binding energy was
performed, referencing the position of C 1s peak at 284.8 eV.

Catalysts 2011, 1
178
2.3. Measurement of Catalytic Activity
Prepared catalysts were loaded into a quartz tube reactor with a 7 mm inner diameter for the
catalytic activity test. The reaction temperature was controlled with an infrared gold image furnace by
monitoring the temperature at inlet and outlet of the catalyst bed. Two kinds of WGS tests were
conducted for examining catalytic activity: one is the temperature dependence test using as-prepared
catalysts; and the other is the WGS at 80 °C using the samples reduced in various ways from Au/Fe2O3
catalyst (Au: 3 wt%) calcined at 200 °C. In the temperature dependence test, the prepared Au/Fe2O3
catalysts were used without pre-reduction. The catalyst bed was heated to the starting temperature,
140 °C, under an Ar stream and kept for 0.5 h to remove air and moisture, followed by the introduction
of the reactant gas. The reactant gas (H2 45.9%, CO 8.3%, CO2 4.1%, H2O 41.7%) was fed to 0.4 g of
the catalyst bed at gas hourly space velocity (GHSV) of 2600 h−1. In the WGS reaction test at 80 °C,
the catalyst was reduced prior to the reaction. The pre-reduction was conducted under three different
reducing gas streams, CO/N2, H2/Ar, and CO/H2O/N2, at two different temperatures, 140 and 200 °C.
The flow rates of the reducing gases were 20, 20, and 26 (steam/carbon ratio, S/C = 10) mL min−1,
respectively, over 0.3 g catalyst, where the flow rates of reducing gases, CO and H2, were unified to
0.62 mL min−1. After a 2 h pre-reduction, the temperature was decreased under an Ar stream to room
temperature for characterizations of the reduced samples or to 80 °C for catalytic activity tests. In the
WGS test at 80 °C, the reactant (CO/H2O/N2 = 2.2/30.3/67.5) was introduced into the catalyst bed at
GHSV = 2800 h−1. Since the partial pressure of H2O, about 30 kPa, is sufficiently lower than the
saturation vapor pressure at 80 °C, 47.4 kPa, the vapor was not condensed to liquid.
The effluent gas from the reactor was diverted through a cold trap to remove H2O, mixed with an
Ar flow of 50 mL min−1 for dilution, and then analyzed using an on-stream gas chromatograph
(VARIAN, CP-4900 Micro-GC) equipped with a thermal conductivity detector and two columns, a
Molsieve 5A and a PoraPLOT Q. Analytical values were expressed as the conversions of CO and H2,
and the yields of CO2 and H2. The conversions were calculated from the ratio of the inlet and outlet
molar flow rates as 1 − Foutlet/Finlet, where F stands for the molar flow rate of CO or H2. The yields were
obtained from the ratio of the outlet molar flow rate of CO2 or H2 over the inlet molar flow rate of CO.
3. Results and Discussion
3.1. Temperature Dependence of Catalytic Activity in WGS
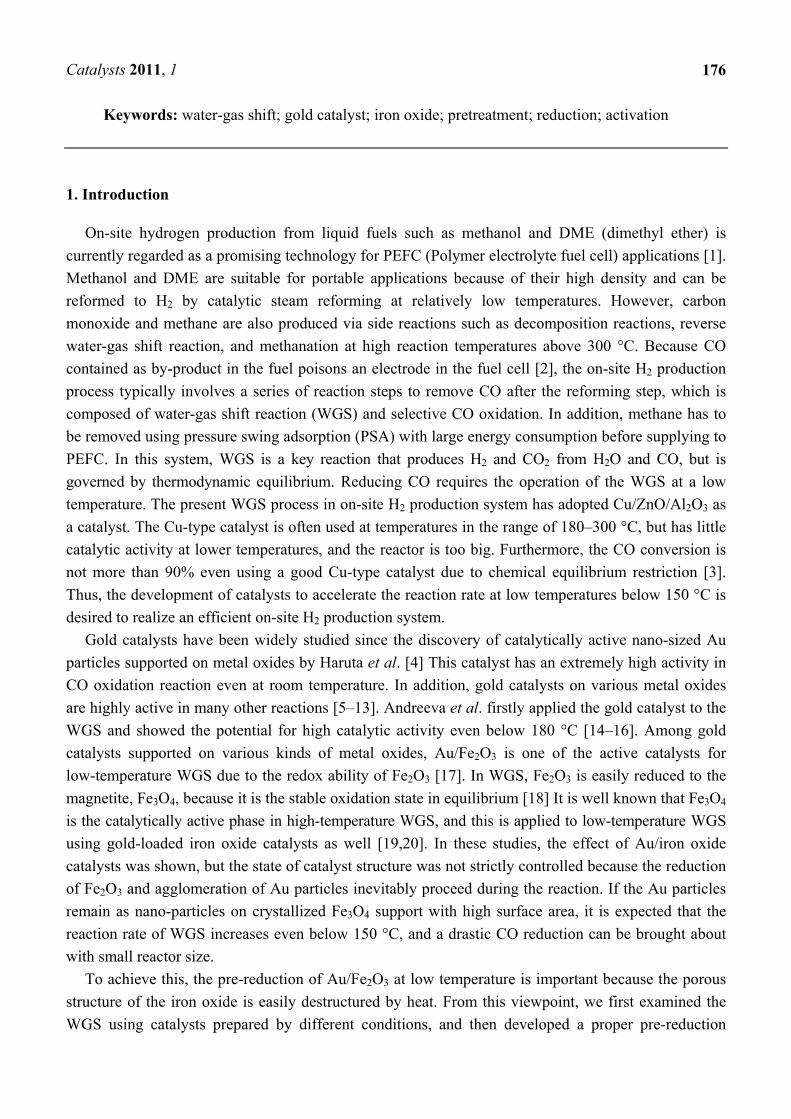
Figure 1 compares the catalytic activities of the prepared Au/Fe2O3 catalysts in WGS. All of the
samples were tested in the same temperature profile, wherein the temperature was raised at a rate of
10 °C min−1 and maintained for 40 min at the given reaction temperature. An average value of
conversion was calculated from three data collected during the last 10 min of the constant temperature
period. Thermodynamically calculated equilibrium CO conversion curve is also drawn.
The CO conversions reached the equilibrium values below 200 °C in the samples loaded with
10 and 3 wt% Au and calcined at 200 °C. The CO conversion using these samples gradually decreased
with increasing temperature and deviated from the equilibrium one because of a catalytic deactivation.
In terms of the Au content, 3 wt% was enough to convert CO at low temperatures. However, the effect
of Au content on CO conversion was significantly reduced at higher temperatures. The sample
Catalysts 2011, 1
179
calcined at 400 °C showed a lower activity at low temperatures, while the difference of conversion
among the gold catalysts was reduced with the increase in reaction temperature.
Figure 1. Catalytic performance of Au/Fe2O3 catalyst (as-prepared) in WGS (0.4 g catalyst,
H2/CO/CO2/H2O = 45.9/8.3/4.1/41.7%, and GHSV = 2600 h−1); samples calcined at
200 °C with Au contents of (a) 10 wt%; (b) 3 wt%; (c) 1 wt%; (d) with no Au and
(e) calcined at 400 °C with Au content of 3 wt%, and equilibrium CO conversion
(dashed line).
1.0
0.8
0.6
0.4
0.2
0.0
CO
con
vers
ion
[-]
300250200150Temperature [˚C]
(a)
(c)
(b)
(e)
(d)
These results reflect the reaction system of WGS using an Au/iron oxide catalyst; the catalytic
activity is caused by small Au particles activated by synergism with the support at low temperatures,
gradually shifting to be support-dependent at high temperatures [20]. The catalytic activity of gold is
diminished by the agglomeration of Au particles with the increase in reaction temperature. On the
other hand, the reaction involves the reduction of Fe2O3 to Fe3O4 phase, which is a catalytically active
oxidation state [19,20] The shift in catalytic activity from Au-dependent to iron oxide dependent is
clearly seen in the conversion curve of 1 wt% Au catalyst that showed low conversion of CO at 140 °C
because of the low content of Au. The catalytic activity of Au increased with temperature up to 180 °C
and then decreased due to the agglomeration, while the active site shifted to iron oxide at around
250 °C, leading to the increase in conversion at 300 °C.
The catalytic activity was thus affected by complicated structural change during the reaction.
A temperature-programmed reduction (TPR) study of Au/iron oxide is well established, demonstrating
that the reduction of iron oxide by H2 at low temperature is accelerated by the existence of Au and by
the lower crystallinity of iron oxide [22,23]. These studies suggest that the gold catalysts calcined at
200 °C of this study were activated to the form of Au/Fe3O4 at the first test point of 140 °C. Namely,
the control of the structure of Au/Fe3O4 is essential to enhance the catalytic activity at low
temperatures. In the following sections, we discussed the low-temperature pre-reduction for Au/Fe2O3
catalyst (Au 3 wt%) calcined at 200 °C, which showed high catalytic activity, to develop more
efficient catalyst for low-temperature WGS.

Catalysts 2011, 1
180
3.2. Pre-Reduction of Au/Fe2O3 Calcined at 200 °C
The reduction temperatures employed were 140 and 200 °C. As reducing gases, CO and H2 were
used because they are possible reactants involved in WGS to reduce iron oxide, and CO/H2O was also
used as a WGS condition. Using these conditions, the pre-reductions were conducted for 2 h,
producing six kinds of reduced samples. The reduced catalysts were represented by reduction
temperature and reducing gas, e.g., 140-CO.
Figure 2. Product gas during pre-reduction of Au/Fe2O3 (3 wt% Au, calcined at 200 °C) as
conversions of CO or H2 and yields of CO2 and H2; pre-reduction at 140 °C by (a) H2;
(b) CO/H2O and (c) CO.
1.0
0.8
0.6
0.4
0.2
0.0
H2
conv
ersi
on [-
]
120100806040200Time [min]
H2 conversion
(a)
1.0
0.8
0.6
0.4
0.2
0.0120100806040200
Time [min]CO
con
vers
ion
[-]
H2
an
d C
O2
yie
ld [m
ol m
ol-C
O-1
]
CO conversion CO2 yield H2 yield
(c)
1.0
0.8
0.6
0.4
0.2
0.0120100806040200
Time [min]
CO conversion CO2 yield H2 yield
CO
con
vers
ion
[-]
H2
and
CO
2 y
ield
[m
ol m
ol-C
O-1
]
(b)
First, the reaction mechanism during the pre-reduction of Au/Fe2O3 calcined at 200 °C was
qualitatively discussed by analyzing the product gas. The produced gas was analyzed every 3 min
during the treatment, and the conversions of CO or H2 and the yields of H2 and CO2 were calculated.
Figure 2 shows the change in the product gases for each treatment at 140 °C; (a) H2 reduction,
(b) CO/H2O reduction, and (c) CO reduction. In the pre-reduction treatments at 200 °C, similar results
were obtained. The amounts of formed or consumed CO, H2, and CO2 were calculated by integrating
the conversions and yields, and summarized in Table 1. In H2 pre-reduction treatment, the amount of
H2 consumed was nearly equal to the stoichiometrically calculated value, 1.91 mmol g-cat−1, based on
the equation: Fe2O3 + 1/3H2 → 2/3Fe3O4 + 1/3H2O. The reduction of iron oxide by H2 is believed to
progress through a dissociation of H2 into hydrogen atoms on Au particles and the following spillover
on iron oxide to drive the reduction as: Fe3+OH− + H → Fe2+ + H2O [22]. In CO/H2O pre-reduction
treatment, CO was completely consumed throughout the operating period, and CO2 was maintained at

Catalysts 2011, 1
181
stoichiometric yield; however, it took about 40 min for H2 to reach the stoichiometric yield. This result
suggests that H2 produced by WGS at the initial stage of the treatment was consumed for reducing iron
oxide. The amount of H2 consumed during CO/H2O pre-reduction was almost the same with that during
H2 pre-reduction. From these results, it was clarified that H2 had a significant role to reduce iron oxide
in the reduction. On the other hand, in CO pre-reduction treatment, the amount of CO consumed was
about two-fold greater than the amount of H2 consumed in other two pre-reductions, indicating that the
CO pre-reduction cannot be represented simply by the equation, Fe2O3 + 1/3CO → 2/3Fe3O4 + 1/3CO2.
Table 1. Amounts of CO, H2, and CO2 consumed and formed during pre-reduction.
Reducing gas Temperature [°C] Consumed [mmol g-cat−1] Formed [mmol g-cat−1]
CO H2 H2 CO2 H2 140 – 1.57 – – H2 200 – 1.67 – –
CO/H2O a 140 – 1.62 b – – CO/H2O a 200 – 1.73 b – –
CO 140 3.49 – 0.26 2.88 CO 200 3.41 – 0.23 2.64
a Consumed CO, formed CO2 and H2 are not listed; b Calculated from H2 yield assuming that H2 was produced by WGS but consumed for the reduction of iron oxide.
Andreeva et al. [14] proposed the reaction mechanism of WGS on the Au/α-Fe2O3 catalyst: the
redox transfer cycle between Fe2+ and Fe3+ by ad/desorption of carbon species and the dissociative
adsorption of H2O on Au particles. In this scheme, formate is formed from the adsorbed CO and the
adjacent hydroxyl group, followed by desorption of CO2 and H atom accompanying the reduction of
Fe3+ to Fe2+ as: AuOH−Fe3+ + CO → Au□Fe3+-COOH− → Au□Fe2+ + CO2 + H, where the symbol “□”
expresses the site of iron oxide adjacent to Au, which presumably activates the Au for the dissociative
adsorption of H2O.
Taking this scheme into consideration, an additional experiment was conducted for the CO-reduced
sample as follows; the sample after 140-CO treatment was kept at the reduction temperature for 30 min
under an Ar stream to completely purge CO, and then H2O with carrier Ar (H2O/Ar = 20/80) was
introduced to the catalyst bed. Figure 3 shows the yield of product gas from the H2O introduction. H2
began to form at the moment of H2O introduction, and the yield reached the maximum at 9 min and
decreased to 0 within 40 min. Simultaneously, a small amount of CO2 was formed. The amounts of H2
and CO2 formed through this operation were 1.34 and 0.38 mmol g-cat−1, respectively. This result
confirms that the sample reduced by CO has a surprisingly active site for dissociative adsorption of
H2O, expressed by the symbol “□”. The total amount of CO2 formed through the successive treatment
of CO reduction and H2O introduction was balanced with the amount of CO consumed in the reduction
treatment. As for H2, the total amount was almost identical to the amount of H2 consumed in H2
pre-reduction and equal to half of that of CO2 formed. Therefore, we can describe the scheme of the
CO reduction treatment as: AuOFe3+ + CO → Au□Fe2+ + CO2. The following steam treatment involves
the dissociative adsorption of H2O; therefore, the scheme is presumed as: Au□Fe2+ + H2O →
Au-H+OH−□Fe2+ → AuOH−Fe3+ + 1/2H2, thus leading to the initiation of the aforementioned
WGS cycle.

Catalysts 2011, 1
182
The cause for the small amount of H2 formed in the reduction treatment (Figure 2(c)) and CO2
formed in the H2O treatment (Figure 3) cannot be specified, but minor reactions occurred by regional
physical or chemical structure may account for this.
Figure 3. Yields of H2 and CO2 during H2O introduction to the catalyst reduced under
140-CO condition.
2.0
1.5
1.0
0.5
0.0
H2
an
d C
O2
yie
ld [m
ol m
ol-C
O-1
]
806040200Time [min]
CO2 yield H2 yield
3.3. Characterizations of the Catalyst After Pre-Reduction
Analysis of the product gas from pre-reductions implied that iron oxide in the catalyst was reduced
to Fe3O4 phase even at 140 °C. Structural characteristics and XRD patterns of the reduced samples are
shown in Table 2 and Figure 4, respectively. The BET surface area of the non-treated sample was
about 200 m2 g−1, with micropores having peak radius of 1.7 nm.
Table 2. Structural properties of the reduced samples.
Sample SBET Pore volume Pore peak radius DFe3O4
a [m2 g−1] [mm3 g−1] [nm] [nm]
140-CO 149 219 2.2 n/d b 200-CO 84 173 3.1 10.3 140-H2 87 196 4.2 10.1 200-H2 49 170 6.1 14.5
140-CO/H2O 68 224 6.1 11.4 200-CO/H2O 41 203 9.3 16.7
a Medium diameter of Fe3O4 particles calculated from Fe3O4 (220) peak at 2θ = 30.1° based on Scherrer equation; b n/d means not detected.
The surface area significantly decreased with the increase in pore peak radius by the pre-reduction.
The sample before the pre-reduction showed no distinct peaks in the XRD pattern (data not shown).
On the other hand, XRD patterns of the reduced samples showed that the iron oxide was in the form of
Fe3O4, although no peak appeared in the pattern of 140-CO. The ratio of intensities at the peaks of
30.1° and 35.5° (the most intense peak of magnetite), I30.1°/I35.5°, is 30 for pure Fe3O4 [24]. When the
crystallized iron oxide contains α-Fe2O3 phase, the intensity ratio decreases because α-Fe2O3 has the
second most intense peak at 35.7° (overlapping with the most intense peak of magnetite) but does not

Catalysts 2011, 1
183
have in the vicinity of 30.1°. The I30.1°/I35.5° values of the reduced samples were between 28 and 35,
with the exception of 140-CO that had undetectable crystallinity level. These results confirm that the
majority of amorphous iron oxide was reduced to Fe3O4 and crystallized during the pre-reduction. The
highest level of crystallization occurred when CO/H2O was used as reducing gas, followed by H2. The
reduction temperature also affected the crystallization and reduction ability. The surface area of the
samples reduced at 140 °C was about 1.7 times higher than that of the samples reduced at 200 °C for
all reducing gases. The reason for the different structure of 140-CO is still not clear, but is believed to
be related to the oxidation state of iron oxide. In other words, the transformation to Au□Fe2+ by CO
pre-reduction has less impact on the structure of iron oxide, while the overall formation of Fe3O4 phase
by H2O treatment can cause crystallization accompanied by decrease in surface area. In fact, when the
140-CO was treated with steam at 80 °C for 40 min, the surface area decreased to 71 m2 g−1.
Figure 4. XRD patterns of the reduced samples.
Inte
nsity
[-]
6050403020Degree [2θ]
200-CO
140-CO
140-H2
200-H2
140-CO/H2O
200-CO/H2O
magnetite (Fe3O4)hematite (α-Fe2O3)
Figure 5 shows TEM photographs of the prepared Au/Fe3O4 catalysts. The TEM observation
confirms the difference between Fe3O4 particles produced by each reduction treatment. The Fe3O4
particles of 140-CO were less than 5 nm with their appearance being almost the same as that of the
sample before pre-reduction, and the other catalyst also had small Fe3O4 particles of about 20 nm.
These particles of Fe3O4 are surprisingly small compared to the direct synthesis of Fe3O4 in liquid
phase from Fe2+/Fe3+ precursor by precipitation [25,26]. Most of the Fe3O4 particles formed through
the precipitation method are on a micrometer scale because the particle growth after the nucleation of
Fe3O4 by the dehydration reaction of Fe2+ and Fe3+ hydroxides cannot be controlled in the liquid phase
synthesis. On the other hand, the formation of Fe3O4 particles in this study progressed in the gas phase.
The crystal growth in the gas phase can be thermally controlled, as obtained for the samples reduced at
140 °C and 200 °C. However, if the calcination temperature of Au/Fe2O3 is the commonly-used
400 °C, the formed Fe3O4 particles would be large because the reduction of well-crystallized Fe2O3
requires far higher temperatures. Moreover, when Au particles are not loaded on the iron oxide, the
small Fe3O4 particles would not be obtained because Au plays a role on decreasing the reduction

Catalysts 2011, 1
184
temperature [22,23]. Thus, the small Fe3O4 particles were obtained only by reducing amorphous iron
oxide loading of Au at low temperatures as proposed in this study, and the particle size was
controllable with the reducing gas and reduction temperature.
Figure 5. TEM photographs of the reduced samples.
20 nm
140-CO/H2O
20 nm
140-H2
20 nm
140-CO
20 nm
200-CO
20 nm
200-H2
20 nm
200-CO/H2O
TEM photographs also showed Au particles having a diameter below 4 nm. However, it was
difficult to identify the Au particles in 140-CO, 200-CO, and 140-H2. To investigate the state of Au
loaded on the Fe3O4 particles, XPS analysis was performed. Au 4f XPS spectra of the reduced samples
are shown in Figure 6. Although the bulk Au shows a peak of Au 4f7/2 electron binding energy of core
levels at 84.0 eV, the value negatively shifts in general if it is a supported small nano-particle [27,28],
as found at around 83.8 eV in this study. On the other hand, the binding energy of the cationic Au
positively shifts by 0.8–1.4 and 2.8–3.5 eV for Au1+ and Au3+, respectively [27–31]. These tendencies
are applicable to Au 4f5/2 having a peak at 88.0 eV for the bulk Au. These facts indicate that the partial
existence of the cationic Au lowers the overall spectral intensity of Au 4f and gives shoulders at a
binding energy above that of metallic Au [20]. The intensity of the spectrum in this study was varied
among the reduced samples, and the differences showed a broad correlation with the structural
characteristics of iron oxide. The sample 200-CO/H2O, having the lowest surface area, showed the
highest intensity; in contrast, the intensity of 140-CO was the lowest. This indicates that the
crystallization and agglomeration of Fe3O4 particles were accompanied by the reduction of the cationic
Au, Au3+ and Au1+, to metallic Au. Because the samples exhibiting a lower intensity of Au 4f peaks
correspond to the samples having unobservable Au by TEM observation, the cationic Au was expected
to be highly dispersed on the support in an undetectable state for the observation.

Catalysts 2011, 1
185
Figure 6. Au 4f spectra of the catalysts reduced at 140 °C by (a) CO; (b) H2; (c) CO/H2O,
reduced at 200 °C by (d) CO; (e) H2; (f) CO/H2O and (g) 140-CO sample after 24 h of
WGS at 80 °C.
Inte
nsi
ty [-
]
908886848280Binding Energy [eV]
(a)(b)
(c)
(d)(e)
(f)(g)
Au 4f5/2Au 4f7/2
3.4. WGS at 80 °C Using Au/Fe3O4 Catalysts
As shown in Figure 1, the Au/iron oxide catalyst calcined at 200 °C has sufficient catalytic activity
to completely remove CO in the WGS at 140 °C. Therefore, we performed the WGS tests using the
pre-reduced samples, namely Au/Fe3O4 catalysts, at the low temperature of 80 °C to differentiate
conversions of the samples and to determine whether the reaction progresses at such a low temperature.
Prior to the tests, the reduced samples were purged under an Ar stream for 15 min at the reduction
temperature, and the temperature was decreased to 80 °C, followed by H2O treatment for 40 min.
The performances of each Au/Fe3O4 catalyst are shown in Figure 7 as CO conversion against reaction
time for a period of 80 min. For all samples, stoichiometric amounts of H2 and CO2 were produced
from H2O and CO during the reaction period. The pre-reduced catalysts were shown to be active for
WGS even at 80 °C. Complete conversion was achieved by 140-CO and 140-H2 during the majority of
the reaction period, and 200-CO produced conversion above 0.9, corresponding to the reaction rate of
2.3 × 10⁻⁵ mol-CO g-Au−1 s−1 or more. Although the conversions using the other samples were above
0.6 at the initial stage of the reaction, they gradually decreased. From the characterization of Au/Fe3O4
catalysts, the former and the latter groups were assigned to the reduced catalysts having surface areas
greater and less than 80 m2 g−1, respectively. The Au/Fe2O3 catalyst calcined at 400 °C and
preliminarily reduced by H2 at 350 °C for 2 h was also examined for the 80 °C WGS reaction to
compare the catalytic activity; however, it showed zero capability for CO conversion. These results
elucidate our suggestion that the low-temperature pre-reduction of Au/Fe2O3 catalyst having
amorphous iron oxide to prepare Au/Fe3O4 catalysts is very effective for low-temperature WGS
reaction. Au/Fe3O4 catalysts that were appropriately reduced before WGS showed a potential to
completely remove CO even at the operating temperature of PEFC, 80 °C, which indicated that a
compact on-site H2 production system, where the CO oxidation section is not necessary, can be
developed using the catalyst developed in this study.

Catalysts 2011, 1
186
Figure 7. WGS at 80 °C using Au/Fe3O4 catalysts (0.3 g of catalyst, CO/H2O/N2 = 2.2/
30.3/67.5%, GHSV = 2800 h−1).
1.0
0.8
0.6
0.4
0.2
0.0
CO
con
vers
ion
[-]
80706050403020100
Time [min]
140-CO 140-H2
140-CO/H2O
200-CO 200-H2
200-CO/H2O
Figure 8 shows the result of 80 °C WGS using non-reduced Au/Fe2O3 catalyst. Although high
conversion was obtained at the initial stage of the reaction, appropriate amounts of H2 were not
produced, which is similar to the reaction behavior observed during CO pre-reduction (Figure 2(c)).
This indicates that the WGS cycle, which is promoted by redox transfer between Fe2+ and Fe3+, did not
occur despite the presence of H2O in the reactant. CO conversion and CO2 yield show that the
reduction of iron oxide progressed, but the low yield of H2 shows that the catalyst was inactive for
dissociative adsorption of H2O. The reduction of iron oxide by CO was caused by high activity of Au
nano-particles for adsorption of CO. In fact, Silberova et al. [32] found with DRIFTS study that the
conversion of CO to CO2 on Au/Fe2O3 catalyst occurs even at a room temperature through the
decomposition of the carbonate species. Meanwhile, low activity for the dissociative adsorption of
H2O observed in this non-reduced catalyst shows that the site on iron oxide to activate Au for the
reaction, “□”, was not formed. This is possibly due to a low crystallinity of the iron oxide support
resulted from the low reaction temperature. In the case of Fe2O3-ZnO and Fe2O3-ZrO2 catalysts, Au on
the crystallized metal oxide was more active compared to the one on amorphous metal oxide for
WGS [33]; therefore, it is believed that the site for dissociative adsorption of H2O cannot be formed on
amorphous iron oxides. Similarly to CO oxidation using gold catalysts, where the rate-determining
step is the activation of oxygen [34], it is important to activate the catalyst for the dissociative
adsorption of H2O. The Au/iron oxide catalyst employed here, thus indicated, can have high catalytic
activity for low-temperature WGS only when appropriately reduced and crystallized before the reaction.

Catalysts 2011, 1
187
Figure 8. Catalytic performance of non-reduced Au/Fe2O3 (3 wt% Au, calcined at 200 °C)
for WGS at 80 °C (0.3 g of catalyst, CO/H2O/N2 = 2.2/30.3/67.5%, GHSV = 2800 h−1).
1.0
0.8
0.6
0.4
0.2
0.080706050403020100
Time [min]
CO
con
vers
ion
[-]
H2
and
CO
2 yi
eld
[mol
mol
-CO
-1]
CO conversion H2 yield CO2 yield
The catalytic activity of the samples, which showed high conversion during the 80 min reaction
period, gradually decreased after further reaction time. The conversion of 140-CO after 24 h of 80 °C
WGS was 0.21, with a decrease in surface area to 48 m2 g−1. Possible factors for the catalytic
deactivation are the formation of carbon species on the catalyst surface and degradation of the Au
particles and of Fe3O4. Although there is small number of studies on the deactivation of the gold
catalyst during WGS, Kim and Thompson [35] specified the deposition of formate and carbonate
species on the catalyst surface to cause the deactivation in Au/CeO2 catalyst. In our study,
deconvolution of C 1s spectra in XPS analysis showed that the area proportion of –COOR:CO32−
among R-OH (286.0 eV), –COOR:CO32− (288.5 eV), adventitious carbon (284.6 eV), and adsorbed
CO2 (undetected) species was 17.9/17.8% before/after 24 h of 80 °C WGS reaction, respectively, for
the 140-CO sample. Additionally, the intensity of the –COOR:CO32− peak did not significantly change
before and after the 24 h reaction. Thus, since there was little difference during the long-term reaction,
the formation of carbon species cannot explain the catalyst deactivation. On the other hand, the
increase in Au 4f spectrum intensity in XPS analysis was observed after 24 h of reaction (Figure 6(g)),
which represents the transformation of cationic Au to the metallic state. As reported in literatures that
the cationic Au is responsible for high catalytic activity of the gold catalyst [36,37], the degradation of
Au can lead to a decrease of catalytic activity. Considering that Au is responsible for the catalytic
activity at low-temperature WGS, which was shown in Figure 1, it is deemed that the deactivation was
caused mainly by the loss of cationic Au. Crystallization of Fe3O4 and the resulting decrease in surface
area can also affect the catalytic activity. However, because the crystallization accompanied the
transformation of cationic Au to the metallic state, maintaining lower crystallinity and/or higher
surface area would prevent the transformation of cationic Au, leading to the maintenance of high
catalytic activity. Hereafter the most important issue for this catalyst is to develop a method for the
prevention of structural change during WGS reaction.

Catalysts 2011, 1
188
4. Conclusions
Based on the result of the WGS using as-prepared Au/Fe2O3 catalyst in the temperature range of
140–300 °C, the Au 3 wt% Au/Fe2O3 catalyst calcined at 200 °C was reduced at low temperatures to
prepare catalytically active Au/Fe3O4 catalysts. It was confirmed by the product gas analysis during the
pre-reduction treatment that the amorphous Fe2O3 was reduced to Fe3O4 using the reducing gases of
CO, H2, or CO/H2O even at 140 °C. Quantitative analysis indicated that the reduction of Fe3+ to Fe2+
was progressed stoichiometrically by 1/2H2 in CO/H2O and H2 pre-reductions and by one mole of CO
in CO pre-reduction. The introduction of steam following the CO pre-reduction clarified the presence
of a site, which activates the Au particles for the dissociative adsorption of H2O, on iron oxide support.
The reduced catalyst in this way had very small Fe3O4 particles less than 20 nm in diameter. Among
the reducing gases used, the highest reducing ability was shown by CO/H2O, and the second was by
H2, judging from the surface area and the crystallinity of the reduced samples. The characteristics of
both Fe3O4 and Au on the support varied with reduction conditions, and the difference affected the
catalytic performance in the WGS. In detail, the produced Au/Fe3O4 catalyst with a higher surface area
and Au particles in a more cationic state showed higher catalytic activity, resulting in the complete
conversion of CO even at 80 °C. Considering a poor catalytic activity of non-reduced Au/Fe2O3
catalyst, formation of a site to activate the Au for dissociative adsorption of H2O was necessary to
progress low-temperature WGS. From these results, it was clarified that the preparation method
of Au/Fe3O4 catalysts proposed in this study is effective for the activation of the catalyst in
low-temperature WGS, leading to the development of a compact on-site H2 production system without
CO oxidation section.
Acknowledgements
This work was supported by the Knowledge Cluster Initiative program (Kyoto Environmental
Nanotechnology Cluster) of the Ministry of Education, Culture, Sports, Science, and Technology
(MEXT) of the Japanese Government.
References
1. Song, C. Fuel processing for low-temperature and high-temperature fuel cells challenges, and
opportunities for sustainable development in the 21st century. Catal. Today 2002, 77, 17–49.
2. Wee, J.-H.; Lee, K.-Y. Overview of the development of CO-tolerant anode electrocatalysts for
proton-exchange membrane fuel cells. J. Power Sources 2006, 157, 128–135.
3. Tanaka, Y.; Utaka, R.; Kikuchi, R.; Sasaki, K.; Eguchi, K. CO removal from reformed fuel over
Cu/ZnO/Al2O3 catalysts prepared by impregnation and coprecipitation methods. Appl. Catal. A
Gen. 2003, 238, 11–18.
4. Haruta, M.; Kageyama, H.; Kamijo, N.; Kobayashi, T.; Delannay, F. Fine structure of novel gold
catalysts prepared by coprecipitation. Stud. Surf. Sci. Catal. 1989, 44, 33–42.
5. Haruta, M.; Yamada, N.; Kobayashi, T.; Iijima, S. Gold catalysts prepared by coprecipitation for
low-temperature oxidation of hydrogen and of carbon monoxide. J. Catal. 1989, 115, 301–309.

Catalysts 2011, 1
189
6. Haruta, M.; Daté, M. Advances in the catalysis of Au nanoparticles. Appl. Catal. A Gen. 2001,
222, 427–437.
7. Haruta, M. Gold as a novel catalyst in the 21st century: Preparation, working mechanism and
applications. Gold Bull. 2004, 37, 27–36.
8. Seker, E.; Gulari, E.; Hammerle, R.H.; Lambert, C.; Leerat, J.; Osuwan, S. NO reduction by urea
under lean conditions over alumina supported catalysts. Appl. Catal. A Gen. 2002, 226, 183–192.
9. Uphade, B.S.; Yamada, Y.; Akita, T.; Nakamura, T.; Haruta, M. Synthesis and characterization of
Ti-MCM-41 and vapor-phase epoxidation of propylene using H2 and O2 over Au/Ti-MCM-41.
Appl. Catal. A Gen. 2001, 215, 137–148.
10. Nkosi, B.; Coville, N.J.; Hutchings, G.J.; Adams, M.D.; Friedl, J.; Wagner, F.E. Hydrochlorination
of acetylene using gold catalysts: A study of catalyst deactivation. J. Catal. 1991, 128, 366–377.
11. Mul, G.; Zwijnenburg, A.; van der Linden, B.; Makkee, M.; Moulijn, J.A. Stability and selectivity
of Au/TiO2 and Au/TiO2/SiO2 catalysts in propene epoxidation: An in situ FT-IR study. J. Catal.
2001, 201, 128–137.
12. Edwards, J.K.; Solsona, B.E.; Landon, P.; Carley, A.F.; Herzing, A.; Kiely, C.J.; Hutchings, G.J.
Direct synthesis of hydrogen peroxide from H2 and O2 using TiO2-supported Au-Pd catalysts.
J. Catal. 2005, 236, 69–79.
13. Kang, Y.-M.; Wan, B.-Z. Preparation of gold in Y-type zeolite for carbon monoxide oxidation.
Appl. Catal. A Gen. 1995, 128, 53–60.
14. Andreeva, D.; Idakiev, V.; Tabakova, T.; Andreev, A.; Giovanoli, R. Low-temperature water-gas
shift reaction on Au/α-Fe2O3 catalyst. Appl. Catal. A Gen. 1996, 134, 275–283.
15. Andreeva, D.; Tabakova, T.; Idakiev, V.; Christov, P.; Giovanoli, R. Au/α-Fe2O3 catalyst for
water-gas shift reaction prepared by deposition-precipitation. Appl. Catal. A Gen. 1998, 169, 9–14.
16. Andreeva, D. Low temperature water gas shift over gold catalysts. Gold Bull. 2002, 35, 82–88.
17. Andreeva, D.; Idakiev, V.; Tabakova, T.; Ilieva, L.; Falaras, P.; Bourlinos, A.; Travlos, A.
Low-temperature water-gas shift reaction over Au/CeO2 catalysts. Catal. Today 2002, 72, 51–57.
18. Lei, Y.; Cant, N.W.; Trimm, D.L. The origin of rhodium promotion of Fe3O4-Cr2O3 catalysts for
the high-temperature water-gas shift reaction. J. Catal. 2006, 239, 227–236.
19. Munteanu, G.; Ilieva, L.; Andreeva, D. Kinetic parameters obtained from TPR data for α-Fe2O3
and Au/α-Fe2O3 systems. Thermochim. Acta 1997, 291, 171–177.
20. Hua, J.; Wei, K.; Zheng, Q.; Lin, X. Influence of calcination temperature on the structure and
catalytic performance of Au/iron oxide catalysts for water-gas shift reaction. Appl. Catal. A Gen.
2004, 259, 121–130.
21. Kudo, S.; Maki, T.; Yamada, M.; Mae, K. A new preparation method of Au/ferric oxide catalyst
for low temperature CO oxidation. Chem. Eng. Sci. 2010, 65, 214–219.
22. Ilieva, L.I.; Andreeva, D.H.; Andreev, A.A. TPR and TPD investigation of Au/α-Fe2O3.
Thermochim. Acta 1997, 292, 169–174.
23. Li, J.; Zhan, Y.; Lin, X.; Zheng, Q. Influence of calcination temperature on properties of
Au/Fe2O3 catalysts for low temperature water gas shift reaction. Acta Phys. Chim. Sin. 2008, 24,
932–938.
24. JCPDS International Centre for Diffraction Data. Powder Diffraction File, Inorganic Compounds
1978; JCPDS: Newtown Square, PA, USA, 1978.
Catalysts 2011, 1
190
25. Mizukoshi, Y.; Shuto, T.; Masahashi, N.; Tanabe, S. Preparation of superparamagnetic magnetite
nanoparticles by reverse precipitation method: Contribution of sonochemically generated oxidants.
Ultrason. Sonochem. 2009, 16, 525–531.
26. Tang, B.; Yuan, L.; Shi, T.; Yu, L.; Zhu, Y. Preparation of nano-sized magnetic particles from
spent pickling liquors by ultrasonic-assisted chemical co-precipitation. J. Hazard. Mater. 2009,
163, 1173–1178.
27. Moulder, J.F.; Stickle, W.F.; Sobol, P.E.; Bomben, K.D. Hand Book of X-Ray Photoelectron
Spectroscopy; Physical Electronics Inc.: Eden Prairie, MN, USA, 1995.
28. Radnik, J.; Mohr, C.; Claus, P. On the origin of binding energy shifts of core levels of supported
gold nanoparticles and dependence of pretreatment and material synthesis. Phys. Chem. Chem.
Phys. 2003, 5, 172–177.
29. Hutchings, G.J.; Hall, M.S.; Carley, A.F.; Landon, P.; Solsona, B.E.; Kiely, C.J.; Herzing, A.;
Makkee, M.; Moulijn, J.A.; Overweg, A.; et al. Role of gold cations in the oxidation of carbon
monoxide catalyzed by iron oxide-supported gold. J. Catal. 2006, 242, 71–81.
30. Fu, Q.; Saltsburg, H.; Flytzani-Stephanopoulos, M. Active nonmetallic Au and Pt species on
ceria-based water-gas shift catalysts. Science 2003, 301, 935–938.
31. Li, J.; Zhan, Y.; Zhang, F.; Lin, X.; Zheng, Q. Au/Fe2O3 water-gas shift catalyst prepared by
modified deposition-precipitation method. Chin. J. Catal. 2008, 29, 346–350.
32. Silberova, B.A.A.; Mul, G.; Makkee, M.; Moulijn, J.A. DRIFTS study of the water-gas shift
reaction over Au/Fe2O3. J. Catal. 2006, 243, 171–182.
33. Tabakova, T.; Idakiev, V.; Andreeva, D.; Mitov, I. Influence of the microscopic properties of the
support on the catalytic activity of Au/ZnO, Au/ZrO2, Au/Fe2O3, Au/Fe2O3-ZnO, Au/Fe2O3-ZrO2
catalysts for the WGS reaction. Appl. Catal. A Gen. 2000, 202, 91–97.
34. Scirè, S.; Crisafulli, C.; Minicò, S.; Condorelli, G.G.; di Mauro, A. Selective oxidation of CO in
H2-rich stream over gold/iron oxide: An insight on the effect of catalyst pretreatment. J. Mol.
Catal. A Chem. 2008, 284, 24–32.
35. Kim, C.H.; Thompson, L.T. Deactivation of Au/CeOx water gas shift catalysts. J. Catal. 2005,
230, 66–74.
36. Guzman, J.; Gates, B.C. Catalysis by supported gold: Correlation between catalytic activity for co
oxidation and oxidation states of gold. J. Am. Chem. Soc. 2004, 126, 2672–2673.
37. Herzing, A.A.; Kiely, C.J.; Carley, A.F.; Landon, P.; Hutchings, G.J. Identification of active gold
nanoclusters on iron oxide supports for CO oxidation. Science 2008, 321, 1331–1335.
© 2011 by the authors; licensee MDPI, Basel, Switzerland. This article is an open access article
distributed under the terms and conditions of the Creative Commons Attribution license
(http://creativecommons.org/licenses/by/3.0/).


![The Uses of Iron (II) Oxide By: Isabel Rimando. Iron (II) oxide [FeO] Not to be confused with iron (III) oxide (rust)](https://img.pdfslide.net/doc/110x75/5a4d1bbd7f8b9ab0599d1c20/the-uses-of-iron-ii-oxide-by-isabel-rimando-iron-ii-oxide-feo-not-to.jpg)