Embed Size (px)
Citation preview
Pre-school and early home learning effects on A-level outcomes Effective Pre-School, Primary & Secondary Education Project (EPPSE)
Research report
October 2015
Pam Sammons, Katalin Toth & Kathy Sylva with Edward Melhuish, Iram Siraj & Brenda Taggart
University of Oxford
Contents List of figures 4
List of tables 5
Acknowledgements 7
Executive Summary 8
Background 8
Aims 8
Methodology 8
Key findings 9
Pre-school 9
Home learning environment 9
Conclusions 10
Introduction 11
Sample 11
Measures 12
Home learning environment (HLE) 12
Pre-school quality 13
Pre-school effectiveness 13
Social disadvantage 13
Place poverty 13
KS5 Academic attainment 14
The association between pre-school and KS4 GCSEs 18
Attendance 18
Duration 18
Quality 18
Effectiveness 19
The association between measures of the HLE and KS4 GCSE attainment 19
Background characteristics of the sample and their relationships with students’ KS5 academic outcomes 19
Background characteristics and AS or A-levels in facilitating subjects 24
2
KS5 Academic attainment and pre-school 25
KS5 Academic attainment and the early years HLE 28
The net effects of the early home learning environment and pre-school on KS5 examination entry patterns 32
Entering any AS or A-level examinations 32
Entering 4+ AS-level or 3+ A-level examinations 33
Total KS5 points score 34
KS5 AS and A-levels points 34
AS or A-levels in facilitating subjects 34
Conclusions 35
References 37
3

List of figures Figure 1: Distribution of total KS5 score 16
Figure 2: Odds ratios for pre-school measures that predict attaining 4+ AS-levels 33
4
List of tables Table 1: Summary of statistically significant effects of early years HLE and pre-school 10
Table 2: Distribution of number of AS-levels taken 14
Table 3: Distribution of number of A-levels taken 15
Table 4: Descriptive statistics for total AS-level score 15
Table 5: Descriptive statistics for total A-level score 15
Table 6: Total KS5 points score 16
Table 7: Distribution of number of facilitating subjects taken at AS-level 17
Table 8: Distribution of number of facilitating subjects taken at A-level 17
Table 9: Selected characteristics of the sample with AS-levels 21
Table 10: Selected characteristics of the sample with A-levels 22
Table 11: Gender and update of facilitating subjects at AS-level 24
Table 12: Gender and uptake of facilitating subjects at A-level 24
Table 13: Social disadvantage and uptake of facilitating subjects at AS-level 25
Table 14: Social disadvantage and uptake of facilitating subjects at A-level 25
Table 15: Pre-school and AS-levels taken 26
Table 16: Pre-school and A-levels taken 26
Table 17: Pre-school and average AS-level points 26
Table 18: Pre-school and average A-level points 26
Table 19: Pre-school and average total KS5 points 26
Table 20: Pre-school and number of AS-levels 27
Table 21: Pre-school and number of A-levels 27
Table 22: Early Years HLE and AS-levels 28
Table 23: Early Years HLE and A-levels 28
5
Table 24: Early Years HLE and number of AS-levels taken 29
Table 25: Early years HLE and number of A-levels taken 29
Table 26: Early years HLE and average AS-level points 30
Table 27: Early years HLE and average A-level points 30
Table 28: Early years HLE and average total KS5 points 31
6
Acknowledgements The authors are very grateful to all the families, children, pre-schools and schools involved in the longitudinal EPPSE 3-16 research over many years. In addition, they wish to thank the other EPPSE Principal Investigators, Edward Melhuish, Iram Siraj and Brenda Taggart, for their support and collaboration in completing the original EPPSE study on which this follow-up research builds. Finally, particular thanks are due to Rebecca Smees and Wesley Welcomme for their contribution in making the data match for AS and A-level results.
7
Executive Summary This report studies the AS and A-level examination outcomes of a large sample of young people in England. It investigates the impact of pre-school and early home learning on entry patterns and overall attainment at ages 17 and 18 plus.
Background The research is based on a follow-up of the longitudinal Effective Provision of Pre-school Primary and Secondary Education (EPPSE) study. This tracked a large sample of children through different phases of education and identified the effects of background characteristics on children's cognitive and social behavioural development.
When students were 16 years old, the EPPSE study found that pre-school and the early years home learning environment (HLE) shaped students' GCSE attainment (see Sammons et al., 2014; Sylva et al., 2014).
It showed that attending any pre-school, compared to none, predicted higher total GCSE scores, higher grades in GCSE English and maths, and the likelihood of achieving 5 or more GCSEs at grade A*-C. The more months students had spent in pre-school, the greater the impact on total GCSE scores and grades in English and maths.
It also showed that positive parenting experiences, especially a more stimulating home learning environment when children were young, helped to promote better long term outcomes. A high or a very high HLE at early ages predicted both a higher total GCSE score and better grades in English and maths, and achieving the GCSE benchmark measures of 5 A*-C and 5 A*-C including English and maths.
Aims This follow-up research aimed to establish whether pre-school and early HLE effects continue to predict academic outcomes in A-level subjects taken during Key Stage 5.
Methodology We merged data on A and AS-level results from the National Pupil Database into the EPPSE dataset and used logistic regression and multilevel model techniques to investigate students’ AS and A-level achievement at age 18 (see Section 2 for more details on methodology).
To identify the strength of pre-school and early home learning, and to put the results into context, we also examined other individual, family, and neighbourhood characteristics.
8
Statistical models were developed to:
• analyse their relationship with later AS and A-level entry patterns and overall attainment;
• establish whether the characteristics of the pre-school attended continues to students' predict later AS and A-level entry and overall academic attainment at the end of Key Stage 5 (KS5);
• explore whether the early years HLE continues to predict AS and A-level entry and later academic attainment.
Key findings
Pre-school
• There are continuing effects of pre-school at age 17. EPPSE students who had attended any pre-school were more likely to enter AS-level exams (mostly taken at age 17) than those who had not. In addition, if they attended a high quality pre-school they were twice as likely as those who hadn’t attended pre-school to take AS-levels.
• However, for most students the pre-school effect had disappeared by the time they took A-levels (generally at age 18) as there were no continuing effects of pre-school at entry to A-level exams or on the grades students achieved in them.
• Separate analysis for the Sutton Trust (Sammons, Toth and Sylva, 2015) showed that there is lasting impact of pre-school for the specific sub-group of disadvantaged young people who were classed as ‘high achievers’ at the end of primary school.
Home learning environment
• The quality of the home learning environment EPPSE students experienced before they attended school does have a continuing effect at ages 17 and 18. EPPSE students who experienced a good early HLE were more likely to enter AS-levels, A-levels, and have higher attainment in terms of KS5 point scores.
9
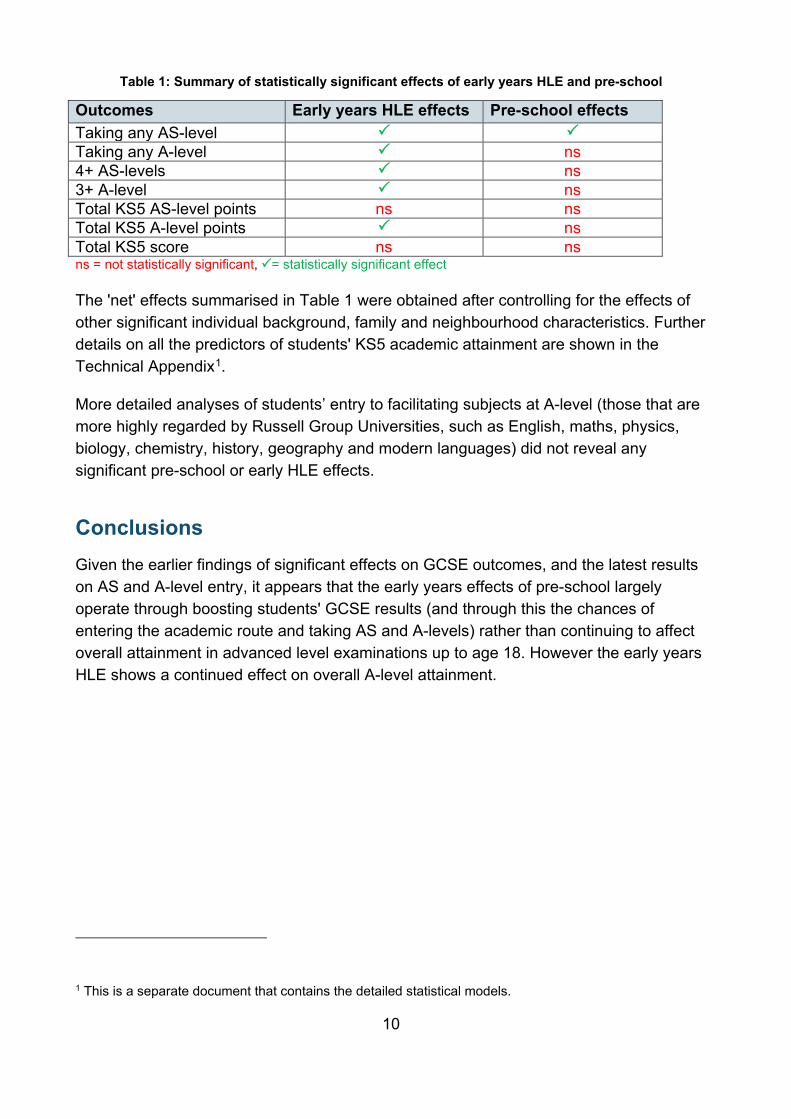
Table 1: Summary of statistically significant effects of early years HLE and pre-school
Outcomes Early years HLE effects Pre-school effects Taking any AS-level Taking any A-level ns 4+ AS-levels ns 3+ A-level ns Total KS5 AS-level points ns ns Total KS5 A-level points ns Total KS5 score ns ns ns = not statistically significant, = statistically significant effect
The 'net' effects summarised in Table 1 were obtained after controlling for the effects of other significant individual background, family and neighbourhood characteristics. Further details on all the predictors of students' KS5 academic attainment are shown in the Technical Appendix1.
More detailed analyses of students’ entry to facilitating subjects at A-level (those that are more highly regarded by Russell Group Universities, such as English, maths, physics, biology, chemistry, history, geography and modern languages) did not reveal any significant pre-school or early HLE effects.
Conclusions Given the earlier findings of significant effects on GCSE outcomes, and the latest results on AS and A-level entry, it appears that the early years effects of pre-school largely operate through boosting students' GCSE results (and through this the chances of entering the academic route and taking AS and A-levels) rather than continuing to affect overall attainment in advanced level examinations up to age 18. However the early years HLE shows a continued effect on overall A-level attainment.
1 This is a separate document that contains the detailed statistical models.
10
Introduction This study adds to earlier research findings from the Effective Pre-school, Primary and Secondary Education Project (EPPSE3+-16). It provides a longitudinal perspective on children’s education careers from age 3+ to age 18+.
The research aims to identify the individual, family, and neighbourhood characteristics that influence students' academic attainment up to age 18. It has a particular interest in any continuing effects of the early years HLE and of pre-school experiences. Statistical models were developed to:
• analyse their relationship with later AS and A-level entry patterns and overall attainment;
• establish whether the characteristics of the pre-school attended continues to students' predict later AS and A-level entry and overall academic attainment at the end of Key Stage 5 (KS5);
• explore whether the early years HLE continues to predict AS and A-level entry and later academic attainment.
Sample The sample for this research is drawn from EPPSE3+-16, a major large-scale, longitudinal study of the progress and development of children from pre-school through to post-compulsory education in England (Sammons et al., 2008a; 2011a; 2014; Sylva et al., 2010; 2014). It has investigated various aspects of pre-school, primary and secondary school provision that shape children's attainment, progress and development over successive phases of education (pre-school, primary, secondary) up to age 16.
The original sample of 3172 children was assessed at the start of pre-school, when the children were about three years old and their development was monitored until they entered school around the age of five. This original sample also includes over 300 ‘home’ children who had not attended any type of pre-school and who were recruited to the study at age five, representing the comparison ‘no pre-school’ group. The sample was followed-up across primary school into adolescence and children were assessed again at key points until the end of KS4 in secondary school. These young people were most recently followed through their final year of compulsory schooling and on to their post 16 educational, training and employment choices.
This follow-up study investigates these students’ destinations (academic/non-academic routes), their AS and A-level take up and attainment in KS5. Data provided by the Department for Education’s National Pupil Database (number of AS and A-levels attained, subjects taken, KS5 grades and total point scores) were merged into the
11
EPPSE dataset to examine these students' AS and A-level examination entry patterns and attainments and the factors that predict success. The study used logistic regression and multilevel logistic regression as appropriate to predict differences in students' examination results at AS and A-levels. Odds ratios were used to show the effects of different predictors in increasing or decreasing the likelihood of good outcomes for the EPPSE sample.
Measures The EPPSE datasets provide rich information on these young people’s lives and educational/social progress from the early years at age 3+ to age 16+. Information on changing home circumstances was collected from parents and later from students themselves (at ages 3, 7, and 14) and assessments of these students’ academic, social and attitudinal development were available for 8 time points in the period 3-18 years.
Home learning environment (HLE)
Measures of the home learning environment were obtained from parents’ responses at four time points: at entry to the study, KS1, KS2 and KS3. The early years HLE measure is based on the frequency of specific activities involving the child (i.e., teaching the child the alphabet, playing with letters and numbers, library visits, reading to the child, teaching the child songs or nursery rhymes) as reported by parents when children were recruited to the study during the pre-school period. These measures were combined to form an overall early years HLE index with scores that could vary between 0 (very low early years HLE) and 49 (very high early years HLE) (Melhuish et al., 2008).
Later, during KS1 when children were approximately 6-7 years old, parents were again surveyed about their interactions with their child at home. Parents reported on activities such as the frequency of reading to/with the child, taking the child out on educational visits, computing activities, sport activities, dance, etc. Exploratory and confirmatory factor analyses indicated that the individual KS1 HLE measures linked to four latent factors with examples items in brackets: home computing (e.g., Parent uses computer with the child in educational ways), one-to-one interaction (e.g., Parent reads to the child), expressive play (e.g., The child paints/draws/makes models) and enrichment outings (e.g., Parent goes on educational visits with the child) (Sammons et al., 2008a; 2008b).
At KS2 and KS3, more questionnaires were sent to parents and students and were asked to state their levels of involvement in different learning activities at home. They reported on activities such as the frequency of internet usage, taking the child out for physical activities and educational visits, computing activities, teaching the child different subjects, parent support and supervision (Sammons et al., 2011b; 2014).
12
Pre-school quality
Pre-school quality was measured with two different scales ECERS-R and ECERS-E (Sylva et al., 1999; 2006). Previous EPPSE analyses have found that the ECERS-E measure, which focuses on the education aspects of pre-school, predicted the most consistent positive effects upon academic attainment at younger ages. The original sample was divided into groups of children whose pre-school experience could be classified as ranging from no quality (i.e., the ‘home’ group) through low, medium and high quality, based on individual pre-school centres’ ECERS-E scores. The classification in four categories was based on the original distribution of the average ECERS scores (no score, lowest - 20%, medium 60% and highest 20%).
Pre-school effectiveness
Measures of pre-school centre effectiveness were calculated separately for young children's outcomes in ‘pre-reading’ and ‘early number concepts’ skills for all 141 pre-school centres in the EPPSE study. These measures were based on the residuals from multilevel value added models predicting academic attainment (at the end of pre-school) of children who had attended a pre-school centre, controlling for their prior attainment at entry to the study and their background characteristics. More effective pre-schools were those in which children had made more progress than predicted by the statistical models (Sammons et al., 2002). The classification in four categories was based on the original distribution of the effectiveness scores: no score (the home sample), lowest - 20%, medium 60% and highest 20%.
Social disadvantage
Various individual, family, and neighbourhood characteristics are known to be significant predictors of academic and social-behaviour outcomes. In addition to testing the effects of individual measures such as parents' qualification levels, family SES or income, we created an overall measure of social disadvantage. To identify students who form the more 'disadvantaged' group in our sample, we used multiple individual measures like free school meal (FSM) status, family socio-economic status (SES) based on parents’ occupations, parents’ salary, parents’ educational qualifications, parents’ employment status.
Place poverty
We also used indicators of neighbourhood disadvantage based on home address post code that measure ‘place’ poverty, including the Income Deprivation Affecting Children Index (IDACI) and the Index of Multiple Deprivation - (IMD). IDACI represents the percentage of children in each Standard Output Area (SOA) that live in families that are income deprived. The overall IMD is a nationwide index combining weighted measures or
13
levels of: crime, barriers to housing, living environment, education and skills training, health deprivation and disability, employment and income. The greater the IMD score, the greater the level of neighbourhood deprivation. This means that both ‘person’ and ‘place' (neighbourhood) drivers of educational outcomes can be identified and compared with educational influences (pre-school, primary and secondary) to throw light on what affects the outcomes of the disadvantaged group in comparison with other more advantaged peers.
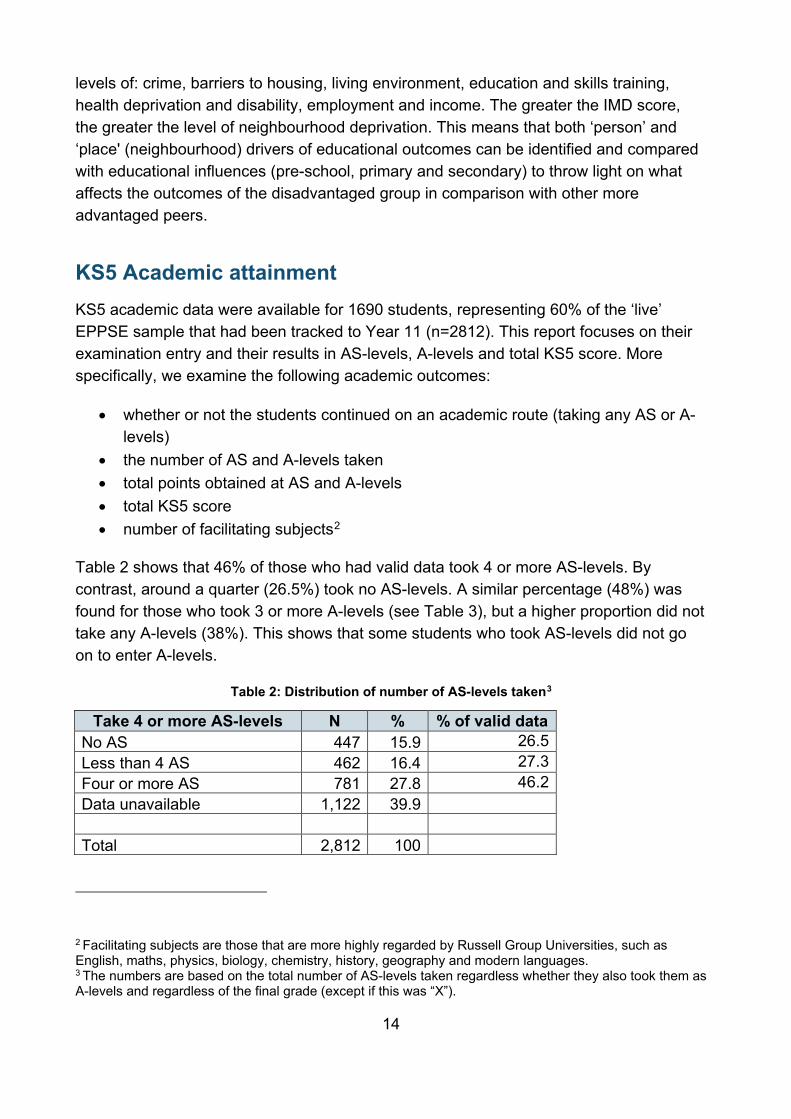
KS5 Academic attainment KS5 academic data were available for 1690 students, representing 60% of the ‘live’ EPPSE sample that had been tracked to Year 11 (n=2812). This report focuses on their examination entry and their results in AS-levels, A-levels and total KS5 score. More specifically, we examine the following academic outcomes:
• whether or not the students continued on an academic route (taking any AS or A-levels)
• the number of AS and A-levels taken • total points obtained at AS and A-levels • total KS5 score • number of facilitating subjects2
Table 2 shows that 46% of those who had valid data took 4 or more AS-levels. By contrast, around a quarter (26.5%) took no AS-levels. A similar percentage (48%) was found for those who took 3 or more A-levels (see Table 3), but a higher proportion did not take any A-levels (38%). This shows that some students who took AS-levels did not go on to enter A-levels.
Table 2: Distribution of number of AS-levels taken3
Take 4 or more AS-levels N % % of valid data No AS 447 15.9 26.5 Less than 4 AS 462 16.4 27.3 Four or more AS 781 27.8 46.2 Data unavailable 1,122 39.9
Total 2,812 100
2 Facilitating subjects are those that are more highly regarded by Russell Group Universities, such as English, maths, physics, biology, chemistry, history, geography and modern languages. 3 The numbers are based on the total number of AS-levels taken regardless whether they also took them as A-levels and regardless of the final grade (except if this was “X”).
14
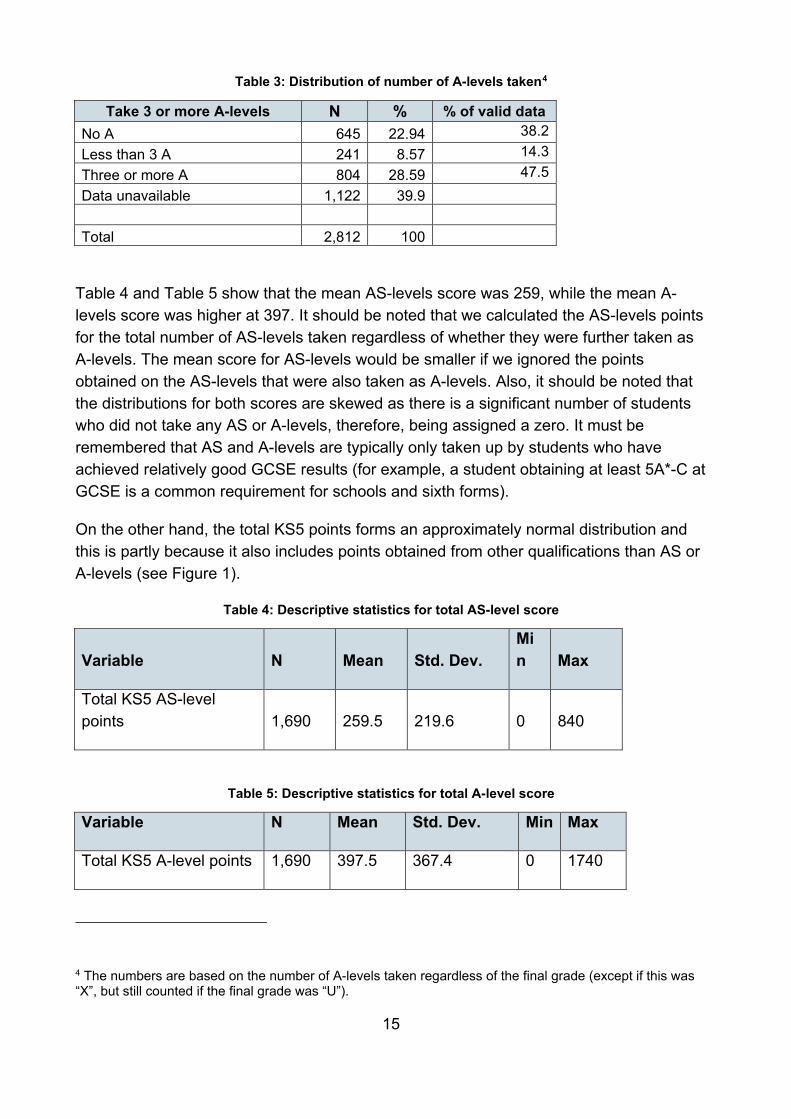
Table 3: Distribution of number of A-levels taken4
Take 3 or more A-levels N % % of valid data No A 645 22.94 38.2 Less than 3 A 241 8.57 14.3 Three or more A 804 28.59 47.5 Data unavailable 1,122 39.9
Total 2,812 100
Table 4 and Table 5 show that the mean AS-levels score was 259, while the mean A-levels score was higher at 397. It should be noted that we calculated the AS-levels points for the total number of AS-levels taken regardless of whether they were further taken as A-levels. The mean score for AS-levels would be smaller if we ignored the points obtained on the AS-levels that were also taken as A-levels. Also, it should be noted that the distributions for both scores are skewed as there is a significant number of students who did not take any AS or A-levels, therefore, being assigned a zero. It must be remembered that AS and A-levels are typically only taken up by students who have achieved relatively good GCSE results (for example, a student obtaining at least 5A*-C at GCSE is a common requirement for schools and sixth forms).
On the other hand, the total KS5 points forms an approximately normal distribution and this is partly because it also includes points obtained from other qualifications than AS or A-levels (see Figure 1).
Table 4: Descriptive statistics for total AS-level score
Variable N Mean Std. Dev. Min Max
Total KS5 AS-level points 1,690 259.5 219.6 0 840
Table 5: Descriptive statistics for total A-level score
Variable N Mean Std. Dev. Min Max
Total KS5 A-level points 1,690 397.5 367.4 0 1740
4 The numbers are based on the number of A-levels taken regardless of the final grade (except if this was “X”, but still counted if the final grade was “U”).
15
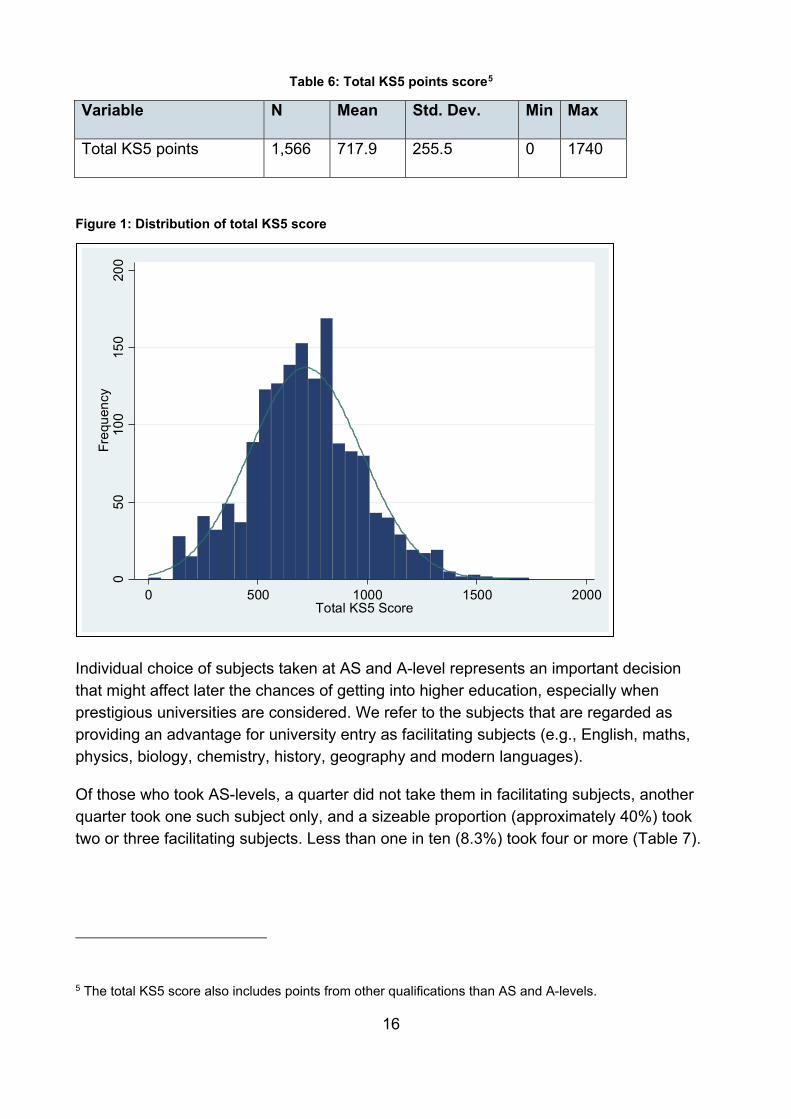
Table 6: Total KS5 points score5
Variable N Mean Std. Dev. Min Max
Total KS5 points 1,566 717.9 255.5 0 1740
Figure 1: Distribution of total KS5 score
Individual choice of subjects taken at AS and A-level represents an important decision that might affect later the chances of getting into higher education, especially when prestigious universities are considered. We refer to the subjects that are regarded as providing an advantage for university entry as facilitating subjects (e.g., English, maths, physics, biology, chemistry, history, geography and modern languages).
Of those who took AS-levels, a quarter did not take them in facilitating subjects, another quarter took one such subject only, and a sizeable proportion (approximately 40%) took two or three facilitating subjects. Less than one in ten (8.3%) took four or more (Table 7).
5 The total KS5 score also includes points from other qualifications than AS and A-levels.
050
100
150
200
Freq
uenc
y
0 500 1000 1500 2000Total KS5 Score
16
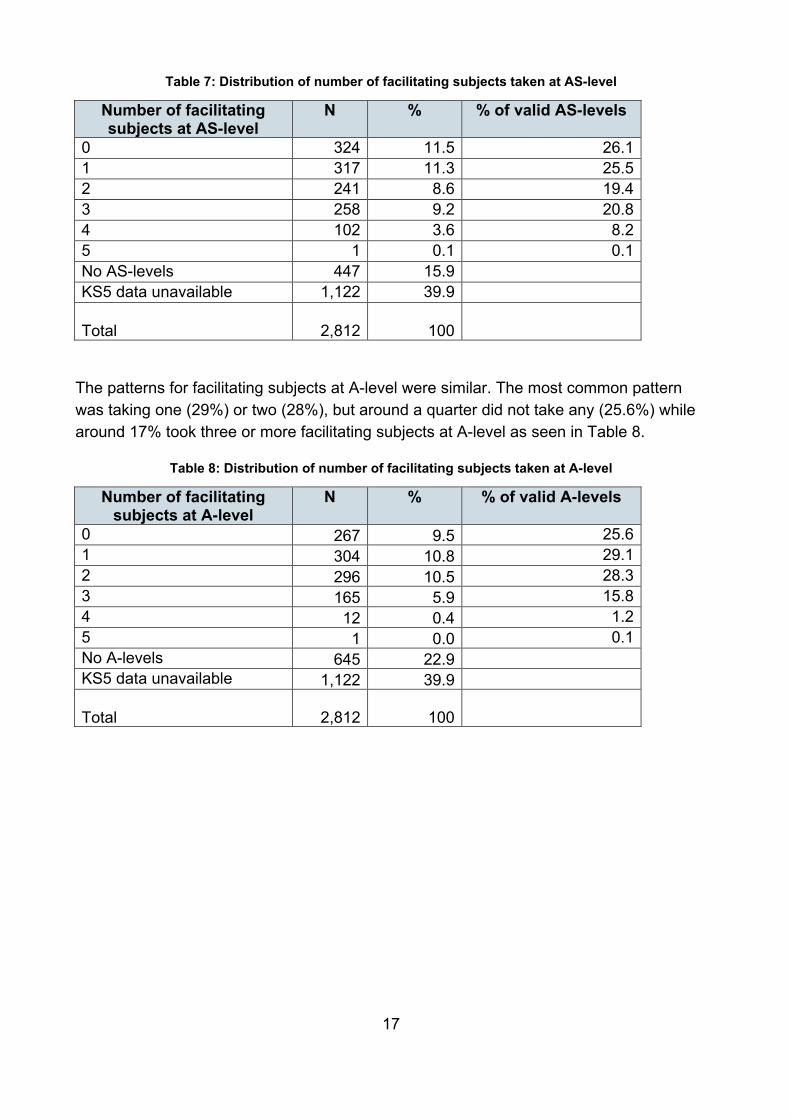
Table 7: Distribution of number of facilitating subjects taken at AS-level
Number of facilitating subjects at AS-level
N % % of valid AS-levels
0 324 11.5 26.1 1 317 11.3 25.5 2 241 8.6 19.4 3 258 9.2 20.8 4 102 3.6 8.2 5 1 0.1 0.1 No AS-levels 447 15.9 KS5 data unavailable 1,122 39.9 Total 2,812 100
The patterns for facilitating subjects at A-level were similar. The most common pattern was taking one (29%) or two (28%), but around a quarter did not take any (25.6%) while around 17% took three or more facilitating subjects at A-level as seen in Table 8.
Table 8: Distribution of number of facilitating subjects taken at A-level
Number of facilitating subjects at A-level
N % % of valid A-levels
0 267 9.5 25.6 1 304 10.8 29.1 2 296 10.5 28.3 3 165 5.9 15.8 4 12 0.4 1.2 5 1 0.0 0.1 No A-levels 645 22.9 KS5 data unavailable 1,122 39.9 Total 2,812 100
17
The association between pre-school and KS4 GCSEs The relationship between different measures of the pre-school attended and GCSE results was tested by Sammons et al. (2014).
Attendance
Attending any pre-school was a statistically significant predictor of: higher total GCSE score (ES6=0.31), a higher number of full GCSE entries (ES=0.21), better grades in GCSE English (ES=0.23) and GCSE maths (ES=0.21), and a higher probability of achieving 5 A*-C including English and maths (OR=1.48) when compared with students from the ‘home’ (or no pre-school) group. Although relatively modest, these effects were stronger than those found for ‘age’ (i.e., being Autumn rather than Summer born) or the effects of some home learning measures (i.e., KS1 and KS2 HLE) or family composition. They indicate that attending a pre-school (versus not) shaped academic outcomes in the longer term up to GCSE.
Duration
The amount of time in months (duration of attendance) that a student had spent in pre-school also showed continued effects on Year 11 academic outcomes. Students who had attended between 2 and 3 years (whether part-time or full-time) in pre-school obtained higher total GCSE scores (ES=0.38), better grades in GCSE English (ES=0.28) and in GCSE maths (ES=0.30), and were entered for more GCSE exams (ES=0.24) than those who had not attended any pre-school.
Quality
There was some evidence that the quality of pre-school continued to predict better GCSE results (total GCSE score – ES=0.37; GCSE English – ES=0.31; GCSE maths – ES=0.36). Those who had attended a high quality setting were more likely to achieve 5 A*-C including English and maths (OR=1.69) than students who had not attended pre-school. Students who had attended high quality pre-schools showed the most consistent pattern of positive effects. These quality effects were mostly fairly small although still statistically significant. This pattern shows broadly similar effects, but they are weaker than those found when students were younger during KS2 of primary school.
6 Effect size (ES) is a statistical concept that shows the strength of the relationship between outcomes while controlling for other factors. An effect size of 0.1 is relatively weak, one of 0.5 moderate in size, one of 0.7 fairly strong.
18
Effectiveness
The indicator of pre-school effectiveness in promoting young children's pre-reading skills continued to predict EPPSE students' academic attainment at the end of Year 11. Higher levels of pre-school effectiveness predicted more GCSE entries (ES=0.25), better grades in GCSE English (ES=0.31), and a higher probability of achieving 5 A*-C including English and maths (OR=1.73).
The patterns of relationships between pre-school effectiveness (in terms of early number concepts) and students' later Year 11 academic outcomes also indicate positive and significant effects for grades in GCSE maths (ES=0.35) and total GCSE score (ES=0.48). However, no clear patterns for these predictors emerged for the various GCSE benchmark indicators.
The association between measures of the HLE and KS4 GCSE attainment Sammons et al. (2014) found that the early years HLE index was a strong net predictor of better academic attainment at age 16 after controlling for the effects of other important background characteristics (e.g., parents’ highest SES, family salary and parents’ highest qualification levels). For total GCSE score and grades in GCSE English and in GCSE maths, only the two highest early years HLE categories (25-32 and 33-45) were identified as statistically significant predictors when compared with the lowest HLE category (0-13).
The top early years HLE category (33-45 points) predicted better outcomes in terms of higher total GCSE score (ES=0.36), grades in GCSE English (ES=0.51) and in GCSE maths (ES=0.45). Similarly, students with high rather than low early years HLE scores were three times more likely to achieve the benchmark measures of 5 A*-C (OR=3.61) and 5 A*-C including English and maths (OR=2.90) (Sammons et al., 2014).
These results confirm findings at younger ages and show that the early years HLE remains highly important for later secondary school academic outcomes up to age 16 plus.
Background characteristics of the sample and their relationships with students’ KS5 academic outcomes This section provides descriptive statistics for the sample at age 18 (KS5). Details of the main findings of the analyses conducted on students’ attainment and progress up to the end of KS4 (Year 11) can be found in Sammons et al. (2014).
19
Table 9 and Table 10 provide a brief summary of the characteristics of the sample for which we have been able to match valid KS5 academic data and their relationships with whether or not the students were continuing on an academic route after compulsory education. We have available academic data for 60% of the ‘live’ sample (n=1690 out of 2812). We compared the background characteristics of those whom our data match indicated that they were taking AS and A-levels and those who were not.
Males represented 52% of the live sample. Females were more likely to continue onto an academic route and take AS-levels (49% vs. 40%) and A-levels (42% vs. 33%) than males.
Almost three quarters of the sample were White British. Bangladeshi and Black African students represented the smallest percentages. Students of Indian origin and other ethnic minorities were found to be proportionately more likely to take AS and A-levels than students of White British ethnic origin.
In terms of parents’ qualification levels, less than a fifth (16-18%) of students were from families where mothers or fathers had a degree or a higher degree. Students whose mothers were more highly qualified (had a degree, higher degree or a professionals qualification) were much more likely to take AS and A-levels than students whose mothers had no qualifications (AS-level 77% vs 23%; A-level 74% vs. 17%). A similar pattern was found for the fathers’ qualification level in terms of differences related to having a degree, higher degree or professional qualification versus no qualifications (AS- level 74% vs. 24%; A-level 70% vs.18%).
About a third (34%) of students originated from families characterised as of higher socio-economic status7 based on their parents’ occupations (SES). A higher percentage (47%) of students’ parents were classified as skilled (either manual or non-manual) and only a very small percentage of the sample (3%) were unemployed.
Students whose family of origin have higher (SES) were more likely to take AS-levels than those with lower SES. Thus, over three quarters (76%) or those from the professional non-manual group took at least one AS-level compared with only 24% of those from semi-skilled manual and only one in five (20%) of unskilled manual backgrounds.
Almost half of the sample (44%) lived in families with low (below £17,500) or no earned income (measured earlier in primary school)8. A clear association was found between the
7 Family SES was calculated by considering the highest SES status of the mother or the father. SES is based on the Registrar General social classification of occupations. 8 Based on data collected by parent questionnaires completed when students were in KS1 of primary school.
20
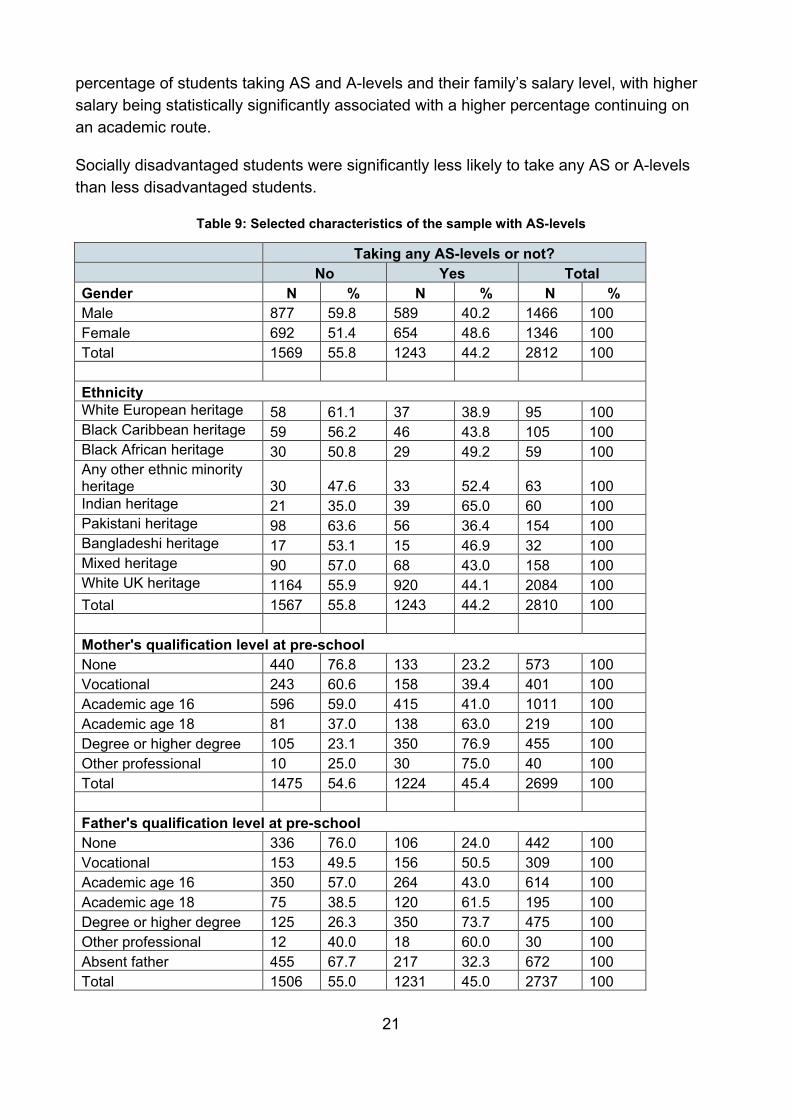
percentage of students taking AS and A-levels and their family’s salary level, with higher salary being statistically significantly associated with a higher percentage continuing on an academic route.
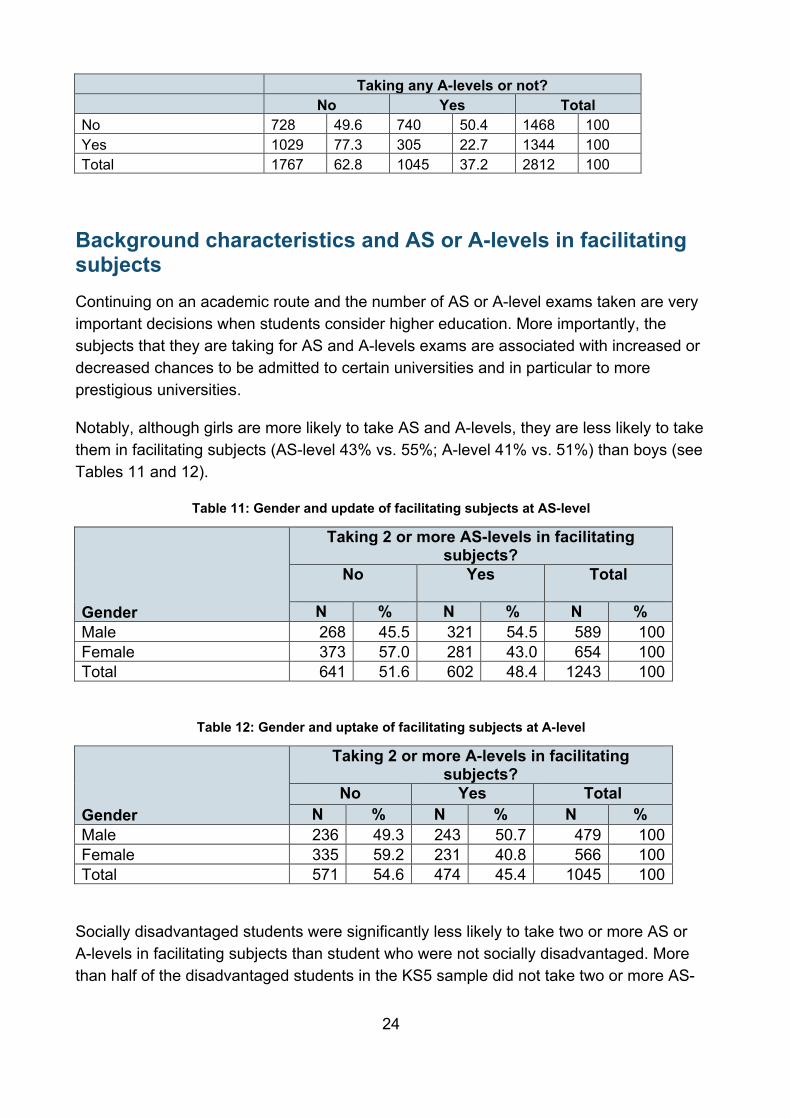
Socially disadvantaged students were significantly less likely to take any AS or A-levels than less disadvantaged students.
Table 9: Selected characteristics of the sample with AS-levels
Taking any AS-levels or not?
No Yes Total
Gender N % N % N % Male 877 59.8 589 40.2 1466 100 Female 692 51.4 654 48.6 1346 100 Total 1569 55.8 1243 44.2 2812 100
Ethnicity White European heritage 58 61.1 37 38.9 95 100 Black Caribbean heritage 59 56.2 46 43.8 105 100 Black African heritage 30 50.8 29 49.2 59 100 Any other ethnic minority heritage 30 47.6 33 52.4 63 100 Indian heritage 21 35.0 39 65.0 60 100 Pakistani heritage 98 63.6 56 36.4 154 100 Bangladeshi heritage 17 53.1 15 46.9 32 100 Mixed heritage 90 57.0 68 43.0 158 100 White UK heritage 1164 55.9 920 44.1 2084 100 Total 1567 55.8 1243 44.2 2810 100
Mother's qualification level at pre-school None 440 76.8 133 23.2 573 100 Vocational 243 60.6 158 39.4 401 100 Academic age 16 596 59.0 415 41.0 1011 100 Academic age 18 81 37.0 138 63.0 219 100 Degree or higher degree 105 23.1 350 76.9 455 100 Other professional 10 25.0 30 75.0 40 100 Total 1475 54.6 1224 45.4 2699 100
Father's qualification level at pre-school None 336 76.0 106 24.0 442 100 Vocational 153 49.5 156 50.5 309 100 Academic age 16 350 57.0 264 43.0 614 100 Academic age 18 75 38.5 120 61.5 195 100 Degree or higher degree 125 26.3 350 73.7 475 100 Other professional 12 40.0 18 60.0 30 100 Absent father 455 67.7 217 32.3 672 100 Total 1506 55.0 1231 45.0 2737 100
21
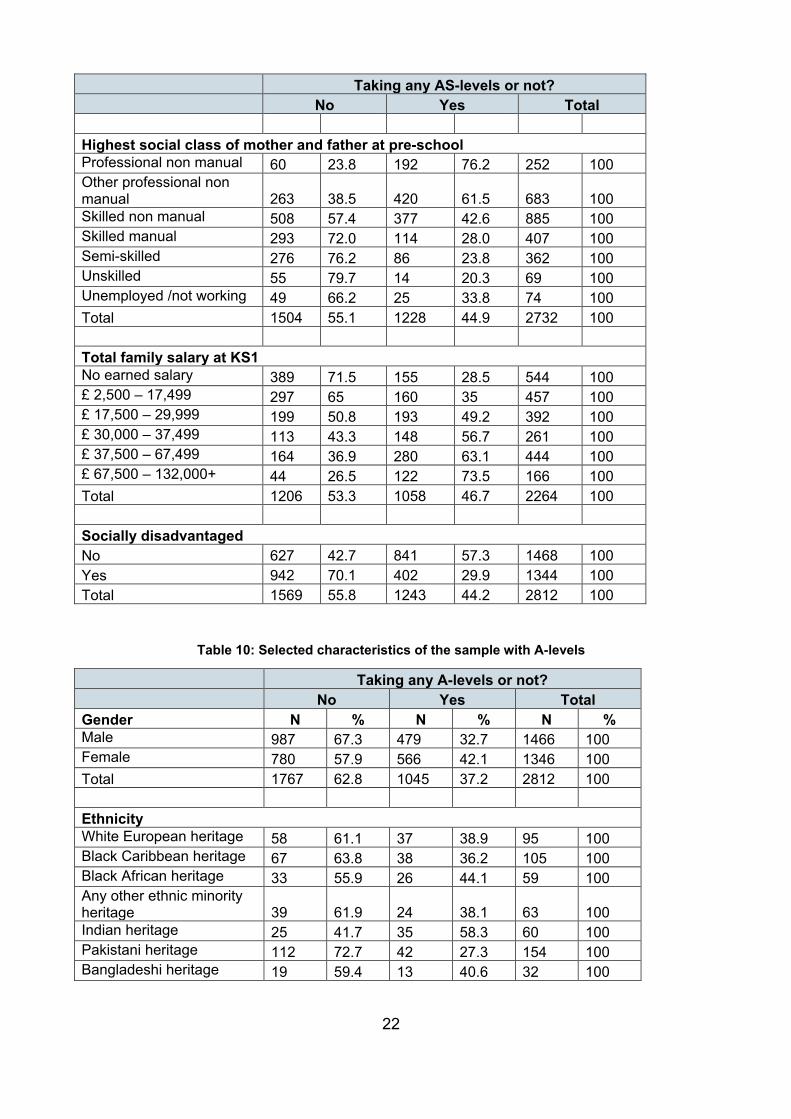
Taking any AS-levels or not?
No Yes Total
Highest social class of mother and father at pre-school Professional non manual 60 23.8 192 76.2 252 100 Other professional non manual 263 38.5 420 61.5 683 100 Skilled non manual 508 57.4 377 42.6 885 100 Skilled manual 293 72.0 114 28.0 407 100 Semi-skilled 276 76.2 86 23.8 362 100 Unskilled 55 79.7 14 20.3 69 100 Unemployed /not working 49 66.2 25 33.8 74 100 Total 1504 55.1 1228 44.9 2732 100
Total family salary at KS1 No earned salary 389 71.5 155 28.5 544 100 £ 2,500 – 17,499 297 65 160 35 457 100 £ 17,500 – 29,999 199 50.8 193 49.2 392 100 £ 30,000 – 37,499 113 43.3 148 56.7 261 100 £ 37,500 – 67,499 164 36.9 280 63.1 444 100 £ 67,500 – 132,000+ 44 26.5 122 73.5 166 100 Total 1206 53.3 1058 46.7 2264 100 Socially disadvantaged No 627 42.7 841 57.3 1468 100 Yes 942 70.1 402 29.9 1344 100 Total 1569 55.8 1243 44.2 2812 100
Table 10: Selected characteristics of the sample with A-levels
Taking any A-levels or not?
No Yes Total
Gender N % N % N % Male 987 67.3 479 32.7 1466 100 Female 780 57.9 566 42.1 1346 100 Total 1767 62.8 1045 37.2 2812 100
Ethnicity White European heritage 58 61.1 37 38.9 95 100 Black Caribbean heritage 67 63.8 38 36.2 105 100 Black African heritage 33 55.9 26 44.1 59 100 Any other ethnic minority heritage 39 61.9 24 38.1 63 100 Indian heritage 25 41.7 35 58.3 60 100 Pakistani heritage 112 72.7 42 27.3 154 100 Bangladeshi heritage 19 59.4 13 40.6 32 100
22
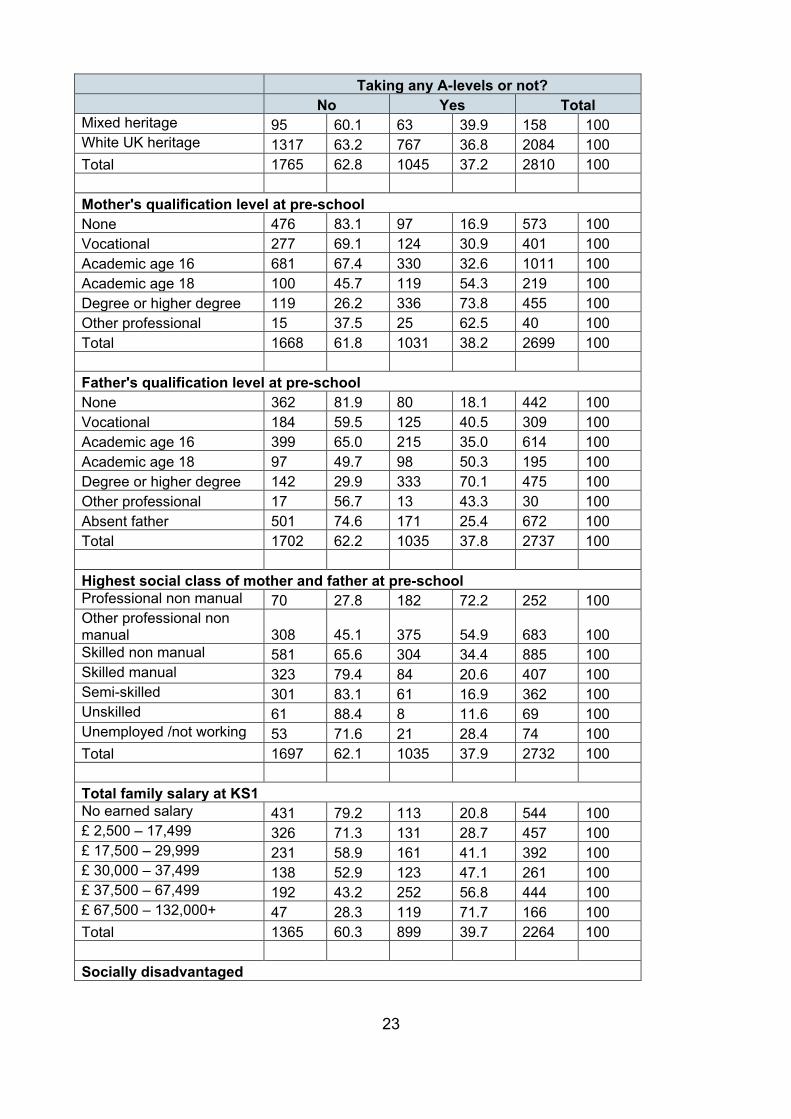
Taking any A-levels or not?
No Yes Total
Mixed heritage 95 60.1 63 39.9 158 100 White UK heritage 1317 63.2 767 36.8 2084 100 Total 1765 62.8 1045 37.2 2810 100
Mother's qualification level at pre-school None 476 83.1 97 16.9 573 100 Vocational 277 69.1 124 30.9 401 100 Academic age 16 681 67.4 330 32.6 1011 100 Academic age 18 100 45.7 119 54.3 219 100 Degree or higher degree 119 26.2 336 73.8 455 100 Other professional 15 37.5 25 62.5 40 100 Total 1668 61.8 1031 38.2 2699 100
Father's qualification level at pre-school None 362 81.9 80 18.1 442 100 Vocational 184 59.5 125 40.5 309 100 Academic age 16 399 65.0 215 35.0 614 100 Academic age 18 97 49.7 98 50.3 195 100 Degree or higher degree 142 29.9 333 70.1 475 100 Other professional 17 56.7 13 43.3 30 100 Absent father 501 74.6 171 25.4 672 100 Total 1702 62.2 1035 37.8 2737 100
Highest social class of mother and father at pre-school Professional non manual 70 27.8 182 72.2 252 100 Other professional non manual 308 45.1 375 54.9 683 100 Skilled non manual 581 65.6 304 34.4 885 100 Skilled manual 323 79.4 84 20.6 407 100 Semi-skilled 301 83.1 61 16.9 362 100 Unskilled 61 88.4 8 11.6 69 100 Unemployed /not working 53 71.6 21 28.4 74 100 Total 1697 62.1 1035 37.9 2732 100
Total family salary at KS1 No earned salary 431 79.2 113 20.8 544 100 £ 2,500 – 17,499 326 71.3 131 28.7 457 100 £ 17,500 – 29,999 231 58.9 161 41.1 392 100 £ 30,000 – 37,499 138 52.9 123 47.1 261 100 £ 37,500 – 67,499 192 43.2 252 56.8 444 100 £ 67,500 – 132,000+ 47 28.3 119 71.7 166 100 Total 1365 60.3 899 39.7 2264 100
Socially disadvantaged
23
Taking any A-levels or not?
No Yes Total
No 728 49.6 740 50.4 1468 100 Yes 1029 77.3 305 22.7 1344 100 Total 1767 62.8 1045 37.2 2812 100
Background characteristics and AS or A-levels in facilitating subjects Continuing on an academic route and the number of AS or A-level exams taken are very important decisions when students consider higher education. More importantly, the subjects that they are taking for AS and A-levels exams are associated with increased or decreased chances to be admitted to certain universities and in particular to more prestigious universities.
Notably, although girls are more likely to take AS and A-levels, they are less likely to take them in facilitating subjects (AS-level 43% vs. 55%; A-level 41% vs. 51%) than boys (see Tables 11 and 12).
Table 11: Gender and update of facilitating subjects at AS-level
Gender
Taking 2 or more AS-levels in facilitating subjects?
No Yes Total
N % N % N % Male 268 45.5 321 54.5 589 100 Female 373 57.0 281 43.0 654 100 Total 641 51.6 602 48.4 1243 100
Table 12: Gender and uptake of facilitating subjects at A-level
Gender
Taking 2 or more A-levels in facilitating subjects?
No Yes Total N % N % N %
Male 236 49.3 243 50.7 479 100 Female 335 59.2 231 40.8 566 100 Total 571 54.6 474 45.4 1045 100
Socially disadvantaged students were significantly less likely to take two or more AS or A-levels in facilitating subjects than student who were not socially disadvantaged. More than half of the disadvantaged students in the KS5 sample did not take two or more AS-
24
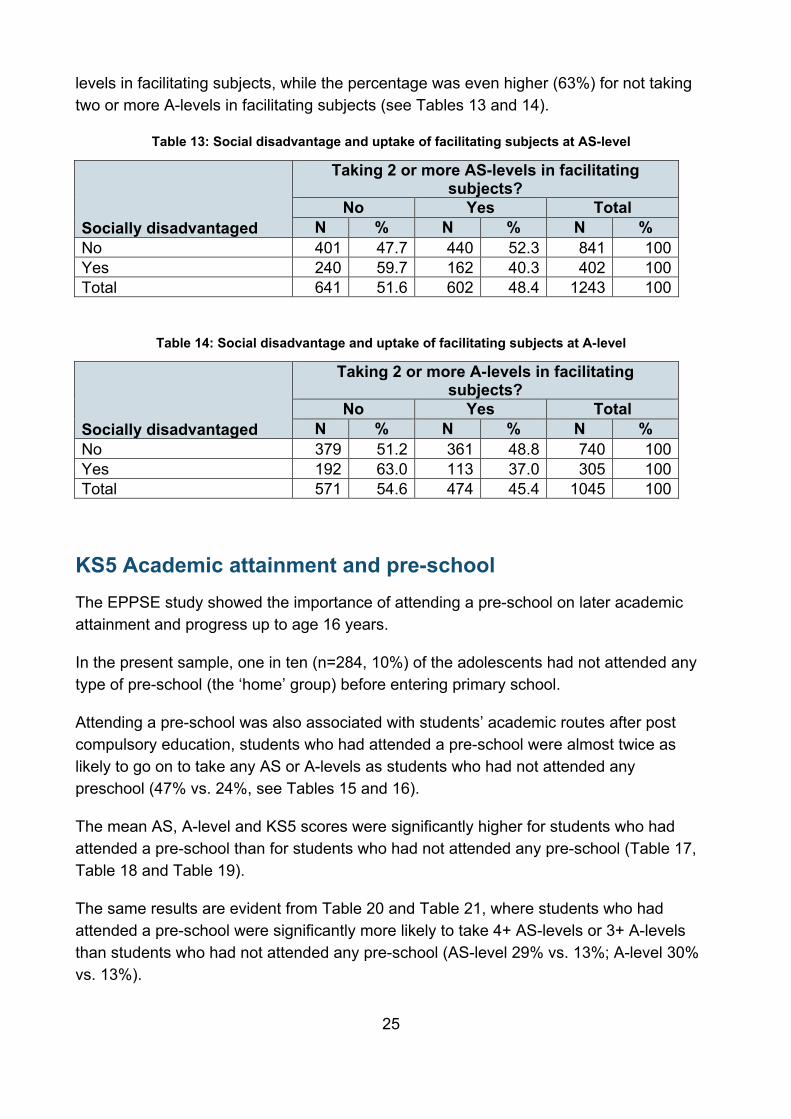
levels in facilitating subjects, while the percentage was even higher (63%) for not taking two or more A-levels in facilitating subjects (see Tables 13 and 14).
Table 13: Social disadvantage and uptake of facilitating subjects at AS-level
Socially disadvantaged
Taking 2 or more AS-levels in facilitating subjects?
No Yes Total N % N % N %
No 401 47.7 440 52.3 841 100 Yes 240 59.7 162 40.3 402 100 Total 641 51.6 602 48.4 1243 100
Table 14: Social disadvantage and uptake of facilitating subjects at A-level
Socially disadvantaged
Taking 2 or more A-levels in facilitating subjects?
No Yes Total N % N % N %
No 379 51.2 361 48.8 740 100 Yes 192 63.0 113 37.0 305 100 Total 571 54.6 474 45.4 1045 100
KS5 Academic attainment and pre-school The EPPSE study showed the importance of attending a pre-school on later academic attainment and progress up to age 16 years.
In the present sample, one in ten (n=284, 10%) of the adolescents had not attended any type of pre-school (the ‘home’ group) before entering primary school.
Attending a pre-school was also associated with students’ academic routes after post compulsory education, students who had attended a pre-school were almost twice as likely to go on to take any AS or A-levels as students who had not attended any preschool (47% vs. 24%, see Tables 15 and 16).
The mean AS, A-level and KS5 scores were significantly higher for students who had attended a pre-school than for students who had not attended any pre-school (Table 17, Table 18 and Table 19).
The same results are evident from Table 20 and Table 21, where students who had attended a pre-school were significantly more likely to take 4+ AS-levels or 3+ A-levels than students who had not attended any pre-school (AS-level 29% vs. 13%; A-level 30% vs. 13%).
25
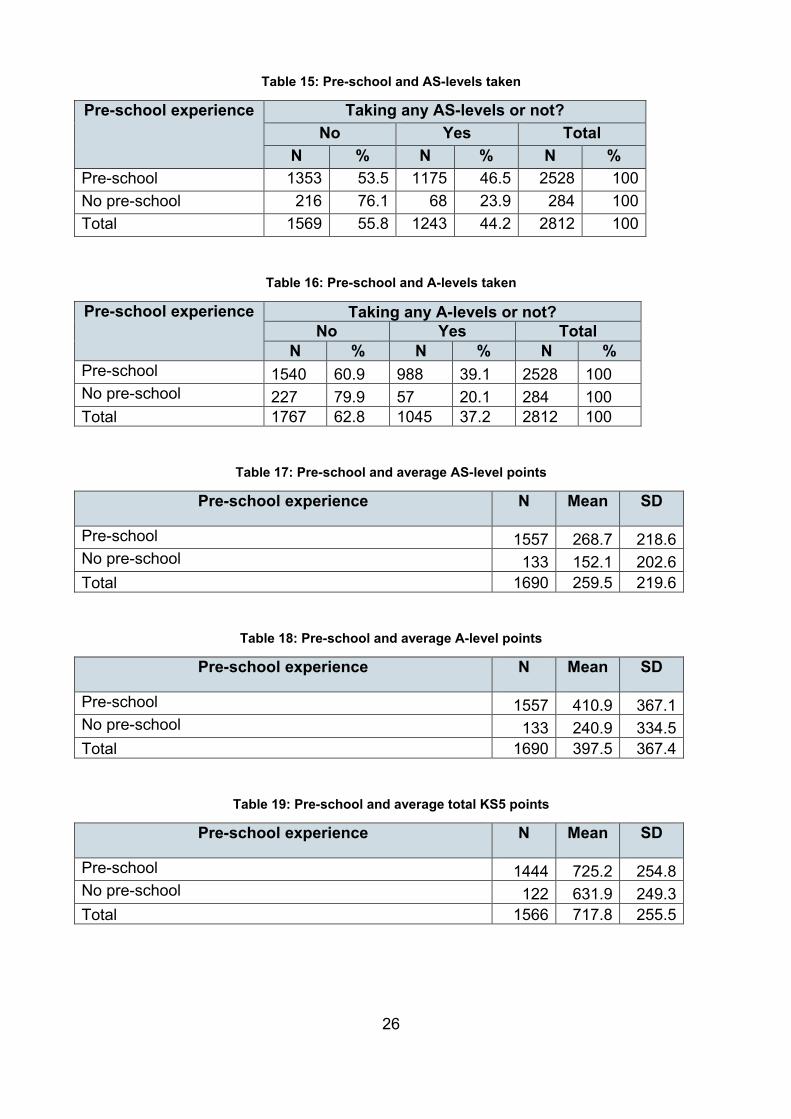
Table 15: Pre-school and AS-levels taken
Pre-school experience Taking any AS-levels or not? No Yes Total
N % N % N % Pre-school 1353 53.5 1175 46.5 2528 100 No pre-school 216 76.1 68 23.9 284 100 Total 1569 55.8 1243 44.2 2812 100
Table 16: Pre-school and A-levels taken
Pre-school experience Taking any A-levels or not? No Yes Total
N % N % N % Pre-school 1540 60.9 988 39.1 2528 100 No pre-school 227 79.9 57 20.1 284 100 Total 1767 62.8 1045 37.2 2812 100
Table 17: Pre-school and average AS-level points
Pre-school experience N Mean SD
Pre-school 1557 268.7 218.6 No pre-school 133 152.1 202.6 Total 1690 259.5 219.6
Table 18: Pre-school and average A-level points
Pre-school experience N Mean SD
Pre-school 1557 410.9 367.1 No pre-school 133 240.9 334.5 Total 1690 397.5 367.4
Table 19: Pre-school and average total KS5 points
Pre-school experience N Mean SD
Pre-school 1444 725.2 254.8 No pre-school 122 631.9 249.3 Total 1566 717.8 255.5
26
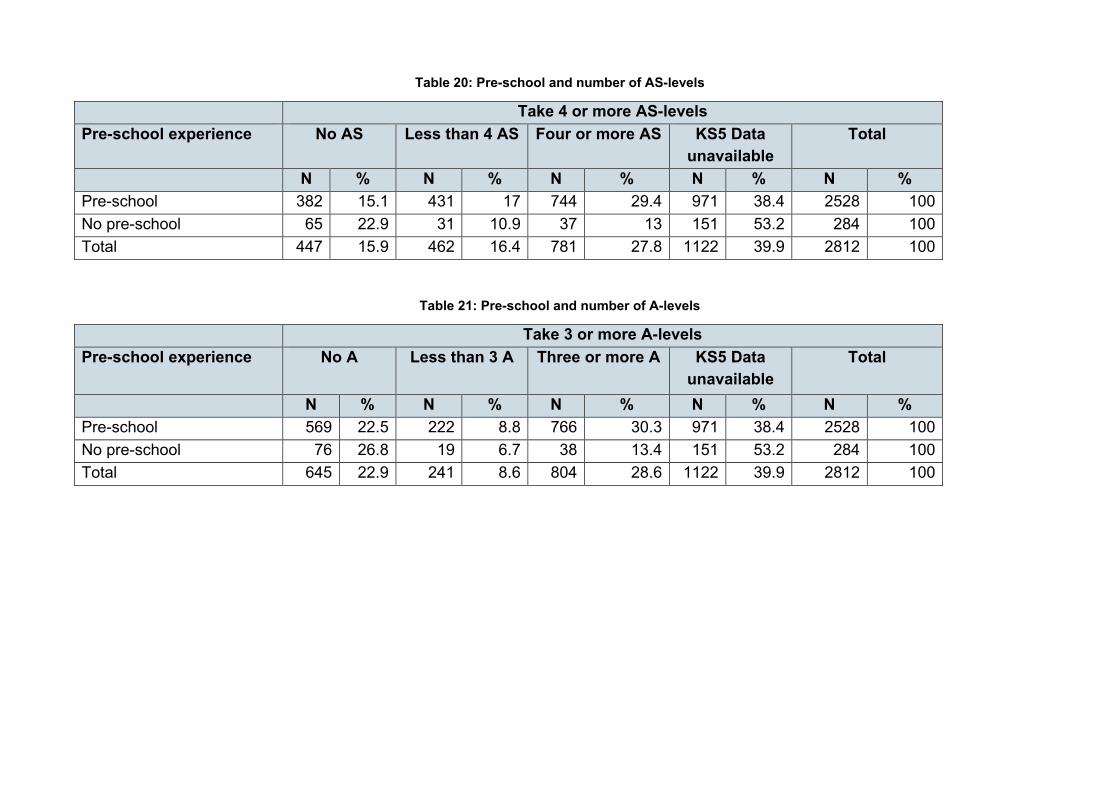
Table 20: Pre-school and number of AS-levels
Take 4 or more AS-levels
Pre-school experience No AS Less than 4 AS Four or more AS KS5 Data unavailable
Total
N % N % N % N % N %
Pre-school 382 15.1 431 17 744 29.4 971 38.4 2528 100 No pre-school 65 22.9 31 10.9 37 13 151 53.2 284 100 Total 447 15.9 462 16.4 781 27.8 1122 39.9 2812 100
Table 21: Pre-school and number of A-levels
Take 3 or more A-levels
Pre-school experience No A Less than 3 A Three or more A KS5 Data unavailable
Total
N % N % N % N % N % Pre-school 569 22.5 222 8.8 766 30.3 971 38.4 2528 100 No pre-school 76 26.8 19 6.7 38 13.4 151 53.2 284 100 Total 645 22.9 241 8.6 804 28.6 1122 39.9 2812 100
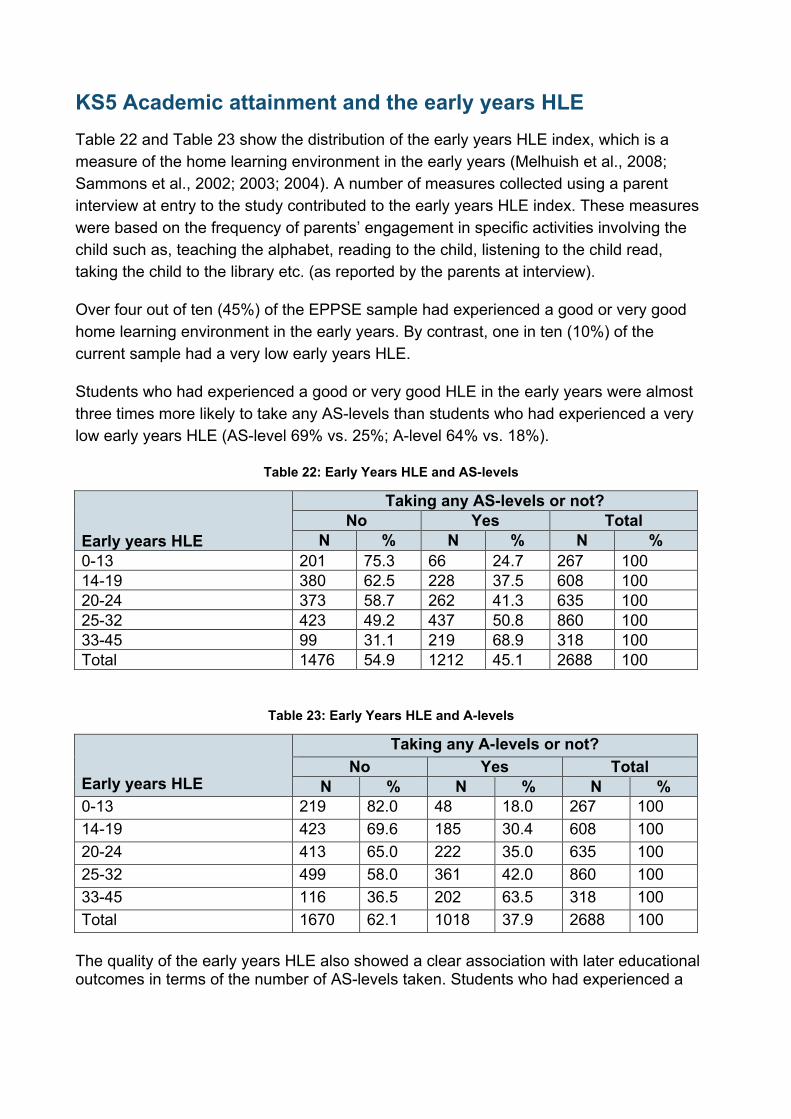
KS5 Academic attainment and the early years HLE Table 22 and Table 23 show the distribution of the early years HLE index, which is a measure of the home learning environment in the early years (Melhuish et al., 2008; Sammons et al., 2002; 2003; 2004). A number of measures collected using a parent interview at entry to the study contributed to the early years HLE index. These measures were based on the frequency of parents’ engagement in specific activities involving the child such as, teaching the alphabet, reading to the child, listening to the child read, taking the child to the library etc. (as reported by the parents at interview).
Over four out of ten (45%) of the EPPSE sample had experienced a good or very good home learning environment in the early years. By contrast, one in ten (10%) of the current sample had a very low early years HLE.
Students who had experienced a good or very good HLE in the early years were almost three times more likely to take any AS-levels than students who had experienced a very low early years HLE (AS-level 69% vs. 25%; A-level 64% vs. 18%).
Table 22: Early Years HLE and AS-levels
Early years HLE
Taking any AS-levels or not? No Yes Total
N % N % N % 0-13 201 75.3 66 24.7 267 100 14-19 380 62.5 228 37.5 608 100 20-24 373 58.7 262 41.3 635 100 25-32 423 49.2 437 50.8 860 100 33-45 99 31.1 219 68.9 318 100 Total 1476 54.9 1212 45.1 2688 100
Table 23: Early Years HLE and A-levels
Early years HLE
Taking any A-levels or not? No Yes Total
N % N % N % 0-13 219 82.0 48 18.0 267 100 14-19 423 69.6 185 30.4 608 100 20-24 413 65.0 222 35.0 635 100 25-32 499 58.0 361 42.0 860 100 33-45 116 36.5 202 63.5 318 100 Total 1670 62.1 1018 37.9 2688 100
The quality of the early years HLE also showed a clear association with later educational outcomes in terms of the number of AS-levels taken. Students who had experienced a
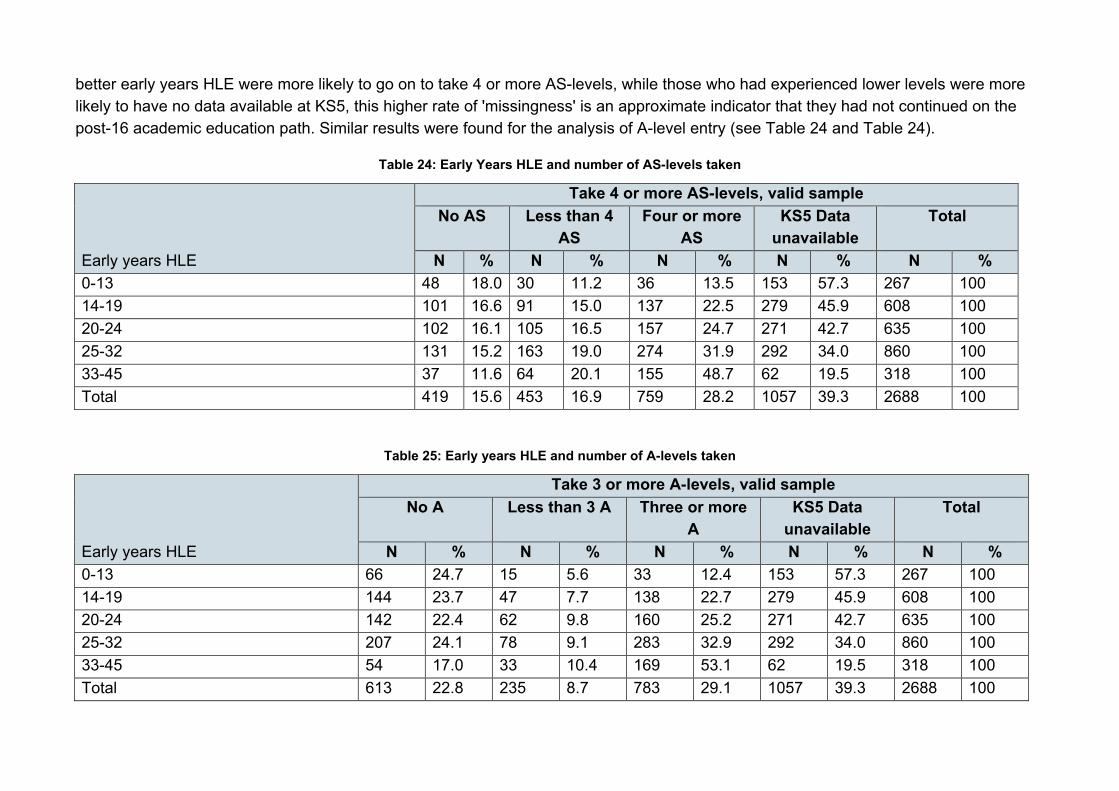
better early years HLE were more likely to go on to take 4 or more AS-levels, while those who had experienced lower levels were more likely to have no data available at KS5, this higher rate of 'missingness' is an approximate indicator that they had not continued on the post-16 academic education path. Similar results were found for the analysis of A-level entry (see Table 24 and Table 24).
Table 24: Early Years HLE and number of AS-levels taken
Early years HLE
Take 4 or more AS-levels, valid sample No AS Less than 4
AS Four or more
AS KS5 Data
unavailable Total
N % N % N % N % N %
0-13 48 18.0 30 11.2 36 13.5 153 57.3 267 100 14-19 101 16.6 91 15.0 137 22.5 279 45.9 608 100 20-24 102 16.1 105 16.5 157 24.7 271 42.7 635 100 25-32 131 15.2 163 19.0 274 31.9 292 34.0 860 100 33-45 37 11.6 64 20.1 155 48.7 62 19.5 318 100 Total 419 15.6 453 16.9 759 28.2 1057 39.3 2688 100
Table 25: Early years HLE and number of A-levels taken
Early years HLE
Take 3 or more A-levels, valid sample No A Less than 3 A Three or more
A KS5 Data
unavailable Total
N % N % N % N % N % 0-13 66 24.7 15 5.6 33 12.4 153 57.3 267 100 14-19 144 23.7 47 7.7 138 22.7 279 45.9 608 100 20-24 142 22.4 62 9.8 160 25.2 271 42.7 635 100 25-32 207 24.1 78 9.1 283 32.9 292 34.0 860 100 33-45 54 17.0 33 10.4 169 53.1 62 19.5 318 100 Total 613 22.8 235 8.7 783 29.1 1057 39.3 2688 100
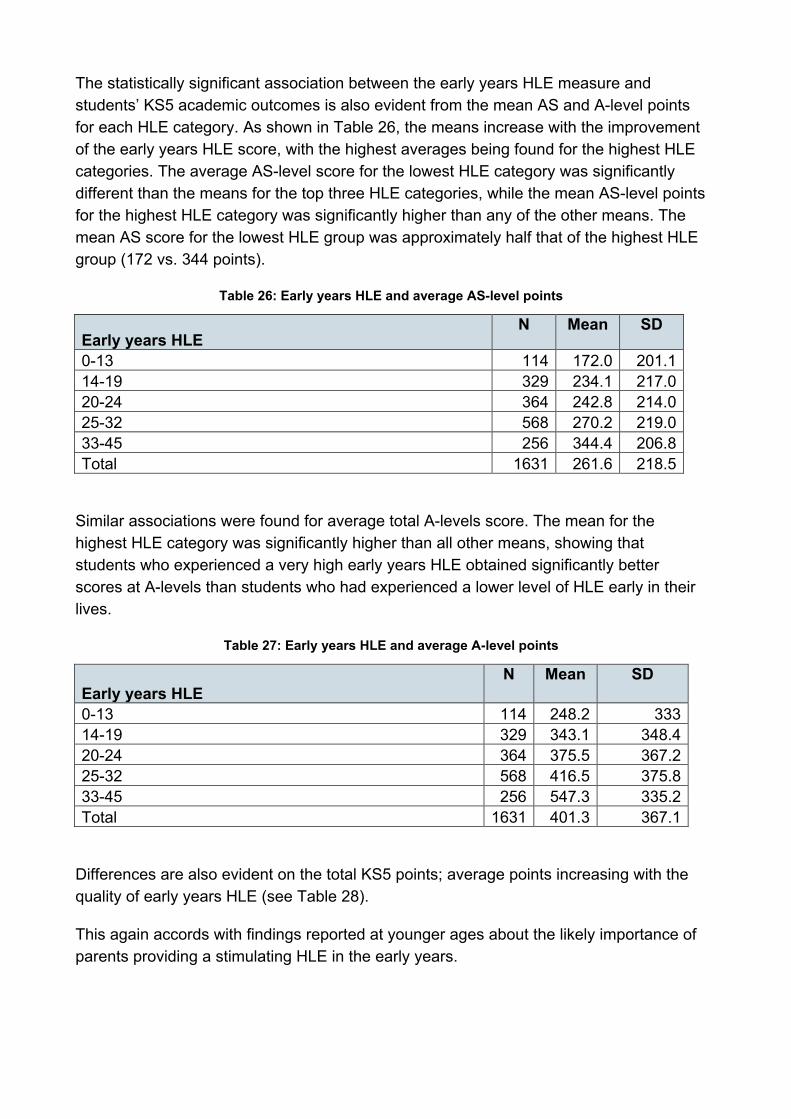
The statistically significant association between the early years HLE measure and students’ KS5 academic outcomes is also evident from the mean AS and A-level points for each HLE category. As shown in Table 26, the means increase with the improvement of the early years HLE score, with the highest averages being found for the highest HLE categories. The average AS-level score for the lowest HLE category was significantly different than the means for the top three HLE categories, while the mean AS-level points for the highest HLE category was significantly higher than any of the other means. The mean AS score for the lowest HLE group was approximately half that of the highest HLE group (172 vs. 344 points).
Table 26: Early years HLE and average AS-level points
Early years HLE N Mean SD
0-13 114 172.0 201.1 14-19 329 234.1 217.0 20-24 364 242.8 214.0 25-32 568 270.2 219.0 33-45 256 344.4 206.8 Total 1631 261.6 218.5
Similar associations were found for average total A-levels score. The mean for the highest HLE category was significantly higher than all other means, showing that students who experienced a very high early years HLE obtained significantly better scores at A-levels than students who had experienced a lower level of HLE early in their lives.
Table 27: Early years HLE and average A-level points
Early years HLE N Mean SD
0-13 114 248.2 333 14-19 329 343.1 348.4 20-24 364 375.5 367.2 25-32 568 416.5 375.8 33-45 256 547.3 335.2 Total 1631 401.3 367.1
Differences are also evident on the total KS5 points; average points increasing with the quality of early years HLE (see Table 28).
This again accords with findings reported at younger ages about the likely importance of parents providing a stimulating HLE in the early years.
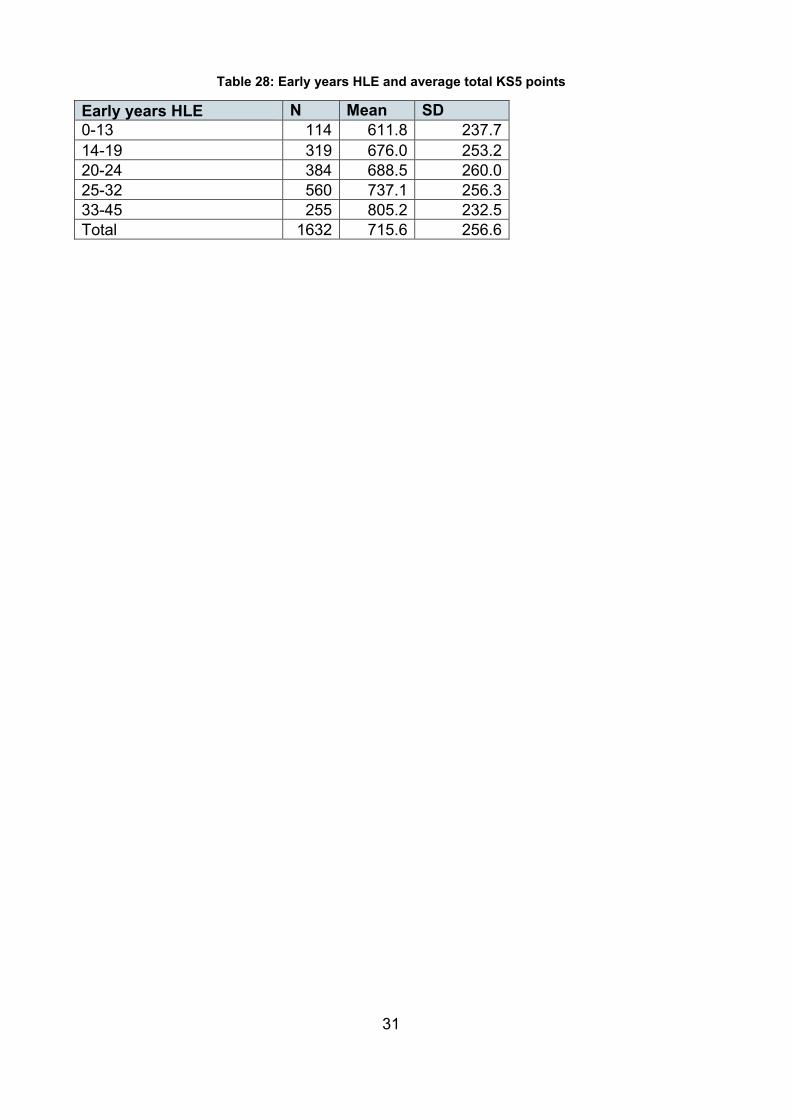
Table 28: Early years HLE and average total KS5 points
Early years HLE N Mean SD 0-13 114 611.8 237.7 14-19 319 676.0 253.2 20-24 384 688.5 260.0 25-32 560 737.1 256.3 33-45 255 805.2 232.5 Total 1632 715.6 256.6
31
The net effects of the early home learning environment and pre-school on KS5 examination entry patterns Here we present the main results of logistic regressions and multilevel multiple regressions that tested the effects of the early years HLE and other measures of the HLE at later ages (KS1, KS2 and KS3) and several measures of children's pre-school experience as predictors of their later KS5 attainment, while controlling for the effects of other background influences (detailed tables are shown in the Technical Appendix).
The analyses show that there are lasting effects of early years experiences in shaping students' longer term academic outcomes up to age 18. They also point to the relative strength of other influences that help to contextualise the HLE and pre-school findings
Entering any AS or A-level examinations The first set of detailed findings present the predictors that shaped the likelihood of students going on to take any AS-level examinations. Results are expressed in terms of Odds Ratios (OR), representing the odds of achieving certain benchmark performance indicators given certain characteristics relative to the odds of the reference group.
Students who had attended pre-school were significantly more likely to enter any AS-level examinations (OR=1.49) than students who had not attended any pre-school, controlling for other influences. Moreover, this likelihood was higher when the students had attended a highly effective pre-school in early number concept (OR=1.78) or in pre-reading (OR=1.71). Pre-school quality was also a significant positive predictor of the probability of entering AS-level examinations. Students who had attended a high quality pre-school being nearly twice as likely to go on to take any AS-levels (ECERS-E - OR=1.88) as students who had not attended any pre-school.
No significant pre-school effects were identified for A-level entry, in contrast to effects on the likelihood of AS entry one year earlier.
Overall, we found that the early years HLE had a statistically significant positive effect on the likelihood of students going on to enter AS-level and A-level examinations, controlling for other individual, family and neighbourhood influences. Students who had experienced a more stimulating (higher scores) early years HLE were more than twice as likely to enter any AS-level examination (OR=2.17) or A-levels (OR=2.41) than students who had experiences the lowest levels of early years HLE. These probabilities were similar to the probabilities obtained for father’s highest qualification levels, but were smaller than the effects of mother’s qualification levels or family income (see Table 1 and Table 2 in the Technical Appendix).
32
Entering 4+ AS-level or 3+ A-level examinations In addition, analyses explored the factors that predicted whether a student took four or more AS-levels or three or more A-levels. Both are indicators of an ‘academic’ route post 16 and strongly linked to the chances of future entry into higher education (HE).
No statistically significant pre-school effects were identified but the various measures of HLE including the early years HLE continued to predict outcomes and especially the HLE in KS3 (enrichment). High scores in the early years HLE increased the likelihood of students going on to take 4+AS-levels (OR=1.64) or 3+A-levels (OR=1.97) than low scores (see Tables 3 and 4 in the Technical Appendix).
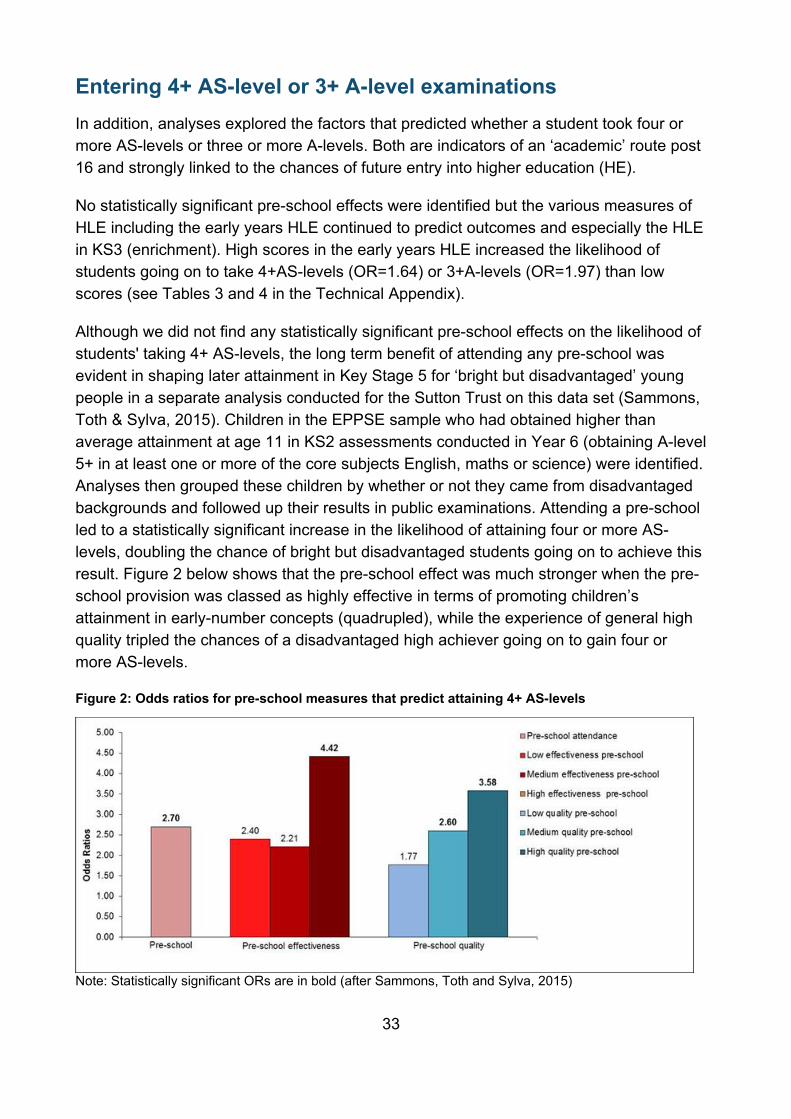
Although we did not find any statistically significant pre-school effects on the likelihood of students' taking 4+ AS-levels, the long term benefit of attending any pre-school was evident in shaping later attainment in Key Stage 5 for ‘bright but disadvantaged’ young people in a separate analysis conducted for the Sutton Trust on this data set (Sammons, Toth & Sylva, 2015). Children in the EPPSE sample who had obtained higher than average attainment at age 11 in KS2 assessments conducted in Year 6 (obtaining A-level 5+ in at least one or more of the core subjects English, maths or science) were identified. Analyses then grouped these children by whether or not they came from disadvantaged backgrounds and followed up their results in public examinations. Attending a pre-school led to a statistically significant increase in the likelihood of attaining four or more AS-levels, doubling the chance of bright but disadvantaged students going on to achieve this result. Figure 2 below shows that the pre-school effect was much stronger when the pre-school provision was classed as highly effective in terms of promoting children’s attainment in early-number concepts (quadrupled), while the experience of general high quality tripled the chances of a disadvantaged high achiever going on to gain four or more AS-levels.
Figure 2: Odds ratios for pre-school measures that predict attaining 4+ AS-levels
Note: Statistically significant ORs are in bold (after Sammons, Toth and Sylva, 2015)
33
Total KS5 points score In addition to analysing examination entry, students’ overall attainment measured by total KS5 points score was investigated in order to identify the factors that play a statistically significant role in shaping overall attainment up to age 18 years+. The results are expressed in terms of effect sizes (ES). The total KS5 points score is a global measure used by many HE institutions in making admissions decisions.
Interestingly, although early years experiences at home and in terms of pre-school had been found to be significant predictors of routes and the likelihood of examination entry, there were no statistically significant effects on total KS5 attainment. No statistically significant lasting pre-school, primary or early years HLE effects were identified. However, other background characteristics were found to predict this outcome (see Table 5 in the Technical Appendix).
KS5 AS and A-levels points Further analyses split the results in total AS and total A-level points. For total AS-level points KS2 and KS3 HLE measures were significant, but no continued early years HLE or pre-school effects were identified.
Overall the results for Total KS5 A-level points were broadly similar. However, for total attainment at A-level the early years HLE still showed a modest, but significant positive effect (ES=0.30). The KS3 HLE measures were also significant in boosting total A-level points score, but no lasting pre-school effects were found.
AS or A-levels in facilitating subjects We also tested the effects of early HLE and pre-school on whether or not students take two or more AS or A-levels in facilitating subjects. No statistically significant effects were found for either early years HLE or pre-school. However, other background predictors were statistically significant, like gender and social disadvantage (see Tables 8 and 9 in the Technical Appendix for details).
34
Conclusions This report has followed up the educational outcomes of young people in the EPPSE 3-16+ project by tracking the students on into Key Stage 5 and studying patterns of entry into AS and A-level examinations, and the factors that predict overall attainment in terms of KS5 points scores and also total points scores for AS and A-levels separately.
The intention was to describe differences in outcomes at AS and A-level for different groups of students (in terms of overall patterns in raw results) and then to use statistical models to establish what factors predict differences in outcomes in KS5. The multilevel statistical models establish the net effect of particular influences, while simultaneously controlling for the effects of other factors. This enabled us to explore whether there is any evidence of continuing effects of the home learning environment, particularly the quality of the early years HLE (measured at age 3+) and of pre-school experiences. The analyses control for the effects of other individual, family and neighbourhood influences.
There are clear differences in terms of raw results showing that those who experienced a better quality early years HLE and those that had attended pre-school have better outcomes at KS5. The more detailed analyses show how strong such effects are while taking account of other important drivers of these outcomes, especially parents’ qualification levels, family SES and family income, for example.
Overall the analyses confirm that both pre-school and the early years HLE continue to shape students' educational outcomes up to age 18 plus. The main effects seem to operate in terms of increasing the likelihood that a young person will enter for any AS (significant positive effects for both pre-school and early HLE) or A-level examinations (only effects for early HLE); in other words enhancing the chances of a young person staying on in an academic route post 16. There are also continued effects of the early HLE on the likelihood of students going on to take 4 or more AS, and 3 or more A-levels.
There is no evidence that pre-school continues to boost overall attainment in terms of total points score for the sample as a whole. However, there is evidence that the early years HLE boosts KS5 attainment in terms of total A-level points score.
In addition to findings for the total sample, further separate analyses have been conducted for a sub group of the EPPSE sample (see Sammons, Toth and Sylva, 2015). This focussed on those students identified as high attaining at the end of KS2 in terms of national assessment results at age 11. Here we found evidence that the ‘bright’ (defined as those with higher attainment in KS2 national assessments at the end of primary school) but disadvantaged got better results if they had attended pre-school. Attending a pre-school led to a statistically significant increase in the likelihood of attaining four or more AS-levels, doubling the chance of bright but disadvantaged students going on to achieve this result.
35
Overall, the present follow-up of the EPPSE sample to age 18+ points to the enduring effects of various important individual, family and neighbourhood influences in shaping students’ long term academic attainment. The findings build on and extend those of earlier phases of the EPPSE research (Sammons et al., 2008a; 2011a; 2014; Sylva et al., 2010; 2014) which demonstrated that both pre-school experiences and the early years HLE continue to shape children’s attainment across different phases of education and including boosting their GCSE results at age 16. For KS5, there is evidence of continuing effects but this suggests pre-school mainly operates for this age group as a factor that enhances the likelihood that students will take AS -level examinations. There is somewhat more evidence of continuing effects of the early years HLE on both entry to AS and A-levels and overall attainment in these examinations.
36
References Melhuish, E.C., Phan, M.B., Sylva, K., Sammons, P., Siraj‐Blatchford, I. and Taggart, B. (2008). Effects of the home learning environment and preschool center experience upon literacy and numeracy development in early primary school, Journal of Social Issues, Vol. 64 No. 1, pp. 95-114.
Sammons, P., Sylva, K., Melhuish, E. C., Siraj-Blatchford, I., Taggart, B. and Elliot, K. (2002). The Effective Provision of Pre-School Education (EPPE) Project: Technical Paper 8a - Measuring the Impact of Pre-School on Children's Cognitive Progress over the Pre-School Period. London: DfES / Institute of Education, University of London.
Sammons, P., Sylva, K., Melhuish, E. C., Siraj-Blatchford, I., Taggart, B. and Elliot, K. (2003). The Effective Provision of Pre-School Education (EPPE) Project: Technical Paper 8b - Measuring the Impact of Pre-School on Children's Social/Behavioural Development over the Pre-School Period. London: DfES / Institute of Education, University of London.
Sammons, P., Elliot, K., Sylva, K., Melhuish, E., Siraj-Blatchford, I. and Taggart, B. (2004). 'The impact of pre-school on young children's cognitive attainments at entry to reception'. British Education Research Journal, 30 (5), 691-712.
Sammons, P., Sylva, K., Melhuish, E.C., Siraj-Blatchford, I., Taggart, B. and Hunt, S. (2008a). Effective Pre-school and Primary Education 3-11 Project (EPPE 3-11): Influences on Children’s Attainment and Progress in Key Stage 2: Cognitive Outcomes in Year 6. Research Report No. DCSF-RR048. Nottingham: DCSF Publications.
Sammons, P., Sylva, K., Melhuish, E.C., Siraj-Blatchford, I., Taggart, B. and Jelicic, H. (2008b). Effective Pre-school and Primary Education 3-11 Project (EPPE 3-11): Influences on Children’s Development and Progress in Key Stage 2: Social/behavioural outcomes in Year 6. Research Report No. DCSF-RR049. Nottingham: DCSF Publications.
Sammons, P., Sylva, K., Melhuish, E.C., Siraj, I., Taggart, B., Toth, K., Draghici, D. and Smees, R. (2011a). Effective Pre-School, Primary and Secondary Education Project (EPPSE 3-14): Influences on Students' Attainment and Progress in Key Stage 3: Academic Outcomes in English, Maths and Science in Year 9. London: Institute of Education, University of London / DfE.
Sammons, P., Sylva, K., Melhuish, E., Siraj-Blatchford, I., Taggart, B., Draghici, D., Toth, K. and Smees, R. (2011b). Effective Pre-School, Primary and Secondary Education Project (EPPSE 3-14) - Influences on students' development in Key Stage 3: Social-behavioural outcomes in Year 9. London: Institute of Education, University of London / Department for Education.
Sammons, P., Sylva, K., Melhuish, E.C., Siraj, I., Taggart, B., Toth, K. & Smees R. (2014). Effective Pre-school, Primary and Secondary Education 3-16 Project (EPPSE 3-16): Influences on students' GCSE attainment and progress at age 16. London: Department for Education Research Report RR352.
37
Sammons, P., Toth, K., & Sylva, K. (2015). Subject to Background: What Promotes Better Achievement for Bright but Disadvantaged Students? London: Sutton Trust.
Sammons, P., Toth, K., & Sylva, K. (2015). Technical Appendix for Pre-school and early home learning effects on A-level outcomes. London: Department for Education Research Report RR472B.
Sylva, K., Sammons, P., Melhuish, E. C., Siraj-Blatchford, I. and Taggart, B. (1999). The Effective Provision of Pre-School Education (EPPE) Project: Technical Paper 1 - An Introduction to the Effective Provision of Pre-School Education (EPPE) Project. London: DfEE / Institute of Education, University of London.
Sylva, K., Siraj-Blatchford, I., Taggart, B., Sammons, P., Melhuish, E., Elliot, K. and Totsika, V. (2006). Capturing Quality in Early Childhood through Environmental Rating Scales. Early Childhood Research Quarterly 21 (1), 76-92.
Sylva, K., Melhuish, E.C., Sammons, P., Siraj-Blatchford, I. and Taggart, B. (Eds.) (2010). Early Childhood Matters: Evidence from the Effective Pre-school and Primary Education project. London: Routledge.
Sylva, K., Melhuish, E.C., Sammons, P., Siraj, I. and Taggart, B. with Smees, R., Toth, K. & Welcomme W. (2014) Effective Pre-school, Primary and Secondary Education 3-16 Project (EPPSE 3-16) Students' educational and developmental outcomes at age 16, London: Department for Education Research Report RR354.
38
© University of Oxford 2015
Reference: DFE-RR472A
ISBN: 978-1-78105-514-4
The views expressed in this report are the authors’ and do not necessarily reflect those of the Department for Education.
Any enquiries regarding this publication should be sent to us at: [email protected] or www.education.gov.uk/contactus
This document is available for download at www.gov.uk/government/publications
39