Embed Size (px)
Citation preview
1
PRE102: Optimizing Your Medical Practice: Current and Future Financial Performance Preconference
Owen J. Dahl, MBA, FACHE, LSSMBBAnnual Conference
October 6, 2013

2
3
Objectives
Complete the picture of total financial management for your practice
Improve your revenue circle
Identify issues with cost management
Identify and report key performance indicators compared to benchmarks
Prepare for future payment model changes
Provide tools and techniques necessary for future success
4
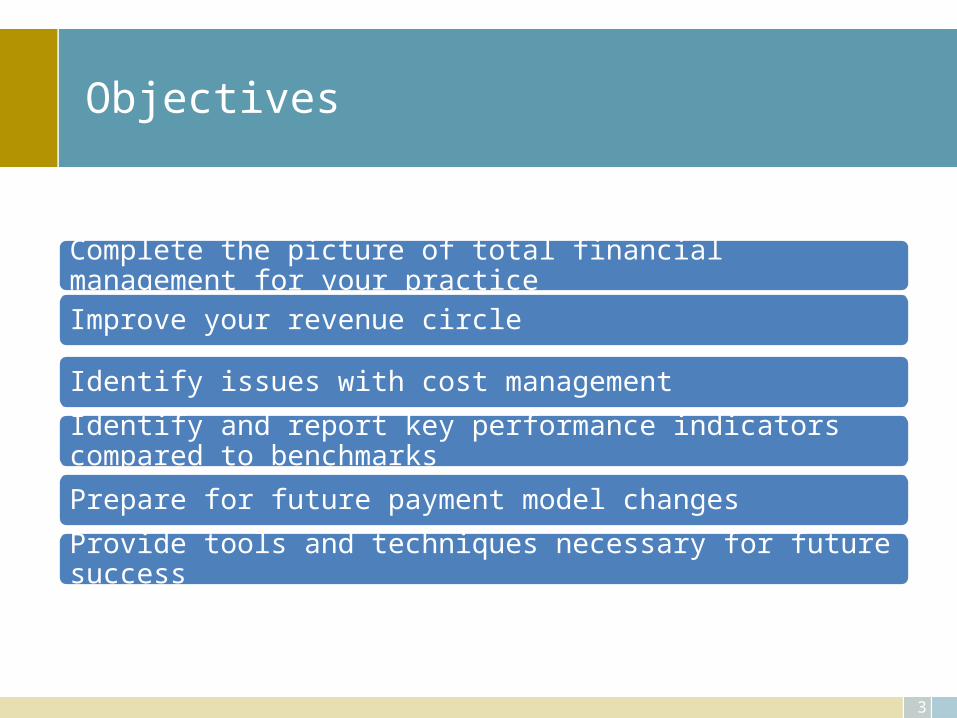
Today’s Health Care Dollar
Adjustments ($40.00):MedicareMedicaidManaged care
$60.00 is collectable 50% overhead
50% forphysicianstake home
$30.00 of totalcharges gohome
-------------------------$100.00 ---------------------------
5
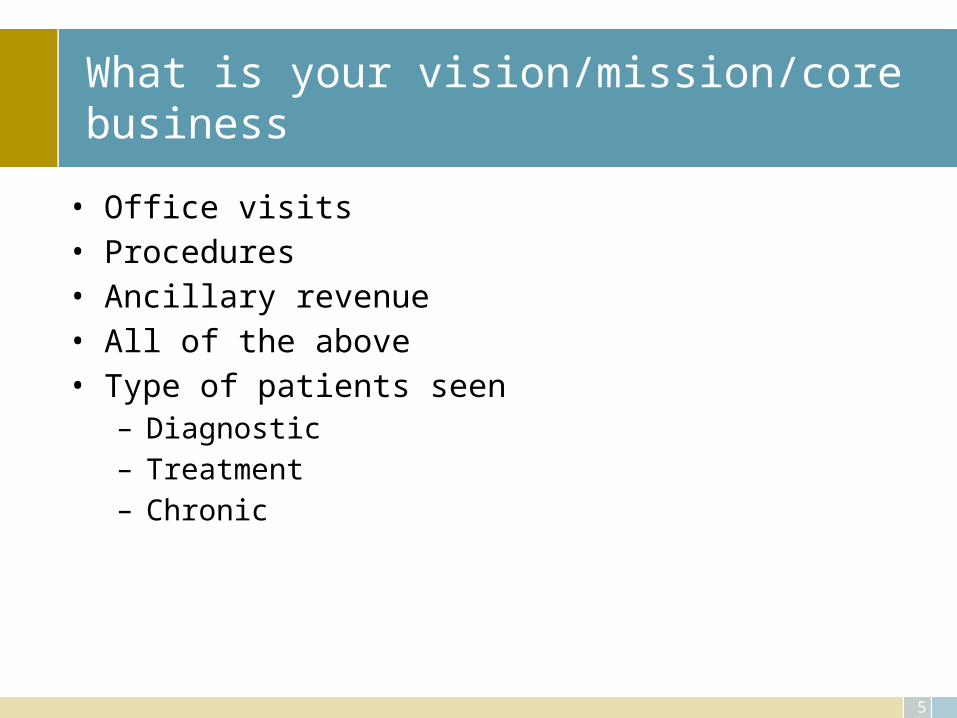
What is your vision/mission/core business
• Office visits• Procedures• Ancillary revenue• All of the above• Type of patients seen
– Diagnostic– Treatment– Chronic
6
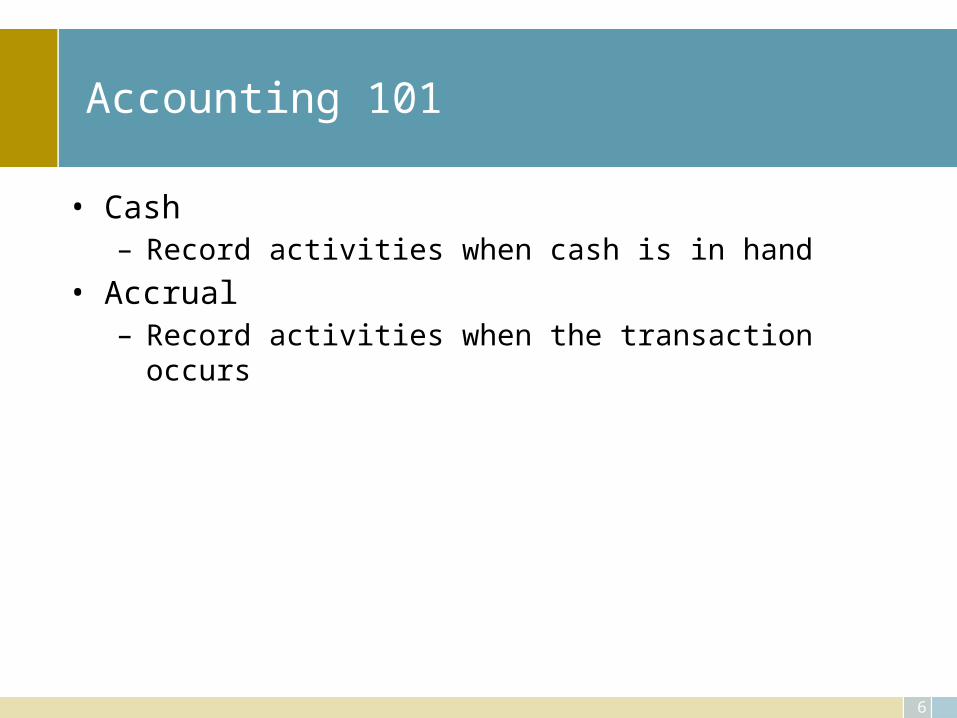
Accounting 101
• Cash– Record activities when cash is in hand
• Accrual– Record activities when the transaction occurs
7
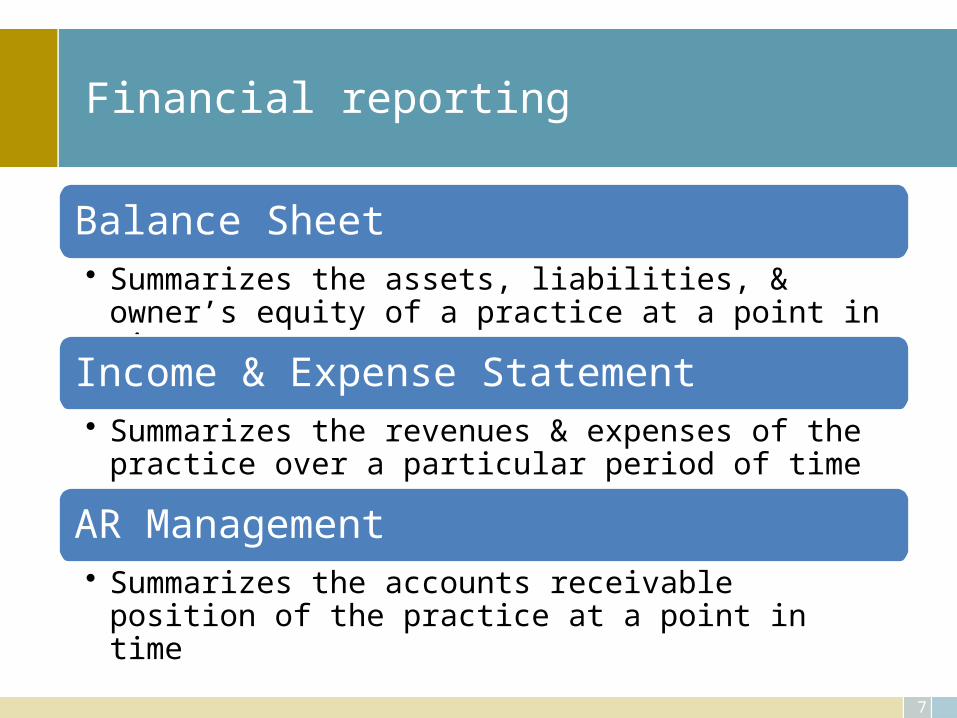
Financial reporting
Balance Sheet• Summarizes the assets, liabilities, & owner’s equity of a
practice at a point in time
Income & Expense Statement• Summarizes the revenues & expenses of the practice over a
particular period of time
AR Management • Summarizes the accounts receivable position of the practice at
a point in time
8
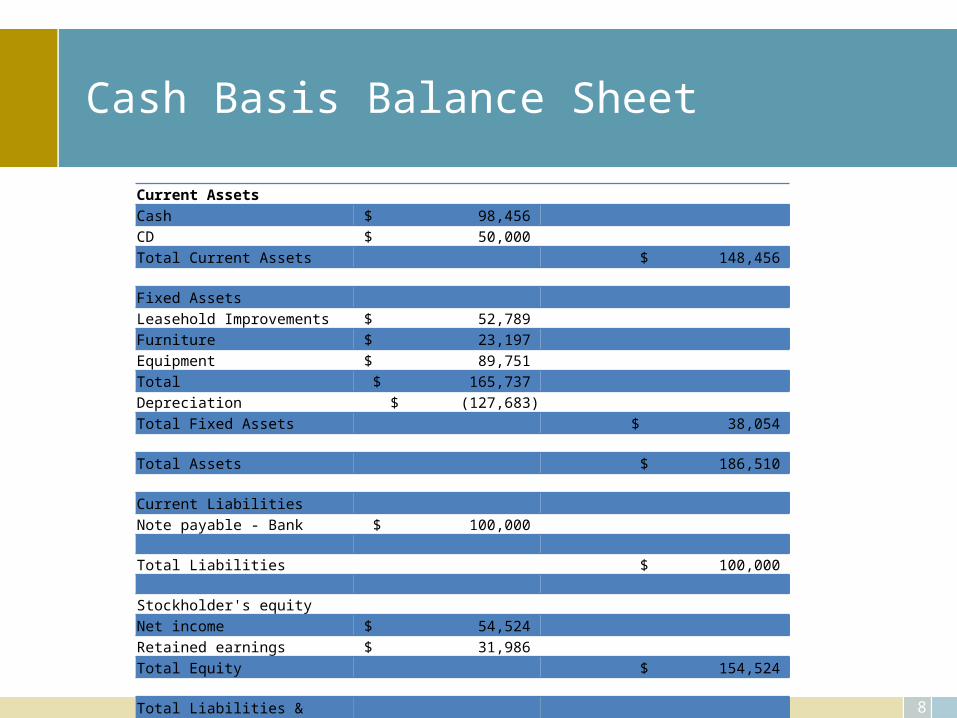
Cash Basis Balance Sheet
Current AssetsCash $ 98,456 CD $ 50,000 Total Current Assets $ 148,456
Fixed AssetsLeasehold Improvements $ 52,789 Furniture $ 23,197 Equipment $ 89,751 Total $ 165,737 Depreciation $ (127,683)Total Fixed Assets $ 38,054
Total Assets $ 186,510
Current LiabilitiesNote payable - Bank $ 100,000
Total Liabilities $ 100,000
Stockholder's equityNet income $ 54,524 Retained earnings $ 31,986 Total Equity $ 154,524
Total Liabilities & Equity $ 186,510
9
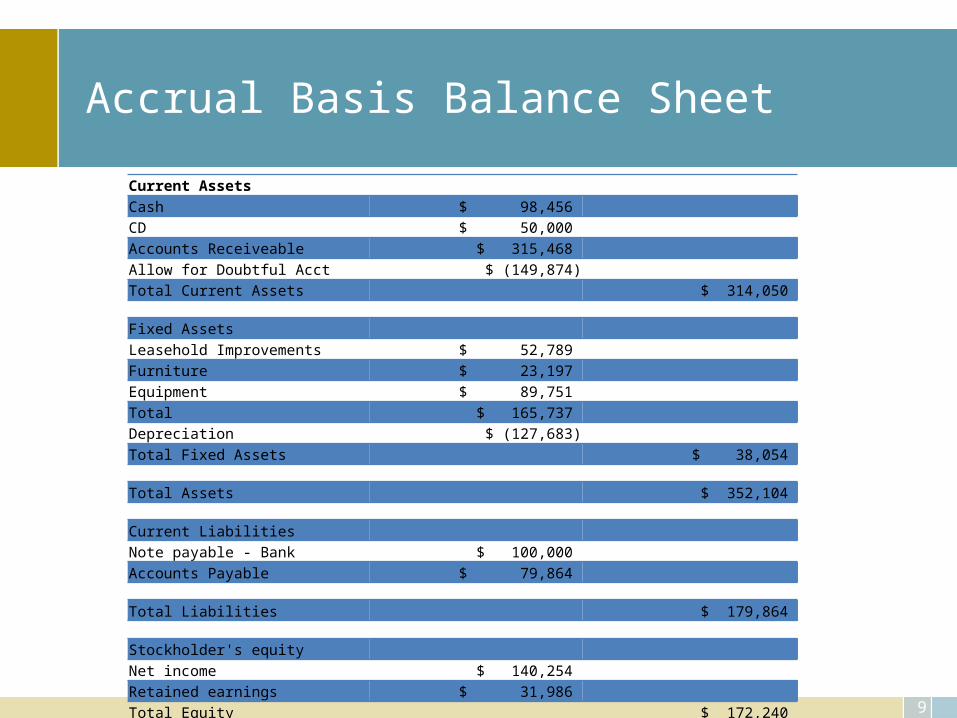
Accrual Basis Balance Sheet
Current AssetsCash $ 98,456 CD $ 50,000 Accounts Receiveable $ 315,468 Allow for Doubtful Acct $ (149,874)Total Current Assets $ 314,050
Fixed AssetsLeasehold Improvements $ 52,789 Furniture $ 23,197 Equipment $ 89,751 Total $ 165,737 Depreciation $ (127,683)Total Fixed Assets $ 38,054
Total Assets $ 352,104
Current LiabilitiesNote payable - Bank $ 100,000 Accounts Payable $ 79,864
Total Liabilities $ 179,864
Stockholder's equityNet income $ 140,254 Retained earnings $ 31,986 Total Equity $ 172,240
Total Liabilities & Equity $ 352,104
10
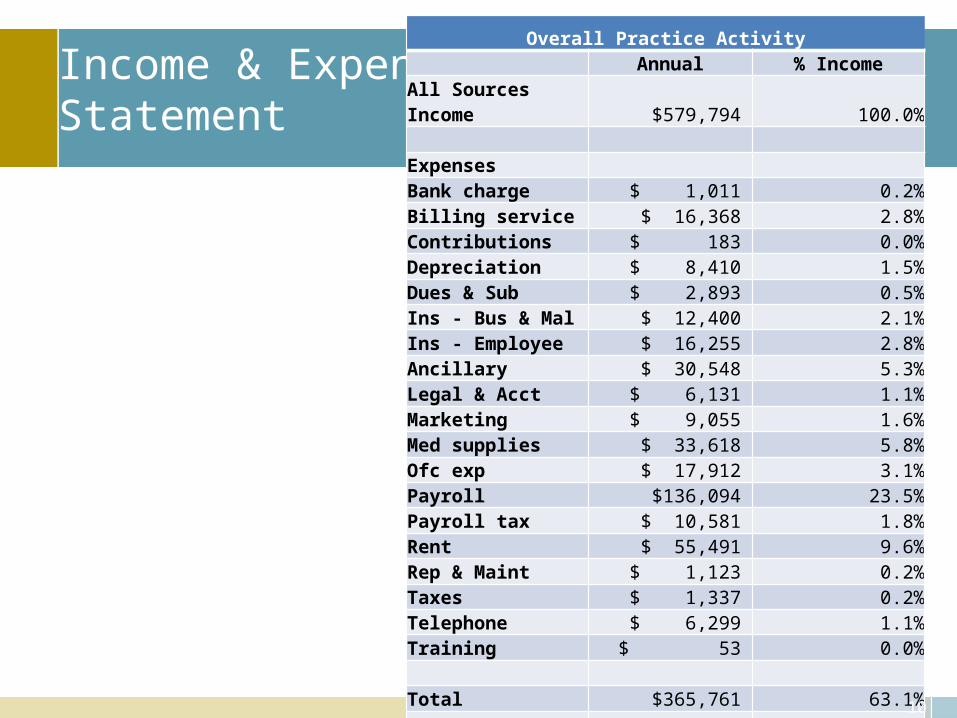
Income & ExpenseStatement
Overall Practice Activity Annual % Income
All Sources Income $579,794 100.0% Expenses Bank charge $ 1,011 0.2%Billing service $ 16,368 2.8%Contributions $ 183 0.0%Depreciation $ 8,410 1.5%Dues & Sub $ 2,893 0.5%Ins - Bus & Mal $ 12,400 2.1%Ins - Employee $ 16,255 2.8%Ancillary $ 30,548 5.3%Legal & Acct $ 6,131 1.1%Marketing $ 9,055 1.6%Med supplies $ 33,618 5.8%Ofc exp $ 17,912 3.1%Payroll $136,094 23.5%Payroll tax $ 10,581 1.8%Rent $ 55,491 9.6%Rep & Maint $ 1,123 0.2%Taxes $ 1,337 0.2%Telephone $ 6,299 1.1%Training $ 53 0.0% Total $365,761 63.1% Net income $214,033 36.9%

11
Benchmark
• Evaluate your practice in terms of best practice leading to improving some aspect of performance, function, financial or process improvement
• Methodology– Identify problem areas– Identify how you did it before (how others do it)– Identify “leading edge” practices– Implement new and improved business practices
12
Revenue
13
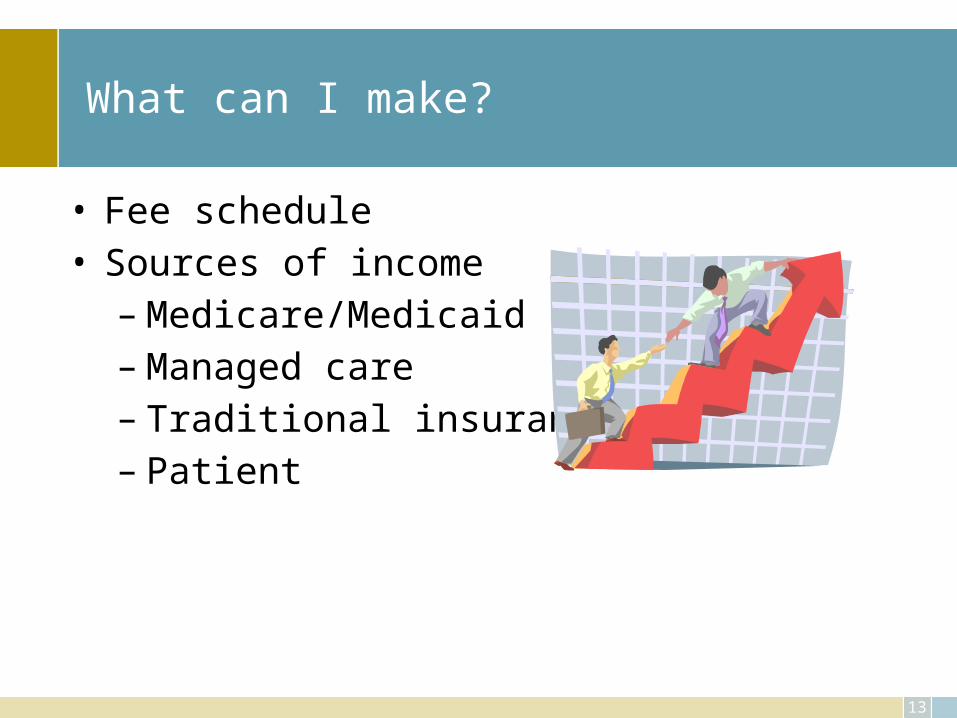
What can I make?
• Fee schedule• Sources of income
– Medicare/Medicaid– Managed care– Traditional insurance– Patient
14
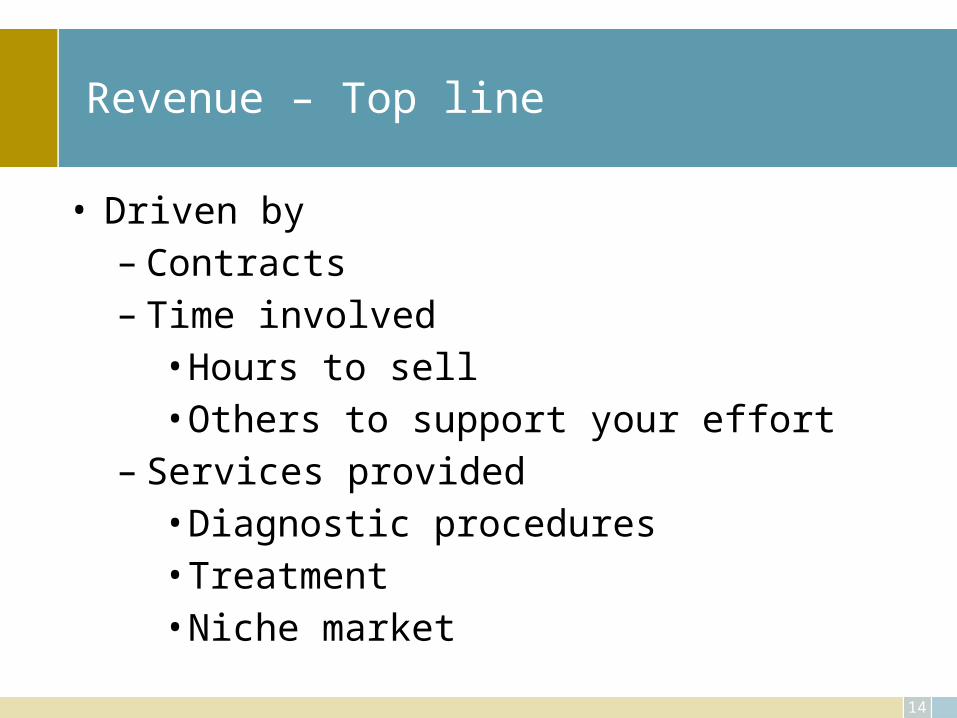
Revenue – Top line
• Driven by – Contracts– Time involved
• Hours to sell• Others to support your effort
– Services provided• Diagnostic procedures• Treatment • Niche market
15
Top Line
• New patients– Recruit– Advertise– Referral sources– Managed care contracts
16
Top Line
• New services– Expand by offering something totally new– Enhance by improving what is currently offered– Factors:
• Experimental• Reimbursement• Training• Capital expenditure
17
Top Line
• Improve revenue– Collections– Managed care contract negotiations
• Identify what contractual rates you are willing to receive, is Medicare sufficient?
– Coding for service provided
18
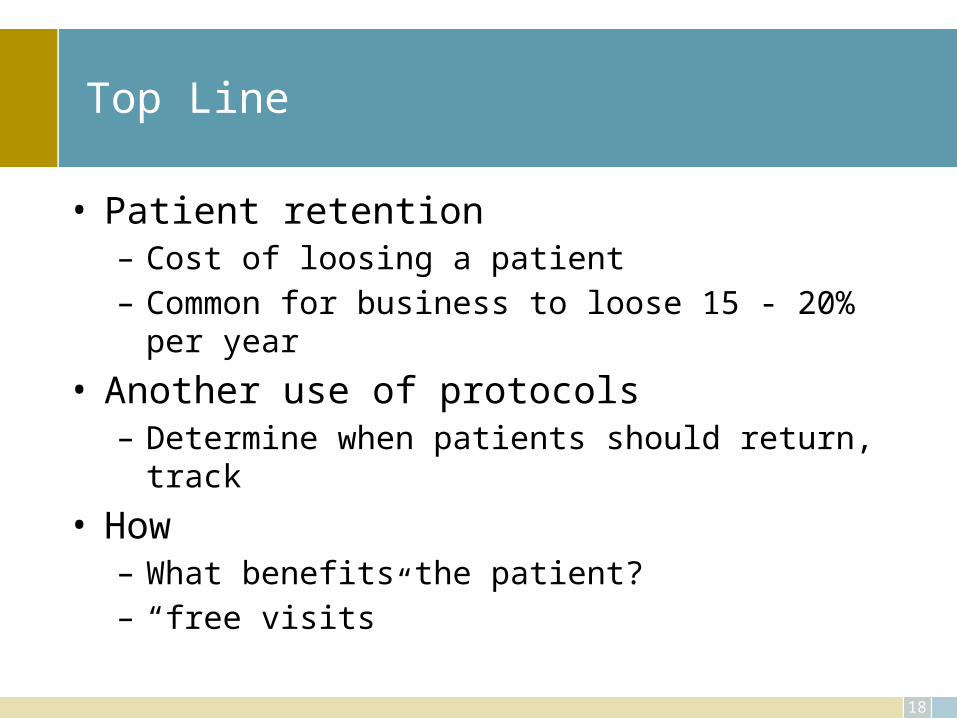
Top Line
• Patient retention– Cost of loosing a patient– Common for business to loose 15 - 20% per year
• Another use of protocols– Determine when patients should return, track
• How– What benefits the patient?– “free visits”

19
Expense
20
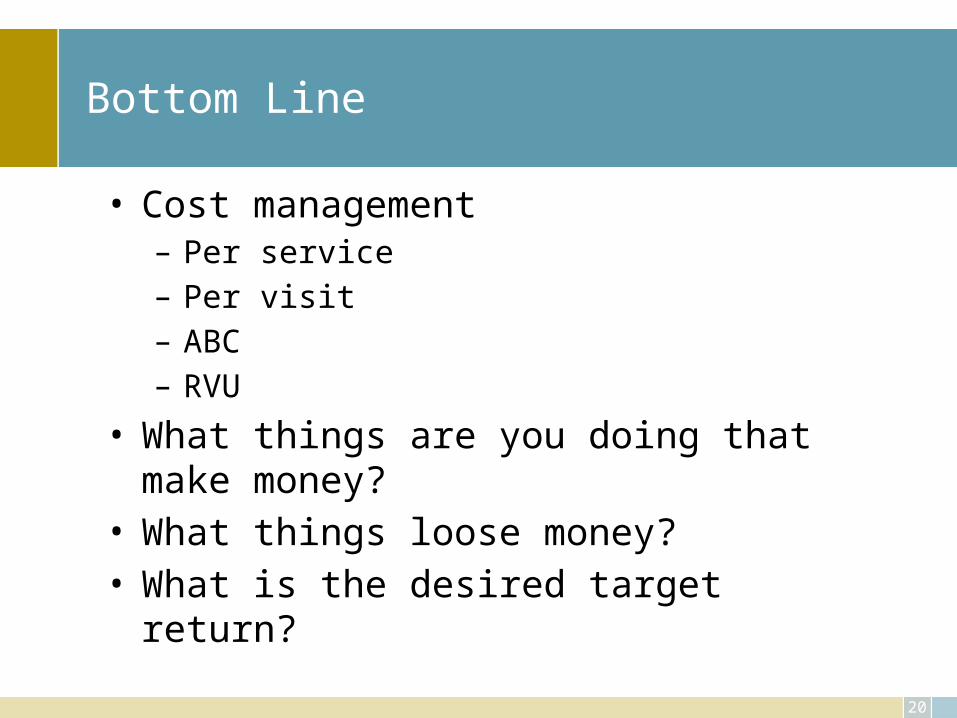
Bottom Line
• Cost management– Per service– Per visit– ABC– RVU
• What things are you doing that make money?• What things loose money?• What is the desired target return?
21
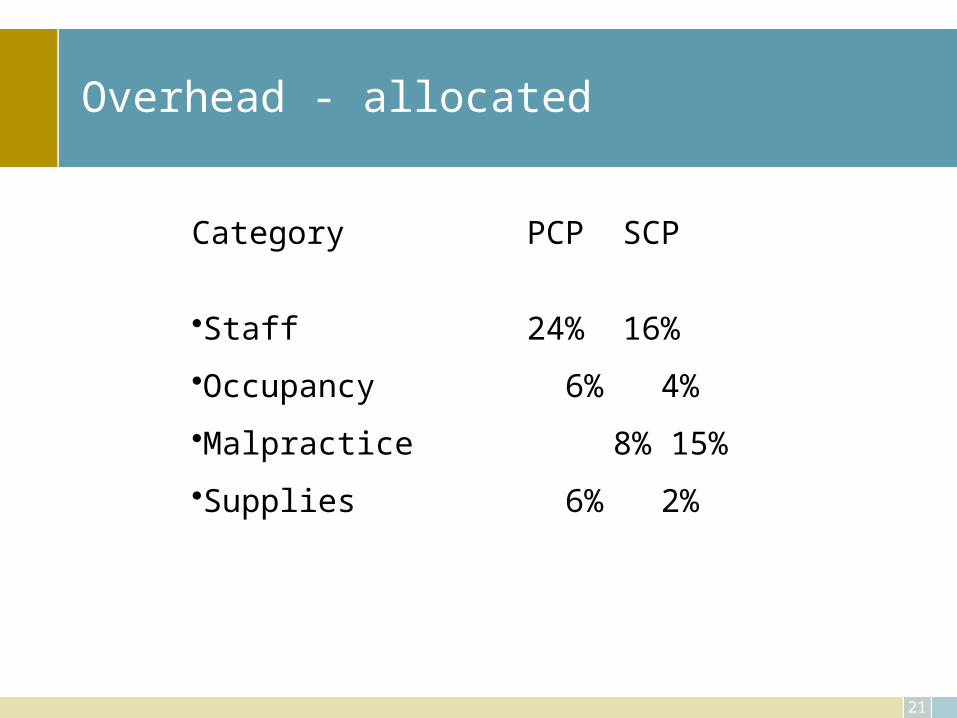
Overhead - allocated
Category PCP SCP
•Staff 24% 16%
•Occupancy 6% 4%
•Malpractice 8% 15%
•Supplies 6% 2%
22
Bottom Line
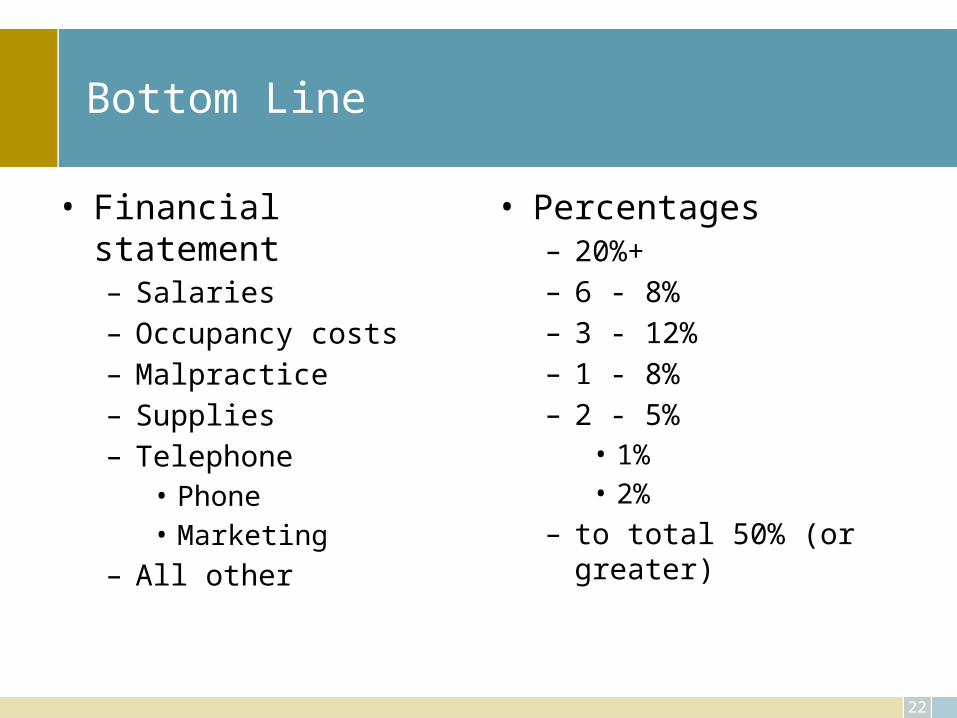
• Financial statement– Salaries – Occupancy costs – Malpractice – Supplies – Telephone
• Phone• Marketing
– All other
• Percentages– 20%+– 6 - 8%– 3 - 12%– 1 - 8%– 2 - 5%
• 1%• 2%
– to total 50% (or greater)
23
Overhead
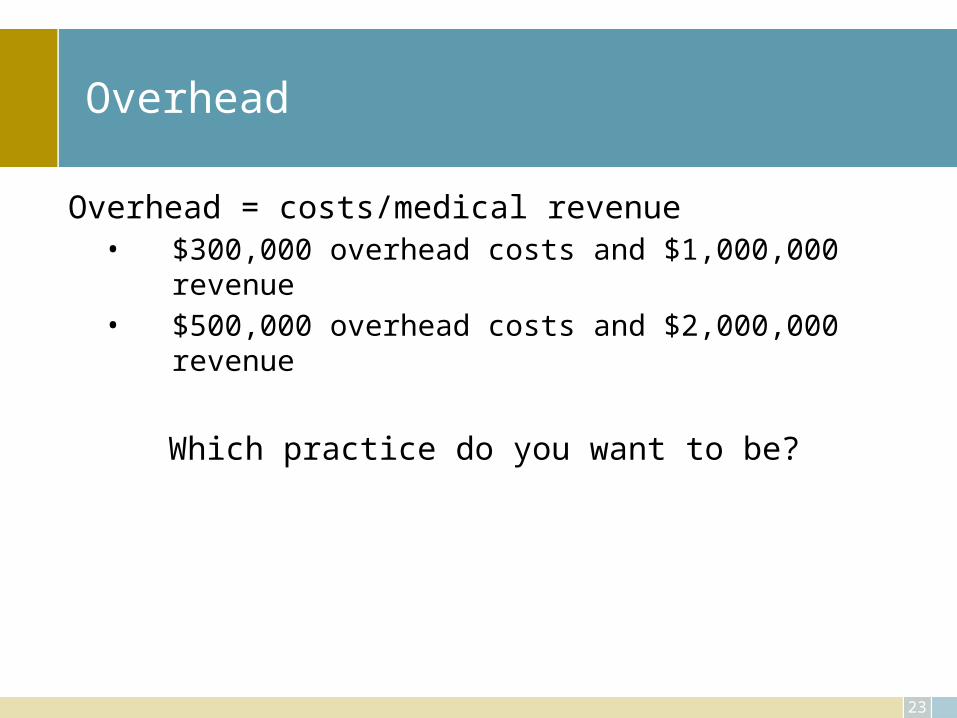
Overhead = costs/medical revenue• $300,000 overhead costs and $1,000,000 revenue• $500,000 overhead costs and $2,000,000 revenue
Which practice do you want to be?
24
Overhead
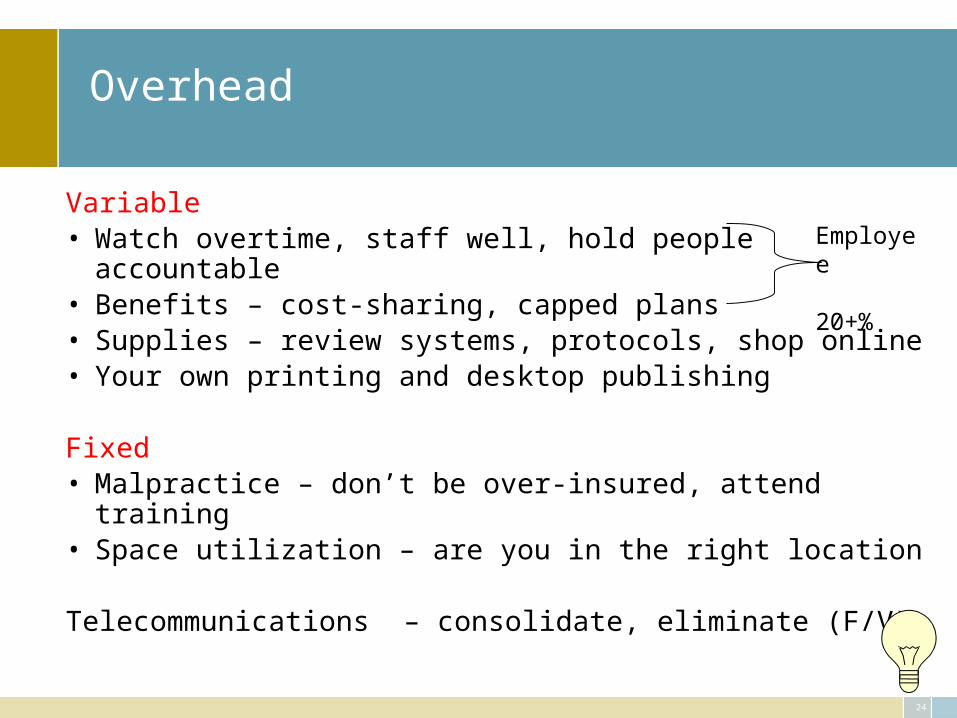
Variable• Watch overtime, staff well, hold people accountable • Benefits – cost-sharing, capped plans • Supplies – review systems, protocols, shop online• Your own printing and desktop publishing
Fixed• Malpractice – don’t be over-insured, attend training• Space utilization – are you in the right location
Telecommunications – consolidate, eliminate (F/V)
Employee
20+%
25
Overhead
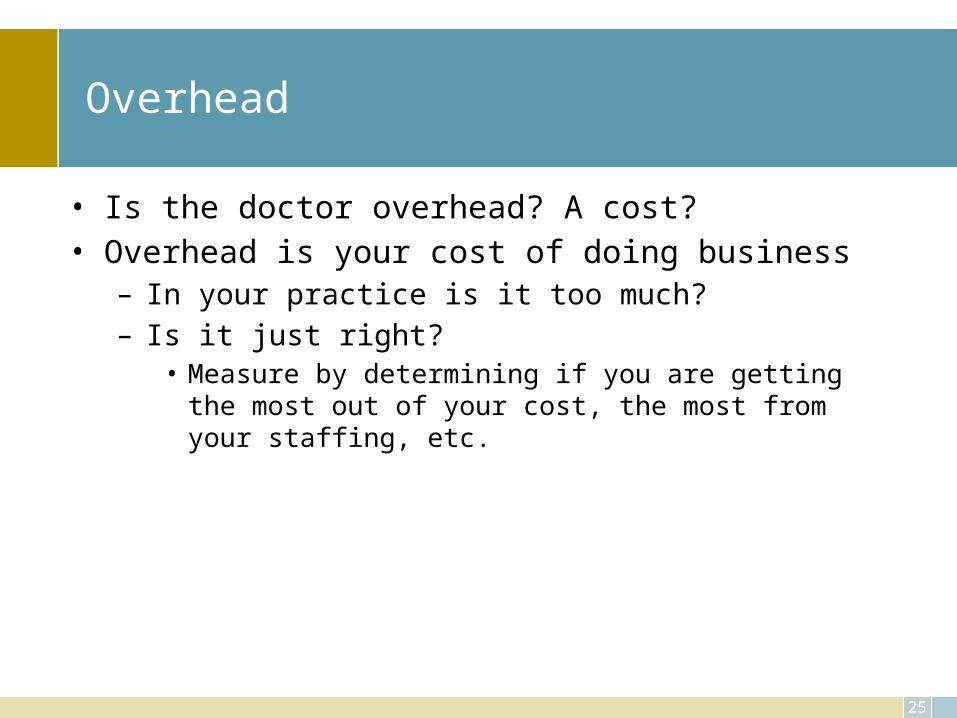
• Is the doctor overhead? A cost?• Overhead is your cost of doing business
– In your practice is it too much?– Is it just right?
• Measure by determining if you are getting the most out of your cost, the most from your staffing, etc.
26
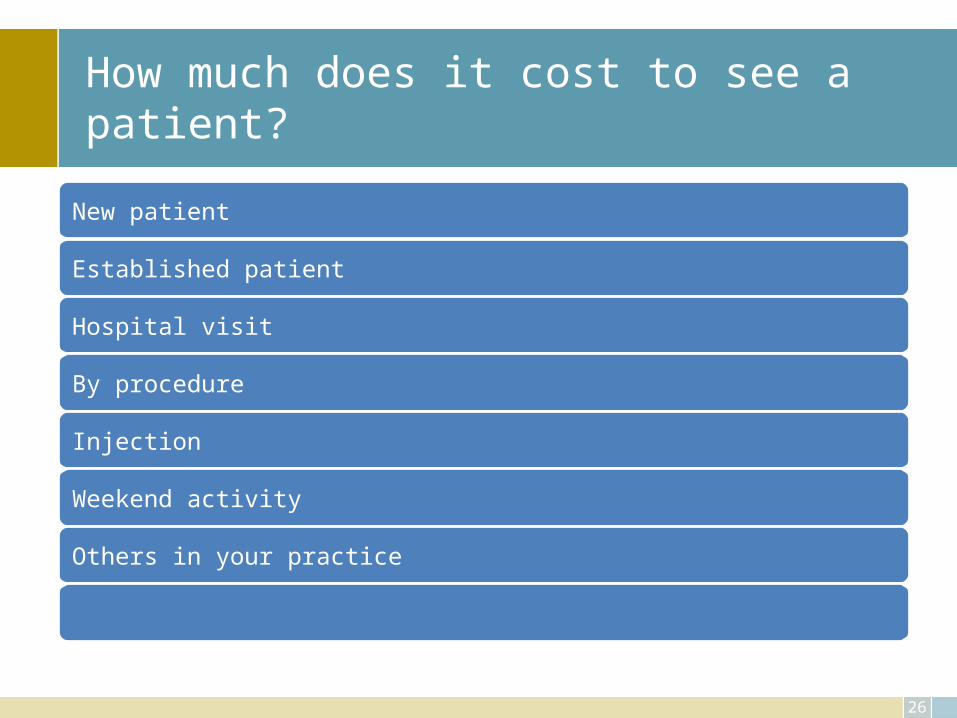
How much does it cost to see a patient?
New patient
Established patient
Hospital visit
By procedure
Injection
Weekend activity
Others in your practice
27
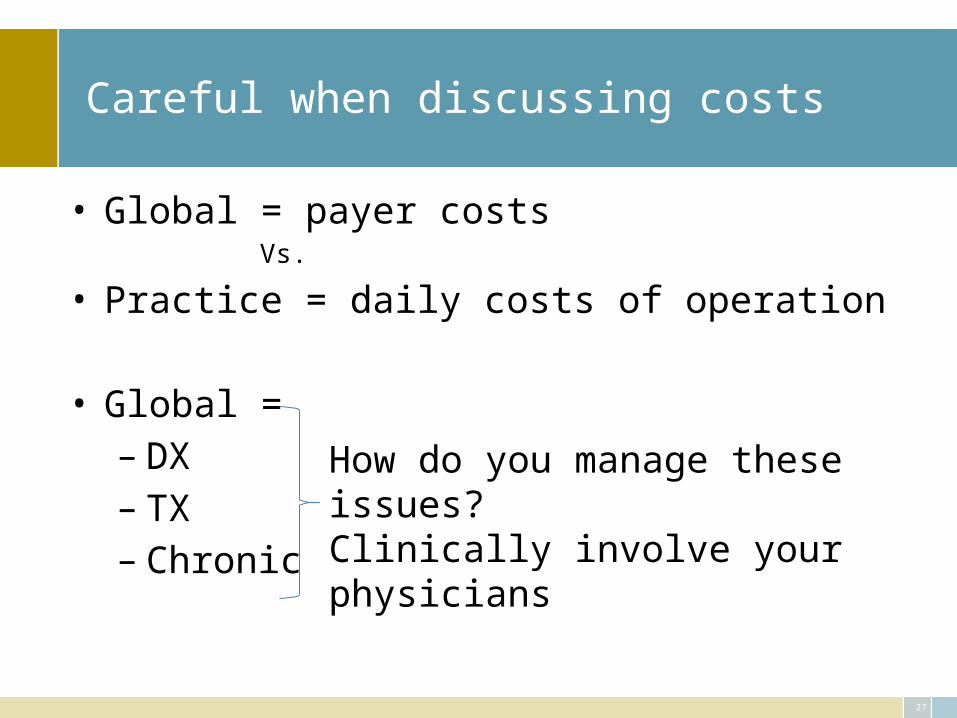
Careful when discussing costs
• Global = payer costsVs.
• Practice = daily costs of operation
• Global = – DX– TX– Chronic
How do you manage these issues?Clinically involve your physicians
28
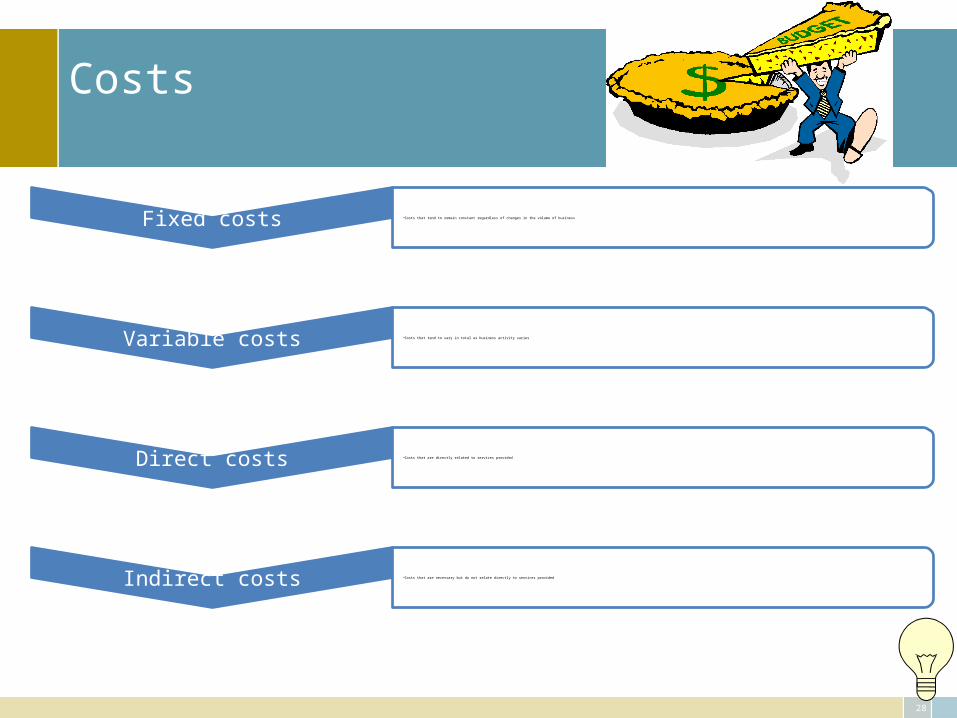
Costs
Fixed costs •Costs that tend to remain constant regardless of changes in the volume of business
Variable costs •Costs that tend to vary in total as business activity varies
Direct costs •Costs that are directly related to services provided
Indirect costs •Costs that are necessary but do not relate directly to services provided
29
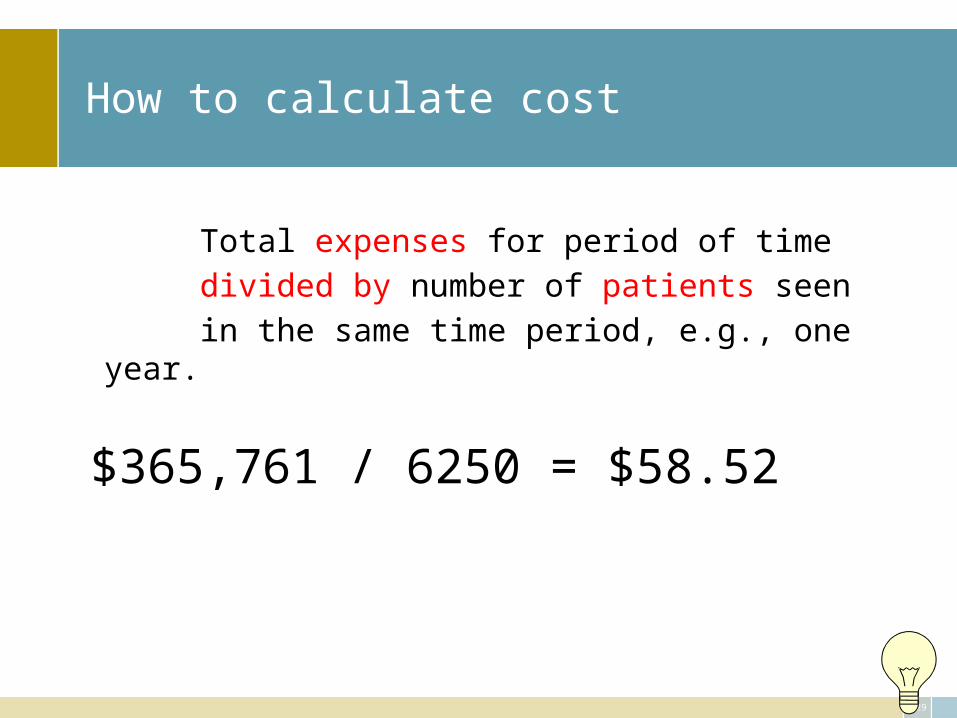
How to calculate cost
Total expenses for period of time
divided by number of patients seen
in the same time period, e.g., one year.
$365,761 / 6250 = $58.52
30
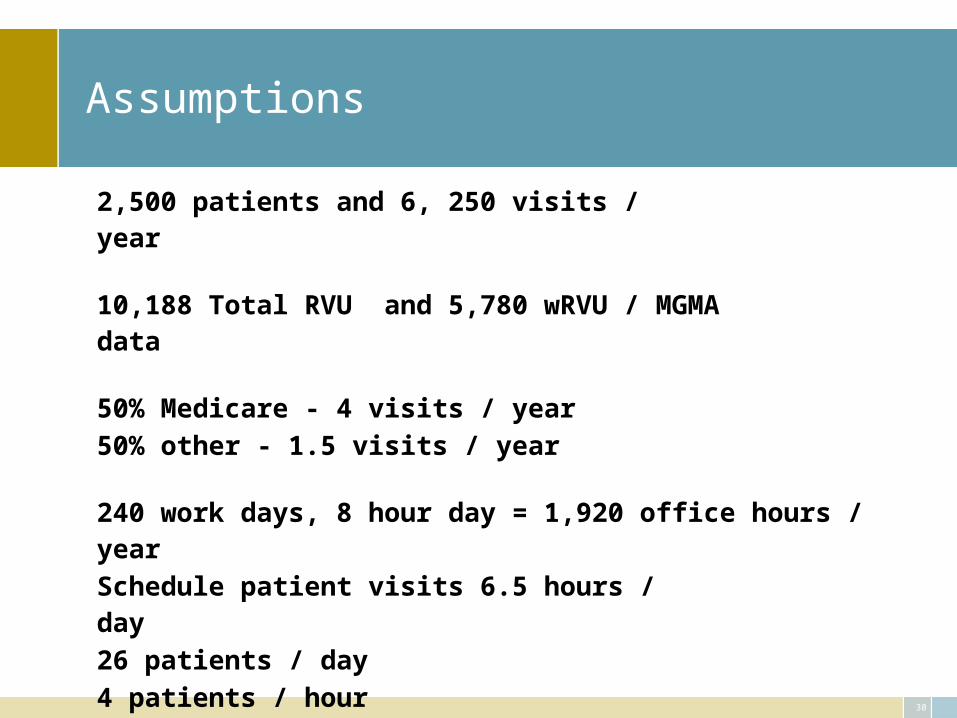
Assumptions
2,500 patients and 6, 250 visits / year
10,188 Total RVU and 5,780 wRVU / MGMA data
50% Medicare - 4 visits / year50% other - 1.5 visits / year
240 work days, 8 hour day = 1,920 office hours / yearSchedule patient visits 6.5 hours / day26 patients / day4 patients / hourOne new patient / work day25 established patients / day
Established patients scheduled - 15 min visits; new pts – 30 min
31
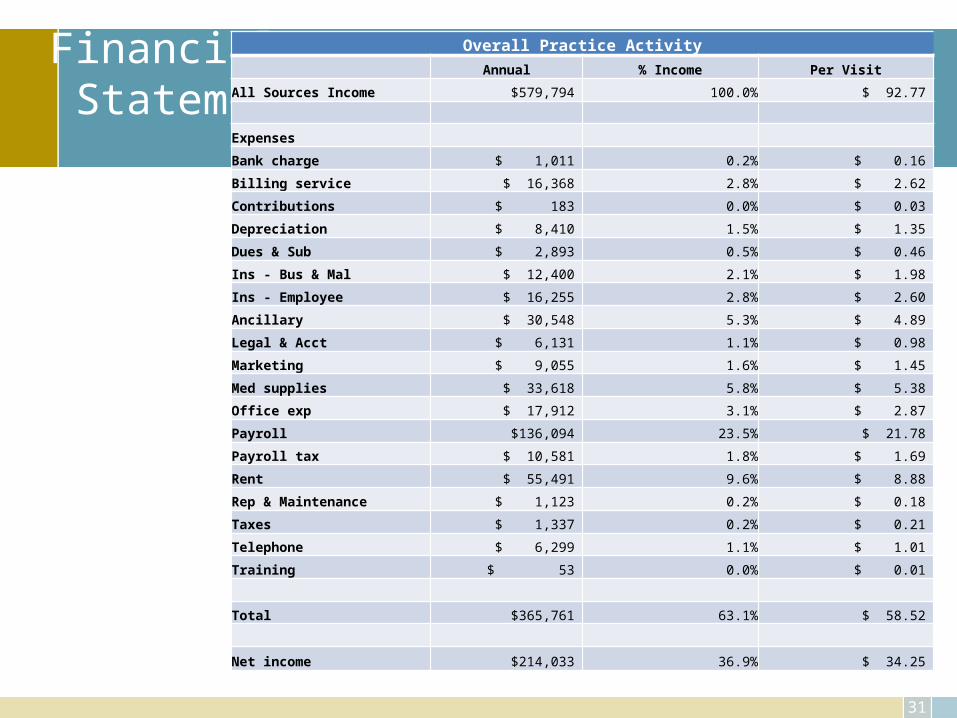
Financial Statement
Overall Practice Activity
Annual % Income Per Visit
All Sources Income $579,794 100.0% $ 92.77
Expenses
Bank charge $ 1,011 0.2% $ 0.16
Billing service $ 16,368 2.8% $ 2.62
Contributions $ 183 0.0% $ 0.03
Depreciation $ 8,410 1.5% $ 1.35
Dues & Sub $ 2,893 0.5% $ 0.46
Ins - Bus & Mal $ 12,400 2.1% $ 1.98
Ins - Employee $ 16,255 2.8% $ 2.60
Ancillary $ 30,548 5.3% $ 4.89
Legal & Acct $ 6,131 1.1% $ 0.98
Marketing $ 9,055 1.6% $ 1.45
Med supplies $ 33,618 5.8% $ 5.38
Office exp $ 17,912 3.1% $ 2.87
Payroll $136,094 23.5% $ 21.78
Payroll tax $ 10,581 1.8% $ 1.69
Rent $ 55,491 9.6% $ 8.88
Rep & Maintenance $ 1,123 0.2% $ 0.18
Taxes $ 1,337 0.2% $ 0.21
Telephone $ 6,299 1.1% $ 1.01
Training $ 53 0.0% $ 0.01
Total $365,761 63.1% $ 58.52
Net income $214,033 36.9% $ 34.25
32
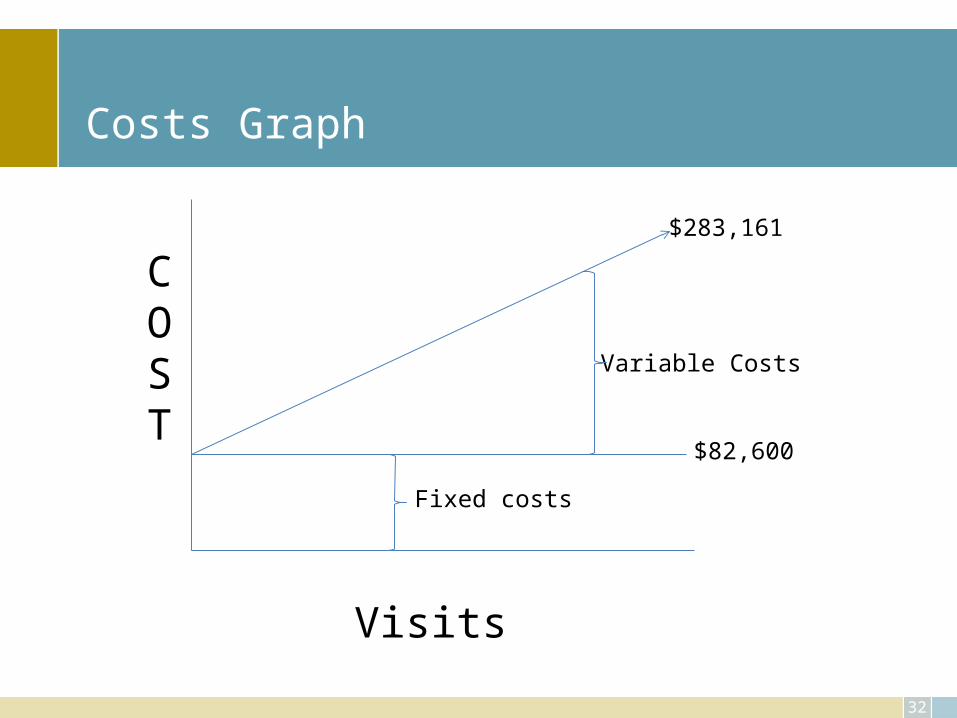
Costs Graph
$82,600
$283,161
COST
Visits
Fixed costs
Variable Costs
33
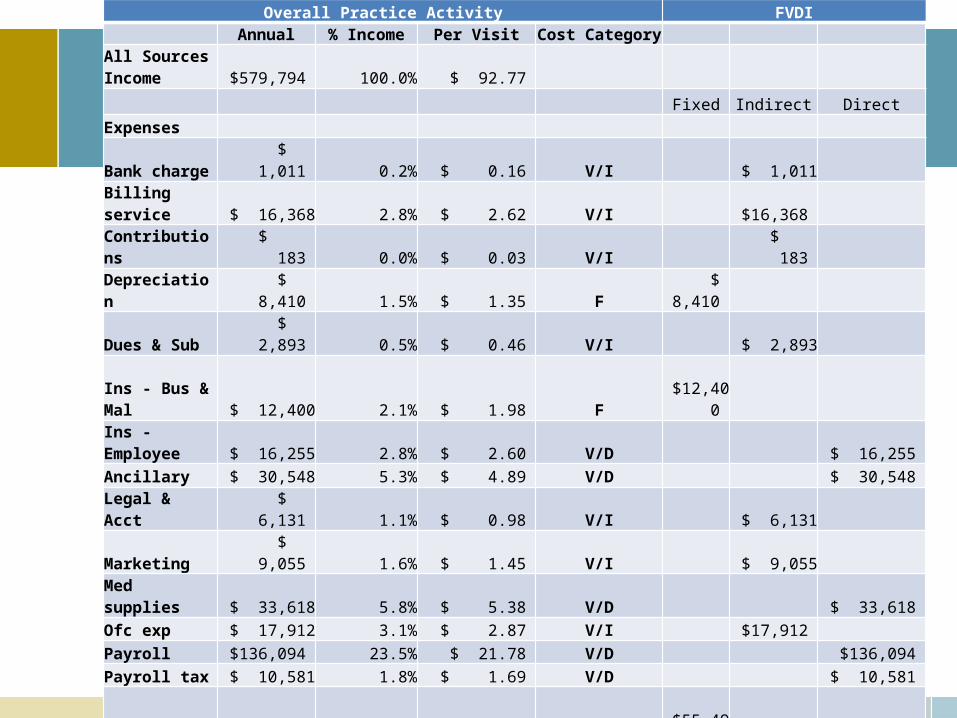
Overall Practice Activity FVDI Annual % Income Per Visit Cost Category
All Sources Income $579,794 100.0% $ 92.77
Fixed Indirect Direct
Expenses
Bank charge $ 1,011 0.2% $ 0.16 V/I $ 1,011
Billing service $ 16,368 2.8% $ 2.62 V/I $16,368
Contributions $ 183 0.0% $ 0.03 V/I $ 183
Depreciation $ 8,410 1.5% $ 1.35 F $ 8,410
Dues & Sub $ 2,893 0.5% $ 0.46 V/I $ 2,893 Ins - Bus & Mal $ 12,400 2.1% $ 1.98 F $12,400
Ins - Employee $ 16,255 2.8% $ 2.60 V/D $ 16,255
Ancillary $ 30,548 5.3% $ 4.89 V/D $ 30,548
Legal & Acct $ 6,131 1.1% $ 0.98 V/I $ 6,131
Marketing $ 9,055 1.6% $ 1.45 V/I $ 9,055
Med supplies $ 33,618 5.8% $ 5.38 V/D $ 33,618
Ofc exp $ 17,912 3.1% $ 2.87 V/I $17,912
Payroll $136,094 23.5% $ 21.78 V/D $136,094
Payroll tax $ 10,581 1.8% $ 1.69 V/D $ 10,581
Rent $ 55,491 9.6% $ 8.88 F $55,491
Rep & Maint $ 1,123 0.2% $ 0.18 V/I $ 1,123
Taxes $ 1,337 0.2% $ 0.21 V/I $ 1,337
Telephone $ 6,299 1.1% $ 1.01 F $ 6,299
Training $ 53 0.0% $ 0.01 V/D $ 53
Total $365,761 63.1% $ 58.52 $82,600 $56,013 $227,149
13.22 8.96 36.34
Net income $214,033 36.9% $ 34.25 22.6% 15.3% 62.1%
Office Visit Activity Only
34
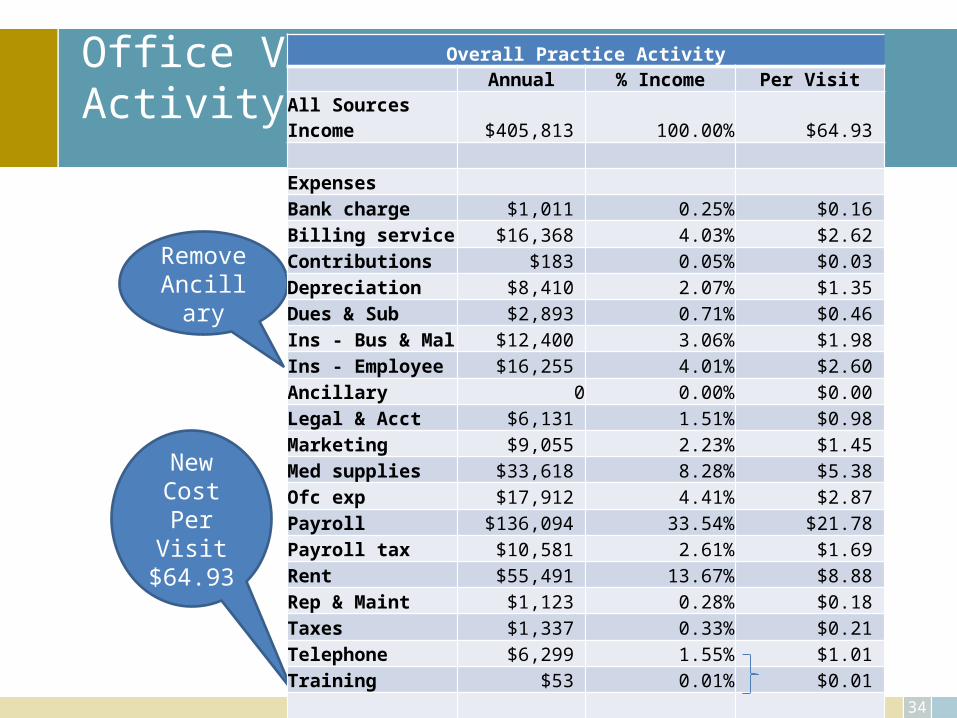
New Cost Per Visit$64.93
RemoveAncillary
Overall Practice Activity Annual % Income Per Visit
All Sources Income $405,813 100.00% $64.93 Expenses Bank charge $1,011 0.25% $0.16 Billing service $16,368 4.03% $2.62 Contributions $183 0.05% $0.03 Depreciation $8,410 2.07% $1.35 Dues & Sub $2,893 0.71% $0.46 Ins - Bus & Mal $12,400 3.06% $1.98 Ins - Employee $16,255 4.01% $2.60 Ancillary 0 0.00% $0.00 Legal & Acct $6,131 1.51% $0.98 Marketing $9,055 2.23% $1.45 Med supplies $33,618 8.28% $5.38 Ofc exp $17,912 4.41% $2.87 Payroll $136,094 33.54% $21.78 Payroll tax $10,581 2.61% $1.69 Rent $55,491 13.67% $8.88 Rep & Maint $1,123 0.28% $0.18 Taxes $1,337 0.33% $0.21 Telephone $6,299 1.55% $1.01 Training $53 0.01% $0.01
Total $335,213 82.60% $53.63 Net income $70,600 17.40% $11.30

35
Background look
Item $$$Total cost $ 365,761 Total revenue $ 579,794
Cost per visit (6,250) $ 58.52
Cost per hour (1,920 hours) $ 190.50
Average cost per patient / hour $ 47.63
Revenue per hour $ 301.98
Cost per RVU $ 35.90
Cost per wRVU $ 63.28
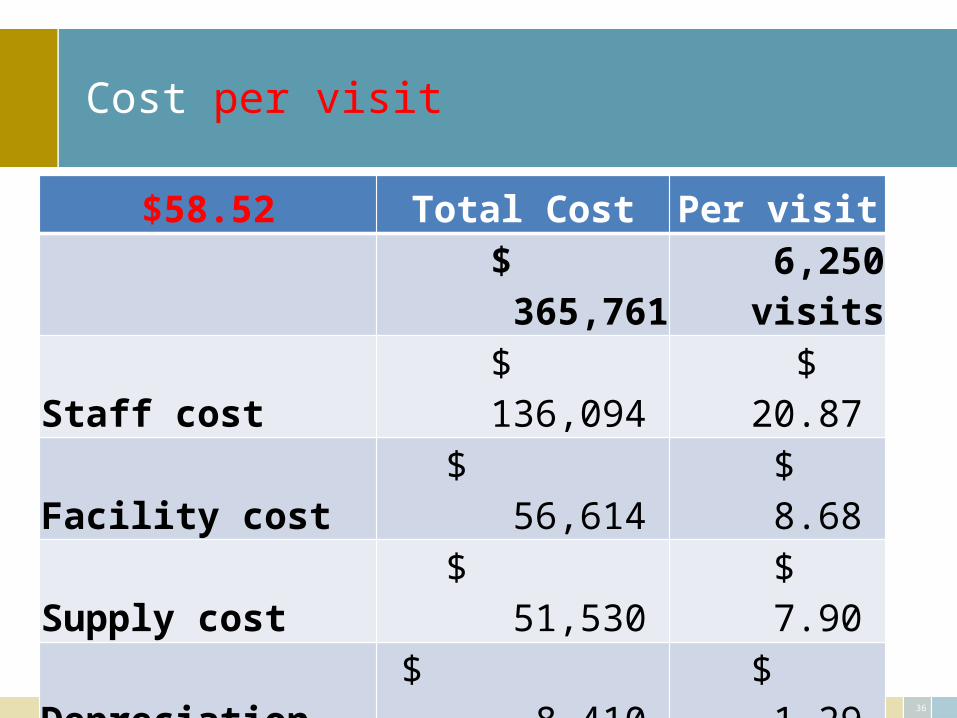
36
Cost per visit
$58.52 Total Cost Per visit
$ 365,761 6,250
visits
Staff cost $ 136,094 $ 20.87
Facility cost $ 56,614 $ 8.68
Supply cost $ 51,530 $ 7.90
Depreciation $ 8,410 $ 1.29
Communication $ 6,299 $ 0.97
Physician $ 214,033 $ 32.83
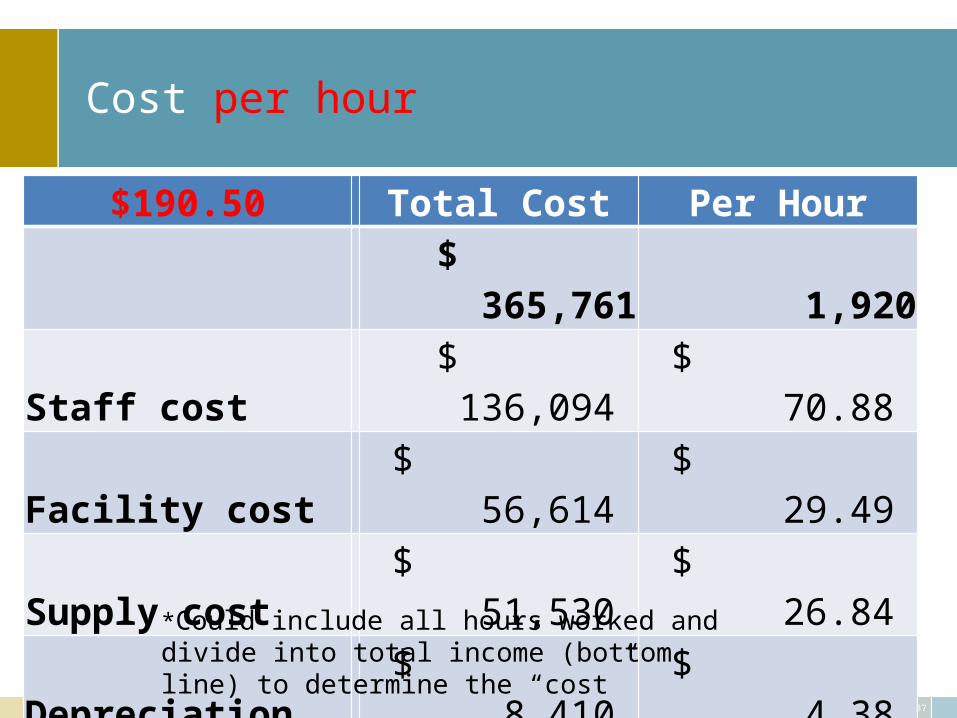
37
Cost per hour
$190.50 Total Cost Per Hour$ 365,761 1,920
Staff cost $ 136,094 $ 70.88
Facility cost $ 56,614 $ 29.49
Supply cost $ 51,530 $ 26.84
Depreciation $ 8,410 $ 4.38
Communication $ 6,299 $ 3.28
Physician* $ 214,033 $ 111.48
*Could include all hours worked and divide into total income (bottom line) to determine the “cost”
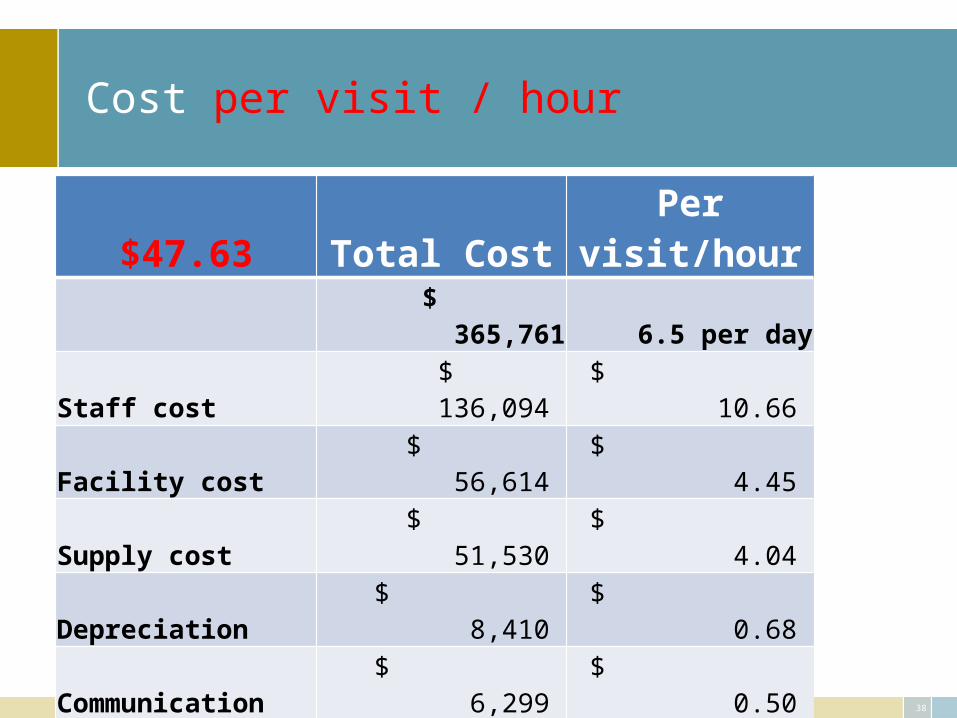
38
Cost per visit / hour
$47.63 Total Cost Per visit/hour$ 365,761 6.5 per day
Staff cost $ 136,094 $ 10.66
Facility cost $ 56,614 $ 4.45
Supply cost $ 51,530 $ 4.04
Depreciation $ 8,410 $ 0.68
Communication $ 6,299 $ 0.50
Physician $ 214,033 $ 16.74
Cost per hour
25 Established Pts / day X 6 hrs = 4.2 per hour $ 45.36
1 New Pt / day $ 95.25
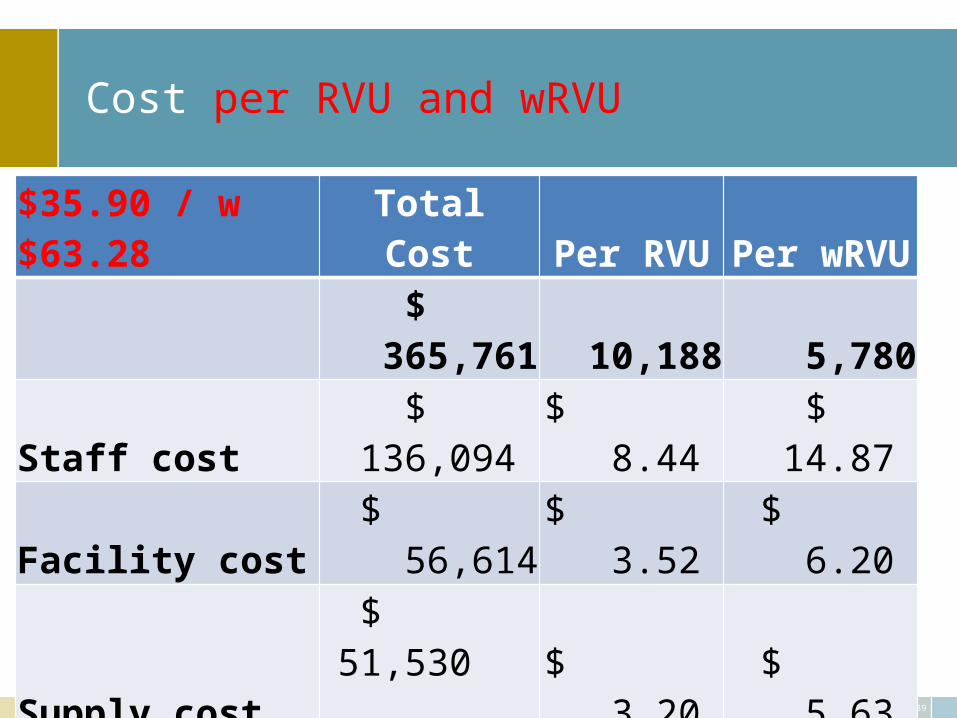
39
Cost per RVU and wRVU
$35.90 / w $63.28 Total Cost Per RVU Per wRVU
$ 365,761 10,188 5,780
Staff cost $ 136,094 $ 8.44 $ 14.87
Facility cost $ 56,614 $ 3.52 $ 6.20
Supply cost$ 51,530
$ 3.20 $ 5.63
Depreciation $ 8,410 $ 0.54 $ 0.95
Communication $ 6,299 $ 0.39 $ 0.70
Physician $ 214,033 $ 13.25 $ 23.35
40
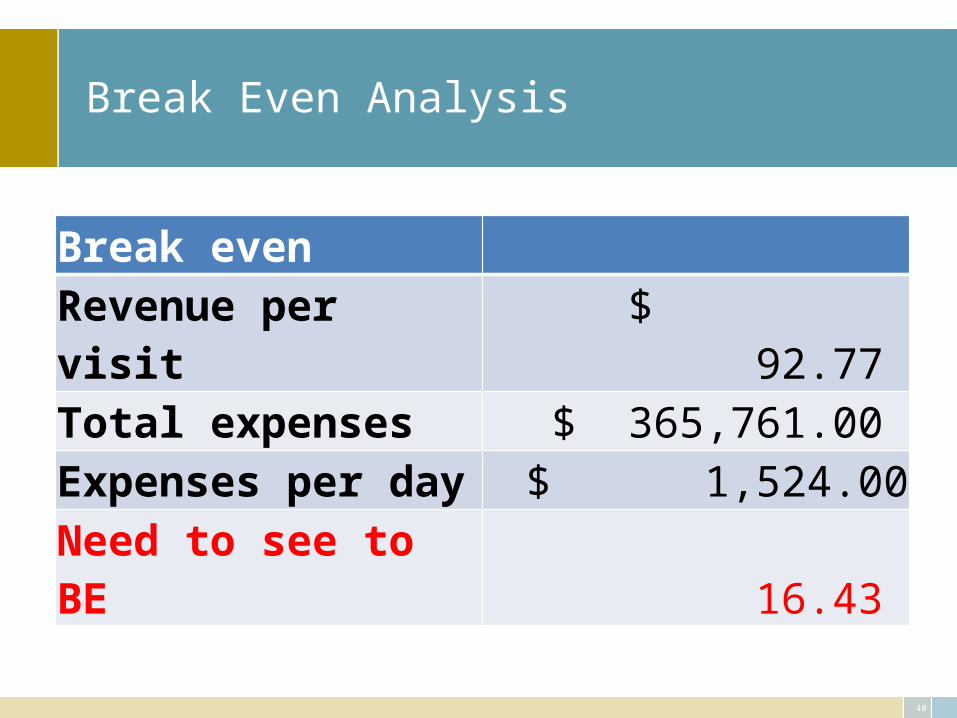
Break Even Analysis
Break evenRevenue per visit $ 92.77 Total expenses $ 365,761.00 Expenses per day $ 1,524.00 Need to see to BE 16.43
41
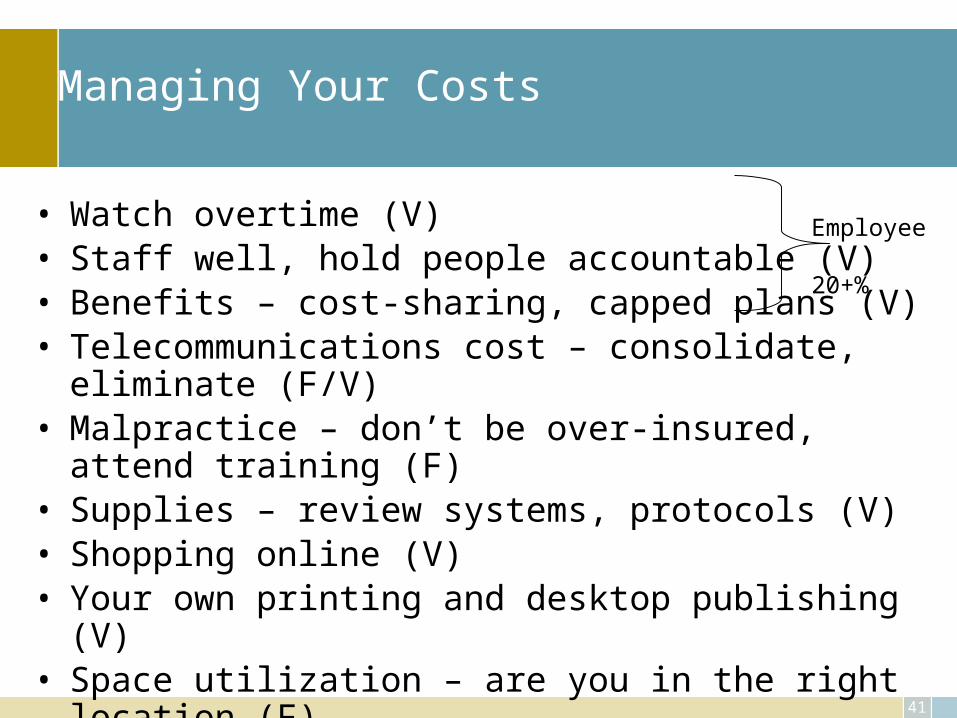
Managing Your Costs
• Watch overtime (V)• Staff well, hold people accountable (V)• Benefits – cost-sharing, capped plans (V)• Telecommunications cost – consolidate, eliminate (F/V)• Malpractice – don’t be over-insured, attend training (F)• Supplies – review systems, protocols (V)• Shopping online (V)• Your own printing and desktop publishing (V)• Space utilization – are you in the right location (F)
Employee
20+%
42
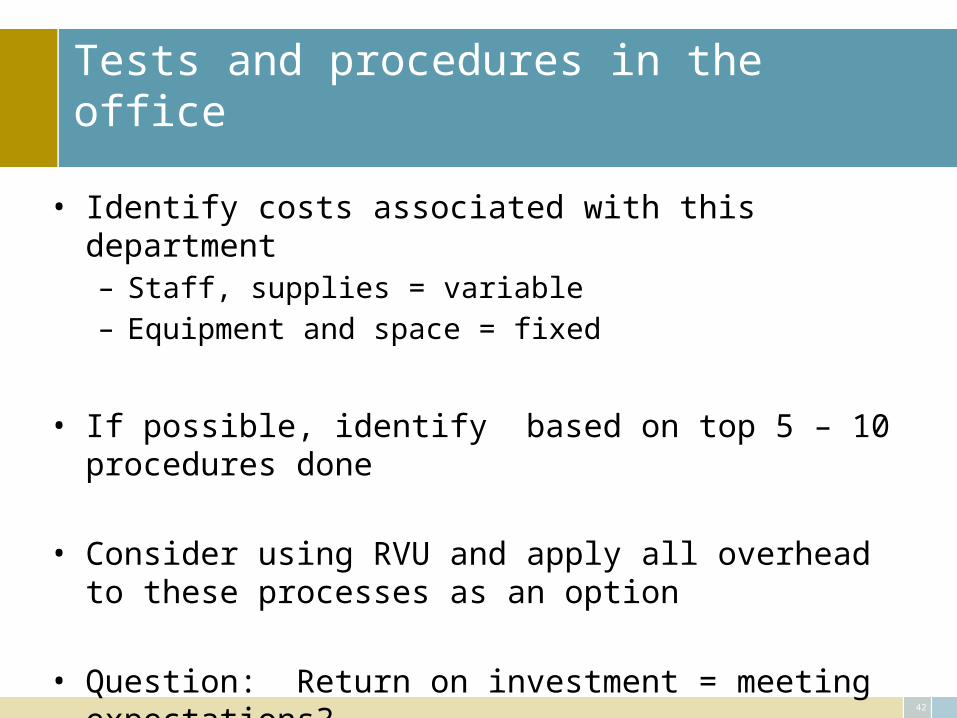
Tests and procedures in the office
• Identify costs associated with this department– Staff, supplies = variable– Equipment and space = fixed
• If possible, identify based on top 5 – 10 procedures done
• Consider using RVU and apply all overhead to these processes as an option
• Question: Return on investment = meeting expectations?
43
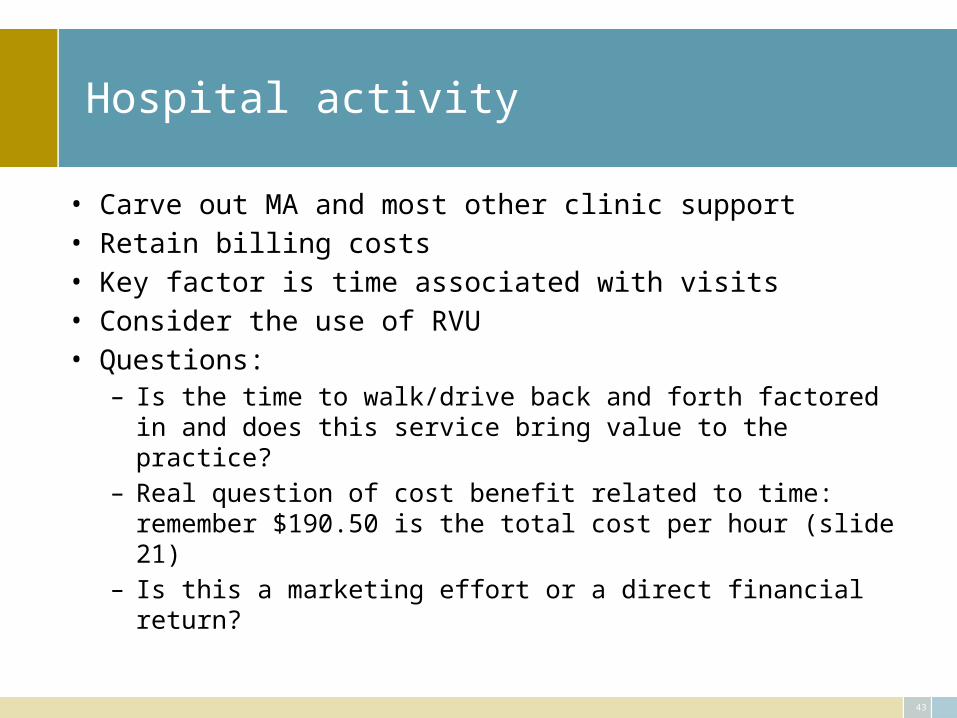
Hospital activity
• Carve out MA and most other clinic support• Retain billing costs• Key factor is time associated with visits• Consider the use of RVU• Questions:
– Is the time to walk/drive back and forth factored in and does this service bring value to the practice?
– Real question of cost benefit related to time: remember $190.50 is the total cost per hour (slide 21)
– Is this a marketing effort or a direct financial return?
44
Surgical Procedure
• Goal: Total cost of this procedure
• Number of visits– Office pre and post– Hospital
• Time in operating room• Allocation of “overhead”
• Awareness of options related to “total costs”, e.g., ambulatory center vs. hospital and the fact of who controls the decision
• Protocol for global treatment plan = national standards or group standards?• Therapy – in office, separate cost vs. total cost
45
Program for cost management
• Understand costs – create a culture of monitoring cost• Establish cost reduction/control goals• Benchmark• Utilize data available internally as well• Identify drivers of costs• Drill down into the processes• Insure that cost reduction/control goals are consistent with the
overall vision and organizational goals
46
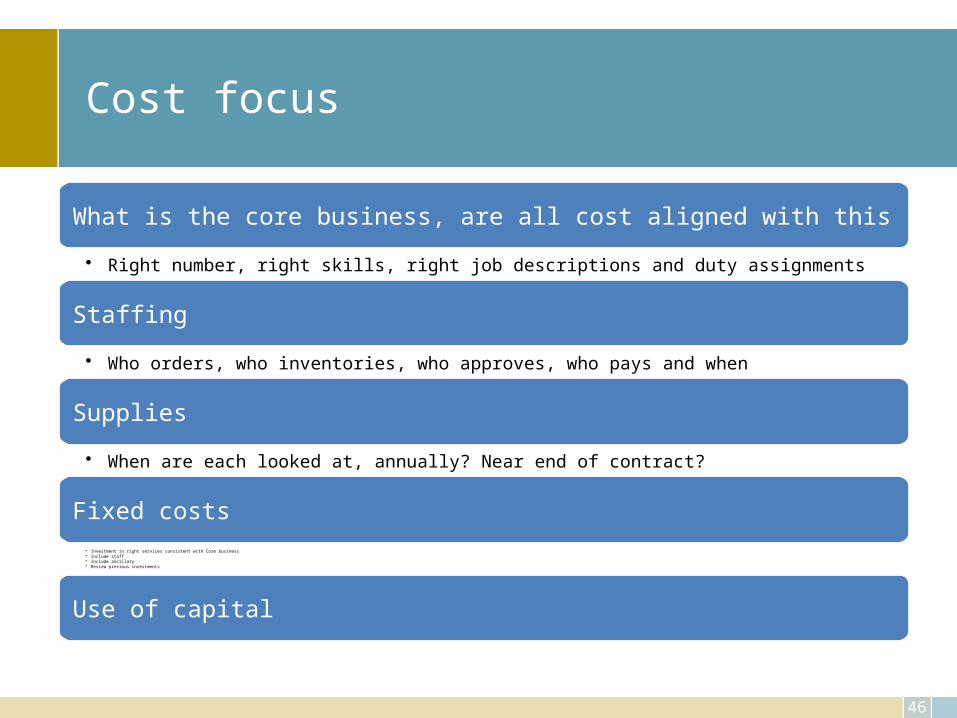
Cost focus
What is the core business, are all cost aligned with this
• Right number, right skills, right job descriptions and duty assignments
Staffing
• Who orders, who inventories, who approves, who pays and when
Supplies
• When are each looked at, annually? Near end of contract?
Fixed costs• Investment in right services consistent with Core business • Include staff• Include ancillary• Review previous investments
Use of capital
47
Future revenue
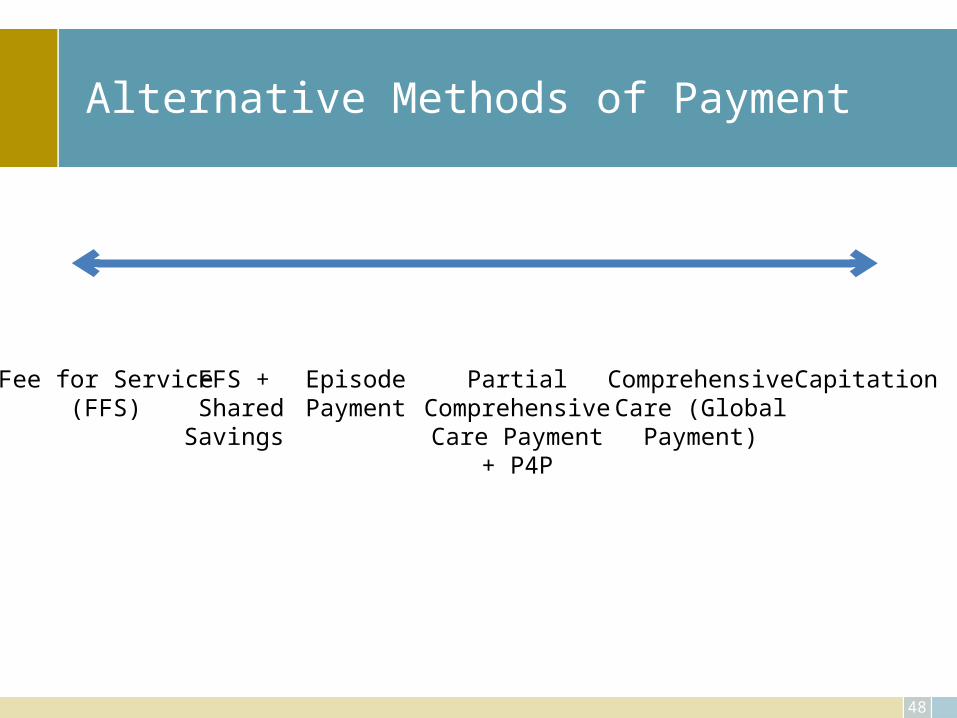
Alternative Methods of Payment
48
Fee for Service(FFS)
FFS + SharedSavings
EpisodePayment
PartialComprehensiveCare Payment
+ P4P
ComprehensiveCare (Global
Payment)
Capitation
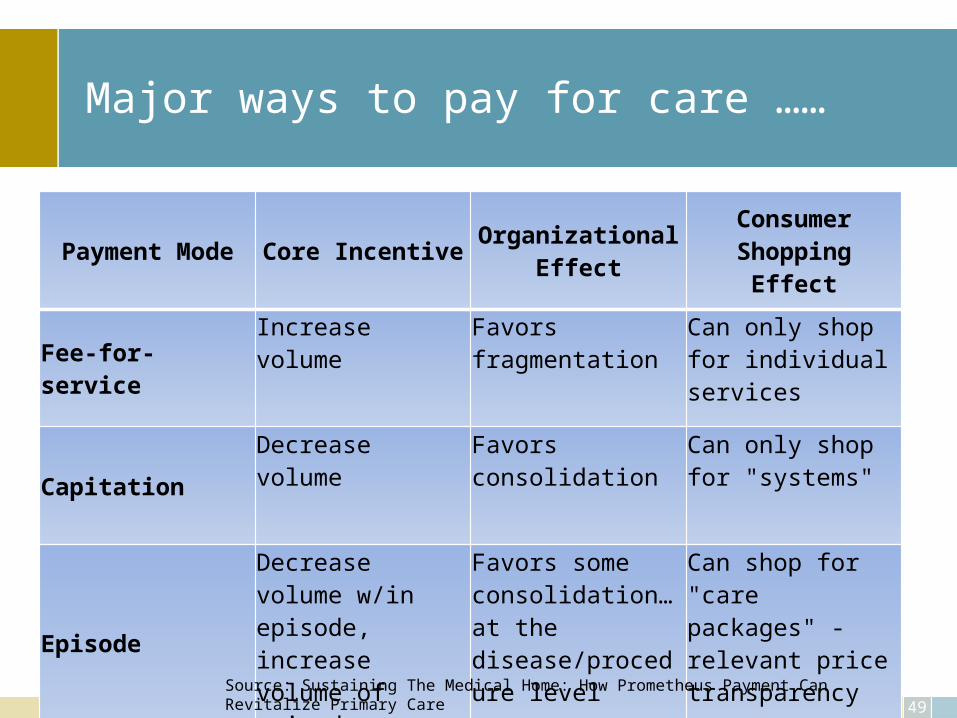
Major ways to pay for care ……
Payment Mode Core Incentive Organizational Effect Consumer Shopping Effect
Fee-for-service
Increase volume Favors fragmentation Can only shop for individual services
Capitation
Decrease volume Favors consolidation Can only shop for "systems"
Episode
Decrease volume w/in episode, increase volume of episodes
Favors some consolidation…at the disease/procedure level
Can shop for "care packages" - relevant price transparency
49Source: Sustaining The Medical Home: How Prometheus Payment Can Revitalize Primary Care
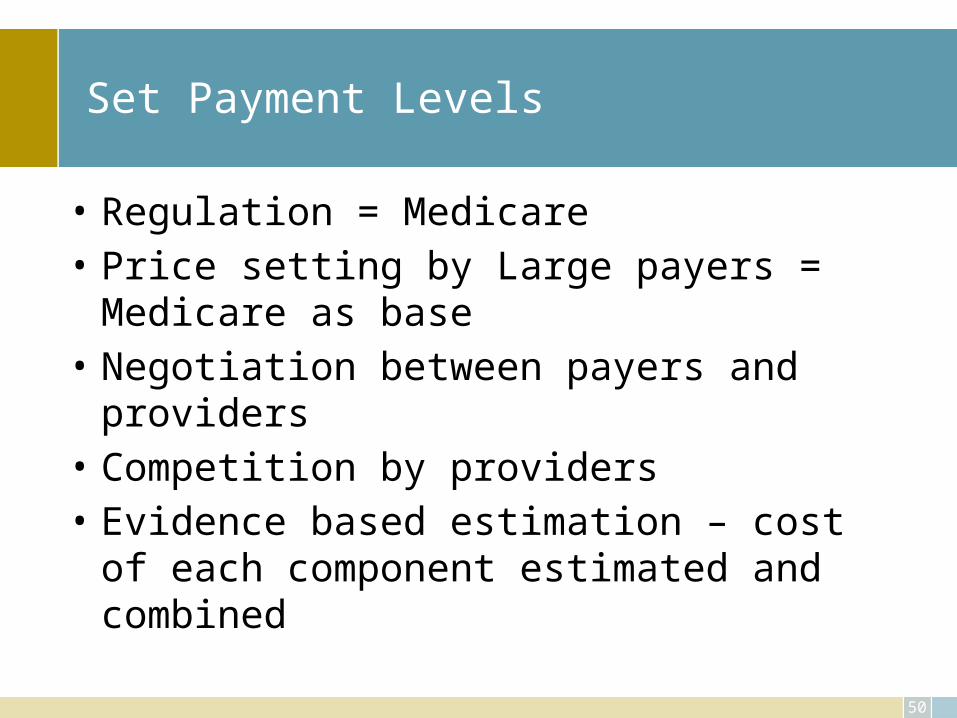
Set Payment Levels
• Regulation = Medicare• Price setting by Large payers = Medicare as base• Negotiation between payers and providers• Competition by providers• Evidence based estimation – cost of each
component estimated and combined
50
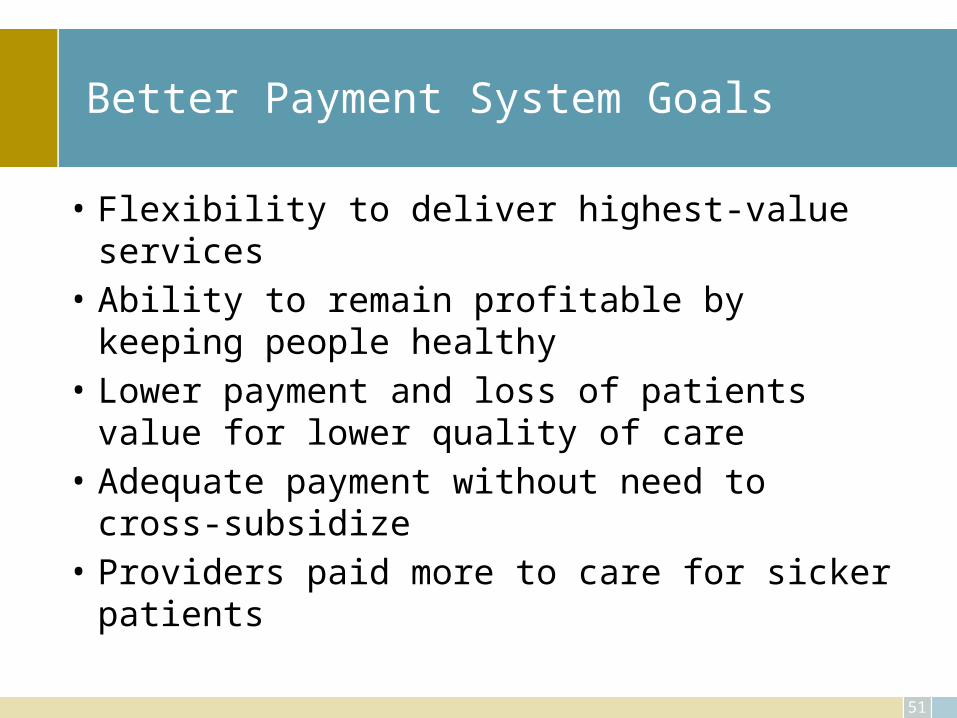
Better Payment System Goals
• Flexibility to deliver highest-value services• Ability to remain profitable by keeping people
healthy• Lower payment and loss of patients value for lower
quality of care• Adequate payment without need to cross-subsidize• Providers paid more to care for sicker patients
51
52
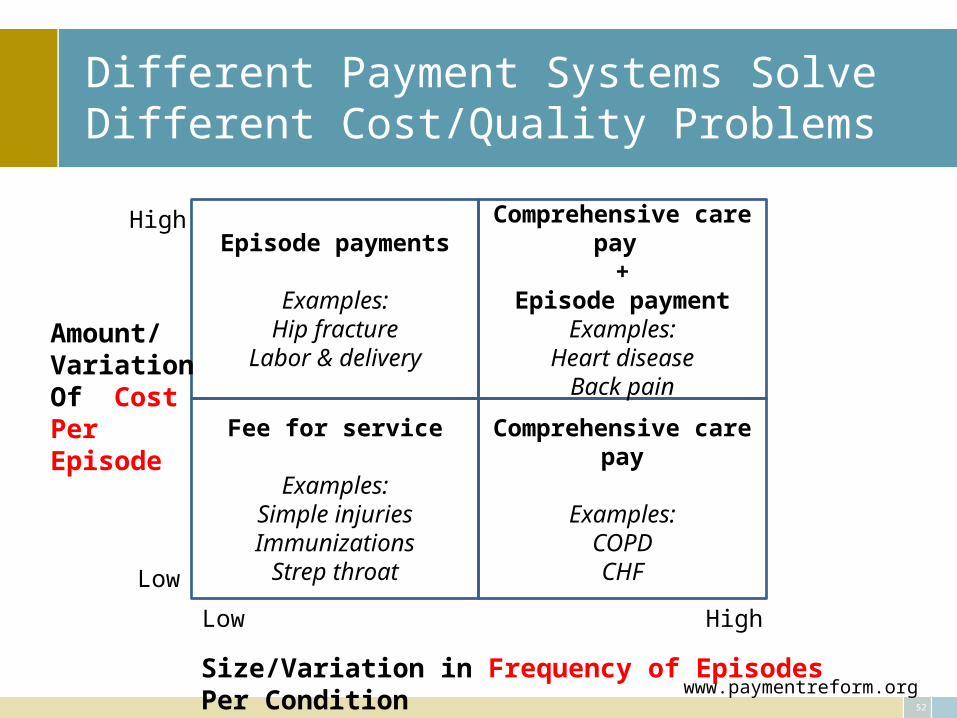
Different Payment Systems Solve Different Cost/Quality Problems
Episode payments
Examples:Hip fracture
Labor & delivery
Comprehensive care pay
Examples:COPDCHF
Comprehensive care pay
+Episode payment
Examples:Heart disease
Back pain
Fee for service
Examples:Simple injuriesImmunizations
Strep throat
High
High
Low
Low
Size/Variation in Frequency of Episodes Per Condition
Amount/VariationOf CostPerEpisode
www.paymentreform.org
53
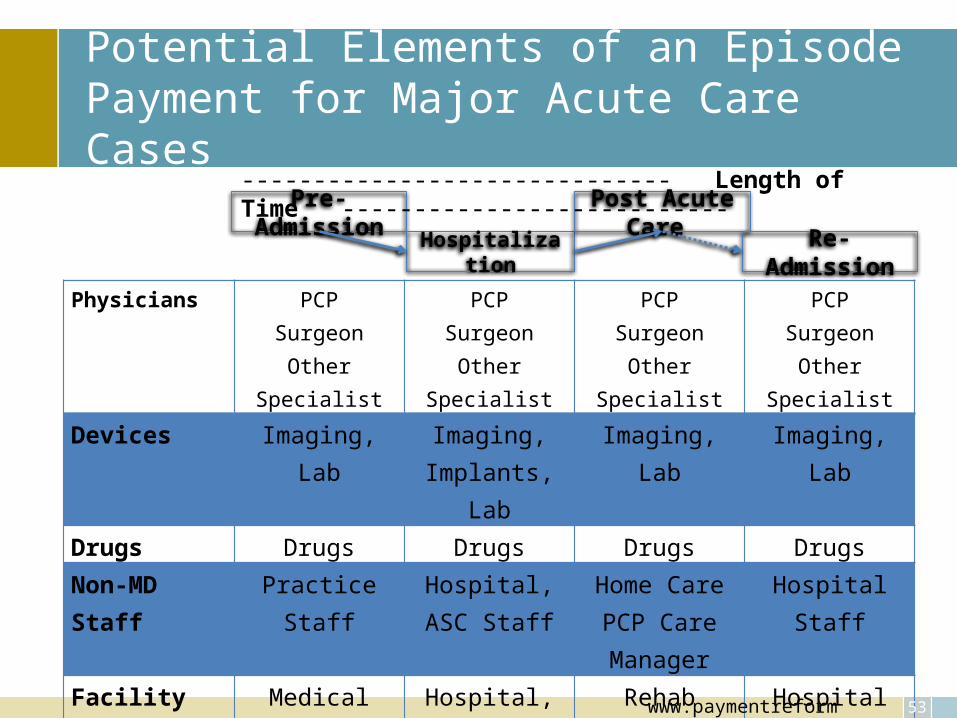
Potential Elements of an Episode Payment for Major Acute Care Cases
Physicians PCPSurgeon
Other Specialist
PCPSurgeon
Other Specialist
PCPSurgeon
Other Specialist
PCPSurgeon
Other Specialist
Devices Imaging, Lab Imaging, Implants, Lab
Imaging, Lab Imaging, Lab
Drugs Drugs Drugs Drugs DrugsNon-MD Staff Practice Staff Hospital, ASC
StaffHome CarePCP Care Manager
Hospital Staff
Facility Medical Office Hospital, ACE Rehab FacilityLong term
Care
Hospital
Pre-Admission
Hospitalization
Post Acute Care
Re-Admission
------------------------------ Length of Time ---------------------------
www.paymentreform.org
54
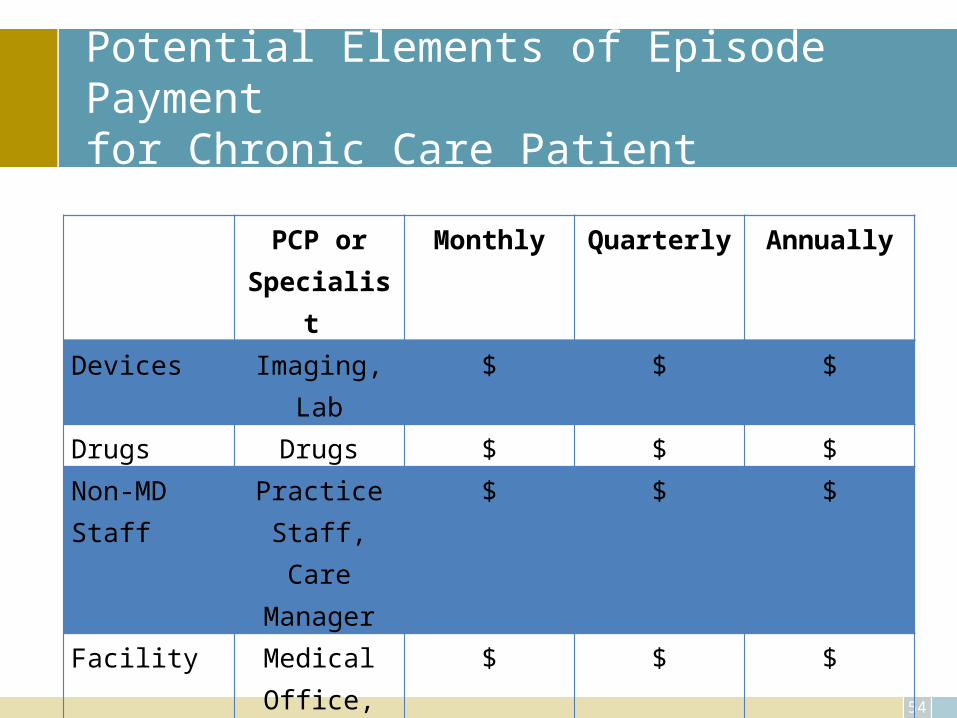
Potential Elements of Episode Payment for Chronic Care Patient
PCP or Specialist
Monthly Quarterly Annually
Devices Imaging, Lab $ $ $
Drugs Drugs $ $ $
Non-MD Staff
Practice Staff, Care Manager
$ $ $
Facility Medical Office,
Hospital, Long Term
Care
$ $ $
55
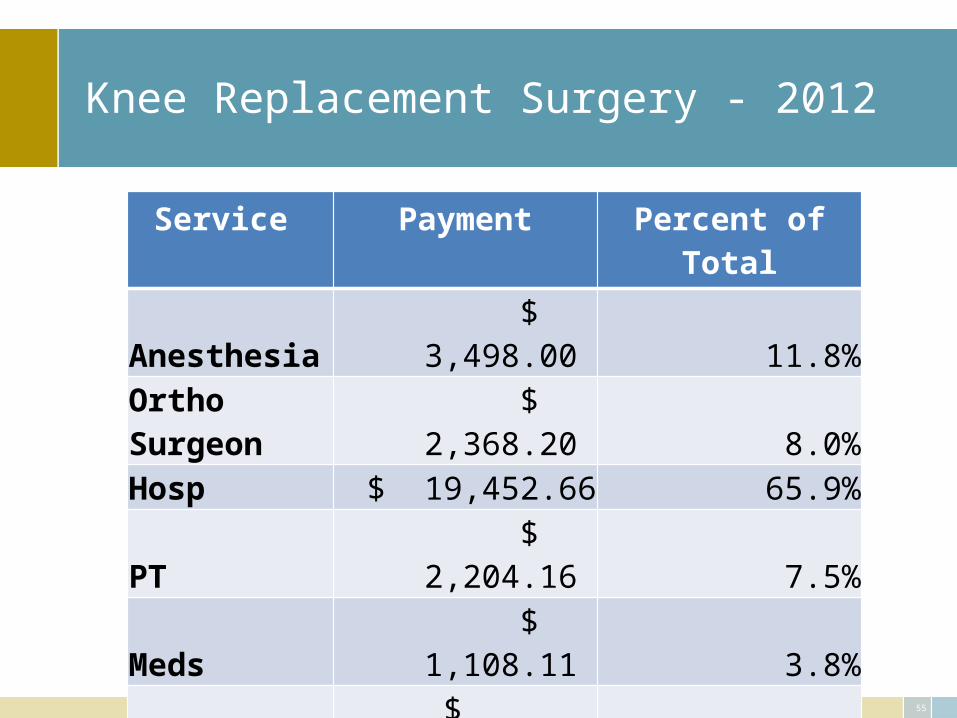
Knee Replacement Surgery - 2012
Service Payment Percent of TotalAnesthesia $ 3,498.00 11.8%Ortho Surgeon $ 2,368.20 8.0%Hosp $ 19,452.66 65.9%PT $ 2,204.16 7.5%Meds $ 1,108.11 3.8%Ortho $ 243.15 0.8%PCP $ 165.48 0.6%X-ray $ 34.50 0.1%Lab $ 464.51 1.6%Total $ 29,538.77 100.0%
56
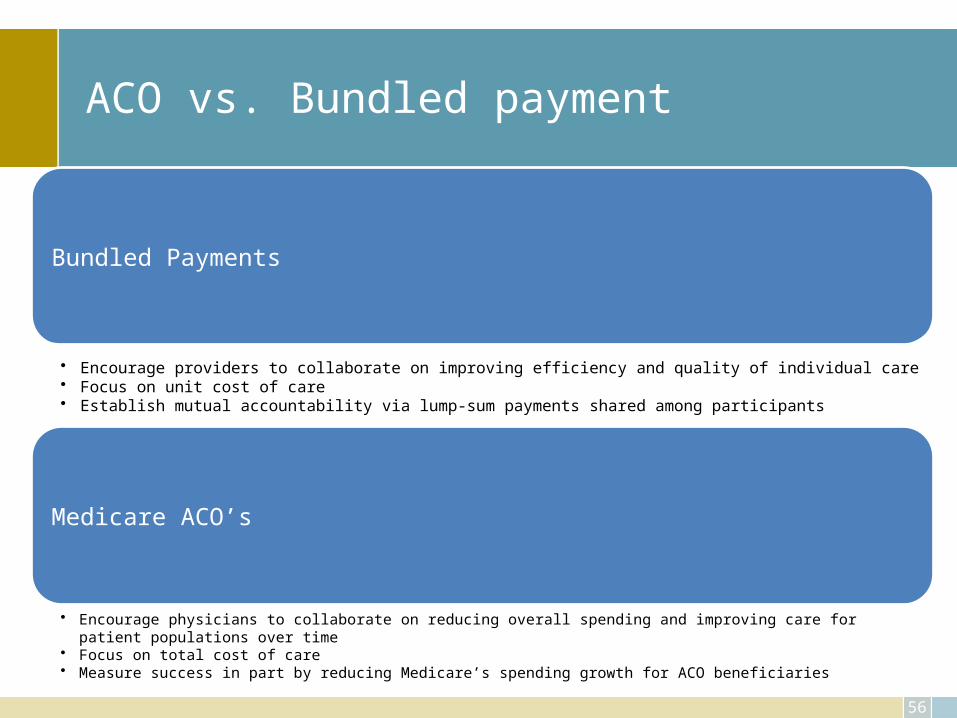
ACO vs. Bundled payment
Bundled Payments
• Encourage providers to collaborate on improving efficiency and quality of individual care• Focus on unit cost of care• Establish mutual accountability via lump-sum payments shared among participants
Medicare ACO’s
• Encourage physicians to collaborate on reducing overall spending and improving care for patient populations over time• Focus on total cost of care• Measure success in part by reducing Medicare’s spending growth for ACO beneficiaries
57
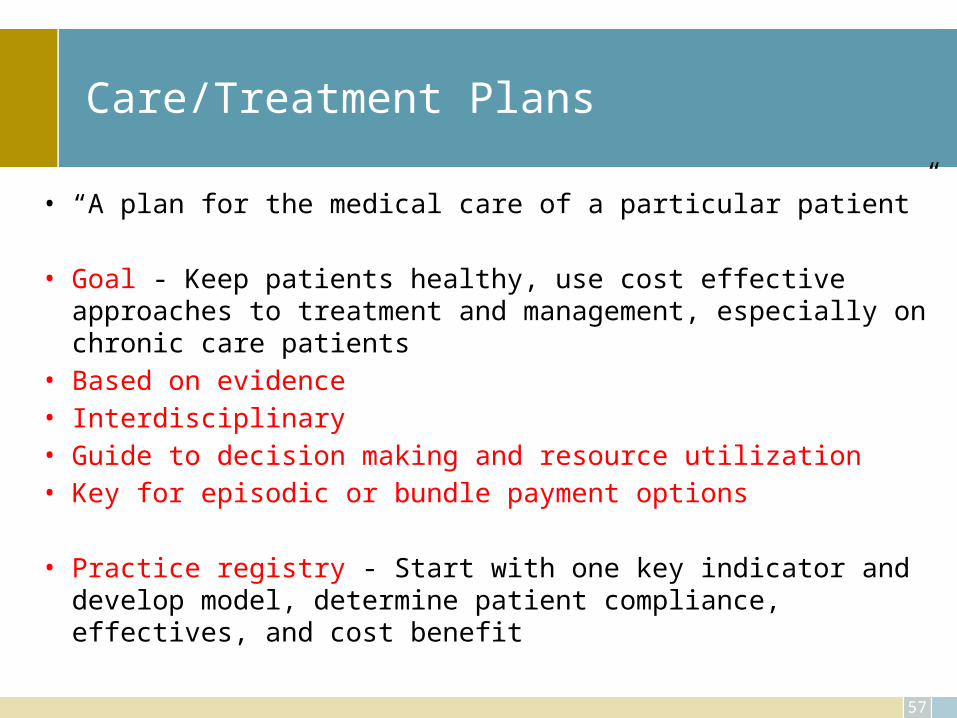
Care/Treatment Plans
• “A plan for the medical care of a particular patient”
• Goal - Keep patients healthy, use cost effective approaches to treatment and management, especially on chronic care patients
• Based on evidence• Interdisciplinary • Guide to decision making and resource utilization• Key for episodic or bundle payment options
• Practice registry - Start with one key indicator and develop model, determine patient compliance, effectives, and cost benefit
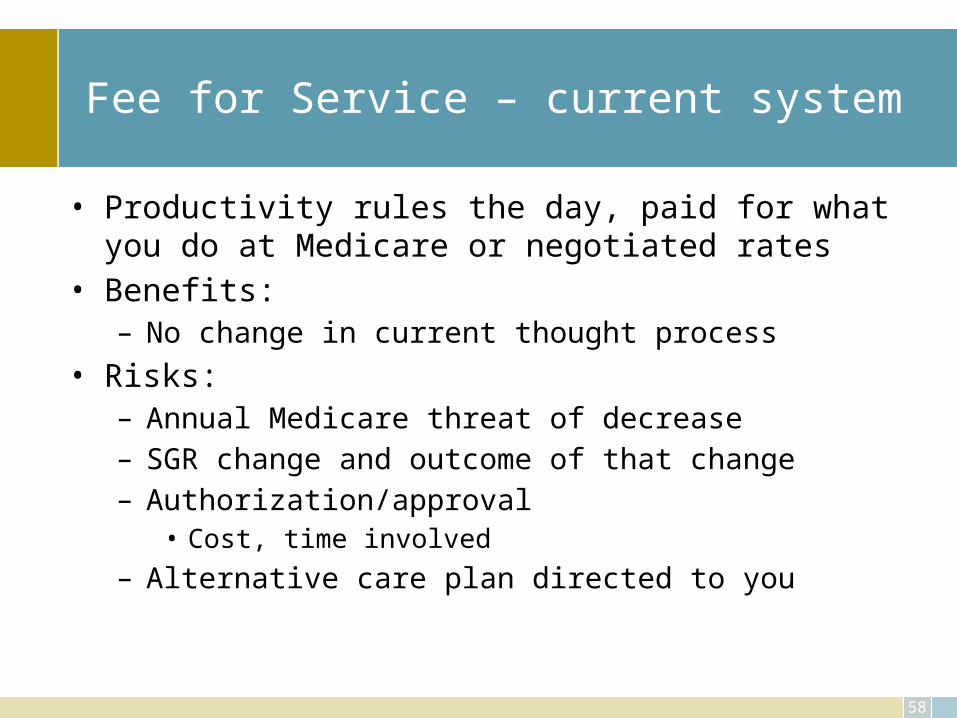
Fee for Service – current system
• Productivity rules the day, paid for what you do at Medicare or negotiated rates
• Benefits:– No change in current thought process
• Risks:– Annual Medicare threat of decrease– SGR change and outcome of that change– Authorization/approval
• Cost, time involved– Alternative care plan directed to you
58
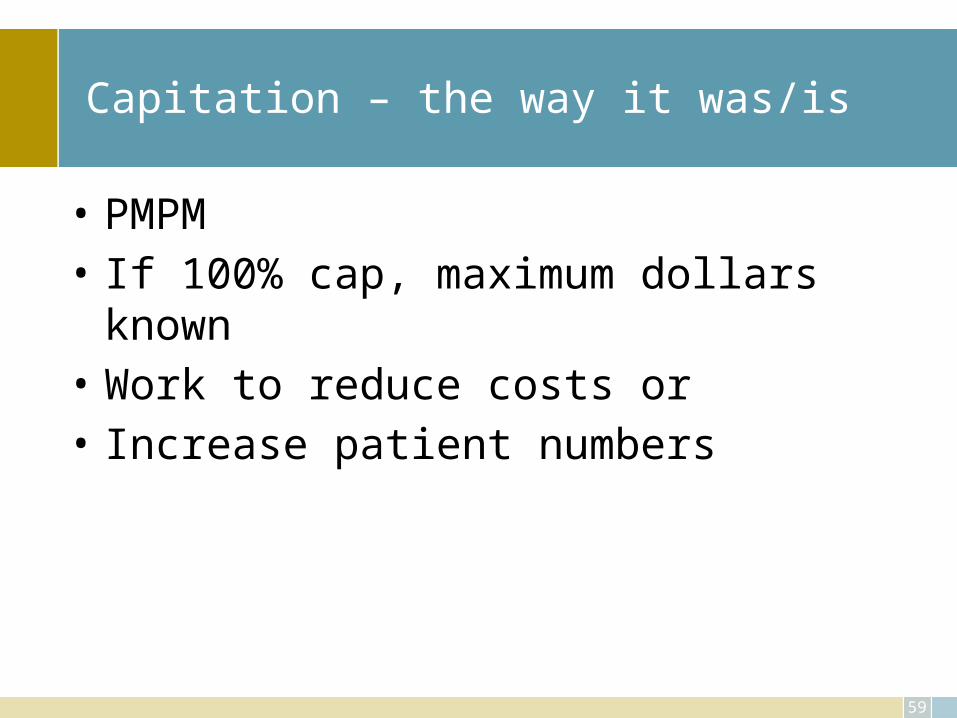
Capitation – the way it was/is
• PMPM• If 100% cap, maximum dollars known• Work to reduce costs or• Increase patient numbers
59
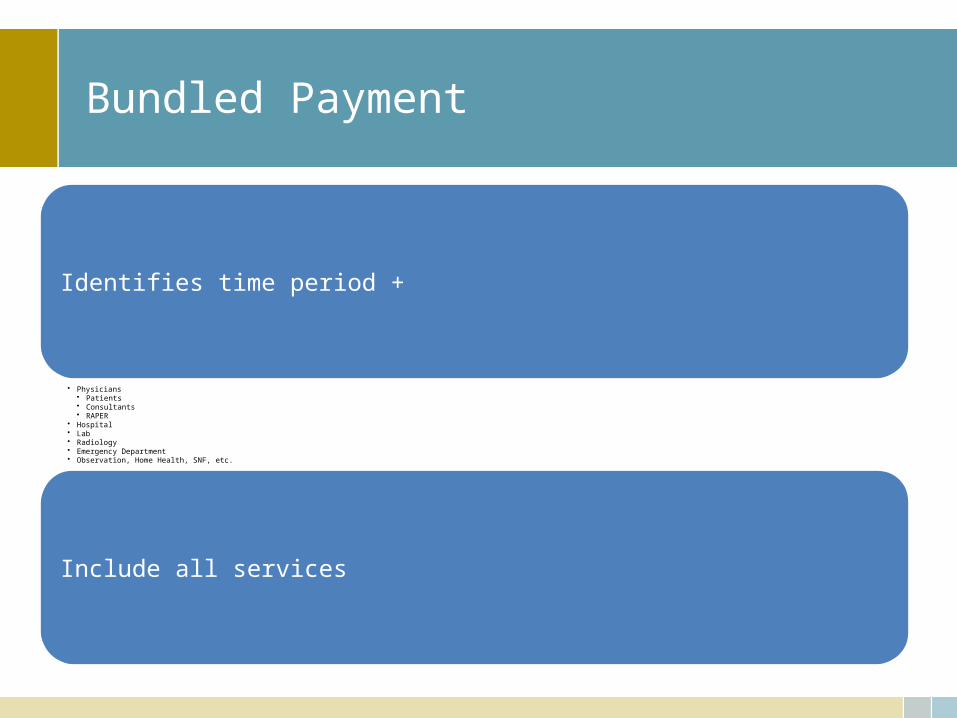
Bundled Payment
Identifies time period +
• Physicians• Patients • Consultants• RAPER
• Hospital• Lab• Radiology• Emergency Department• Observation, Home Health, SNF, etc.
Include all services
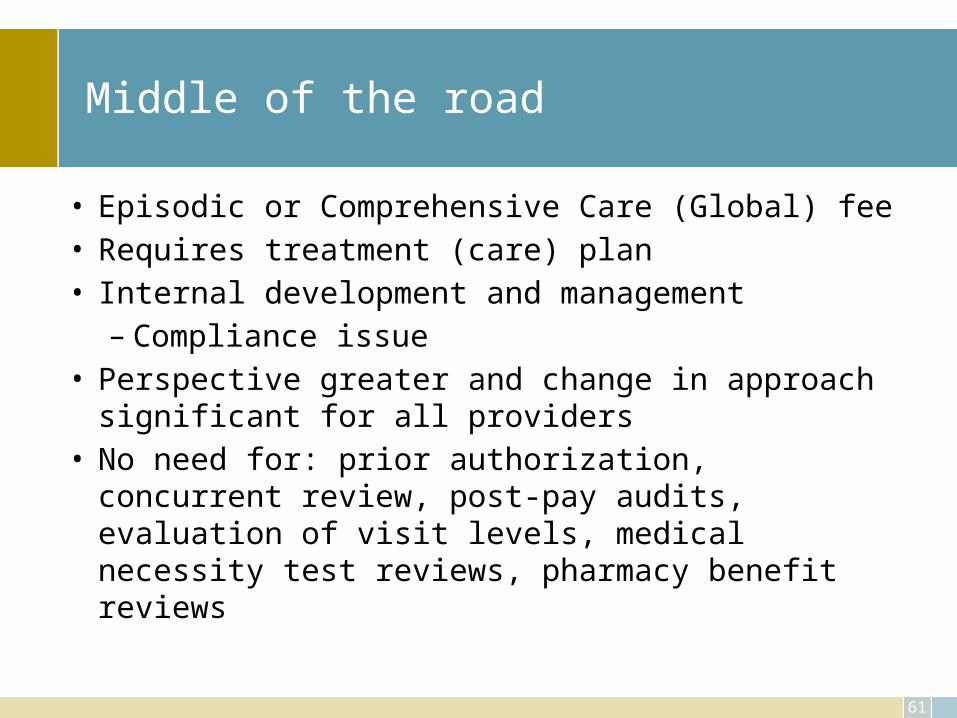
Middle of the road
• Episodic or Comprehensive Care (Global) fee• Requires treatment (care) plan• Internal development and management
– Compliance issue• Perspective greater and change in approach significant for
all providers• No need for: prior authorization, concurrent review, post-
pay audits, evaluation of visit levels, medical necessity test reviews, pharmacy benefit reviews
61
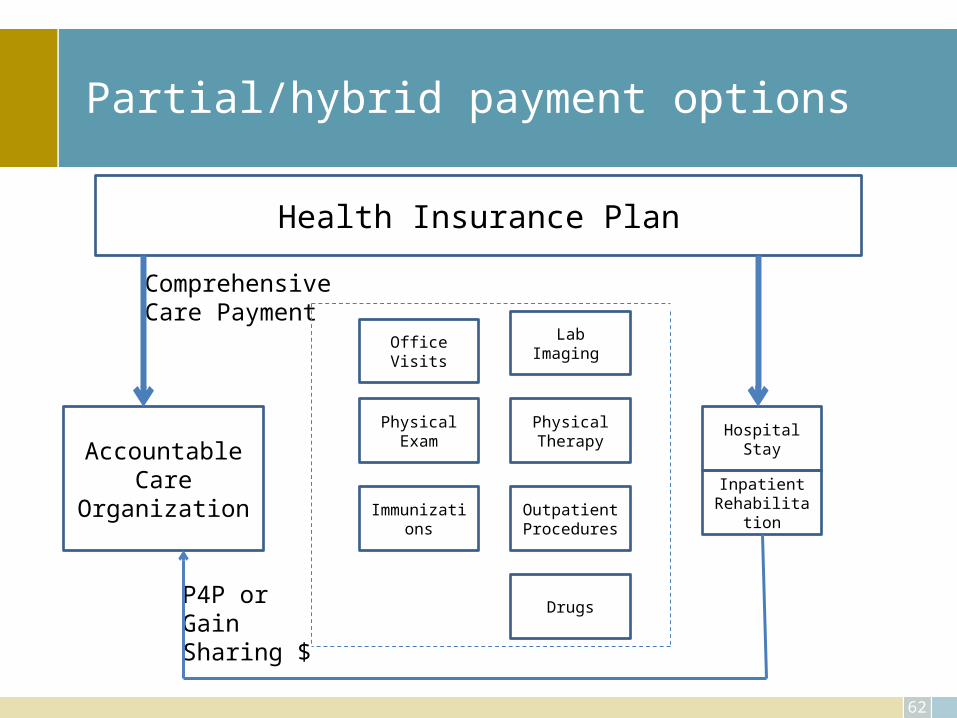
Partial/hybrid payment options
62
Health Insurance Plan
AccountableCare
Organization
OfficeVisits
PhysicalExam
Immunizations
Drugs
OutpatientProcedures
PhysicalTherapy
HospitalStay
LabImaging
InpatientRehabilitation
P4P orGain Sharing $
ComprehensiveCare Payment
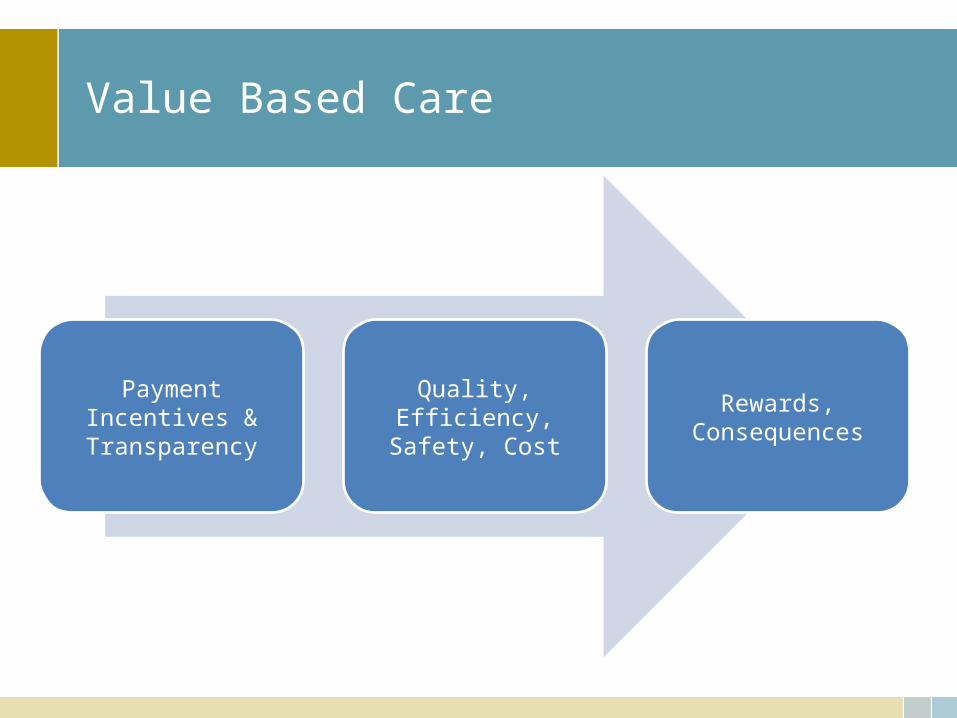
Value Based Care
Payment Incentives & Transparency
Quality, Efficiency, Safety, Cost
Rewards, Consequences
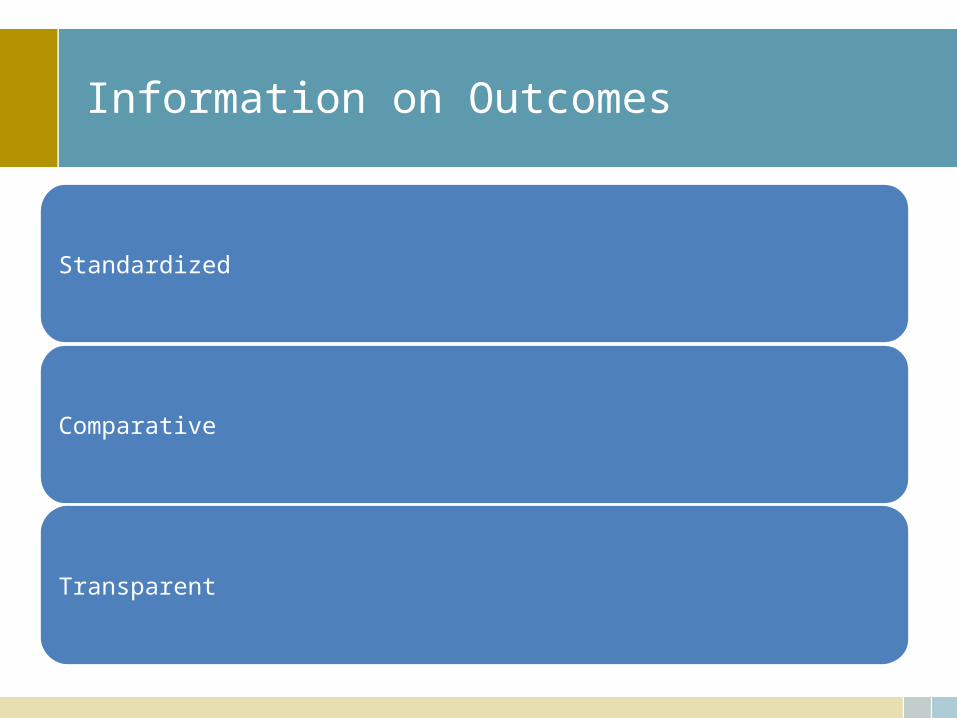
Information on Outcomes
Standardized
Comparative
Transparent
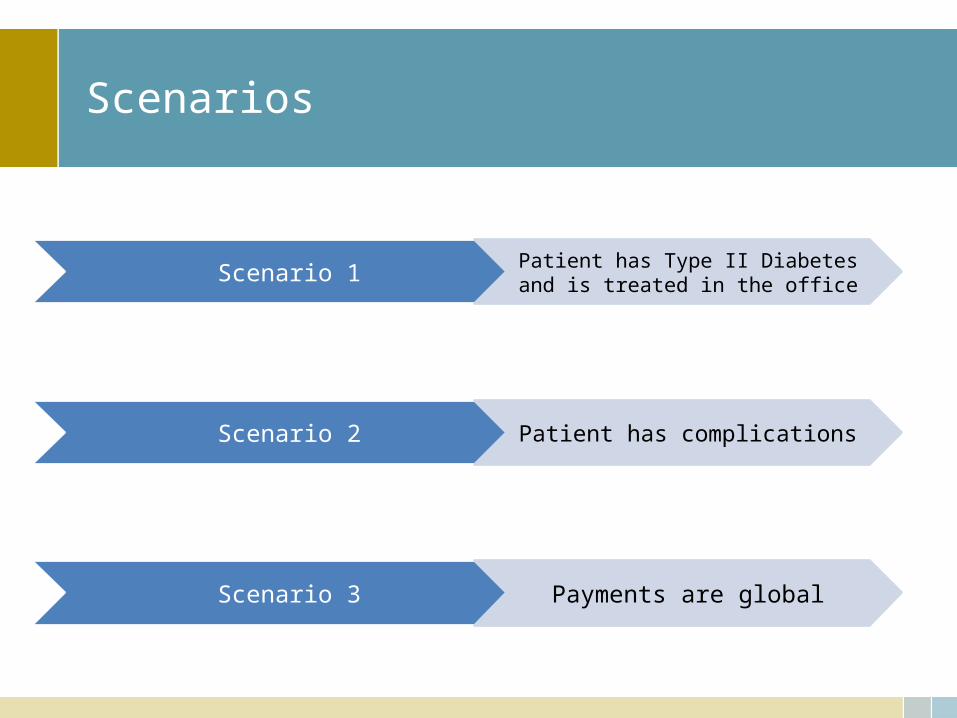
Scenarios
Scenario 1 Patient has Type II Diabetes and is treated in the office
Scenario 2 Patient has complications
Scenario 3 Payments are global
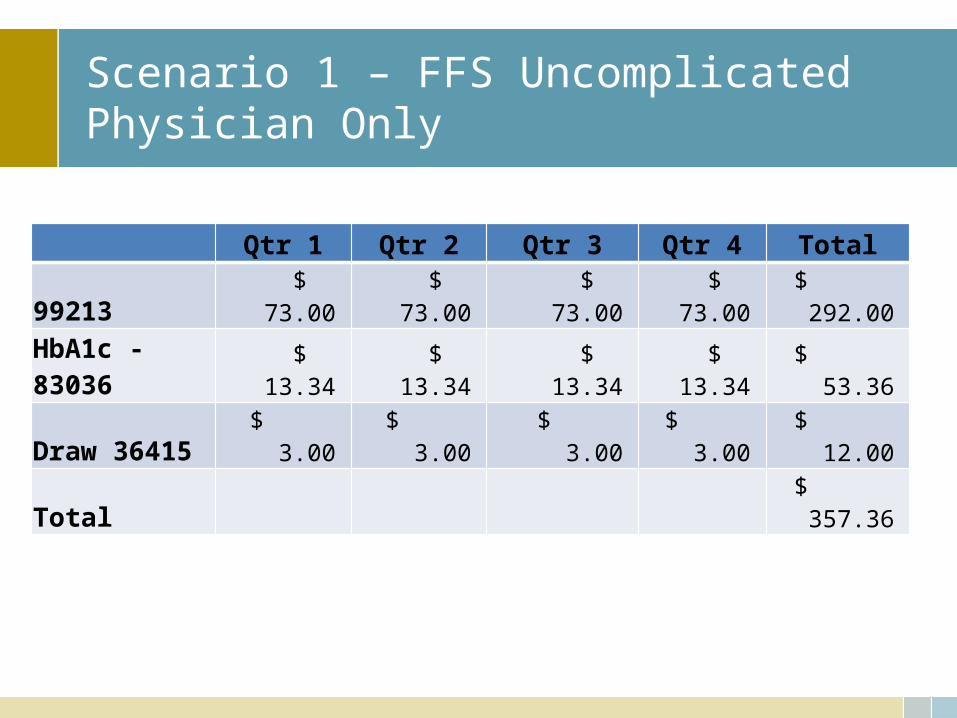
Scenario 1 – FFS UncomplicatedPhysician Only
Qtr 1 Qtr 2 Qtr 3 Qtr 4 Total99213 $ 73.00 $ 73.00 $ 73.00 $ 73.00 $ 292.00
HbA1c - 83036 $ 13.34 $ 13.34 $ 13.34 $ 13.34 $ 53.36
Draw 36415 $ 3.00 $ 3.00 $ 3.00 $ 3.00 $ 12.00
Total $ 357.36
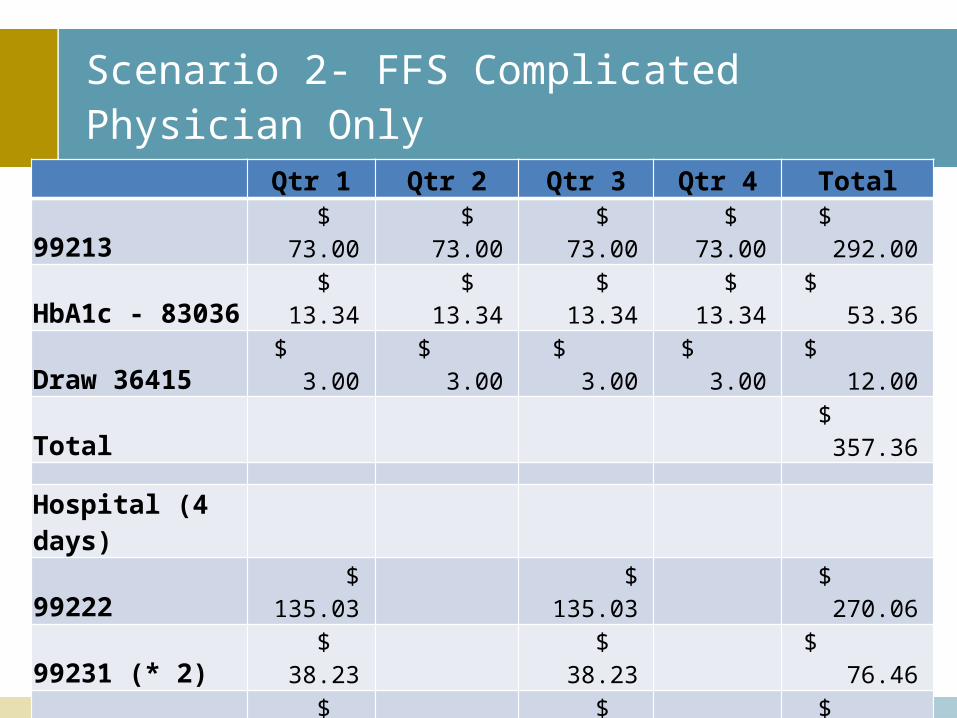
Scenario 2- FFS ComplicatedPhysician Only
Qtr 1 Qtr 2 Qtr 3 Qtr 4 Total99213 $ 73.00 $ 73.00 $ 73.00 $ 73.00 $ 292.00
HbA1c - 83036 $ 13.34 $ 13.34 $ 13.34 $ 13.34 $ 53.36
Draw 36415 $ 3.00 $ 3.00 $ 3.00 $ 3.00 $ 12.00
Total $ 357.36
Hospital (4 days)99222 $ 135.03 $ 135.03 $ 270.06
99231 (* 2) $ 38.23 $ 38.23 $ 76.46
99238 $ 71.03 $ 71.03 $ 142.06
Four day stay $ 282.52 $ 282.52 $ 565.04
Total $ 526.81 $ 526.81 $ 1,053.62
Emergency 99283 $ 60.05 $ 60.05 $ 60.05 $ 60.05 $ 240.20
Total $ 1,651.18
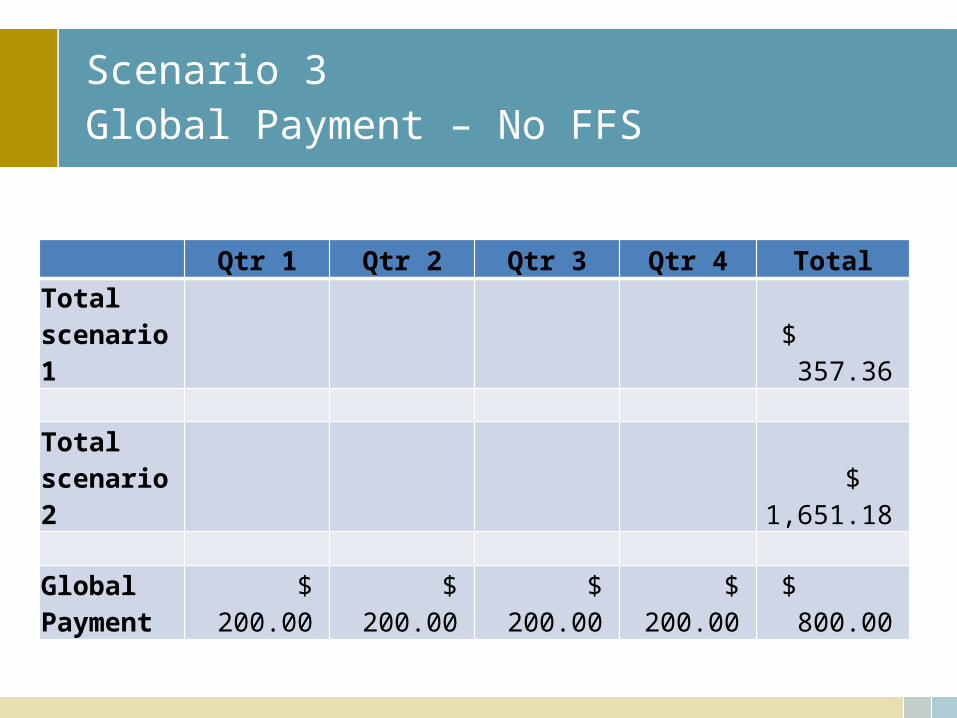
Scenario 3Global Payment – No FFS
Qtr 1 Qtr 2 Qtr 3 Qtr 4 TotalTotal scenario 1 $ 357.36
Total scenario 2 $ 1,651.18
Global Payment $ 200.00 $ 200.00 $ 200.00 $ 200.00 $ 800.00
Approach to future
• Patient involvement • Access, quality, cost control• Mission
– Safe, affordable, effective, patient centered, evidence based care
• Not mission– Duplicate care, treatments, eliminate overuse, misuse
of treatment options• Baseline – diabetes, heart: CAD, CHF, failure, COPD,
hypertension, prevention69
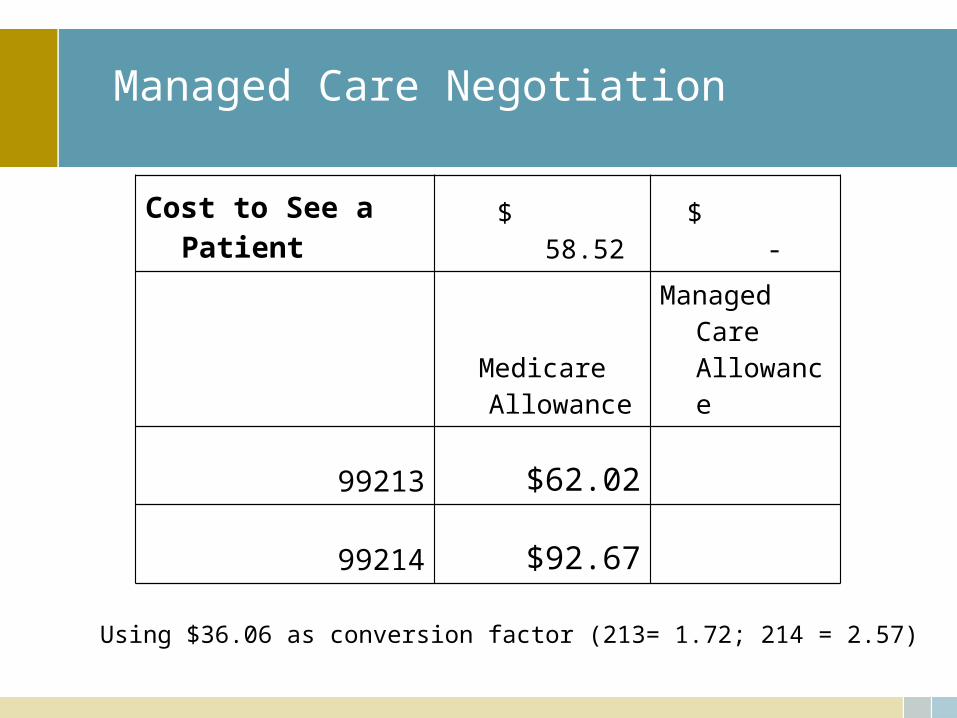
Managed Care Negotiation
Cost to See a Patient $ 58.52 $ -
Medicare Allowance
Managed Care Allowance
99213 $62.02
99214 $92.67
70
Using $36.06 as conversion factor (213= 1.72; 214 = 2.57)
71
Managed Care Contract Issues
• Agreement between MCO and physician• Governs the terms of treatment and payment• Specifies the method of claims submission and how they
are paid• Restricts the physicians ability to collect fees from patients• Limits the physicians ability to provide certain types of
treatment
72
Managed Care Contract Issues, cont.
• Provides procedures for dispute resolution between physician and MCO
• Places certain requirements on physicians to be able to maintain contract
• Requires physician to continue to treat patient even after contract is over
• Restricts when the contract can be terminated• Limits physicians claims against MCO

73
Budget
Budget Process
• Plan - Goals and objectives, new programs, etc.
• Budget - Financial picture – usually 12 months
• Forecast - Revise budget throughout year, quarterly
• Perform - Implement activities to achieve goals, application and use of resources
• Report - Monthly financial picture
• Intervene - Revise forecast/budget OR approach to issues – to gain control of issues and compliance with “budget”
Factors to consider in budget
• Uncertainty and volatility of the market
• Key drivers – metrics
• Trend analysis
• Gaps – business as unusual
• Forecast
• Decision support
76
Uncertainty/risk/probability
• Uncertain – indefinite, not known beyond doubt, not clearly identified or defined
• Risk – possibility of loss or injury, the chance that an (investment …) will lose value
• Probability – the ratio of the number of outcomes in an exhaustive set of equally likely outcomes that produce a given event to the total number of possible outcomes
• For example:– Weather today – 60% chance of rain (probability), should you have the
company picnic (uncertain), if not what will the cost be to re-schedule and the loss of the food, etc. already ordered?
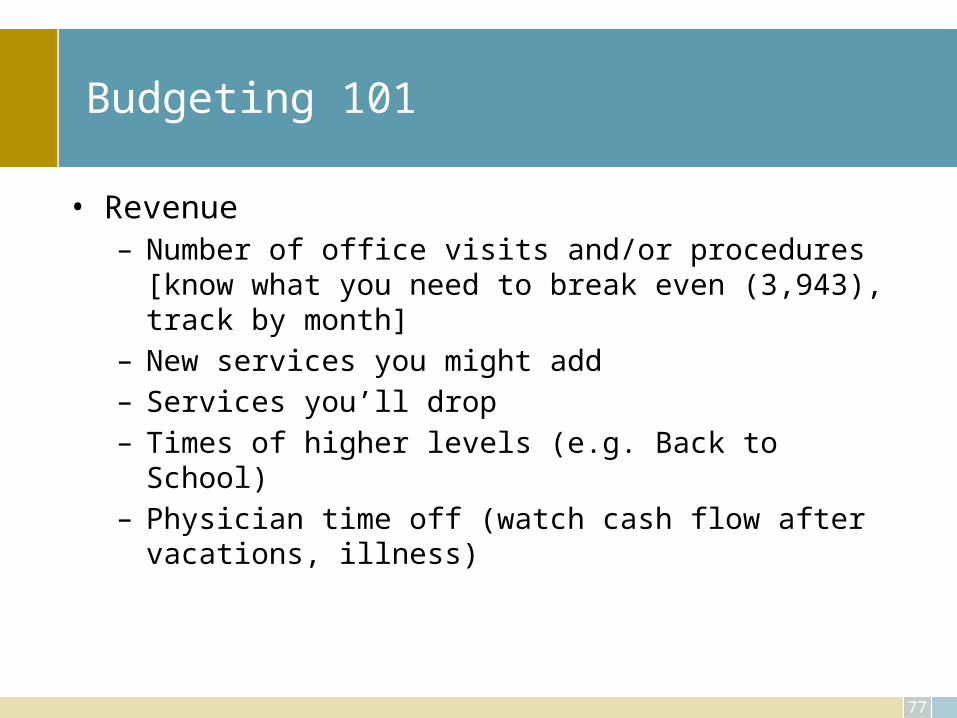
Budgeting 101
• Revenue– Number of office visits and/or procedures [know what you need to
break even (3,943), track by month]– New services you might add– Services you’ll drop– Times of higher levels (e.g. Back to School)– Physician time off (watch cash flow after vacations, illness)
77
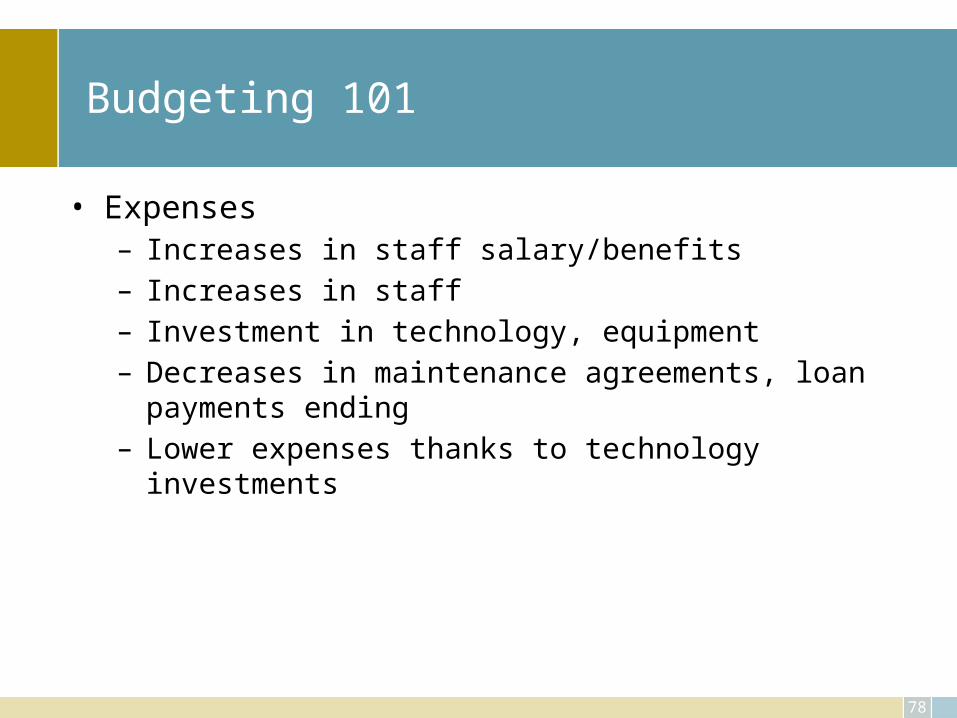
Budgeting 101
• Expenses– Increases in staff salary/benefits– Increases in staff– Investment in technology, equipment– Decreases in maintenance agreements, loan payments ending– Lower expenses thanks to technology investments
78
Budgeting 101
• Develop annually• Review monthly• Dig to understand variances. Not all savings are
good.
79
80
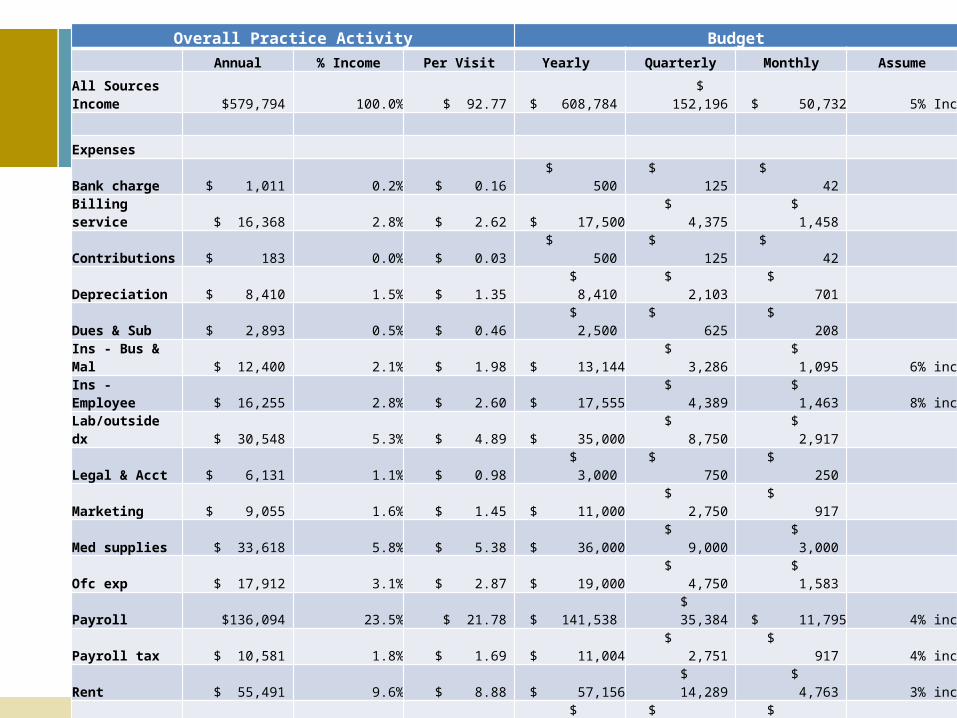
Overall Practice Activity Budget
Annual % Income Per Visit Yearly Quarterly Monthly Assume
All Sources Income $579,794 100.0% $ 92.77 $ 608,784 $ 152,196 $ 50,732 5% Inc
Expenses
Bank charge $ 1,011 0.2% $ 0.16 $ 500 $ 125 $ 42
Billing service $ 16,368 2.8% $ 2.62 $ 17,500 $ 4,375 $ 1,458
Contributions $ 183 0.0% $ 0.03 $ 500 $ 125 $ 42
Depreciation $ 8,410 1.5% $ 1.35 $ 8,410 $ 2,103 $ 701
Dues & Sub $ 2,893 0.5% $ 0.46 $ 2,500 $ 625 $ 208
Ins - Bus & Mal $ 12,400 2.1% $ 1.98 $ 13,144 $ 3,286 $ 1,095 6% inc
Ins - Employee $ 16,255 2.8% $ 2.60 $ 17,555 $ 4,389 $ 1,463 8% inc
Lab/outside dx $ 30,548 5.3% $ 4.89 $ 35,000 $ 8,750 $ 2,917
Legal & Acct $ 6,131 1.1% $ 0.98 $ 3,000 $ 750 $ 250
Marketing $ 9,055 1.6% $ 1.45 $ 11,000 $ 2,750 $ 917
Med supplies $ 33,618 5.8% $ 5.38 $ 36,000 $ 9,000 $ 3,000
Ofc exp $ 17,912 3.1% $ 2.87 $ 19,000 $ 4,750 $ 1,583
Payroll $136,094 23.5% $ 21.78 $ 141,538 $ 35,384 $ 11,795 4% inc
Payroll tax $ 10,581 1.8% $ 1.69 $ 11,004 $ 2,751 $ 917 4% inc
Rent $ 55,491 9.6% $ 8.88 $ 57,156 $ 14,289 $ 4,763 3% inc
Rep & Maint $ 1,123 0.2% $ 0.18 $ 1,500 $ 375 $ 125
Taxes $ 1,337 0.2% $ 0.21 $ 1,500 $ 375 $ 125
Telephone $ 6,299 1.1% $ 1.01 $ 6,500 $ 1,625 $ 542
Training $ 53 0.0% $ 0.01 $ 2,500 $ 625 $ 208
Total $365,761 63.1% $ 58.52 $ 385,807 $ 96,452 $ 32,151
Net income $214,033 36.9% $ 34.25 $ 222,977 $ 55,744 $ 18,581 4.2% inc
81
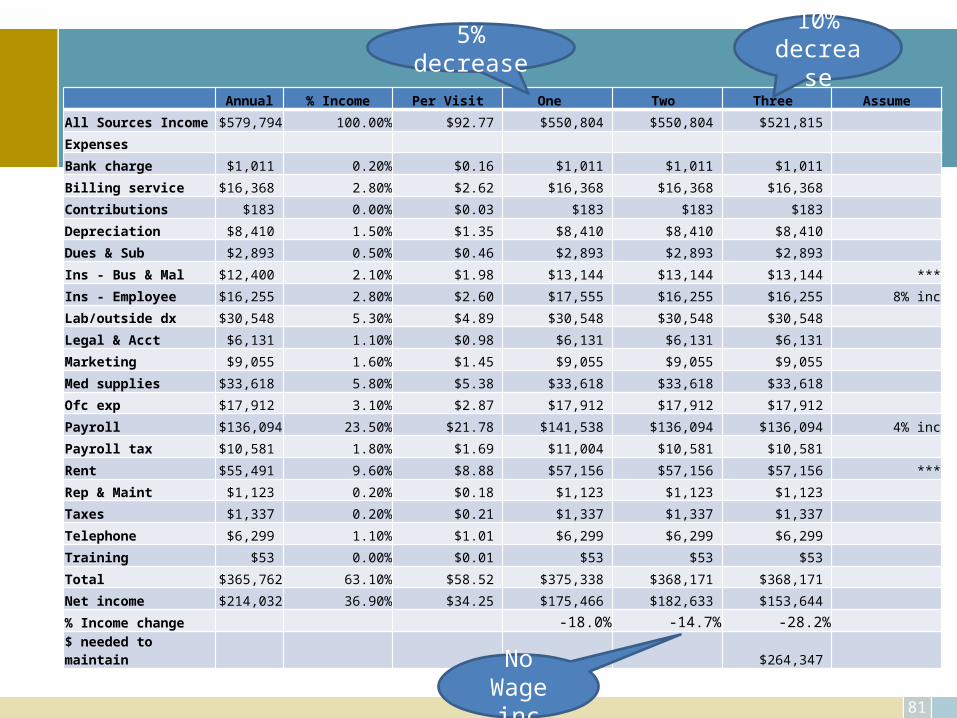
Annual % Income Per Visit One Two Three Assume
All Sources Income $579,794 100.00% $92.77 $550,804 $550,804 $521,815
Expenses
Bank charge $1,011 0.20% $0.16 $1,011 $1,011 $1,011
Billing service $16,368 2.80% $2.62 $16,368 $16,368 $16,368
Contributions $183 0.00% $0.03 $183 $183 $183
Depreciation $8,410 1.50% $1.35 $8,410 $8,410 $8,410
Dues & Sub $2,893 0.50% $0.46 $2,893 $2,893 $2,893
Ins - Bus & Mal $12,400 2.10% $1.98 $13,144 $13,144 $13,144 ***
Ins - Employee $16,255 2.80% $2.60 $17,555 $16,255 $16,255 8% inc
Lab/outside dx $30,548 5.30% $4.89 $30,548 $30,548 $30,548
Legal & Acct $6,131 1.10% $0.98 $6,131 $6,131 $6,131
Marketing $9,055 1.60% $1.45 $9,055 $9,055 $9,055
Med supplies $33,618 5.80% $5.38 $33,618 $33,618 $33,618
Ofc exp $17,912 3.10% $2.87 $17,912 $17,912 $17,912
Payroll $136,094 23.50% $21.78 $141,538 $136,094 $136,094 4% inc
Payroll tax $10,581 1.80% $1.69 $11,004 $10,581 $10,581
Rent $55,491 9.60% $8.88 $57,156 $57,156 $57,156 ***
Rep & Maint $1,123 0.20% $0.18 $1,123 $1,123 $1,123
Taxes $1,337 0.20% $0.21 $1,337 $1,337 $1,337
Telephone $6,299 1.10% $1.01 $6,299 $6,299 $6,299
Training $53 0.00% $0.01 $53 $53 $53
Total $365,762 63.10% $58.52 $375,338 $368,171 $368,171
Net income $214,032 36.90% $34.25 $175,466 $182,633 $153,644
% Income change -18.0% -14.7% -28.2%
$ needed to maintain $264,347
NoWage inc
5% decrease 10% decrease
82
Managing the revenue cycle
83
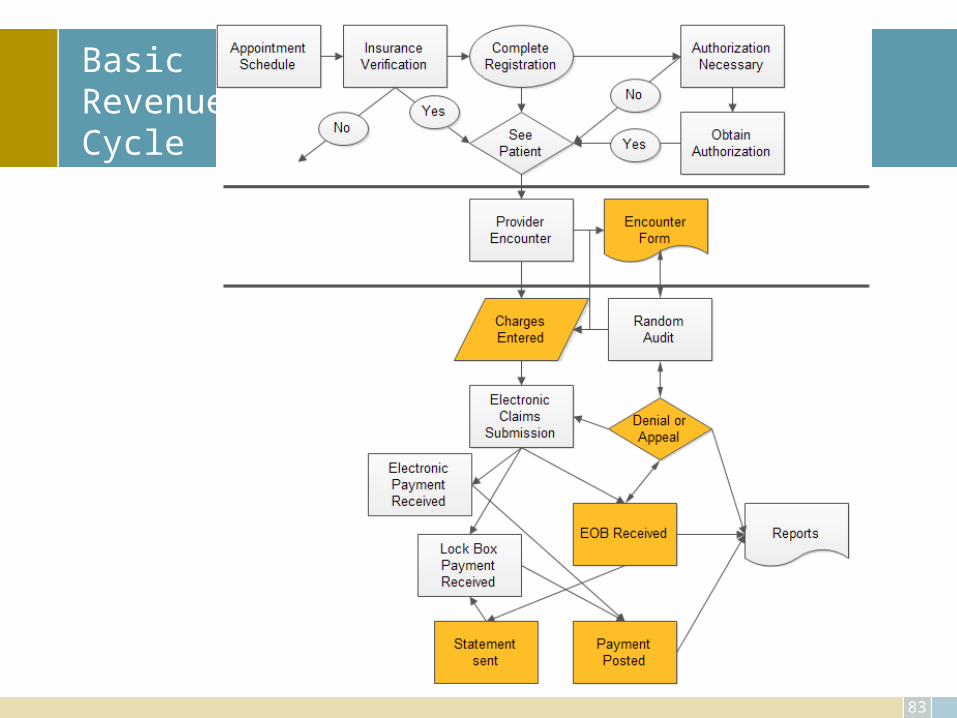
Basic Revenue Cycle
84
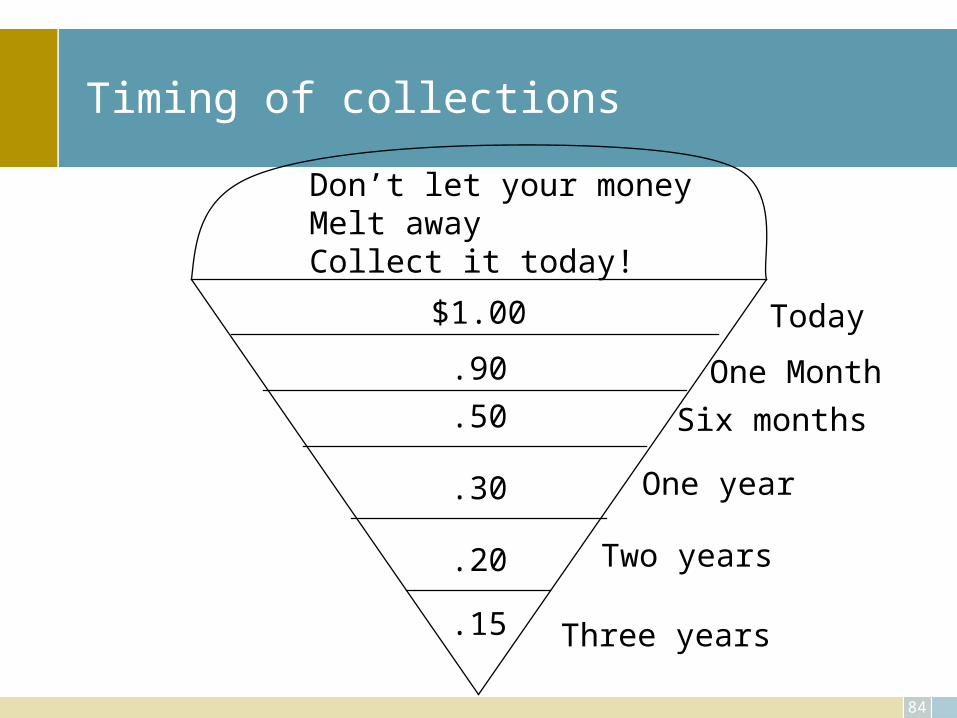
Timing of collections
$1.00
.90
.50
.30
.20
.15
Don’t let your moneyMelt awayCollect it today!
Today
One Month
Six months
One year
Two years
Three years
Pre-visit
• Schedule appointment!• Established financial policy• When do you get what information?
– New patient coordinator– Demographic, insurance and medical
• Verification (eligibility – which term?) of coverage– At every visit– Payment assurance process
• Reminder call with appointment time, location AND notice of co-pay and balance due
Time of Visit
• Define activity at the time of the patient visit– Payments will be made prior to or after the visit with
the physician? – Will you collect old balances in full or partially?– Consider “social norm” approach rather than
threaten– Physicians (all providers) should NOT become
involved with any discussion on payments, this is covered in the collection policy
87
Payments . . . TOV
• Super bill must be complete– Continuous number– Missing ticket report
• Must know deductibles and/or co-pay• Must know extent of coverage allowed• Must know procedure(s) done, e.g., down payment
required• Time of entry• Deposit ticket – shared duties
88
Deductible and co-pay changes beginning of each year
• Medicare Part B Deductible increases annually• Medicare traditional vs. Medicare Advantage Plans• Review contracts and ANY Letters received from payers,
check their web sites– Payer– Employer
Financial Policy
• A simple broad statement that is given to every patient that defines the patient responsibility in the management of their payments
• Communicate, expectations clear, consistency• Keep it simple yet broad to cover all patients• Train staff on contents and expectations of training• Give copy to each patient, have them sign, scan in signed
copy, • Include on your web site
Financial Policy - Content
• Introduction – what is in this policy• Patient is responsible for what they owe• When payments are expected• Fees for late payments, discount options• If they don’t pay what could happen• Allow for discounts for cash payments• Consider charging for sending statements (incentive to pay on time,
discount option)• Signature
Registration
“Receive” patient, don’t just greet• Always ask
Insurance card and driver’s license (ID)
Review of accuracy – date, responsible party
“Medicare” – Parts A/B; traditional vs. Advantage
Collection
Scripts
Credit cards
Hospital patients – consults
Referrals from other practices
Staff and scripts
• Use scripts – develop simple, consistent words for the staff to use when approaching the patient about their balance due. – “How would you like to pay the balance due?” “Mr. Smith, will you be
using cash, check or credit card?” – “Mr. Smith, will you be paying cash, check or with your Visa or Master
Card?”– “You have a small balance remaining; can we add that to your credit
card at this time?” (Use only when the patient has given the credit card to staff member!)
93
Credit Card vs. Cash/check
• Credit card merchant fees – 1.5 – 3.25% (+ per transaction fee?)– Record to bank– Secure web site
• Check processing– Receipt– Time– Deposit ticket– To bank (use electronic clearance tools connected to your bank)– NSF risk
• Cash processing– Receipt– Time – Deposit ticket– To Bank– Employee handling
94
Credit cards -- 3-D secure
• The basic concept of the protocol is to tie the financial authorization process with an online authentication. This authentication is based on a three domain model (hence the 3-D in the name). The three domains are:– Acquirer Domain (the merchant and the bank to which money is being paid).– Issuer Domain (the bank which issued the card being used).– Interoperability Domain (the infrastructure provided by the card scheme,
credit, debit, prepaid or other type of finance card, to support the 3-D Secure protocol). Interoperability Domain includes the internet, MPI, ACS and other software providers
• The protocol uses XML messages sent over SSL connections with client authentication (this ensures the authenticity of both peers, the server and the client, using digital certificates).
http://en.wikipedia.org/wiki/3-D_Secure
95
Credit Card … Do’s
• Do:– Sign your cards as soon as they arrive. – Carry your cards separately from your wallet, in a zippered compartment, a business
card holder, or another small pouch. – Keep a record of your account numbers, their expiration dates, and the phone number
and address of each company in a secure place. – Keep an eye on your card during the transaction, and get it back as quickly as possible. – Void incorrect receipts. – Destroy carbons. – Save receipts to compare with billing statements. – Open bills promptly and reconcile accounts monthly, just as you would your checking
account. – Report any questionable charges promptly and in writing to the card issuer. – Notify card companies in advance of a change in address.
http://www.ftc.gov/bcp/edu/pubs/consumer/credit/cre07.shtm
96
Don’ts
• Don't:– Lend your card(s) to anyone. – Leave cards or receipts lying around. – Sign a blank receipt. When you sign a receipt, draw a line through any
blank spaces above the total. – Write your account number on a postcard or the outside of an
envelope. – Give out your account number over the phone unless you're making
the call to a company you know is reputable. If you have questions about a company, check it out with your local consumer protection office or Better Business Bureau.
Blame others . . .
• Get the blame away from you (staff)!
– “Our accountant will not allow us to carry these amounts on our books”
• Sign (use digital photo frame)
– “Your insurance company requires us to collect co-payments at the time of service”
Performance
• Monitor daily activity of the staff for collections –– Know how many patients with payments due - actually paid, goal
100%. – Know how many dollars could have been collected and the actual
amount collected, goal 100%. – For those accounts that payment was not received, ask the staff to
note why. – This can become a training tool on the issues, excuses, etc. that are
faced daily. – You can work through more “scripts” to handle these issues in the
future.
Coding and Charge Entry
• Timely coding– Day of service– Hospital/surgery charges
• Who does what?– CCI– LCD
• Claims scrubbing and edits• Audit
– Random– 10 charts per provider
100
Process
• Claims submission• Statements• Secondary's• Timing
Claims Processing & Payment Posting
• Electronic submission– Clean up process and tracking to determine source of
any common error issues
• Daily review
• Payment posting– Process of denial and/or appeal
102
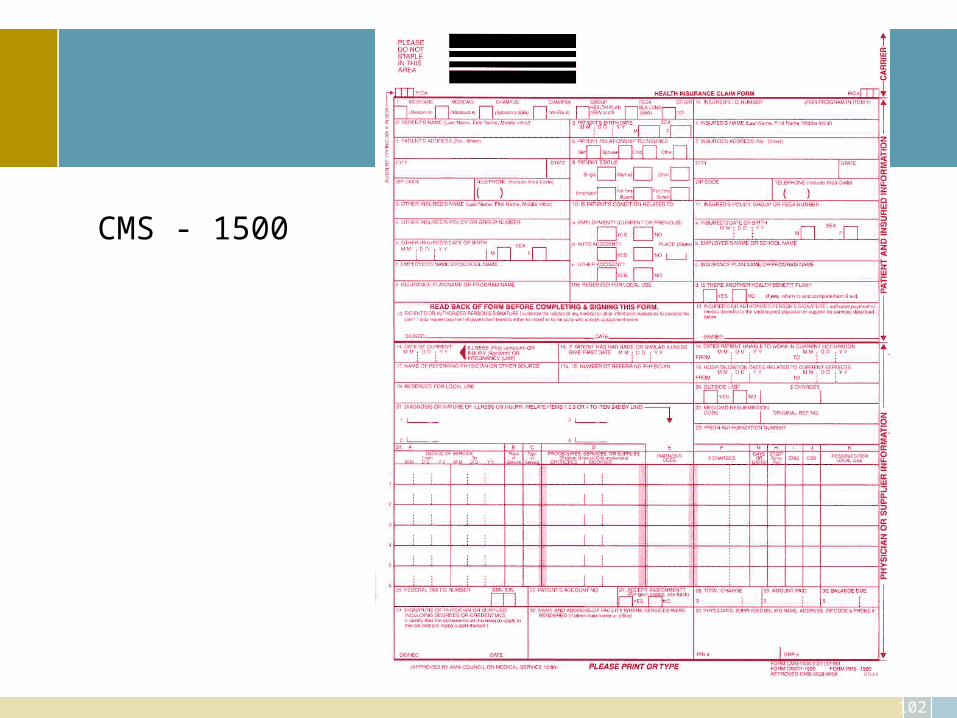
CMS - 1500
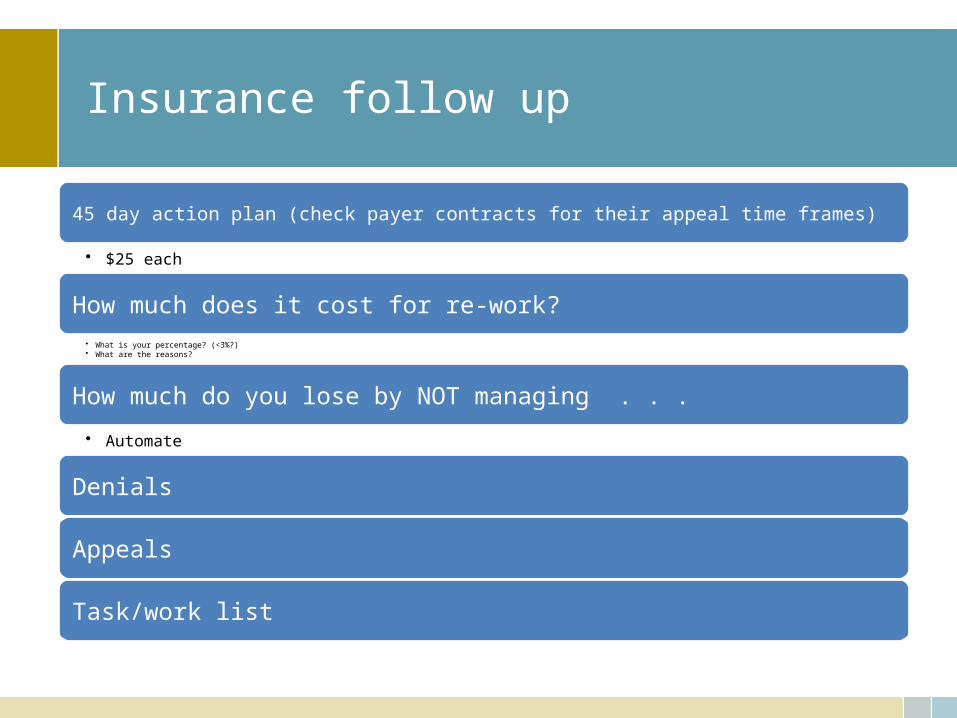
Insurance follow up
45 day action plan (check payer contracts for their appeal time frames)
• $25 each
How much does it cost for re-work?• What is your percentage? (<3%?) • What are the reasons?
How much do you lose by NOT managing . . .
• Automate
Denials
Appeals
Task/work list
104
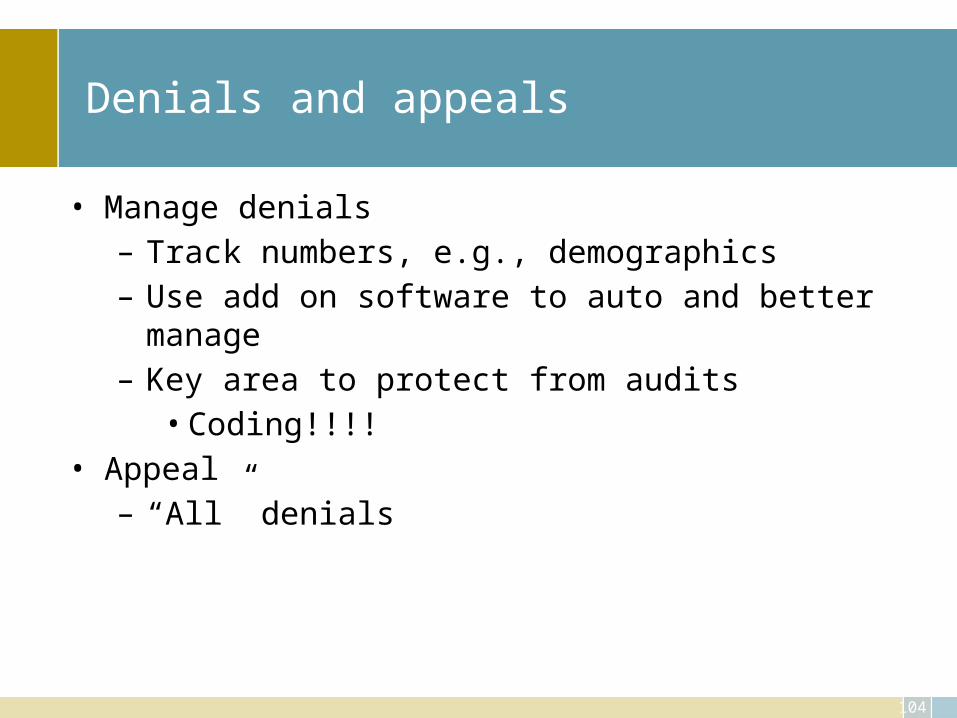
Denials and appeals
• Manage denials– Track numbers, e.g., demographics– Use add on software to auto and better manage– Key area to protect from audits
• Coding!!!!• Appeal
– “All” denials
105
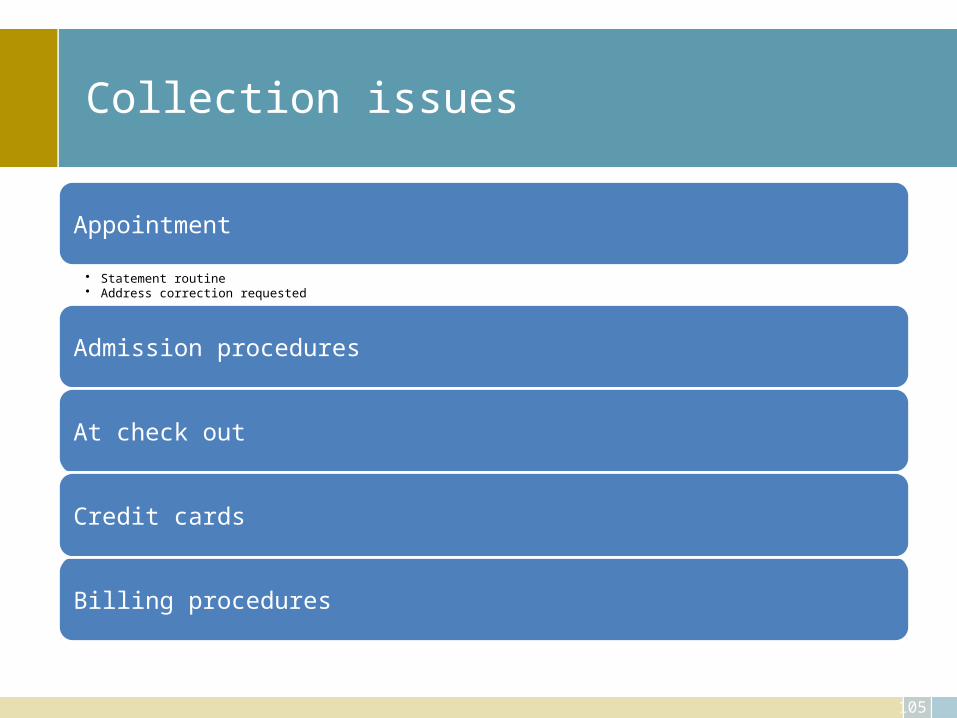
Collection issues
Appointment
• Statement routine• Address correction requested
Admission procedures
At check out
Credit cards
Billing procedures
106
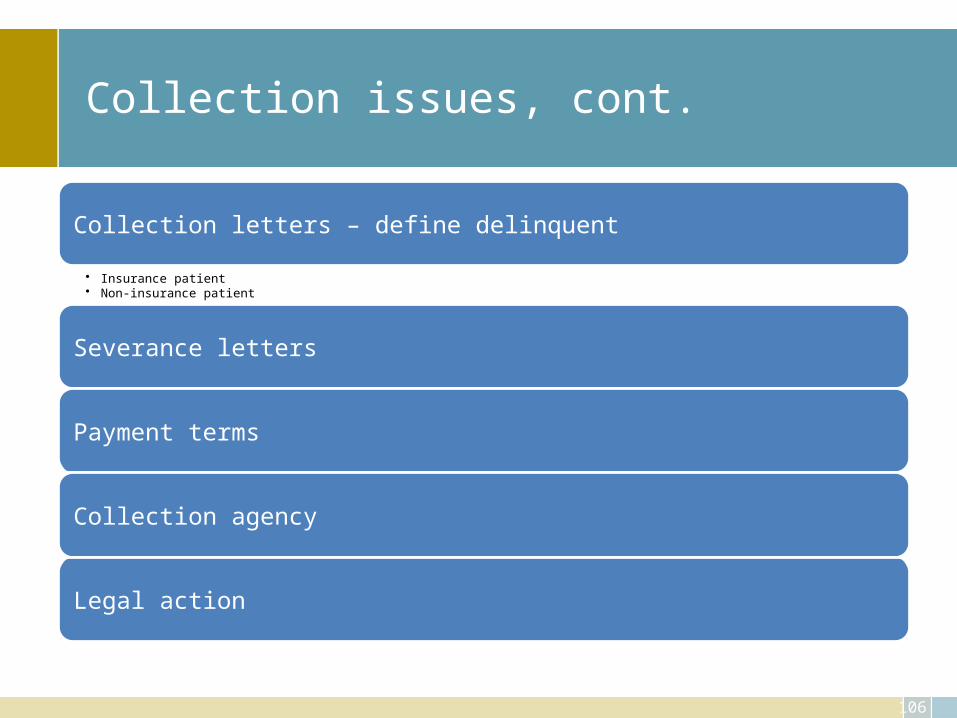
Collection issues, cont.
Collection letters – define delinquent
• Insurance patient• Non-insurance patient
Severance letters
Payment terms
Collection agency
Legal action
107
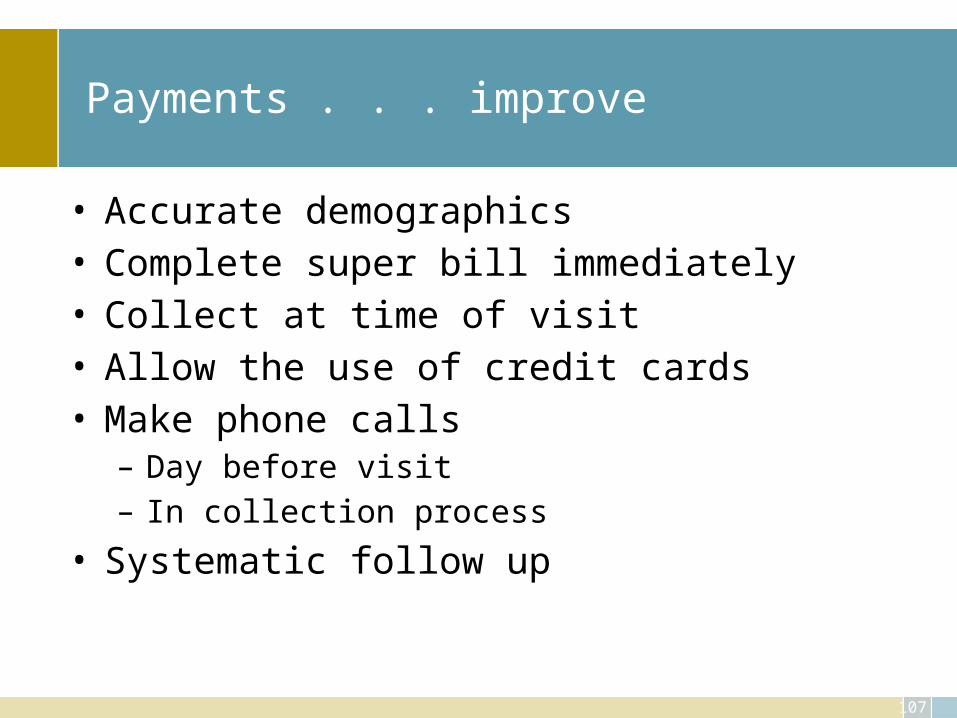
Payments . . . improve
• Accurate demographics• Complete super bill immediately• Collect at time of visit• Allow the use of credit cards• Make phone calls
– Day before visit– In collection process
• Systematic follow up
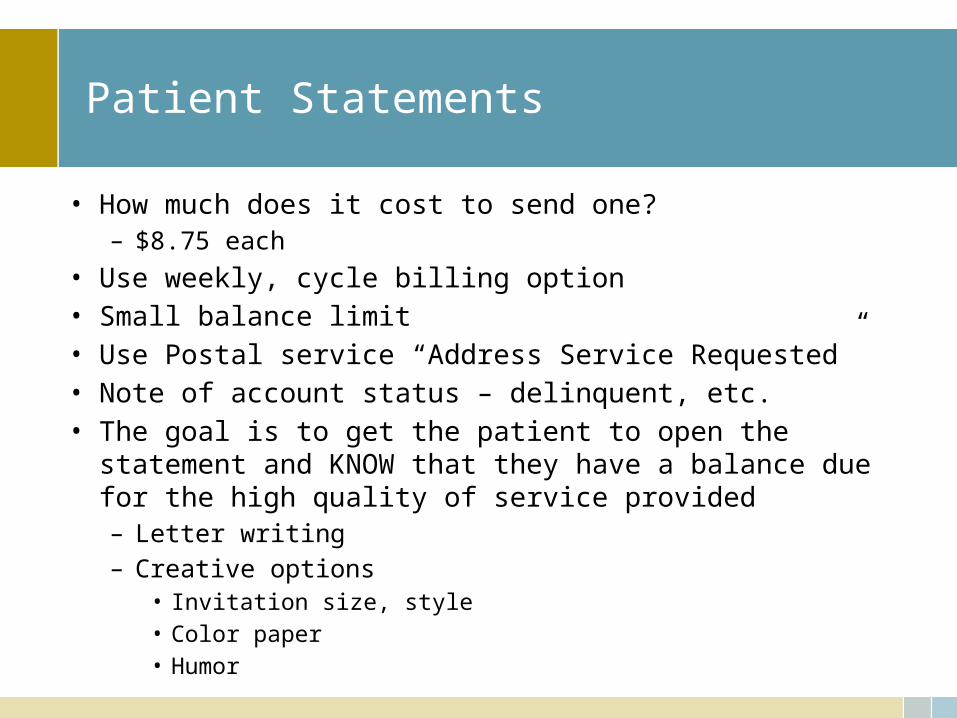
Patient Statements
• How much does it cost to send one?– $8.75 each
• Use weekly, cycle billing option• Small balance limit• Use Postal service “Address Service Requested”• Note of account status – delinquent, etc.• The goal is to get the patient to open the statement and KNOW that
they have a balance due for the high quality of service provided– Letter writing – Creative options
• Invitation size, style• Color paper• Humor
Delinquent Account
• Define what is a delinquent account – – Recommend two statements. – If you do not currently use the “cycle” statement option for your
billing, change. – Statements are sent the week that it is determined that the balance
remaining is the patient’s responsibility and then four weeks later. – If no payment is received, the account is now considered
delinquent. – You then activate the notes on statements or letter writing
campaign to inform that patient that if the balance is not paid by such and such date, action will be taken to collect the balance due.
Land Line (Telephone!)
• Use the telephone – – Remind the patient of their co-pay and/or balance due when the
appointment reminder call is made.– Also determine a minimum balance necessary to exercise the
personal request for payment. It may not be wise to call on every account but beneficial to call on those accounts with a balance greater than say $100, you decide what works best for you.
– This is the second most effective time to collect, time of visit being the most effective!
Payment plans
Retain copy of credit card, securely, and use it
Allow for payments on the web site
Payment plans – YOU are a bank
Charge interest
112
Consumer Credit Protection Acts
• Truth & Lending– Disclose terms and costs – “4”– Credit card– Dispute resolution
• Fair Credit Billing– Unfair billing
• Fair Debt Collection Practices– Communication– Harassment– False & Misleading
Use Web Site & Patient Portal
• Financial policy• Collection• Statements• Appointments• And so much more
– Post your fee schedule– Marketing of “specials”– And . . . .
Aggressive? Not?
• Determine how far you are willing to go to collect the balance due – Will you refer patients to a collection agency or write of the
balance? – Is there a dollar amount that you will write off? – Dr. A says this while Dr. B says that
• Who’s in the middle!– Expectation for patients must be very clear– Every one must act consistently to achieve the goal of improved
collections.
Guidelines from the Doctors
• Develop a collection policy – – All items noted here should be written, agreed upon and given to
the staff to use in their daily efforts to collect. – This policy should go beyond just the patient balances and
include the entire process of verification, authorization, claims submission, and the like,
– In other words this should define how the entire revenue cycle is managed.
116
Payments . . .Audits
Timeliness
• EOB check DOS, DOB, DOP
Error analysis
• Invalid numbers, demographic related
Denials
• Coding
Other
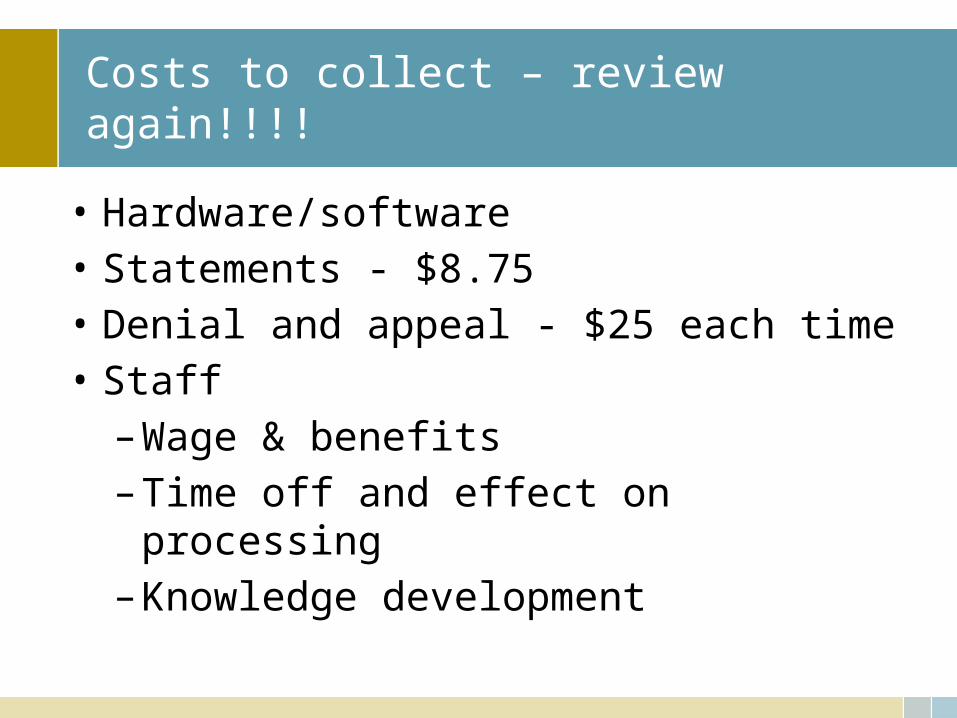
Costs to collect – review again!!!!
• Hardware/software• Statements - $8.75• Denial and appeal - $25 each time• Staff
– Wage & benefits– Time off and effect on processing– Knowledge development
118
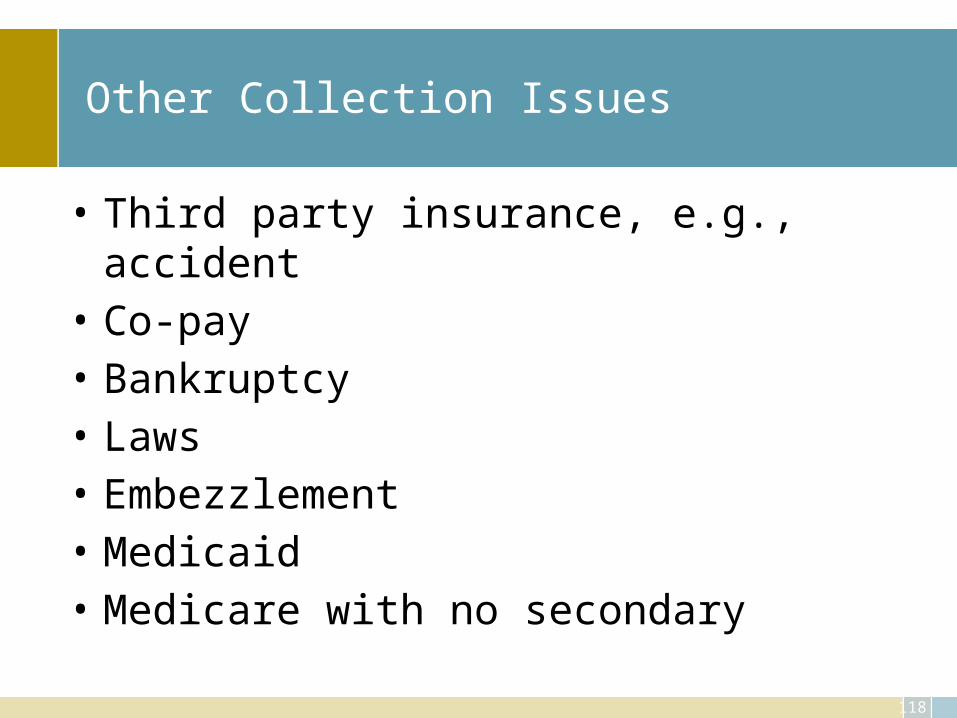
Other Collection Issues
• Third party insurance, e.g., accident• Co-pay• Bankruptcy• Laws• Embezzlement• Medicaid• Medicare with no secondary
119
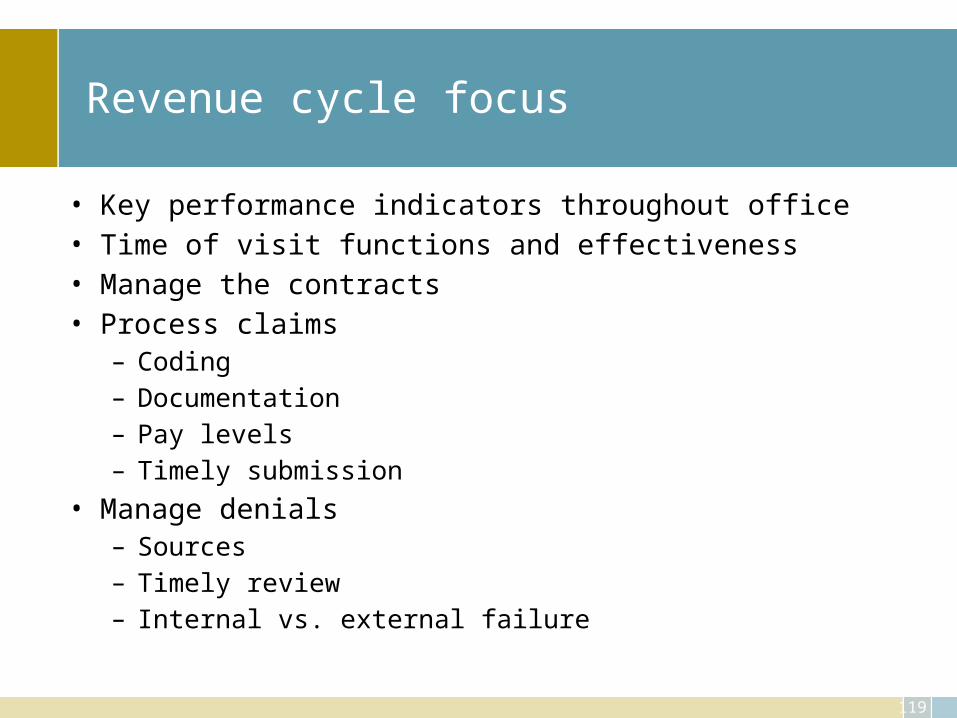
Revenue cycle focus
• Key performance indicators throughout office• Time of visit functions and effectiveness• Manage the contracts• Process claims
– Coding– Documentation– Pay levels– Timely submission
• Manage denials– Sources– Timely review – Internal vs. external failure
120
Audits
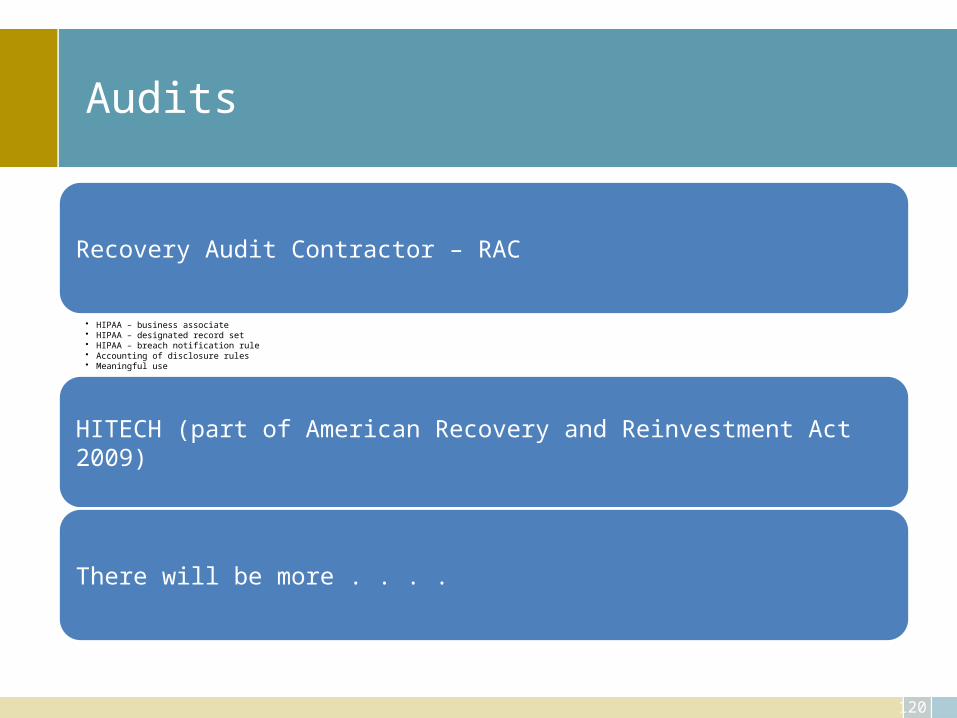
Recovery Audit Contractor – RAC
• HIPAA – business associate• HIPAA – designated record set• HIPAA – breach notification rule • Accounting of disclosure rules• Meaningful use
HITECH (part of American Recovery and Reinvestment Act 2009)
There will be more . . . .
121
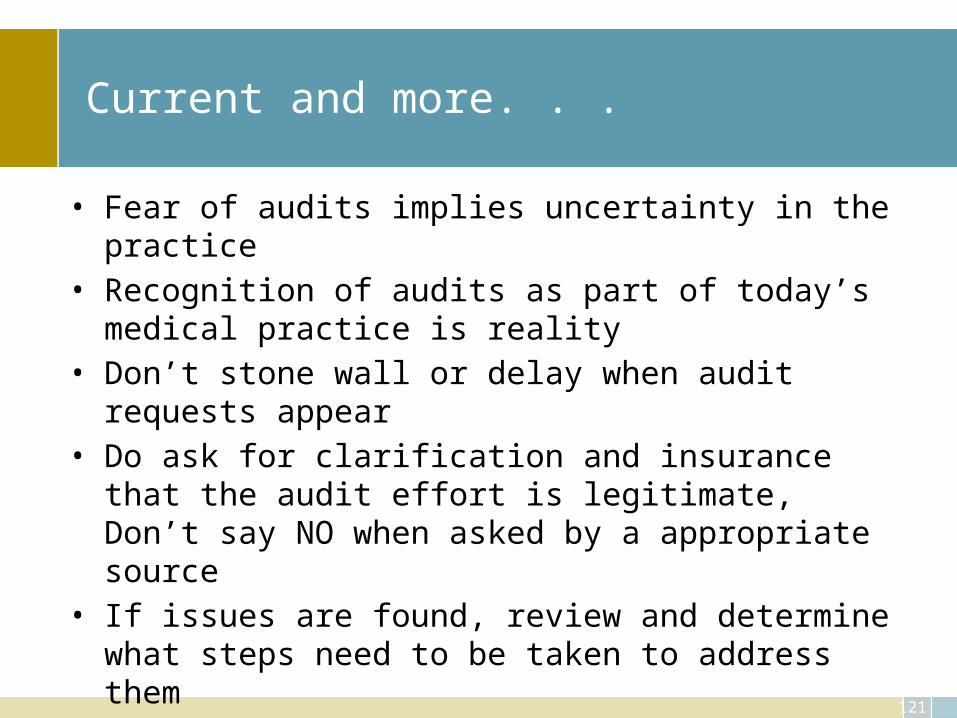
Current and more. . .
• Fear of audits implies uncertainty in the practice• Recognition of audits as part of today’s medical practice is reality• Don’t stone wall or delay when audit requests appear• Do ask for clarification and insurance that the audit effort is
legitimate, Don’t say NO when asked by a appropriate source• If issues are found, review and determine what steps need to be
taken to address them• Review any and all sources of information to stay ahead of the
regulation changes and potential audits that are or may be on the horizon
122
Internal controls
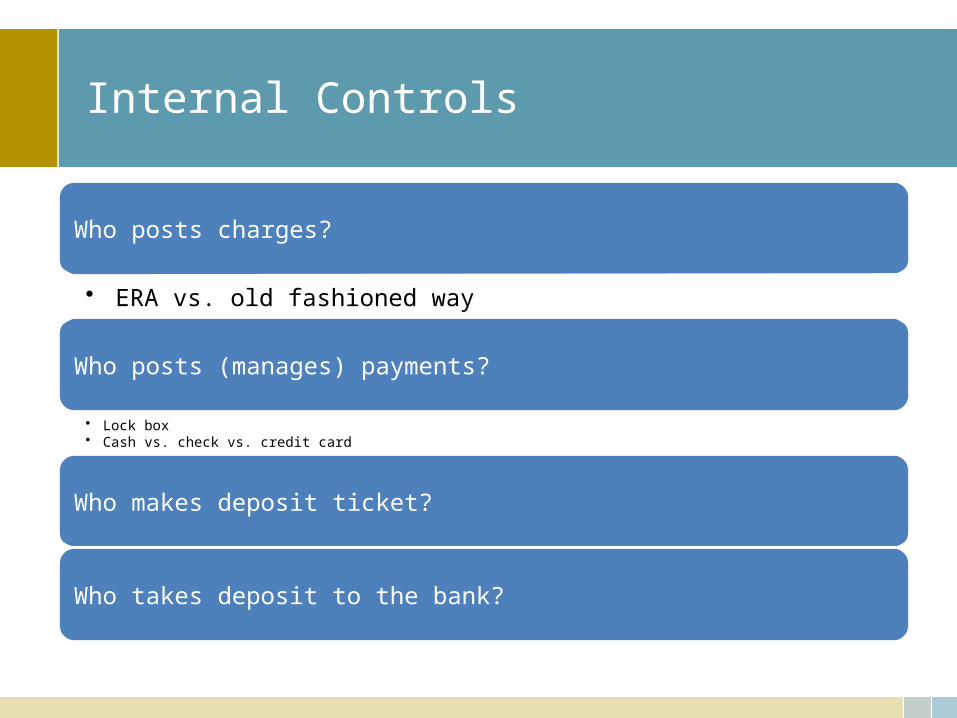
Internal Controls
Who posts charges?
• ERA vs. old fashioned way
Who posts (manages) payments?
• Lock box• Cash vs. check vs. credit card
Who makes deposit ticket?
Who takes deposit to the bank?
124
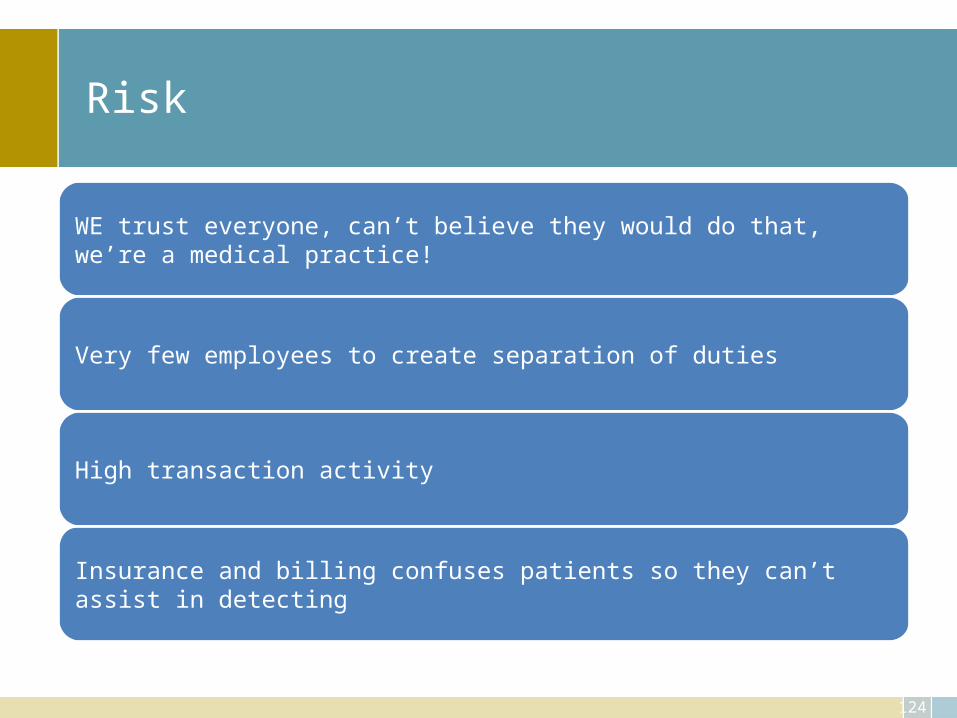
Risk
WE trust everyone, can’t believe they would do that, we’re a medical practice!
Very few employees to create separation of duties
High transaction activity
Insurance and billing confuses patients so they can’t assist in detecting
125
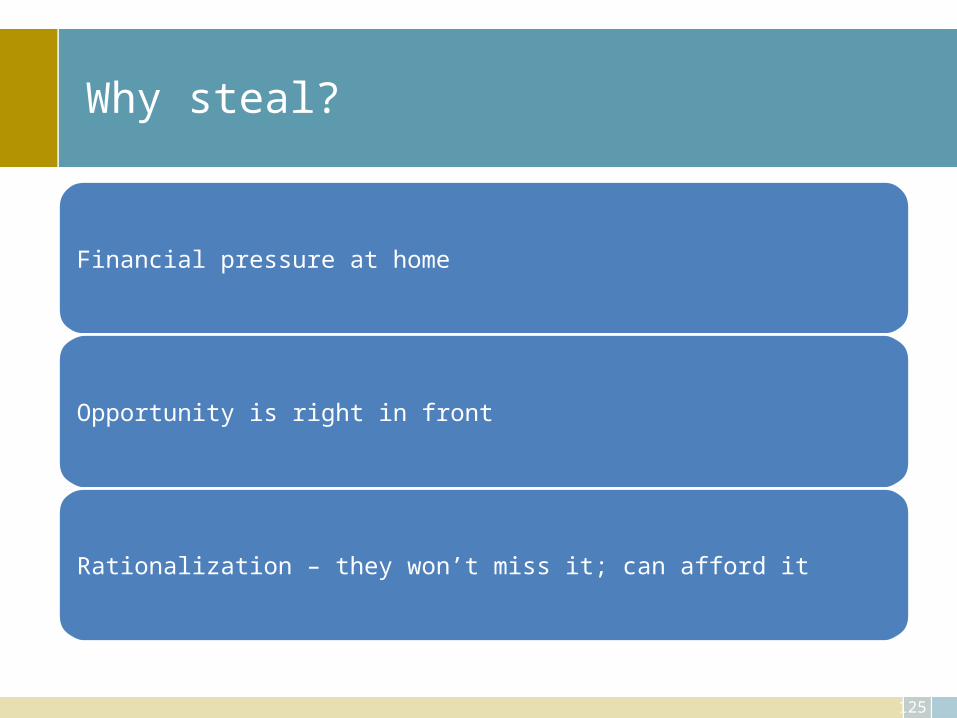
Why steal?
Financial pressure at home
Opportunity is right in front
Rationalization – they won’t miss it; can afford it
126
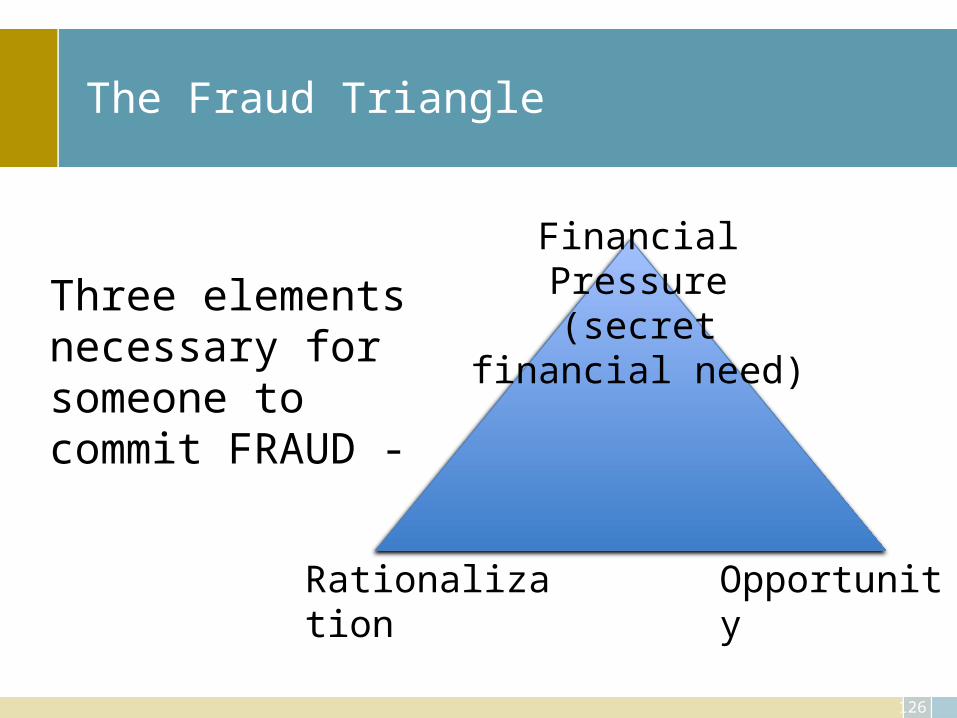
The Fraud Triangle
Financial Pressure(secret financial need)
OpportunityRationalization
Three elements necessary for someone to commit FRAUD -
127
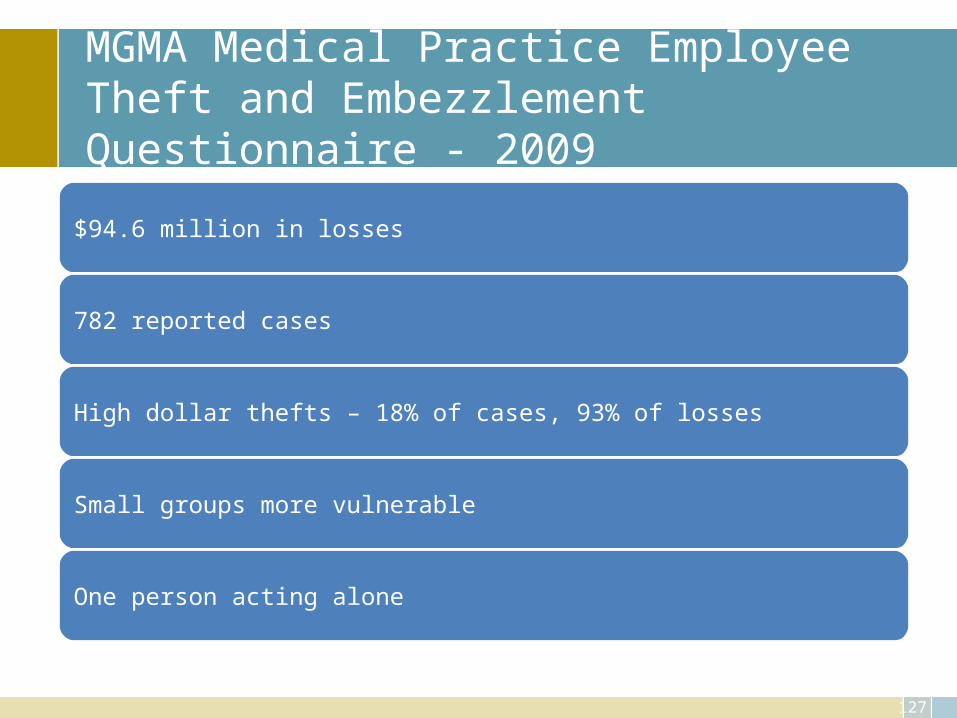
MGMA Medical Practice Employee Theft and Embezzlement Questionnaire - 2009
$94.6 million in losses
782 reported cases
High dollar thefts – 18% of cases, 93% of losses
Small groups more vulnerable
One person acting alone
128
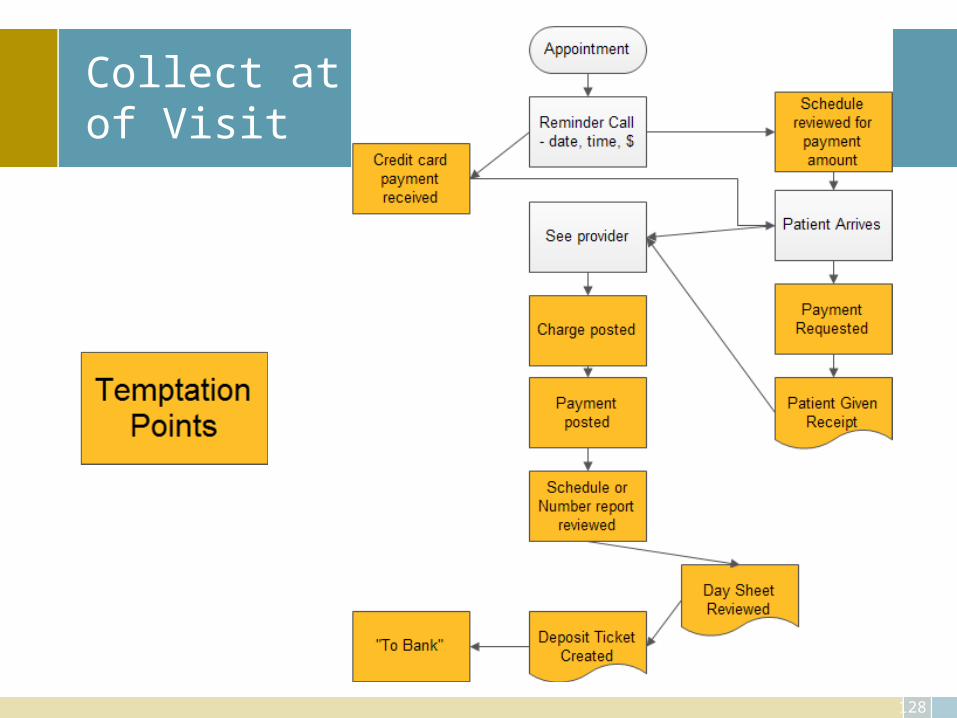
Collect at Time of Visit
129
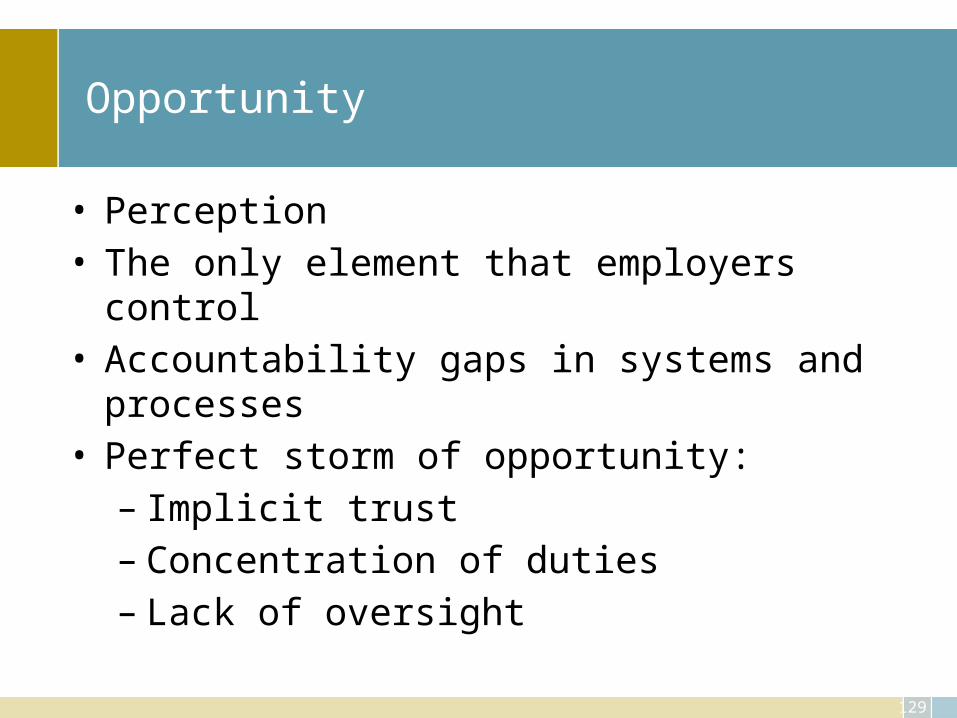
Opportunity
• Perception• The only element that employers control• Accountability gaps in systems and processes• Perfect storm of opportunity:
– Implicit trust– Concentration of duties– Lack of oversight
130
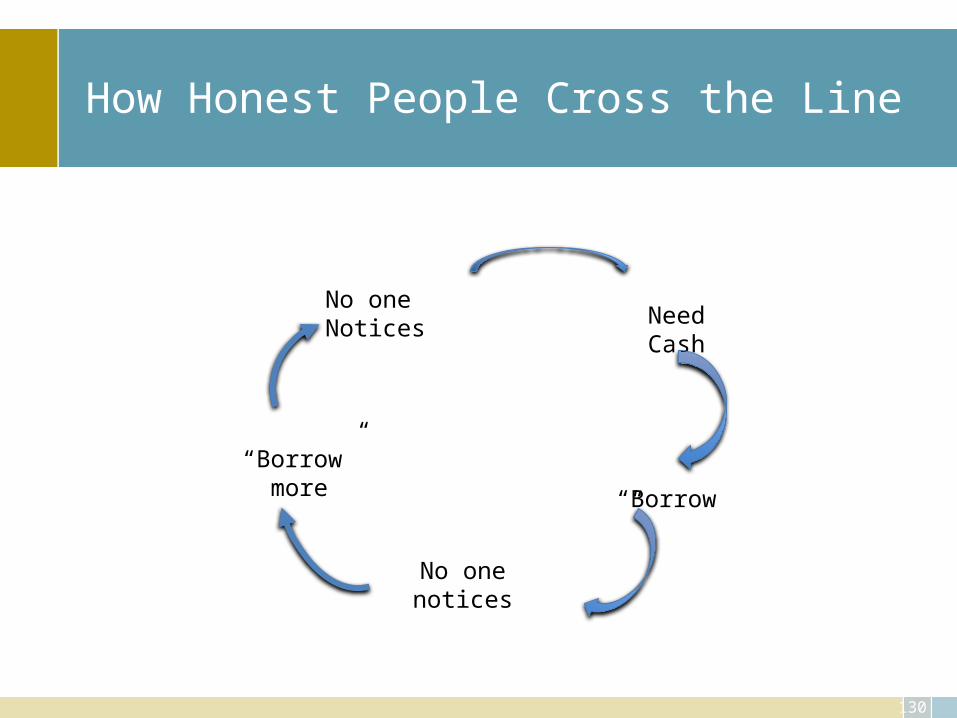
How Honest People Cross the Line
Need Cash
“Borrow”
No one notices
“Borrow” more
No one Notices
131
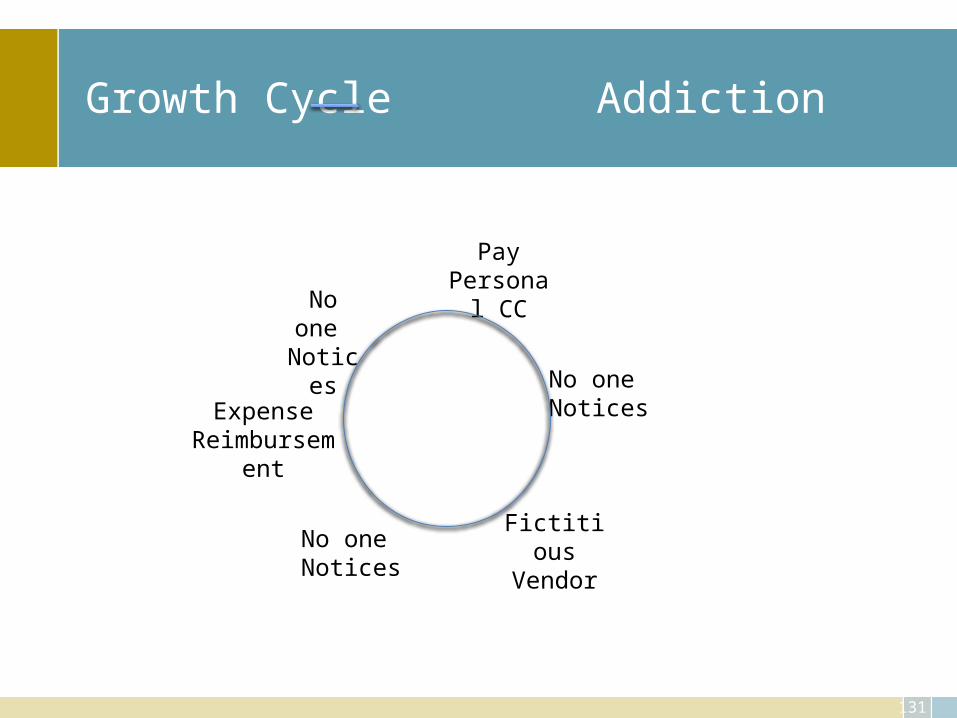
Growth Cycle Addiction
Pay Personal
CC
No one Notices
No one Notices
No one Notices
Fictitious Vendor
Expense Reimbursement
132
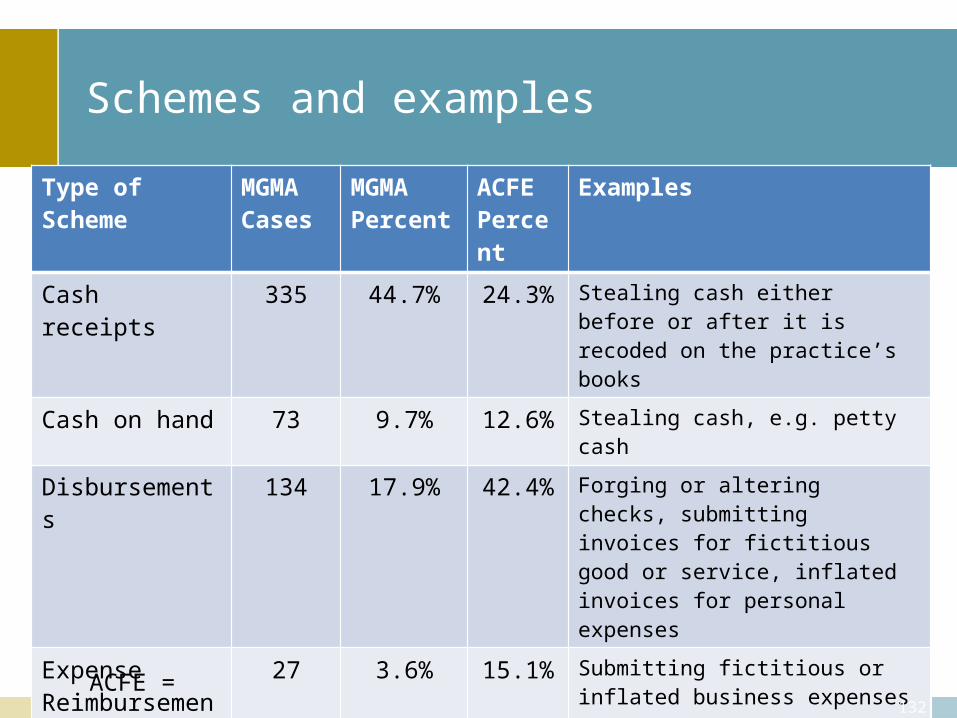
Schemes and examples
Type of Scheme MGMACases
MGMAPercent
ACFE Percent
Examples
Cash receipts 335 44.7% 24.3% Stealing cash either before or after it is recoded on the practice’s books
Cash on hand 73 9.7% 12.6% Stealing cash, e.g. petty cash
Disbursements 134 17.9% 42.4% Forging or altering checks, submitting invoices for fictitious good or service, inflated invoices for personal expenses
Expense Reimbursements
27 3.6% 15.1% Submitting fictitious or inflated business expenses
Payroll 46 6.1% 8.5% Creating fictitious employees, unauthorized bonuses or inflate pay
Non cash 56 7.5% 16.3% Stealing or misusing practices non cash assets such as supplies, equip
Other 78 10.4% Respondents reported thefts involving multiple schemes, patient refunds, billing schemes, identity theft, prescription theft
ACFE =
133
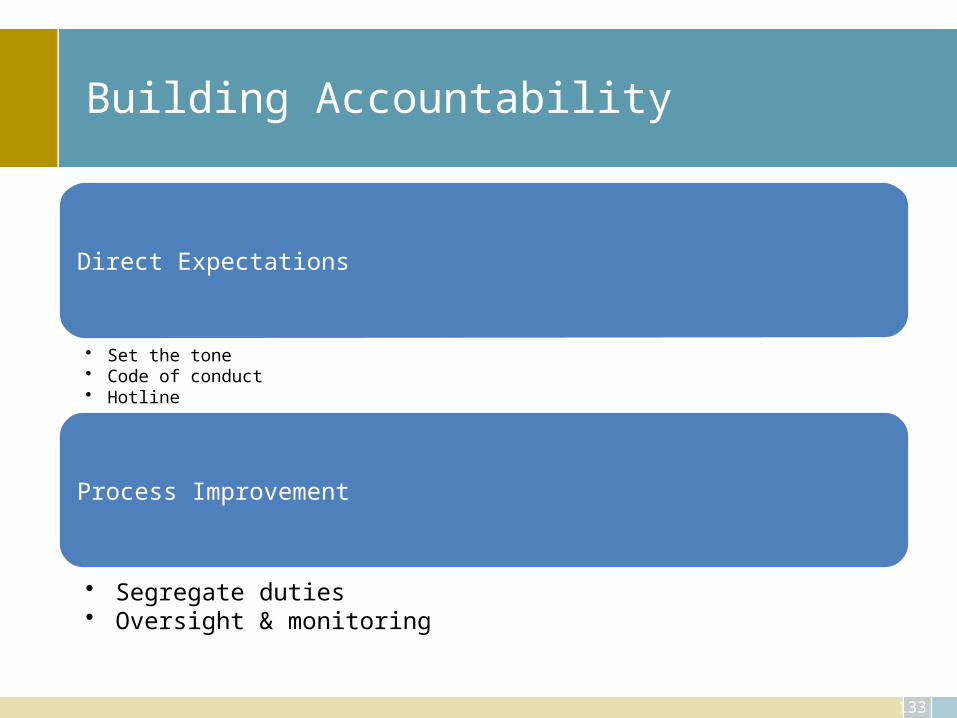
Building Accountability
Direct Expectations
• Set the tone• Code of conduct• Hotline
Process Improvement
• Segregate duties• Oversight & monitoring
134
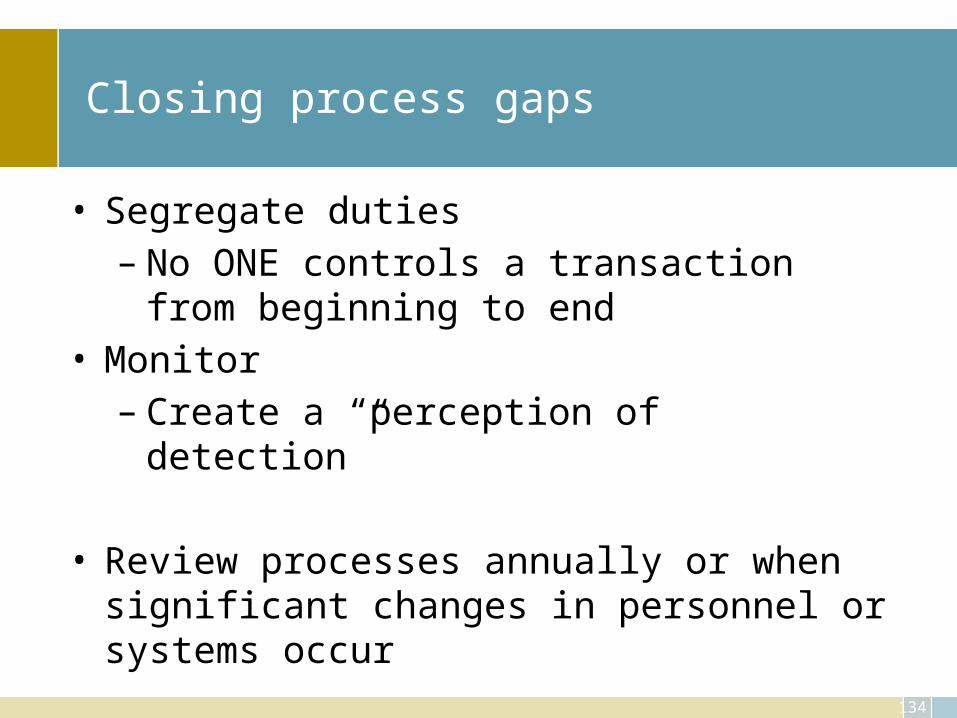
Closing process gaps
• Segregate duties– No ONE controls a transaction from beginning to end
• Monitor– Create a “perception of detection”
• Review processes annually or when significant changes in personnel or systems occur
135
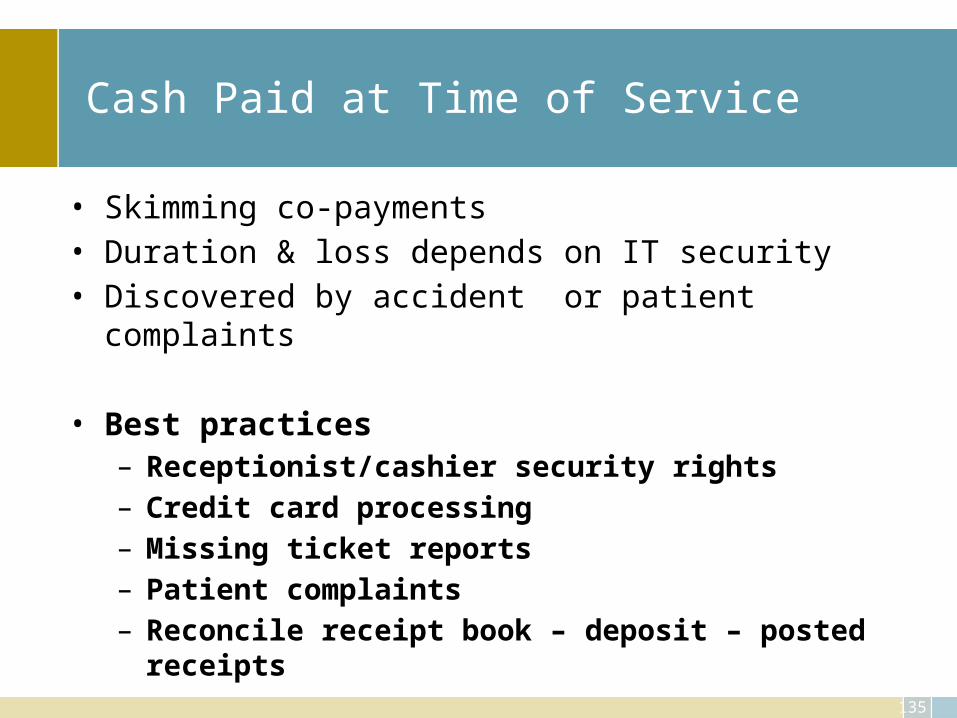
Cash Paid at Time of Service
• Skimming co-payments• Duration & loss depends on IT security• Discovered by accident or patient complaints
• Best practices– Receptionist/cashier security rights– Credit card processing– Missing ticket reports– Patient complaints– Reconcile receipt book – deposit – posted receipts
136
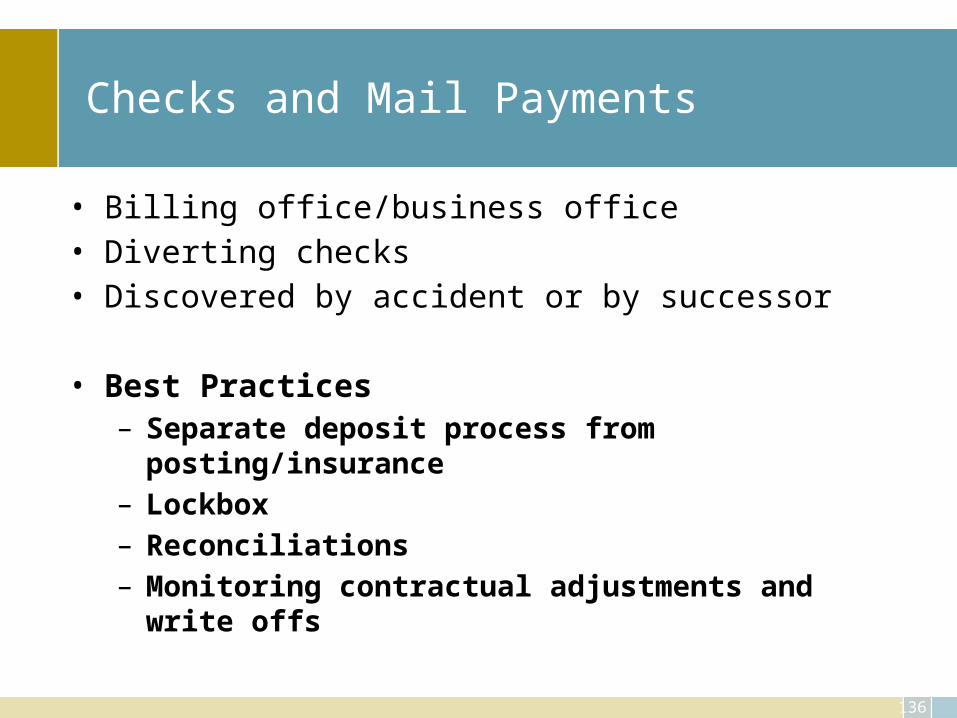
Checks and Mail Payments
• Billing office/business office• Diverting checks• Discovered by accident or by successor
• Best Practices– Separate deposit process from posting/insurance– Lockbox– Reconciliations– Monitoring contractual adjustments and write offs
137
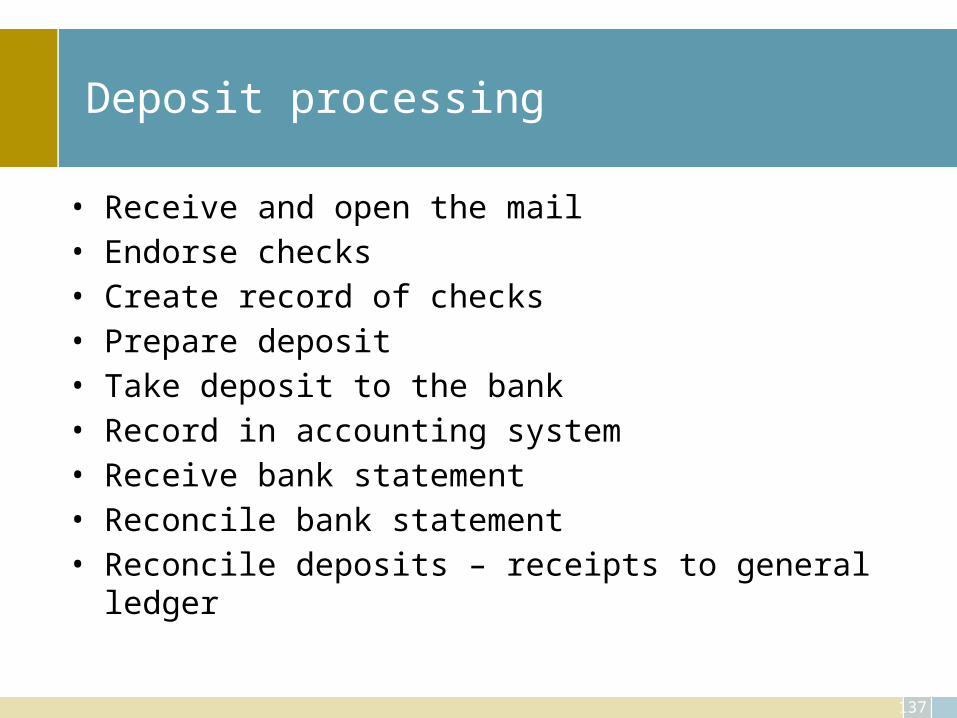
Deposit processing
• Receive and open the mail• Endorse checks• Create record of checks• Prepare deposit• Take deposit to the bank• Record in accounting system• Receive bank statement• Reconcile bank statement• Reconcile deposits – receipts to general ledger
138
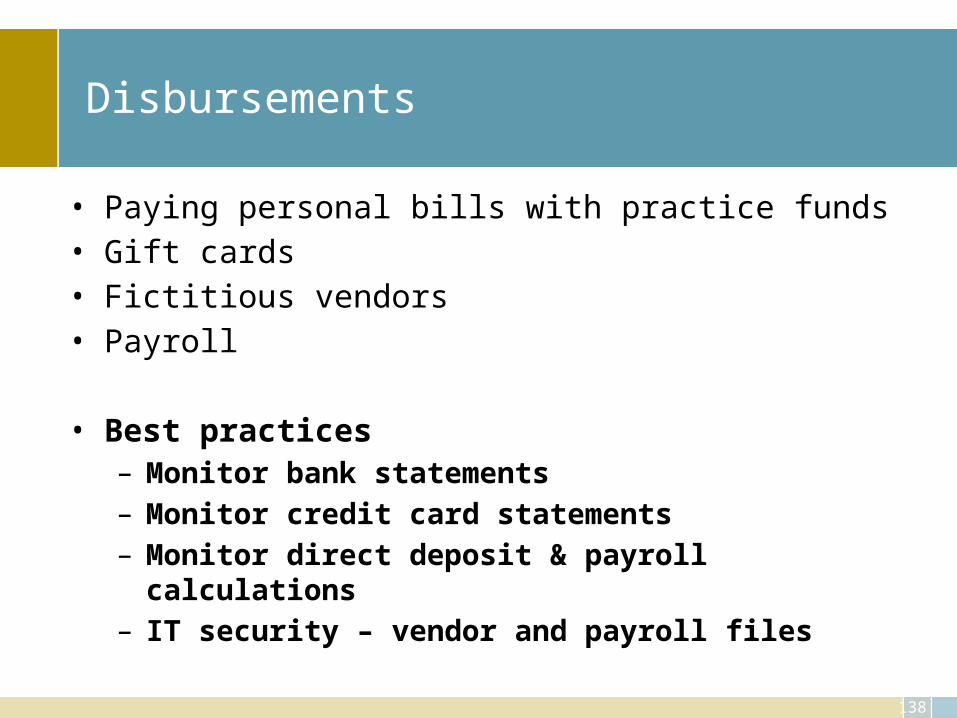
Disbursements
• Paying personal bills with practice funds• Gift cards• Fictitious vendors• Payroll
• Best practices– Monitor bank statements– Monitor credit card statements– Monitor direct deposit & payroll calculations– IT security – vendor and payroll files

139
Oversight and monitoring
Create a “perception of detection”
Intermittent and routine
Surprise audits
Job rotation
Mandatory vacations
Mandatory reconciliations
Surprise audits
140
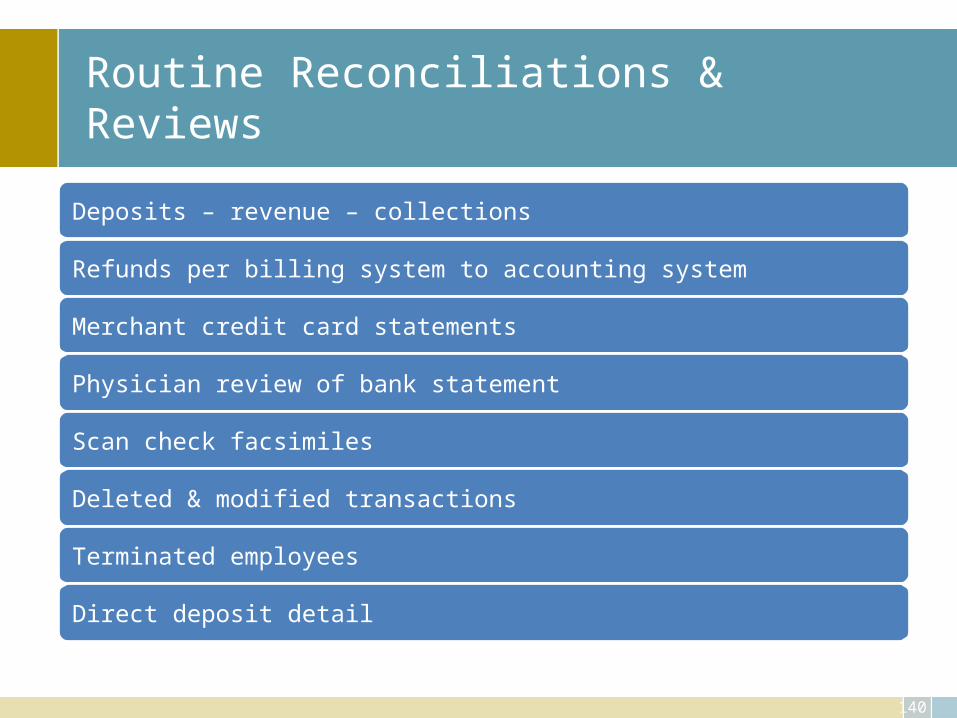
Routine Reconciliations & Reviews
Deposits – revenue – collections
Refunds per billing system to accounting system
Merchant credit card statements
Physician review of bank statement
Scan check facsimiles
Deleted & modified transactions
Terminated employees
Direct deposit detail
141
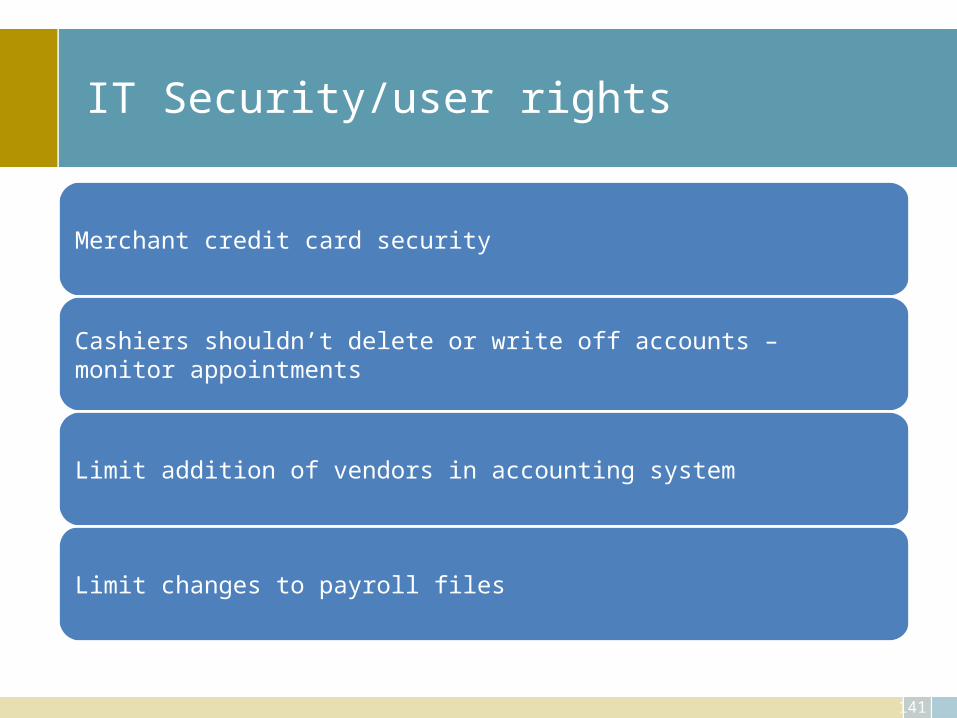
IT Security/user rights
Merchant credit card security
Cashiers shouldn’t delete or write off accounts – monitor appointments
Limit addition of vendors in accounting system
Limit changes to payroll files
142
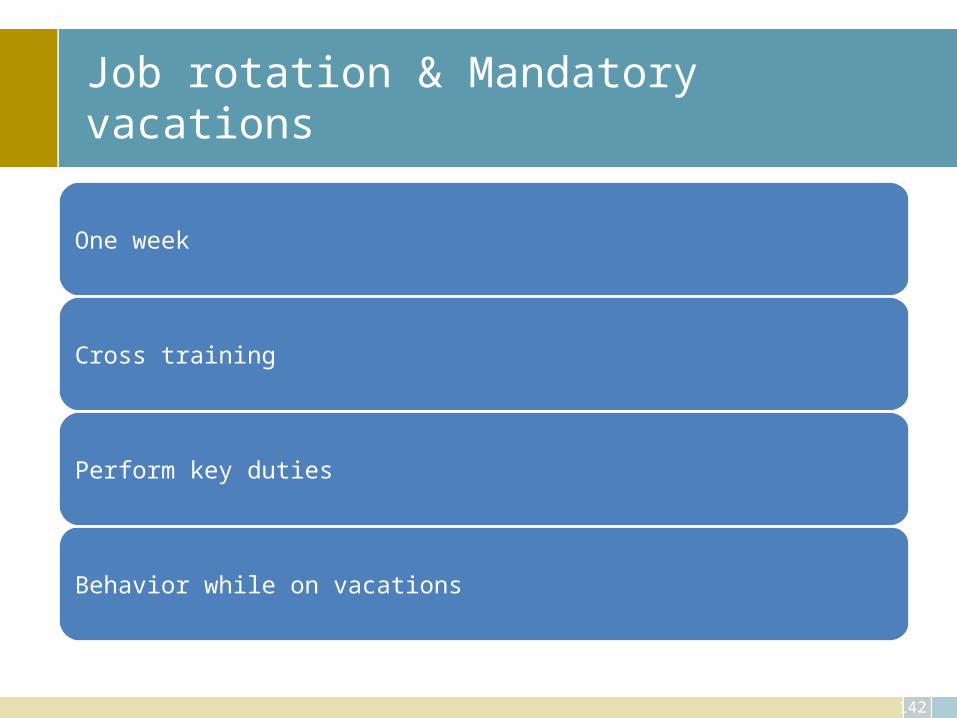
Job rotation & Mandatory vacations
One week
Cross training
Perform key duties
Behavior while on vacations
143
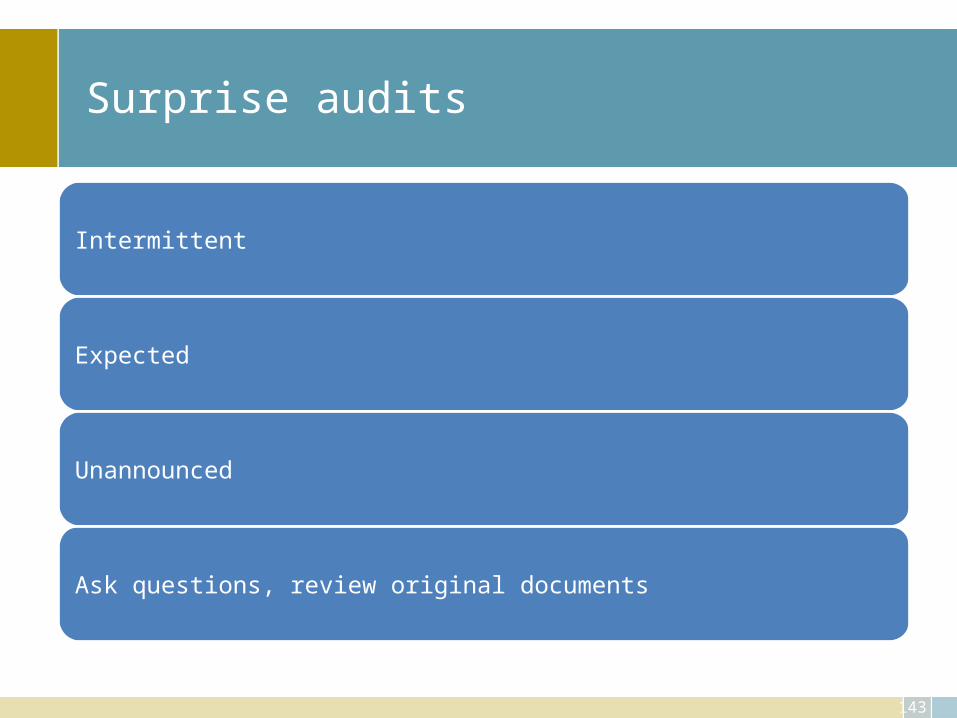
Surprise audits
Intermittent
Expected
Unannounced
Ask questions, review original documents
144
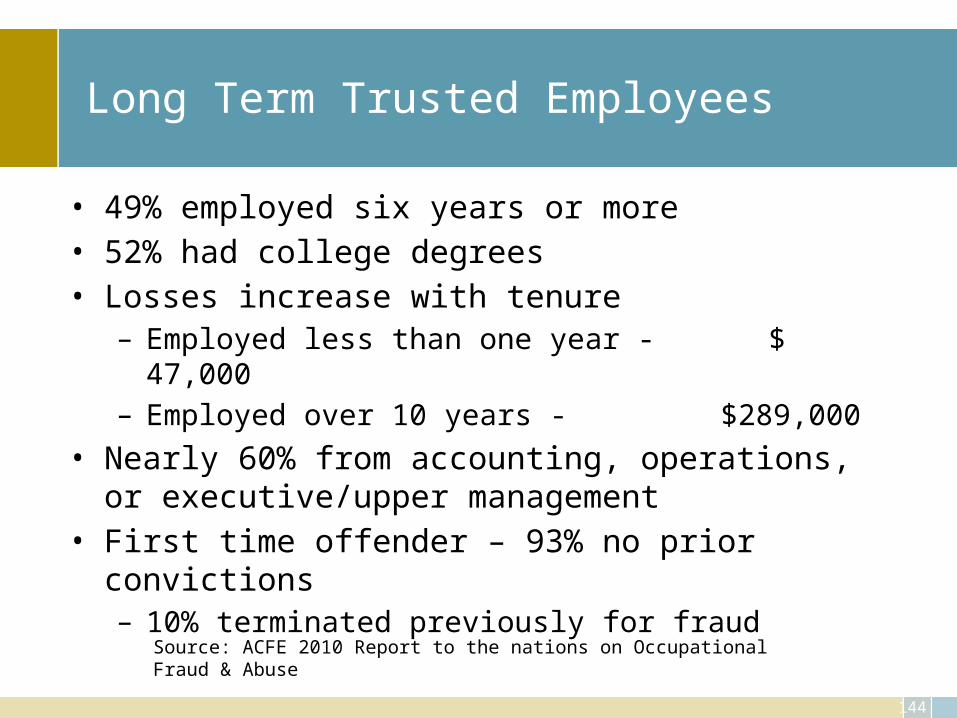
Long Term Trusted Employees
• 49% employed six years or more• 52% had college degrees• Losses increase with tenure
– Employed less than one year - $ 47,000– Employed over 10 years - $289,000
• Nearly 60% from accounting, operations, or executive/upper management
• First time offender – 93% no prior convictions– 10% terminated previously for fraud
Source: ACFE 2010 Report to the nations on Occupational Fraud & Abuse
145
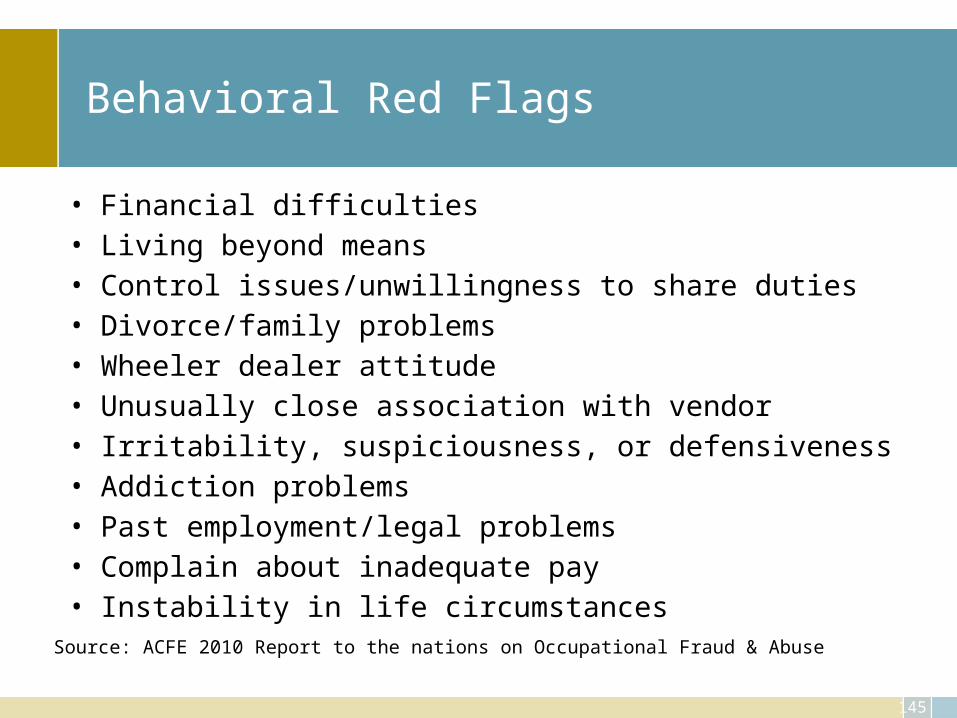
Behavioral Red Flags
• Financial difficulties• Living beyond means• Control issues/unwillingness to share duties• Divorce/family problems• Wheeler dealer attitude• Unusually close association with vendor• Irritability, suspiciousness, or defensiveness• Addiction problems• Past employment/legal problems• Complain about inadequate pay• Instability in life circumstancesSource: ACFE 2010 Report to the nations on Occupational Fraud & Abuse
146
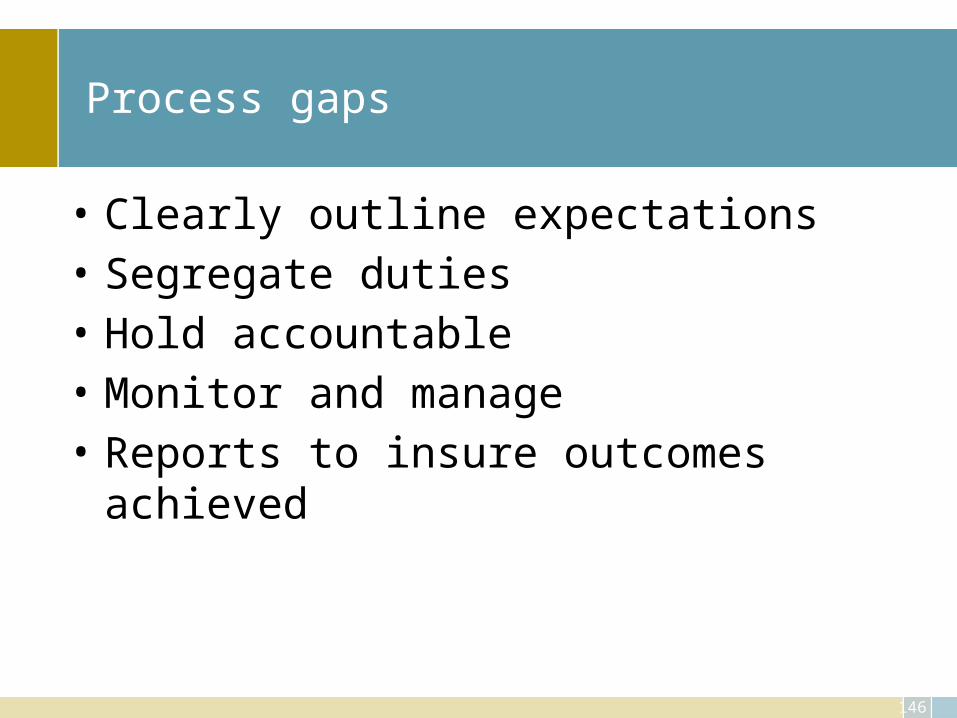
Process gaps
• Clearly outline expectations• Segregate duties• Hold accountable• Monitor and manage• Reports to insure outcomes achieved
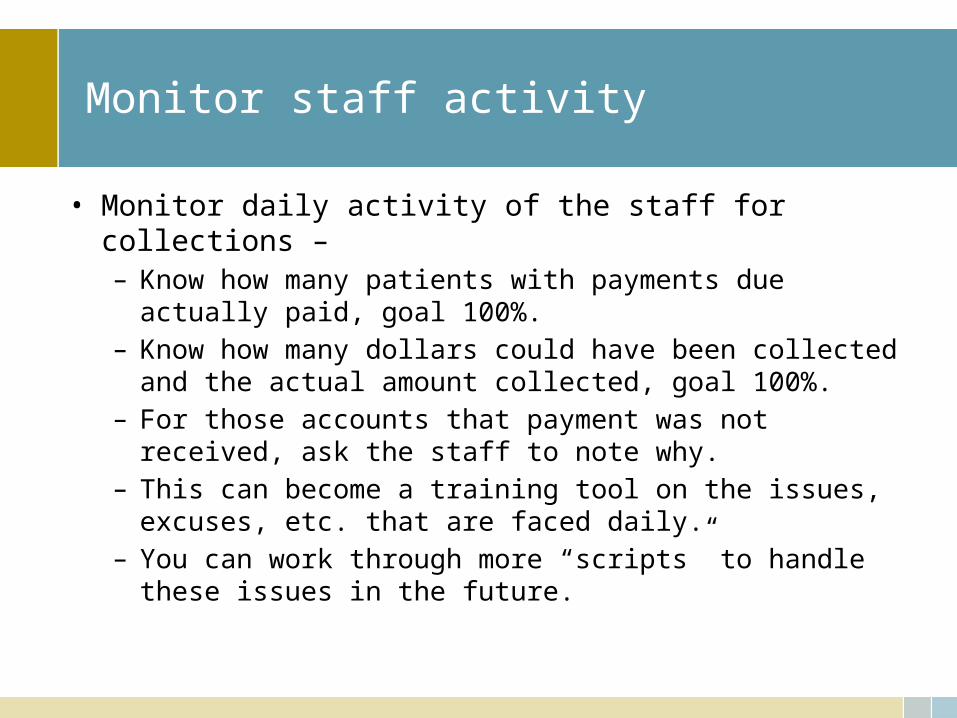
Monitor staff activity
• Monitor daily activity of the staff for collections –– Know how many patients with payments due actually paid, goal 100%. – Know how many dollars could have been collected and the actual
amount collected, goal 100%. – For those accounts that payment was not received, ask the staff to
note why. – This can become a training tool on the issues, excuses, etc. that are
faced daily. – You can work through more “scripts” to handle these issues in the
future.
148
Reporting
149
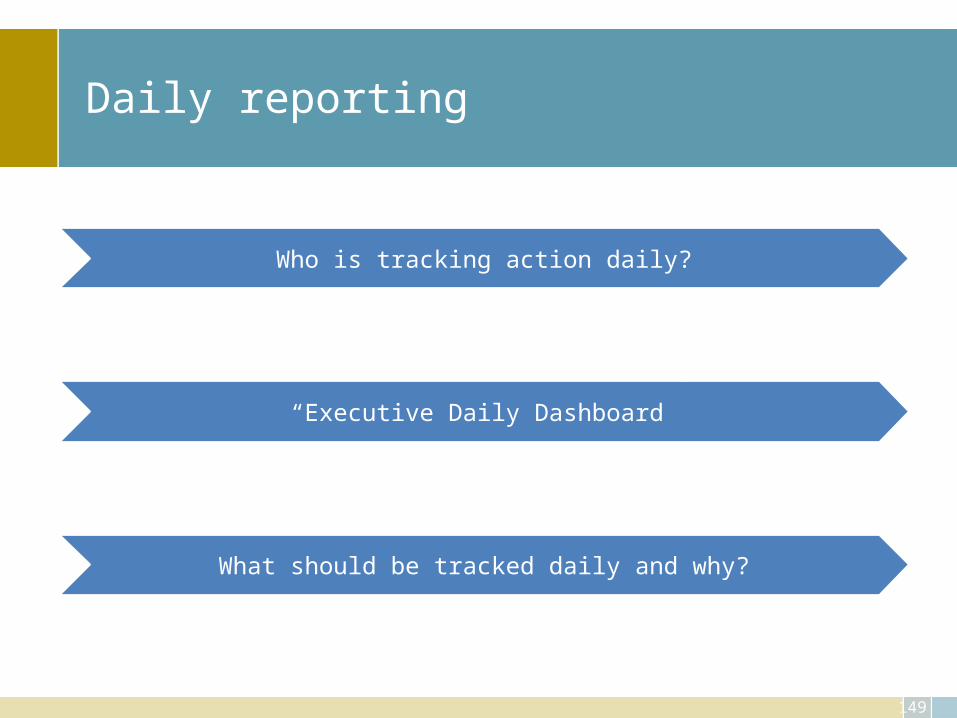
Daily reporting
Who is tracking action daily?
“Executive Daily Dashboard”
What should be tracked daily and why?
150
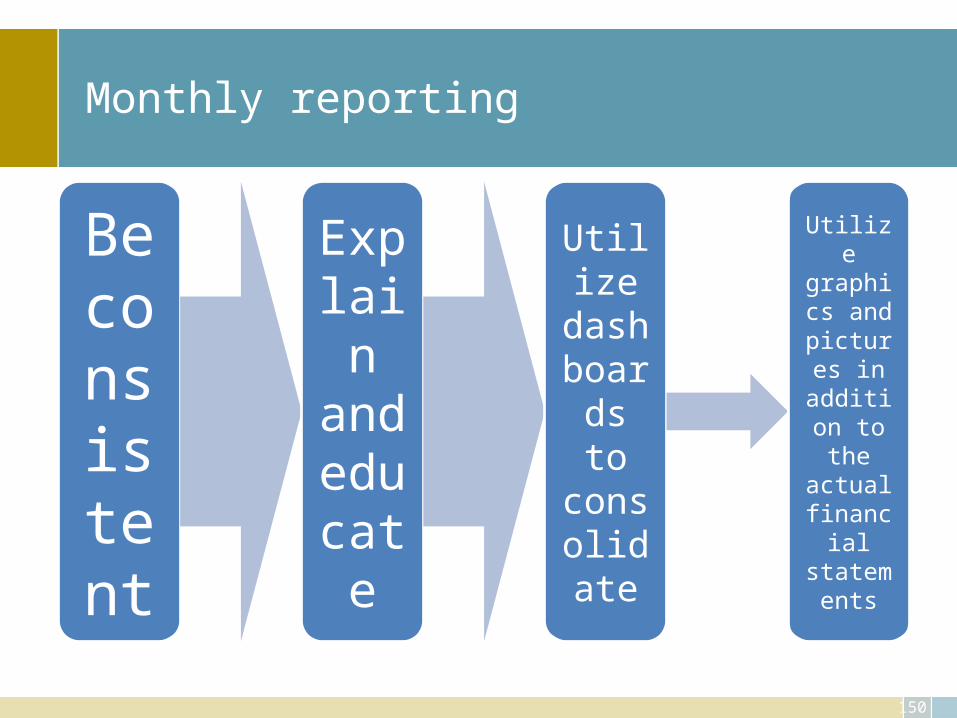
Monthly reporting
Be consistent
Explain and educate
Utilize
dashboards to consolida
te
Utilize graphics and
pictures in
addition to the
actual financi
al statem
ents
151
Benchmark
• Evaluate your practice in terms of best practice leading to improving some aspect of performance, function, financial or process improvement
• Methodology– Identify problem areas– Identify how you did it before (how others do it)– Identify “leading edge” practices– Implement new and improved business practices
KPI
• What are you key performance indicators – three things to monitor every month– What is your days in accounts receivable (average daily charges over
a period of time, minimum of 90 days, divided into the current accounts receivable), the goal is less than 35 days!
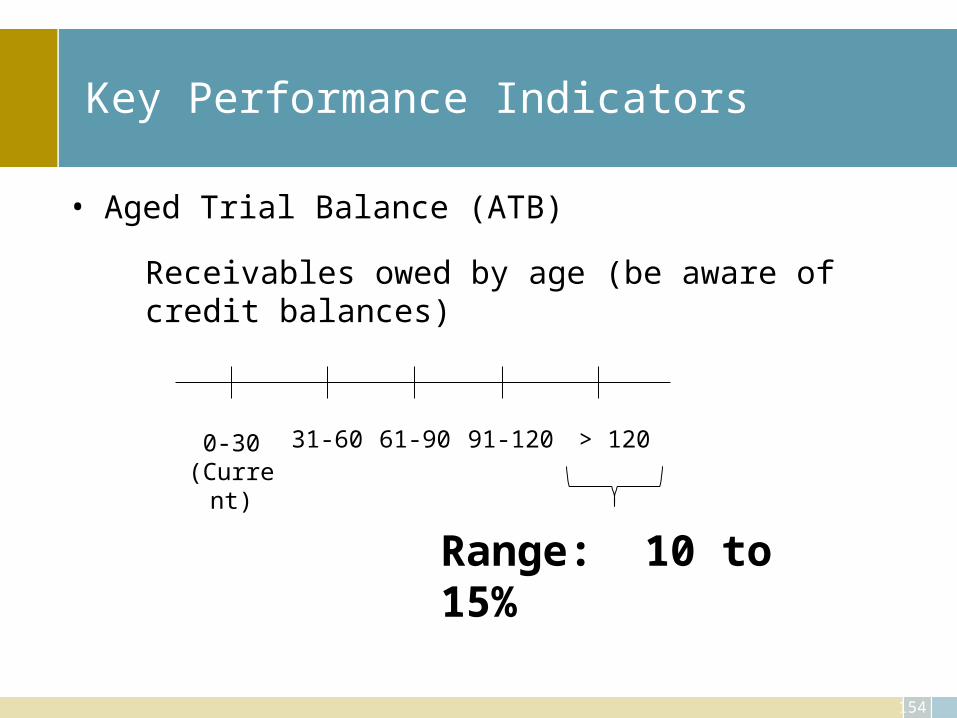
– What is your percentage of accounts receivable over 120 days, the goal is less than 15%!
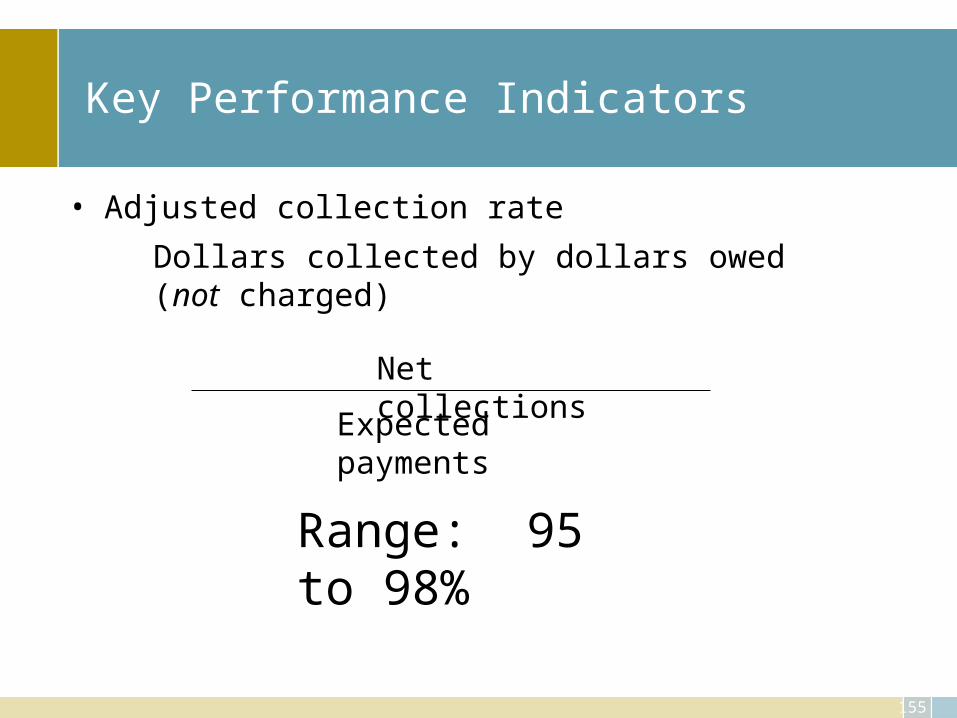
– What is your net collectable percentage (considering contracts you cannot collect 100% of billed charges but per contract how much have you actually collected), goal is 95 – 98%.
– The trend line should note an improvement or certainly not a sliding back.
153
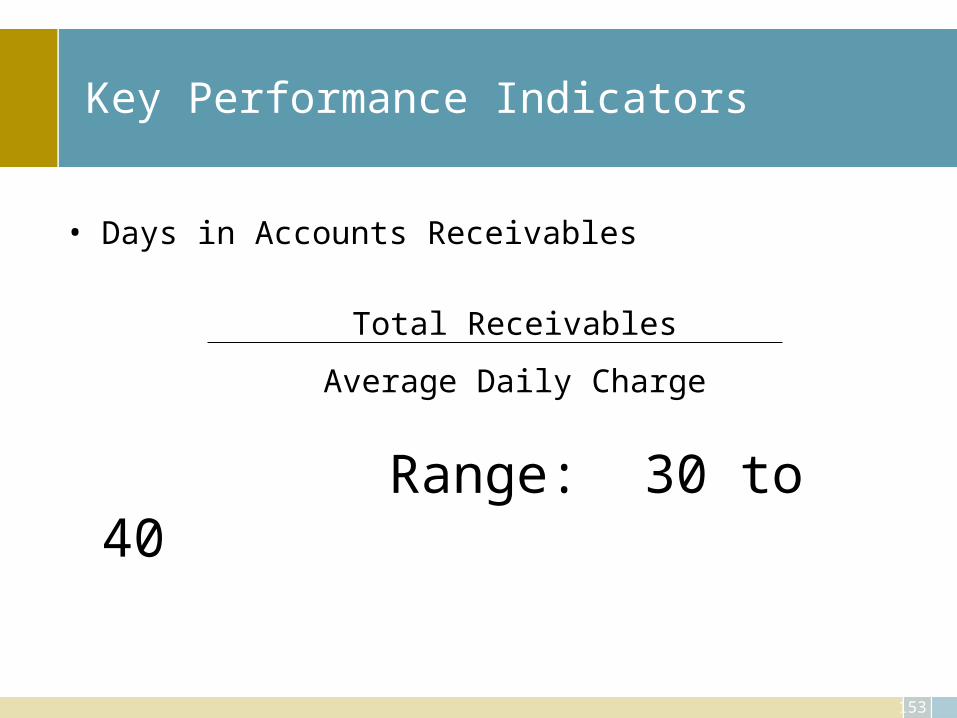
Key Performance Indicators
• Days in Accounts Receivables
Range: 30 to 40
Total Receivables
Average Daily Charge
154
Key Performance Indicators
• Aged Trial Balance (ATB)
Receivables owed by age (be aware of credit balances)
0-30(Curren
t)
> 12061-90 91-12031-60
Range: 10 to 15%
155
Key Performance Indicators
• Adjusted collection rate
Dollars collected by dollars owed (not charged)
Net collectionsExpected
payments
Range: 95 to 98%
Dashboard
156
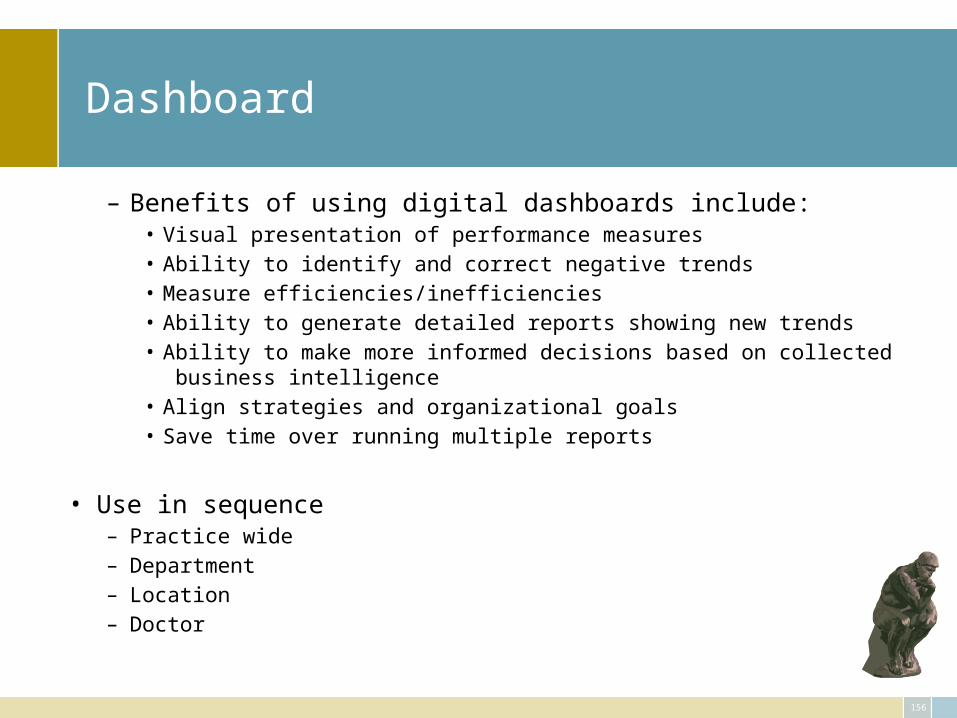
– Benefits of using digital dashboards include:• Visual presentation of performance measures • Ability to identify and correct negative trends • Measure efficiencies/inefficiencies • Ability to generate detailed reports showing new trends • Ability to make more informed decisions based on collected business intelligence • Align strategies and organizational goals • Save time over running multiple reports
• Use in sequence– Practice wide– Department– Location– Doctor
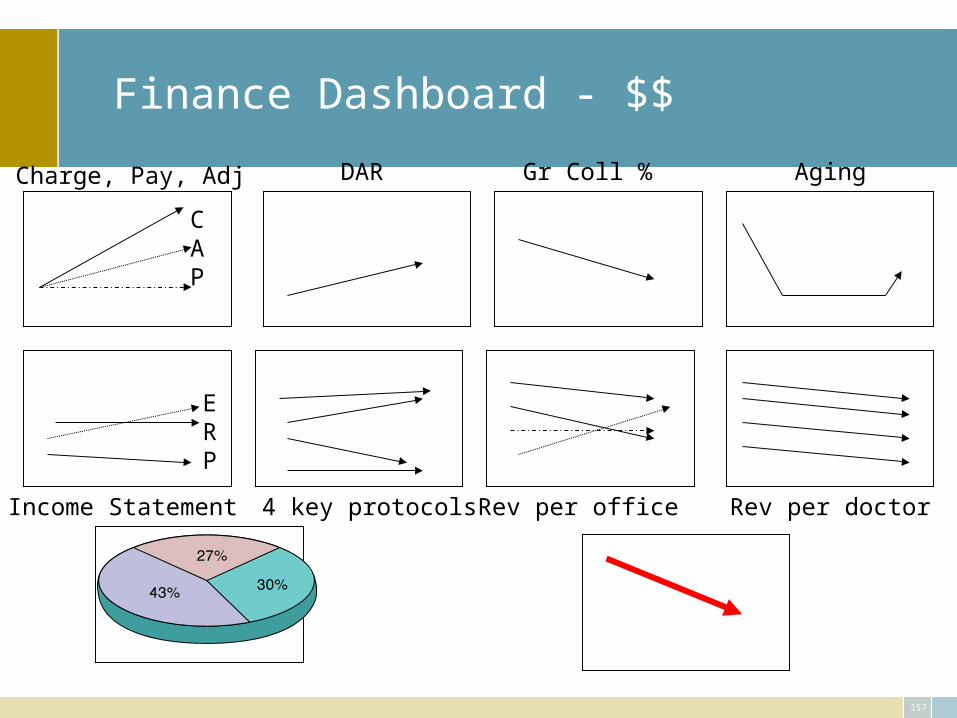
Finance Dashboard - $$
157
CAP
Charge, Pay, Adj DAR Gr Coll % Aging
ERP
Income Statement 4 key protocols Rev per office Rev per doctor
158
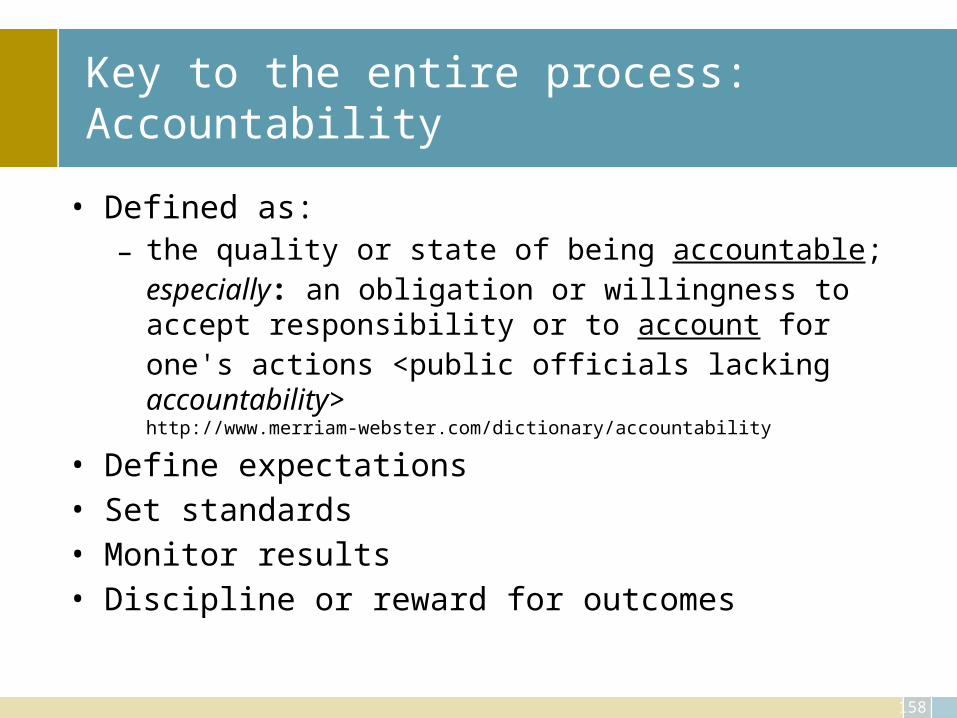
Key to the entire process: Accountability
• Defined as:– the quality or state of being accountable; especially: an obligation or
willingness to accept responsibility or to account for one's actions <public officials lacking accountability> http://www.merriam-webster.com/dictionary/accountability
• Define expectations• Set standards• Monitor results• Discipline or reward for outcomes
159
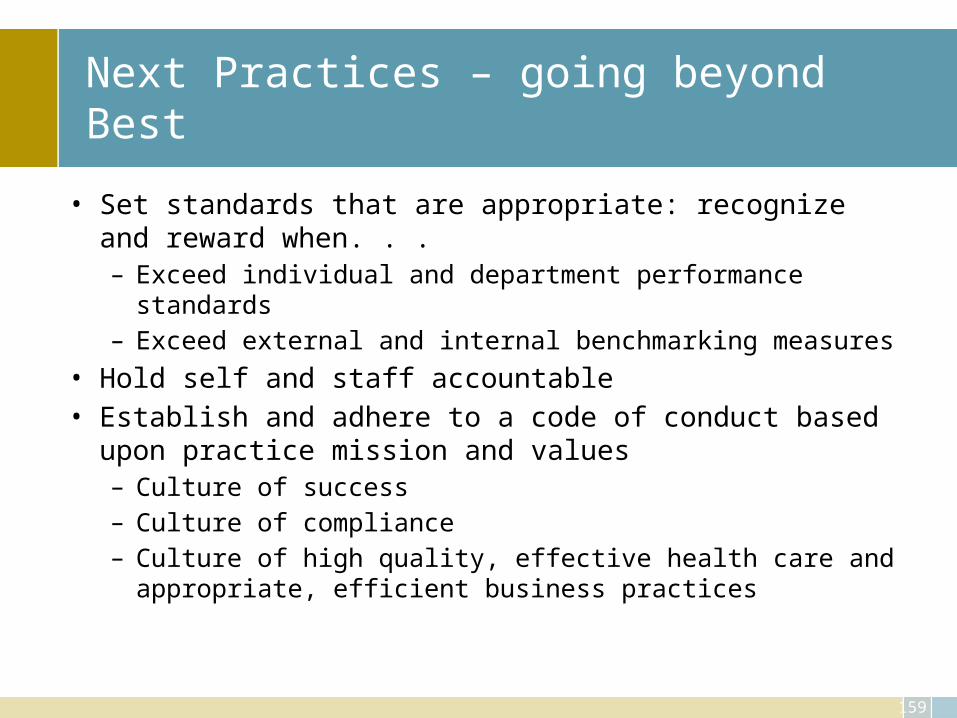
Next Practices – going beyond Best
• Set standards that are appropriate: recognize and reward when. . .– Exceed individual and department performance standards– Exceed external and internal benchmarking measures
• Hold self and staff accountable• Establish and adhere to a code of conduct based upon practice
mission and values– Culture of success– Culture of compliance– Culture of high quality, effective health care and appropriate, efficient
business practices
Staff training
• Train the staff –
– not once but often to insure that • they are aware of the issues at hand • they are doing• they can do to improve.
161
Case studies
Revenue cycle
Cost management
Internal controls
Budget
Contracting

162
Assignment
• Review your case• Answer the questions• Present your findings • Discussion
163
Action Plan
• Cannot overwhelm the staff• Events need to occur orderly• Pursue biggest pay back items first• Detail the plan to all staff• Get all follow up staff to buy in• Use tight time line, with report and end dates• Allow for slippage for things beyond control
164
Conclusion
• Review and tighten up the entire revenue cycle
• Utilize multiple staff and sources to protect and increase efficiency
• Clearly establish guidelines and standards• Hold yourself and all staff accountable
165
Conclusion
• Episodic, bundled or capitation will be part of our future
• Know what your COSTS are• Know the components of each cost category• Prepare for the future NOW• Control the right costs• Seek to improve operations• Patient first, profit will follow