Embed Size (px)
Citation preview

Precise isotope ratio determination of common Pb using quadrupole
LA-ICP-MS with optimized laser sampling conditions and a robust
mixed-gas plasma
Sean A. Crowe, Brian J. Fryer, Iain M. Samson and Joel E. Gagnon
Department of Earth Sciences and Great Lakes Institute for Environmental Research(GLIER), University of Windsor, Windsor, Ontario, Canada N9B 3P4
Received 20th March 2003, Accepted 5th August 2003
First published as an Advance Article on the web 27th August 2003
This work presents a method for the precise (0.2% RSE) determination of common (i.e. non-radiogenic) Pb
isotope ratios using quadrupole Nd:YAG (266 nm) LA-ICP-MS at low (y2 ppm) Pb concentrations. Laser
sampling conditions significantly influence the precision of Pb isotope ratio measurements. This paper presents
a set of optimum sampling conditions for the described system. Setting the laser focus above the sample surface
significantly improves the precision of ratio measurements due to increased count rates and a reduction in the
heterogeneity of particulate matter produced by fracturing at the site of ablation. In addition, using a more
robust, mixed-gas (Ar–N2) plasma significantly increases sensitivity and reduces mass bias. With a mixed Ar–N2
plasma and optimized laser sampling conditions, single collector quadrupole LA-ICP-MS can be superior, for
some applications (e.g., where micrometre-scale spatial resolution is important), to TIMS, and at low Pb
concentrations is a cost-effective alternative to LA-MC-ICP-MS. The application of single detector, quadrupole
LA-ICP-MS to the precise determination of common Pb isotope ratios in minerals has not been previously
documented. This method is a powerful tool for use in isotope tracer studies of ore deposits and has potential
applications to a range of environmental problems.
Introduction
Lead isotopes can be a useful tool in many geological,environmental, and biological investigations. In the U–Th–Pb system, the decay of two long-lived radioactive isotopes ofU (238U and 235U) and the radioactive isotope of Th (232Th)yields three radiogenic isotopes of lead (206Pb, 207Pb and 208Pb,respectively). As a result, Pb-bearing material has a time-dependent Pb isotopic composition that reflects the relativeabundances and decay schemes of the three parent isotopes.Due to its relatively high atomic mass, Pb isotopes are noteasily fractionated by natural chemical or physical processesand are, therefore, primarily changed by radioactive decay ormixing. Therefore, many materials have distinct Pb isotopesignatures that reflect their origin and geological history. Thus,Pb isotope signatures can be used to delineate the sources ofmetals in a variety of systems. The efficacy of the Pb isotopesystem in these applications is limited by the degree to whichsmall differences in ratios can be resolved and by the spatial-scale at which the material can be sampled. Therefore,improvements in both the spatial resolution of samplingtechniques and in analytical precision would enhance theapplication of the Pb isotope system to many problems.Conventional methods for the determination of Pb isotope
ratios involve measurement using either thermal ionizationmass spectrometry (TIMS)1–4 or solution nebulization ICP-MS5–8 (SN-ICP-MS). The TIMS technique has been morewidely used due to its better precision. However, SN-ICP-MSmethods offer a cost effective and relatively rapid technique forinitial screening analyses and can provide moderately preciseisotope ratio measurements in samples with high Pb concen-trations. As a result, considerable effort has been focused onimproving the precision of isotope ratio measurements made byICP-MS techniques.7–11 However, all solution-based methodssuffer from time-consuming dissolution procedures that areespecially sensitive to Pb contamination from the laboratoryenvironment and reagents.12 This severely limits precision and
accuracy and valuable micro-scale information is lost with thedissolution of relatively large quantities of sample material.The use of LA-ICP-MS for micrometre-scale, Pb isotope
ratio determinations was originally proposed by Fryer et al.13
and Feng et al.14 Both groups described a method capable ofyielding moderately precise (1–2% RSD) U–Pb age dates basedon high spatial resolution (y30 mm) analyses of Archeanzircons13,14 and pitchblende.13 Recently, laser ablation coupledwith multiple-collector ICP-MS instrumentation (LA-MC-ICP-MS) has been used to conduct in situ Pb–Pb dating ofapatite, monazite and sphene with a precision of better than1%.15 However, MC-ICP-MS instrumentation is expensive andmust be dedicated to a limited range of isotopes. Furthermore,although multiple ion counting detectors are available for somenew instruments (e.g. Nu-Plasma, Isoprobe and Neptune) theuse of Faraday detectors (which require large ion beams) inmost MC-ICP-MS instruments limits the application of LA-MC-ICP-MS to materials with high Pb concentrations. Theselimitations present the possibility for useful applications ofsingle-detector, quadrupole instruments.This paper examines the use of quadrupole LA-ICP-MS for
common Pb isotope ratio measurements in complex matrices atlow (few ppm) concentrations. Experiments were conductedwhich study the effect of laser sampling conditions and mixedgas plasmas on the precision and accuracy of Pb isotope ratiomeasurements. This paper also presents an example applicationto the determination of Pb isotope ratios in minerals.
Experimental
Sample preparation
NIST 610 series synthetic glass reference materials wereanalysed in the form of polished wafers. The glass waferswere polished for 5 min using 1000 grit silicon carbide powderand for 1 min with 0.05 mm high purity gamma alumina powder(Buehler). The polished wafers were then sonicated for 15 min
DOI: 10.1039/b303225f J. Anal. At. Spectrom., 2003, 18, 1331–1338 1331
This journal is # The Royal Society of Chemistry 2003
Publ
ishe
d on
27
Aug
ust 2
003.
Dow
nloa
ded
by L
omon
osov
Mos
cow
Sta
te U
nive
rsity
on
15/0
2/20
14 1
6:41
:59.
View Article Online / Journal Homepage / Table of Contents for this issue
in ethyl alcohol and for 15 min in ultra-pure Milli-Q distilledwater. Mineral samples were analysed in the form of polished,100 mm thick, thin-sections. Surfaces were re-polished for 1 minwith high purity gamma alumina powder. The polishedsections were then sonicated for 15 min in ethyl alcohol andfor 15 min in ultra-pure Milli-Q water.
Imaging and stage control
Observation during laser ablation was accomplished with aSony analog camera interfaced to a PC with a video capturecard. Image Pro Plus1 image analysis software was used forreal-time imaging, photography, and making spatial measure-ments. A Prior Scientific1 motorized microscope stage,controlled by a Stage Pro1 module in the Image Pro Plus1
software was used for stage translation (x-y-z). Stage move-ment was controlled both manually (using a joystick) and bymacros written in Visual Basic1 within the Image Pro Plus1/Stage Pro1 software. The computer-controlled motorizedstage has a horizontal (x, y) accuracy of ¡1.0 (3s) mm andcan be moved in 2.0 mm steps. Vertical (z) motion wasaccomplished with a Prior Scientific1 focus drive, alsocontrolled in the Image Pro Plus1/Stage Pro1 software. Thefocus drive is capable of a resolution of 0.2 mm.
Micro-sampling
Measurements were made as a single 2-min long signalacquisition with the laser turned on, which followed 30 s ofdata collection on the combined instrument and gas back-ground with the laser beam turned off.16,17 The number ofmeasurements used for a single ratio determination wasselected based on the concentration of Pb in the sample andthe desired precision. As a result, the number of traverses ondifferent minerals varied with Pb content. At low concentra-tions (y2 ppm), 20, 2-min traverses were used for a singleanalysis. This resulted in a total acquisition time of approxi-mately 70 min including measurements of reference materials.Measurements of NIST 612 glass bracketed the mineralsamples and were conducted in the 1st, 2nd, 3rd, 14th, 15th,
26th, 27th and 28th positions of the analysis sequence,respectively. Traverse locations were spaced at greater thanor equal to 150 mm to avoid any possible effects of elementalmigration due to heating.18
Standard sampling conditions (SSC), similar to thosetypically used for trace element analysis in our laboratory,are: a raster rate of 3.6 mm s21, the laser focused 150 mm abovethe sample surface, and no beam restriction. Traverses onthe NIST glass under SSC were 430 mm in length, had awidth of 38 mm, and a depth of 11 mm (sampling 1.86 105 mm3
(0.005 mg) of glass). Traverses on plagioclase feldspar (Ca,Na)[Al1–2Si2–3O8] grains under SSC were 430 mm in length, hada width of 45 mm, a depth of 21 mm, and sampled 4.06 105 mm3
(0.01 mg) of feldspar. Sulfide minerals sampled under SSC hadtraverse widths of 38 mm, lengths of 430 mm, depths of 14 mm,and yielded sample masses of 0.01 mg. The dimensions of thecraters were determined using image analysis. Traverselocations on mineral grains were selected using opticalmicroscopy to avoid visibly recognizable alteration products,inclusions, and fractures.
Laser
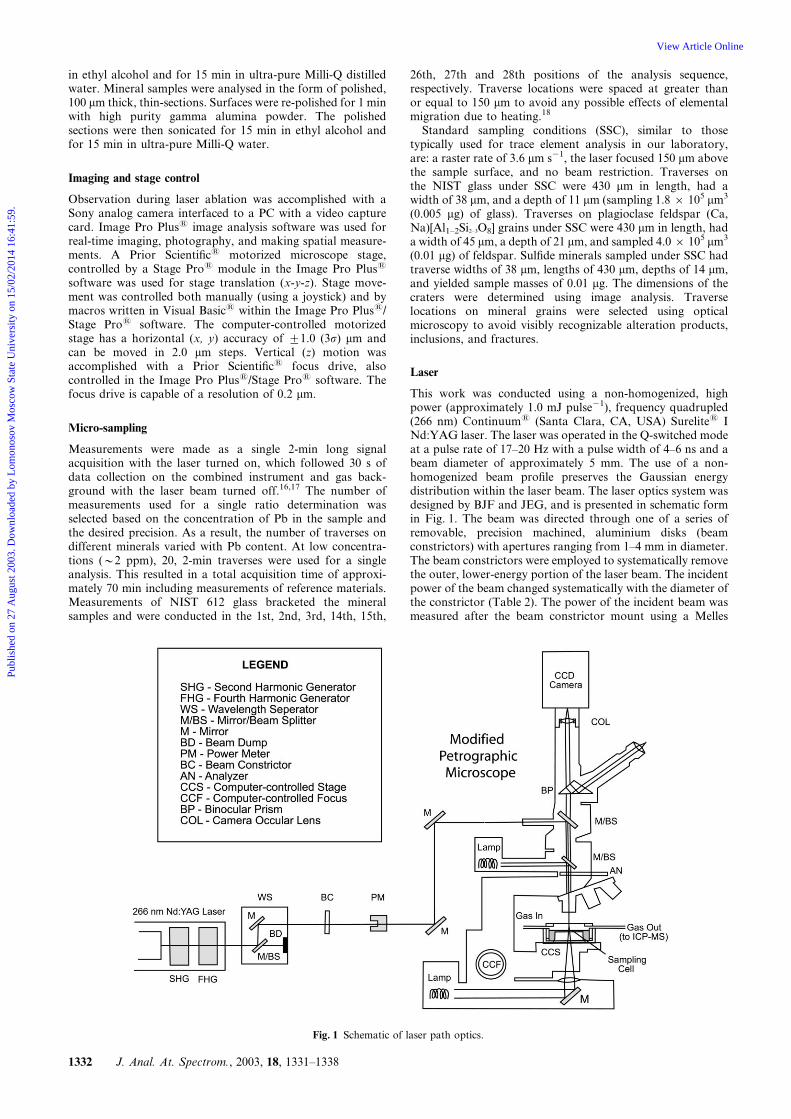
This work was conducted using a non-homogenized, highpower (approximately 1.0 mJ pulse21), frequency quadrupled(266 nm) Continuum1 (Santa Clara, CA, USA) Surelite1 INd:YAG laser. The laser was operated in the Q-switched modeat a pulse rate of 17–20 Hz with a pulse width of 4–6 ns and abeam diameter of approximately 5 mm. The use of a non-homogenized beam profile preserves the Gaussian energydistribution within the laser beam. The laser optics system wasdesigned by BJF and JEG, and is presented in schematic formin Fig. 1. The beam was directed through one of a series ofremovable, precision machined, aluminium disks (beamconstrictors) with apertures ranging from 1–4 mm in diameter.The beam constrictors were employed to systematically removethe outer, lower-energy portion of the laser beam. The incidentpower of the beam changed systematically with the diameter ofthe constrictor (Table 2). The power of the incident beam wasmeasured after the beam constrictor mount using a Melles
Fig. 1 Schematic of laser path optics.
1332 J. Anal. At. Spectrom., 2003, 18, 1331–1338
Publ
ishe
d on
27
Aug
ust 2
003.
Dow
nloa
ded
by L
omon
osov
Mos
cow
Sta
te U
nive
rsity
on
15/0
2/20
14 1
6:41
:59.
View Article Online

Griot1 (Carlsbad, CA, USA) broadband power/energy meterequipped with a large area thermopile, high-density graphitesensor disc. The beam was directed, using two 90u solidaluminium (coated for 266 nm) mirrors, into the laser port ofan Olympus1 (Markham, ON, Canada) BX-51 petrographicmicroscope. The beam was then reflected by a Melles Griot1
266 nm coated mirror and focused using an Optics ForResearch1 (OFR1) (Caldwell, NJ, USA) 266 nm 56 objectivelens.The optics system has been set up to allow versatility
for a wide range of applications. The sample cell wascustom-designed and consisted of a Lexan cylinder with ascrew-top removable lid and a fused silica window. Thesample cell has a volume of approximately 100 ml (whensamples are in the form of thin sections). The ablatedsample material was delivered from the sample cell to theICP-MS via 4 mm inside diameter polyurethane tubing and wasintroduced directly to the ICP torch (a standard 1.5 mm idThermo Elemental1 torch). The transport gas consisted of amixture of ultra-pure nebulizer Ar gas (BOC1, Windsor, ON,Canada) diverted from the ICP-MS and ultra-pure N2 gas(BOC1). The N2 gas was introduced to the Ar nebulizer gasprior to the sample cell using an Aridus1 micro-concentricdesolvating nebulizer. The ratio of nebulizer Ar to N2
(generally 50 : 1) was precisely controlled and was determinedby adjusting the Ar and N2 flow rates to obtain maximumsensitivity.
ICP-MS and data acquisition
The ICP-MS analyses were conducted using a high-sensitivity(450 million cps ppm21 on U using solution nebulization)Thermo Elemental1 (Mississauga, ON, Canada) X-7quadrupole instrument. The X-7 instrument, operated withultra-high purity gases, has very low backgrounds of 15 cpsfor 208Pb and less than 1 cps for 238U and 232Th. The instru-ment was operated in rapid peak jumping mode and datawas acquired for the 206, 207, 208, 232 and 238 massesusing a dwell time of 10 ms and an average settling time of0.8 ms. The commonly used 204Pb isotope was not measuredin this work due to an isobaric interference from 204Hg andthe low (1.4%) natural abundance of 204Pb, which yieldspoor counting statistics. For example, with an instrumentresponse of y15000 cps ppm21, a sample with low Pbconcentration (2 ppm) would yield a signal intensity of
420 cps for the 204Pb isotope. The detailed operating con-ditions are presented in Table 1.
Data reduction and analysis
Data reduction was conducted using commercially availablespreadsheets with macros written in Visual Basic1. Short-terminstrumental drift was corrected based on systematic differ-ences between the NIST glass measurements. During pre-liminary work, a number of data reduction schemes, usingdifferent integration intervals, were investigated. However,although each scheme resulted in different values, no onescheme investigated proved superior to another for this dataset. For consistency, the following procedure was used for allwork reported here. First, 10 sweep means were calculated forindividual isotopes using the raw data produced from theinstrument software. This provided a smoothed signal andallowed the separation of the time-dependent variation in thesignal from the noise. Integration regions were selected visuallybased on the stability of the count rate, from plots of the 10sweep means for a single measurement. The mean count rate ofthe 10 sweep means was then calculated for individual isotopesfrom the selected integration region. Measurement ratios werecalculated by dividing the means of the relevant isotopes: inessence, isotope ratios were calculated as the ratio of the meanintegrated signal intensities. To quantify signal noise (reportedas % RSD), ratios were also calculated from the 10 sweepmeans.
Statistics and measures of precision
Several measures of precision are reported in this work. A briefdiscussion is included here to avoid confusion and allow easycomparison with other work. Repeatability is defined in thisstudy as the precision of ratios calculated from the 10 sweepaverages, and is used as a measure of signal noise. It will bereported as relative standard deviation (RSD) or % RSD and isthe standard deviation of the approximately 130 ratiosobtained from 10 sweep averages divided by the mean ratioof the 10 sweep averages.Reproducibility is the measure of external precision, and is
defined as the precision of N measurements (traverses) madefor a single sample. This is reported as the relative standarderror (RSE) or % RSE. RSE is calculated as the RSD of Nmeasurements divided by the square root of N. Poissoncounting statistics are calculated by dividing the square root ofthe number of counts by the number of counts. For instrumentswith significantly high backgrounds, the background correctedcounting statistics errors for isotope ratio measurements(RSDBCSR) are calculated as in eqn. 1:
RSDBCSR~
ffiffiffiffiffiffiffiffiffiffiffiffiffiffiffiffiffiffiffiffiffiffiffiffiffiffiffiffiffiffiffiffiffiffiffiffiffiffiffiffiffiffiffiffiffiffiffiffiffiffiffiffiffiffiffiffiffiffiffiffiffiffiffiffiffiffiffiffiffiffiffiffiffiffiffiffiffiffiffiffiffiffiffiffiffiffiffiffiffiffiffiffiffiffiffiffiffiffiffiffiffiffin nð Þxzn nð Þb
pn nð Þx{n nð Þb
!2
z
ffiffiffiffiffiffiffiffiffiffiffiffiffiffiffiffiffiffiffiffiffiffiffin dð Þxzn dð Þb
pn dð Þx{n dð Þb
!2vuut (1)
where nx is the total number of counts in the integrated laserablation signal and nb is the total counts on the background(for the same time period) for both the numerator (n) anddenominator (d). As the backgrounds in this work are much
Table 2 The effect of beam restriction on laser power
Aperture diameter/mm Laser power/mJ
— 18.04.0 14.53.5 13.53.0 10.52.5 9.02.0 6.01.5 2.81.0 1.1
Table 1 LA-ICP-MS operating conditions
Laser—Model Continuum Surelite I1
Wavelength 266 nmMode Q-switchedEnergy per pulse 1.0 mJRepetition rate 17–20 HzMicro-concentric desolvating nebulizer—Model Cetac Aridus1
Temperature 70 uCSweep gas 4.27 l min21
N2 38 ml min21
ICP-MS—Model Thermo Elemental X71
Plasma conditions:RF power 1280 WAuxiliary gas flow 0.70 l min21
Nebulizer gas flow 0.75 l min21
Data acquisition:Scanning mode Rapid peak hopDwell time 10 msPoints per peak 1Settling time (average) 0.8 ms
m/z 206, 207, 208, 232, 238
J. Anal. At. Spectrom., 2003, 18, 1331–1338 1333
Publ
ishe
d on
27
Aug
ust 2
003.
Dow
nloa
ded
by L
omon
osov
Mos
cow
Sta
te U
nive
rsity
on
15/0
2/20
14 1
6:41
:59.
View Article Online
lower than the signal intensity the counting statistics error isreduced and it is possible to use the approximation eqn.2:
RSDCSR~
ffiffiffiffiffiffiffiffiffiffiffiffiffiffiffiffi1
nnz
1
nd
s(2)
Results
Focal position
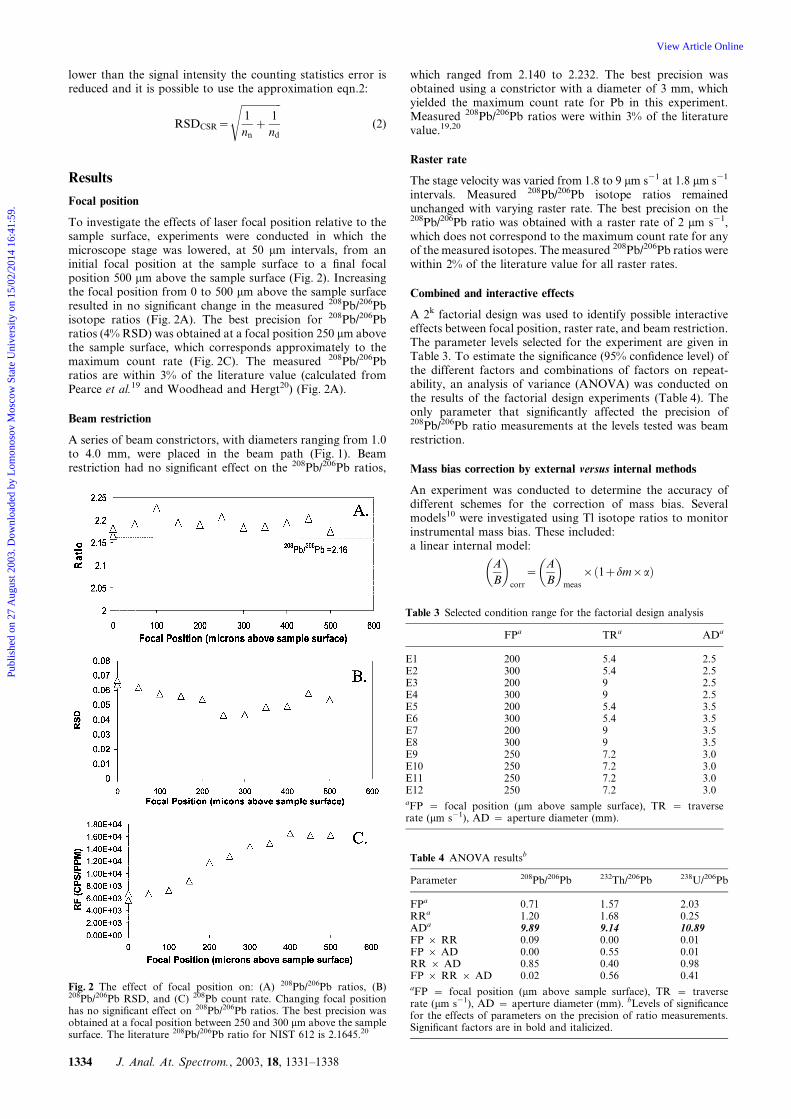
To investigate the effects of laser focal position relative to thesample surface, experiments were conducted in which themicroscope stage was lowered, at 50 mm intervals, from aninitial focal position at the sample surface to a final focalposition 500 mm above the sample surface (Fig. 2). Increasingthe focal position from 0 to 500 mm above the sample surfaceresulted in no significant change in the measured 208Pb/206Pbisotope ratios (Fig. 2A). The best precision for 208Pb/206Pbratios (4% RSD) was obtained at a focal position 250 mm abovethe sample surface, which corresponds approximately to themaximum count rate (Fig. 2C). The measured 208Pb/206Pbratios are within 3% of the literature value (calculated fromPearce et al.19 and Woodhead and Hergt20) (Fig. 2A).
Beam restriction
A series of beam constrictors, with diameters ranging from 1.0to 4.0 mm, were placed in the beam path (Fig. 1). Beamrestriction had no significant effect on the 208Pb/206Pb ratios,
which ranged from 2.140 to 2.232. The best precision wasobtained using a constrictor with a diameter of 3 mm, whichyielded the maximum count rate for Pb in this experiment.Measured 208Pb/206Pb ratios were within 3% of the literaturevalue.19,20
Raster rate
The stage velocity was varied from 1.8 to 9 mm s21 at 1.8 mm s21
intervals. Measured 208Pb/206Pb isotope ratios remainedunchanged with varying raster rate. The best precision on the208Pb/206Pb ratio was obtained with a raster rate of 2 mm s21,which does not correspond to the maximum count rate for anyof the measured isotopes. The measured 208Pb/206Pb ratios werewithin 2% of the literature value for all raster rates.
Combined and interactive effects
A 2k factorial design was used to identify possible interactiveeffects between focal position, raster rate, and beam restriction.The parameter levels selected for the experiment are given inTable 3. To estimate the significance (95% confidence level) ofthe different factors and combinations of factors on repeat-ability, an analysis of variance (ANOVA) was conducted onthe results of the factorial design experiments (Table 4). Theonly parameter that significantly affected the precision of208Pb/206Pb ratio measurements at the levels tested was beamrestriction.
Mass bias correction by external versus internal methods
An experiment was conducted to determine the accuracy ofdifferent schemes for the correction of mass bias. Severalmodels10 were investigated using Tl isotope ratios to monitorinstrumental mass bias. These included:a linear internal model:
A
B
� �corr
~A
B
� �meas
| 1zdm|að Þ (2)
Fig. 2 The effect of focal position on: (A) 208Pb/206Pb ratios, (B)208Pb/206Pb RSD, and (C) 208Pb count rate. Changing focal positionhas no significant effect on 208Pb/206Pb ratios. The best precision wasobtained at a focal position between 250 and 300 mm above the samplesurface. The literature 208Pb/206Pb ratio for NIST 612 is 2.1645.20
Table 4 ANOVA resultsb
Parameter 208Pb/206Pb 232Th/206Pb 238U/206Pb
FPa 0.71 1.57 2.03RRa 1.20 1.68 0.25ADa 9.89 9.14 10.89FP 6 RR 0.09 0.00 0.01FP 6 AD 0.00 0.55 0.01RR 6 AD 0.85 0.40 0.98FP 6 RR 6 AD 0.02 0.56 0.41aFP ~ focal position (mm above sample surface), TR ~ traverserate (mm s21), AD ~ aperture diameter (mm). bLevels of significancefor the effects of parameters on the precision of ratio measurements.Significant factors are in bold and italicized.
Table 3 Selected condition range for the factorial design analysis
FPa TRa ADa
E1 200 5.4 2.5E2 300 5.4 2.5E3 200 9 2.5E4 300 9 2.5E5 200 5.4 3.5E6 300 5.4 3.5E7 200 9 3.5E8 300 9 3.5E9 250 7.2 3.0E10 250 7.2 3.0E11 250 7.2 3.0E12 250 7.2 3.0aFP ~ focal position (mm above sample surface), TR ~ traverserate (mm s21), AD ~ aperture diameter (mm).
1334 J. Anal. At. Spectrom., 2003, 18, 1331–1338
Publ
ishe
d on
27
Aug
ust 2
003.
Dow
nloa
ded
by L
omon
osov
Mos
cow
Sta
te U
nive
rsity
on
15/0
2/20
14 1
6:41
:59.
View Article Online

a power internal model:
A
B
� �corr
~A
B
� �meas
| 1zað Þdm(2)
an exponential internal model:
A
B
� �corr
~A
B
� � dm|að Þ
meas
(2)
and an external model:
AB
� �lit:
AB
� �meas
~a (2)
where (A/B)meas and (A/B)corr are the measured and mass biascorrected isotope ratios, respectively, dm is the difference inmass (amu) between the two isotopes and a is a correctionfactor. The correction factor for the internal models is obtainedfrom the measured proxy isotope ratio by substituting theaccepted value for the corrected value in the appropriatemodel. For the external model, a correction factor (a) wasobtained by dividing the literature value of a reference material(in this case NIST 612 glass) by the measured ratio. Correctionswere then made by multiplying the measured ratios of theunknowns by the calculated correction factor. A series of 8measurements of NIST 612, corrected using a linear model andthe 205Tl/203Tl ratio, yielded mean 206Pb/207Pb and 208Pb/207Pbratios of 1.111 ¡ 0.002 (RSE) and 2.388 ¡ 0.002 (RSE),respectively. Use of the exponential and power models bothresulted in mass bias corrected 206Pb/207Pb ratios of 1.106 ¡
0.002 (RSE) and resulted in corrected 208Pb/207Pb values of2.380 ¡ 0.002 (RSE) and 2.388 ¡ 0.002 (RSE), respectively.
The same 8 measurements yielded mean 206Pb/207Pb and208Pb/207Pb ratios of 1.102 ¡ 0.002 (RSE) and 2.382 ¡ 0.002(RSE) when corrected externally with NIST 612. Using anexternal correction followed by an internal correction using anexponential law resulted in mass bias-corrected ratios of 1.102¡ 0.002 and 2.391 ¡ 0.002 for 206Pb/207Pb and 208Pb/207Pb,respectively. Use of the linear and power models, with theexternal model, in place of the exponential law did notsignificantly improve these values.
Analytical merits of measurements made under OSC
To estimate the best possible precision and accuracy for Pbisotope ratio measurements made at low concentrations underoptimum sampling conditions (OSC) (including precise mea-surements of isotopes of U and Th (OSCPb,Th,U)), usingexternal calibration, an experiment was conducted using NIST614 glass ([Pb] ~ 2.07 ¡ 0.09 ppm).21 Measurements wereconducted using a raster rate of 5.4 mm s21, a 3.0 mm diameterbeam constrictor, and a focal position 300 mm above the samplesurface (Fig. 3). Mean 206Pb/207Pb and 208Pb/207Pb ratios of1.155 ¡ 0.002 (RSE) and 2.416 ¡ 0.001 (RSE), respectively,were obtained from 20 measurements of NIST 614 glasscorrected for mass bias by external calibration with NIST 612(Fig. 3A and B). Externally corrected 232Th/207Pb and238U/207Pb ratios were measured at 1.142 ¡ 0.009 (RSE) and1.518 ¡ 0.005 (RSE), respectively. These measurements areaccurate (compared to literature values calculated fromKurosawa et al.21 and Woodhead and Hergt20) within 0.7%,0.15%, 23%, and 15% for 206Pb/207Pb, 208Pb/207Pb, 232Th/207Pband 238U/207Pb ratios, respectively.
Fig. 3 Results from measurements of 206Pb/207Pb and 208Pb/207Pb ratios on NIST 614 glass. The nominal values are 1.1481 and 2.4124,respectively.20 The Pb concentration is 2.07 ¡ 0.09 ppm.21
J. Anal. At. Spectrom., 2003, 18, 1331–1338 1335
Publ
ishe
d on
27
Aug
ust 2
003.
Dow
nloa
ded
by L
omon
osov
Mos
cow
Sta
te U
nive
rsity
on
15/0
2/20
14 1
6:41
:59.
View Article Online

Application to complex matrices
As a test of the applicability and utility of the quadrupole,single detector LA-ICP-MS instrument for the determinationof Pb isotope ratios in geological materials, a selection ofminerals from the Marathon PGE-Cu deposit was analysed.The Marathon deposit is hosted by a gabbroic unit of the 1.108Ga35 Coldwell Intrusive Complex on the North Shore of LakeSuperior, Ontario, Canada.The concentrations of Pb, Th, and U in stoichiometric
plagioclase (Ca, Na)[Al1–2Si2–3O8] and hornblende Ca2(Mg,Fe)4Al[Si7AlO22](OH)2 has been determined by LA-ICP-MS(Table 5). Pb concentrations in plagioclase are approximately2 ppm with Th and U concentrations of 0.02 ppm and less than0.001 ppm, respectively. Hornblende has much higher Pbconcentrations of 13.6 ppm, and Th and U concentrations of0.22 and 0.5 ppm, respectively. The isotope ratios measured forthese minerals under OSCPb,Th,U are presented in Fig. 4 alongwith the isotope ratios obtained using TIMS38 from the samerocks. The mean 206Pb/207Pb and 208Pb/207Pb ratios obtainedfrom 20 measurements of plagioclase corrected for the in situdecay of U and Th, to 1.108 Ga, are 1.075 ¡ 0.003 (RSE) and2.369 ¡ 0.006 (RSE), respectively. The mean 206Pb/207Pb and208Pb/207Pb ratios obtained from 5 measurements of hornblendeand corrected for the in situ decay of U and Th are 1.059¡ 0.002(RSE) and 2.345 ¡ 0.006 (RSE), respectively. Measuredchalcopyrite (CuFeS2) ratios have means of 1.052 ¡ 0.003(RSE) and 2.354¡ 0.007 (RSE) for 206Pb/207Pb and 208Pb/207Pb,respectively, for 10 traverses and have not been corrected for Uand Th decay. Pyrrhotite (Fe1 2 xS) yielded mean ratios from 20measurements of 1.050¡ 0.004 (RSE) and 2.356¡ 0.008 (RSE)for 206Pb/207Pb and 208Pb/207Pb, respectively.
Discussion
Previous studies have shown that the precision and accuracy ofquadrupole LA-ICP-MS isotopic measurements are limited
primarily by counting statistics and instrumental massbias.13,15,22–25 In this work, efforts to optimize the externalprecision (reproducibility) of Pb isotope ratio measurements, atlow concentrations, are based on maximizing the count rateand the within-run repeatability (i.e. minimizing signal noise)for the desired ratios, and stabilizing mass bias. From theexisting literature13,14,17,26–32 and preliminary investigations33
we identified three conditions, namely, laser focus position,raster rate, and beam restriction, as having the largest effect oncount rate at equivalent incident power, repetition rate andwavelength.
Poisson counting statistics
Fryer et al.13 showed that LA-ICP-MS isotope ratio precisionwas predominantly a function of Poisson counting statisticsand suggested that using a more sensitive ICP-MS should yieldbetter isotope ratio precision. Adding N2 to the nebulizer gasflow significantly increases (by a factor of up to 2–3 times)sensitivity in the low mass region and results in 238U sensitivityof up to 1 billion cps ppm21 in solution mode using a micro-concentric desolvating nebulizer. In addition to the ICP-MSsensitivity, we have found that laser conditions significantlyinfluence the count rate in laser ablation analyses.The precision of Pb/Pb ratios varies considerably with
changes in focal position, beam restriction, and raster rate.Although the maximum repeatability was generally obtainedunder the conditions that yielded the highest count rate, someexceptions were observed. Focal positions of 250 and 300 mmabove the sample surface yielded Pb isotope ratios with arepeatability of 4%. Although focal positions at a greaterdistance from the sample surface resulted in an increase incount rate, the repeatability decreased, with RSDs becominggreater than 5% at focal positions greater than 450 mm abovethe sample surface. Beam constrictors with diameters of greaterthan 3.0 mm yielded the best Pb isotope ratio precision at 4%RSD. In our investigation of the use of constrictors, the
Table 5 Pb, Th and U content of Marathon minerals
Sample Mineral n Pb (ppm) Th (ppm) U (ppm)
G-11-4 Plagioclase 9 2.29 0.02 0.0003G-10-2 Hornblende 1 13.60 0.22 0.057Detection limit (3 SD background) 0.0006 00005 0.000 01
Fig. 4 Results from measurements of 206Pb/207Pb and 208Pb/207Pb ratios on plagioclase (PLAG), chalcopyrite (CPY), pyrrhotite (PO) andhornblende (HBLD) from theMarathon deposit. HBLDave is the mean of the five plotted hornblende measurements. Hornblende has been correctedfor in situ production of radiogenic Pb. LA-ICP-MS corrected (PLAG) has also been corrected for the in situ production of radiogenic Pb. Error barsare the standard deviation of n measurements. HBLD points represent single measurements and so error bars are not shown.
1336 J. Anal. At. Spectrom., 2003, 18, 1331–1338
Publ
ishe
d on
27
Aug
ust 2
003.
Dow
nloa
ded
by L
omon
osov
Mos
cow
Sta
te U
nive
rsity
on
15/0
2/20
14 1
6:41
:59.
View Article Online

maximum precision was obtained using the constrictor thatyielded the highest count rate for Pb. In contrast to the effectsof focal position and beam restriction, the best Pb/Pb precisionwas obtained at a raster rate of 2 mm s21, which, interestingly,corresponds to the lowest count rate for Pb. In addition toaffecting count rate, laser-sampling conditions also influencethe degree of heterogeneity of the particulate materialproduced at the site of ablation. The optimum samplingconditions reflect not only the best count rate but also thedegree of homogeneity in the material produced by laserablation under these conditions. Based on these experiments,the OSC for obtaining precise Pb/Pb ratios (OSCPb) were afocal position of 300 mm above the sample surface, beamrestriction with a 3.0 mm constrictor and a raster rate of2 mm s21. These are different than OSCPb,Th,U which are usedwhen small corrections for the production of radiogenic Pb areimportant. An investigation of the combined effects showedthat interactive effects between conditions were negligible withrespect to precision. Under OSCPb,Th,U the external reprodu-cibility of uncorrected measurements closely approximates thatof counting statistics. Twenty measurements of the 206Pb/207Pband 208Pb/207Pb ratios of NIST 614 glass result in an externalreproducibility of 0.2% RSE. This corresponds to a s ratio,13
which is defined as:
s ratio~RSD of N measurements½ �
RSDCSR(2)
where RSDCSR is the counting statistics error (eqn. 2) of 1.4and 1.2, respectively. This is marginally better than the value of1.5 obtained by Fryer et al.:13 however, it is important to notethat the counting statistics error has been greatly reduced byincreased sensitivity. The s ratio values of 232Th/207Pb and238U/207Pb are 68 and 46, respectively, indicating thatadditional factors affect precision.
Mass bias
Several studies5,16,34 have described the mass discrimination, ormass bias, effects in ICP-MS that result from non-equivalentsensitivities for different masses, according to models (i.e.,linear, exponential, and power) that were originally proposedfor sector field TIMS mass spectrometers and include massfractionation. However, several other studies have shown thatmass discrimination in plasma-based instruments is notaccurately described by such models.6,10,30 An externalcorrection scheme was proposed30 in which a correctionfactor was calculated from the difference in SRM values,measured before and after the unknowns, and known ratios.The use of both correction schemes has been investigated and itwas found that the external model was more accurate.However, the internal models may be more robust and as aresult may produce more reproducible results in the long term.This possibility needs to be investigated. The ability to use theexternal calibration scheme in this work is enhanced by therelatively flat response of the X7 instrument over a large rangeof masses with the introduction of N2 to the nebulizer gas. Forexample, the mass bias correction in this work is only 0.2% peramu in comparison to the 1.5% per amu observed in the studyof Horn et al.34 using a PQ II1, or the 0.9% per amu observedby Belshaw et al.11 using a Nu-plasma MC-ICP-MS. Themagnitude of the mass bias correction (0.2% amu21) obtainedusing the Ar–N2 plasma approaches that of TIMS instruments(0.1% amu21).12 In addition, mass bias drift within runs andbetween runs was insignificant compared to counting statisticserror.
Application to complex matrices
LA-ICP-MS measurements of the Pb isotope composition ofplagioclase from the Marathon deposit are in good agreement
with the ratios obtained using TIMS35 for plagioclase separatesfrom the same rocks. Obtaining the same ratio by LA-ICP-MSgives confidence in the accuracy of the external mass biascorrection scheme used. In addition, the external reproduci-bility (RSE), 0.003 and 0.006 for 206Pb/207Pb and 208Pb/207Pb,respectively, of the measurements made on plagioclase isequivalent to that obtained for the same number of measure-ments made on NIST 614 glass. Thus, the OSC designed toobtain high precision measurements using NIST glass areapplicable to minerals with similar Pb and major elementcompositions. Furthermore, the measurements made by LA-ICP-MS under OSCPb,Th,U have comparable precision (0.3%RSE) to those made by TIMS (0.4%)35 despite the muchsmaller sampling volume.The precision of Pb isotope ratio measurements made by
LA-ICP-MS under OSCPb,Th,U have proven to be sufficient todiscern differences in the Pb isotope composition betweendifferent minerals in the same rocks. At Marathon, this couldhave important implications in studies regarding differentmodels proposed for the genesis of the PGE–Cu mineralizationin these rocks.36
Conclusions
Quadrupole LA-ICP-MS is capable of producing precise (0.2%RSE on NIST 614 glass) and accurate (¡ 0.7% on NIST 614glass) Pb isotope ratio measurements of silicate and sulfideminerals at lowy2.0 ppm Pb concentrations. This capability isparticularly useful for isotope tracer studies using common Pb,where elemental fractionation between U, Th and Pb is notcritical. We have confirmed that, as shown by Fryer et al.,13
isotope ratio precision is primarily a function of countingstatistics, and that the count rate can be maximized byoptimizing laser sampling conditions and using an Ar–N2
plasma. The degree of variability between traverses on the samematrix is related to signal noise, which is significantly affectedby the focus and raster rate. Thus, to maximize precisionbetween samples, it is necessary to be able to accuratelyreproduce the raster rate and focal position. Furthermore, wehave found that applications of the classical mass bias laws donot work well at the high count rates, and low (0.2%) degree ofinstrumental mass bias, of measurements made in this study.As a result, it is best to use an external calibration scheme,which brackets unknown samples with SRMs. UnderOSCPb,Th,U, Pb isotope ratio measurements of common Pbusing LA-ICP-MS are much better than those reported for highresolution SIMS.37 The SIMS method described by Belshawet al.37 yielded a precision of 1% (RSE) for measurements of206Pb/207Pb in NIST 610 (422 ppm Pb), whereas we have beenable to obtain a precision of 0.2% (RSE) for 206Pb/207Pb inNIST 614 (y2 ppm Pb). This is largely a function of enhancedsensitivity and hence better counting statistics when using LA-ICP-MS. Similarly, Compston et al.38 obtained a precision of1.3% (RSE) for measurements of 206Pb/207Pb ratios in plagio-clase feldspars (approximately 3 ppm Pb) using SHRIMP.We have obtained better precision (0.3% RSE) for 206Pb/207PbPb isotope ratios of plagioclase with similar (2 ppm) Pbconcentrations.Measurements of Pb isotope ratios in NIST 611 (422 ppm
Pb) by LA-MC-ICP-MS yielded 206Pb/207Pb ratios with aprecision of 0.02% (RSE).16 In comparison, Pb isotope ratios ofNIST 610 by LA-ICP-MS under OSCPb,Th,U would yield aprecision of approximately 0.04% (RSDCS) based on a s ratioof 1.4. Thus, under optimized laser sampling conditions, usingmixed gas (Ar–N2) plasma, LA-ICP-MS is a cost effectivealternative to TIMS, SHRIMP or MC-ICP-MS for makingprecise Pb isotope ratio measurements at low concentrations.A detailed comparison of measurements made over a rangeof concentrations using laser ablation coupled to different
J. Anal. At. Spectrom., 2003, 18, 1331–1338 1337
Publ
ishe
d on
27
Aug
ust 2
003.
Dow
nloa
ded
by L
omon
osov
Mos
cow
Sta
te U
nive
rsity
on
15/0
2/20
14 1
6:41
:59.
View Article Online

MC-ICP-MS instruments equipped with ion-counting detec-tors and quadrupole ICP-MS instruments would be useful. Theeffect of adding N2 to the nebulizer gas on isotope ratioprecision should also be investigated using MC-ICP-MS.
Acknowledgements
This work was supported by NSERC CRD and CFI/OITgrants to IMS and BJF and NSERC discovery grants to IMSand BJF. Dr. Henry Longerich is thanked for an insightfulreview. Dr. John Greenough, Lachlan MacLean, Dr. DavidFowle, J.-C. Barrette, Dr. Shaunquan Zhang, and Dr. MikeHarris are thanked for helpful suggestions. Johari Pannalal andScott Song are acknowledged for comments and suggestions.This paper also benefited from the suggestions of ananonymous reviewer. John Robinson is thanked for helpwith SEM imaging.
References
1 T. E. Krogh, Geochim. Cosmochim. Acta, 1973, 37, 485.2 F. Tera and G. J. Wasserburg, Anal. Chem., 1975, 47, 2214.3 T. E. Krogh, Geochim. Cosmochim. Acta, 1982, 46, 637.4 B. Kober, Contrib. Mineral. Petrol., 1986, 93, 482.5 H. P. Longerich, B. J. Fryer and D. F. Strong, Spectrochim. Acta,
Part B, 1987, 42, 39.6 T. A. Hinners, E. M. Heithmar, T. M. Spittler and J. M. Henshaw,
Anal. Chem., 1987, 59, 2658.7 J. R. Encinar, J. I. Garcia Alonso, A. Sanz-Medel, S. Main and
P. J. Turner, J. Anal. At. Spectrom., 2001, 16, 315.8 S. Erlich, Z. Karpas, L. Ben-Dor and L. Halicz, J. Anal. At.
Spectrom., 2001, 16, 975.9 L. Halicz, Y. Erel and A. Veron, At. Spectrosc., 1996, 17, 186.10 F. Monna, J.-L. Loizeau, B. A. Thomas, C. Gueguen and
P.-Y. Favarger, Spectochim. Acta, Part B, 1998, 53, 1317.11 N. S. Belshaw, P. A. Freedman, R. K. O’Nions, M. Frank and
Y. Guo, Int. J. Mass Spectrom., 1998, 181, 51.12 M. F. Thirwall, Chem. Geol., 2000, 163, 299.13 B. J. Fryer, S. E. Jackson and H. P. Longerich, Chem. Geol., 1993,
109, 1.14 R. Feng, N. Machado and J. Ludden, Geochim. Cosmochim. Acta,
1993, 57, 3479.15 B. J. A. Willigers, J. A. Baker, E. J. Krogstad and D. W. Peate,
Geochim. Cosmochim. Acta, 2002, 66, 1051.16 J. N. Christensen, A. N. Halliday, L. V. Godfrey, J. R. Hein and
D. K. Rea, Science, 1997, 277, 913.
17 X.-H. Li, X.-R. Liang, M. Sun, H. Guan and J. G. Malpas, Chem.Geol., 2001, 175, 209.
18 T. E. Jefferies, N. J. G. Pearce, W. T. Perkins and A. Raith, Anal.Commun., 1996, 33, 35.
19 N. J. G Pearce, W. T. Perkins, J. A. Westgate, M. P. Gorton,S. E. Jackson, C. R. Neal and S. P. Chenery, Geostand. Newsl.,1997, 21, 115.
20 J. D. Woodhead and J. M. Hergt, Geostand. Newsl., 2001, 25, 261.21 M. Kurosawa, S. E. Jackson and S. Sueno, Geostand. Newsl., 2002,
26, 75.22 B. J. Fryer, S. E. Jackson and H. P. Longerich, Can. Min., 1995,
33, 303.23 H. P. Longerich, S. E. Jackson and D. Gunther, J. Anal. At.
Spectrom., 1996, 11, 899.24 H. P. Longerich, D. Gunther and S. E. Jackson, Fresenius’ J. Anal.
Chem., 1996, 355, 538.25 D. J. Scott and G. Gauthier, Chem. Geol., 1996, 131, 127.26 P. M. Outridge, W. Doherty and D. C. Gregoire, Spectrochim.
Acta, Part B, 1996, 51, 1451.27 O. V. Borisov, X. Mao and R. E. Russo, Spectrochim. Acta, Part
B, 2000, 55, 1693.28 H. Liu, O. V. Borisov, X. Mao, S. Shuttleworth and R. E. Russo,
Appl. Spectrosc., 2000, 54, 1435.29 M. Motelica-Heino, P. Le Coustumer and O. F. X. Donard,
J. Anal. At. Spectrom., 2001, 16, 542.30 S. Aries, M. Motelica-Heino, R. Fredier, T. Grezes and M. Polve,
Geostand. Newsl., 2001, 25, 387.31 M. Guillong and D. Gunther, J. Anal. At. Spectrom., 2002, 17,
831.32 N. Machado and A. Simonetti, GAC-MAC Abstr. Program, 2002,
27, 70.33 S. A. Crowe, B. J. Fryer, I. M. Samson, C. T. Barrie and
P. C. Walford, GAC-MAC Abstr. Program, 2002, 27, 24.34 I. Horn, R. L. Rudnick and W. F. McDonough, Chem. Geol.,
2000, 167, 405.35 L. M. Heaman and N. Machado, Contrib. Mineral. Petrol., 1992,
110, 289.36 C. T. Barrie, A. D. MacTavish, P. C. Walford, R. T. Chataway
and R. Middaugh, in The Geology, Geochemistry, Mineralogy, andMineral Benefication of Platinum-Group Elements, ed. L. J. Cabri,Canadian Institute of Mining and Metallurgy, 2000.
37 N. S. Belshaw, R. K. O’Nions, D. J. Martel and K. W. Burton,Chem. Geol., 1994, 112, 57.
38 W. Compston, I. S. Williams and C. Meyer, in Stable IsotopeGeochemistry: A tribute to Samuel Epstein, ed. H. P. Taylor Jr.,J. R. O’Neil and I. R. Kaplan, Geochem. Soc., Spec. Publ., 1991,No. 3.
1338 J. Anal. At. Spectrom., 2003, 18, 1331–1338
Publ
ishe
d on
27
Aug
ust 2
003.
Dow
nloa
ded
by L
omon
osov
Mos
cow
Sta
te U
nive
rsity
on
15/0
2/20
14 1
6:41
:59.
View Article Online