Embed Size (px)
Citation preview

www.norsonic.com
Product Data
Innovative sound instrumentation
Applications
• Environmental noise• Building acoustics• Sound intensity• Noise monitoring• Product noise testing• Noise in the workplace• Infrasound• Noise nuisance recorder• Front end for Nor850• General noise and vibration measurements
Precision Sound & Vibration AnalyserNor150

2
Sound & Vibration Analyser Nor150
General features, common for all measurement modes
• High Precision Class 1 sound level meter and frequency analyser.
• Single or dual channel.
• Large colour touch-screen (4.3”).
• Real keyboard for quick operation in challenging environments.
• Intuitive user interface with graphical icons for selection of measurement mode and custom-made user setups.
• Built in webserver for communication through the internet from anywhere in the world via LAN, USB, WLAN, 3G/4G modem.
• Voice and text notes, built in GPS and camera help you document your measurements.
• Wide frequency range for vibration and low frequency measurements (0,4 Hz – 20kHz in 1/3 octave band).
• 120dB measurement range.
• Extensive trigger system for reports, audio recording and camera.
• Seamless integration with Nor850 software.
• Multi language support.
• Extensive on board help system.
The Nor150 is a multi-tool covering a variety of applications such as Environmental Noise assessments, Building Acoustics, Sound Intensity, Noise at workplace and more.
It sets new standards in user-friendliness and sophistication not yet found in any other Sound Level Meter on the market. The robust design combined with a vast range of measurement application covered in one unit, makes this the natural choice for every professional acoustician.
Featuring a large 4.3” true color touchscreen, the Nor150 provides user friendliness of a smartphone. Further features include; two measurement channels, built in web server, camera, GPS and advanced voice and text notes bring-ing the sophistications normally found in laboratory instrumentation out in the field. Connect your smartphone, pad or PC and take full control of the instrument. Add photos and voice notes obtained on your smartphone or pad seamless integrated with markers to your noise data.
Nor150 is seamless integrated with the Norsonic range of post processing and reporting programs, as the Nor850 multi-channel measurement platform and NorReview. It has never been easier to export data to third party tools like Matlab® or further process the data in Excel®.
Startup application menu
The Nor150 covers a wide range of measurement applications and thus a number of various measurement parameters in addition to an extensive way of displaying the parameters in the frequency and time domain.
The configuration and use of the instrument however is easy and intuitive. At the startup, an application setup menu with icons appears where you select what application you want to work with.
You may also create your own favorite setups and chose to display them in the same menu. These are listed as smaller icons. A set of factory preset setups are also available, indicated with an orange frame around the icon. The factory preset icons are country dependent. Thus, you don’t need to scroll through setups for national standards not applicable for your country.

3
Sound & Vibration Analyser Nor150
The instrument case is designed around a sturdy milled aluminium frame combined with a moulded plastic housing. Personalize your instrument by lazer marking your company logo and name.
On the right hand side is the power socket, Trigger input and output for synchronized sampling of several Nor150. Also the Norsonic standard 15 pin digital I/O hosting a high speed RS232 interface, 3 digital input, 4 digital outputs, Signal generator, AC output, SPDIF and 3,3Vdc - 50 mA power for auxiliary equipment
Innovative design for simplifying measurements
Optional 2nd Input channel on left side. All input connectors are protected from dust and rain by silicone rubber covers.
Optional built in Camera and GPS. Status LED provides useful information
by changing colour such as measure-ment running, overload, battery low, audio recording etc.
Backlit keyboard and display. To extend battery time, both brightness and time-out is adjustable in the power setting menu.
Built in LAN, USB A and mini B connectors, Micro SD card and Headset connector for voice comments and audio recording playback. WLAN and GPRS/3G-4G modems through USB.
The battery pack has a built in battery gauge. Batteries can be easily replaced in field. Charging time is 2 hours. Battery lifetime is dependent on use and connected accessories. Typical time is 8 hours.

4
Sound & Vibration Analyser Nor150
User interfaceThe Nor150 features a graphical touch interface like a smart phone. In addition, we included a real keyboard for demand-ing field application where a touch interface may be chal-lenging to operate. Setting up the analyser and working with post processed data uses the touch display. For measurement control and during a measurement you may choose to use the real push buttons.
The Nor150 can be configured with different types of display views. A selection of graphical displays, such as Level versus Frequency, Level versus Time and Sound Level Meter view are available. You may configure up to four different views, and toggle through the views with the View button. A view can be single or dual view. The dual view, or split screen, gives you the option to combine such as a Level vs. Frequency display with a Level vs. time display. This combination is especially useful when you do multispectral analysis and want to maneuver both in the time and frequency domain. Different display views are available, dependent on what measurement mode you are working with; Environmental, Building Acoustics or Sound Intensity.
Switch between graphical and numerical/table display. Each graphical display has an associated numerical display.
A graphical display can display up to 3 different measurement functions in one graph. If you have selected more than 3 functions to be measured, you can use the FUNC button to scroll through the measured function.
Information button. The info screen shows important measurement settings or shows useful hints about error messages and field indicators.
Calibration button. Activates the calibration functions.
Memory button access the memory system.
Exits a menu without doing your modifications.
Starts a measurement or Stops an ongoing measurement.
Cursor buttons Keys for moving the cursor in graphical and tabular displays .
Exits the current menu and stores/accept your current selections.
On/Off / Lock Keyboard button.
Pause/continue. Temporarily stop measured data to go into the global results. The pause is a toggle style func-tion. It includes a graphical back-erase function.
Setup button access the menu system.

5
Sound & Vibration Analyser Nor150
Status bar
Measurement picture
Soft Key Bar
The status barThe status bar at the top of the display provides useful information about the instrument and the on-going measurement.
1. Battery gauge
2. Overload indication
3. Measurement status – Ready, waiting for trigger, running, pause, ended, stored, locked
4. Application mode
5. Real time clock in ready mode. In all other modes the measurement time is displayed
6. Help function
The status bar is not displayed in the menus.
1 2 3 4 5 6
The status bar
The measurement functions and time profile concept.The Nor150 basic configuration is fitted with parallel detection of Fast, Slow and Impulse time constants and the A, C and Z spectral weighting functions. The measurement parameters are;
SPL The instantaneous Sound Pressure Level
Lmax The Maximum Sound Pressure Level time weighted
Lmin The Minimum Sound Pressure Level time weighted
Leq The Integrated Averaged SPL
LEqI Impulse weighted Time Average SPL
LE The Sound Exposure Level
LPEAK The Maximum Peak Level
Ln Statistical functions
TMAX5 “Takt Maximal” – a special parameter measured mainly in Germany
The time profile concept, named level versus time profile, also known as electronic level recorder is a part of the basic func-tionality. Three time profiles are available, Profile A, Profile B and Profile Moving. Profile A is the main profile from where the two others are extracted. The resolution of time profile A can be set to any value between 5ms to 24 hours. Profile B has a resolution starting from 1 sec. Profile A is set to 1 sec if profile B or Moving is activated. The advantage by having more than one time profile is to measure some values with high resolution (profile A) and let the Profile B measure values with a longer time interval.
The soft key bar in the bottom of the display holds different functions dependent on which menu or display you are in.
Even though the instrument is easy and intuitive to use an extensive on-line help is availble. Just push the ? to access the help for for the current display you are in. In addition, you may search for a keyword or look it up in the index.
6
Sound & Vibration Analyser Nor150
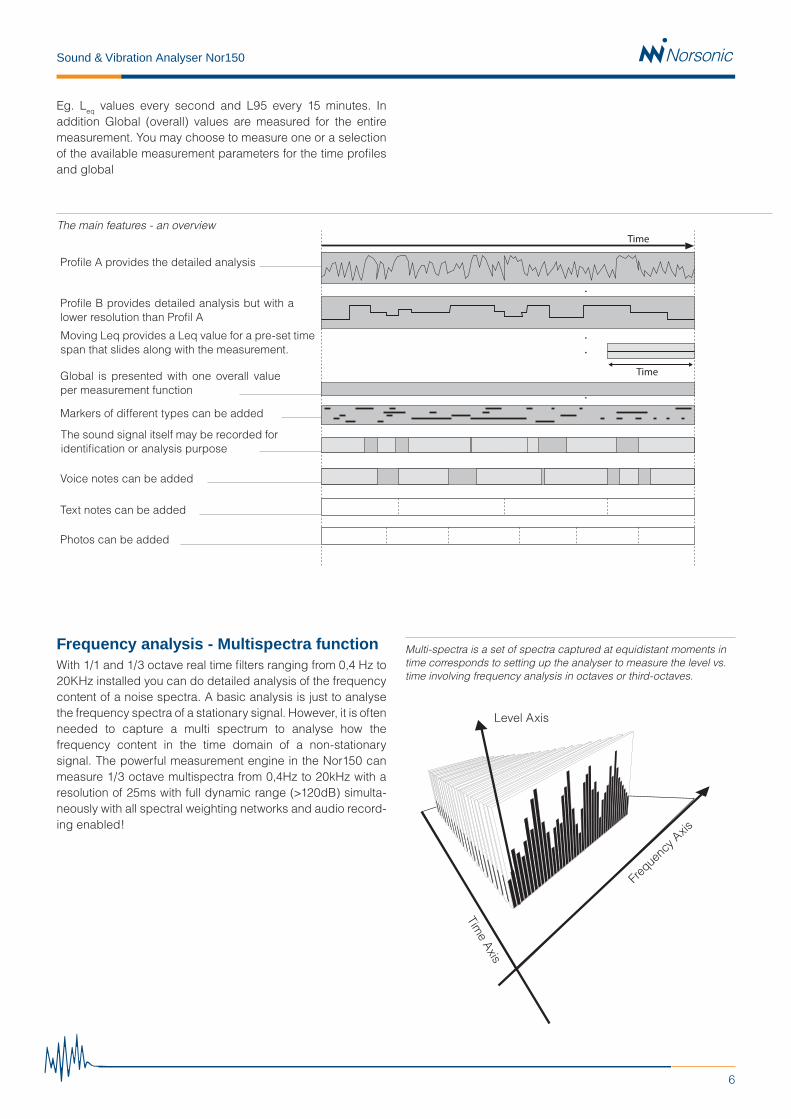
Eg. Leq values every second and L95 every 15 minutes. In addition Global (overall) values are measured for the entire measurement. You may choose to measure one or a selection of the available measurement parameters for the time profiles and global
Frequency analysis - Multispectra functionWith 1/1 and 1/3 octave real time filters ranging from 0,4 Hz to 20KHz installed you can do detailed analysis of the frequency content of a noise spectra. A basic analysis is just to analyse the frequency spectra of a stationary signal. However, it is often needed to capture a multi spectrum to analyse how the frequency content in the time domain of a non-stationary signal. The powerful measurement engine in the Nor150 can measure 1/3 octave multispectra from 0,4Hz to 20kHz with a resolution of 25ms with full dynamic range (>120dB) simulta-neously with all spectral weighting networks and audio record-ing enabled!
Profile A provides the detailed analysis
Markers of different types can be added
The sound signal itself may be recorded for identification or analysis purpose
Voice notes can be added
Text notes can be added
Photos can be added
Global is presented with one overall value per measurement function
Profile B provides detailed analysis but with a lower resolution than Profil A
Moving Leq provides a Leq value for a pre-set time span that slides along with the measurement.
The main features - an overview
Multi-spectra is a set of spectra captured at equidistant moments in time corresponds to setting up the analyser to measure the level vs. time involving frequency analysis in octaves or third-octaves.
Freque
ncy A
xis
Time Axis
Level Axis

7
Sound & Vibration Analyser Nor150
Large display – intuitive useThe Nor150 offers you several ways of composing a set of display views that provides maximum information for your measurement application. Up to 4 different display views may be configured and scrolled through with the VIEW button, before, during and after a measurement sequence. You easily compose a view from a selection of available graphs, such as level versus time display, level versus frequency display, sound level meter display or cumulative and probability distribution display. A display view may be a single view or dual view. Each graphical display is accomplished by a nu-merical display. Just push the TBL button to toggle between numerical and graphical view.
If more than 3 parameters are measured you can toggle through the different parameters using the FUNC button. One measurement parameter may be locked to the view so that it always is displayed while scrolling through the other available parameters.
Measurement data from both channels may be combined into one graphical view.
Your graphical view configuration is stored together with the measurement and may also be stored as a user-defined setup.
Level vs time
The single view of the level vs time display consists of a main window displaying up to three values simultaneously. Markers are indicated by bold horizontal lines. Markers can indicate an audio recording or a manual inserted marker. A dotted horizontal line indicates a single marker, such as a triggered picture or a manual inserted single marker.
The upper graph is a compressed graph covering the entire measurement to give you a complete overview. The yellow field is the current view in the main graph.
The level vs time picture is available as portrait or landscape view.
The X-axis can be set to period #, relative or absolute time. You can rapidly move along the x-axis by tapping on the upper graph or use the zoom function. In addition, you can jump between markers or replay audio recordings, view pictures and comments.
Level vs time display single view
Level vs frequency display
The single view of the level vs frequency display is available as portrait or landscape view. Several types of drawing shapes are supported; filled or open bar graph, line or step line. In addition to color selection of each graph, you may also configure the drawing order of the graph; back, middle or front.
Level vs frequency display

8
Sound & Vibration Analyser Nor150
Dual view with L/t and L/f
Dual view with L/t and L/f
You may compose any mix of the available graphs in a split view configuration. The split view is only available as portrait displays. A special useful view is the combination of Level vs frequency and level vs time. By selecting the link cursor feature you move the cursor in both the time and frequency domain simultaneously.
Another useful combination is to combine a graphical and numerical view or two level versus frequency views holding information’s from each of the channels. You may also combine measurement data from both channels in one graphical view.
Sound level meter display
The sound level meter display is especially designed for users who requires large numbers and little information. As with the other displays you may configure three measurement parameters to display simultaneously. The bar graph shows the instantaneous value. This view is only available as portrait.
Cumulative and Probability Distribution Function (PDF)
- combined in one display with a horizontal instantaneous sound pressure level graph. Both the value of the PDF and the Cumulative value at the cursor position are displayed simultaneously.
The view is available as portrait and landscape
Up to 8 freely selectable percentile values may be measured. Any value from 0,1% to 99,9% can be selected. All frequency bands and weighting networks are calculated, both for the entire measurement global, and for every period in the time profile, provided that the profile resolution is set larger than 2 minutes
Cumulative and Probability Distribution Function (PDF) - both as portrait and landscape. The statistical class width is 0,20 dB over the entire 130 dB range including the 1/1 and 1/3 octave bands.
Sound level meter display
A numerical table is associated with all the graphical views. Just press the TAB button to toggle between graphical and numerical view. Works both with single and split screen.

9
Sound & Vibration Analyser Nor150
Sensor administration menu
A built-in sensor database is holding information of a set of standard transducers. This avoid you from making improper settings. In addition, you may add other sensors to the data-base. All data regarding calibration etc are stored and can be recalled at a later stage.
You may define a verification interval for a sensor allowing the instrument to notify you if a sensor is due for periodically verification. In this way, you leave the sensor administration and external verification due dates to be taken care of by the Nor150.
Calibration
The calibration menu offers three calibration methods; manual, auto and mic. check. Manual is the traditional way, where you manually adjust the sensitivity until you read the desired level. Auto is an easier way. Just select calibration level and press “go”. The level will be automatically adjusted to the right value. Mic.Check is a manual test of an outdoor microphone having the SysCheck feature added.
The 1/3 octave spectrum available in the calibration menu helps you to verify that the ambient noise level is well below the calibration signal level.
The lower level vs time graph holds the historical information about earlier calibration levels made for the selected transducer. In this way, you may see how a transducer maintain its calibration level. Changes more than ±2dB relative to the verification level set for the transducer will result in an error message. The verification level is indicated by the orange horizontal line.
Graphical pause back-erase
The 0 to 20 sec. graphical pause back erase feature allows you to pause an ongoing measurement and remove an unwanted noise event. Just tap on the graph where you want to continue from. The unwanted noise event is removed from the overall calculation. In the level versus time profile, the event is kept but pause marker is inserted. In NorReview post processing and reporting program you can choose to include or exclude the paused noise event from your reporting.
Graphical pause back-erase feature
The Calibration menu Manual and automatic mode
The Transducers menu The calibration history gives you full traceability of the microphone sensitivity.

10
Sound & Vibration Analyser Nor150
Optional extensions and future proofThe Nor150 comes with an extensive set of functions available in its basic version. The modular software design enables functional expansion to take place when you need it and not at the time you purchase the instrument. This applies to all options except for the hardware related option 1 and 2, which cannot be added as retrofit.
All installed options remain in the instrument and there is no need for further loading of the options when used.
Norsonic provide regular firmware updates with new features and optional extensions. We implement new features to improve the handling of the instrument. Implementing new standards or revisions of existing standards are a part of our software maintenance scheme. Our retrofit policy is to keep your Norsonic instrument up to date the whole lifecycle of the instrument.
The options listed below is the current features available. There are more to come to expand the use of the Nor150 further. The priority and what features that should be, is decided by carefully listening to our customers. Your voice is determining the future development of the Nor150, helping us to stay in the forefront creating an even more complete unit for noise and vibration measurement applications.
Nor150 basic unit includes A, C and Z weighting networks with measurement of Leq, LeqI, LE – sound exposure level, SPL, Lmax, Lmin with parallel detection of Fast, Slow and Impulse time constants, statistical calculation of Ln, and TMAX5. The measurement data is analysed as global values in addition to two parallel time profiles with an adjustable resolu-tion ranging from 5ms to 24h. All interfaces and voice and text annotation included.
Option 1. Built in Camera and GPS.
Option 2. 2nd measurement channel.
Option 3. 1/1 and 1/3 octave filters (0,4-20kHz in 1/3 octave band) including multi-specter functionality in time profile A.
Option 4. Audio recording, marker management and event trigger.
Option 5. Sound Intensity mode supporting measurements in accordance with ISO 9614-1 and -2. Includes web server for remote control and display of measurement results on a smart phone. Requires option 2 and 3.
Option 7. Signal generator with sine, white, pink, bandpass filtered noise.
Option 8. Reverberation Time decay and calculation of T20 and T30 based on impulse or noise excitation. Requires op-tion 3. Requires also option 7 if RT shall be based on noise excitation.
Option 9. Complete Building Acoustic mode with microphone position room averaging in accordance with ISO-16283 as well as sound insulation indices calculated in accordance with ISO-717/1 and /2. (Req. opt. 3, 7, 8).
Option 11. Enhanced noise assessment package with internal web server including NorRemote for remote control via smartphones, pads and PC and additional four triggers for independent setting of different trigger levels during a day. Requires option 4.
Use your fingertip to change scale, move cursor, zoom and expand – easy and intuitive.

11
Sound & Vibration Analyser Nor150
Environmental Analyser
Nor150 is ideal for all types of environmental noise measurements. Measurements with markers, audio recordings and event triggered pictures are easily made. The large 4.3” display gives you all the necessary information. Up to 60 measurement parameters may be logged simultaneously.
The sophisticated trigger system enable different trigger levels for Day, Evening or Night with event triggers to collect markers, audio recordings and pictures. The data can be displayed remotely on any PC, notepad or smartphone. From the same device, you may change settings or simply check the status of the Nor150.
Features• Twin time profiles with resolution from 5ms and additional
Moving report with trigger possibility.
• Extensive trigger system for reports, audio recording, camera and digital output lines.
• Voice, text and picture notes.
• 5 independent event triggers (LDEN support).
• Advanced marker management.
• Full remote control from smartphone, PC or pads.
• 0-20 sec graphical back erase / pause function.
• 0-120 sec Audio pre-trigger.
• Easy integration to postprocessing programs and Excel.
Voice annotation and replay of the audio recording is easy using a standard headset with microphone.
The Audio recording and Picture feature
The Nor150 records the sound signal itself if option 4 is installed. The most common application is for source identifi-cation purposes.
Dependent on the selected quality of the recording format, the signal may also be used for further analysis. The recording quality is available in several formats to suits different applications, 8, 16 and 24 bit resolution with a sampling rate of 12 or 48kHz. A pre-trigger may be set to start capturing a recording up to 120 sec before the event took place.
The audio recording may be started manually using the key-board or a remote hand switch. It is also possible to start a recording if a marker is activated. Further, a marker may be activated by an event trigger. Continuous recording only limited by the size of the SD memory card. The recording may be replayed on the Nor150 by connecting a standard headset. An orange horizontal marker line is inserted at the top of the display in the level vs time view when recording by using the jump between markers feature. You may easily scan through the captured recordings in a measurement sequence with-out transferring the data to a PC. Detailed analysis however is more convenient using the NorReview postprocessing and reporting program.

12
Sound & Vibration Analyser Nor150
Internal camera for documentation purpose.
Advanced marker management
Pictures can be taken with the internal camera before or after a measurement for documentation purpose. Event triggered pictures requires an external IP camera. In the similar way as audio recording, the camera may be triggered manually by a hand-switch, a key push, a manual marker or by a level threshold trigger. The capture pictures are automatically trans-ferred to the Nor150 and stored together with the measure-ment file. An single marker is inserted in the level vs time trace. The picture can be viewed on the instrument after the measurement is elapsed or transferred to a PC for later analysis in NorReview.
Advanced marker management
The Nor150 features a sophisticated, but yet easy to use marker management. Up to ten markers may be selected. The user can name the marker, select between single and toggle marker, colour and associate an action to the marker. The action can be; enable a reference tone, start a recording, take a picture or set one of the digital outputs on the Norsonic 15 pin digital I/O socket. It is easy to add markers to an ongoing measurement. The marker menu can be hidden from the full overview of the L/t display. Notes may in the same way as markers be added to an ongoing measurement.
Event trigger menu
Sophisticated event trigger
Up to five independent event trigger may be configured. Each trigger can be activated by an external switch/digital signal and/or by a preset sound level threshold. In the event setting you configure which of the measurement parame-ters to trig on, the maximum event action time, the minimum duration after an event and the time between events to limit repetitive events caused by a barking dog etc. In addition, you may configure the time span an event shall be active. With the five trigger you can combine up to five different thresholds for LDEN or similar applications. An event action insert a marker in the level vs time profile to enable further investigations in the NorReview postprocessing and reporting program. Addition-ally, you may record the sound and capture a picture. The picture can be taken with an IP camera or a device camera found on a smart phone, pad or PC. The pictures are auto- matically transferred and bundled with the measurement data. You may view the picture or replay the audio recording on the Nor150 itself or in the NorReview postprocessing and report- ing software.

13
Sound & Vibration Analyser Nor150
NorConnect - main operating view
NorVirtualNorVirtual emulates the Nor150 on a PC. Whatever view (graphs, menus, tables etc.) the same view is mirrored on the PC screen. The mouse can be used to operate the virtual key-board. The program supports all communication channels on the Nor150. Hence, you may use this program in combination with NorConnect to connect and control the Nor150 remote from virtually any place in the world. NorVirtual is a perfect tool for seminars, schools, universities etc. NorVirtual is freeware and part of the Nor150 delivery.
NorConnect for Nor150A program for downloading measurements acquired on a Nor150. The program is seamless integrated with NorReview, Nor850 and NorReport. Thus, you are just a few mouse clicks away from generating report based on a template or perform calculations in Excel or NorReview. The program supports all communication environments supported by Nor150 ena-bling you to remotely connect to the instrument via modem, WLAN or LAN. The program also supports to read from SD card and USB. In combination with NorRemote or NorVirtual you have a simple system for remote control and download measurements. NorConnect is freeware and included in the Nor150 delivery.
Generating reports
Measuring sound is often more than just reporting a dBA value. Most measurements are made in accordance to a stand- ardized method requiring a report generated on a standard format, but sometimes you may need a customized report or calculations made in Excel. Whatever need you have, we offer a broad range of programs that helps you to evaluate the data and generate proper measurement reports.

14
Sound & Vibration Analyser Nor150
NorRemote Nor1050The Nor150’s built in web server opens up new possibilities of remote communication and acquisition of data from a Sound level meter. Simply connect to your instrument via LAN, GPRS or WiFi using a web browser to control, download or view the measurement in real time. The program covers all applica-tions from downloading files to full control of your analyser, add markers, start a recording or just check the battery status.
NorReview Nor1026Evaluate, calculate and create reports. The NorReview software is your complete tool for environmental noise assessments. It features a powerful calculation module, marker and event handling, replay of audio recording with moving cursor and more. NorReview is the right tool for all acousticians dealing with environmental noise or all tasks where a time profile of an acoustical signal is measured.
Connect your smartphone, pad or PC to the Nor150. Photos and voice notes obtained on your smartphone or pad are seamless integrated with markers into your noise data with markers in the time profile.

15
Sound & Vibration Analyser Nor150
Building Acoustic Analyser
Features• Complete calculation of airborne, façade and impact sound
insulation indices in accordance with international and national Standards.
• Single or dual channel measurements.
• Reverberation time measurements with parallel calculation of T15, T20, T30, Tmax and EDT.
• Ensemble averaging of reverberation decays.
• Backward integration of reverberation decays based on impulse excitation.
• User adjustment of individual RT decay lines.
• Signal generator with white, pink or bandpass filtered noise for increased S/N ratio in demanding environments.
• Supports multiple microphone and loudspeaker positions with corresponding on-board energetic or arithmetic averaging.
• Project overview with information about all individual measurement details and project progress.
• Seamless integration with Nor850 reporting software.
The Building Acoustics mode is designed to cover any in-situ sound insulation measurement tasks. You may choose to measure airborne, façade or impact sound insulation, and the Nor150 will offer you a wide range of user-friendly features that helps make your desired measurement task more efficient than ever.
Supported StandardsNor150 is supporting the new series of ISO 16283 Standards for field measurement of sound isolation in buildings and building elements. ISO 16283-1 for air-borne sound insulation contains calculations for both normal and staggered rooms, even with the additional corner measurements. ISO 16283-2 is used for impact sound insulation. ISO 16283-3 for facade sound insulation contains calculations based on both traffic and loudspeaker excitation as well as for façade elements.
In addition to the above widely used Standards, the following international and national Standards for in-situ sound insulation are currently supported:
• ISO 140-4, -5 and -7
• ISO 717-1 and -2
• ISO 10052
• ASTM E336 and E413
• ASTM E1007 and E989
• DIN 4109-4 and -11
• BS-ISO 140-4 and -7
• SS-EN-ISO 25267
• SIA 181

16
Sound & Vibration Analyser Nor150
Measuring sound insulationNor150 supports all the intricate calculation details given in the various Standards in an intuitive and user-friendly interface.
Measuring the sound insulation implies measurement of the sound level in the receiving room with noise or impact excitation as well as the background noise level without excita-tion. In addition, the reverberation time in the receiving room must be measured using either noise or impulse excitation. The reverberation time is used for correcting the received level for room absorption.
Additionally, the sound level in the source position must be measured for airborne and façade insulation. Room averag- ing using multiple microphone positions is also required. Some standards also require multiple loudspeaker positions which are easily made with the user-friendly Nor150 Building Acoustics mode.
Level measurementsFor airborne insulation, the loudspeaker is placed in the source room and the various microphone positions are measured. For impact insulation, the tapping machine is placed in the source room, but no positions are measured. In the receiving room, however, the various microphone positions are measured in both cases with the loudspeaker or tapping machine activated in the source room. In addition, the background level is measured in the receiving room without any active source in the other room.
To avoid the use of measurement data that is interfered with impulsive background noise, the Nor150 has built-in two active features. Firstly, by measuring the Leq and the Lmax values simultaneously. You may easily see before acceptance that something is wrong should these values differ more than 3-4 dB. Secondly, as the graphical profile view for each measure-ment is displayed, a similar situation may easily be detected. Both features are stored with the measurement data, and may be evaluated in the post processing Nor850 software later.
Reverberation time measurementsThe measured sound level must be corrected for the absorption in the receiving room. Hence, measuring the reverberation time is required before the final calculation of the sound insulation index. The Nor150 offer reverberation time measurements based on either noise or impulse excitation, and calculates the T15, T20, and T30 in parallel in addition to Tmax for noise excitation and EDT for impulse excitation.
Setup menu for selecting standards. You may recalculate for additional standards based on already measured data.
Single or dual channel measurementsThe Nor150 Building Acoustics mode supports both single and dual channel measurements. The signal generator output is automatically activated when the measurement sequence is running.
In single channel, you pre-define whether your microphone channel is placed in the Source or Receiving room, and the measurement data is handled accordingly in the final calcula-tions.
In dual channel operations, you choose which microphone channel that is placed in the Source and Receiving room. Alternatively, you place both microphone channels in the same room. In either case, the measured data are all handled correctly in the final sound insulation index calculation.
Split screen display (left) with Source, Receiving and Background levels in the upper level versus frequency (L/f) graph. The lower graph is a level versus time presentation of the Source and Receiving room based on the cursor position from the L/f graph. Alternatively, all microphone positions and the average values are displayed together (right).

17
Sound & Vibration Analyser Nor150
All decay curves may be viewed graphically before acceptance of each measurement. If you find the calculated decay line not to be acceptable, the instrument offer a manual adjustment feature to improve those decay lines and the corresponding reverberation time.
Graphical Reverberation Decay (left). Move with the cursor along the frequency axis to display the corresponding graphical reverberation curve. Press the Num button to get the corresponding numerical values. Alternatively all reverberation time measurements and the average values are displayed together (right).
Project ViewISO 16283-1 requires measurement of five microphone positions for each of two the loudspeaker positions, in both the source and receiving room. In addition, background noise and multiple reverberation time measurements in the receiving room must be measured. In various national Standards, this requirement may differ, but in all cases there are a long list of individual measurements. The Nor150 Building Acoustic mode offers an easy method to keep track of all these measurements; the Project View.
With a simple push on the Project softkey, a table containing all measurements appear - sorted after room and measure-ment type. For each group the number of measurements as well as a possible warning sign are displayed. Additionally, the table may be expanded to show all individual measure-ments. Should there be a warning or error for any of these, you may step directly to this measurement for further details or adjustments. Individual measurements may be temporar-ily excluded from the final rating index calculation. Project View display an overview of the entire measurement
project in a consentrated form (left) and with all details in the expaneded form (right)
Single frequency scanningField measurements of sound insulation often face problems with too high background noise in the receiving rooms, both for level and reverberation time measurements. Hence, the Nor150 Building Acoustics mode offer bandpass filtered noise combined with a single frequency measurement feature to overcome such problems.
After measuring the background noise level without noise excitation and then the initial microphone position with broadband pink/white noise, the instrument will detect those frequency bands that have S/N ratio problems based on the background noise measurement values. The measurements of these frequencies will then be repeated using bandpass filtered noise which secure a 12-15 dB higher S/N ratio. For the next microphone positions, the Nor150 will re-take the same frequencies with bandpass noise automatically.
Sound insulation rating indexAfter performing minimum one microphone position for all required measurements of the selected Standard, the calcu-lation of the rating index will automatically follow to give an initial indication about the rating index. You may then perform the missing microphone positions, and the final rating index is displayed in a graphical view including the reference curve.

18
Sound & Vibration Analyser Nor150
Final reportsThe Nor150 is seamless integrated with the powerful Nor850 building acoustic postprocessing and reporting software for professional and easy generation of measurement reports in accordance to national and international standards.
Alternatively, you may transfer the data to your PC via Nor-Con- nect and automatically convert it to Excel for report generation based on your favorite templates.
The rating picture for impact insulation. Split screen with graphi-cal and numerical values. If more than one loudspeaker or tapping machine position have been measured, you may use the softkey ‘#’ to scroll through the individual calculated results for each position named A, B, C, ….. The total result is called ‘Total’.
Re-use of measurement dataWhen a sound insulation project with all required measure-ments are finished, the operator may re-use these data for additional projects. This comes handy if the background noise level and the reverberation times in the receiving room shall be re-used for an impact test in the same room.
Re-calculation of the sound insulation index based on another Standard is also available. This is simply done by changing the Standard selection after storing the initial project. Hence, no need to re-take all the measurements for making additional national sound insulation indices - the Rw, DnT,w and ASTC a.o. indices are all calculated based on the same measurements!

19
Sound & Vibration Analyser Nor150
Sound Intensity Analyser
Sound intensity is a powerful measurement method in situations where traditional methods proves difficult or not feasible. With the new features of the Nor150, sound intensity measurements are significantly easier to accomplish than ever before, and may actually be less time-consuming than corresponding sound pressure methods.
Nor150 equipped with the sound intensity option and the Nor1290 probe kit is a powerful tool for all types of sound intensity measurements, from high-precision laboratory conditions to demanding and rough field use.
Thanks to the unique phase correction algorithm, only a 12mm spacer is necessary to cover the entire frequency range from 25 Hz to 10 kHz. This significantly reduces the time spent in-situ, and allows measurements of highly reactive sound fields.
Sound intensity is especially suitable for sound power measurements of non-movable machinery in industrial environments, measurements of driven machinery, industrial plant exhausts and pipes both indoor and outdoors.
In-situ building acoustics may benefit from the intensity technique, both for transmission loss and sound leackage detection. And for research & developement applications, sound intensity provides powerful noise map visualisation.
Features• Compliant to IEC 61043 Class 1.
• Unique phase correction allows measuring 25 Hz to 10 kHz with single 12 mm spacer.
• Full on-board support for ISO 9614-2 sound power measurements.
• Smartphone remote control for single-hand operation, all measurement data presented during measurement.
• Intuitive warning indicators makes sound power measurements easy.
• Measurement-based improvement suggestions helps the user on the way, no need to consult the ISO standard.
• Pause and back-erase with L(t)-graph.
• Integrates with Nor850 visual mapping and reporting software for advanced post-processing.
• Configurable measurement sequence.
• Full measurement edit support (segment exclusion, resize, retake).
• Photo, text and voice annotation for individual segments.
• Accepts legacy sound intensity probes.

20
Sound & Vibration Analyser Nor150
Sound power according to ISO 9614-2The ISO 9614-2 may not be famous for its simplicity, and with previous instrumentation it was a time-consuming procedure for determining sound power. The standard does however provide a very powerful method for determining sound power under demanding conditions, and with the new Nor150 sound intensity option, the method is easier to use than ever before.
We have designed the Nor150 user interface to relieve you from the blunder and details associated with the standard. All field indicators are continously calculated, updated and abstracted into intuitive warning indications. Full-text warnings provides the necessary detail without confusion, and the Nor150 even provides suggestions for improvement based on the ongoing measurement.
In-depth graphical or tabular representation of field indicators and difference functions is available during the mesaurement. Presentations include analysis of extraneous noise, repeatabil-ity, uncertainty values and dynamic capability.
The measurement surface may be defined before the measurement using dimensions measured on-site. The analyser will generate a set of surfaces and segments based on the dimensions, but of course, you may also fine-tune the setup in details. The benefit is a visual representation of the measurement surface, and immediate results on-screen. This approach also ensures that all pitfalls of the ISO 9614-2 may be detected on-site by the instrument.
If it’s not practical to enter the details of the surface before the measurement, a simple list of segments will also suffice. The segment areas may easily be changed after the measurement is completed, either on the Nor150, or in the post-processing software Nor850. A varity of annotation methods may be used for each segment; text, voice recording and pictures using the built-in camera.
The INFO key will bring up detailed information about the cursor position. Here, A-network preweighting is also applied to the measurement spectra, giving the user a good indication of which band that contibutes to the total A-weighted value.

21
Sound & Vibration Analyser Nor150
Designed for the rough and unexpectedThe Nor150 Intensity options is designed to handle the unexpected. Changing important measurement settings such as frequency range and accuracy grade can be done at any time if the measurement progress requires so. Compensating areas can also be done at any time. The measurements are recalculated instantly, providing useful information.
When measuring sound intensity in demanding conditions, interrupts in terms of impulsive noise are common. The Nor150 includes a unique pause-function with back-erase. Simply press the pause-button and remove the desired number of seconds from the measurement with the help of a level-time graph. Then continue with the measurement. There is no need to start over!
When a measurement site involves physical challenges such as climbing a ladder, the Nor150 itself may be stored in a belt-pack or backpack. Connected only by a standard microphone cable, the Nor1290 probe handle with a smartphone will bring the full user interface of the Nor150 to your fingertips. A light-weight, single-hand probe with all measurement functions and indicators available.
General sound intensity measurementsAlthough the Nor150 is designed to enable exceptionally easy sound power measurements according to the ISO 9614 standard, you will not be locked up to the standard. It can also be used for sound source localization, leakage detection or general intensity measurements for building acoustics such as sound insulation according to ISO 15186.
Noise source localization
To locate the noise source, move the probe along the structure of interest. The mirror graph on the Nor150 will easily visualise a change in sound intensity direction, indicating the source location.
Intensity mapping
The Nor150 is an excellent tool for research and development of new products, identification of noise sources on complex machines and general mapping of a noise source. A fine grid for scanning or single point-measurements may be defined, either on a single surface or a full box.
After making the measurements assisted by the visual display on the Nor150, the measurement is easily exported to the Nor850 software, using WiFi, LAN or USB. Nor850 will produce 2D and 3D mappings of the measurement, and photos from either the Nor150 or another camera may be projected on the surface.
The ISO 9614-2 sound power using the sound intensity scanning method with a surface enclosing the device under test.
Pressing the PAUSE button will bring up the level-time graph. Move the cursor to remove a desired number of seconds from the measurement, and press continue. The functionality is also available on the remote control.
All settings may be changed dur-ing or after a measurement, ex-cept the baseline Filter settings. Using the calculated total range setting to decide frequency range, all data is kept for optional use later.

22
Sound & Vibration Analyser Nor150
PerformanceForget the old way of measuring intensity using different spacers. Thanks to our unique phase correction algorithm and the powerful DSP, the Nor150 is capable of measuring sound intensity with extremely high dynamic capability. The Nor1290 probe configured with the default 12 mm spacer will typically have better dynamic capability than required by the IEC 61043 for a 100 mm spacer. This is achieved using an advanced two-stage phase correction teqhnique and the ac-companying Nor1294 Phase Verification Coupler.
Nor1294 Phase Verification Coupler
The two-stage correction process with additional verification saves considerable time compared to traditional methods
The Nor150/Nor1290 kit provides a dynamic capability never seen before
Calibration history for each probe
The first stage in the correction process includes a phase correcting filter for each channel, directly targeting the error introduced by the ventilation on intensity microphones. The Nor1294 enables calibration at very low frequencies, thus obtaining a high precision correction.
The second stage involves a per-band calibration. Using a deterministic exponentially-swept sine, the complete process time is dramatically reduced compared to the traditional pink-noise excitation.
To prove compliance to the standard and persistent perfor-mance, all calibration data is stored in the Nor150 and may easily be presented at a later time.

23
Sound & Vibration Analyser Nor150
The Nor1290 probe kitThe Nor1290 probe kit offers a lightweight and rugged solution for rough environments. Mount a smartphone on the probe, and you are provied with single hand operation and the same measurement displays as on the Nor150. The remote system is fully synced, allowing you to put all your focus on the measurement task.
The probe head has two adjustment knobs. The upper-most knob is for compensating spacer distance and center displacement, while the lower is for locking the probe firmly into an angle. The angular adjustment has well-defined mechanical steps for your convenience.
The detachable probe head is equipped with a standard 7-pin lemo connector with firm attachment via a screw-lock. It may be connected directly to the top of the Nor150, extended via a standard microphone cable or mounted on top of the probe handle rod. This ensures maximum flexibility and gives you full configuration freedom, while keeping the cost of additional equipment such as extension cables to a very minimum.
The Nor150/Nor1290 kit
Nor1290 kit contents
• Nor1290 adjustable probe head.
• Two phase-matched GRAS 40GI 1/2” prepolarised microphones.
• 90° angular 1/2” to 1/4” adapter.
• Two impedance matched GRAS 26CC 1/4” CCP preamplifiers.
• Probe handle w/ smartphone mount.
• Lightweight 1m carbon fibre rod with lemo connectors.
• Nor1294 Phase Verification Coupler.
• Windscreen.
• Set of spacers.
• 2 m extension cable.
• Two-level hard case with room for all contentents mentioned above plus Nor150, power adaptor and SPL calibrator Nor1251 or Nor1255/Nor1256.

24
Sound & Vibration Analyser Nor150
Other probe types may be used. The picture show B&K 2683 probe adapted to the Norsonic handle kit.
Frequency range (±2 dB) Ref. IEC 61043 Class 1
Dynamic range lower limit
(microphone thermal noise)dB(A) 27
Dynamic range upper limit dB 146
Nominal sensitivity @ 250
Hz (±2 dB)mV/Pa 12.5
Microphone type ½” Rear vented, Prepolarised
Preamplifier ¼”, IEPE powered
Temperature range,
operation°C / °F 5 to 40 / 41 to 104
Temperature coefficient
@250 Hz
dB/°C /
dB/°F-0.01 / -0.006
Humidity range non
condensing% RH 0 - 100
Humidity coefficient
@250 Hz
dB/%
RH-0.001
Influence of axial vibration
@1 m/s²
dB re
20 µPa66
Spacers included mm 12, 25, 50, 100
Cable length m 2
Connector type 7pin Lemo
CE/RoHS compliant/
WEEE registeredYes/Yes/Yes
Specifications for Nor1290 Sound intensity probe
Probe compatibilityThe Nor150 also supports various probes from the most popular manufacturers. The probe support includes traditional preamplifiers with 200V polarisation and prepolarised microphones with IEPE/CCP/ICP preamplifiers.
All probes may be connected directly to the top 7-pin lemo by the help of adapters provided by Norsonic, but we recom-mend to buy one of the available probe handle kits. These kits provides a probe handle with support for smartphones and a suitable adapter for the desired legacy probe at the top of the probe rod, and includes a Nor1294 Phase Correction Coupler.
The advanced phase correction technique will provide high dynamic capability performance for most probes. However, the function must have been verfied at the Norsonic Laboratory in Norway. The correction technique relies on the Nor1294 provided with the probe conversion kits. Contact your Norsonic supplier for information about supported probes.
The intensity microphones may be plugged directly onto the main socket.

25
Sound & Vibration Analyser Nor150
NorRemote for Sound IntensityThe NorRemote feature for Sound Intensity mode is designed as an extension for the Nor150. The NorRemote app provides exactly the same measurment information as the Nor150 screen itself - thus, you may operate and review the measure-ment with a single hand only.
The NorRemote app is free of charge and runs on any newer Android smartphones. A WiFi-connection excludes the need for extra cables.
The user interface is the same as on the Nor150, showing the same measurement views. Start, stop, pause, back-erase, expanded warnings information and measurement sugges-tions all behave the same way, and it’s all synced with the Nor150 screen. All advanced analysis views are also available.
Photos may be taken with the smartphone, and they are automatically stored on the Nor150 for later review on the instrument or in the Nor850 software. The NorRemote measurement screen is identical to the Nor150
presentation, with softbuttons for in-situ operation of the measurement.
The NorRemote app is available for free on the Google Play Store.

26
Sound & Vibration Analyser Nor150
Surface configuration
Surface
SegmentFront
Left
BackRight
Top
in surface Left
the Front surface
The total measurement surface is divided into several surfaces and segments. Define the overall dimensions, and let the Nor150 auto-generate the complete surface.
XY
Z
The total surface overview shows key information. In case the surface is not symmetric as in this example, the surfaces scales accordingly for easy recognition of position.
Double-tapping into a surface will show all segments inside the surface. Warning indica-tors are shown along with scan progress color frame. Key levels are available at the top.
The surface definition menu provides access to the measurement surface setup. Submenues for each surface allows further configuration.
The segment edit menu allows editing the dimensions (and conseqently the area) of each segment.
The surface edit menu provides access to all segments inside the surface. The summed area of all segments is displayed. The number of segments may be controlled by editing the Row/Column setup.

27
Sound & Vibration Analyser Nor150
The Extranous Intensity view shows the F+/- indicator for the total surface, displaying the effect of extraneous noise on the measurement.
Measurement views and noise source localisation
The ∆-view shows the difference between two orthogonal scans, in terms of both Ieq and Leq. Additionally the ISO requirement is plotted in black color.
Dynamic capability analysis shows the dynamic capability of the probe and instrument, along with the field indicator FpI from the current measure-ment
Advanced analysis
The instantaneous view during measurement. Instantaneous intensity with time constant Fast is displayed along with Ieq and Leq.Intantaneous intensity is a great tool for localising noise sources.
All functions are available in tabular format, including warning indicators. It is also possible to display surface/segments overviews in tabular format, including navigation using double-taps.
Sound Intensity probe used for noise source localisation

28
Sound & Vibration Analyser Nor150
Post processing using Nor850
In the Nor850 software you can change all settings the same way as in the Nor150. However, copying and analysing the measurements is easier on a larger screen. The Nor850 software provides intuitive visual tools for editing.
Copy segments or surfaces, view intermediate results of a subset of segments, exclude segments, surfaces or bands. If desired, the measurement may be up/downgraded between Survey/Engineering, and the weighted frequency range may be changed.
Nor850 displays all the information as the Nor150, including the Scope Selector and all functions. In addition, the results are mapped onto a 2D/3D surface for noise mapping.
A typical application may be the case where limited time did not allow for a full definition of segments before measurement. All measurements can be made on a single surface where the areas are not defined. By opening up two measurement projects in Nor850, you define a new total measurement surface and copy/paste each measured segment into correct locations in the new project.
The Scope Selector looks the same as on the Nor150. Additional options are available by right-clicking a surface or segment.
Get detailed information from the graph, also linked with the tables with different viewing options. Select mutliple bands for exclusion.
29
Sound & Vibration Analyser Nor150
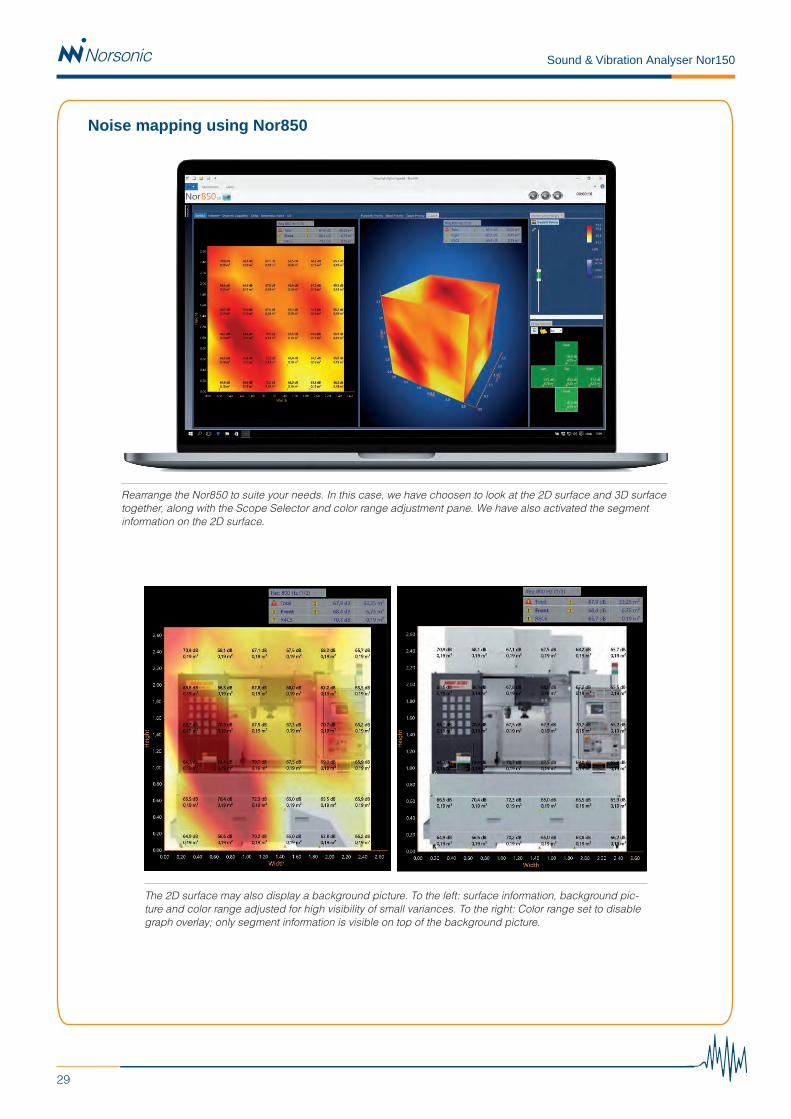
Noise mapping using Nor850
Rearrange the Nor850 to suite your needs. In this case, we have choosen to look at the 2D surface and 3D surface together, along with the Scope Selector and color range adjustment pane. We have also activated the segment information on the 2D surface.
The 2D surface may also display a background picture. To the left: surface information, background pic-ture and color range adjusted for high visibility of small variances. To the right: Color range set to disable graph overlay; only segment information is visible on top of the background picture.
30
Sound & Vibration Analyser Nor150
Sound power level LW(A): dB
Measurement surface:kPa°C m% m
mm²
0.0 Not compliant
Total area:Z: 5.0Y:X:Surface type:
125
Cuboid5.05.0
Not compliant
Not compliant
Status
Not compliant
Not compliant
Not compliant
Not compliant
Not compliant
Not compliant
Not compliant
Not compliant
Not compliant
Not compliant
Not compliant
Not compliant
Not compliant
Not compliant
Not compliant
Not compliant
0.00.00.00.0
0.0
0.00.00.00.00.00.00.00.00.0
[dB]8.46.54.90.70.20.00.0
1.6
FpI
[dB]6.06.36.65.74.72.51.7
63
3.52.31.9
80 58.2100125160200
1.41.51.4
1.00.80.91.01.0
1.11.2
35.433.8
3150 60.060.94000
Static pressure: 105.0Air temperature: 25.0Relative air humidity: 50.0
98.594.993.1
30.232.630.2
1.2
102.333
43.837.245.150.054.3
22.624.025.5
45.451.8
21.5
Ieq
[dB]Leq
[dB]Ld
[dB]16.039.8
41.7
Not compliant
F+/-
23.518.321.520.821.3
26.2
28.178.674.7
98.090.5
8001000
630
[Hz] [dB]Frequency LW
54.856.4
50
92.3
77.077.673.972.1
61.866.571.5
58.364.269.6
78.6
71.373.0
6300 52.3
26.2
27.228.7
32.7
89.487.781.781.081.9
73.3
69.567.962.161.562.3
53.4
68.4
5000 78.9 58.0 59.2 30.9
Sound power levels according to ISO 9614-2:1996
Determination of sound power levels of noise sources using sound intensity - Measurement by scanning
No. of test report:
39.4
53.379.285.2
60.466.372.874.2
66.860.7
2000 25.826.2
12501600
54.9250315400500
2500
72.4
Measurement surface:kPa°C m% m
mm²
1
2
3
Sound power level LW(A): dB102.333
400500
Not compliant
2
2
2
125016002000
630 2
25002
6300
2
73.3
93.1
2
2002
2
Excluded
3150
2
No. of test report:
4000 2
5000
Signature:15.02.2017
Warning
Date:
Name of test institute:
Z:Y:
160 2
2
Total area:
1000
2
2
2
Object:
Mountingconditions:
Operatingconditions:
X:50.0Relative air humidity:25.0
Surface type: Cuboid
Sound power levels according to ISO 9614-2:1996
Frequency
Determination of sound power levels of noise sources using sound intensity - Measurement by scanning
Date of test: 15.02.2017
[Hz]
250315
2
2
Air temperature:
Client:
125.0
5.05.05.0
Static pressure: 105.0
f
125 2
2506380
800
LW
1/3 octave[dB]
54.856.458.2
100
94.9
92.389.487.781.781.081.978.9
60.466.372.874.279.285.290.598.098.5
40
50
60
70
80
90
100
63 125 250 500 1000 2000 Hz 4000
Soun
d po
wer
leve
ls L
W,
dB¾®
Frequency, f, Hz ¾®
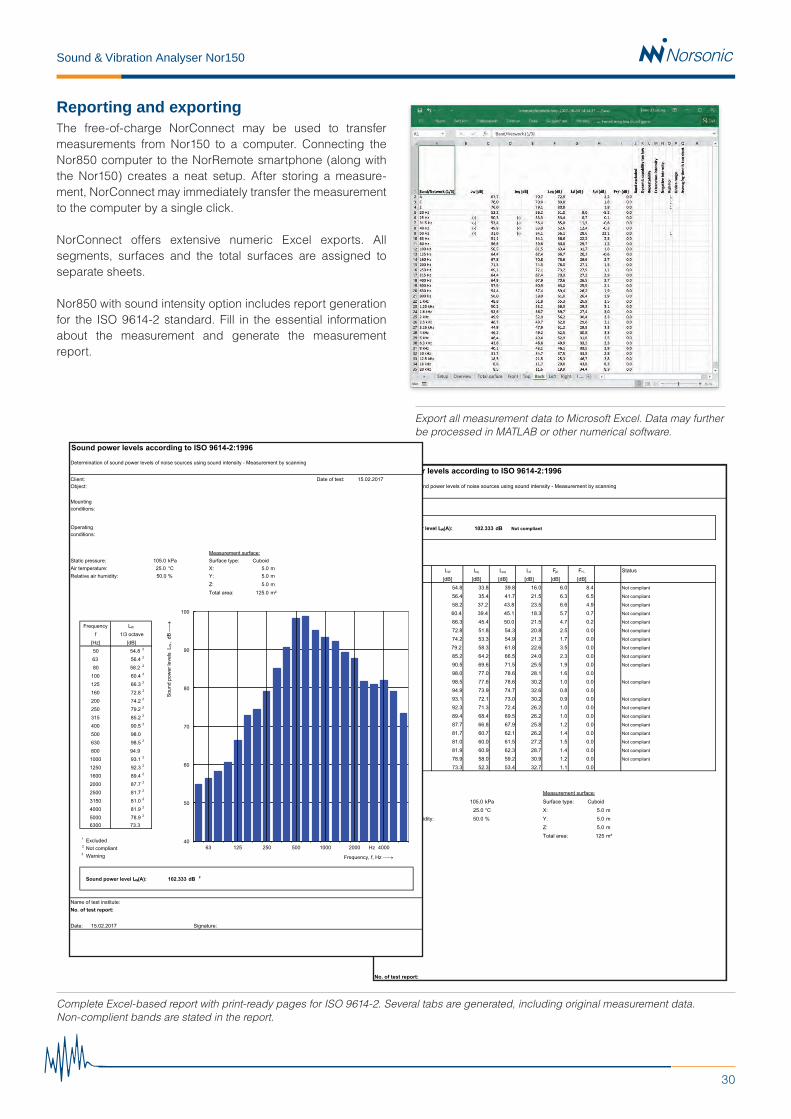
Reporting and exportingThe free-of-charge NorConnect may be used to transfer measurements from Nor150 to a computer. Connecting the Nor850 computer to the NorRemote smartphone (along with the Nor150) creates a neat setup. After storing a measure-ment, NorConnect may immediately transfer the measurement to the computer by a single click.
NorConnect offers extensive numeric Excel exports. All segments, surfaces and the total surfaces are assigned to separate sheets.
Nor850 with sound intensity option includes report generation for the ISO 9614-2 standard. Fill in the essential information about the measurement and generate the measurement report.
Export all measurement data to Microsoft Excel. Data may further be processed in MATLAB or other numerical software.
Complete Excel-based report with print-ready pages for ISO 9614-2. Several tabs are generated, including original measurement data. Non-complient bands are stated in the report.

31
Sound & Vibration Analyser Nor150
Specifications
The Nor150 Precision Sound and Vibration Analyser is supplied with ½” preamplifier Nor1209 and the ½” measurement microphone Nor1225. It conforms to the latest revision of the following National and International standard including amendments, all type 1 / class 1; IEC61672, IEC60651, IEC60804, IEC61260, DIN45657, ANSI S1.4, ANSIS1.11, and ANSI S1.43.
Measured Parameters
Simultaneous measurement of SPL, Leq, LeqI, LMax, LMin, LE, LEI, LPeak, Ln and Tmax5.
Time weighting functions: Fast, Slow and Impulse.
Spectral weighting functions: A, C and Z - weighting.
Frequency analysis: 1/1 and 1/3 octave real time filters from 0,4 Hz to 20 kHz.
Statistical calculations: 8 individual adjustable percentiles from L0,1% to L99,9%, The statistical calculations are performed in real time within each frequency band and for each profile period if period length is set longer than 2 minutes. Class width is 0,2dB. Dynamic range is 130dB
Measurement control
Overall measurement duration: 1 sec – 7 days. (If set to Repeat or Synchro mode a new measurement will be started automatically, with no time gap between each measurement.)
Time profile A resolution 5 ms – 24 hours including full frequency spectra. From 1 sec if profile B or Moving is enabled
Time profile B and Moving resolution 1s – 24 hours. A, C and Z - no frequency spectra
0-20 sec free selectable graphical back erase.
Audio recording
12 and 48 kHz sampling rate / 8, 16 and 24 bits /
0-120 sec pre-trigger.
Measurement range
One range covering 120dB without any range adjustments.
Self-noise measured with 1/2” microphone with a nominal sensitivity of 50mv/Pa: 17dBA.
Maximum RMS level 137dBA, Maximum Peak level 140dB PeakC.
The high SPL mode enables measurements up to 194dB using a suitable 1/4” microphone.
Noise Generator
Built in noise generator with Sine, White, Pink and 1/1 and 1/3 octave band passed filtered noise and Impulse noise.
Sound Intensity
Full on-board support for ISO9614-2 with intuitive warning indica-tors and measurement based suggestions for improvements. Fulfils IEC61043 class 1 requirements.
Dynamic capability Nor150 combined with Nor1290 Sound Intensity probe with 12mm spacer; >18dB (125Hz -10kHz), >13dB (f ≥40Hz)
Reverberation Time
Parallel calculation of T15, T20 and T30 in addition to Tmax for Noise excitation and EDT for impulse excitation.
Display
4,3” colour display, ¼ VGA with capacitive touch. Protected by an anti-smudge coated and scratch-proof glass.
GPS / Camera
Built in GPS.
Built in Camera for annotation before and after a measurement. Support for use of external IP or device cameras for event triggered pictures during a measurement. The event captured pictures are automatically timestamped, transferred to Nor150 and are bundled with the measurement.
Datastorage / Datatransfer
Storage modes: Manual, Auto, Repeat and Synchro. Synchro synchronise the start of the next measurement to the next full hour.
Internal memory: 350 MB - not used for measurement storage.
Micro SD card: Up to 64 GB, supports XC and HC standard.
Data can also be stored on an external USB stick.
Data transfer via LAN, USB and high-speed RS232. Supports WLAN and GPRS - 3G/UMTS - 4G/LTE via USB.
Inputs
Microphone input: Two microphone inputs (Second channel optional). Supports standard 7 pin Lemo preamplifiers including SysCheck, Microphone heating, TEDS and IEPE. Polarization voltage: 0, 70 and 200V. Preamplifier voltage is ± 15V. Both channels are connected to the main microphone input in Sound Intensity mode. Channel 2 is multiplexed and replaces the SysCheck feature.
Comment microphone: Via 3 pin mini jack.
Analogue outputs
AC out, 100mV full scale on 15 pin I/O socket.
3 pin mini jack headphone socket for replay of voice notes, listen to microphone AC signal or replay of audio recordings. Comment microphone for voice notes is connected to same plug.
Signal generator on 15 pin I/O socket with Pink, White, Band-pass filtered, sine and impulse noise.
Power
Rechargeable 3,5Ah Li-Ion batteries with built in fuel gauge.
External power: 10-28Vdc 3-5Watt.
Typical battery lifetime: 8 hours.
Dimensions (ex. preamplifier and microphone LxWxH): 240 x 82 x 39mm.
Weight (including preamplifier and microphone): 700g.
Accessories included (Standard package)
Nor150, Precision Sound Analyser with A, C and Z weighting net-works, Parallel time constants, Statistical calculation and time profile A. Supplied with rechargeable battery pack, mains adaptor Nor345, carrying case Nor1340, 32GB micro SD card, USB cable Nor4525, Microphone Nor1225, Preamplifier Nor1209, Windscreen Nor1451, WiFi dongle Nor4614A, Instruction manual, 3 years warranty and calibration certificate, Nor1051 NorConnect software for file transfer & measurement view and NorVirtual - sound level meter emulation program.
Specifications may change without further notice.

+47 32 85 89 00 | [email protected] | www.norsonic.com
Distributor:
PD 150 Ed1Rv3 En 0919
Norsonic is one of the world’s leading manufacturers of precision measurement instruments for sound and vibration applications. Since 1967, the specifications for our successful instruments have been based on the requirements of regulations found in the EU, North American and other industrialised countries.
By careful attention to the user’s requirements at the design stage, it has been possible to increase the complexity of the instrument yet preserve a user interface that is convenient and easy to understand. Our products have been developed in close consultation with our customers in more than 35 countries around the world.
It is by listening to our customers’ needs that keep Norsonic at the forefront of the world market for sound and vibration instrumentation. Our vision is to supply our customers with the most innovative soun instrumentation of the highest quality.
Norsonic offer 3 year warranty. Our quality philosophy permeates the whole lifecycle of a product. It starts with the design, continues with internal design tests, and ends with pattern evaluation for legal metrology at international laboratories such as the PTB in Germany.
Our products have for decades been type approved in order to secure that the produced measurement results are accurate and within the given specifications. All our sub-contractors are carefully selected and frequent quality audits assure that they keep a high quality standard.
Full test and calibration in accordance with relevant international standards, such as IEC61672, are carried out before the products leave the factory.
Norsonic Calibration Laboratory (NCL) is an international accredited laboratory. Products producing absolute levels, such as acoustical calibrators, tapping machines and reference sound sources are supplied with accredited calibra-tion certificates as a part of the delivery.
Norsonic uses a minimum of 20% of its turnover in research and development. A great portion of this amount is used to design new features in existing products. We are active member of the international standardisation work to ensure that you as a Norsonic customer keep your products up to date for many years after your initial purchase.
Our R/D department has close cooperation with collaborating partners in order to take advantage of special technology not offered by internal resources.
At Norsonic, we are proud to serve our customers and listen to their needs. All our products are developed in close cooperation with customers by listening to their needs and wishes.
For more detailed information visit us at www.norsonic.com


![Analyser [1]](https://img.pdfslide.net/doc/110x75/587356ca1a28ab280c8b7d14/analyser-1.jpg)