Embed Size (px)
Citation preview

Predicted errors of tropospheric emission spectrometer nadir
retrievals from spectral window selection
John Worden,1 Susan S. Kulawik,1 Mark W. Shephard,2 Shepard A. Clough,2
Helen Worden,1 Kevin Bowman,1 and Aaron Goldman3
Received 8 January 2004; revised 1 March 2004; accepted 11 March 2004; published 15 May 2004.
[1] Error covariances and vertical resolutions are reported for Tropospheric EmissionSpectrometer (TES) nadir-view retrievals of surface temperature, atmospherictemperature, H2O, O3, CO, and CH4. These error covariances are computed as a result ofselecting spectral windows that maximize the information content of simulated, TESnadir-view atmospheric retrievals of four regions representative of northern midlatitude,southern midlatitude, tropical, and polar climates. The information content of a retrieval isa function of an a priori and an a posteriori covariance matrix where the a posterioricovariance depends on an estimated smoothing error, measurement error, and systematicerrors from interfering species, surface emissivity, atmospheric and surface temperature,and line parameter uncertainties. For conditions representative of northern midlatitudes,we can expect about 3 degrees of freedom (DOF) for retrievals of H2O, 5 DOF for O3 withabout 2.4 DOF in the troposphere, and 0.8 DOF for CO. These measures for the verticalresolution and the predicted errors can be used to assess which atmospheric sciencequestions can be addressed with TES atmospheric retrievals. Proper characterization ofTES retrievals is also critical for applications such as atmospheric data assimilation andinverse modeling. INDEX TERMS: 0365 Atmospheric Composition and Structure: Troposphere—
composition and chemistry; 0368 Atmospheric Composition and Structure: Troposphere—constituent
transport and chemistry; 0394 Atmospheric Composition and Structure: Instruments and techniques; 1640
Global Change: Remote sensing; KEYWORDS: remote sensing, troposphere, error characterization
Citation: Worden, J., S. S. Kulawik, M. W. Shephard, S. A. Clough, H. Worden, K. Bowman, and A. Goldman (2004), Predicted
errors of tropospheric emission spectrometer nadir retrievals from spectral window selection, J. Geophys. Res., 109, D09308,
doi:10.1029/2004JD004522.
1. Introduction
[2] The Tropospheric Emission Spectrometer [Beer et al.,2001] is one of four instruments on the EOS-Aura platformdesigned to study the Earth’s ozone, air quality, and climate.The TES is an infrared Fourier transform spectrometer(FTS), which measures the spectral infrared (IR) radiancesbetween 650 cm�1 and 3050 cm�1 in a limb-viewing and anadir (downward looking) mode. The observed IR radianceis imaged onto an array of 16 detectors, which have acombined horizontal footprint of 5.3 km, by 8.4 km in thenadir viewing mode. In the nadir view, TES retrievals willbe sensitive to the more abundant tropospheric species suchas H2O, O3, CO and CH4. However, because verticalinformation about trace gas concentrations is obtained onlyfrom spectral variations along the line of sight, sufficientspectral resolution and signal-to-noise ratio are required to
distinguish between stratospheric and tropospheric infraredsignatures. TES spectral resolution was chosen to match theaverage pressure-broadened widths of weak infrared molec-ular transitions in the lower troposphere for nadir measure-ments (0.1 cm�1 apodized) [Beer et al., 2001]. This paperfocuses on the selection of spectral windows to be used forTES nadir retrievals. A future manuscript will describe thespectral window selection for TES limb retrievals.[3] Spectral windows are desired in order to optimize
the quality of a retrieval in part by reducing the effects ofknown systematic errors on the retrieval as well as bychoosing those spectral regions with the best sensitivity tothe atmospheric species of interest. Spectral windows arealso selected to reduce computational burden withoutsignificantly degrading the quality of a retrieval. Errorcharacterization is a necessary part of the spectral windowselection when the computed information content is usedas the metric for window selection [Rodgers, 1998;Dudhia et al., 2002]. For example, von Clarmann andEchle [1998] and Echle et al. [2000] have used informa-tion content as a metric for selecting spectral windows,principally for the Michelson Interferometer for PassiveAtmospheric Sounding (MIPAS) instrument. Similarly,Chedin et al. [2003] describes the selection of channelsfor the retrieval of CO2 profiles by computing the infor-
JOURNAL OF GEOPHYSICAL RESEARCH, VOL. 109, D09308, doi:10.1029/2004JD004522, 2004
1Jet Propulsion Laboratory, California Institute of Technology,Pasadena, California, USA.
2Atmospheric and Environmental Research, Inc., Lexington, Massa-chusetts, USA.
3Department of Physics, University of Denver, Denver, Colorado, USA.
Copyright 2004 by the American Geophysical Union.0148-0227/04/2004JD004522$09.00
D09308 1 of 12

mation content over the Atmospheric InfraRed Sounder(AIRS) channels.[4] Errors that are considered for the TES spectral win-
dow selection are (1) smoothing error that is due to theregularization of a retrieval, (2) measurement error thatis due to data noise, (3) systematic errors that are dueto uncertainties of surface and atmospheric temperature,retrieved and nonretrieved interfering species and errors dueto spectroscopic line parameters, and (4) ‘‘cross-state’’ errorthat is due to retrieving surface emissivity jointly with theatmospheric parameters of interest. The effects of clouds onTES atmospheric retrievals are not considered in this paperas an error source. Therefore the error covariances reportedin this paper are for cloud-free scenes. However, the TESretrieval algorithm will account for the effects of clouds thatare uniform across the TES field-of-view by joint retrievalof cloud properties with retrieval of atmospheric trace gasconcentrations and temperature. Calibration errors are alsonot considered because they are unknown at this time. As aresult of the spectral window selection and estimation ofTES errors we report the expected resolution, accuracy,and precision of TES nadir retrievals for surface andatmospheric temperature, H2O, O3, CO, and CH4 forclimatological conditions representative of tropical, polar,and middle latitudes. These a posteriori error covariancesalso show the altitude domains where these retrievals aresensitive to temperature and trace gas concentrations.
2. TES Noise Equivalent Spectral Radiance
[5] Calibration measurements of the TES have beenrecorded during thermal vacuum testing to characterizeradiometric, spectral and spatial performance. Spectralresolution and the instrument line shape (ILS) were deter-mined from both low-pressure gas cell measurements as wellas monochromatic CO2 laser measurements. Radiometricperformance was evaluated using measured spectra ofknown external radiometric sources and by calibrating thesespectra using the measured spectrum from the onboardradiometric source.[6] The noise equivalent spectral radiance (NESR) is the
standard deviation of radiance at each spectral point of acalibrated spectrum. The NESR is estimated using the uncal-ibrated noise level obtained for each target spectrum from thefrequency range outside the optical filter band. The radio-metric response function, which converts uncalibrated datanumbers to radiance units (watts cm�2 sr�1/cm�1), is appliedto the ‘‘out-of-band’’ noise to obtain the NESR estimate. Thissingle spectrum estimate is verified using an independentcalculation that relies on the availability of several spectrameasured from the same source in order to provide astatistical sample radiance in order to determine the NESR.[7] The estimated NESR from calibration measurements
is also compared to the predicted NESR from a TESradiometric model. In the case of the TES thermal vacuummeasurements, variable signal throughput was observed dueto time-dependent parameters such as water ice buildup onthe detectors. The radiometric model was adjusted toaccount for these factors when comparing measured andmodeled NESR. Figure 1 shows the expected NESR for aclear-sky nadir view of a tropical atmosphere with a surfacetemperature around 300 K. The NESRs shown in Figure 1
are the standard deviation for the measurement error co-variance that is used for the spectral window selection andretrieval characterization.
3. Estimation Theory
[8] A spectral window is selected if it increases theinformation content for a specified set of retrieval parame-ters (i.e., set of parameters to be inferred with the measure-ment). The information content depends on the a priori andthe a posteriori covariances of the retrieved parameters. Thea posteriori covariance depends on measurement error,systematic errors, and the choice of regularization used inthe retrieval. In this section we describe the estimationtheory and retrieval approach used for performing andcharacterizing the errors of TES atmospheric retrievals.We then describe how the information content of a retrievalis computed for a selected spectral window.[9] Measured radiances can be related to a forward model
through the following additive noise model:
y ¼ F x; b; vð Þ þ n ð1Þ
where y 2 RM is the observation vector containing thecalibrated, measured spectra. The observation vector is thesum of the nonlinear forward model operator, F: RN ! RM,which simulates the radiance produced from the terrestrialsurface and atmosphere and observed by the spacecraft. Thenoise term n 2 RM is assumed to be zero-mean, whiteGaussian noise so that:
Sn ¼ E nnT� �
¼ s2I ð2Þ
where E[.] is the expectation operator [Papoulis, 1984], s isthe NESR, and I is the identity matrix. The forward model
Figure 1. Modeled noise equivalent spectral radiance(NESR) expected for clear-sky nadir observations with asurface temperature of 300 K: (top) radiance units and(bottom) effective brightness temperature difference for theNESR from the top panel. The different colored lines are forthe four Tropospheric Emission Spectrometer (TES) filtersused for making nadir observations.
D09308 WORDEN ET AL.: PREDICTED ERRORS OF TES NADIR RETRIEVALS
2 of 12
D09308

is a function of the ‘‘full’’ state vector, x 2 RN where x can,for example, be the distribution of atmospheric gas,atmospheric temperature, surface temperature, or surfaceemissivity. The vector b contains all the other parameters,trace gases, atmospheric temperature distribution, geometryof the measurement, etc., necessary to define the radiancefor the TES sensors; these parameters are fixed for anygiven retrieval.[10] Operationally, the TES radiances are apodized to
reduce systematic errors from the instrument line shapeand also reduce computational burden. Apodization intro-duces correlations between radiance points; however, forsimplicity we do not include these correlations in themeasurement error covariance described by equation (2).[11] Fine discretization of the atmosphere is required to
model accurately the radiative transfer through the atmo-sphere. The atmospheric grid used by the TES forwardmodel algorithm contains 87 pressure levels between1211.53 hPa and 0.1 hPa. However, variations in tempera-ture or trace gas concentrations cannot typically be resolvedon this fine vertical grid and therefore the retrieval must beregularized. Regularization of the retrieval includes defininga retrieval vector that limits the possible values of the fullstate vector. For this study, the retrieval vector and the fullstate vector are related by a linear mapping:
x ¼ Mz ð3Þ
where z is the retrieval vector and M is a mapping matrix.The mapping matrix may also be interpreted as
M ¼ @x
@z: ð4Þ
The mapping matrix represents a ‘‘hard constraint’’ becausethe estimate cannot take on values outside the range spaceof M [Rodgers, 2000; Bowman et al., 2002]. Note, mapsthat have correlations between different types of retrievalparameters are not generated. For example, if the retrievalvector contains both atmospheric water and temperature (orother gas), then the relationship between the full-state vectorand retrieval vector is
x ¼ xH2O
xTATM
� �¼ MH2O 0
0 MTATM
� �zH2O
zTATM
� �ð5Þ
where MH2O and MTATM are the maps for water andtemperature, respectively. The elements of water state vectorare defined as [xH2
O]i = ln q(Pi) where q is the volumemixing ratio of a Pi pressure scale.[12] TES operational retrievals will be reported on the full-
state pressure grid and therefore the error analysis describedin subsequent sections explicitly accounts for mappingbetween the retrieval levels and this full-state grid. However,for numerical reasons associated with computing the deter-minant of large matrices, we actually compute the covari-ance matrices used for the spectral window selection on theretrieval grid. This approximation for computing the errorcovariances is reasonable if the set of retrieval parameterssufficiently describes the vertical variations of the profile.
3.1. Linear Retrieval
[13] A retrieval can be described by theminimization of thefollowing maximum a posteriori cost function [Tarantola,1987; Rodgers, 2000]:
x ¼ M �minz
y� F Mzð Þk k2S�1nþ z� zck k2L
� �ð6Þ
where zc is a constraint vector, + is a constraint matrix, andSn is the error covariance matrix defined in equation (2).This cost function is optimal when the state vector andmeasurement error are multivariate normal distributions.The constraint vector and matrix are referred to as ‘‘soft’’constraints because they provide a priori information aboutthe solution space (e.g., smoothness of the profile orstatistical distribution of the state vector), without restrictingthat solution space for the estimate. The nonlinear retrievalis performed through iterative minimization of the observedradiances with the forward model calculation evaluated atsuccessive estimates of the retrieval vector.[14] If the estimate is ‘‘close’’ to the true state, then its
dependence on the choice of constraint vector, constraintmatrix, and true state can be described by the linear retrieval[Rodgers, 2000]:
x ¼ xc þ Axx x� xcð Þ þMGznþXi
MGzKib bi�bia �
ð7Þ
where M is the mapping matrix, n is the noise vector, x isthe true full state vector, and xc = Mzc is the a priori statevector. The vector b is the true state for those parametersthat also affect the modeled radiance, e.g., concentrations ofinterfering gases, calibration, etc. The vector ba is thecorresponding a priori values for the vector b. The Jacobian,Kb = @F
@b, describes the dependency of the forward modelradiance, F, on the vector b. Gz is the gain matrix which isdefined by
Gz ¼@z
@F¼ KT
z S�1n Kz þ Lz
��1KT
z S�1n : ð8Þ
The retrieval Jacobian, Kz, is defined by
Kz ¼@F
@x
@x
@z¼ KxM: ð9Þ
Equation (7) is a valid approximation to equation (6) whenthe estimate is close to the true state, that is,
Kx x� x½ � � F x;bð Þ � F x; bð Þ ð10Þ
The averaging kernel matrix or resolution matrix, Axx =@x@x is
the sensitivity of the retrieval to the true state of theatmosphere and is computed by the following equation:
Axx ¼@x
@x¼ @x
@z
@z
@F
@F
@x¼ MGzKx; ð11Þ
The averaging kernel matrix is used to define the‘‘resolution’’ of the retrieval. The vertical resolution of anatmospheric retrieval, defined on a pressure (or altitudegrid), can be derived from the rows of the averaging kernelmatrix, @xi/@x, which define the relative contribution ofeach element of the true state to the estimate at a particularpressure (or altitude). The resolution can be defined as the
D09308 WORDEN ET AL.: PREDICTED ERRORS OF TES NADIR RETRIEVALS
3 of 12
D09308

full width half maximum of the rows of the averagingkernel.[15] The averaging kernel matrix is also used to compute
the DOF for signal of the retrieval [Rodgers, 2000], which isdefined as
dofs ¼ tr Axx½ �: ð12Þ
The degrees of freedom for signal of the retrieval may beinterpreted as the number of statistically independentelements of the estimate.
3.2. Error Analysis and Information Content
[16] The error in the estimate is the true state minus theestimate:
~x ¼ x� x ð13Þ
Substituting equation (7) into equation (13) leads to
~x ¼ I� Axxð Þ x� xcð Þ|fflfflfflfflfflfflfflfflfflfflfflfflffl{zfflfflfflfflfflfflfflfflfflfflfflfflffl}smoothing error
þ MGzn|fflffl{zfflffl}measurement error
þXi
MGzKib bi�bia �
|fflfflfflfflfflfflfflfflfflfflfflfflfflfflfflffl{zfflfflfflfflfflfflfflfflfflfflfflfflfflfflfflffl}systematic errors
:
ð14Þ
The right-hand side of this equation is composed of threeterms. The first term results from applying constraints to theestimate of retrieval parameter on a specific grid. Theseconstraints can be a combination of ‘‘hard’’ constraints (e.g.,representing the profile on a coarse pressure grid) or ‘‘soft’’constraints (e.g., adding a quadratic penalty function toequation (8)) in order to ensure an acceptable regularization.This first term is the so-called ‘‘smoothing’’ error [Rodgers,2000]. Physically, the smoothing error describes theuncertainty due to unresolved fine structure. The secondterm (measurement error) transforms the random instrumentspectral error to an error on the full state vector. The thirdterm transforms errors from forward model parameters to anerror on the full state vector, for brevity we describe theseterms as systematic errors, although some of the errors suchas temperature and water can change with each retrieval.[17] The mean of the error vector defined on the full-state
grid (i.e., the grid chosen for the full-state vector) is
E ~x½ � ¼ I� Axxð Þ x� xcð Þ; ð15Þ
where �x = E[x]. Equation (15) is also the mean of thesmoothing error and hence represents the bias introduced bythe constraint vector and constraint matrix. In the casewhere the constraint vector is equal to the mean of the‘‘true’’ state, then the estimate is unbiased. We haveassumed a zero-mean measurement noise vector andsystematic error for equation (14). The total error covariancematrix after a measurement has been performed is
S~x ¼ Axx � Ið ÞSa Axx � Ið ÞT þ MGzSnGTzM
T
þXi
MGzKibS
ib MGzK
ib
�T; ð16Þ
where S~x = E[(~x � �~x)(~x � �~x)T], �~x = E[~x], Sa = E[(x � �x)(x ��x)T], and Sb = E[(b � b)(b � b)T]. The smoothing error
covariance matrix is composed of the averaging kernel andthe covariance of the state vector. Hence the smoothingerror will decrease as the resolution of the retrievalincreases, i.e., the averaging kernel will approximate theidentity matrix.
3.3. Cross-State Error
[18] The surface emissivity strongly affects the nadir-viewed radiances; consequently, uncertainties in the surfaceemissivity degrade the accuracy of TES nadir atmosphericretrievals. There are two approaches we could use toreduce the effect of surface emissivity uncertainties onTES retrievals: (1) retrieve surface emissivity separatelyand characterize the emissivity error as a systematic error inthe retrieval error covariance calculation shown inequation (16) or (2) retrieve surface emissivity jointly withthe other atmospheric parameters. We find that retrievingsurface emissivity separately introduces unacceptable sys-tematic error into TES atmospheric retrievals. We thereforeretrieve emissivity jointly with the atmospheric parametersbut compute the information content only over the atmo-spheric parameters of interest. Retrieving emissivity jointlywith the atmospheric parameters of interest has the followingeffect on the estimate of the atmospheric parameters (noiseand systematic error terms are not shown for brevity):
x ¼ xa þ Axx x�xað Þ þ Axe e� eað Þ; ð17Þ
where the matrix A refers to the full averaging kernel for thejoint retrieval, the vector ‘‘x’’ refers to the atmosphericparameters of interest, and the vector ‘‘e’’ refers to the set ofemissivity parameters. Therefore Axx refers to the submatrixof A that is associated with the vector x, and Axe refers tothe submatrix of A that relates the sensitivity of the vector xto the vector of emissivities. The a posteriori errorcovariance (now including noise and systematic errors) forthe estimate of x is
S~x ¼ Axx � Ið ÞSa Axx � Ið ÞT þ Axeð ÞSeea Axeð ÞT þ MGzSnGTzM
T
þXi
MGzKibS
ib MGzK
ib
�T ð18Þ
where Sa refers to the a priori covariance for theatmospheric parameters of interest (i.e., the vector x) andSaee is the a priori covariance for emissivity. The gain matrix
and Jacobians in equation (18) do not include the emissivityparameters. The first term in this equation is the smoothingerror; the second term is what we have defined as the‘‘cross-state’’ error because it is the error of the estimate forthe parameters of interest (e.g., the atmospheric parameters)due to jointly retrieving with an additional set of parameters(e.g., emissivity). We note that the covariance, S~x, inequation (18) for the vector x is equivalent to the submatrixof the total error covariance for the joint retrieval whichcorresponds to the atmospheric parameters.
3.4. Information Content
[19] A measure of the performance of the retrieval is the‘‘information content’’ [Rodgers, 2000], which is defined as
DH ¼ 1
2log2
jSajjS~xj
� �¼ 1
2log2 jSaj � log2 jS~xjð Þ; ð19Þ
D09308 WORDEN ET AL.: PREDICTED ERRORS OF TES NADIR RETRIEVALS
4 of 12
D09308

where j j is the determinant operator. The determinant of thetotal error covariance matrix defines the total error volumefor the covariance. Therefore the information contentdescribes the decrease in error volume relative to the errorvolume calculated from the a priori covariance matrix of theatmospheric state. The unit of information content inequation (19) is bits. The information content increases byone bit for every factor of 2 decrease in error volumerelative to the volume of uncertainty of the atmosphericstate.
4. Spectral Windows Selection Approach
[20] Spectral windows are chosen to be the same for allnadir observations in order to ensure that biases from lineparameters associated with using scene-dependent spectralwindows are not introduced into TES retrievals. Conse-quently, we select a set of spectral windows that maximizethe combined information content of four regions represen-tative of different climatological conditions: northern mid-latitude, southern midlatitude, tropical, and polar. A prioricovariances are generated for each region using the Modelfor Ozone and Related Chemical Tracers (MOZART)[Brasseur et al., 1998]. Spectral windows that increase thetotal information content of the sum all four regions are thenselected,
DHtotal ¼Xi
DHi; ð20Þ
where the index, i, indicates one of the four regions.[21] Spectral windows are also chosen to reflect a partic-
ular retrieval sequence. Surface temperature, atmospherictemperature, and water vapor affect the atmosphericequation of state and consequently the retrieval of allatmospheric species observed by TES. Therefore spectralwindows that maximize the information content of a jointretrieval of these parameters are selected first. The joint aposteriori error covariance of surface temperature, atmo-spheric temperature, and water is propagated as a systematicerror for selecting spectral windows for ozone, methane,and carbon monoxide. Note that the full joint error covari-ance, with cross correlations between temperature and waterterms, is propagated as a systematic error. Ignoring the crosscorrelations can increase the error volume (or decrease theinformation content) of this joint retrieval and hence cansignificantly affect the spectral window selection for retriev-als of trace gas concentrations. Spectral windows for ozonewere selected next with the resulting error covariance usedas a systematic error in the spectral window selection formethane and carbon monoxide.[22] The procedure used for selecting for TES nadir
spectral windows is the following:[23] 1. Calculate information content for a small window
that is scanned across the spectral range of the appropriateTES filter. Our window size for scanning was chosen to be(an ad hoc) four spectral points (0.24 cm�1).[24] 2. Select window with the largest information con-
tent and expand window by four points on alternate sides.The expanded windows are evaluated using a sequentialupdate approach [e.g., Rodgers, 2000; Dudhia et al., 2002]in order to reduce computation time. If the a posteriori error
from the expanded window results in positive informationcontent then the window is selected and again expanded.This process is repeated until the a posteriori error decreasesthe information content. If the spectral window expansiondecreases the information content the new addition isignored, the spectral range of the window is recorded, andthe a priori covariance is replaced by the a posterioricovariance in order to evaluate the next window.[25] 3. Steps 1 and 2 are repeated until either a desired
number of unique windows are found or there is no positiveincrease in information content left in the spectral regionsremaining across the filter.[26] We applied additional selection criteria and modifi-
cations to the selected spectral windows after the automatedprocess described by steps 1 through 3 in order to reduce thecomputation burden of a retrieval and ensure that eachwindow contributes positively with the final ensemble ofwindows. For example, after all the spectral windows areselected they are sorted by information content. Windowsthat contributed only a small amount of information contentwere discarded. It is also possible that some windowscontribute positive information content against the originala priori covariance but negative information content againstan updated a priori covariance. Therefore we sometimesfound windows that showed negative information contentafter this final sorting process; these windows were alsodiscarded. Windows that were spectrally ‘‘close,’’ that is,within the spectral half width of the instrument line shape,were combined if the incurred negative change in informa-tion content was minimal.
5. Spectral-Window Selection for SurfaceTemperature, Atmospheric Temperature, and H2O
[27] Spectral windows for the retrieval of surface temper-ature, atmospheric temperature, and water vapor are selectedusing spectral sensitivities calculated within the bandpasses of the TES 2B1 (650 cm�1–900 cm�1) and 2A1(1100 cm�1–1320 cm�1) filters. The 2B1 spectral bandpass encompasses the 15 mm CO2 band as well as a‘‘window’’ region near 900 cm�1 where there is littleatmospheric absorption. The spectral band pass of the2A1 filter includes several water absorption lines, the7.8 mm CH4 band, and several window regions with littleatmospheric absorption.[28] A priori covariances for temperature and H2O are
constructed by first generating a climatological covarianceusing one day from a run of the MOZART model [Brasseuret al., 1998]. However, the climatological variances arelarger than the expected uncertainty from predictions ofatmospheric temperature and water vapor from the NationalCenter for Environmental Prediction (NCEP) (e.g., seehttp://wwwt.ncep.noaa.gov/), which will be used as a priorifor TES retrievals. Because we were only able to obtainstandard deviations of uncertainties at coarse pressureresolution from NCEP, we chose to scale MOZART clima-tologies to the NCEP standard deviations.[29] We choose the constraint matrix to be the inverse
of the a priori covariance. The a priori covariance foremissivity assumes a standard deviation of 0.1 with nocorrelations between emissivity parameters. This standarddeviation is based upon examining land surface emissivity
D09308 WORDEN ET AL.: PREDICTED ERRORS OF TES NADIR RETRIEVALS
5 of 12
D09308

variability from the ASTER [Yamaguchi et al., 1998]database for this spectral region. The covariance for themeasurement noise is diagonal and is the inverse square ofthe NESR discussed in section 2.[30] Jacobians are computed analytically for both the
retrieved parameters and interferents using the TES forwardmodel algorithm [e.g., Clough and Iacono, 1995; Clough etal., 2004; Worden et al., 2004], which is based on the LineBy Line Radiative Transfer Model (LBLRTM) [e.g., Cloughand Iacono, 1995; Clough et al., 2004]. Trace gas interfer-ents for the 2B1 filter are assumed to be O3 and H2O. Tracegas interferents assumed for the 2A1 filter are N2O, CH4,O3, and the water isotope HDO. Covariances for these tracegases are generated using MOZART. Line parameter errorsare also included for these retrieved and interfering tracegases (Appendix A).[31] The strategy for performing a retrieval of surface
temperature, atmospheric temperature, and water is (1) per-form an initial retrieval of surface temperature and atmo-spheric temperature using only the 2B1 filter and (2) performa retrieval of surface temperature, atmospheric temperature,and water using the updated surface temperature and atmo-spheric temperature from step 1 and radiances from both the2B1 and 2A1 filters. This strategy is utilized to reduce thepossibility that a retrieval will jump into a local minimumthat is nonphysical. Our spectral window selection alsofollows this strategy; that is, spectral windows are firstselected for a retrieval of surface and atmospheric temper-ature using the 2B1 filter. Spectral windows are then selectedfor a joint retrieval of surface temperature, atmospherictemperature, and H2O using only the 2A1 filter. Note thatthe a posteriori covariance from the 2B1 filter spectralwindow selection is used as part of the a priori covariancefor the 2A1 spectral window selection.[32] Figures 2a and 2b show the information content
across the TES 2B1 filter used to start the spectral window
selections for the atmospheric and surface temperatureretrievals. Figure 2a shows that for the first pass acrossthe 2B1 filter, the information content peaks in the ‘‘win-dow’’ spectral region where there is little atmosphericabsorption. Consequently, the first spectral window willreduce the uncertainty associated with surface temperature.Figure 2b shows the information content across the 2B1filter after the first window is chosen. The informationcontent now peaks in the CO2 band; selection of spectralwindows in the CO2 band primarily reduces the a priorierror associated with atmospheric temperature.[33] The top panels of Figure 3a and Figure 3b shows the
computed radiance for the TES 2B1 and 2A1 filters for thenorthern midlatitude profile. The selected spectral windowsfor the retrieval of atmospheric and surface temperature andH2O are shown overlying the radiances in the top panels ofFigures 3a and 3b, respectively. The middle and bottompanels of Figures 3a and 3b show the estimated radianceerror from the interferents and line parameter errors, respec-tively; the radiance error is computed with the followingequation:
jdLnj � KbSbKTb
�1=2nn ð21Þ
where dLn is the radiance error, the index n refers to thefrequency index, Kb is the Jacobian for systematic error b,and Sb is the error covariance matrix. The species thatcontributes the most to the estimated radiance error at eachspectral point is also shown. For comparison, the NESR foreach filter is shown as a dotted line in the middle panel. Thebottom panel of Figures 3a and 3b shows the radiance errorestimated from the line parameter uncertainties in thesespectral regions (Appendix A). The estimated radianceerrors indicate spectral regions that are likely to be selected.For example, the spectral windows shown for the 2A1 filter
Figure 2. (a) Information content across the TES 2B1 filter before any spectral window is selected. Thefilter is divided into a set of 0.24 cm�1 windows, and the information content is computed for eachwindow. (b) Information content across the TES 2B1 filter after the first spectral window is selected.
D09308 WORDEN ET AL.: PREDICTED ERRORS OF TES NADIR RETRIEVALS
6 of 12
D09308

occur where the radiance errors from interferents and lineparameters are smaller than those of adjacent spectralregions.[34] Figures 4a and 4b show error estimates for the
retrieval of the northern midlatitude profile of surfacetemperature, atmospheric temperature, and H2O, using thefinal set of spectral windows. For Figures 4a and 4b, thesquare root of the diagonal values of the a priori covarianceare shown as the solid black line with plus and minus valuesabout zero. The diamonds indicate retrieval levels. Thesquare root of the diagonal of the a posteriori error covari-ance for a retrieval using the selected spectral windows isshown as a dashed line. The dominant error is typicallysmoothing error. As discussed earlier, smoothing errordescribes the extent that the retrieval infers fine structureon the reported altitude grid. Consequently, the smoothingerror is reduced if the vertical resolution increases. Inaddition to showing the reduction in error for atmosphericand surface temperature and H2O, Figures 4a and 4b alsoindicate the altitude range where the retrieval is mostsensitive. For example, the retrieval is sensitive to H2Oconcentrations below about 11 km in the northern midlat-itude profile and is sensitive to atmospheric temperaturefrom the stratosphere down to the surface.
[35] Tables 1 and 2 show estimated vertical resolutionsfor specific altitude ranges for the four atmospheric profilesused in the spectral window selection. Average verticalresolutions are computed for the indicated pressure rangeshown in each table. The vertical resolution at somepressure is computed from the full width at half maximum(FWHM) of the corresponding row of the averaging kernelmatrix as discussed in section 3.1. Tables 1 and 2 also showthe degrees of freedom (equation (12)) and the reduction inerror, as indicated by the number of bits (equation (19)), forthe four profiles. In general, arctic regions have fewerdegrees of freedom and reduction in uncertainty from thea priori because of the greatly reduced surface temperatureand water content as compared to the other regions.
6. Spectral Window Selection for O3
[36] Spectral windows are selected for ozone retrievalsusing spectral sensitivities calculated within the band passof the TES 1B2 filter. This filter spans the spectral rangebetween 950 cm�1 and 1150 cm�1, which encompasses the9.6 mm ozone band. The NESR for the TES 1B2 filter isshown in Figure 1. The climatological covariance for ozoneis constructed from the MOZART model, however, thiscovariance is adjusted to remove correlations between thetroposphere and upper stratosphere that are likely unphys-ical. Systematic errors used for the spectral window selec-
Figure 3a. (top) Computed radiance for the TES 2B1 filterfor the northern midlatitude profile. The spectral windowsfor the retrieval of surface temperature, atmospherictemperature, and H2O are shown overlying the radiance.(middle) Estimated radiance error from the NESR andspectral interferents (O3 and H2O). (bottom) Line parametererrors.
Figure 3b. (top) Computed radiance for the TES 2A1filter for the northern midlatitude profile. The spectralwindows for the retrieval of surface temperature, atmo-spheric temperature, and H2O are shown overlying theradiance. (middle) Estimated radiance error from the NESRand spectral interferents (O3 and CH4). (bottom) Lineparameter errors.
D09308 WORDEN ET AL.: PREDICTED ERRORS OF TES NADIR RETRIEVALS
7 of 12
D09308

tion include (1) estimated errors for spectroscopic parame-ters of CO2, O3, and H2O and (2) the total error covariancefrom the surface temperature, atmospheric temperature, andH2O retrieval discussed in section 4. As previously dis-cussed, emissivity is jointly retrieved with ozone in thespectral window selection process; as with the previousretrieval, the a priori error covariance for the emissivity isassumed to be a diagonal with a standard deviation of 0.1.[37] The selected spectral windows for the retrieval of
ozone are shown in the top panel of Figure 5. The top panelof Figure 5 shows the computed radiance for the TES 1B2filter for the northern midlatitude profile. The spectralwindows are shown overlying the radiances. The secondand third panels show the estimated radiance error fromthe temperature and water uncertainties as well as line
parameter errors. The radiance error was computed usingequation (21).[38] Figure 6 shows the expected error budget for the
retrieval of the northern midlatitude profile of ozone usingthe selected spectral windows. As with Figure 4, the squareroot of the diagonal values of the a priori covariance areshown as the solid black line with plus and minus valuesabout zero. The diamonds indicate retrieval levels. Thesquare root of the diagonal of the a posteriori error covari-ance for a retrieval using the selected spectral windows isshown as a dashed line. Table 3 shows estimated verticalresolutions, total number of bits, and degrees of freedom forthe four regions used in the spectral window selection. Ingeneral, there are about 5 degrees of freedom for the ozoneretrieval with about 2.4 degrees of freedom associated withthe troposphere.[39] A study by Bowman et al. [2002] also shows that
TES ozone retrievals will have about 2 degrees of freedomin the troposphere and that this resolution is sufficient forinferring daily variations of lower and upper tropospheric
Figure 4. (a) Estimated errors for north midlatitude retrieval of surface and atmospheric temperature.The initial climatological variability is shown with the solid black line, and the final retrieval error isshown with the dashed line. The a posteriori (or total) error is composed of smoothing error (blue),measurement error (green), errors from the spectrally interfering species O3 and CH4 (orange), and lineparameter errors (red). The cross-state error associated with retrieving H2O and emissivity jointly withtemperature are included into the smoothing error. (b) Estimated errors for the north midlatitude retrievalof H2O. The initial climatological variability is shown with the solid black line, and the final retrievalerror is shown with the dashed line. The final retrieval error is composed of smoothing error (blue),measurement error (green), errors from the spectrally interfering species O3 and CH4 (orange), and lineparameter errors (red).
Table 1. Retrieval Characterization for Atmospheric Temperature
Retrievala
NorthernMidlatitudes
SouthernMidlatitudes Tropics Polar
1000–400 hPa resolution 2.7 km 4.4 km 2.1 km 6.9 km400–100 hPa resolution 4.1 km 5.8 km 3.8 km 7.4 km100–10 hPa resolution 8.0 km 10.0 km 7.6 km 9.9 kmTotal DOF 10.3 7.9 10.9 6.3Total bits 20.1 15.4 19.1 12.1
aThe first three rows show the average vertical resolution for theindicated pressures. The total DOF refers to the total degrees of freedom,which is the trace of the averaging kernel. The total number of bits indicatesthe reduction in error volume for the retrieval.
Table 2. Retrieval Characterization for H2O Retrieval
NorthernMidlatitudes
SouthernMidlatitudes Tropics Polar
1000–400 hPa resolution 4.3 km 4.1 km 4.0 km 6.0 km400–100 hPa resolution 3.8 km 4.6 km 3.9 km 11.6 kmTotal DOF 3.3 3.2 3.4 1.4Total bits 4.0 4.5 3.9 1.7
D09308 WORDEN ET AL.: PREDICTED ERRORS OF TES NADIR RETRIEVALS
8 of 12
D09308

integrated ozone amounts. The Bowman et al. [2002] studyshows larger sensitivity of TES ozone retrievals to boundarylayer ozone concentrations; this increased sensitivity (ascompared to the results reported in this manuscript) resultsfrom a more optimistic NESR and a greater thermal contrastbetween the surface and boundary layer temperatures.
7. CO
[40] Spectral windows are selected for atmospheric car-bon monoxide retrievals using spectral sensitivities calcu-lated within the band pass of the TES 1A1 (1890 cm�1–2260 cm�1) filter. This spectral domain includes 4.7 mm COband. A priori climatologies for carbon monoxide aregenerated using MOZART. Systematic errors include thetotal error covariance from the surface temperature, atmo-spheric temperature, H2O and O3 retrievals discussed insection 4 as well as errors from nonretrieved species such asCH4, OCS, and N2O. (Note that CH4 is retrieved after CO.)CO line parameter uncertainties were not included as sys-tematic errors as it was decided that line parameter uncer-tainties in this spectral domain were small enough to ignore.[41] The top panel of Figure 7 shows the computed
radiance for the TES 1A1 filter for the northern midlatitudeprofile. The selected spectral windows for the retrieval ofCO are shown overlying the radiance in the top panel ofFigure 7. The middle and bottom panels show the estimatedradiance error from the uncertainties in surface temperature,
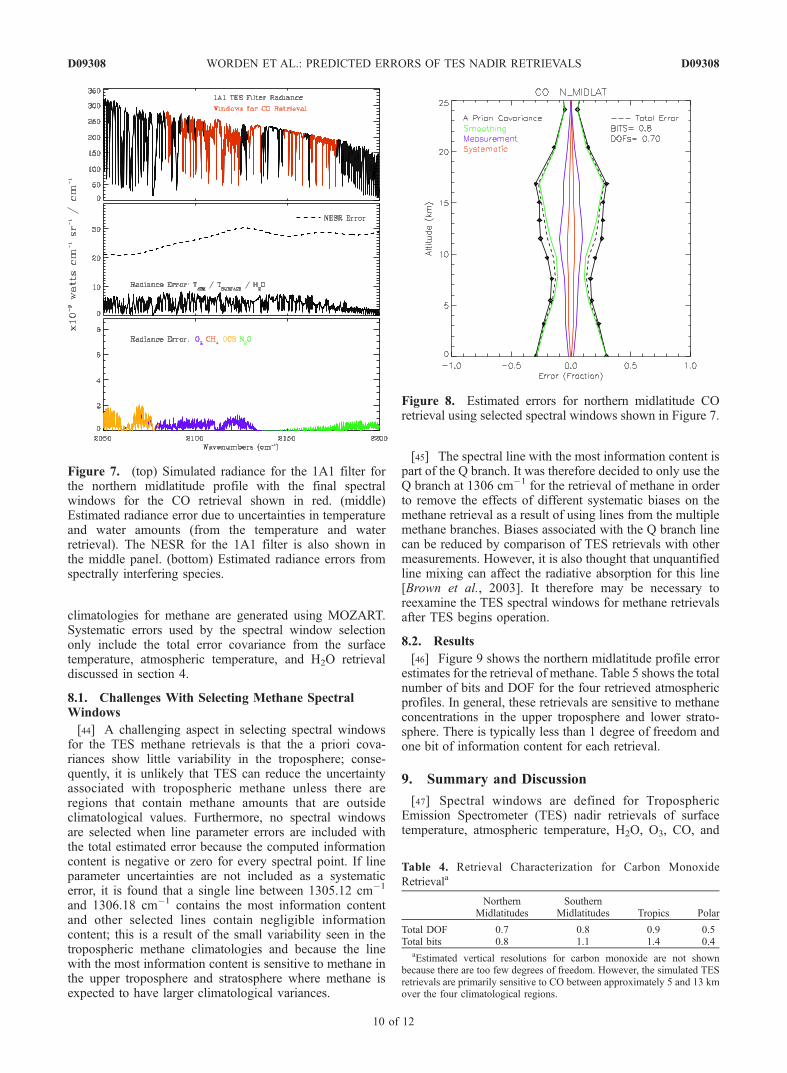
atmospheric temperature, water vapor and other interferents,respectively.[42] Figure 8 shows the northern midlatitude profile error
estimates for the retrieval of carbon monoxide. The retrievalis sensitive to CO concentrations between about 5 km and15 km. Table 4 shows the total number of bits and DOF forthe retrieval of the four atmospheric profiles used for thespectral window selection. There is about 1 degree offreedom for each retrieved profile. Vertical resolutions arenot included in Table 4 because there were not enoughdegrees of freedom to characterize vertical resolutions overseveral altitude regions.
8. CH4
[43] Spectral windows are selected for methane retrievalsusing spectral sensitivities calculated within the band passof the TES 2A1 (1100 cm�1 and 1320 cm�1) filter; thisspectral domain includes many H2O, N2O, and HDOabsorption lines as well as the 7.8 mm CH4 band. A priori
Figure 5. (top) Computed radiance for the TES 1B2 filterfor the northern midlatitude profile. The spectral windowsfor the retrieval of ozone are shown overlying the radiance.(middle) Estimated radiance error due to uncertainties ofH2O and temperature. (bottom) Estimated radiance errorfrom line parameter errors. The NESR for the 1B2 filter isshown in the middle panel.
Figure 6. Estimated errors for northern midlatitude O3
retrieval using selected spectral windows shown in Figure 5.The initial climatological variability is shown with the solidblack line, and the a posteriori (total) error is shown with thedashed line. Total error is composed of smoothing error(blue), measurement error (green), systematic errors fromH2O and atmospheric and surface temperature (red), andline parameter errors (orange).
Table 3. Retrieval Characterization for Ozone Retrievala
NorthernMidlatitudes
SouthernMidlatitudes Tropics Polar
700–400 hPa resolution 6.6 km 6.3 km 6.8 km 5.4 km400–100 hPa resolution 5.1 km 7.0 km 4.9 km 5.2 km100–10 hPa resolution 10.2 km 10.4 km 10.3 km 8.7 kmTotal DOF 4.9 4.8 4.7 4.6Total bits 8.5 8.3 6.3 6.3
aThe first three columns show the average vertical resolution for theindicated pressures. The total DOF refers to the total degrees of freedom,which is the trace of the averaging kernel. The total number of bits indicatesthe reduction in error volume for the retrieval.
D09308 WORDEN ET AL.: PREDICTED ERRORS OF TES NADIR RETRIEVALS
9 of 12
D09308
climatologies for methane are generated using MOZART.Systematic errors used by the spectral window selectiononly include the total error covariance from the surfacetemperature, atmospheric temperature, and H2O retrievaldiscussed in section 4.
8.1. Challenges With Selecting Methane SpectralWindows
[44] A challenging aspect in selecting spectral windowsfor the TES methane retrievals is that the a priori cova-riances show little variability in the troposphere; conse-quently, it is unlikely that TES can reduce the uncertaintyassociated with tropospheric methane unless there areregions that contain methane amounts that are outsideclimatological values. Furthermore, no spectral windowsare selected when line parameter errors are included withthe total estimated error because the computed informationcontent is negative or zero for every spectral point. If lineparameter uncertainties are not included as a systematicerror, it is found that a single line between 1305.12 cm�1
and 1306.18 cm�1 contains the most information contentand other selected lines contain negligible informationcontent; this is a result of the small variability seen in thetropospheric methane climatologies and because the linewith the most information content is sensitive to methane inthe upper troposphere and stratosphere where methane isexpected to have larger climatological variances.
[45] The spectral line with the most information content ispart of the Q branch. It was therefore decided to only use theQ branch at 1306 cm�1 for the retrieval of methane in orderto remove the effects of different systematic biases on themethane retrieval as a result of using lines from the multiplemethane branches. Biases associated with the Q branch linecan be reduced by comparison of TES retrievals with othermeasurements. However, it is also thought that unquantifiedline mixing can affect the radiative absorption for this line[Brown et al., 2003]. It therefore may be necessary toreexamine the TES spectral windows for methane retrievalsafter TES begins operation.
8.2. Results
[46] Figure 9 shows the northern midlatitude profile errorestimates for the retrieval of methane. Table 5 shows the totalnumber of bits and DOF for the four retrieved atmosphericprofiles. In general, these retrievals are sensitive to methaneconcentrations in the upper troposphere and lower strato-sphere. There is typically less than 1 degree of freedom andone bit of information content for each retrieval.
9. Summary and Discussion
[47] Spectral windows are defined for TroposphericEmission Spectrometer (TES) nadir retrievals of surfacetemperature, atmospheric temperature, H2O, O3, CO, and
Figure 7. (top) Simulated radiance for the 1A1 filter forthe northern midlatitude profile with the final spectralwindows for the CO retrieval shown in red. (middle)Estimated radiance error due to uncertainties in temperatureand water amounts (from the temperature and waterretrieval). The NESR for the 1A1 filter is also shown inthe middle panel. (bottom) Estimated radiance errors fromspectrally interfering species.
Figure 8. Estimated errors for northern midlatitude COretrieval using selected spectral windows shown in Figure 7.
Table 4. Retrieval Characterization for Carbon Monoxide
Retrievala
NorthernMidlatitudes
SouthernMidlatitudes Tropics Polar
Total DOF 0.7 0.8 0.9 0.5Total bits 0.8 1.1 1.4 0.4
aEstimated vertical resolutions for carbon monoxide are not shownbecause there are too few degrees of freedom. However, the simulated TESretrievals are primarily sensitive to CO between approximately 5 and 13 kmover the four climatological regions.
D09308 WORDEN ET AL.: PREDICTED ERRORS OF TES NADIR RETRIEVALS
10 of 12
D09308

CH4. In order to ensure that spectral windows are robustover a variety of climatological conditions, spectral win-dows are selected which maximize the combined informa-tion content for retrievals of four regions representative ofnorthern midlatitude, southern midlatitude, tropical, andpolar climates. Errors that are considered for the spectralwindow selection included smoothing error, measurementerror, uncertainties with atmospheric temperature and inter-fering species, and line parameter uncertainties. A crossstate error which is due to retrieving emissivity jointly withthe atmospheric parameters of interest is also included in theerror budget.[48] The averaging kernels and error covariances from
this spectral window selection are used to predict theestimated vertical resolution, information content, accuracy,and precision for the troposphere and lower stratosphere forthe four profiles used in the spectral window selection.These metrics for the TES nadir retrievals can be used toassess which atmospheric related questions can beaddressed by TES data.[49] The proper characterization of TES atmospheric
retrievals is also critical for applications such as dataassimilation and inverse modeling. For example, astudy by Jones et al. [2003] compared CO fields from the
GEOS-CHEM model to simulated TES retrievals. The TESaveraging kernel matrix and constraint vector were appliedto the GEOS-CHEM profiles in order to compare these twosets of CO profiles. This method of comparison accounts forthe biases and smoothing from TES retrievals. Jones et al.[2003] found that the TES CO retrievals, as characterized inthis paper, have enough vertical resolution and accuracy toestimate at least nine globally distributed carbon monoxidesources, which are associated with geopolitical boundaries.
Appendix A: Spectral Line ParameterUncertainties
[50] The accuracy of the TES atmospheric forward modelspectral radiances depends on spectral line parameter uncer-tainties. Line parameter uncertainties are estimated using theHITRAN [Rothman et al., 1992] database as a guide butalso based upon prior comparisons between measured andmodeled IR radiances and experience with spectral linemeasurements. Line parameter uncertainties are primarilydependent on the strength of the line because the linestrength determines whether the line parameters are directlymeasured, or calculated using a physical or statistical model.These uncertainties are mapped to the covariance of re-trieved parameters in the following manner:[51] 1. Estimated uncertainties are computed for the
spectroscopic parameters of a species; refer to Table A1for an example of estimated of H2O uncertainties.[52] 2. A reference radiance spectrum is computed.[53] 3. A line parameter (i.e., a spectral strength, width, or
shift) is adjusted for the species for the spectral region ofinterest by the estimated uncertainty and a new radiancespectrum is computed. The difference between this newradiance and the reference radiance is the estimated radianceerror for this spectral line parameter (e.g., Figure A1). Note,that it is computationally intractable at this time to adjust thespectral strength, width, and shifts of individual lines.[54] 4. Spectral radiance errors are mapped to the covari-
ance of the retrieved parameters using equation (16) exceptthat the columns of the Jacobians are these calculatedradiance errors and the covariance; Sb is a matrix in whichthe diagonal entries have a value of 1. We use this approachfor mapping spectral line parameter uncertainties into theretrieved parameter covariances in order to account forcorrelations between the line parameter uncertainties.[55] Spectral radiance errors have been computed for four
representative atmospheres (northern midlatitude, southern
Figure 9. Estimated errors for northern midlatitude CH4
retrieval. Only a single spectral window between1305.12 cm�1 and 1306.18 cm�1 is used for this retrieval.
Table 5. Retrieval Characterization for Methane Retrieval
NorthernMidlatitudes
SouthernMidlatitudes Tropics Polar
Total DOF 0.60 0.69 0.43 0.65Total Bits 0.55 0.73 0.30 0.71
Table A1. Line Parameter Uncertainties for H2O Between
1150 cm�1 and 1320 cm�1a
Strength Range at 296 K,b
cm�1 (molecule cm�2)�1
H2O Spectroscopic Error Estimates
Strength, % Widths, % Shifts, cm�1
S > 1.0E-21 3 3 1.0E-41.0E-21 > S > 1.0E-22 4 4 1.0E-31.0E-22 > S > 6.0E-24 7 7 2.0E-36.0E-24 > S > 4.0E-26 10 10 5.0E-34.0E-26 > S > 1.0E-40 25 25 1.0E-2S < 1.0E-40 100 100 1.0E-1
aRead, for example, 1.0E-21 as 1.0 � 10�21.bThe water vapor continuum errors for this spectral region are 4% for the
self and 5% for the foreign.
D09308 WORDEN ET AL.: PREDICTED ERRORS OF TES NADIR RETRIEVALS
11 of 12
D09308

midlatitude, polar, and tropics) and used in the spectralwindow selection for all the retrieved TES species andprimary interferents (e.g., N2O). Table A1 shows an exam-ple of the H2O line parameter errors for the TES 2A1 filterspectral region.
[56] Acknowledgments. We would like to thank Tilman Steck, LindaBrown, Gregory Osterman, Curtis Rinsland, Reinhard Beer, Clive Rodgers,Evan Fishbein, and Michael Gunson for their suggestions, discussions, andcontributions to this research. We would also like to thank the twoanonymous referees who provided thorough and thoughtful reviews of thismanuscript. The research described in this paper was performed at the JetPropulsion Laboratory, California Institute of Technology, under a contractwith the National Aeronautics and Space Administration.
ReferencesBeer, R., T. A. Glavich, and D. M. Rider (2001), Tropospheric emissionspectrometer for the Earth Observing System’s Aura Satellite, Appl. Opt.,40(15), 2356–2367.
Bowman, K. W., J. Worden, T. Steck, H. M. Worden, S. Clough, andC. Rodgers (2002), Capturing time and vertical variability of tropospheric
ozone: A study using TES nadir retrievals, J. Geophys. Res., 107(D23),4723, doi:10.1029/2002JD002150.
Brasseur, G. P., D. A. Hauglustaine, S. Walters, P. J. Rasch, J. F. Muller,C. Granier, and X. X. Tie (1998), MOZART, a global chemical transportmodel for ozone and related chemical tracers: 1. Model description,J. Geophys. Res., 103(D21), 28,265–28,289.
Brown, L. R., et al. (2003), Methane line parameters in HITRAN, J. Quant.Spectrosc. Radiat. Transfer, 82(1–4), 219–238.
Chedin, A., R. Saunders, A. Hollingsworth, N. A. Scott, M. Matricardi,J. Etcheto, C. Clerbaux, R. Armante, and C. Crevoisier (2003), Thefeasibility of monitoring CO2 from high-resolution infrared sounders,J. Geophys. Res., 108(D2), 4064, doi:10.1029/2001JD001443.
Clough, S. A., and M. J. Iacono (1995), Line-by-line calculation of atmo-spheric fluxes and cooling rates: 2. Application to carbon dioxide, ozone,methane, nitrous oxide and the halocarbons, J. Geophys. Res., 100(D8),16,519–16,535.
Clough, S. A., M. W. Shephard, E. J. Mlawer, J. S. Delamere, M. J. Iacono,K. Cady-Pereira, S. Boukabara, and P. D. Brown (2004), Atmosphericradiative transfer modeling: A summary of the AER codes, J. Quant.Spectrosc. Radiat. Transfer., in press.
Dudhia, A., V. L. Jay, and C. D. Rodgers (2002), Microwindow selectionfor high-spectral-resolution sounders, Appl. Opt., 41(18), 3665–3673.
Echle, G., T. von Clarmann, A. Dudhia, J. M. Flaud, B. Funke, N. Glatthor,B. Kerridge, M. Lopez-Puertas, F. J. Martin-Torres, and G. P. Stiller(2000), Optimized spectral microwindows for data analysis of theMichelson Interferometer for Passive Atmospheric Sounding on theenvironmental satellite, Appl. Opt., 39(30), 5531–5540.
Jones, D. B. A., K. W. Bowman, P. I. Palmer, J. R. Worden, D. J. Jacob,R. N. Hoffman, I. Bey, and R. M. Yantosca (2003), Potential of observa-tions from the Tropospheric Emission Spectrometer to constrain conti-nental sources of carbon monoxide, J. Geophys. Res., 108(D24), 4789,doi:10.1029/2003JD003702.
Papoulis, A. (1984), Probability, Random Variables and StochasticProcesses, McGraw-Hill, New York.
Rodgers, C. D. (1998), Information content and optimization of high spec-tral resolution remote measurements, Adv. Space Res., 21(31), 361–367.
Rodgers, C. D. (2000), Inverse Methods for Atmospheric Sounding: Theoryand Practice, World Sci., River Edge, N. J.
Rothman, L. S., et al. (1992), The Hitran Molecular Database—Editionsof 1991 and 1992, J. Quant. Spectrosc. Radiat. Transfer, 48(5 –6),469–507.
Tarantola, A. (1987), Inverse Problem Theory: Methods for Data Fittingand Model Parameter Estimation, Elsevier Sci., New York.
von Clarmann, T., and G. Echle (1998), Selection of optimized microwin-dows for atmospheric spectroscopy, Appl. Opt., 37(33), 7661–7669.
Worden, J. R., K. W. Bowman, and D. B. Jones (2004), Two dimensionalcharacterization of atmospheric profile retrievals from limb soundingobservations, J. Quant. Spectrosc. Radiat. Transfer, 86(1), 45–71.
Yamaguchi, Y., A. B. Kahle, H. Tsu, T. Kawakami, and M. Pniel (1998),Overview of advanced spaceborne thermal emission and reflection radio-meter (ASTER), IEEE Trans. Geosci. Remote Sens., 36(4), 1062–1071.
�����������������������K. Bowman, S. S. Kulawik, H. Worden, and J. Worden, Jet Propulsion
Laboratory, California Institute of Technology, 4800 Oak Grove Drive,Pasadena, CA 91109, USA. ([email protected])S. A. Clough and M. W. Shephard, Atmospheric and Environmental
Research, Inc., 131 Hartwell Avenue, Lexington, MA 02421-3626, USA.A. Goldman, Department of Physics, University of Denver, Denver, CO
80208, USA.
Figure A1. Line parameter systematic errors. Residualradiances are computed and shown in each panel by firstcomputing a reference radiance and then adjusting theindicated H2O line parameters by the estimated error andrecomputing the radiance.
D09308 WORDEN ET AL.: PREDICTED ERRORS OF TES NADIR RETRIEVALS
12 of 12
D09308