Embed Size (px)
Citation preview

34The Journal of Cotton Science 14:34–45 (2010) http://journal.cotton.org, © The Cotton Foundation 2010
ENGINEERING AND GINNINGPredicting Fiber Quality After Commercial Ginning Based on
Fiber Obtained With Laboratory-Scale Gin StandsJ. Clif Boykin*, Derek P. Whitelock, Carlos B. Armijo, Michael D. Buser, Gregory A. Holt,
Thomas D. Valco, Dennis S. Findley, Edward M. Barnes and Michael D. Watson
J.C. Boykin, USDA-ARS, Cotton Ginning Research Unit, 111 Experiment Station Road, Stoneville, MS 38776; D.P. Whitelock and C.B. Armijo, USDA-ARS, Southwestern Cotton Ginning Research Laboratory, P.O. Box 578, Las Cruces, NM 88047; M.D. Buser and G.A. Holt, USDA-ARS, Cotton Production and Processing Research Unit, 1604 East FM 1294, Lubbock, TX 79403; T.D. Valco, USDA-ARS, Office of Technology Transfer, 141 Experiment Station Road, Stoneville, MS 38776; D.S. Findley, Southeastern Cotton Ginners Association, 139 Prominence Court, Suite 110, Dawsonville, GA 30534 ; E.M. Barnes and M.D. Watson, Cotton Incorporated, 6399 Weston Parkway, Cary, NC 27513
*Corresponding author : [email protected]
ABSTRACT
For research purposes, it is often necessary to gin small cotton samples on laboratory-scale gin stands (lab gins) to evaluate fiber properties, but because lab gins differ from commercial gin plants, the validity of the results obtained has been questioned. The objective of this research was to compare fiber properties between cotton processed with lab gins and commercial gin stands. Seed cotton was collected at the gin stand feeder apron and lint was collected before and after lint cleaning at seven commercial cotton gin facilities. Each seed-cotton sample was sub-divided for processing with four lab gins includ-ing two from Dennis Manufacturing, one from Continental Eagle Corporation, and one from Custom Fabricators and Repairs (CFR). Fiber properties of all lint samples were measured with the Advanced Fiber Information System (AFIS). Averaged over all commercial gin facili-ties, the CFR lab gin was found to cause more fiber breakage than the commercial gin stand resulting in a small reduction in fiber length and increase in short fiber content, but no differences were found for the other lab gins. Fineness data for the New Dennis lab gin was lower than the commercial gin stand. Immature fiber content was lower and maturity ratio higher than the commercial gin stand for the Old Dennis, CFR,
and Continental lab gins. Neps were higher for the Old Dennis lab gin than the commercial gin stand, whereas seed-coat neps were higher for the CFR lab gin and lower for the New Dennis and Old Dennis lab gin. When these results were analyzed for all commercial gin facilities it was found that in most cases (except neps) differ-ences between the lab gins and the commercial gin stands were not consistent from one gin facil-ity to the next. This proved that results obtained from lab gins cannot be precisely reproduced, even with a correction factor, in commercial gin plants. Correlation analysis indicated that the New Dennis gin stand produced lint samples that were the most similar to commercial gin stand lint samples when considering all properties, and most correlations were strong for other lab gins as well. These results show that lab gins offer an effective, convenient screening tool for cotton researchers predicting fiber quality in commercial gins.
In commercial cotton processing in the USA, cotton is typically harvested by a mechanical
picker or stripper, stored and transported in a module, and pneumatically conveyed through a sequence of gin processes including drying, seed-cotton cleaning, ginning, lint cleaning, and bale packaging. Some of these processes alter various properties of cotton. Marketed bales are typically sampled and measured by High Volume Instrument (HVI) at the USDA Agricultural Marketing Service to determine fiber properties such as color, length, micronaire, strength, and trash content, which are important in textile processing.
Fiber quality is an important aspect of cotton research, and fiber must be removed (ginned) from the seed to determine its bulk properties. Research plots may yield too small a quantity of seed cotton to gin with conventional machinery, so laboratory-scale gin stands (lab gins) are used to process cotton prior to fiber quality analysis. These lab gins differ from commercial ginning in several ways, so the

35BOYKIN ET AL.: FIBER QUALITY OF COMMERCIAL VS. LABORATORY SCALE GINS
validity of this method of determining fiber proper-ties has been questioned. In tests utilizing lab gins, seed cotton may be picked by hand or machine and cleaned by hand or not at all before ginning, and the lint is typically not cleaned. Because picking, drying, seed-cotton cleaning, and lint cleaning are known to alter fiber properties, it is understandable that the use of lab gins in studies including fiber quality analysis has been questioned.
Several tests have been conducted to address this issue (Calhoun et al., 1996; Boykin, 2008; Boykin and Creech, 2004; and Gannaway et al., 2004). In these tests, cotton cultivars compared differently for certain properties depending on whether the lint was obtained with conventional ginning or with a lab gin, but the lab gins were found to be adequate to predict most fiber property differences among cotton cultivars. These tests analyzed HVI data only and included one lab gin compared to one commercial gin. There is no documented research that compares multiple lab gins to multiple commercial gins using fiber quality data determined with the Advanced Fi-ber Information System (AFIS, Uster Technologies, Knoxville, TN). The objective of this research was to compare fiber quality of lint from four lab gins to fiber quality of lint from commercial gins.
MATERIALS AND METHODS
Seed cotton and lint were sampled at seven com-mercial cotton gin facilities during regular operation. Facility locations spanned the cotton belt represent-ing the southeast, mid-south, southwest, and far-west regions. The cottons tested included a range of cotton cultivars, agronomic practices, and environmental conditions and provided a wide variety of cottons to test the lab gins. The details of the cottons collected were not the focus of this research. In this report, cottons collected from the seven commercial gin facilities were designated SOURCE and labeled 1, 5, 21, 22, 31, 33, and 99. For each SOURCE, five seed-cotton samples were collected at the feeder apron of
one gin stand for one module of cotton. Simultaneous to the seed cotton, lint was collected after the same gin stand so that five samples each were obtained before the gin stand, after the gin stand, and after the subsequent lint cleaner(s) for each SOURCE.
For each SOURCE, the five seed-cotton samples were subdivided into four samples and ginned on four lab gins to obtain five lint samples for each lab gin. Lab gin specifications are given in Table 1. Because simultaneous lint samples were collected after the commercial gin stand and after the commercial lint cleaners for each SOURCE, there were five commercial gin stand and five commercial lint cleaner lint samples that matched the lab gin lint samples. These constituted the six GIN treatments as follows:
1) AfGS (commercial gin stand): varied for each SOURCE
2) AfLC (commercial gin stand with lint cleaning): varied for each SOURCE
3) New Dennis (Dennis Manufacturing, Athens, TX): a 10-saw lab gin (Fig. 1)
4) Old Dennis: an older model of the New Dennis lab gin (Fig. 2)
5) CFR (Custom Fabricators and Repairs, Bryan, TX): a 10-saw lab gin (Fig. 3)
6) Continental (Continental Eagle Corporation, Pratville, AL): a 10-saw lab gin (Fig. 4)
Before ginning was done on the four lab gins, the seed-cotton samples were stored for at least 72 hours at Cotton Incorporated in a conditioned envi-ronment with temperature maintained at 21 ˚C (70
˚F) and relative humidity maintained at 50%. All lab ginning was done in this conditioned environment, so SOURCE to SOURCE variability for these GIN treatments was due to differences in the cotton only. This was not true for the AfGS and AfLC GIN treat-ments that had additional SOURCE to SOURCE variability due to different gin stands, lint clean-ers, and ambient conditions associated with each SOURCE. Fiber properties for all lint samples were determined with the AFIS at Cotton Incorporated.
Table 1. Lab gin specifications
Lab gin Saw diameter, cm
Saw speed, RPM Teeth per saw Brush roller
diameter, cmBrush roller speed, RPM Brushes Brush length,
cmOld Dennis 12.7 845 137 20.32 3063 8 5
New Dennis 12.7 476 137 20.32 1725 8 5
CFR 12.7 1355 137 20.32 2372 6 2.5
Continental 25.4 311 235 30.48 1096 14 2.5

36JOURNAL OF COTTON SCIENCE, Volume 14, Issue 1, 2010
Statistical analysis of AFIS fiber properties was performed with the Mixed Procedure (SAS v8.2, Cary, NC, 2001). To develop the statistical model, each SOURCE was considered an experi-ment with randomized complete block design. The five replications for each SOURCE were the ex-perimental blocks with each block containing the six GIN treatments. The statistical model included the fixed effects SOURCE, GIN, and their interaction (SOURCE*GIN). Replication within SOURCE was included as a random effect. There were seven levels for the factor SOURCE and there were six levels for the factor GIN. As the analysis was interpreted, it
became clear that when a SOURCE*GIN interaction was found to be significant there was no clear way to distinguish (statistically) which GIN treatment(s) were responsible for the interaction. Therefore, sub-sets of the data were analyzed using the same model described above. First, the factor GIN was reduced to two levels including only AfGS and one of the other five GIN treatments to separately analyze five data subsets. Next, the factor GIN was reduced to two levels including only AfLC and one of the other four GIN treatments to separately analyze four data subsets. This subset method was used to study the GIN*SOURCE interaction specific to each pair of GIN treatments, which allowed each lab gin to be compared individually to either the AfGS or AfLC.
RESULTS
Overall Differences in Gin Stands. Fiber length properties differed among GIN treatments (Table 2). Upper quartile length by weight (UQLw) averaged 30.7 mm for AfGS samples, 30.3 mm for AfLC samples, and varied from 30.4 to 30.8 mm among the four lab gins (New Dennis, Old Dennis, Continental, and CFR). The UQLw for CFR and AfLC samples was statistically lower than AfGS, though differences were less than 0.5 mm. Short fiber content by weight (SFCw) was generally higher for GIN treatments with lower UQLw. Reduced fiber length results from exces-sive fiber breakage, which also increases short fiber content. It was no surprise that lint cleaning reduced fiber length and increased short fiber content, but it was significant to note that the CFR was the only lab gin found to reduce fiber length and increase short fiber content relative to the commercial gin stand (AfGS). This indicated that fiber breakage with the CFR lab gin was significantly greater than the com-mercial gin stand, but fiber breakage with the New Dennis, Old Dennis, and Continental lab gins did not differ significantly from the commercial gin stand.
Fiber fineness, immature fiber content (IFC), and maturity differed among GIN treatments (Table 2). Fineness was lower for New Dennis samples than AfGS samples, but the other lab gins did not differ statistically from AfGS. The Old Dennis, Continen-tal, and CFR samples averaged lower IFC and higher maturity ratio than AfGS samples, but the New Den-nis samples did not differ statistically from AfGS. Overall, fineness, IFC, and maturity ratio data for the AfGS was much more similar to the New Dennis than to the other lab gins.
Figure 1. 10-saw New Dennis lab gin.
Figure 2. 10-saw Old Dennis lab gin.
Figure 3. 10-saw CFR lab gin.
Figure 4. 10-saw Continental lab gin.

37BOYKIN ET AL.: FIBER QUALITY OF COMMERCIAL VS. LABORATORY SCALE GINS
and the CFR had less trash. The Old Dennis samples had overall larger trash particles due to the low dust content and the Continental samples had overall smaller trash particles due to the high dust content.
Interactions Between GIN and SOURCE. All fiber properties differed significantly for the factor SOURCE (Tables 2 and 3), meaning there was sig-nificant variation among the commercial gin plants surveyed. This variation was due to differences in varieties, production practices, environmental condi-tions, gin machinery, and other undocumented factors. Fiber property values for SOURCE were not relevant to this study, but variation in SOURCE provided an inference base to test GIN treatments. To predict fiber properties of commercial gins with lab gins, sample values should be equal to commercial gin sample values for each commercial gin plant surveyed or they should differ by a consistent or predictable amount. For each property, there was a significant interaction between SOURCE and GIN with P < 0.05 (Tables 2 and 3). The significant interaction indicated that differences among GIN treatments depended on the SOURCE used for comparison. The general impli-cation of these results is that cotton ginned with lab gins may not be adequate to predict fiber properties measured after commercial ginning because the off-sets between GIN treatments were not consistent for each SOURCE. However, statistical analysis of the factor GIN*SOURCE included all GIN treatments, so
Neps and seed-coat neps (SCN) differed among GIN treatments (Table 3). Neps were lowest for AfGS (237 neps/g lint) and highest for AfLC (296 neps/g lint). Additional mechanical neps are created with additional mechanical processing, so it was not surprising that the commercial lint cleaner (AfLC) had the highest neps. The Old Dennis samples had more neps than the AfGS samples, but differences were not statistically significant for the other lab gins. Increased neps with the Old Dennis samples indicate that the gin saws or ribs were worn or not properly aligned, but this condi-tion also tends to increase fiber breakage, which was not found for this lab gin. Compared to AfGS samples, the New Dennis and Old Dennis had significantly fewer SCN and the CFR had significantly more SCN. The SCN for AfLC and Continental samples did not differ statistically from AfGS samples. Reduced SCN for the New Dennis and Old Dennis lab gins indicated reduced damage to the cotton seed as compared to the commercial gin stand, but increased SCN for the CFR lab gin indicated increased damage to the cotton seed.
Trash size, the number of dust particles (dust), the number of larger trash particles (trash), and the percent visible foreign material (VFM) differed among GIN treatments (Table 3). As expected, the AfLC samples had less dust, trash, and VFM than the AfGS samples. Compared to the AfGS samples, the New Dennis sam-ples had less dust and VFM; the Old Dennis had less dust, trash, and VFM; the Continental had more dust;
Table 2. Statistical analysis of AFIS fiber length, fineness, and maturity properties as affected by GIN, SOURCE, and GIN*SOURCE interaction. Model 1 included all 7 levels of the factor SOURCE and 6 levels of the factor GIN
UQLw, mm [z] SFCw, % [z] Ln5%, mm [z] Fineness, mtex IFC, % [z] Maturity ratioGIN Least squares means [y]
AfGS [x] 30.7 a 10.0 bc 34.4 a 170.6 a 9.41 b 0.846 cAfLC [x] 30.3 b 10.9 a 34.0 b 168.5 b 9.83 a 0.833 eNew Dennis [w] 30.6 a 9.7 c 34.4 a 168.1 b 9.42 b 0.840 dOld Dennis [w] 30.8 a 9.6 c 34.4 a 171.5 a 6.40 c 0.907 aContinental [w] 30.6 a 10.2 b 34.3 a 170.5 a 6.49 c 0.902 abCFR [w] 30.4 b 11.2 a 34.0 b 170.3 a 6.53 c 0.898 bLSD 0.2 0.4 0.2 1.3 0.26 0.005Factor F-values [v]
SOURCE 306.65 238.05 299.32 97.50 206.90 172.62GIN 11.65 18.35 10.09 7.71 320.27 312.12GIN*SOURCE 6.09 8.02 5.78 2.64 11.01 11.35
[z] UQLw = upper quartile length by weight, SFCw = short fiber content by weight, Ln5% = upper fifth percentile by number, IFC = immature fiber content.
[y] Means for GIN treatments followed by the same letter did not differ significantly (P < 0.05).[x] Samples obtained after the commercial gin stand (AfGS) or commercial lint cleaner (AfLC).[w] Samples obtained from lab gins.[v] All factors significant with P < 0.0001.

38JOURNAL OF COTTON SCIENCE, Volume 14, Issue 1, 2010
further analysis was conducted to determine for which GIN treatments the interaction was least significant, and thus would give the most consistent results across a variety of seed cotton conditions and characteristics.
Each GIN treatment was analyzed individually with the AfGS treatment, and also with the AfLC treatment (Tables 4 and 5). For each analysis, a statistical model was used to evaluate a subset of
the data that included only two levels for the fac-tor GIN. The model included the factors SOURCE (seven commercial gin plants surveyed), GIN (2 GIN treatments included in the data subset), and the SOURCE*GIN interaction. The results for the factors GIN and SOURCE are shown in Tables 2 and 3 and only the statistics for the SOURCE*GIN interaction are shown in Tables 4 and 5.
Table 3. Analysis of AFIS fiber neps, seed-coat neps, and trash properties as affected by GIN, SOURCE, and GIN*SOURCE interaction. Model 1 included all 7 levels of the factor SOURCE and 6 levels of the factor GIN
Neps count / g lint SCN count / g lint [z] Trash size, um Dust count / g lint Trash count / g lint VFM, % [z]
GIN Least squares means [y]
AfGS [x] 237 c 19.6 b 337 b 587 b 121 a 2.61 aAfLC [x] 296 a 19.1 b 348 ab 334 d 78 d 1.76 cNew Dennis [w] 240 c 15.2 c 339 b 497 c 113 ab 2.36 bOld Dennis [w] 262 b 13.7 c 354 a 360 d 91 c 1.84 cContinental [w] 240 c 19.1 b 307 d 655 a 112 ab 2.59 abCFR [w] 250 bc 24.7 a 320 c 602 b 111 b 2.76 aLSD 19 2.5 11 52 9 0.23Factor F-values [v]
SOURCE 137.64 52.66 15.18 46.28 75.84 63.64GIN 11.35 17.94 19.10 51.80 26.16 26.33GIN* SOURCE 1.69* 1.95** 3.42 3.98 3.92 3.93
[z] SCN = seed-coat neps, VFM = visible foreign matter.[y] Means for GIN treatments followed by the same letter did not differ significantly (P < 0.05).[x] Samples obtained after the commercial gin stand (AfGS) or commercial lint cleaner (AfLC).[w] Samples obtained from lab gins.[v] All factors significant (P < 0.0001) unless noted ** (P < 0.01) or * (P < 0.05).
Table 4. Analysis of GIN*SOURCE interaction for AFIS fiber length, fineness, and maturity properties
UQLw, mm [z] SFCw, % [z] Ln5%, mm [z] Fineness, mtex IFC, % [z] Maturity ratioGIN Statistical model 2 [y]
GIN*SOURCE F-values for each GIN compared to AfGS [x, w]
AfLC [x] 0.38 n.s. 4.01 0.55 n.s. 2.20 n.s. 1.94 n.s. 3.73New Dennis 4.49 8.74 4.55 0.59 n.s. 1.31 n.s. 1.42 n.s.Old Dennis 9.67 13.50 10.19 2.91* 26.78 22.68Continental 9.69 14.42 12.14 4.41 31.46 27.78CFR 8.97 20.20 9.99 2.95* 24.92 18.15GIN Statistical model 3 [v]
GIN*SOURCE F-values for each GIN compared to AfLC [x, w]
New Dennis 6.14 10.04 6.21 3.26* 0.76 n.s. 3.07*Old Dennis 11.06 15.23 9.88 4.48 14.19 21.56Continental 11.07 12.60 11.06 3.99 15.53 21.46CFR 11.92 17.79 14.07 3.32* 22.60 18.14
[z] UQLw = upper quartile length by weight, SFCw = short fiber content by weight, Ln5% = upper fifth percentile by number, IFC = immature fiber content.
[y] In model 2, GIN reduced to 2 levels including AfGS and the GIN treatment noted in each line.[x] AfGS = after commercial gin stand, AfLC = after commercial lint cleaner.[w] All factors significant at P < 0.01 unless noted * (P < 0.05) or n.s. (not significant).[v] In model 3, GIN reduced to 2 levels including AfLC and the GIN treatment noted in each line.

39BOYKIN ET AL.: FIBER QUALITY OF COMMERCIAL VS. LABORATORY SCALE GINS
When AfLC samples were analyzed with AfGS samples, the SOURCE*GIN interaction (F = 0.38) was not significant for UQLw (Table 4), meaning the difference between AfGS and AfLC samples did not vary with SOURCE. When each lab GIN treatment was analyzed with AfGS samples, all SOURCE*GIN interactions were significant for UQLw with F-values ranging from 4.49 for New Dennis samples to 9.69 for Continental samples. When each lab GIN treatment was analyzed with AfLC samples, the SOURCE*GIN interactions were significant for UQLw with F-values ranging from 6.14 to 11.92 (Table 4). These results indicated that UQLw for none of the lab gin treatments differed consistently from either AfGS or AfLC samples for each SOURCE. This was also true for SFCw (Table 4). For UQLw and SFCw, the F-value was lowest (weakest interaction) for the New Dennis samples analyzed with either the AfGS or AfLC samples, so the New Dennis results, though significantly different, were most consistent with AfGS and AfLC results.
For fineness, IFC, and maturity ratio, the New Dennis was the only lab GIN treatment analyzed with AfGS samples without a significant SOURCE*GIN interaction (Table 4). This was also true for neps (Table 5). The Old Dennis was the only lab GIN treatment without a significant SOURCE*GIN inter-
action for SCN, and the Continental was the only lab GIN treatment without a significant SOURCE*GIN interaction for trash content and VFM (Table 5). These results suggest that the New Dennis was con-sistent with AfGS for fineness, IFC, maturity ratio, and neps; the Old Dennis was consistent with AfGS for SCN; the Continental was consistent with AfGS for trash content and VFM; but none of the lab GIN treatments were consistent with AfGS for trash size or dust content.
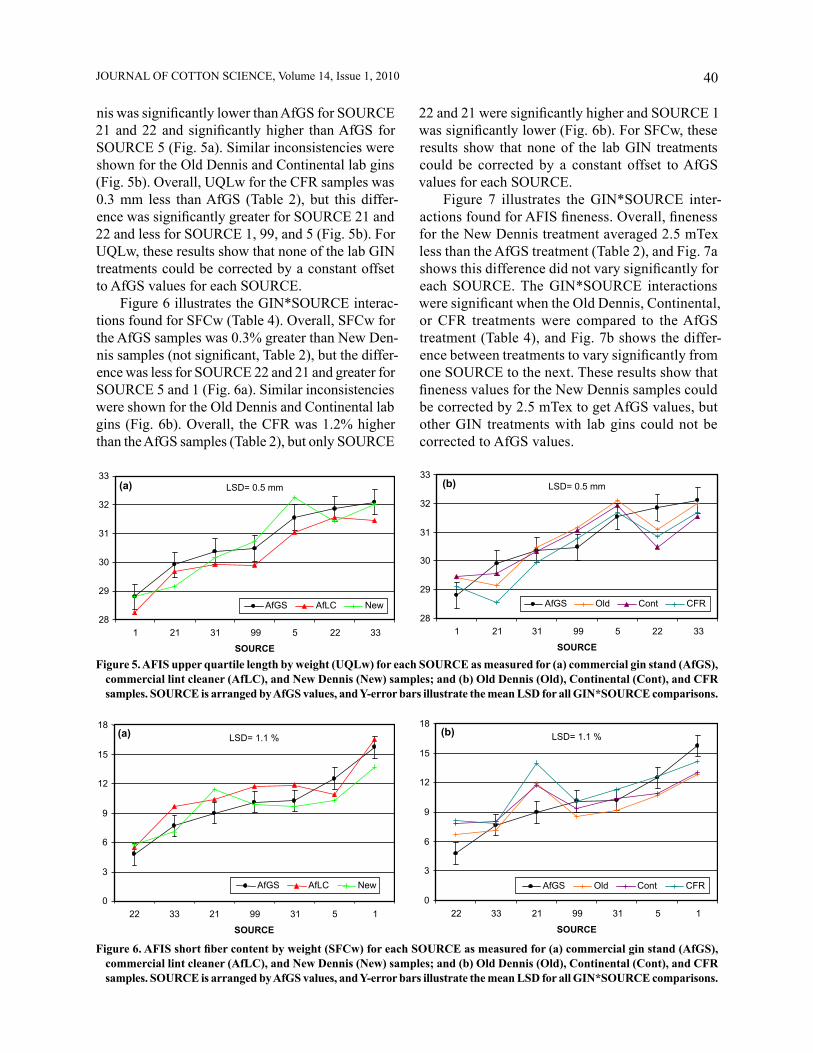
Variation in Results Across Gin Plants. Figure 5 illustrates the GIN*SOURCE interactions found for UQLw, which were significant when AfGS samples were analyzed with New Dennis, Old Dennis, Con-tinental, or CFR samples (Table 4). In these plots, SOURCE was sorted by UQLw for AfGS samples, and Y-error bars were displayed on each AfGS value to show the least significant difference (LSD) aver-aged for all GIN*SOURCE comparisons. Trends in UQLw between each SOURCE were consistent for the AfGS and AfLC samples as the offset between AfGS and AfLC did not differ significantly with SOURCE (Fig. 5a). But this was not true when comparing New Dennis, Old Dennis, Continental, or CFR samples to AfGS samples. Overall, UQLw for the AfGS samples and New Dennis samples did not differ significantly (Table 2), but the New Den-
Table 5. Analysis of GIN*SOURCE interaction for AFIS fiber neps, seed-coat neps, and trash properties
Neps count / g lint SCN count / g lint [z] Trash size, um Dust count / g lint Trash count / g lint VFM, % [z]
GIN Statistical model 2 [y]
GIN*SOURCE F-values for each GIN compared to AfGS [x, w]
AfLC [x] 1.35 n.s. 1.71 n.s. 2.74* 15.33 12.01 9.73
New Dennis 2.16 n.s. 2.46* 3.09* 4.18 7.21 4.89
Old Dennis 2.50* 1.58 n.s. 7.12 8.46 7.72 6.09
Continental 2.60* 4.29 8.07 2.92* 2.31 n.s. 1.62 n.s.
CFR 3.49* 3.78 2.61* 3.89 7.40 6.06
GIN Statistical model 3 [v]
GIN*SOURCE F-values for each GIN compared to AfLC [x, w]
New Dennis 1.37 n.s. 1.26 n.s. 4.74 4.51 7.34 8.76
Old Dennis 1.52 n.s. 0.98 n.s. 3.30 11.14 7.22 13.94
Continental 2.25 n.s. 2.40 n.s. 5.95 6.68 7.79 5.04
CFR 2.75* 2.11 n.s. 2.81* 5.66 10.18 9.71[z] SCN= seed coat neps, VFM= visible foreign matter.[y] In model 2, GIN reduced to 2 levels including AfGS and the GIN treatment noted in each line.[x] AfGS= after commercial gin stand, AfLC= after commercial lint cleaner.[w] All factors significant at P < 0.01 unless noted * (P < 0.05) or n.s. (not significant).[v] In model 3, GIN reduced to 2 levels including AfLC and the GIN treatment noted in each line.
40JOURNAL OF COTTON SCIENCE, Volume 14, Issue 1, 2010
nis was significantly lower than AfGS for SOURCE 21 and 22 and significantly higher than AfGS for SOURCE 5 (Fig. 5a). Similar inconsistencies were shown for the Old Dennis and Continental lab gins (Fig. 5b). Overall, UQLw for the CFR samples was 0.3 mm less than AfGS (Table 2), but this differ-ence was significantly greater for SOURCE 21 and 22 and less for SOURCE 1, 99, and 5 (Fig. 5b). For UQLw, these results show that none of the lab GIN treatments could be corrected by a constant offset to AfGS values for each SOURCE.
Figure 6 illustrates the GIN*SOURCE interac-tions found for SFCw (Table 4). Overall, SFCw for the AfGS samples was 0.3% greater than New Den-nis samples (not significant, Table 2), but the differ-ence was less for SOURCE 22 and 21 and greater for SOURCE 5 and 1 (Fig. 6a). Similar inconsistencies were shown for the Old Dennis and Continental lab gins (Fig. 6b). Overall, the CFR was 1.2% higher than the AfGS samples (Table 2), but only SOURCE
Figure 5. AFIS upper quartile length by weight (UQLw) for each SOURCE as measured for (a) commercial gin stand (AfGS), commercial lint cleaner (AfLC), and New Dennis (New) samples; and (b) Old Dennis (Old), Continental (Cont), and CFR samples. SOURCE is arranged by AfGS values, and Y-error bars illustrate the mean LSD for all GIN*SOURCE comparisons.
(b)
28
29
30
31
32
33
1 21 31 99 5 22 33
SOURCE
AfGS Old Cont CFR
LSD= 0.5 mm
(a)
28
29
30
31
32
33
1 21 31 99 5 22 33
SOURCE
AfGS AfLC New
LSD= 0.5 mm (b)
28
29
30
31
32
33
1 21 31 99 5 22 33
SOURCE
AfGS Old Cont CFR
LSD= 0.5 mm
(a)
28
29
30
31
32
33
1 21 31 99 5 22 33
SOURCE
AfGS AfLC New
LSD= 0.5 mm
(b)
0
3
6
9
12
15
18
22 33 21 99 31 5 1
SOURCE
AfGS Old Cont CFR
LSD= 1.1 %
(a)
0
3
6
9
12
15
18
22 33 21 99 31 5 1
SOURCE
AfGS AfLC New
LSD= 1.1 % (b)
0
3
6
9
12
15
18
22 33 21 99 31 5 1
SOURCE
AfGS Old Cont CFR
LSD= 1.1 %
(a)
0
3
6
9
12
15
18
22 33 21 99 31 5 1
SOURCE
AfGS AfLC New
LSD= 1.1 %
Figure 6. AFIS short fiber content by weight (SFCw) for each SOURCE as measured for (a) commercial gin stand (AfGS), commercial lint cleaner (AfLC), and New Dennis (New) samples; and (b) Old Dennis (Old), Continental (Cont), and CFR samples. SOURCE is arranged by AfGS values, and Y-error bars illustrate the mean LSD for all GIN*SOURCE comparisons.
22 and 21 were significantly higher and SOURCE 1 was significantly lower (Fig. 6b). For SFCw, these results show that none of the lab GIN treatments could be corrected by a constant offset to AfGS values for each SOURCE.
Figure 7 illustrates the GIN*SOURCE inter-actions found for AFIS fineness. Overall, fineness for the New Dennis treatment averaged 2.5 mTex less than the AfGS treatment (Table 2), and Fig. 7a shows this difference did not vary significantly for each SOURCE. The GIN*SOURCE interactions were significant when the Old Dennis, Continental, or CFR treatments were compared to the AfGS treatment (Table 4), and Fig. 7b shows the differ-ence between treatments to vary significantly from one SOURCE to the next. These results show that fineness values for the New Dennis samples could be corrected by 2.5 mTex to get AfGS values, but other GIN treatments with lab gins could not be corrected to AfGS values.

41BOYKIN ET AL.: FIBER QUALITY OF COMMERCIAL VS. LABORATORY SCALE GINS
Figure 8 illustrates the GIN*SOURCE interac-tions found for AFIS immature fiber content (IFC), and Fig. 9 illustrates the GIN*SOURCE interactions found for AFIS maturity ratio (Table 4). The IFC for New Dennis samples did not differ significantly from the AfGS samples for any SOURCE (Fig. 8a). Overall, the maturity ratio for New Dennis samples was 0.006 less than the AfGS samples (Table 2), and Fig. 9a shows this amount did not vary significantly for each SOURCE. Overall, IFC for the other three lab GIN treatments was significantly lower than the AfGS samples and the maturity ratio was significantly higher (Table 2), and this was true for each SOURCE except 99, which had the lowest IFC and highest maturity ratio (Figs. 8b and 9b). The difference between the AfGS samples and the other three lab GIN treatments increased for each SOURCE as the IFC for the AfGS samples increased (Fig. 8b) or the maturity ratio for
the AfGS samples decreased (Fig. 9b). It appeared that a shift (increase) in maturity measured for the other three lab GIN treatments overshadowed differ-ences in SOURCE for low IFC; and this also affected results for maturity ratio, which is the ratio of mature fibers (maturity greater than 0.5) to immature fibers (maturity less than 0.25). These results show that IFC and maturity ratio values for the New Dennis samples could be corrected to get AfGS values, but this was not true for the other three lab gins.
Figure 10 illustrates the GIN*SOURCE interac-tions found for AFIS neps. Overall, the New Dennis samples did not differ significantly from the AfGS samples (Table 3), and Fig. 10a shows this is true for each SOURCE except 99, which was significantly higher in neps for the New Dennis samples. This dif-ference for SOURCE 99 was not strong enough for the GIN*SOURCE interaction to be significant when
Figure 7. AFIS fineness for each SOURCE as measured for (a) commercial gin stand (AfGS), commercial lint cleaner (AfLC), and New Dennis (New) samples; and (b) Old Dennis (Old), Continental (Cont), and CFR samples. SOURCE is arranged by AfGS values, and Y-error bars illustrate the mean LSD for all GIN*SOURCE comparisons.
(b)
150
160
170
180
190
5 1 22 21 31 99 33
5 1 22 21 31 99 33
SOURCE
LSD= 3.7 mTex
AfGS Old Cont CFR
(a)
150
160
170
180
190
SOURCE
AfGS AfLC New
LSD= 3.7 mTex (b)
150
160
170
180
190
5 1 22 21 31 99 33
5 1 22 21 31 99 33
SOURCE
LSD= 3.7 mTex
AfGS Old Cont CFR
(a)
150
160
170
180
190
SOURCE
AfGS AfLC New
LSD= 3.7 mTex
(b)
4
6
8
10
12
14
16
99 22 21 33 31 1 5
SOURCE
LSD= 0.73 %
AfGS Old Cont CFR
(a)
4
6
8
10
12
14
16
99 22 21 33 31 1 5
SOURCE
AfGS AfLC New
LSD= 0.73 % (b)
4
6
8
10
12
14
16
99 22 21 33 31 1 5
SOURCE
LSD= 0.73 %
AfGS Old Cont CFR
(a)
4
6
8
10
12
14
16
99 22 21 33 31 1 5
SOURCE
AfGS AfLC New
LSD= 0.73 %
Figure 8. AFIS immature fiber content (IFC) for each SOURCE as measured for (a) commercial gin stand (AfGS), commer-cial lint cleaner (AfLC), and New Dennis (New) samples; and (b) Old Dennis (Old), Continental (Cont), and CFR samples. SOURCE is arranged by AfGS values, and Y-error bars illustrate the mean LSD for all GIN*SOURCE comparisons.

42JOURNAL OF COTTON SCIENCE, Volume 14, Issue 1, 2010
comparing the New Dennis samples to the AfGS samples (Table 5). The GIN*SOURCE interactions were significant when comparing the other three lab GIN treatments to the AfGS samples (Table 5), but it was clear that values shown in Fig. 10b would fall within the Y-error bars for AfGS samples if adjusted for a constant offset for each treatment. For neps, these results indicated that values for all the lab GIN treatments could be corrected to AfGS values.
Figure 11 illustrates the GIN*SOURCE inter-actions found for AFIS SCN. When compared to AfGS samples, the GIN*SOURCE interactions were significant for the New Dennis, Continental, and CFR samples (Table 5). Overall, the New Dennis samples had significantly fewer SCN than AfGS samples (Table 3), but this was only true individually for SOURCE 33 and 5 (Fig. 11a). Overall, the Conti-nental samples’ SCN did not differ significantly from that of the AfGS samples (Table 3), but significantly
fewer SCN were found for Continental samples from SOURCE 5 (Fig. 11b). Overall, the CFR samples had significantly more SCN than the AfGS samples (Table 3), but this was only true for SOURCE 1 and 99 (Fig. 11b). For SCN, these results show that Old Dennis sample values could be corrected by 5.9 SCN to get AfGS values, but other GIN treatments with lab gins could not be corrected to AfGS values.
Figure 12 illustrates the GIN*SOURCE interac-tions found for AFIS dust content. When compared to AfGS samples, the GIN*SOURCE interactions were significant for all GIN treatments (Table 5), and Figs. 12a and 12b show the difference between treatments to vary significantly from one SOURCE to the next. Figure 13 illustrates the GIN*SOURCE interactions found for AFIS trash content. When compared to AfGS samples, the GIN*SOURCE interactions were significant for the AfLC, New Dennis, Old Dennis, and CFR samples (Table 5),
(b)
0.75
0.80
0.85
0.90
0.95
5 1 31 33 22 21 99
5 1 31 33 22 21 99
SOURCE
LSD= 0.015
AfGS Old Cont CFR
(a)
0.75
0.80
0.85
0.90
0.95
SOURCE
AfGS AfLC New
LSD= 0.015(b)
0.75
0.80
0.85
0.90
0.95
5 1 31 33 22 21 99
5 1 31 33 22 21 99
SOURCE
LSD= 0.015
AfGS Old Cont CFR
(a)
0.75
0.80
0.85
0.90
0.95
SOURCE
AfGS AfLC New
LSD= 0.015
Figure 9 AFIS maturity ratio for each SOURCE as measured for (a) commercial gin stand (AfGS), commercial lint cleaner (AfLC), and New Dennis (New) samples; and (b) Old Dennis (Old), Continental (Cont), and CFR samples. SOURCE is arranged by AfGS values, and Y-error bars illustrate the mean LSD for all GIN*SOURCE comparisons.
(b)
0
100
200
300
400
500
600
21 22 33 31 99 1 5
SOURCE
LSD= 52 neps/g lint
AfGS Old Cont CFR
(a)
0
100
200
300
400
500
600
21 22 33 31 99 1 5
SOURCE
AfGS AfLC New
LSD= 52 neps/g lint
10
(b)
0
100
200
300
400
500
600
21 22 33 31 99 1 5
SOURCE
LSD= 52 neps/g lint
AfGS Old Cont CFR
(a)
0
100
200
300
400
500
600
21 22 33 31 99 1 5
SOURCE
AfGS AfLC New
LSD= 52 neps/g lint
10
Figure 10. AFIS neps for each SOURCE as measured for (a) commercial gin stand (AfGS), commercial lint cleaner (AfLC), and New Dennis (New) samples; and (b) Old Dennis (Old), Continental (Cont), and CFR samples. SOURCE is arranged by AfGS values, and Y-error bars illustrate the mean LSD for all GIN*SOURCE comparisons.

43BOYKIN ET AL.: FIBER QUALITY OF COMMERCIAL VS. LABORATORY SCALE GINS
and Fig. 13 shows the difference between these treatments to vary significantly from one SOURCE to the next. For dust content, these results show that none of the lab GIN treatments could be corrected by
a constant offset to AfGS values for each SOURCE. For trash content, these results show only the Con-tinental samples could be corrected to AfGS values by a constant offset.
(b)
0
10
20
30
40
50
21 31 1 22 33 99 5
SOURCE
LSD= 7.0 SCN/g lint
AfGS Old Cont CFR
(a)
0
10
20
30
40
50
21 31 1 22 33 99 5
SOURCE
AfGS AfLC New
LSD= 7.0 SCN/g lint (b)
0
10
20
30
40
50
21 31 1 22 33 99 5
SOURCE
LSD= 7.0 SCN/g lint
AfGS Old Cont CFR
(a)
0
10
20
30
40
50
21 31 1 22 33 99 5
SOURCE
AfGS AfLC New
LSD= 7.0 SCN/g lint
Figure 11. AFIS neps for each SOURCE as measured for (a) commercial gin stand (AfGS), commercial lint cleaner (AfLC), and New Dennis (New) samples; and (b) Old Dennis (Old), Continental (Cont), and CFR samples. SOURCE is arranged by AfGS values, and Y-error bars illustrate the mean LSD for all GIN*SOURCE comparisons.
(b)
0
200
400
600
800
1000
1200
21 31 99 1 33 22 5
SOURCE
LSD=142 dust/g lint
AfGS Old Cont CFR
(a)
0
200
400
600
800
1000
1200
21 31 99 1 33 22 5
SOURCE
AfGS AfLC New
LSD=142 dust/g lint (b)
0
200
400
600
800
1000
1200
21 31 99 1 33 22 5
SOURCE
LSD=142 dust/g lint
AfGS Old Cont CFR
(a)
0
200
400
600
800
1000
1200
21 31 99 1 33 22 5
SOURCE
AfGS AfLC New
LSD=142 dust/g lint
Figure 12. AFIS dust content for each SOURCE as measured for (a) commercial gin stand (AfGS), commercial lint cleaner (AfLC), and New Dennis (New) samples; and (b) Old Dennis (Old), Continental (Cont), and CFR samples. SOURCE is arranged by AfGS values, and Y-error bars illustrate the mean LSD for all GIN*SOURCE comparisons.
(b)
0
50
100
150
200
250
31 21 99 1 33 5 22
SOURCE
LSD=25 trash/g lint
AfGS Old Cont CFR
(a)
0
50
100
150
200
250
31 21 99 1 33 5 22
SOURCE
AfGS AfLC New
LSD=25 trash/g lint (b)
0
50
100
150
200
250
31 21 99 1 33 5 22
SOURCE
LSD=25 trash/g lint
AfGS Old Cont CFR
(a)
0
50
100
150
200
250
31 21 99 1 33 5 22
SOURCE
AfGS AfLC New
LSD=25 trash/g lint
Figure 13. AFIS trash content for each SOURCE as measured for (a) commercial gin stand (AfGS), commercial lint cleaner (AfLC), and New Dennis (New) samples; and (b) Old Dennis (Old), Continental (Cont), and CFR samples. SOURCE is arranged by AfGS values, and Y-error bars illustrate the mean LSD for all GIN*SOURCE comparisons.

44JOURNAL OF COTTON SCIENCE, Volume 14, Issue 1, 2010
Correlation Analysis. Results have indicated that in most cases, fiber properties determined for lab GIN treatments cannot be corrected by constant offsets to equal AfGS values for each SOURCE. The exceptions to this were fineness, IFC, and maturity ratio measured for the New Dennis samples; neps measured for any lab GIN treatment; SCN measured for the Old Dennis samples; and trash measured for the Continental samples. Thus, correlations were determined between the AfGS and other GIN treatments for fiber properties measured for each SOURCE to determine which treatments were most similar. Table 6 shows that of all lab GIN treatments, the New Dennis was most strongly correlated with AfGS values for UQLw, SFCw, fineness, IFC, and maturity ratio (Table 6). All lab GIN treatments were highly correlated with AfGS samples for neps, but the Old Dennis was most strongly correlated with AfGS values for SCN (Table 7). The New Dennis and Continental were the most strongly correlated with AfGS values for dust content, and the Continental was the most strongly correlated for trash content Table 6. Correlations (r) between samples taken after the commercial gin stand (AfGS) and other GIN treatments for AFIS
fiber properties measured for each SOURCE
UQLw [z] SFCw [z] Fineness IFC [z] Maturity ratio
GIN
AfLC [y] 0.99* [x] 0.93* 0.96* 0.99* 0.97*
New Dennis 0.94* 0.90* 0.97* 0.99* 0.98*
Old Dennis 0.86* 0.81* 0.90* 0.87* 0.66
Continental 0.79* 0.85* 0.86* 0.88* 0.75
CFR 0.85* 0.76* 0.88* 0.86* 0.75[z] UQLw = upper quartile length by weight, SFCw = short fiber content by weight, IFC = immature fiber content.[y] AfLC = after commercial lint cleaner.[x] “*” denotes significant correlation (P < 0.05).
Table 7. Correlations (r) between samples taken after the commercial gin stand (AfGS) and other GIN treatments for AFIS fiber properties measured for each SOURCE
Neps count SCN count [z] Dust count Trash count
GIN
AfLC [y] 0.98* [x] 0.96* 0.42 0.85*
New Dennis 0.97* 0.93* 0.81* 0.83*
Old Dennis 0.97* 0.97* 0.55 0.80*
Continental 0.97* 0.86* 0.80* 0.92*
CFR 0.97* 0.86* 0.77* 0.87*[z] SCN = seed-coat neps.[y] AfLC = after commercial lint cleaner.[x] “*” denotes significant correlation (P < 0.05).
(Table 7). All things considered, the New Dennis gin stand produced lint samples that were overall the most similar to AfGS samples.
CONCLUSION
This study compared AFIS fiber properties of lint ginned with four laboratory scale gin stands (lab gins) to lint ginned in several commercial gins. Overall, the Old Dennis gin stand caused less fiber breakage than commercial gin stands, and no differences were found for the other lab gins. Fineness and maturity data for lint from the New Dennis gin stand appeared to be most similar to the commercial gin stand. Only the Old Dennis lint samples had more neps than the commercial gin stand; the others did not differ. The New and Old Dennis gin stands had fewer SCN than the commercial gin stand, but the CFR had more SCN. The New and Old Dennis gin stands had less dust, and the Continental had more. The Old Dennis and CFR had less trash. The Old Dennis had larger trash par-ticles and the Continental had smaller trash particles.
45BOYKIN ET AL.: FIBER QUALITY OF COMMERCIAL VS. LABORATORY SCALE GINS
When the data was analyzed to determine if dif-ferences between lab gins and commercial gins were consistent from one gin plant to the next, it was found that none of them differed consistently for UQLw or SFCw; only the New Dennis differed consistently for fineness, IFC, and maturity; all lab gins differed consistently for neps; only the Old Dennis differed consistently for SCN; none differed consistently for dust; and only the Continental differed consistently for trash content. So in most cases (except neps), lab gins did not differ consistently from the commercial gin stand from one gin facility to the next. This proved that results obtained from lab gins cannot be precisely reproduced, even with a correction factor, in commercial gin plants. Correlation analysis indi-cated that the New Dennis gin stand was the most similar to commercial gin stands when considering all properties, and most correlations were strong for the other lab gins as well. These results show that lab gins offer an effective, convenient screening tool for cotton researchers predicting fiber quality in commercial gins.
ACKNOWLEDGMENTS
A special thanks to the fiber quality lab staff at Cotton Incorporated who devoted a great amount of time processing samples for this study.
DISCLAIMER
Mention of a trade names or commercial prod-ucts in the publication is solely for the purpose of providing specific information and does not imply recommendation or endorsement by the U.S. Depart-ment of Agriculture.
REFERENCES
Boykin, J.C. 2008. Small sample techniques to evaluate cot-ton variety trials. J. Cotton Sci. 12:16–32.
Boykin, J.C. and J.B. Creech. 2004. Comparison of conven-tional and breeder sample methods for fiber quality pa-rameters. p. 2951-2964. In Proc. Beltwide Cotton Conf., San Antonio, TX. 5-9 Jan. 2004. Natl. Cotton Counc. Am., Memphis, TN..
Calhoun, D.S, T.P. Wallace, W.S. Anthony, and M.E. Barfield. 1996. Comparison of lint fraction and fiber quality data from hand- vs. machine-harvested samples in cotton yield trials. p. 611-614. In Proc. Beltwide Cotton Conf., Nashville, TN. 9-12 Jan. 1996. Natl. Cotton Counc. Am., Memphis, TN..
Gannaway, J., E. Hequet, R. Boman, M. Kelly, and and R. Nichols. 2004. Grab samples versus commercially ginned bales: a Texas high plains comparison. p. 1098. In Proc. Beltwide Cotton Conf., San Antonio, TX. 5-9 Jan. 2004. Natl. Cotton Counc. Am., Memphis, TN..