Embed Size (px)
Citation preview
CAMPANA, N.; TUCCI, C.E.M. 2001. Predicting floods from urban development scenarios: Case study of the Dilúvio basin, Porto Alegre, Brazil. In: Urban Water, Oxford Vol. 3n.2(2001) p.113-124. (s)
PREDICTING FLOODS FROM URBAN DEVELOPMENT SCENARIOS: CASE STUDY OF THE DILÚVIO BASIN, PORTO ALEGRE, BRAZIL
Néstor A. Campana
Civil Engineering Department, University of Brasília University Campus, North Wing, 70910-900 Brasília DF, Brazil - [email protected]
Carlos E. M. Tucci
Institute of Hydraulic Research, Federal University of Rio Grande do Sul Av. Bento Gonçalves,9500, Postal code 15029 9501-970, Porto Alegre - RS, Brazil - [email protected]
ABSTRACT: Urbanisation increases the hydrograph peak and overland flow volume, and decreases the basin concentration time. To predict the consequences for flooding of future urban development requires the design hydrograph to be estimated. However flood hydrographs for the main drainage network must be estimated without full information of future urban development since planning procedures (the Urban Master Plan) specify only the type of occupation and population density in areas where development is planned.
This paper presents the relationship between parameters of a hydrologic model and those of the Urban Plan. The hydrologic model IPH IV was used together with a GIS to predict the hydrograph corresponding to alternative urbanisation scenarios. Model parameters were fitted and verified using recorded data from the Diluvio Creek in Porto Alegre, Brazil. The model was applied to predict the design hydrograph for different risks, taking into account the city Urban Master Plan. Using simulation, areas subject to flooding following the storm rainfall with 25-year return period were delineated, the flooding being mainly due to flow obstruction by bridges.
INTRODUCTION
Brazil’s urban population is very high, almost 80% of the total. There are more than 12 cities with population greater than 1 million and many other medium-sized cities where the rate of population increase is high. This urbanisation has had a major effect on urban drainage since there is no regulation for control of peak flow at source. When the frequency of flooding and the magnitude of flood peaks increase to cause ever greater public damage, the solution adopted has generally been to increase channel conveyance, at high cost and low efficiency.
The cost of controlling flood drainage after areas have been urbanised is so high that most municipal districts do not have sufficient funds to deal with it. More efficient, preventive control is now being accomplished by predicting the impacts from the potential urban developments, and planning control measures at an early stage; these forecasts are incorporated into the Urban Master Plan, thereby minimising future damage and controlling costs. The main effects of urbanisation on the quantity of water transmitted by the drainage system are: increase in peak discharge, decrease in concentration time and time to peak discharge, and increased surface runoff.
Predictions of the hydrograph to be expected following major urban development are usually obtained by use of rainfall-runoff models. Several models are used for this purpose in urban basins (SCS, 1975; Crawford and Linsley, 1966). The information required for a reliable prediction consists of: (a) the design rainfall, with intensity, duration and return period specified, (b) basin characteristics such as drainage area, stream length, soil type, natural vegetation cover; (c) urbanisation conditions, such as drainage network structure, locality and extent of impermeable areas.
Urban drainage planning is a process that is best begun whilst a basin is still in its natural conditions and urbanisation is about to proceed. Taking as the point of departure the population density and occupation type, planning scenarios are identified for each economic area of the city. If the hydrologic model is to predict the volume and time-distribution of urban runoff satisfactorily, the urban characteristics given in the scenario must be related to the parameters of the hydrologic model, with urbanisation typically represented by the proportion of impermeable area and characteristics of the drainage network. The following section explores the connection between hydrologic and urbanisation parameters.
RELATIONSHIP BETWEEN HYDROLOGIC AND URBANISATION PARAMETERS
The main hydrologic parameters used to represent urbanisation conditions are: (a) impermeable area of
the basin, understood here as consisting of every surface in which the precipitation contributes directly to stormwater network; (b) time of concentration or velocity of flow through the basin
Impermeable areas
In the SCS model (1975) the parameter CN estimates the overland flow volume based on soil type and aspects of urban development such as lot size, commercial, industrial area, among others. These relations were obtained for urban development conditions in the United States.
In Brazil, Motta and Tucci (1984) used data from Porto Alegre to develop a relationship between urban density and impermeable area. Tucci et al. (1989) used indirect methods to establish a relationship between impermeable areas and proportion of density occupation in a basin for the city of São Paulo. This relationship presented very good results with 11 basins and was consistent with the results obtained using data from Porto Alegre.
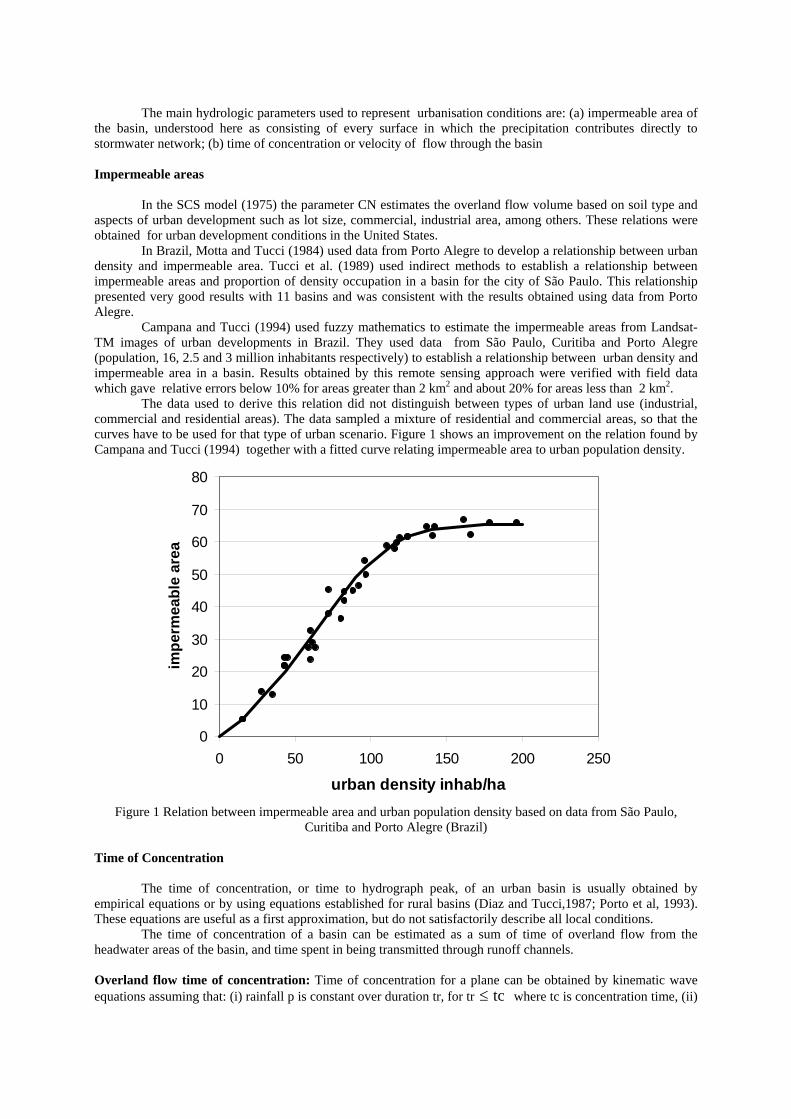
Campana and Tucci (1994) used fuzzy mathematics to estimate the impermeable areas from Landsat-TM images of urban developments in Brazil. They used data from São Paulo, Curitiba and Porto Alegre (population, 16, 2.5 and 3 million inhabitants respectively) to establish a relationship between urban density and impermeable area in a basin. Results obtained by this remote sensing approach were verified with field data which gave relative errors below 10% for areas greater than 2 km2 and about 20% for areas less than 2 km2.
The data used to derive this relation did not distinguish between types of urban land use (industrial, commercial and residential areas). The data sampled a mixture of residential and commercial areas, so that the curves have to be used for that type of urban scenario. Figure 1 shows an improvement on the relation found by Campana and Tucci (1994) together with a fitted curve relating impermeable area to urban population density.
0
10
20
30
40
50
60
70
80
0 50 100 150 200 250
urban density inhab/ha
impe
rmea
ble
area
Figure 1 Relation between impermeable area and urban population density based on data from São Paulo,
Curitiba and Porto Alegre (Brazil) Time of Concentration
The time of concentration, or time to hydrograph peak, of an urban basin is usually obtained by empirical equations or by using equations established for rural basins (Diaz and Tucci,1987; Porto et al, 1993). These equations are useful as a first approximation, but do not satisfactorily describe all local conditions.
The time of concentration of a basin can be estimated as a sum of time of overland flow from the headwater areas of the basin, and time spent in being transmitted through runoff channels. Overland flow time of concentration: Time of concentration for a plane can be obtained by kinematic wave equations assuming that: (i) rainfall p is constant over duration tr, for tr tc≤ where tc is concentration time, (ii)
runoff is from a plane of semi-infinite width; (iii) Manning´s equation represents the friction slope. The equation is
br
br
rcb ptbp
ptaL
tt)(
)(−
+= (1)
where L is the length of the plane (m); p is the rainfall intensity; a=S1/2/n; S is slope; n is the Manning roughness coefficient; b = 0.6. Channel time of concentration: this can be estimated from the following uniform flow equation
vL
t ccc = (2)
where tcc is the concentration time (s); Lc is channel length (m) and v channel velocity (m/s), obtained by Manning equation.
The time of concentration for the basin is then
tc = tcb +tcc (3) Flow path through rural and urban basins: To represent the flow path through a basin, the DTM (digital terrain model) proposed by Jensen and Domingue (1988) was used. The basin is represented by a mesh of square cells and in the study reported in this paper the mesh-size was 30m x 30m. The DTM calculated the main drainage and the distance travelled by flow over the basin surface and in the channels, assuming that flow moved along the line of steepest descent..
The DTM model assumptions are valid for rural basins. For urban basins, however, flow travels through the network of storm sewers and may not necessarily follow the line of steepest descent, whilst water flowing through gutters in the basin surface may not enter the storm sewers until the main section.
Using data from some sub-basins of the Arroio Dilúvio in Porto Alegre, and assuming that the network of sewers runs parallel to streets defining city blocks that were square, a relationship was determined between the distances travelled by stormwater under rural and urban conditions, giving the equation
durb = 1,071 drur +5,21 (4)
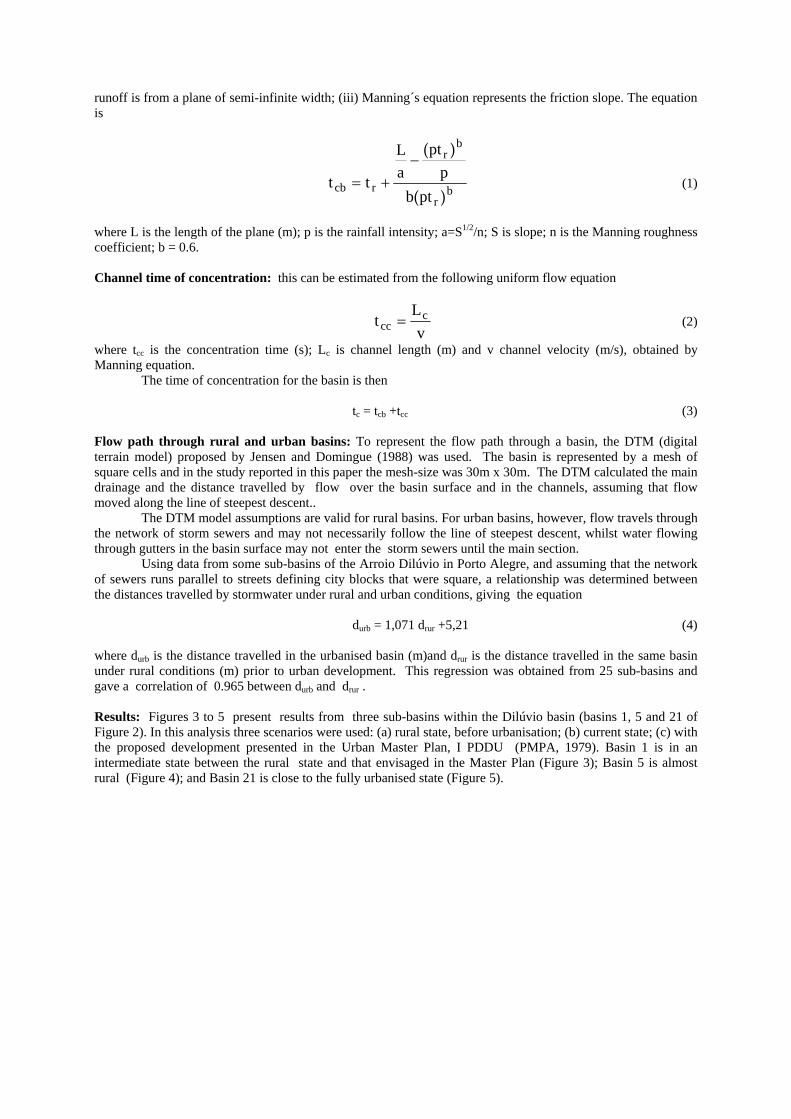
where durb is the distance travelled in the urbanised basin (m)and drur is the distance travelled in the same basin under rural conditions (m) prior to urban development. This regression was obtained from 25 sub-basins and gave a correlation of 0.965 between durb and drur . Results: Figures 3 to 5 present results from three sub-basins within the Dilúvio basin (basins 1, 5 and 21 of Figure 2). In this analysis three scenarios were used: (a) rural state, before urbanisation; (b) current state; (c) with the proposed development presented in the Urban Master Plan, I PDDU (PMPA, 1979). Basin 1 is in an intermediate state between the rural state and that envisaged in the Master Plan (Figure 3); Basin 5 is almost rural (Figure 4); and Basin 21 is close to the fully urbanised state (Figure 5).
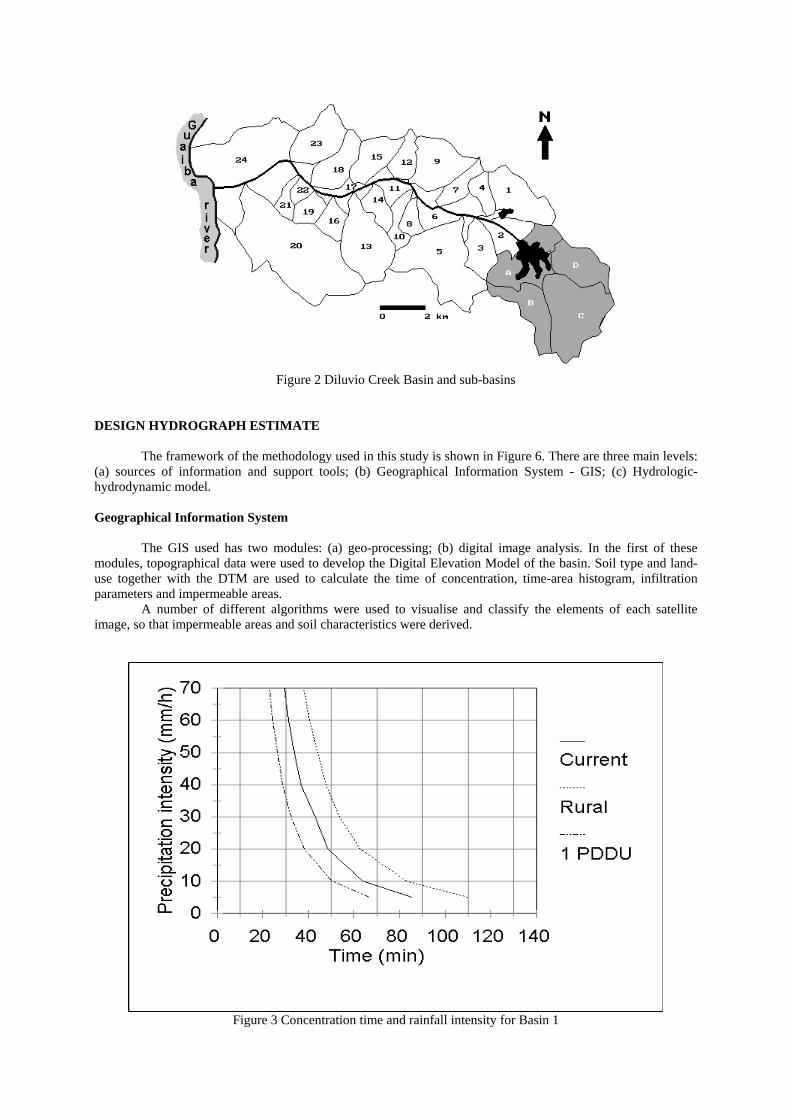
Figure 2 Diluvio Creek Basin and sub-basins
DESIGN HYDROGRAPH ESTIMATE
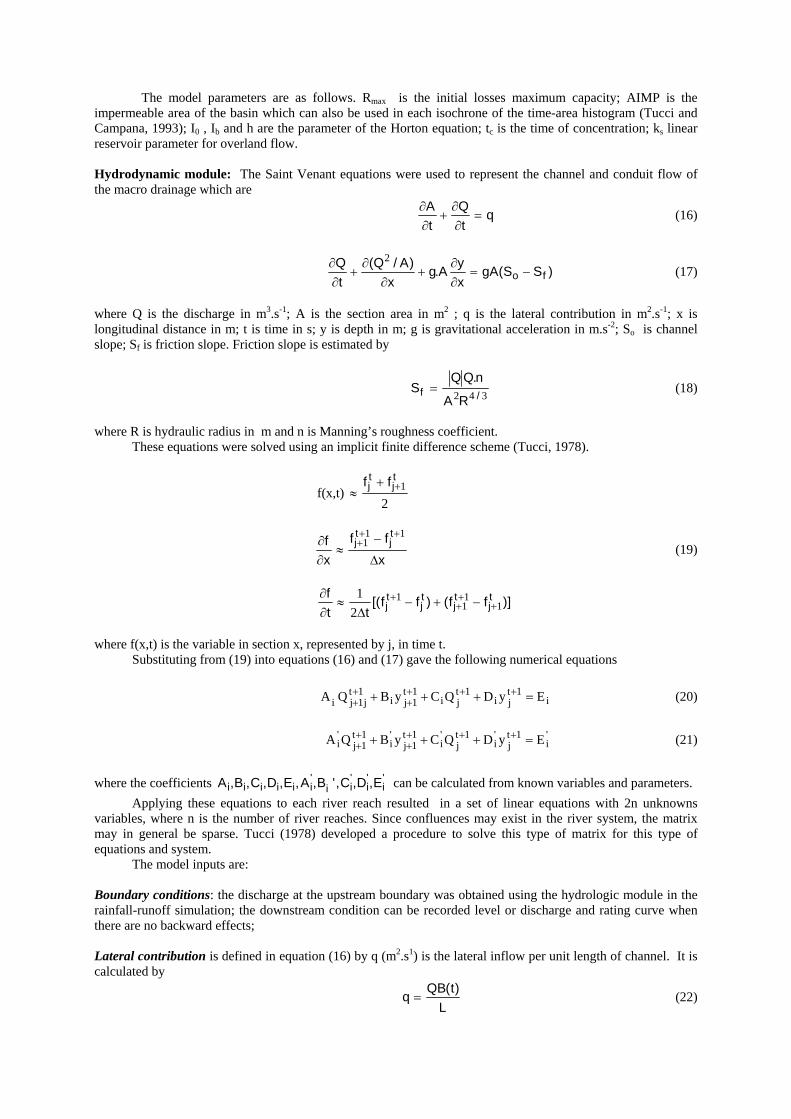
The framework of the methodology used in this study is shown in Figure 6. There are three main levels: (a) sources of information and support tools; (b) Geographical Information System - GIS; (c) Hydrologic-hydrodynamic model.
Geographical Information System
The GIS used has two modules: (a) geo-processing; (b) digital image analysis. In the first of these
modules, topographical data were used to develop the Digital Elevation Model of the basin. Soil type and land-use together with the DTM are used to calculate the time of concentration, time-area histogram, infiltration parameters and impermeable areas.
A number of different algorithms were used to visualise and classify the elements of each satellite image, so that impermeable areas and soil characteristics were derived.
Figure 3 Concentration time and rainfall intensity for Basin 1
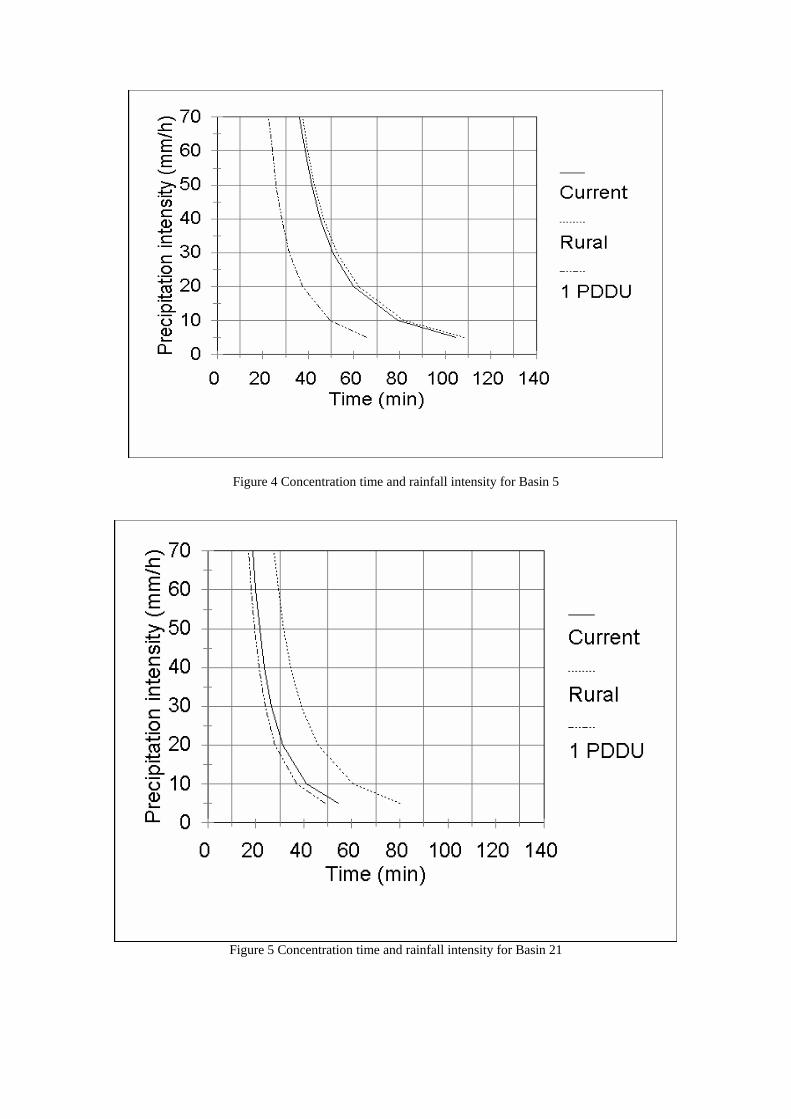
Figure 4 Concentration time and rainfall intensity for Basin 5
Figure 5 Concentration time and rainfall intensity for Basin 21
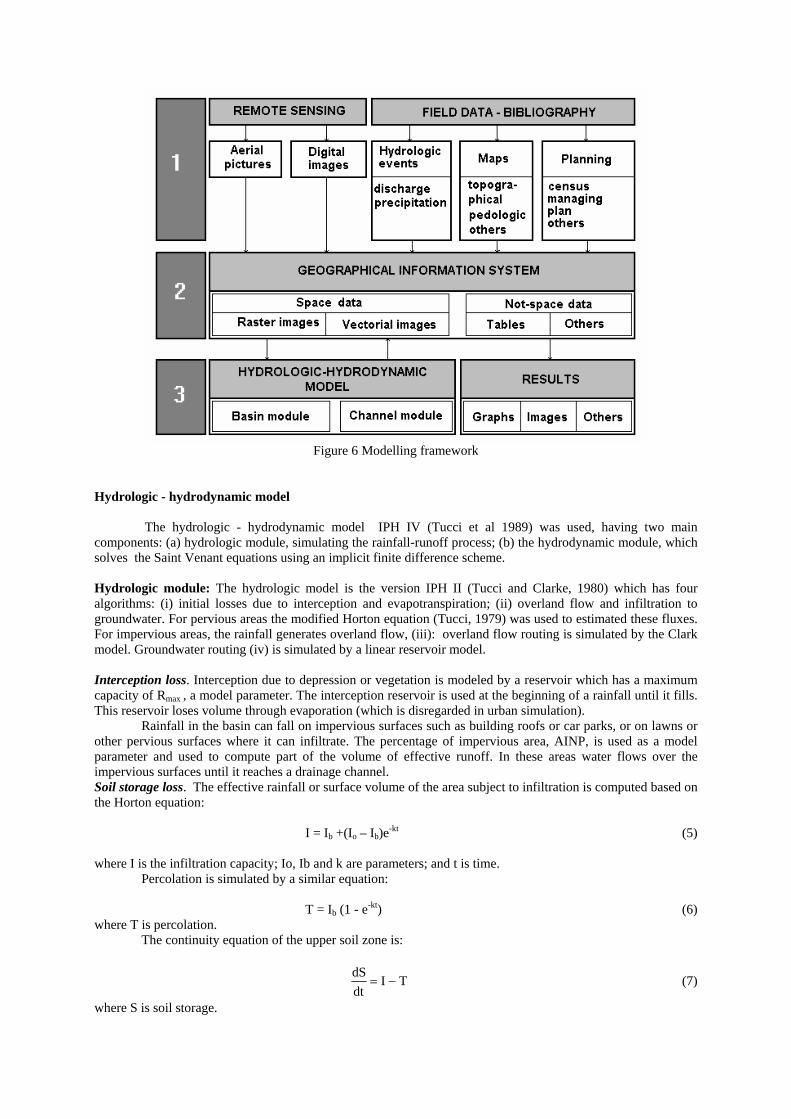
Figure 6 Modelling framework
Hydrologic - hydrodynamic model
The hydrologic - hydrodynamic model IPH IV (Tucci et al 1989) was used, having two main components: (a) hydrologic module, simulating the rainfall-runoff process; (b) the hydrodynamic module, which solves the Saint Venant equations using an implicit finite difference scheme. Hydrologic module: The hydrologic model is the version IPH II (Tucci and Clarke, 1980) which has four algorithms: (i) initial losses due to interception and evapotranspiration; (ii) overland flow and infiltration to groundwater. For pervious areas the modified Horton equation (Tucci, 1979) was used to estimated these fluxes. For impervious areas, the rainfall generates overland flow, (iii): overland flow routing is simulated by the Clark model. Groundwater routing (iv) is simulated by a linear reservoir model. Interception loss. Interception due to depression or vegetation is modeled by a reservoir which has a maximum capacity of Rmax , a model parameter. The interception reservoir is used at the beginning of a rainfall until it fills. This reservoir loses volume through evaporation (which is disregarded in urban simulation). Rainfall in the basin can fall on impervious surfaces such as building roofs or car parks, or on lawns or other pervious surfaces where it can infiltrate. The percentage of impervious area, AINP, is used as a model parameter and used to compute part of the volume of effective runoff. In these areas water flows over the impervious surfaces until it reaches a drainage channel. Soil storage loss. The effective rainfall or surface volume of the area subject to infiltration is computed based on the Horton equation:
I = Ib +(Io – Ib)e-kt (5)
where I is the infiltration capacity; Io, Ib and k are parameters; and t is time. Percolation is simulated by a similar equation:
T = Ib (1 - e-kt) (6) where T is percolation. The continuity equation of the upper soil zone is:
TIdtdS
−= (7)
where S is soil storage.

Substituting equations (5) and (6) in (7), integrating and substituting known variables from (1) and (2) results in:
I.)II(hln
I)II(hln
IS
bo
o
bo
2o
−+
−−
= (8)
T.I.hln
IS
b
o−= (9)
where h = e-k. Considering rainfall P in an interval t to t + ∆t, three situations can occur, depending on the relationship of rainfall rate to infiltration rates at times t and t + ∆t: (a)When rainfall (P) is greater than infiltration capacity (It), effective rainfall can be calculated by integrating the Horton equation in the interval:
)1h(hln
)II()IP(tV
tbtb −
−−−∆=
∆ (10)
and the variables It+1, St+1 and Tt+1 are calculated by equations (1), (3) and (5) respectively. (b) When P < It all of the rainfall infiltrates and the effective rainfall is zero. Using equation (5) in (3) and putting I= P results in :
St+1= St.e-∆t/b +P.b(1-e-∆t/b) (11)
where b = - Io/(lnh.Ib.). It+1 is calculated by equation (9). If It+1 is greater than the rainfall it is only necessary to calculate Tt+1 by equation (9). (c) When P > It+1 , an intersection of the infiltration capacity curve with the rainfall curve occurs. Using equation (11) for I = P, the intersection time is:
b.PSb.PS
lnbtxt
1t−−
−=∆ + (12)
The interval (t, ∆tx) is calculated according to case (b), and the interval (∆tx, t+∆t) according to situation (a). When the percolation volume is required, a balance of continuity is performed in order to calculate it. Basin routing. Clark’s method is used to route the effective rainfall. This method uses a time-area histogram and a linear reservoir procedure. First, the time-area procedure is used:
∑ +−= )f.V(V j1jnt*t (13)
where the fj are the histogram ordinates and nt are the number of ordinates of tc, which is the time of concentration in units of ∆t. The time-area histogram may be estimated by methods based on basin physical characteristics, or the synthetic time-area histogram based on the length of the main stream. Finally, the effective rainfall is routed through a linear reservoir:
)e1(Ve.QQ ss k/t*
tk/ts
1tst
∆−∆−− −+= (14)
where Qs is the overland flow, and ks is a parameter. Groundwater routing Qb is calculated using equation (14) with percolation volume instead of Vt
* and another value for ks, called kb. It is important only for continuous simulation in rural basins. The total flow from the basin is
QB(t) = bt
st QQ + (15)
The model parameters are as follows. Rmax is the initial losses maximum capacity; AIMP is the impermeable area of the basin which can also be used in each isochrone of the time-area histogram (Tucci and Campana, 1993); I0 , Ib and h are the parameter of the Horton equation; tc is the time of concentration; ks linear reservoir parameter for overland flow. Hydrodynamic module: The Saint Venant equations were used to represent the channel and conduit flow of the macro drainage which are
qtQ
tA
=∂∂
+∂∂ (16)
)SS(gAxyA.g
x)A/Q(
tQ
fo −=∂∂
+∂
∂+
∂∂ 2
(17)
where Q is the discharge in m3.s-1; A is the section area in m2 ; q is the lateral contribution in m2.s-1; x is longitudinal distance in m; t is time in s; y is depth in m; g is gravitational acceleration in m.s-2; So is channel slope; Sf is friction slope. Friction slope is estimated by
342 /fRA
n.QQS = (18)
where R is hydraulic radius in m and n is Manning’s roughness coefficient.
These equations were solved using an implicit finite difference scheme (Tucci, 1978).
f(x,t) 2
1tj
tj ff ++
≈
xff
xf t
jtj
∆
−≈
∂∂
+++
111 (19)
)]ff()ff[(tt
f tj
tj
tj
tj 1
11
121
+++
+ −+−∆
≈∂∂
where f(x,t) is the variable in section x, represented by j, in time t.
Substituting from (19) into equations (16) and (17) gave the following numerical equations
i1t
ji1t
ji1t1ji
1tj1ji EyDQCyBQA =+++ +++
+++ (20)
'i
1tj
'i
1tj
'i
1t1j
'i
1t1j
'i EyDQCyBQA =+++ +++
+++ (21)
where the coefficients '
i'i
'ii
'iiiiii E,D,C,'B,A,E,D,C,B,A can be calculated from known variables and parameters.
Applying these equations to each river reach resulted in a set of linear equations with 2n unknowns variables, where n is the number of river reaches. Since confluences may exist in the river system, the matrix may in general be sparse. Tucci (1978) developed a procedure to solve this type of matrix for this type of equations and system.
The model inputs are: Boundary conditions: the discharge at the upstream boundary was obtained using the hydrologic module in the rainfall-runoff simulation; the downstream condition can be recorded level or discharge and rating curve when there are no backward effects; Lateral contribution is defined in equation (16) by q (m2.s1) is the lateral inflow per unit length of channel. It is calculated by
L)t(QBq = (22)
where QB(t) is the basin discharge and L is the sum of the river reaches contributing to the basin. River hydraulics characteristics: river sections are selected taking into account the variation between sections and the possible existence of obstructions to flow. From the sections are calculated the relationship between water level and wetted area, hydraulic radius and width. The model parameter is Manning’s roughness of each section, or a roughness function with the depth in each section.
DILÚVIO BASIN
Part of the Brazilian city of Porto Alegre lies in the Dilúvio basin (Figure 2) which has a drainage area of 76 km2 and main river length of 12 km. In terms of relief, it has some high ground up to about 300m.
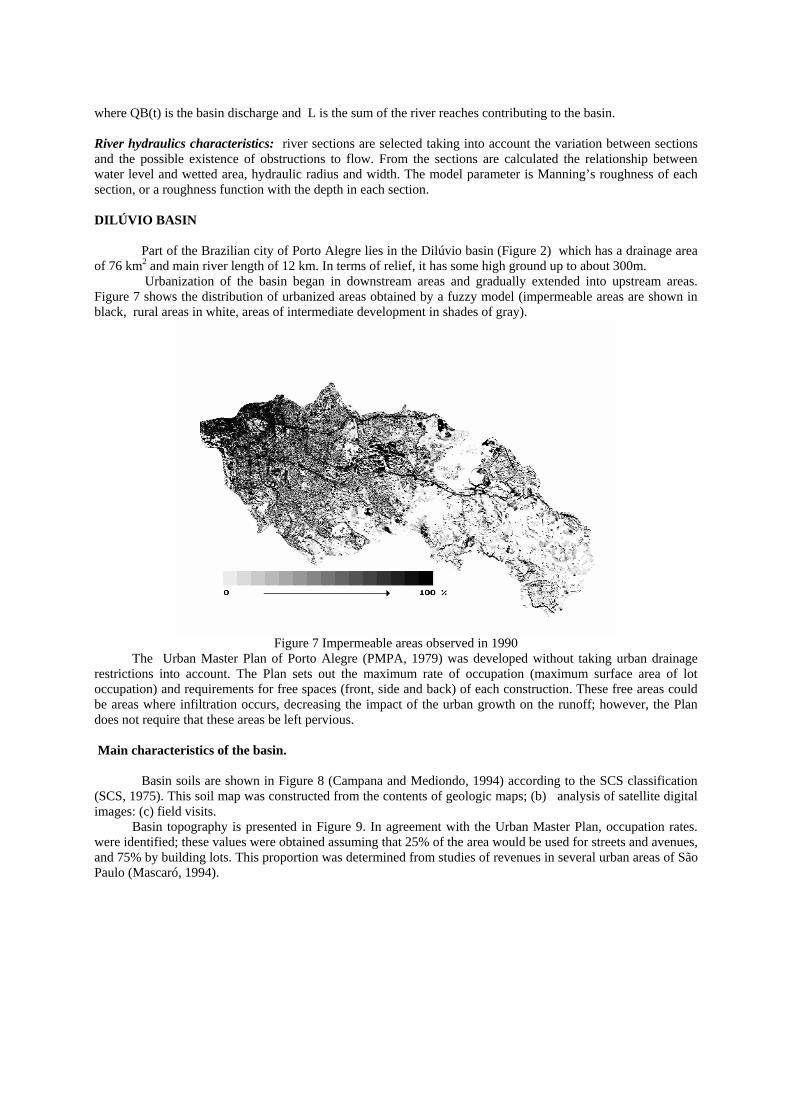
Urbanization of the basin began in downstream areas and gradually extended into upstream areas. Figure 7 shows the distribution of urbanized areas obtained by a fuzzy model (impermeable areas are shown in black, rural areas in white, areas of intermediate development in shades of gray).
Figure 7 Impermeable areas observed in 1990
The Urban Master Plan of Porto Alegre (PMPA, 1979) was developed without taking urban drainage restrictions into account. The Plan sets out the maximum rate of occupation (maximum surface area of lot occupation) and requirements for free spaces (front, side and back) of each construction. These free areas could be areas where infiltration occurs, decreasing the impact of the urban growth on the runoff; however, the Plan does not require that these areas be left pervious. Main characteristics of the basin.
Basin soils are shown in Figure 8 (Campana and Mediondo, 1994) according to the SCS classification (SCS, 1975). This soil map was constructed from the contents of geologic maps; (b) analysis of satellite digital images: (c) field visits.
Basin topography is presented in Figure 9. In agreement with the Urban Master Plan, occupation rates. were identified; these values were obtained assuming that 25% of the area would be used for streets and avenues, and 75% by building lots. This proportion was determined from studies of revenues in several urban areas of São Paulo (Mascaró, 1994).
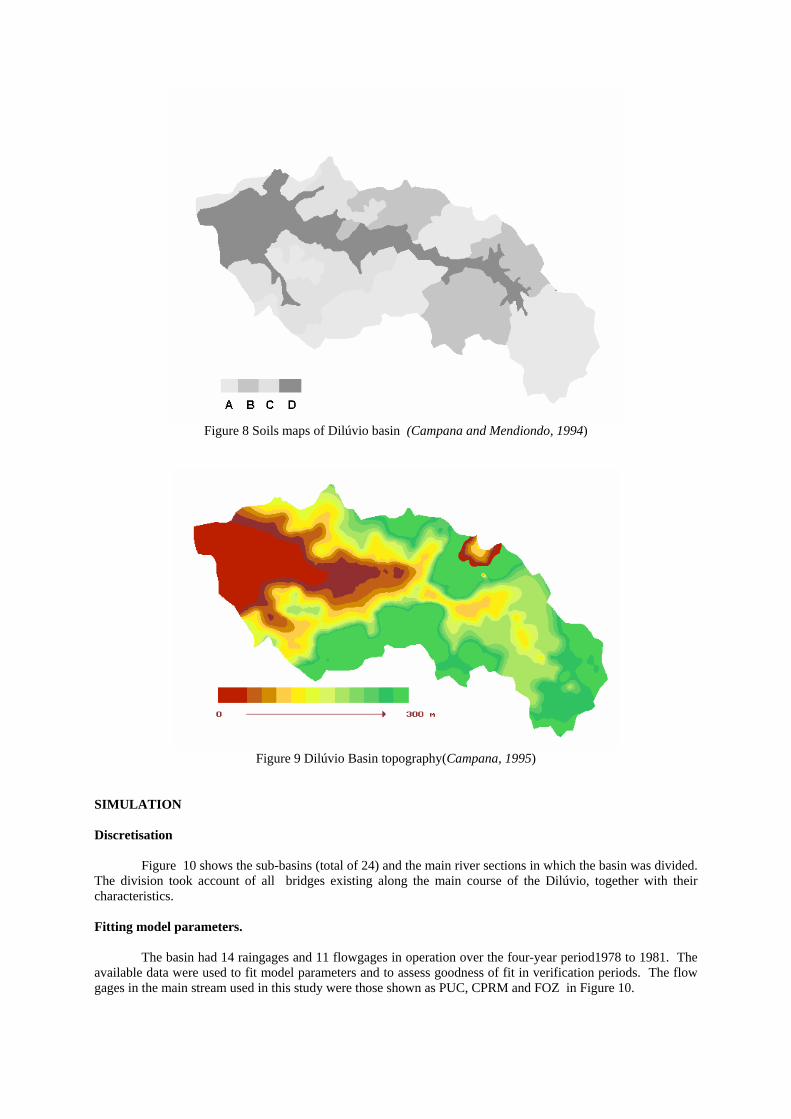
Figure 8 Soils maps of Dilúvio basin (Campana and Mendiondo, 1994)
Figure 9 Dilúvio Basin topography(Campana, 1995)
SIMULATION Discretisation
Figure 10 shows the sub-basins (total of 24) and the main river sections in which the basin was divided. The division took account of all bridges existing along the main course of the Dilúvio, together with their characteristics. Fitting model parameters.
The basin had 14 raingages and 11 flowgages in operation over the four-year period1978 to 1981. The available data were used to fit model parameters and to assess goodness of fit in verification periods. The flow gages in the main stream used in this study were those shown as PUC, CPRM and FOZ in Figure 10.

Figure 10 River sections and sub-basins of Dilúvio Creek.
The model fitting was accomplished in two stages:
Fitting the hydrologic model to sub-basins: In this step, three events were selected from each of the sub-basins 5, 9, 13 and 23 and their data were used to estimate model parameters. Figure 11 and 12 present the results of two sub-basins. Fitting hydrologic - hydrodynamic model for the overall basin: The upstream boundary condition was calculated by the hydraulic module, and the downstream boundary condition was taken as recorded water-level. The fitting was accomplished using two sections of the Dilúvio, PUC and CPRM. Three events were selected. For the sub-basins, the hydrologic parameters were those derived using the procedure explained above. The initial Manning’s roughness coefficient was set at 0.030 for each section of natural channel, and at 0.016 in each canalised reach. Both hydraulic and hydrologic parameters were estimated by trial and error. Table 1 gives details from the fitting procedure, and Figures 13 and 14 compare observed and fitted discharges at the PUC and CPRM sections. In this table
R2
∑∑
−
−−= 2
2
1)QOMQO(
)QOQ(
i
ii (23)
where Qi is calculated flow, QOi is recorded flow, and QOM, is mean recorded flow. Model verification: To verify the model, the average of each model parameter over the three events used for model fitting was calculated, and the discharge in each section was then estimated for three other events whose data were not used at the model-fitting stage. Table 2 shows results from this verification procedure. Model results showed good agreement with recorded data.
Table 1 Statistics of the parameter fitting Event Sect ion Peak f low
Error (%)
Time of peak error
(%)
Hydrograph volume error
(%)
Standard devia t ion
m3s - 1
R2
1� PUC� 4.2� 0� 1.5� 1.09� 0.98� � CPRM� 5.0� 0� 8.8� 1.69 0.98
2� PUC� 3.4� 0� 5.0� 0.42� 0.96� � CPRM� 5.2� 0� -9.1� 0.33� 0.99�
3� PUC� 1.3� 0� 2.0� 1.39� 0.90� � CPRM� 2.8� 0� -5.0� 0.94� 0.98�
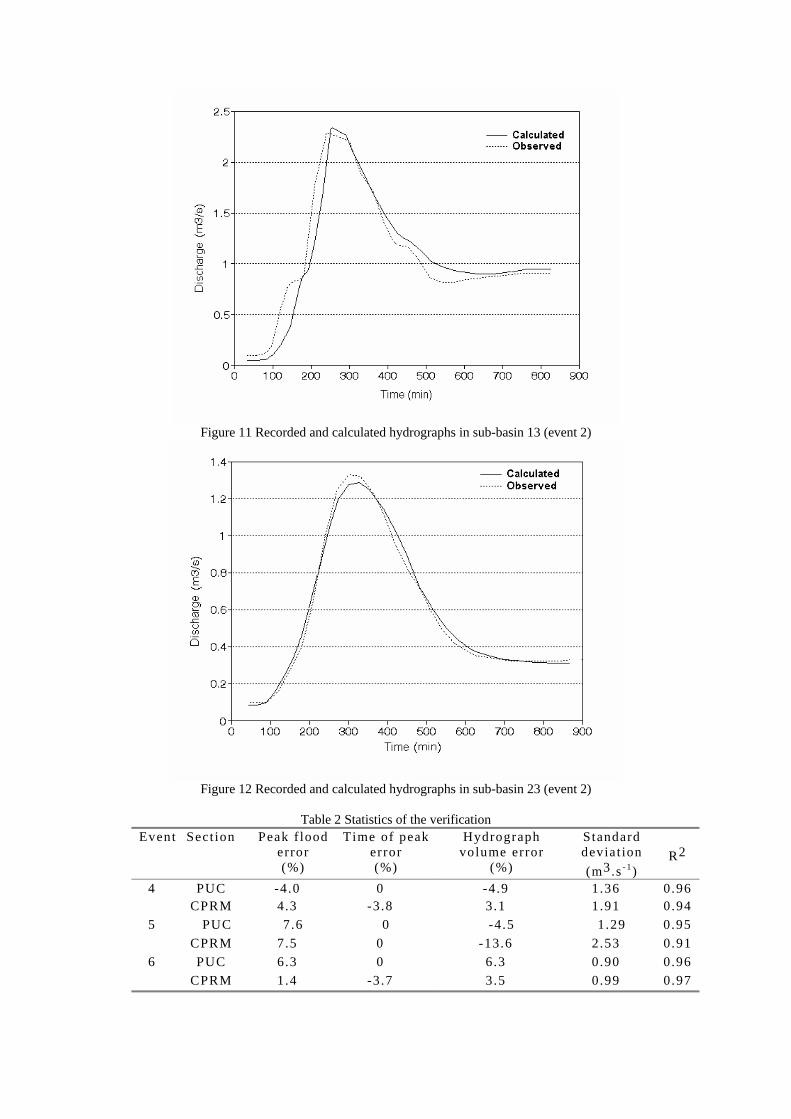
Figure 11 Recorded and calculated hydrographs in sub-basin 13 (event 2)
Figure 12 Recorded and calculated hydrographs in sub-basin 23 (event 2)
Table 2 Statistics of the verification
Event Sect ion Peak f lood error (%)
Time of peak error (%)
Hydrograph volume error
(%)
Standard devia t ion (m3.s - 1)
R2
4� PUC� -4.0� 0� -4.9� 1.36� 0.96� CPRM� 4.3� -3.8� 3.1� 1.91� 0.94
5� PUC 7.6 0 -4.5 1.29 0.95� CPRM� 7.5� 0� -13.6� 2.53� 0.91
6� PUC� 6.3� 0� 6.3� 0.90� 0.96� CPRM� 1.4� -3.7� 3.5� 0.99� 0.97
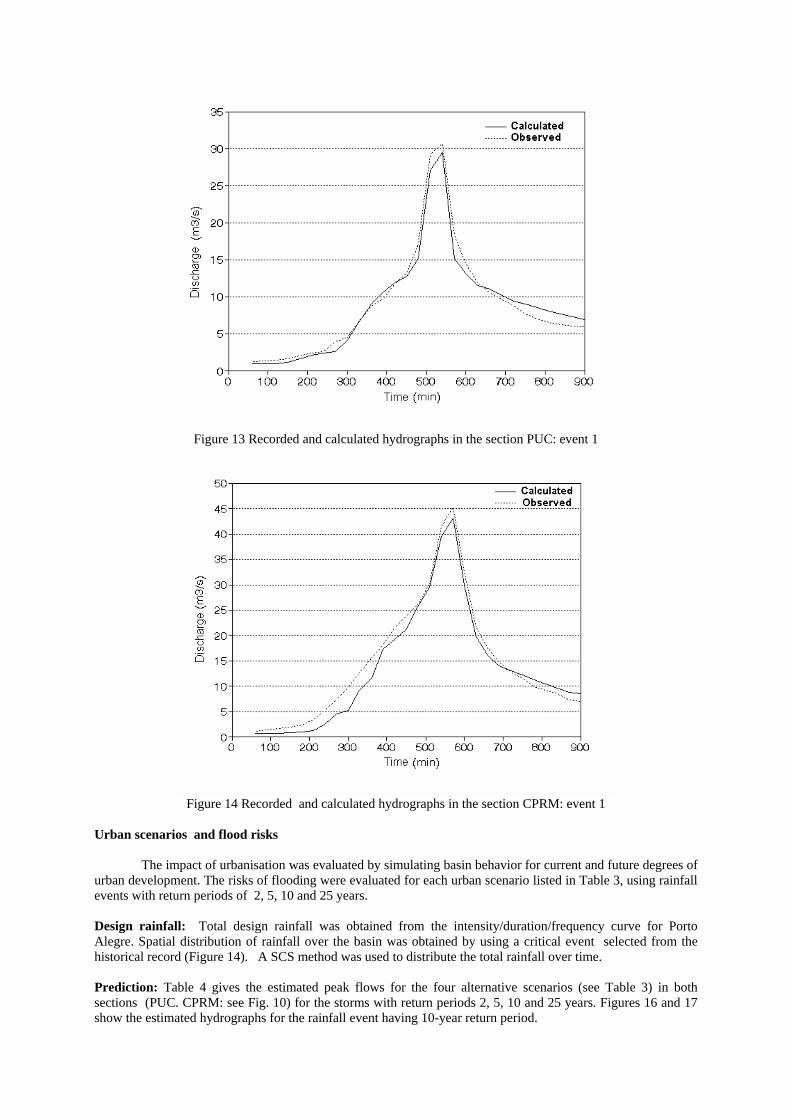
Figure 13 Recorded and calculated hydrographs in the section PUC: event 1
Figure 14 Recorded and calculated hydrographs in the section CPRM: event 1
Urban scenarios and flood risks
The impact of urbanisation was evaluated by simulating basin behavior for current and future degrees of urban development. The risks of flooding were evaluated for each urban scenario listed in Table 3, using rainfall events with return periods of 2, 5, 10 and 25 years. Design rainfall: Total design rainfall was obtained from the intensity/duration/frequency curve for Porto Alegre. Spatial distribution of rainfall over the basin was obtained by using a critical event selected from the historical record (Figure 14). A SCS method was used to distribute the total rainfall over time. Prediction: Table 4 gives the estimated peak flows for the four alternative scenarios (see Table 3) in both sections (PUC. CPRM: see Fig. 10) for the storms with return periods 2, 5, 10 and 25 years. Figures 16 and 17 show the estimated hydrographs for the rainfall event having 10-year return period.
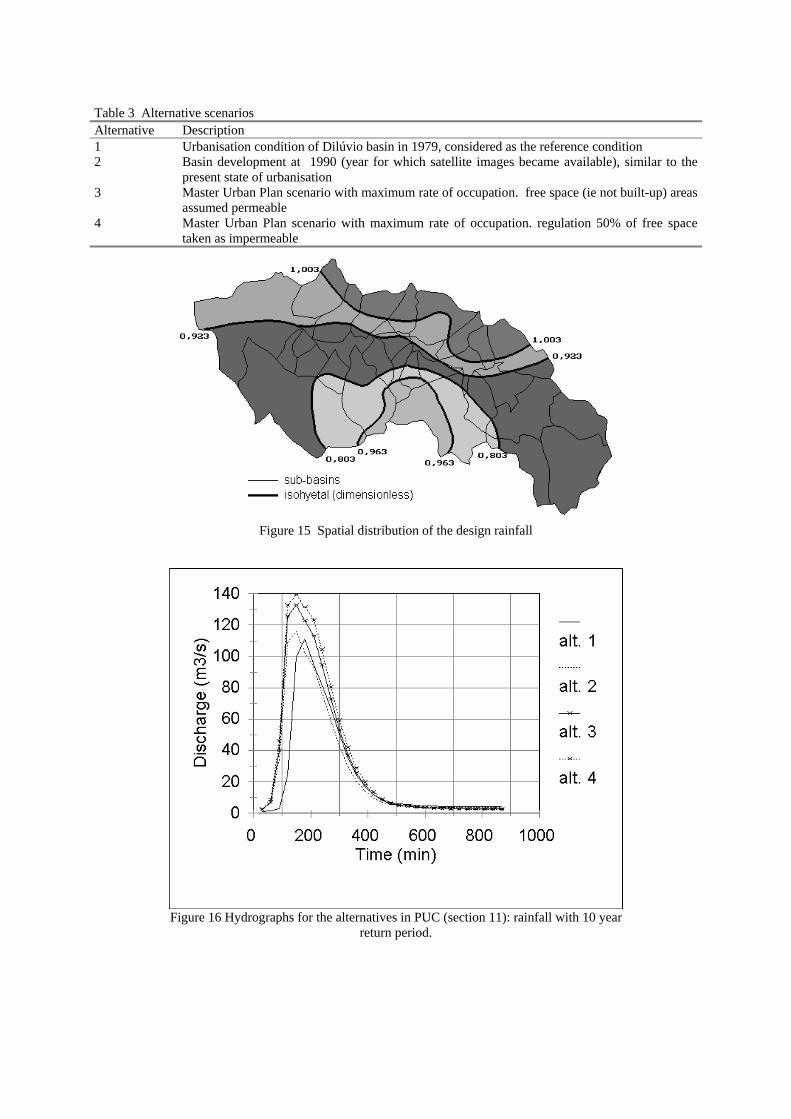
Table 3 Alternative scenarios Alternative Description 1 Urbanisation condition of Dilúvio basin in 1979, considered as the reference condition 2 Basin development at 1990 (year for which satellite images became available), similar to the
present state of urbanisation 3 Master Urban Plan scenario with maximum rate of occupation. free space (ie not built-up) areas
assumed permeable 4 Master Urban Plan scenario with maximum rate of occupation. regulation 50% of free space
taken as impermeable
Figure 15 Spatial distribution of the design rainfall
Figure 16 Hydrographs for the alternatives in PUC (section 11): rainfall with 10 year
return period.
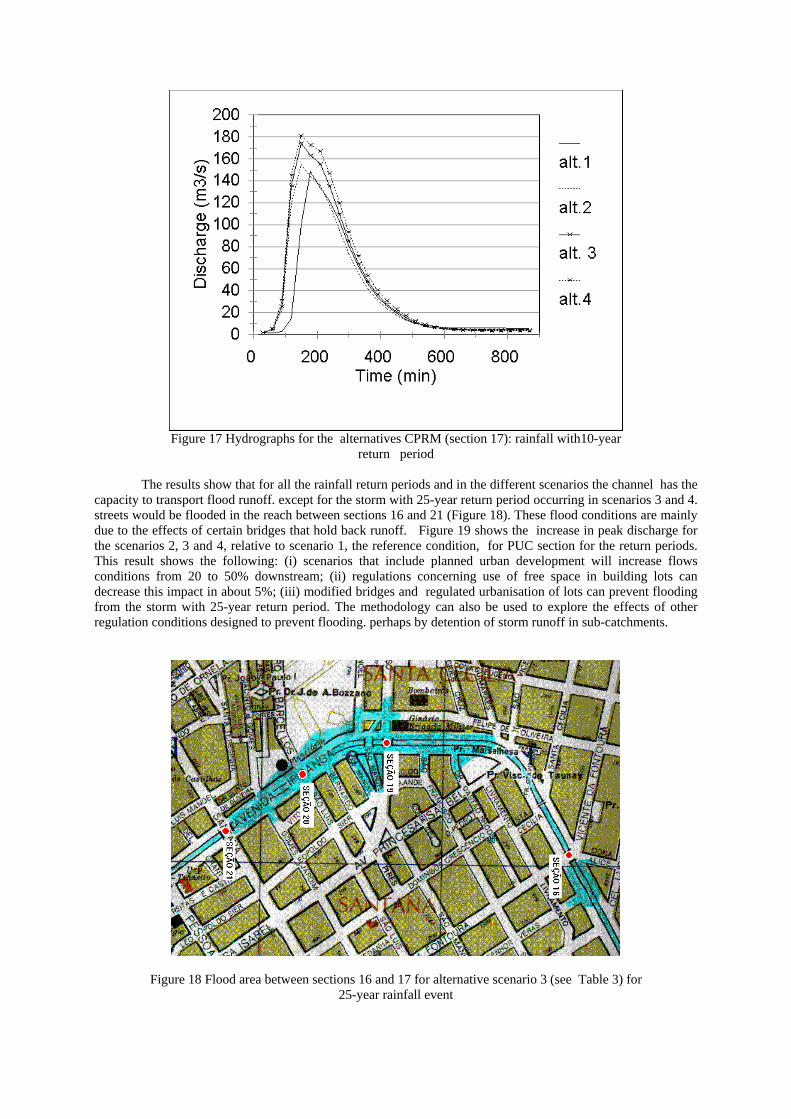
Figure 17 Hydrographs for the alternatives CPRM (section 17): rainfall with10-year
return period
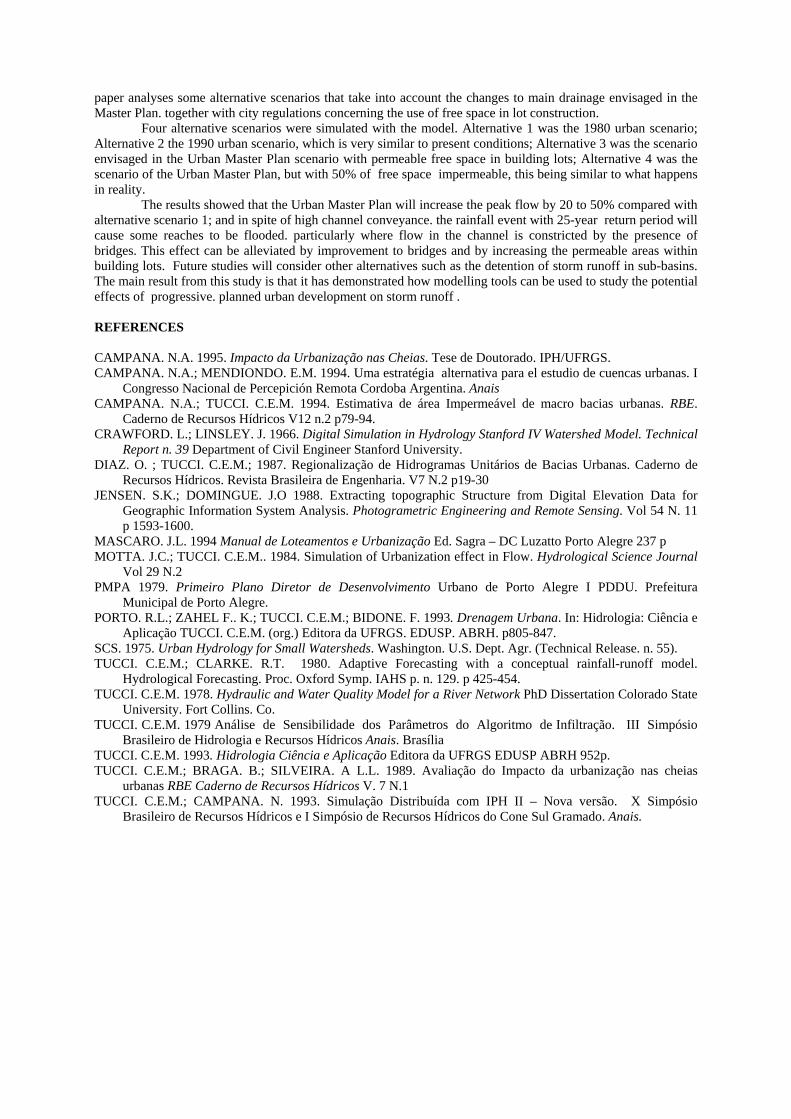
The results show that for all the rainfall return periods and in the different scenarios the channel has the capacity to transport flood runoff. except for the storm with 25-year return period occurring in scenarios 3 and 4. streets would be flooded in the reach between sections 16 and 21 (Figure 18). These flood conditions are mainly due to the effects of certain bridges that hold back runoff. Figure 19 shows the increase in peak discharge for the scenarios 2, 3 and 4, relative to scenario 1, the reference condition, for PUC section for the return periods. This result shows the following: (i) scenarios that include planned urban development will increase flows conditions from 20 to 50% downstream; (ii) regulations concerning use of free space in building lots can decrease this impact in about 5%; (iii) modified bridges and regulated urbanisation of lots can prevent flooding from the storm with 25-year return period. The methodology can also be used to explore the effects of other regulation conditions designed to prevent flooding. perhaps by detention of storm runoff in sub-catchments.
Figure 18 Flood area between sections 16 and 17 for alternative scenario 3 (see Table 3) for 25-year rainfall event
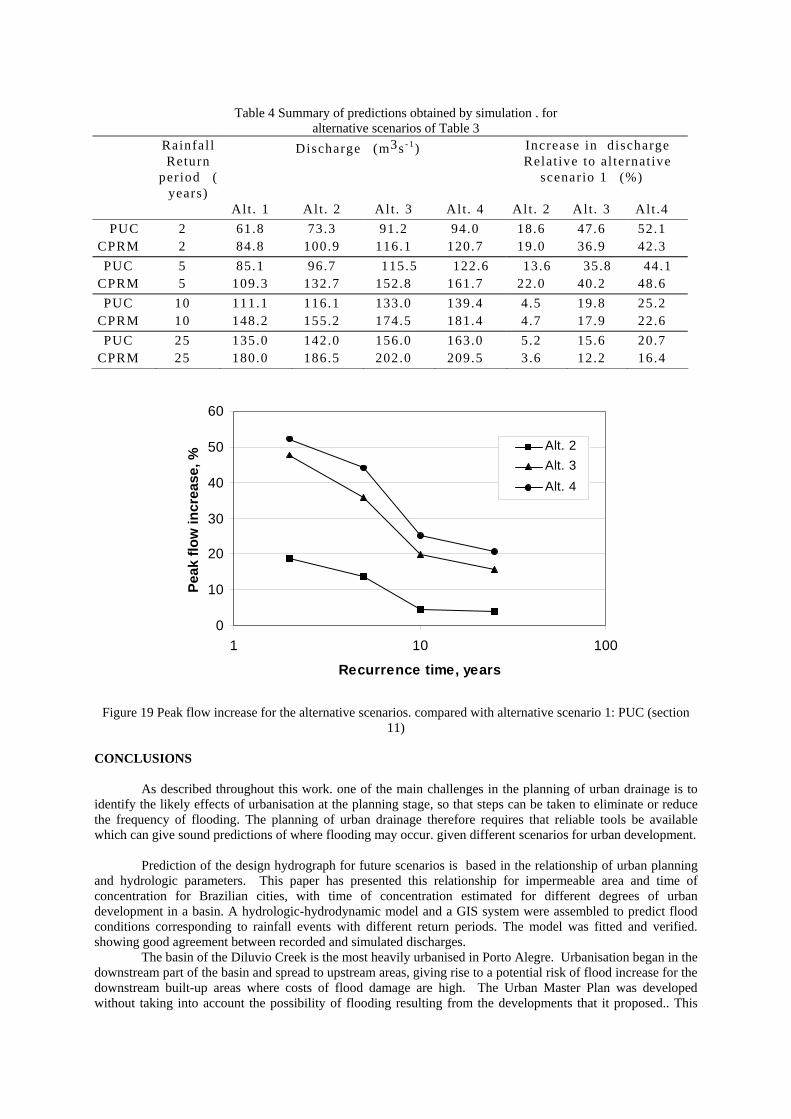
Table 4 Summary of predictions obtained by simulation . for
alternative scenarios of Table 3 Rainfal l
Return per iod�(
years)
Discharge�(m3s- 1)� Increase in d ischarge Relat ive to al ternat ive
scenar io 1�(%)�
� � Alt . 1� Alt . 2� Alt . 3� Alt . 4� Alt . 2� Alt . 3� Alt .4�PUC 2� 61.8� 73.3� 91.2� 94.0� 18.6� 47.6� 52.1�
CPRM� 2� 84.8� 100.9� 116.1� 120.7� 19.0� 36.9� 42.3� PUC� 5� 85.1� 96.7� 115.5 122.6 13.6 35.8 44.1
CPRM� 5� 109.3� 132.7� 152.8� 161.7� 22.0� 40.2� 48.6� PUC� 10� 111.1� 116.1� 133.0� 139.4� 4.5� 19.8� 25.2�
CPRM� 10� 148.2� 155.2� 174.5� 181.4� 4.7� 17.9� 22.6� PUC� 25� 135.0� 142.0� 156.0� 163.0� 5.2� 15.6� 20.7�
CPRM� 25� 180.0� 186.5� 202.0� 209.5� 3.6� 12.2� 16.4�
0
10
20
30
40
50
60
1 10 100
Recurrence time, years
Peak
flow
incr
ease
, %
Alt. 2Alt. 3Alt. 4
Figure 19 Peak flow increase for the alternative scenarios. compared with alternative scenario 1: PUC (section
11) CONCLUSIONS
As described throughout this work. one of the main challenges in the planning of urban drainage is to identify the likely effects of urbanisation at the planning stage, so that steps can be taken to eliminate or reduce the frequency of flooding. The planning of urban drainage therefore requires that reliable tools be available which can give sound predictions of where flooding may occur. given different scenarios for urban development.
Prediction of the design hydrograph for future scenarios is based in the relationship of urban planning
and hydrologic parameters. This paper has presented this relationship for impermeable area and time of concentration for Brazilian cities, with time of concentration estimated for different degrees of urban development in a basin. A hydrologic-hydrodynamic model and a GIS system were assembled to predict flood conditions corresponding to rainfall events with different return periods. The model was fitted and verified. showing good agreement between recorded and simulated discharges.
The basin of the Diluvio Creek is the most heavily urbanised in Porto Alegre. Urbanisation began in the downstream part of the basin and spread to upstream areas, giving rise to a potential risk of flood increase for the downstream built-up areas where costs of flood damage are high. The Urban Master Plan was developed without taking into account the possibility of flooding resulting from the developments that it proposed.. This
paper analyses some alternative scenarios that take into account the changes to main drainage envisaged in the Master Plan. together with city regulations concerning the use of free space in lot construction.
Four alternative scenarios were simulated with the model. Alternative 1 was the 1980 urban scenario; Alternative 2 the 1990 urban scenario, which is very similar to present conditions; Alternative 3 was the scenario envisaged in the Urban Master Plan scenario with permeable free space in building lots; Alternative 4 was the scenario of the Urban Master Plan, but with 50% of free space impermeable, this being similar to what happens in reality.
The results showed that the Urban Master Plan will increase the peak flow by 20 to 50% compared with alternative scenario 1; and in spite of high channel conveyance. the rainfall event with 25-year return period will cause some reaches to be flooded. particularly where flow in the channel is constricted by the presence of bridges. This effect can be alleviated by improvement to bridges and by increasing the permeable areas within building lots. Future studies will consider other alternatives such as the detention of storm runoff in sub-basins. The main result from this study is that it has demonstrated how modelling tools can be used to study the potential effects of progressive. planned urban development on storm runoff . REFERENCES CAMPANA. N.A. 1995. Impacto da Urbanização nas Cheias. Tese de Doutorado. IPH/UFRGS. CAMPANA. N.A.; MENDIONDO. E.M. 1994. Uma estratégia alternativa para el estudio de cuencas urbanas. I
Congresso Nacional de Percepición Remota Cordoba Argentina. Anais CAMPANA. N.A.; TUCCI. C.E.M. 1994. Estimativa de área Impermeável de macro bacias urbanas. RBE.
Caderno de Recursos Hídricos V12 n.2 p79-94. CRAWFORD. L.; LINSLEY. J. 1966. Digital Simulation in Hydrology Stanford IV Watershed Model. Technical
Report n. 39 Department of Civil Engineer Stanford University. DIAZ. O. ; TUCCI. C.E.M.; 1987. Regionalização de Hidrogramas Unitários de Bacias Urbanas. Caderno de
Recursos Hídricos. Revista Brasileira de Engenharia. V7 N.2 p19-30 JENSEN. S.K.; DOMINGUE. J.O 1988. Extracting topographic Structure from Digital Elevation Data for
Geographic Information System Analysis. Photogrametric Engineering and Remote Sensing. Vol 54 N. 11 p 1593-1600.
MASCARO. J.L. 1994 Manual de Loteamentos e Urbanização Ed. Sagra – DC Luzatto Porto Alegre 237 p MOTTA. J.C.; TUCCI. C.E.M.. 1984. Simulation of Urbanization effect in Flow. Hydrological Science Journal
Vol 29 N.2 PMPA 1979. Primeiro Plano Diretor de Desenvolvimento Urbano de Porto Alegre I PDDU. Prefeitura
Municipal de Porto Alegre. PORTO. R.L.; ZAHEL F.. K.; TUCCI. C.E.M.; BIDONE. F. 1993. Drenagem Urbana. In: Hidrologia: Ciência e
Aplicação TUCCI. C.E.M. (org.) Editora da UFRGS. EDUSP. ABRH. p805-847. SCS. 1975. Urban Hydrology for Small Watersheds. Washington. U.S. Dept. Agr. (Technical Release. n. 55). TUCCI. C.E.M.; CLARKE. R.T. 1980. Adaptive Forecasting with a conceptual rainfall-runoff model.
Hydrological Forecasting. Proc. Oxford Symp. IAHS p. n. 129. p 425-454. TUCCI. C.E.M. 1978. Hydraulic and Water Quality Model for a River Network PhD Dissertation Colorado State
University. Fort Collins. Co. TUCCI. C.E.M. 1979 Análise de Sensibilidade dos Parâmetros do Algoritmo de Infiltração. III Simpósio
Brasileiro de Hidrologia e Recursos Hídricos Anais. Brasília TUCCI. C.E.M. 1993. Hidrologia Ciência e Aplicação Editora da UFRGS EDUSP ABRH 952p. TUCCI. C.E.M.; BRAGA. B.; SILVEIRA. A L.L. 1989. Avaliação do Impacto da urbanização nas cheias
urbanas RBE Caderno de Recursos Hídricos V. 7 N.1 TUCCI. C.E.M.; CAMPANA. N. 1993. Simulação Distribuída com IPH II – Nova versão. X Simpósio
Brasileiro de Recursos Hídricos e I Simpósio de Recursos Hídricos do Cone Sul Gramado. Anais.