Embed Size (px)
Citation preview

Predicting Freshman Grade-Point Average from High-School Test Scores: are There
Indications of Score Inflation?
A working paper of the Education Accountability Project at the Harvard Graduate School of Education
http://projects.iq.harvard.edu/eap
Daniel Koretz Carol Yu
Meredith Langi David Braslow
Harvard Graduate School of Education
August 26, 2014
© 2014 by the authors. All rights reserved.
The research reported here was supported by the Institute of Education Sciences, U.S. Department of Education through Grant R305AII0420 to the President and Fellows of Harvard College. The authors thank the City University of New York and the New York State Education Department for the data used in this study. The opinions expressed are those of the authors and do not represent views of the Institute, the U.S. Department of Education, the City University of New York, or the New York State Education Department.

Abstract
The current focus on “college and career readiness” highlights a long-standing
question: how well does performance on high-school tests predict performance in
college? The answer may depend not only on the content and difficulty of the tests, but
also on the extent to which test preparation has inflated scores. This study uses data from
the City University of New York to investigate how well scores on the Mathematics A,
Integrated Algebra, and English Language Arts Regents examinations predict freshman
grade-point average. We find that in the aggregate, Regents scores predict roughly as
well as SAT scores but that high school grade-point average (HSGPA) based on only
college-preparatory courses predicts substantially better than either set of tests. Starting
with a conventional ordinary least squares prediction based on HSGPA and either set of
tests, adding the second set of tests improves aggregate prediction only trivially but
would change which students are selected. We found that these predictive relationships
vary markedly among campuses, with a tendency for stronger prediction by test scores on
campuses with higher scores.
1
The current focus on college and career readiness underscores a long-standing
question: how well does performance on high-school tests predict performance in
college? This may depend not only on the content and difficulty of the tests, but also on
the extent to which test preparation has inflated scores.
Scores on several types of tests may be available for students entering college,
including college-admissions tests, i.e., the SAT or ACT, and high-stakes high-school
tests mandated by states. The latter in turn are of two broad types. Many states administer
one survey test in a subject to all students, regardless of the course they take. For
example, high-school students in Massachusetts are required to pass only a single
mathematics test, regardless of the courses they take. In contrast, some states administer
end-of-course (EOC) or other curriculum-based tests, such as the North Carolina EOC
tests or the New York State Regents examinations. In addition to being more closely tied
to specific course content, the latter entail more testing and cover more content than the
survey tests. These three types of tests vary substantially in both content and difficulty, so
it would not be surprising if they were of different value in predicting performance in
college.
Scores on all three of these types of tests are vulnerable to score inflation, i.e.,
upward bias from inappropriate test preparation. Preparation appears to vary among these
three. Preparation for college-admissions tests is not ubiquitous and is often intensive but
short-term. In contrast, substantial research (albeit conducted mostly in grades lower than
high school) suggest that preparation for high-stakes K-12 tests is both widespread and
long-term (e.g. Koretz, Barron, Mitchell, & Stetcher, 1996; Pedulla, Abrams, Madaus,
Russell, Ramos, Miao, et al., 2003; Shepard & Dougherty, 1991; Smith & Rottenberg,
1991; Stecher, Barron, Chun, & Ross 2000). It would be reasonable to expect that score
inflation might vary similarly among types of tests. Studies have found that the resulting
inflation of scores in K-12 tests is often very large, in some cases half a standard
deviation or more within a few years of the first implementation of the test (Jacob, 2007;
Klein, Hamilton, McCaffrey, & Stecher, 2000; Koretz & Barron, 1998; Koretz, Linn,
Dunbar, & Shepard, 1991). In contrast, some studies have shown much more modest
effects of test preparation on college-admissions tests. For example, Briggs (2002)
estimated effects on SAT scores ranging from roughly .03 to .28 standard deviation.
2
However, the relevant studies use very different methods, making it difficult to attribute
the difference in estimated effects to either the types of preparation or the characteristics
of tests.1
Most studies of the validity of score gains on high-stakes tests have used
concurrent outcomes to estimate inflation, e.g., trends in scores on lower-stakes tests of
the same domain or concurrent differences in scores between a high-stakes test and a
lower-stakes test. For example, numerous studies have compared trends on a high-stakes
test to concurrent trends on a lower-stakes audit test, such as NAEP, using large
discrepancies in trends as an indication of score inflation (Jacob, 2007; Klein, Hamilton,
McCaffrey, & Stecher, 2000; Koretz & Barron, 1998). The logic of these studies is
straightforward and compelling: inferences based on scores are valid only to the extent
that performance on the test generalizes to the domain that is the target of inference, and
if performance generalizes to the target, it must generalize to a reasonable degree to other
tests measuring that same target.
Nonetheless, there is growing interest in investigating the relationships between
performance on high-stakes tests and later outcomes, such as performance in
postsecondary education. There are a number of reasons that these relationships are
important. The first was clarified by early designers of standardized tests: these tests are
necessarily short-term proxies for longer-term outcomes that are the ultimate goal of
schooling (Lindquist, 1951). In addition, to the extent that the specific intended inference
based on scores is about preparation for later performance, later outcomes are a
particularly important source of evidence bearing on possible score inflation. Finally, the
accountability pressures associated with high-stakes tests may have longer-term
1 For example, Briggs estimated differences in SAT scores using linear regression with a number of adjustments for selectivity bias. In contrast, as noted below, most studies of score inflation in K-12 make use of trends on lower-stakes audit tests (e.g., Koretz & Barron, 1998), and most of these use either identical groups or randomly equivalent groups for comparison.

3
outcomes that go beyond those reflected in test scores (e.g. Deming, 2008; Deming,
Cohodes, Jennings, & Jencks, 2013).
As a first step in exploring the predictive value of high-stakes high-school tests,
we used data from the City University of New York to explore the relationships between
Regents examination test scores and performance in the first year of college. Specifically,
we explored two questions:
x How well do high-stakes high-school tests predict freshman-year performance,
and how does this compare to the prediction from college-admissions test scores?
The specific high-stakes tests were the English Language Arts and the
Mathematics A/ Integrated Algebra Regents examinations. The college-
admissions test was the SAT.
x How variable are these predictions from campus to campus?
Our expectation was that scores on the Regents Exams are affected more by score
inflation, but even if that is so, the effects on relationships with later outcomes are
difficult to predict. First, it is possible that in the absence of inflation, the predictive value
of the Regents and SAT scores would differ because of the characteristics of the tests. For
example, it is possible that in the absence of inflation, Regents scores would have more
predictive value because they are curriculum-based but that inflation offsets this
difference. Second, while score inflation can erode the cross-sectional correlations
between scores and other outcomes, it needn’t have this effect. Pearson correlations are
calculated from deviations from means, and it is possible to inflate a distribution, thus
increasing its mean, while not substantially changing cross-sectional correlations. Koretz
& Barron (1998) found precisely this pattern when comparing a high-stakes test in
Kentucky to the ACT: cross-sectional correlations were quite stable at both the student
and school levels, but trends in mean scores were dramatically different. In this study, we
do not examine trends in means over time, and therefore, we cannot rule out that
possibility. Rather, we simply explore whether scores on these high-stakes tests retain
predictive power despite intensive test preparation. This is an essential first step, but
additional research of different types may be needed to further explore the extent of score
inflation.

4
In this study, we used the analytical approach that is conventional in validation
studies of college-admissions tests: student-level ordinary least squares regression,
conducted separately by campus because of between-campus differences in grading
standards (e.g., Bridgeman, McCamley-Jenkins, & Ervin, 2000; Kobrin et al., 2008).
Unlike some of these studies (e.g., Bridgeman et al., 2000), we included subject-specific
test scores in regression models that included high-school GPA. Using this traditional
approach has the advantage of making our findings directly comparable to a large,
established literature. However, detailed analysis of the data suggests that more complex
methods would be more appropriate than this traditional approach for analyzing the
relationships between test scores and college grades. We briefly note some of the key
findings from this exploratory work. Later papers will describe these results in more
detail and explore the application of alternative methods.
Data
Our data include two cohorts. The 2010 cohort consists of students who graduated
from high school in 2010 and entered the CUNY system as a freshman in 2010, 2011 or
2012. The 2011 cohort consists of students who graduated from high school in 2011 and
entered CUNY as freshmen in 2011 or 2012. For the purpose of future analysis, both
cohorts are restricted to students who graduated from NYC public schools. We further
restricted our sample for this study to the eleven Senior and Comprehensive Colleges,
with the intention of focusing on students enrolled in four-year programs. However, we
were unable to differentiate between two-year and four-year students at the three
Comprehensive campuses, so both types of students are included in our analysis for those
three campuses.
Finally, from this sample we dropped students who are missing either scores for
the tests used in our analysis or high-school GPA (HSGPA). The most common missing
score was the SAT, particularly among students attending the three Comprehensive
colleges. This is expected as the Comprehensive colleges include two-year programs as
well as the four-year programs. The percent of students missing SAT scores in
Comprehensive colleges range from 19% to 38% across both cohorts. Excluding these
students missing SAT scores presumably removed many of the two-year students we
ideally would have excluded for that reason. In contrast, the percent of students missing

5
SAT scores in Senior colleges ranges from less than 1% to 3%. Students missing SAT
scores have lower HSGPAs and Regents exam scores than their peers not missing scores.
The percent of students missing HSGPA ranges from less than 1% to 5% across all
campuses. Students missing HSGPA tend to perform slightly lower on all exams
compared with students not missing HSGPA. After removing these students with missing
scores or missing HSGPA, our analytic samples include 88% and 86% of share of the
original 2010 and 2011 cohorts, respectively, who attended Senior and Comprehensive
colleges.
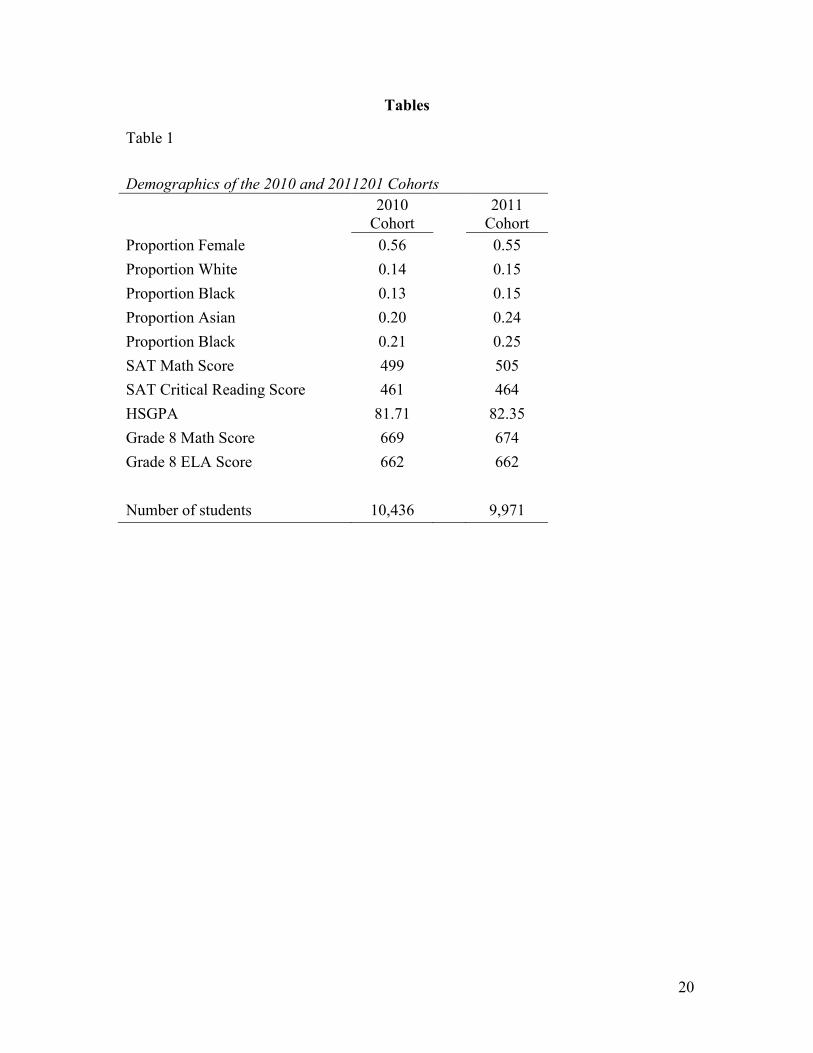
In the final analytic samples, there are small differences in demographic make-up
between the 2010 and 2011 cohorts, particularly in the percent of Asian and Hispanic
students (see Table 1). Additionally, students in the 2011 cohort had slightly higher
average scores on the SAT tests and the Regents English exam, as well as slightly higher
HSGPAs. One possible explanation for these differences is the additional year of data we
have only for the 2010 cohort, which includes students entering CUNY as freshman two
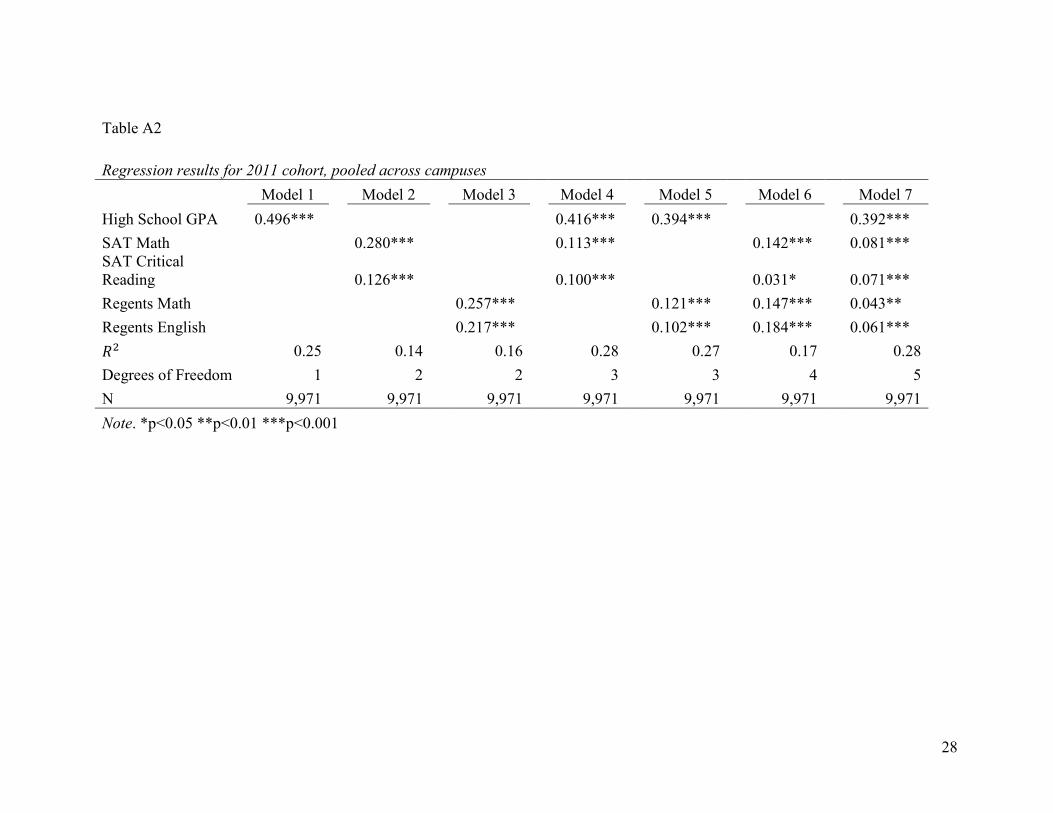
years after graduating high school. Despite these small differences, the results of our
analysis differ little between the cohorts. Therefore, we will focus on the results for the
2010 cohort. This is the cohort most relevant to our study because the majority of
students in it took a long-standing Regents mathematics exam. Results for the 2011
cohort are presented in Appendix A.
Our outcome variable is freshman GPA (FGPA), calculated on a 4-point scale and
weighted according to the number of credits for each class. Our predictors include
HSGPA, SAT scores, and New York State Regents math and English scores. HSGPA is
on a scale of 50 to 100 and is calculated by CUNY based on courses determined to be
“college preparatory.” This differs from other studies (e.g., Bridgeman et. al., 2000) in
which the HSGPA variable reflects any course grades on a student’s transcript, without
this additional qualification. Students’ SAT scores include scores from the mathematics
and critical reading sections and are the highest available. The Regents English and the
Regents math scores provided to us are the highest score students earned on that
particular exam.
6
The creation of the Regents math score variable was complicated by the transition
between the Regents Math A exam and the Integrated Algebra exam, which occurred
while the students in our sample were attending high school. The first Integrated Algebra
exam was administered in June of 2008, and the last Math A exam was administered in
January of 2009. During this transition phase, students were allowed to take either exam,
and some in our sample took Math A, Integrated Algebra, or both. The modal test for the
2010 cohort was the Math A exam, taken by 95% of our analytic sample, while the modal
test for the 2011 cohort was the Integrated Algebra exam, taken by 76% of our analytic
sample. In both cohorts, a Regents math variable was created by using the score on the
modal test if available, and the score on the non-modal test otherwise.
Methods
We conducted a series of regression analyses in which FGPA was predicted by
different high school achievement measures. We sorted these measures into three
predictor sets based on their source: HSGPA, Regents exam scores, and SAT scores. By
introducing these predictors into our regression models as sets, it is possible to look at the
additional predictive power provided by these different sources of information and to
compare the predictive power of subject-specific scores from the Regents exams and the
SAT.2
Using data pooled across all 11 senior colleges, we estimated seven regression
models for predictors alone and in several combinations: HSGPA, SAT scores, Regents
scores, HSGPA and SAT scores, HSGPA and Regents scores, and HSGPA with both
SAT and Regents scores. Standardized coefficients are reported to allow for comparisons
of coefficients associated with variables reported on different scales.
We did not adjust the data for measurement error or restriction of range. We did
not use a correction for measurement error for two reasons. First, the uncorrected
relationship is the one relevant to admissions decisions. Second, we lack information on
2 In theory, the two separate scores should predict better than a single composite, but in our models, the difference was trivial. We nonetheless retained separate scores in order not to obscure differences in prediction between subjects.

7
the reliability of the FGPA and HSGPA variables, both of which are certainly far less
reliable than either set of test scores. We did not use a correction for restriction of range
for two reasons.3 We lack information on the distribution of the SAT for either the pool
of applicants or the total population of NYC high-school graduates. Moreover, this
correction can be misleading if the selection function differs from the simple selection
assumed in the derivation of the correction (e.g., Linn, 1983).
To further explore potential differences in predictive relationships across
campuses, we conducted separate regression analyses for each campus, using several
different models, and compared the coefficients and ଶ values.
Results
Descriptive results
In our sample for the 2010 cohort, 14% of students identify as white, 13% black,
20% Asian and 21% Hispanic. Average SAT scores are slightly below the national
average. The average SAT math score of 499 points and a standard deviation of 107
points. The average SAT critical reading score is 461 points with a standard deviation of
97 points. The national averages for the SAT are 516 points for the math exam and 501
points for the critical reading exam (College Board, 2010). Average Regents scores are
81 points for both math and English. There are a small number of students who have
reported Regents scores below the minimum graduation requirement of 65 points: 216
students in mathematics and 131 in English. Additional descriptive statistics are
presented in Table 1.
Correlations of FGPA with Regents scores were similar to those with SAT scores.
In English, the correlation with Regents scores was slightly higher than that with SAT
scores: ݎ = .35 compared with ݎ = .31. In mathematics, the two correlations were for all
practical purposes the same: ݎ = .36 and ݎ = .35, respectively. We found a stronger
3 Restriction of range does not bias unstandardized regression coefficients, but it can bias correlations and standardized regression coefficients, both of which we use in this paper.

8
relationship between the SAT and Regents scores in mathematics (ݎ = .76) than in
English/verbal (ݎ = .58; Table 2).
Additionally, there are indications of a nonlinear relationship between weighted
FGPA and our predictors (for an example, see Figure 1). Figure 1 suggests that the
relationship between HSGPA and FGPA is stronger for students with FGPAs above 2.0
than for students with lower FGPAs. In fact, for students with a FGPA below 2.0, there
appears to be no correlation with HSGPA. Similar nonlinearities appear in the
relationships between FGPA and SAT scores and Regents scores.
Campus-level relationships
The conventional approach in studies of validity and utility of college-admissions
tests is to conduct analysis separately within each college campus and then combine the
results across campuses (e.g., Bridgeman et al., 2000; Kobrin et al., 2008). This approach
avoids one of the major problems caused by differences in grading standards among
colleges. If colleges differ in grading standards in ways unrelated to the measured
predictors, this would introduce error into an analysis that pooled data across campuses.
The result would be attenuation of ଶ and standardized regression coefficients.
Accordingly, we conducted analyses separately by campus. However, we found
that in many cases, the observed within-campus relationships were markedly weaker than
those in a pooled analysis, despite ample within-campus sample sizes. This is the reverse
of the effect one would expect from differences in grading standards unrelated to the
student-level predictors. To explore this, we analyzed the relationships between our
predictors at the aggregate (campus) level.
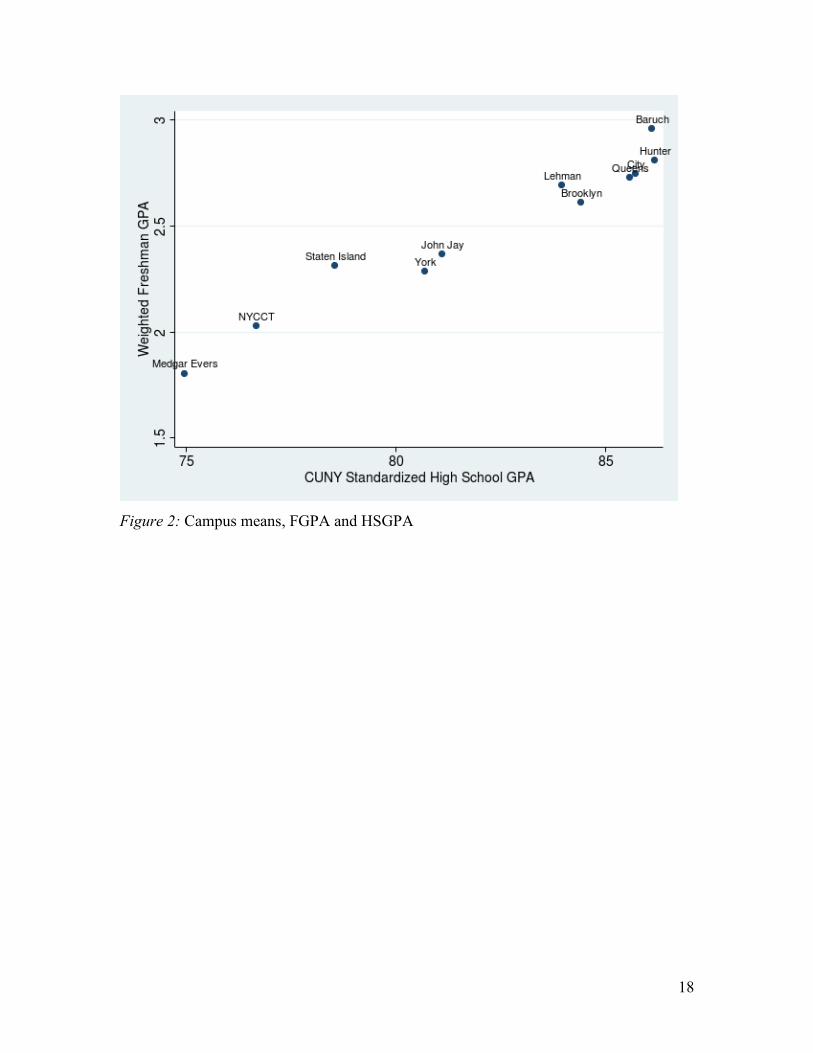
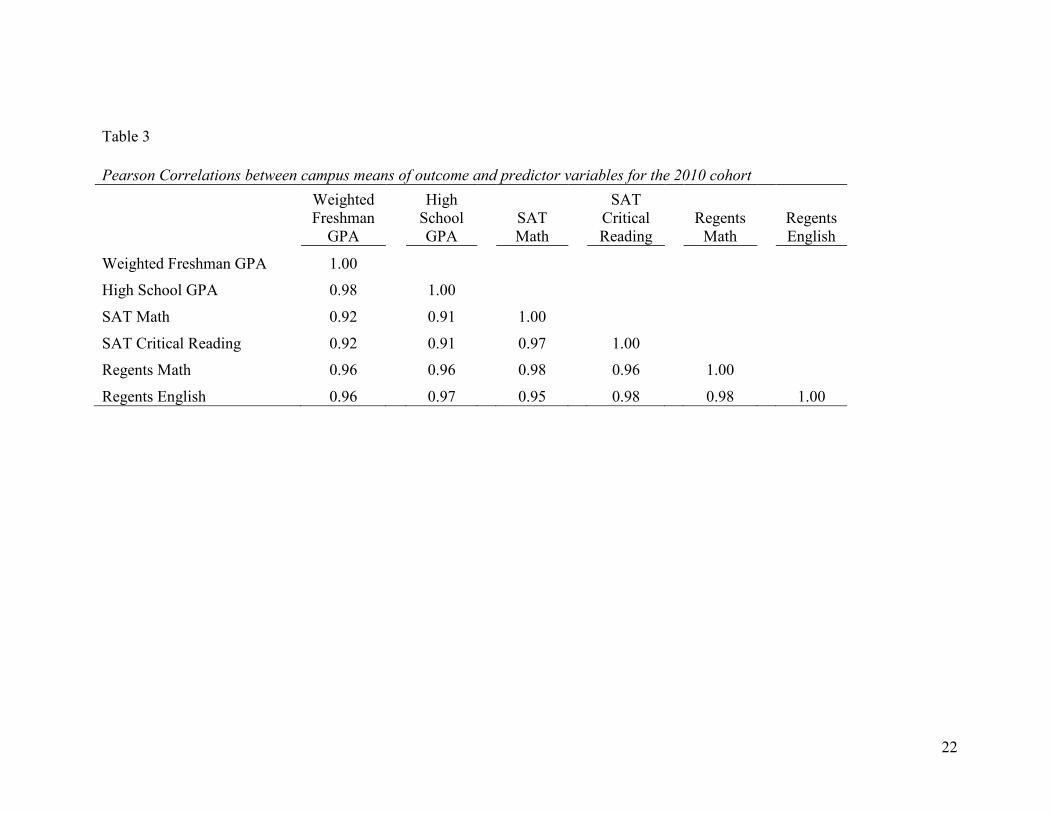
We found remarkably strong between-campus relationships between measures of
secondary-school performance and freshman grade-point average (Table 3). In particular,
there is an extremely strong relationship (ݎ = .98) between mean FGPA and mean
HSGPA (Figure 2). The dispersion of means on the x-axis is to be expected; it merely
shows that the campuses differ in selectivity, with Medgar Evers accepting students with
relatively low HSGPA and with Baruch and Hunter at the other extreme. What we found
surprising is that these differences in selectivity were closely mirrored by corresponding
differences in mean FGPA. We found similar relationships between mean FGPA and our
9
other predictors, indicating that these relationships reflect characteristics of FGPA rather
than of any given measure of secondary performance.
These strong between-campus relationships suggest that faculty are applying
reasonably similar grading standards across campuses. To the extent that this is true,
analyzing relationships separately by campus does not avoid attenuation by eliminating
noise. On the contrary, it attenuates observed relationships by discarding valuable
predictive variation that lies between campuses. On the other hand, pooling the data
across campuses obscures between-campus variations in the relationships studied, and we
found that in the CUNY system, these variations are large. For this reason, we present
below both within-campus and pooled system-wide regression results.
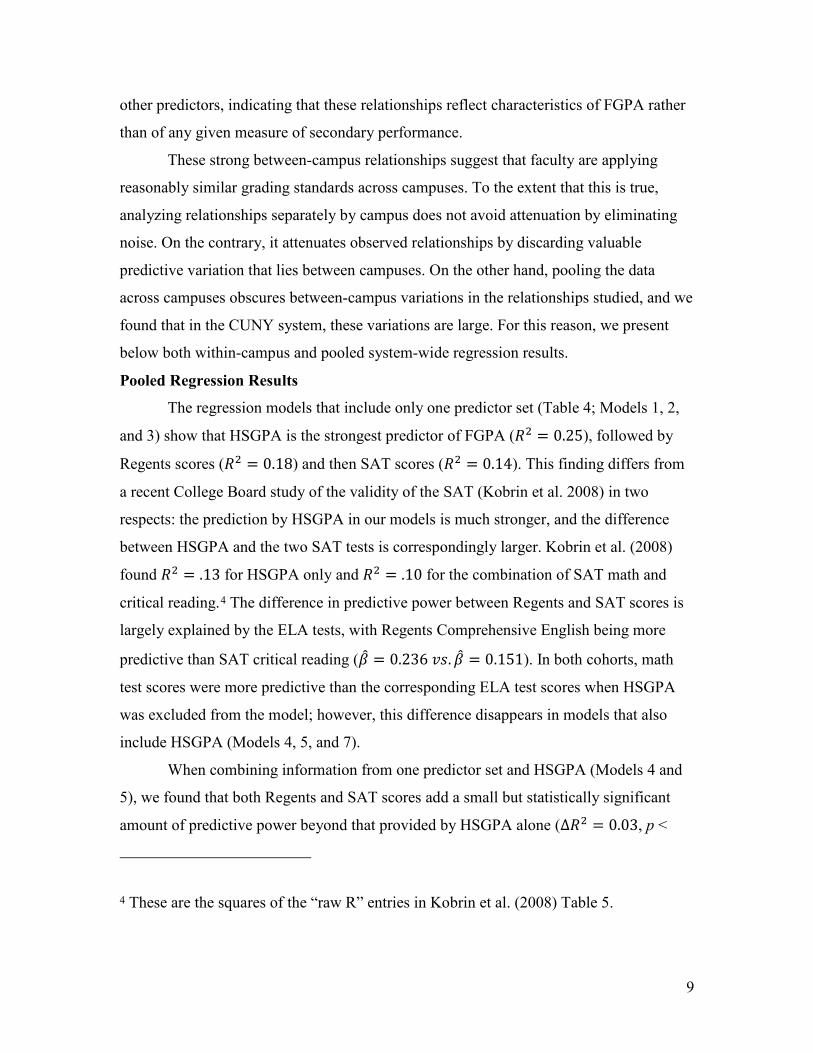
Pooled Regression Results
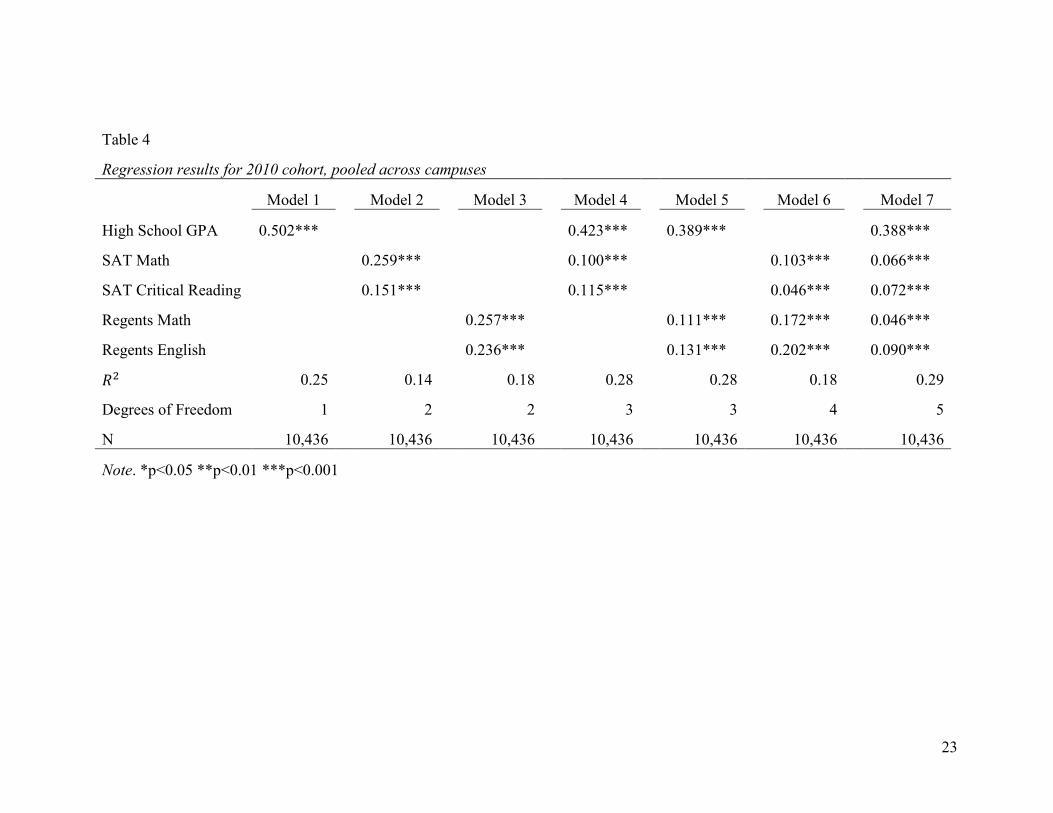
The regression models that include only one predictor set (Table 4; Models 1, 2,
and 3) show that HSGPA is the strongest predictor of FGPA (ଶ = 0.25), followed by
Regents scores (ଶ = 0.18) and then SAT scores (ଶ = 0.14). This finding differs from
a recent College Board study of the validity of the SAT (Kobrin et al. 2008) in two
respects: the prediction by HSGPA in our models is much stronger, and the difference
between HSGPA and the two SAT tests is correspondingly larger. Kobrin et al. (2008)
found ଶ = .13 for HSGPA only and ଶ = .10 for the combination of SAT math and
critical reading.4 The difference in predictive power between Regents and SAT scores is
largely explained by the ELA tests, with Regents Comprehensive English being more
predictive than SAT critical reading (ߚመ = መߚ.ݏݒ 0.236 = 0.151). In both cohorts, math
test scores were more predictive than the corresponding ELA test scores when HSGPA
was excluded from the model; however, this difference disappears in models that also
include HSGPA (Models 4, 5, and 7).
When combining information from one predictor set and HSGPA (Models 4 and
5), we found that both Regents and SAT scores add a small but statistically significant
amount of predictive power beyond that provided by HSGPA alone (ȟଶ = 0.03, p <
4 These are the squares of the “raw R” entries in Kobrin et al. (2008) Table 5.

10
.001). These models explain the same amount of variation in FGPA (ଶ = 0.28)
regardless of the choice of test. In these models, HSGPA remains the strongest predictor
by a wide margin (ߚመ ൎ 0.4).
The models that include both SAT and Regents scores (Models 6 and 7) show that
the two tests have a high degree of overlap in predicting FGPA. Comparing these models
to the corresponding models with only one of the two sets of tests (Model 6 with Models
2 and 3; Model 7 with Models 4 and 5) suggests that there is little incremental validity
(ȟଶ 0.04) associated with the additional information from adding a second set of
tests, regardless of which. In the model including all available measures (Model 7), we
find that HSGPA is still the strongest predictor by a good margin (ߚመ = መߚ.ݏݒ 0.388 0.09 for other predictors).
Campus-Level Regression Results
FGPA is much more predictable at some campuses than others, with ଶ from
Model 7 ranging from 0.14 to 0.31 across the eleven campuses. (Table 5 provides the
regression results, and Table 6 provides the range and means of the coefficients.) The
average ଶ from the campus-level regressions (0.20) is lower than the corresponding ଶ
from the pooled analysis (0.29); this is because students with higher test scores and
HSGPAs tend to select into campuses with higher FGPAs, a process that is not modeled
by within-campus regressions. The regression coefficients also vary across campuses,
with ranges greater than 0.1 for each predictor. This variation is in some cases so great
that measures that have no predictive power for some campuses (e.g. SAT critical reading
at Baruch, ߚመ = െ0.002) are the most predictive test score at others (e.g. SAT critical
reading at City College, ߚመ = 0.126). Similar variation across campuses appears in
simpler models, e.g., Model 5. However, an important caveat is that many of the within-
campus coefficients are not significant, and a substantial share of the between-campus
variation is likely to be noise.
To explore possible explanations for this variation, we looked at the relationships
between the ଶ values for each campus and the means and standard deviations of each
predictor by campus. Bivariate scatterplots (for example, Figure 2) suggest that
prediction might be stronger at more selective campuses, and all other factors being
equal, one might expect stronger prediction in campuses with more variation in

11
predictors. We evaluated this by ranking the campuses on both the means and standard
deviations of all variables and then calculating Spearman rank correlations between each
of the variables and ଶ.
The strength of prediction is clearly positively related to the selectivity of the
campus. Spearman correlations between ଶ and the variables in our models ranged from
0.25 (HSGPA) to 0.40 (FGPA, Regents English, and both SAT tests; see Table 7). In
contrast, the relationship between ଶ and the standard deviation of our variables was
inconsistent—positive in four instances but negative in the case of FGPA and Regents
English. Both sets of results are consistent across the two cohorts.
To evaluate whether the variation in ଶ values across campuses was a result of
random idiosyncrasies associated with the 2010 cohort, we compared the findings across
cohorts using our most complete model (model 7) and found that the observed campus-
level predictive relationships were quite stable across time. The average change in ଶ
across years was 0.026, with one campus a strong outlier (Brooklyn College, ȟଶ =0.13). Similarly, the average absolute change in the coefficients across years was 0.051,
suggesting that the fluctuation in predictive relationships is moderate as well. Therefore,
variations in results across campus cannot be entirely explained by cohort effects.
Sensitivity Tests
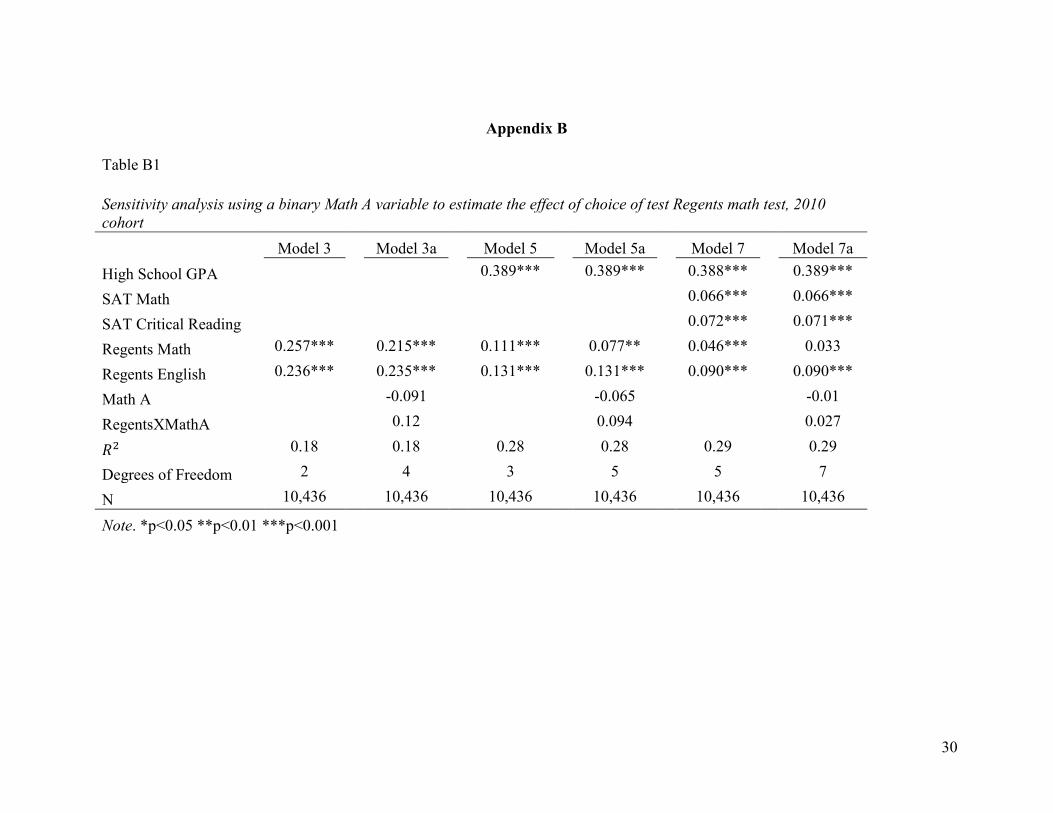
We conducted three sensitivity tests to assess the robustness of our results. The
results did not identify any substantial problems. The first test explored how the
predictive relationship between mathematics scores and FGPA differed across the two
Regents mathematics exams. The Regents mathematics variable used in the models in
Table 4 used the score on modal math test for that cohort, if available for a student, and
the non-modal score if this but not the modal score was available. This may have masked
differences in the predictive relationships between the two exams. To address this, we
added to the relevant models (Models 3, 5, and 7) a dummy variable indicating which
exam a student took and an interaction term between that dummy and the Regents math
variable (see Appendix B). This allowed us to examine both whether the specific test a
student took was predictive of FGPA and whether the tests had different predictive power
within each cohort. The choice of tests made little difference in either respect, so the
simpler models were retained.

12
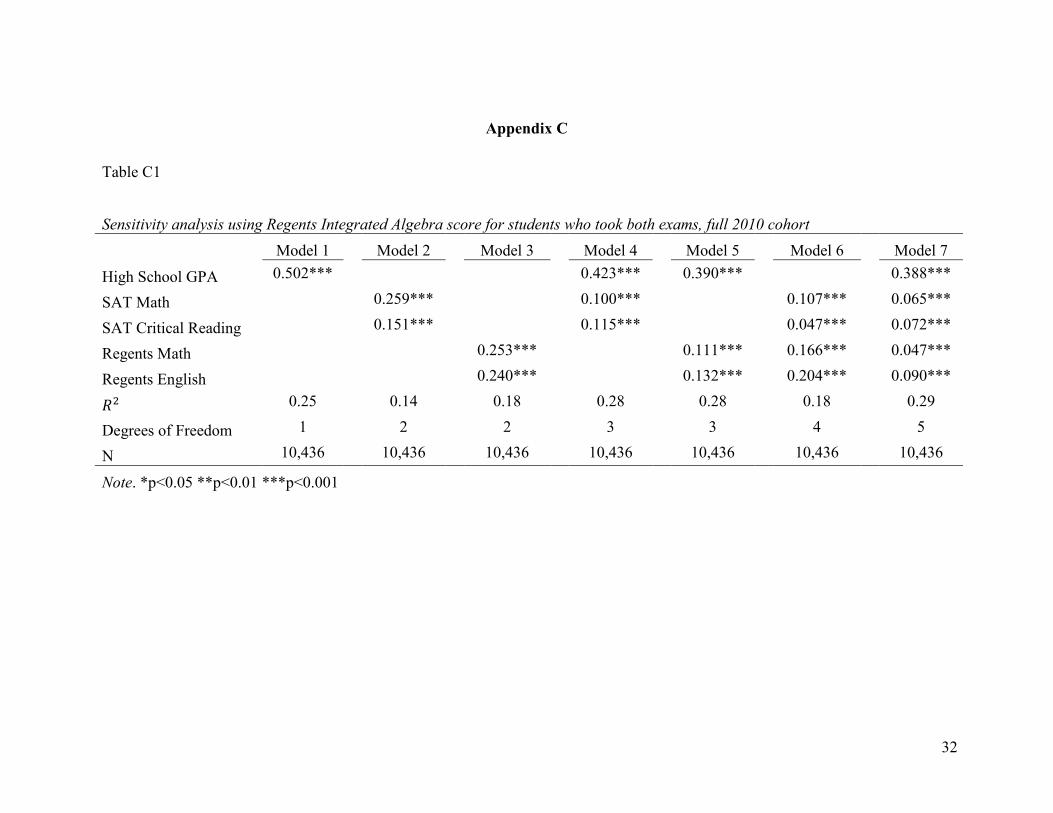
The second sensitivity test analyzed the effect of using a different rule for
selecting a Regents mathematics score for students who took both the Mathematics A and
Integrated Algebra tests. These students constituted less than 6 percent of our analytical
sample in both cohorts. In the 2010 cohort, this decision had no substantial effect on our
results. Appendix Table C1 shows results comparable to Table 4 for the 2010 cohort,
using the Integrated Algebra score instead of the Math A score for the students who had
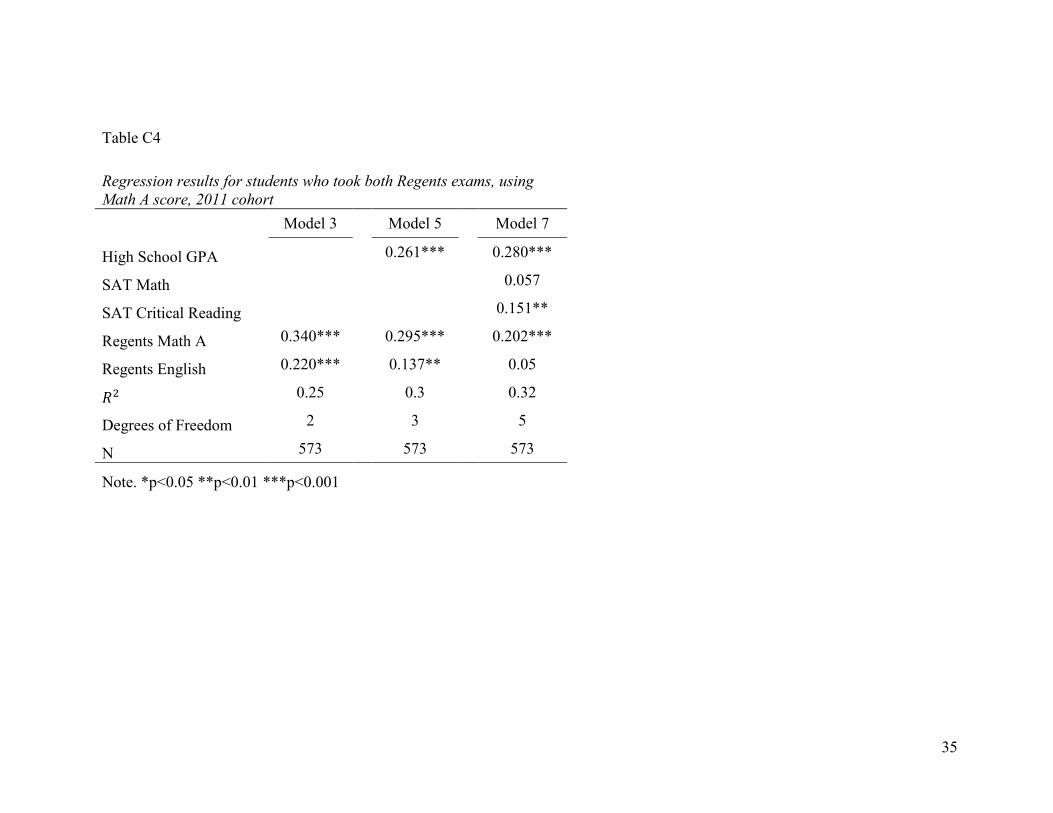
both scores. In the 2011 cohort, however, this choice did have an appreciable effect
despite the small number of students. Appendix Table C2 shows results comparable to
Appendix Table A2 for the 2011 cohort, but using Mathematics A scores for students
who had both. To explore this, we estimated our models separately in the subsample of
students for whom we had both scores, using each of the two scores. For this subsample
of the 2011 cohort, the choice of exam score had a substantial effect on the estimated
coefficients (Table C3). The coefficients of most interest to us—those for the Regents
exam—were more consistent with our other results when we used the modal test
(Integrated Algebra for that cohort), so we chose to be consistent with the analysis of the
2010 cohort and use the modal test score for all students who had it.
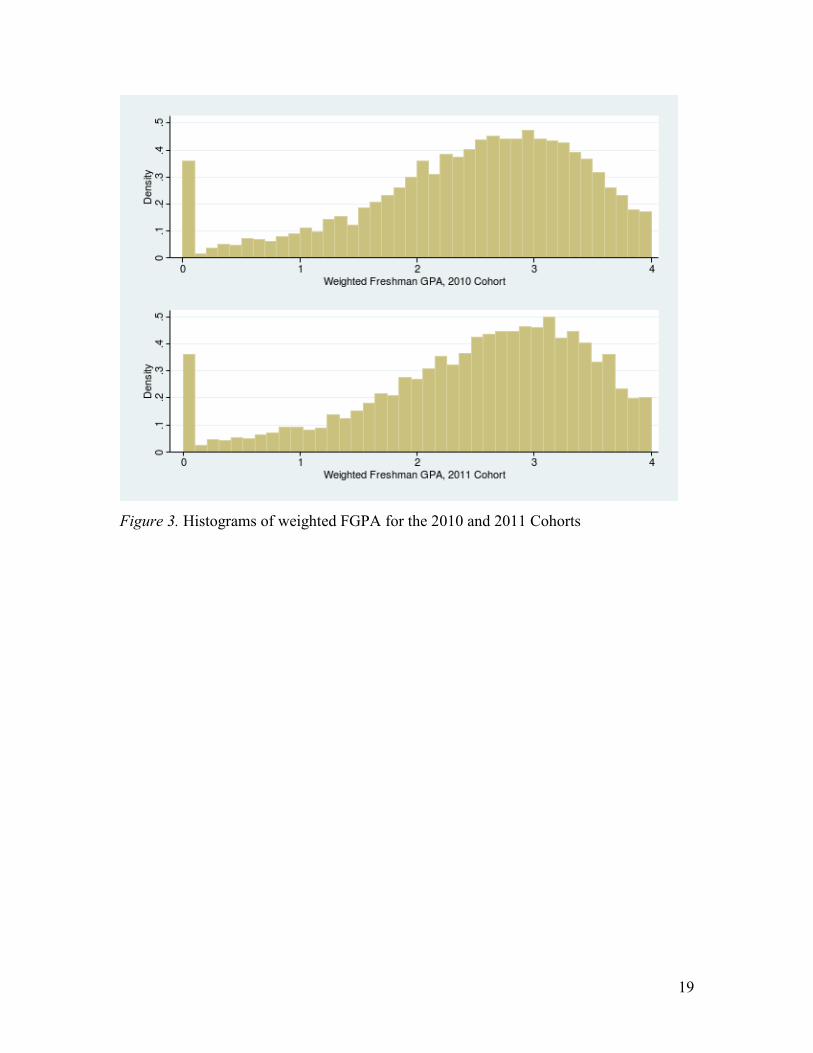
The third sensitivity test addressed non-normality in our outcome. The
distribution for FGPA is skewed left and has a spike at zero (see Figure 3). Only a small
number of students fall in this spike (less than 4% in each cohort), but we nonetheless
replicated our analyses after dropping these students and found no appreciable difference
in the results (see Appendix D).
Discussion
We undertook this study with the expectation that the two Regents tests would
function quite differently from the two SAT tests as predictors of FGPA. The Regents
tests are much more closely tied to the implemented curriculum, and we would expect
them to be the focus of extensive and test preparation that is both more widespread and of
longer duration than preparation for the SAT.
Our findings are inconsistent with this expectation. Looking at the CUNY system
as a whole, our overarching finding is that it makes little difference in the aggregate
which of the pairs of tests is used or even whether the model includes only one set tests or
both. If HSGPA is omitted from the model, the Regents tests predict slightly better than

13
the SAT, but once HSGPA is included in the model, the differences in predictive power
between the two sets of tests is negligible. If one starts with a baseline model that
includes HSGPA and either of the two sets of tests, adding the second set of tests has a
trivial effect on overall prediction. However, the models that include both tests show
modest but significant effects of all four tests on FGPA, indicating that the tests capture
different information. Therefore, while the choice between the two sets of tests has little
effect in the aggregate, it will affect which students are selected.
We also found that the substitution of the newer Integrated Algebra Regents
examination for the older Mathematics A exam had little effect. The patterns we found in
the 2010 entering cohort, of whom 95 percent took the Math A exam, were largely
replicated in the 2011 entering cohort, of whom 76 percent took the Integrated Algebra
test. For the most part, the differences in findings between cohorts are very small and
may be nothing more than noise. One might expect a newly introduced test to predict
differently from a long-standing older test because of less well developed test preparation
activities for the newer test. However, the Integrated Algebra test was introduced
gradually, and educators had considerable time to reorient their instruction to better target
the new test. Moreover, the two exams were not greatly different. The content standards
for the Integrated Algebra test were quite similar to those for Mathematics A, although a
bit more extensive (Abrams, 2010). Moreover, the two tests were structured very
similarly; in June 2008, for example, both comprised 30 multiple-choice questions
followed by nine constructed-response items.5 Therefore, it is quite possible that many of
the effects of test preparation focused on the Math A test would generalize to Integrated
Algebra.
Our findings about the incremental prediction provided by tests are inconsistent
with some earlier research. For example, using a national (but not representative) sample
of postsecondary institutions, Kobrin et al. (2008) found only slightly stronger prediction
5 Complete test forms for the two examinations can be downloaded from http://www.nysedregents.org/IntegratedAlgebra/ and http://www.nysedregents.org/MathematicsA/.

14
by HSGPA (ଶ = .13) than by the SAT (ଶ = .10), and they also found that combining
both predictors yielded appreciably better prediction than either alone (ଶ = .19). In
contrast, not only did we find much stronger prediction by HSPGA, we also found that
adding either set of tests to HSGPA had only a very small effect on prediction (in the
2010 cohort, ȟଶ = .03). We cannot ascertain from our data why our results are so
markedly different. One possible factor is the refined HSGPA variable used by CUNY,
which is focused on college-preparatory classes. These results may also reflect
characteristics of the CUNY campuses or of the students who attend them.
Our findings point to several questions that warrant further explanation. First, as
noted earlier, these analyses by themselves are not sufficient to explore the effects of test
preparation on prediction. Additional work is needed to disentangle the effects of the
content and difficulty of the tests from test preparation. Second, our descriptive analyses
make it clear that prediction is considerably stronger in some parts of the achievement
range than in others. More complex analytical models are needed to clarify these
differential relationships. Third, we stress that despite the small increment in aggregate
prediction yielded by either set of tests—or both—all four tests had appreciable and
statistically significant relationships with FGPA. This indicates that different sets of
predictors will select different groups of students, and further analysis is needed to
explore which groups of students are advantaged or disadvantaged by various predictors.
Finally, we maintain that the single-level regression approach, which is used both here
and in the literature on the validity of college-admissions tests, is not optimal because it
conflates within- and between-school relationships.

15
References
Abrams, D. (2010). Request for Public Comment: Appendix. Albany, New York: New
York State Education Department.
Bridgeman, B., McCamley-Jenkins, L., & Ervin, N. (2000). Predictions of Freshman
Grade-Point Average From the Revised and Recentered SAT I: Reasoning Test.
(College Board Research Report No. 2000-1.) New York: The College Entrance
Examination Board.
Briggs, D. C. (2002). SAT Coaching, Bias and Causal Inference. Unpublished doctoral
dissertation. University of California at Berkeley.
College Board. (2010). 2010 College-bound seniors: total group profile report. Retrieved
from https://professionals.collegeboard.com/profdownload/2010-total-group-
profile-report-cbs.pdf
Deming, D. J. (2008). Early childhood intervention and life-cycle skill development:
Evidence from head start. American Economic Journal: Applied Economics, 1(3):
111-34.
Deming, D. J., Cohodes, S., Jennings, J., and Jencks, C. (2013). School Accountability,
Postsecondary Attainment And Earnings. Working Paper 19444. Cambridge, MA:
National Bureau of Economic Research.
Jacob, B. (2007). Test-based accountability and student achievement: An investigation of
differential performance on NAEP and state assessments. Cambridge, MA:
National Bureau of Economic Research (Working Paper 12817).
Klein, S. P., Hamilton, L. S., McCaffrey, D. F., & Stecher, B. M. (2000). What do test
scores in Texas tell us? (Issue Paper IP-202). Santa Monica, CA: RAND.
Retrieved January 12, 2004,from http://www.rand.org/publications/IP/IP202/
Kobrin. J. L., Patterson, B. F., Shaw, E. J., Mattern, K. D., & Barbuti, S. M. (2008).
Validity of the SAT for Predicting First-Year College Grades. (College Board
Research Report No. 2008-5.) New York: The College Board.
Koretz, D., & Barron, S. I. (1998). The Validity of Gains on the Kentucky Instructional
Results Information System (KIRIS). MR-1014-EDU, Santa Monica: RAND.

16
Koretz, D., Barron, S., Mitchell, K., & Stecher, B. (1996). The perceived effects of the
Kentucky instructional results information system (kiris) (MR-792–PCT/FF).
Santa Monica, CA: RAND.
Koretz, D., Linn, R. L., Dunbar, S. B., & Shepard, L. A. (1991, April). The effects of
high-stakes testing: Preliminary evidence about generalization across tests. In R.
L. Linn (Chair), The effects of high stakes testing. Symposium presented at the
annual meetings of the American Educational Research Association and the
National Council on Measurement in Education, Chicago.
Lindquist, E. F. (1951). Preliminary considerations in objective test construction. In E. F.
Lindquist (Ed.), Educational measurement (2nd ed., 119–158). Washington:
American Council on Education.
Linn, R. L. (1983). Pearson selection formulas: Implications for studies of predictive bias
and estimates of educational effects in selected samples. Journal of Educational
Measurement, 20(1), 1-15.
Pedulla, J. J., Abrams, L. M., Madaus, G. F., Russell, M. K., Ramos, M. A., Miao, J., et
al. (2003). Perceived effects of state-mandated testing programs on teaching and
learning: Findings from a national survey of teachers. Chestnut Hill,
Massachusetts: National Board on Educational Testing and Public Policy.
Retrieved July 15, 2010. http://www.bc.edu/research/nbetpp/statements/nbr2.pdf
Shepard, L. A., & Dougherty, K. D. (1991). The effects of high stakes testing. In R. L.
Linn (Ed.), Annual meetings of the American Education Research Association and
the National Council of Measurement in Education. Chicago, IL.
Smith, M. L., & Rottenberg, C. (1991). Unintended consequences of external testing in
elementary schools. Educational Measurement: Issues and Practice, 10 (4), 7–11.
Stecher, B. M., Barron, S. L., Chun, T., & Ross, K. (2000). The effects of the Washington
state education reform on schools and classrooms (CSE Tech. Rep. No. 525). Los
Angeles: University of California, Los Angeles, Center for Research on
Evaluation, Standards and Student Testing.

17
Figures
Figure 1. Weighted FGPA plotted against CUNY standardized high school GPA, 2010
cohort
18
Figure 2: Campus means, FGPA and HSGPA
19
Figure 3. Histograms of weighted FGPA for the 2010 and 2011 Cohorts
20
Tables
Table 1
Demographics of the 2010 and 2011201 Cohorts
2010 Cohort
2011 Cohort
Proportion Female 0.56 0.55 Proportion White 0.14 0.15 Proportion Black 0.13 0.15 Proportion Asian 0.20 0.24 Proportion Black 0.21 0.25 SAT Math Score 499 505 SAT Critical Reading Score 461 464 HSGPA 81.71 82.35 Grade 8 Math Score 669 674 Grade 8 ELA Score 662 662
Number of students 10,436 9,971

21
Table 2
Student-level Pearson Correlations between outcome and predictor variables for the 2010 cohort
Weighted Freshman
GPA
High School GPA
SAT Total Score
SAT Math
SAT Critical Reading
Regents Math
Regents English
Weighted Freshman GPA 1.00
High School GPA 0.50
1.00 SAT Total Score 0.37
0.42
1.00
SAT Math 0.35
0.43
0.91
1.00
SAT Critical Reading 0.31
0.32
0.88
0.61
1.00
Regents Math 0.36
0.50
0.70
0.76
0.48
1.00
Regents English 0.35
0.44
0.57
0.44
0.58
0.45
1.00
22
Table 3
Pearson Correlations between campus means of outcome and predictor variables for the 2010 cohort
Weighted Freshman
GPA
High School GPA
SAT Math
SAT Critical Reading
Regents Math
Regents English
Weighted Freshman GPA 1.00 High School GPA 0.98
1.00 SAT Math 0.92
0.91
1.00
SAT Critical Reading 0.92
0.91
0.97
1.00 Regents Math 0.96
0.96
0.98
0.96
1.00
Regents English 0.96
0.97
0.95
0.98
0.98
1.00
23
Table 4
Regression results for 2010 cohort, pooled across campuses
Model 1
Model 2
Model 3
Model 4
Model 5
Model 6
Model 7
High School GPA 0.502***
0.423***
0.389***
0.388***
SAT Math
0.259***
0.100***
0.103***
0.066***
SAT Critical Reading
0.151***
0.115***
0.046***
0.072***
Regents Math
0.257***
0.111***
0.172***
0.046***
Regents English
0.236***
0.131***
0.202***
0.090***
ଶ 0.25
0.14
0.18
0.28
0.28
0.18
0.29
Degrees of Freedom 1
2
2
3
3
4
5
N 10,436 10,436 10,436 10,436 10,436 10,436 10,436
Note. *p<0.05 **p<0.01 ***p<0.001

24
Table 5
By-campus results for Model 7 in the 2010 cohorts
Baruch
Brooklyn
City
Hunter
John Jay
Lehman
High School GPA 0.490***
0.258***
0.371***
0.454***
0.265***
0.290***
SAT Math -0.012
-0.021
0.017
0.028
0.077*
-0.008
SAT Critical Reading 0.124***
0.117**
0.06
0.079**
0.113***
0.018
Regents Math 0.127***
0.037
-0.037
0.058
0.027
0.171**
Regents English -0.002
0.096*
0.126***
0.108***
0.097**
0.018
ଶ 0.31
0.14
0.18
0.28
0.15
0.14
Degrees of Freedom 5
5
5
5
5
5
N 817 704 953 1,128 1,243 369
Queens
York
Medgar Evers
NYCCT
Staten Island
High School GPA 0.328***
0.337*** 0.411*** 0.312*** 0.395*** SAT Math 0.036
0.075 0.1 0.090** -0.02
SAT Critical Reading 0.102*
0.039 0.011 0.091*** 0.128*** Regents Math -0.001
-0.002 -0.025 0.089** 0.137***
Regents English 0.097*
0.111** 0.067 0.027 0.055 R2 0.19
0.15 0.21 0.19 0.28
Degrees of Freedom 5
5 5 5 5 N 766
878 514 1,749 1,315
Note. *p<0.05 **p<0.01 ***p<0.001

25
Table 6
Range and averages of coefficients from Model 7, 2010 cohort
Minimum
Maximum
Range
Average
Coefficient from Pooled
Model 7
High School GPA 0.26 0.49 0.23 0.36 0.39
SAT Math -0.03 0.12 0.16 0.05 0.07 SAT Reading 0.00 0.13 0.13 0.07 0.07 Regents Math -0.01 0.09 0.10 0.04 0.05
Regents English 0.02 0.12 0.11 0.08 0.09
R2 0.14 0.31 0.17 0.20 0.29

26
Table 7
Spearman rank correlations of R2 from Model 7 with means and standard deviations of all variables
Means
Standard deviations
FGPA 0.42 -0.36
HSGPA 0.25 0.39
Regents math 0.34 0.16
Regents English 0.45 -0.12
SAT Math 0.40 0.65
Sat Critical Reading 0.45 0.65

27
Appendix A
Table A1
Student-level Pearson Correlations between outcome and predictor variables for the 2011 cohort
Weighted Freshman
GPA
High School GPA
SAT Total Score
SAT Math
SAT Critical Reading
Regents Math
Regents English
Weighted Freshman GPA 1.00
High School GPA 0.50
1.00 SAT Total Score 0.37
0.42
1.00
SAT Math 0.36
0.44
0.91
1.00 SAT Critical Reading 0.29
0.30
0.88
0.59
1.00
Regents Math 0.35
0.47
0.72
0.77
0.49
1.00 Regents English 0.33
0.44
0.56
0.45
0.57
0.44
1.00
28
Table A2
Regression results for 2011 cohort, pooled across campuses
Model 1
Model 2
Model 3
Model 4
Model 5
Model 6
Model 7
High School GPA 0.496***
0.416***
0.394***
0.392*** SAT Math
0.280***
0.113***
0.142***
0.081***
SAT Critical Reading
0.126***
0.100***
0.031*
0.071***
Regents Math
0.257***
0.121***
0.147***
0.043** Regents English
0.217***
0.102***
0.184***
0.061***
ଶ 0.25
0.14
0.16
0.28
0.27
0.17
0.28 Degrees of Freedom 1
2
2
3
3
4
5
N 9,971 9,971 9,971 9,971 9,971 9,971 9,971 Note. *p<0.05 **p<0.01 ***p<0.001

29
Table A3
By-campus results for Model 7 in the 2011 cohort
Baruch
Brooklyn
City
Hunter
John Jay
Lehman
High School GPA 0.500***
0.413***
0.276***
0.404***
0.263***
0.327*** SAT Math 0.035
0.02
-0.021
-0.025
0.069
0.082
SAT Critical Reading 0.048
0.102**
0.132***
0.066*
0.146***
-0.004
Regents Math 0.125***
0.073
0.05
0.175***
-0.013
-0.013 Regents English 0.090**
0.043
0.123**
0.039
0.062
0.105
ଶ 0.34
0.27
0.18
0.22
0.14
0.14 Degrees of Freedom 5
5
5
5
5
5
N 793 700 957 1,256 1,023 366
Queens York Medgar Evers NYCCT
Staten Island
High School GPA 0.322*** 0.368*** 0.367*** 0.358*** 0.401*** SAT Math -0.021 0.021 0.112* 0.072** 0.077* SAT Critical
Reading 0.084 0.073 -0.07 0.029 0.019
Regents Math 0.076 0.012 -0.084 0.092** 0.087* Regents English 0.103* 0.096* 0.265*** 0.002 0.052 ଶ 0.18 0.17 0.21 0.17 0.27 Degrees of Freedom 5 5 5 5 5 N 666 720 463 1,797 1,230 Note. *p<0.05 **p<0.01 ***p<0.001
30
Appendix B
Table B1
Sensitivity analysis using a binary Math A variable to estimate the effect of choice of test Regents math test, 2010 cohort
Model 3
Model 3a
Model 5
Model 5a
Model 7
Model 7a
High School GPA
0.389***
0.389***
0.388***
0.389***
SAT Math
0.066***
0.066***
SAT Critical Reading
0.072***
0.071***
Regents Math 0.257***
0.215***
0.111***
0.077**
0.046***
0.033
Regents English 0.236***
0.235***
0.131***
0.131***
0.090***
0.090***
Math A
-0.091
-0.065
-0.01
RegentsXMathA
0.12
0.094
0.027
ଶ 0.18
0.18
0.28
0.28
0.29
0.29
Degrees of Freedom 2
4
3
5
5
7
N 10,436 10,436 10,436 10,436 10,436 10,436
Note. *p<0.05 **p<0.01 ***p<0.001

31
Table B2
Sensitivity analysis using a binary Math A variable to estimate the effect of choice of test Regents math test, 2011 cohort
Model 3
Model 3a
Model 5
Model 5a
Model 7
Model 7a
High School GPA
0.394***
0.396***
0.392***
0.393***
SAT Math
0.081***
0.081***
SAT Critical Reading
0.071***
0.068***
Regents Math 0.257***
0.260***
0.121***
0.107***
0.043**
0.036*
Regents English 0.217***
0.217***
0.102***
0.100***
0.061***
0.060***
Math A
0.053
0.037
0.048
RegentsXMathA
-0.054
-0.007
-0.029
ଶ 0.16
0.16
0.27
0.27
0.28
0.28
Degrees of Freedom 2
4
3
5
5
7
N 9,971 9,971 9,971 9,971 9,971 9,971
Note. *p<0.05 **p<0.01 ***p<0.001
32
Appendix C
Table C1
Sensitivity analysis using Regents Integrated Algebra score for students who took both exams, full 2010 cohort
Model 1
Model 2
Model 3
Model 4
Model 5
Model 6
Model 7
High School GPA 0.502***
0.423***
0.390***
0.388***
SAT Math
0.259***
0.100***
0.107***
0.065***
SAT Critical Reading
0.151***
0.115***
0.047***
0.072***
Regents Math
0.253***
0.111***
0.166***
0.047***
Regents English
0.240***
0.132***
0.204***
0.090***
ଶ 0.25
0.14
0.18
0.28
0.28
0.18
0.29
Degrees of Freedom 1
2
2
3
3
4
5
N 10,436 10,436 10,436 10,436 10,436 10,436 10,436
Note. *p<0.05 **p<0.01 ***p<0.001

33
Table C2
Sensitivity analysis using Regents Mathematics A score for students who took both exams, full 2011 cohort
Model 1
Model 2
Model 3
Model 4
Model 5
Model 6
Model 7
High School GPA 0.496***
0.416***
0.394***
0.392***
SAT Math
0.280***
0.113***
0.142***
0.043**
SAT Critical Reading
0.126***
0.100***
0.031*
0.061***
Regents Math
0.257***
0.121***
0.147***
0.081***
Regents English
0.217***
0.102***
0.184***
0.071***
ଶ 0.25
0.14
0.16
0.28
0.27
0.17
0.28
Degrees of Freedom 1
2
2
3
3
4
5
N 10,436 10,436 10,436 10,436 10,436 10,436 10,436
Note. *p<0.05 **p<0.01 ***p<0.001

34
Table C3
Regression results for students who took both Regents exams, using Integrated Algebra score, 2010 cohort
Model 3
Model 5
Model 7
High School GPA
0.388***
0.373***
SAT Math
0.078
SAT Critical Reading
0.041
Regents IA 0.146***
0.069
0.036
Regents English 0.298***
0.151***
0.118*
ଶ 0.14
0.25
0.26
Degrees of Freedom 2
3
5
N 530 530 530
Note. *p<0.05 **p<0.01 ***p<0.001
35
Table C4
Regression results for students who took both Regents exams, using Math A score, 2011 cohort
Model 3
Model 5
Model 7
High School GPA
0.261***
0.280***
SAT Math
0.057
SAT Critical Reading
0.151**
Regents Math A 0.340***
0.295***
0.202***
Regents English 0.220***
0.137**
0.05
ଶ 0.25
0.3
0.32
Degrees of Freedom 2
3
5
N 573 573 573
Note. *p<0.05 **p<0.01 ***p<0.001

36
Table C5
Regression results for students who took both Regents exams, using Integrated Algebra score, 2011 cohort
Model 3
Model 5
Model 7
High School GPA
0.286***
0.299***
SAT Math
0.183**
SAT Critical Reading
0.142*
Regents IA 0.216***
0.185***
0.026
Regents English 0.298***
0.195***
0.076
ଶ 0.2
0.27
0.3
Degrees of Freedom 2
3
5
N 573 573 573
Note. *p<0.05 **p<0.01 ***p<0.001

37
Appendix D
Table D1
Sensitivity analysis dropping students with a weighted freshman GPA of zero, 2010 cohort
Model 1
Model 2
Model 3
Model 4
Model 5
Model 6
Model 7
High School GPA 0.493***
0.412***
0.379***
0.379***
SAT Math
0.251***
0.097***
0.099***
0.060***
SAT Critical Reading
0.162***
0.126***
0.060***
0.083***
Regents Math
0.253***
0.115***
0.168***
0.051***
Regents English
0.238***
0.136***
0.197***
0.090***
ଶ 0.24
0.14
0.17
0.28
0.28
0.18
0.28
Degrees of Freedom 1
2
2
3
3
4
5
N 10,067 10,067 10,067 10,067 10,067 10,067 10,067
Note. *p<0.05 **p<0.01 ***p<0.001

38
Table D2
Sensitivity analysis dropping students with a weighted freshman GPA of zero, 2011 cohort
Model 1
Model 2
Model 3
Model 4
Model 5
Model 6
Model 7
High School GPA 0.500***
0.414***
0.388***
0.387***
SAT Math
0.282***
0.117***
0.140***
0.081***
SAT Critical Reading
0.142***
0.115***
0.043***
0.082***
Regents Math
0.264***
0.131***
0.152***
0.049***
Regents English
0.226***
0.114***
0.189***
0.067***
ଶ 0.25
0.15
0.17
0.29
0.28
0.18
0.29
Degrees of Freedom 1
2
2
3
3
4
5
N 9,608 9,608 9,608 9,608 9,608 9,608 9,608
Note. *p<0.05 **p<0.01 ***p<0.001