Embed Size (px)
Citation preview

Application Note
1
Predicting monoclonal antibody stability in different formulations using the UNit
Introduction
Over the last few decades there has been a paradigm
shift in the world of therapeutic medicines. Small
molecules, such as aspirin and penicillin, no longer
dominate the market place and block buster biologics
such as Humira (Abbott), Remicade (Centocore) and
Herceptin (Genentech) are now leading the way.
A biologic therapeutic is typically a protein, the building
blocks and machinery of life. Proteins are fundamentally
more complicated than small molecules as they are
(relatively) large macromolecules with a high degree of
complexity of structure and function. Typically
administered in solution, the molecules are held
together by a combination of short range interactions
within the molecule and with the solvent, and longer
range forces such as electrostatics.
Proteins, particularly antibodies, have highly complex
native conformations, each having unique chemical and
physical properties. In order to develop therapeutic
proteins as safe and economically feasible medicines
they are required to have adequate robustness to
endure the wide range of thermal, mechanical and
chemical stresses to which they are exposed during
manufacture, storage, transport and administration.
This is usually achieved through either engineering the
protein candidate to generate a compound which has
the required intrinsic stability, or by altering the matrix
in which the protein exists by changing its composition.
The process of optimizing the solvent conditions
(formulation) of protein drug candidates can be an
extremely difficult and time consuming practice. The
optimal formulation will provide a protective
environment which will maintain the molecular
conformation and minimize any degradation products
resulting from exposure to conditions that arise during
the various stages of the manufacturing process. These
conditions include variations in temperature, different
solution pHs, freeze–thawing, freeze–drying, spray–
drying, reconstitution and agitation [1].
The stresses encountered can cause proteins to degrade
via both physical and chemical pathways. Examples of
chemical degradation include hydrolysis, deamidation
and oxidation, which are usually managed through the
use of low temperatures, protection from light or
addition of antioxidants that reduce their rates of
occurrence. By far the most problematic are the
physical degradation pathways of which aggregation
and unfolding are the two most prevalent and
disadvantageous.
After identifying the degradation pathways, possibly
during the preformulation stage, it is necessary to find
suitable mechanisms to circumvent their occurrence.
For drugs which are to be administered parenterally,
changes in the composition of the formulation (other
than altering the solution pH or protein concentration)
most commonly include the addition of a wide variety
of excipients. With such a wide variety of excipients
available to protect against the numerous causes of
protein degradation, making the choice of which ones
to use for further development can be extremely
challenging. Analytical methods traditionally used to
screen colloidal and conformational stability of the
selected drug candidate in these formulations are
typically slow and require large volumes, which limits
the number of formulations which can be characterized
in early development.

Application Note
2
Long-term stability studies of the formulated drug
substance under different stresses are required to test
the shelf life of a drug substance, which are time
consuming and require large amounts of protein. As
such, it is not feasible to carry them out for every
different formulation, especially as there may be no
appropriate formulation at the end of the test period.
Therefore, it is of specific interest to find a method of
analyzing proteins rapidly that can generate a predictive
measure of the stability of the protein after an
extended period.
Since long term stability studies typically take eighteen
months to three years, a long time in the drug
development pipeline, scientists have sought
alternative routes to allow them to screen more
formulations more quickly. This allows them to more
easily narrow the number of final formulations selected
for long term stability studies. The most common route
for this is known as forced degradation, in which
proteins are subjected to extreme handling processes,
such as extremes in temperature, agitation, light
exposure, oxidation, multiple freeze-thaw cycles. These
processes are all known to cause degradation in protein
biopharmaceuticals which often result from practical
applications during the drug substance lifetime, such as
shipping, storage, accidental freezing or losses in
excipient stability or purity. These extreme handling
processes are thought to degrade proteins far more
rapidly than in long term storage and the resultant
degradation routes can be used to predict which
formulations will yield the optimal stability of the
biologic.
Typically techniques such as SDS-PAGE (Sodium dodecyl
sulphate polyacrylamide gel electrophoresis), SEC (size
exclusion chromatography) and DLS (dynamic light
scattering) are used to characterize the conformation
and aggregation state of the protein during these
studies. Models relating to the unfolding and
aggregation of proteins can allow a degree of
extrapolation to occur such that a researcher is able to
predict the formulations which degrade most quickly.
The degradation rates obtained for formulations at
elevated temperature will allow prediction of
degradation (albeit at a slower rate), when stored long
term at reduced temperatures. Supplementary to this
are other predictive measures where parameters
indicative of the thermal stability of the protein can be
shown to correlate with both accelerated stability
measures and the reduction in the monomer fraction or
activity following long term storage [2].
Here, we measure the melting temperature (Tm) and
aggregation onset temperature (Tagg) of a protein in
various formulations. We propose that where these
values are higher for one formulation than another
there will be less statistical probability during storage
for the protein to occupy an unfolded state, reducing its
potential to aggregate.
Typically techniques such as DSC (differential scanning
calorimetry), intrinsic protein fluorescence, DSF
(differential scanning fluorimetry), LS (light scattering –
both static (SLS) and dynamic (DLS)) and self-interaction
chromatography (SIC) are used to characterize
conformational and colloidal thermal stability, but often
these are low throughput, or require large volumes and
multiple cleaning steps. DSC is one of the most
commonly used techniques to compare thermal
stability of proteins, however it takes a significant
amount of time and material, limiting its throughput
capability. Further, usable concentrations are typically
low (<5 mg/mL) as the severe aggregation observed
during the thermal treatment of high concentration
proteins often clogs the instrument and makes its use
difficult and impractical. It is often important to test
proteins in formulation solutions at concentrations used
for delivery which are often high when subcutaneous
injection is preferred.

Application Note
3
Alternative high throughput technologies such as DSF
can be used to characterize conformational stability of
proteins [2], but this has drawbacks as it uses an
extrinsic dye which can interact with and affect the
protein behavior and aggregation characteristics.
New technology developments have endeavored to
navigate these limitations by reducing sample volume
requirements, increasing throughput and automation
and combining the simultaneous acquisition of
information regarding sample conformational and
colloidal stability. The UNit instrumentation combines
intrinsic protein fluorescence, DSF and static light
scattering and offers a complete protein stability
platform to characterize both conformational and
colloidal stability.
Without prior knowledge of the degradation pathway of
a protein, simultaneously measuring both
conformational and colloidal stability of the same
sample provides a broad range of information, which is
crucial when choosing the correct formulation for a
product. While in some cases, the thermal
conformational stability has been shown to correlate
with the monomer loss of a protein during storage, in
other cases it has not and instead the aggregation rate
at 70 °C has [2]. As such, a complete picture is required
to reliably predict the most stable formulation for the
protein of study.
Practical considerations – formulation around degradation
Proteins are not renowned for their stability in solution.
They are well known to be prone to aggregation, even
when stored at 4 °C. There are several common routes
by which this degradation might occur, including
aggregation, fragmentation, and chemical modification.
Physical degradation paths include denaturation,
adsorption to surfaces, aggregation and precipitation.
The risk of following these pathways can be mitigated
by careful and considered choice of the pH, ionic
strength, buffer and excipients for a drug substance or
drug product formulation.
There are many excipients approved by the regulators
that are commonly used to formulate protein drugs [3].
These excipients can be categorized into the following;
buffering agents, amino acids, osmolytes, sugars and
carbohydrates, proteins and polymers, salts,
surfactants, chelators and anti-oxidants, preservatives
and specific ligands [4] [5]. The choice of excipients to
be used is generally based on prior knowledge of the
degradation pathways of the protein of interest.
In this study we aim to demonstrate how the measured
thermal stability can predict the long term aggregation
characteristics of a monoclonal antibody. In this work
the protein used, MAb1, was obtained through the
Bioprocessing Research Industry Club (BRIC) consortium
of the Biotechnology and Biological Sciences Research
Council (BBSRC) of the United Kingdom of Great Britain
and Northern Island (UK).
The UNit as a high throughput protein stability screening platform with different formulations
The UNit instrument is designed for high throughput,
low sample volume investigations into protein stability.
The instrument uses a proprietary multi well sample
plates called the UNi with each well requiring only 9 µL
of sample and capacity for 48 samples to be
investigated in a single experimental run. The
instrument uses thermo-electric heating and cooling for
precise control of sample temperature allowing thermal
ramps or isothermal type experiments to be performed.
The sample is simultaneously illuminated with multiple
wavelengths of laser light allowing simultaneous
acquisition of both fluorescence and static light
scattering data which is analyzed in the bespoke UNit
Analysis software to gain detailed information on both
the conformational and colloidal stabilities.

Application Note
4
Typical UNit data for different formulations Typical data from the UNit thermal ramp experiment,
with two different formulations of the same protein are
shown in Figure 1. The different features are highlighted
and include information regarding: the initial
conformational and colloidal state of the protein
around room temperature; aggregation onset
temperature (Tagg) and any further aggregation events;
single or multiple melting temperatures (Tm); and any
differences in solubility of aggregates (precipitation).
Figure 1: Two different formulations of the same protein with different features highlighted.
Experimental Details Experimental Design
For the purposes of this study, due to the unknown
degradation pathway of MAb1, a variety of different
formulation properties have been selected with broad
variations in pH, salt concentration and excipient, to
yield a range of different stabilities.
144 formulations were screened in one day with the 2
instrument and the resultant information was analyzed
in a variety of different ways to understand the
different stabilities of each of the individual
formulations.
After careful digestion of the wealth of information
provided, a final choice of twelve different formulations
was selected to be taken forward for further study.
These twelve formulations were selected to have a
range of different stabilities, both conformationally and
colloidally. The final 12 selected were taken on to be
studied under a variety of different storage conditions,
typical of a normal short and long term stability study
and in accordance with ICH guidelines. Comparative
information was gathered using size exclusion
chromatography (SEC), dynamic light scattering (DLS)
and UV concentration measurements to characterize
the aggregation and fragmentation throughout the
study.
A selection of time points were chosen at which stage
each of the samples were measured on all of the
techniques. Initially, samples were measured at weeks
0, 1, 2, 4 and at regular intervals after. Storage
conditions of -80 °C, -20 °C, 4 °C and 40 °C were used in
the study.
Materials A monoclonal antibody, MAb1 was formulated at a
concentration of 1 mg/mL in all experiments.
Solvent conditions were varied and the prepared
buffers included glycine, Na acetate, Na citrate and Tris
at a range of pHs from 2.2 to 10.6. Excipients included
NaCl, trehalose, arginine/glutamate (Arg/Glu),
polysorbate 80 (Tween 80) and sorbitol. All chemicals
and reagents were sourced from SigmaAldrich, UK.
Stocks of buffers were prepared at 100 mM.
Methods Following the predictive phase, twelve formulations
were chosen for long term stability testing. At each time
point in the test, one aliquot of sample was used from
each of the different storage conditions for all
measurements on all instruments.
Copy for pic

Application Note
5
The UNit: The 144 samples that were included in the predictive
screen were measured on the UNit in three
experimental runs. In each run, 9 µL of each sample was
loaded into a UNi and placed in the UNit instrument. A
stepped thermal ramp was carried out between 15 and
95 °C with the protein intrinsic fluorescence and static
light scattering signals being recorded every 1 °C, with a
hold time of 60 s at each temperature to allow
equilibration of the samples before measurement
started. An exposure time of 1000 ms was used and the
two lasers in the system were attenuated to their
maximum value (266 nm laser – filter 4; 473 nm laser –
filter 3).
During the stability testing phase the 12 chosen
formulations from the four different storage conditions
were measured in triplicate using the same
experimental settings as during the predictive
screening. Each of the formulation buffers was also
measured in singlicate to record any degradation of the
buffers over time, at each of the storage conditions at
each time point. All data was analyzed initially using the
UNit Analysis software version 2.0.4 and melting
temperatures, aggregation onset temperatures, the
initial light scattering signal and the initial fluorescence
ratio (350:330) was extracted from the data where
appropriate.
Dynamic Light Scattering: 40 µL of each sample at each time point was measured
in singlicate using the Malvern Zetasizer Nano S. Data
was analyzed in the provided software to characterize
the degree of aggregation or fragmentation in solution.
Size Exclusion Chromatography Size exclusion chromatograph was carried out using an
Agilent 1100 Series system that was fitted with an auto-
sampler, a column heater and a variable wavelength
detector (flow cell path length = 10mm). The column
used with this system was a TOSOH G3000 SWXL (with a
guard column), which had a 7.8 mm ID and a length of
30 cm. The mobile phase consisted of phosphate
buffered saline at pH 7.4. A flow rate of 0.8 mL/min was
used, with an injection volume of 20 L, a temperature
of 25 °C. The detection wavelength was set to 280 nm,
and the samples were at a concentration of 1 mg/mL.
Agilent total recovery HPLC glass vials were used and
the system had a run time of 50 minutes.
Prior to loading onto the column 70 l of the samples
were centrifuged at 21,100 x g for 20 min to remove
larger aggregates and 30 mL of the supernatant was
placed in the sample vials.
Results and Discussion Predictive Stage Results
In the predictive screen 144 different formulations were
measured on the UNit as described earlier, and
analyzed using the UNit analysis software. The 266 nm
SLS data was used to represent the aggregation
stabilities rather than 473 nm due to its increased
sensitivity at these concentrations. The raw spectra
data were processed to obtain a value of the ratio
between the fluorescence intensity at 350 nm and 330
nm which gives an indication of the degree of solvent
exposure of the tryptophan residues in the protein and
correlates with the unfolding. The data can be
processed in a range of different ways and the ratio was
chosen as it appeared to give the clearest
representation of the conformational data in this case.
The data from all 3 runs was collated and is presented
in Figure 2, where the integrated area of the 266 nm
scattered light versus temperature can be seen in (a)
and fluorescence intensity ratio (350/330 nm) in (b).
The data presented in Figure 2(a) suggests that all
formulations begin in a monomeric state as there is no
significant difference between the initial SLS values for
any of the formulations (integrated SLS intensity 15-20
°C). There is a large variation in the derived aggregation
onset temperatures (Tagg) and differences can also be
seen in the degree of aggregation (how much the curve
increases). Figure 2(b) shows that there are a range of
different initial values in the fluorescence ratio data
(averaged between 15 – 20 °C) suggesting that the
proteins are initially present in a range of
conformational states and also a variety in the Tm values
with some samples showing multiple Tm’s.

Application Note
6
After initially running this large, yet rapid screen each
formulation was analyzed to select the final 12
formulations to take on for further study during the
long term storage. At this stage, although detailed
analysis was not required, the differences in colloidal
and conformational stabilities can be seen visually from
the curves presented in Figure 2 according to the
characteristics identified in Figure 1.
Figure 2: 144 samples of MAb1 measured on the Unit in a thermal ramp experiment, SLS data seen in (a) and fluorescence intensity ratio (350/330 nm) in (b).
Following analysis of the initial 144 formulations, the
features highlighted in Figure 1 were compared and
used to select 12 further formulations from the 144.
These 12 were selected to cover a range of different
stabilities, including demonstrating the effect of
particular excipients. Initial tests were also run using
orthogonal techniques highlighting that a formulation
containing 1 M sorbitol, whilst compatible with the UNit
and showing significant stabilizing effects in the
conformational data, was incompatible with other
techniques due to limitations with the sample viscosity.
As such this excipient was omitted from the final screen
and replaced with formulations with no excipient (other
than NaCl).
The 12 formulations were also chosen to allow
comparisons to be made between differences in pH,
ionic strength, buffering agent and additive with
different storage conditions and forced degradation
methods. These are listed and color coded according to
their comparative differences along with their
‘formulation number’ in Table 1
Initial, time 0 measurements Following the final selection of 12 formulations, samples
were prepared in bulk and aliquots made for each of
the time points, under each of the storage conditions
required. These were then grouped (set of formulations
1 – 12 plus the 12 buffers) and transferred to their
respective storage temperatures. One set was retained
and measured on the UNit and SEC and these were used
as the week 0 time point measurements.
Table 1: 12 final formulations selected for further study
Each of these 12 samples was measured in triplicate on
the UNit with the 12 buffers measured in singlicate
making up one run containing a total of 48 samples.
Time constraints of the technique allowed the samples
to be measured only in singlicate on the SEC.
An example of the triplicate measurements of each of
the 12 formulations measured on the UNit can be seen
in Figure 3 with the SLS and fluorescence ratio data
overlaid to show any cooperative behavior or otherwise
between the aggregation and conformational changes.
The slight difference in one of the triplicate
measurements for formulation 11 may be attributed to
the pH being very close to the pI of MAb1.
4.0
3.0
2.0
1.0
0.0
26
6 n
m S
LS
/ 1
06 c
ou
nts
.nm
80604020
Temperature / °C
1.0
0.9
0.8
0.7
0.6
0.5
0.4
Flu
ore
sce
nce
in
ten
sity r
atio
80604020
Temperature / °C
(a)
(b)

Application Note
7
Figure 3: Final 12 formulations of MAb1 measured on the UNit in a thermal ramp experiment, SLS and fluorescence data overlaid, plots for each formulation are numbered according to the earlier definition.
Parameters which describe the differences between the
formulations, were extracted from the curves in Figure
3 and plotted in bar chart form. Figure 4 shows the
variation in the initial 266 nm SLS and initial
fluorescence ratio values, averaged between 15 and 20
°C. Figure 5 shows the corresponding Tagg and Tm values.
All values presented in these figures are averages of the
triplicate measurements and the error bars are the
standard deviations.
There is no significant variation observed between the
initial values of the static light scattering across the 12
measured formulations. The SLS reflects the average
molecular weight of the components of the sample and
therefore the signal is proportional to the state of
aggregation. Due to the insignificant variation in the
data it is highly probable that the samples were
monomeric at room temperature at week 0.
Figure 4: Initial 266 nm Scatter or SLS (top) and initial fluorescence ratio (bottom), averaged between 15 and 20 °C. The highlighted formulations reflect comparative differences in ionic strength (orange), buffering species (green) and additive (lilac).
Similarly, in the initial fluorescence ratio data, which
reflects differences in the tertiary structure, very little
difference can be seen between the samples. This is
with the exception of formulations 1 and 2, which
reflects samples that are at low pH and appear to have
a degree of acid induced unfolding. The difference in
the ionic strength between the two samples most
probably accounts for this apparent difference in
tertiary structure.
Whilst the differences seen here are relatively small, it
is expected that larger differences will be seen between
the 12 different formulations as the samples degrade in
quality and aggregate over the course of time under the
different storage conditions.
0
20
40
60
80
100
120
140
160
180
1 2 3 4 5 6 7 8 9 10 11 12
Sca
tte
r 2
66
nm
(co
un
ts.n
m)
Th
ou
san
ds
Formulation
Initial 266 nm Scatter (15-20 °C)
0
0.1
0.2
0.3
0.4
0.5
0.6
0.7
0.8
0.9
1
1 2 3 4 5 6 7 8 9 10 11 12
Rat
io 3
50/3
30 n
m
Formulation
Initial Fluorescence Ratio (15 - 20 °C)

Application Note
8
The data presented in Figure 5 demonstrates that both
Tagg (top) and Tm (bottom) are formulation dependent.
This is likely to be due to a combination of the sample
pH affecting the structure of the protein, and in some
cases the excipients and buffer conditions providing
some protection against thermally induced aggregation.
It is also apparent in the unfolding data (fluorescence,
bottom) that lower pH separates domain unfolding [6].
Figure 5: 266 nm aggregation onset (Tagg) values derived from the 266 nm SLS data (top) and Tm values derived from fluorescence ratio data (bottom). The highlighted formulations reflect comparative differences in ionic strength (orange), buffering species (green) and additive (lilac).
Measurement after storage After the initial measurement on week 0 the aliquots
were transferred to their relevant storage temperatures
(-80, -20, 4 and 40 °C). Time constraints imposed by the
throughput of the HPLC meant that for the samples
characterized by SEC it was necessary that they were
run in one long experiment. This was carried out over a
period of two days, with the first day consisting of the
samples stored at 4 and 40 °C and the samples stored at
-80 and -20 °C on the second day.
On the UNit single measurements were made of the
buffers and triplicate measurements of the different
formulations containing MAb1 with 2 separate runs for
4 and 40 °C on the first day and 2 separate runs with -20
and -80 °C on the second day. One difference in the
two measurements was that with the SEC, whilst
automated in its measurements samples had to be
removed from their storage temperatures (two
temperatures per experiment) and allowed to sit at
room temperature for the duration of the experiment,
whereas with the UNit, samples were removed from
their storage temperature one condition at a time, were
loaded into the UNi and the experiment began within 5
– 10 minutes of removal.
As in Figure 4 and Figure 5, the UNit data was
parameterized such that the initial integrated SLS
intensity, the initial integrated fluorescence intensity
ratio, Tagg and Tm values were extracted for each time
point and each storage temperature. These numbers
were then plotted versus time point and the 12
formulations were compared. After only four weeks the
most pronounced trends could be seen between
formulations 1 and 2, where the discrimination in the
formulations was ionic strength; 3 and 4, where buffer
species varied; and 6, 7, 8 and 9, which were identical
apart from addition of four different excipients. At this
stage particular interest is focused on the
differentiation of stability with samples that are
formulated in different buffer species.
The effect of buffer species Formulations 3 and 4 are almost identical, in that each
are at pH 3.6, contain 50 mM NaCl and 100 mM
trehalose, with the only difference being the buffering
species (both buffers at 50 mM). In formulation 3 a
citrate buffer is used and in formulation 4 an acetate
buffer is used. There is evidence presented in the
literature that suggests that citrate, a multivalent
carboxylate buffer, causes antibody self-association and
can trigger filament formation in antibodies [6] [7].
Predictive and Week 0
15
25
35
45
55
65
75
85
95
1 2 3 4 5 6 7 8 9 10 11 12
Te
mp
era
ture
(°C
)
Sample Number
Mean Tagg (°C)
15
25
35
45
55
65
75
85
95
1 2 3 4 5 6 7 8 9 10 11 12
Tem
pe
ratu
re (
°C)
Formulation
Transition Temperatures Ratio 350/330 nm (°C)
Mean Tm3
Mean Tm2
Mean Tm1

Application Note
9
Figure 6: Initial SLS (a), initial fluorescence (b) and Tagg (c) for formulation 3. 40 °C storage which resulted in the most dramatic change is highlighted in red, other temperatures highlighted in blue.
Acetate however, is a monocarboxylate and as such
does not trigger association or does not do so to the
same extent [7]. Whilst this may cause an effect when
the formulations are in solution at 4 and 40 °C, the
effects may be different when stored at -20 and -80 °C
as the principle cause of degradation when frozen is
likely to be the mobility of the protein through the
partially frozen lattice and local concentration gradients
of both protein and excipients.
Figure 6 shows the calculated initial SLS intensity, the
initial fluorescence and the aggregation onset
temperatures for formulation 3, with the citrate buffer.
There is a pronounced change in the protein that has
been stored at 40 °C during the four weeks of storage.
Storage at this temperature can be treated as an
accelerated degradation condition. The changes include
an overall increasing trend in the initial SLS intensity
indicating that the proportion of aggregated protein in
solution is increasing over time (the drop at week 2 may
be attributed to a non-uniform dispersion of aggregates
in the solution).
A similar trend can be observed in the initial
fluorescence intensity ratio which indicates increased
occupancy of the denatured state. A drop in Tagg,
indicating a reduction in the thermal aggregation
stability over time is also observed. Other storage
temperatures show slight changes (highlighted in blue)
which are less significant after four weeks and the 4 °C
samples are expected to follow a similar trend as the
elevated temperature data but at a slower rate.
Figure 7 shows comparative data to Figure 6, but for
formulation 4, which is the acetate buffer. In this case
the area highlighted in red in formulation 3, where
there was significant evidence of degradation, is left in
place for this formulation (4, acetate). However the
data for formulation 4 (acetate) does not show the
same degradation as with formulation 3 (citrate). Here
all four storage temperatures are highlighted in blue,
which show overall little change in the initial SLS
intensity, slight increases in initial fluorescence (the
most pronounced for 40 °C albeit small compared to
formulation 3) and no dramatic decrease in Tagg for any
of the four storage conditions.
What can be said is that there is a notable increase in
the uncertainty on the determination of the aggregation
onset temperature for all of the measured samples,
which can be attributable to either a smaller magnitude
aggregation event (see Figure 3, formulation 4 for
example), or a less uniform distribution in colloidal
stability of the samples.
Application Note
10
Figure 7: Initial SLS (a), initial fluorescence (b) and Tagg (c) for formulation 4. 40 °C Here no data points are seen in the red highlighted area as were seen for formulation 3.
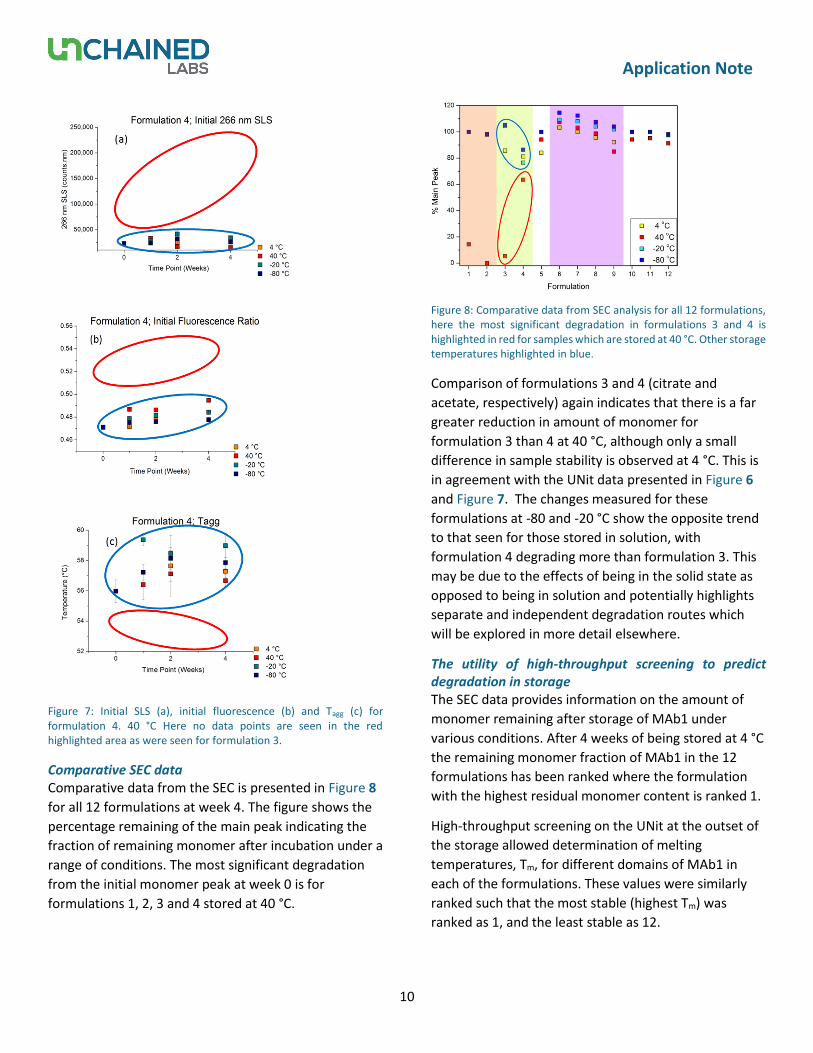
Comparative SEC data Comparative data from the SEC is presented in Figure 8
for all 12 formulations at week 4. The figure shows the
percentage remaining of the main peak indicating the
fraction of remaining monomer after incubation under a
range of conditions. The most significant degradation
from the initial monomer peak at week 0 is for
formulations 1, 2, 3 and 4 stored at 40 °C.
Figure 8: Comparative data from SEC analysis for all 12 formulations, here the most significant degradation in formulations 3 and 4 is highlighted in red for samples which are stored at 40 °C. Other storage temperatures highlighted in blue.
Comparison of formulations 3 and 4 (citrate and
acetate, respectively) again indicates that there is a far
greater reduction in amount of monomer for
formulation 3 than 4 at 40 °C, although only a small
difference in sample stability is observed at 4 °C. This is
in agreement with the UNit data presented in Figure 6
and Figure 7. The changes measured for these
formulations at -80 and -20 °C show the opposite trend
to that seen for those stored in solution, with
formulation 4 degrading more than formulation 3. This
may be due to the effects of being in the solid state as
opposed to being in solution and potentially highlights
separate and independent degradation routes which
will be explored in more detail elsewhere.
The utility of high-throughput screening to predict degradation in storage The SEC data provides information on the amount of
monomer remaining after storage of MAb1 under
various conditions. After 4 weeks of being stored at 4 °C
the remaining monomer fraction of MAb1 in the 12
formulations has been ranked where the formulation
with the highest residual monomer content is ranked 1.
High-throughput screening on the UNit at the outset of
the storage allowed determination of melting
temperatures, Tm, for different domains of MAb1 in
each of the formulations. These values were similarly
ranked such that the most stable (highest Tm) was
ranked as 1, and the least stable as 12.

Application Note
11
When the SEC and the UNit measurements are plotted
against each other, as in Figure 9, a correlation can be
observed such that the sample with the highest melting
temperature at the start of the process has the highest
remaining percentage of monomer after four weeks of
storage in solution.
Analysis of this data suggests that the dominant
pathway for degradation of the protein under these
conditions is caused by unfolding and aggregation of the
fAb region of the antibody.
Figure 9: Correlation between Initial UNit Tm (fAb) data and SEC monomer remaining after 4 weeks after storage at 40 °C.
Summary and Conclusions Prediction of a therapeutic protein’s propensity to
aggregate as early as possible in formulation is
advantageous and optical probes of conformation and
aggregation are particularly well suited to this
application. They are rapid, use little material and can
simultaneously measure multiple stability indicating
parameters. By measuring more stability indicating
parameters it has been shown in the literature that the
predictive power can be increased as different
degradation routes correlate with different predictive
parameters [2]. Without a priori knowledge of the
degradation route of a protein the more complete the
characterization the lower the risk of choosing the
wrong formulation.
The UNit has been demonstrated here to be a useful
tool in formulation screening. With its excellent
correlation between the predictive Tm and resultant
data from SEC, an industry standard, after 4 weeks
storage at 4 °C shown in Figure 9. It was high-
throughput allowing up to 144 samples to be screened
in one day on a single instrument. It required very small
volumes – only 9 µL per well. There were no
microfluidics or auto sampler involved resulting in no
cleaning steps and no clogging. It was simple to set up,
requiring far less man power. Finally UNit is incredibly
data rich, giving many metrics and a more complete
picture of stability (Tm, Tagg, Initial SLS, Initial
conformation used here are only a few) making it an
ideal tool for carrying out high-throughput screening
and measurement of proteins in a wide range of
different and diverse formulations.
References [1] M. Capelle, R. Gurny and T. Arvinte, “High
throughput screening of protein formulation
stability: practical considerations,” Eur J Pharm
Biopharm, pp. 131-48, Feb 2007.
[2] D. Goldberg, S. Bishop, A. Shah and H. Sathish,
“Formulation development of therapeutic
monoclonal antibodies using high-throughput
fluorescence and staticlight scattering
techniques: Role of conformational and colloidal
stability.,” J Pharm Sci, pp. 1306-1315, Apr 2011.
[3] FDA,
“http://www.fda.gov/downloads/drugs/guidanc
ecomplianceregulatoryinformation/guidances/uc
m079250.pdf,” [Online].
[4] T. J. Kamerzell, R. Esfandiary, S. B. Joshi, C. R.
Middaugh and D. B. Volkin, “Protein–excipient
interactions: Mechanisms and biophysical
characterization applied to protein formulation
development,” Adv Drug Deliv Rev, pp. 1118-
1159, Oct 2011.

Application Note
12
[5] S. Ohtake, Y. Kita and T. Arakawa, “Interactions
of formulation excipients with proteins in
solution and in the dried state,” Adv Drug Del
Rev, pp. 1053-1073, Oct 2011.
[6] A. W. Vermeer and W. Norde, “The thermal
stability of immunoglobulin: unfolding and
aggregation of a multi-domain protein,”
Biophysical Journal, vol. 78, no. 1, pp. 394-404,
2000.
[7] O. Esue, A. X. Xie, T. J. Kamerzell and T. W.
Patapoff, “Thermodynamic and structural
characterization of an antibody gel,” 2013.
[8] O. Esue, o. Kanai, J. Liu, T. W. Patapoff and S. J.
Shire, “Carboxylate-Dependent Gelation of a
Monoclonal Antibody,” Pharmaceutical
Research, vol. 26, no. 11, pp. 2478-2485, 2009.
[9] M. A. Singer and S. Lindquist, “Multiple Effects of
Trehalose on Protein Folding In Vitro and In
Vivo,” Molecular Cell, vol. 1, pp. 639-648, 1998.
Toll-free: (800) 815-6384 Tel: (925) 587-9800 [email protected] unchainedlabs.com