Embed Size (px)
Citation preview
Predicting Peirce’s Population
Mrs. Megan Hoopes-Myers – EDTECH 542 Page 1
Predicting Peirce’s Population
TABLE OF CONTENTS
Begin with the End in Mind
Craft the Driving Questions
Plan the Assessment
Map the Project
Manage the Process
Appendix
NOTE: Information obtained for this Project-Based Learning was adapted and modified from http://www.transformation2013.org/node/17.

Predicting Peirce’s Population
Mrs. Megan Hoopes-Myers – EDTECH 542 Page 2
Begin with the End in Mind
Summarize the theme for this project. Why do this project?
Within groups, students will create linear equations, find trend lines, and make predictions based on the student and faculty/staff population of Peirce Middle School in West Chester, Pennsylvania over the last 20-25 years. Each group will be in charge of creating a pamphlet for the School Board President. This pamphlet will
include Peirce’s demographics, population statistics and trends, a linear function logo, and inviting information as to why students should attend Peirce Middle School.
Identify the content standards that students will learn in this project (two to three per subject).
Algebra 1 Pennsylvania State Standards 2.5 Mathematical Problem Solving and Communication
2.5.A1.A Develop a plan to analyze a problem identify the information needed to solve the problem, carry out the plan, check whether an answer makes sense, and explain how the problem was solve in grade appropriate
contexts. 2.5.A1.B Use symbols, mathematical terminology, mathematical notation,
mathematical rules, graphing, and other types of mathematical representations to communicate observations, predictions, concepts, procedures, generalizations, ideas, and results.
2.6 Statistics and Data Analysis
2.6.A1.E Make predictions based on lines of best fit or draw conclusions on the value of a variable in a population based on the results of a sample.
2.8 Algebra and Functions
2.8.A1.E Use combinations of symbols and numbers to create expressions, equations, and inequalities in two or more variables, systems of equations,
and inequalities, and functional relationships that model problem situations. 2.8.A1.F Interpret the results of solving equations, inequalities, systems of
equations, and systems of inequalities in the context of the situation that motivated the model.
2.11 Concepts of Calculus
2.11.A1.B Describe rates of change a modeled by linear equations. Grade 8 Mathematics Pennsylvania State Standards 2.2 Computation and Estimation
2.2.8.C Use the order of operations to evaluate numerical expressions. 2.4 Mathematical Reasoning and Connections
2.4.8.A Draw inductive and deductive conclusions within mathematical contexts.
Predicting Peirce’s Population
Mrs. Megan Hoopes-Myers – EDTECH 542 Page 3
2.6 Statistics and Data Analysis 2.6.8.E Determine the effect of extreme values on numerical summaries and
calculate estimates based on survey results or graphs.
2.8 Algebra and Functions
2.8.8.B Evaluate and simplify algebraic expressions and solve and graph linear equations and inequalities.
2.8.8.C Find the missing elements and recognize, describe, and extend patterns to include linear, exponential, and simple quadratic equations.
2.11 Concepts of Calculus
2.11.8.B Describe the concept of unit rate, ratio, and slope in the context of rate of change.
Identify key skills students will learn in this project. List only those skills you plan to assess (two to four per person).
Identify and graph the linear parent function. Describe and predict the effect of changing the slope (“m”) and the y-
intercept (“b”) on the parent graph. Establish how to identify linear functions by making connections between the
various representations.
Define slope and intercepts of linear equations and functions. Calculate slope (rate of change) and intercepts from various representations. Explain how direct variations are related to linear functions.
Identify the habits of mind that students will practice in this project (one to two per project).
Students will recognize connections between mathematics, history, and marketing through the completion of “Predicting Peirce’s Population” project. They will use technology to gather and analyze population growth/decay for Peirce Middle School in West Chester, Pennsylvania over the past 20-25 years. The students will conclude their research and computations with the creation of a flyer providing graphics, research, linear concepts, and a linear function logo for the School Board President to present at the next School Board meeting.
Return to the Table of Contents
Predicting Peirce’s Population
Mrs. Megan Hoopes-Myers – EDTECH 542 Page 4
Craft the Driving Question
State the essential question or problem statement for the project. The statement should encompass all project content and outcomes, and provide a central focus for student inquiry. Essential Question: How can linear functions help predict population trends?
Sub-Questions: History Related:
1. How many students attended Peirce 25 years ago? 20 years ago? 15 years ago? 10 years ago? 5 years ago? How many students currently attend
Peirce? What population trend do you notice? 2. What are the demographics of Peirce Middle School?
Math Related:
1. Why is it important to write equations of lines? How does that concept appear in real life?
2. What is the importance of the rate of change? How does rate of change appear in real life?
3. How does the slope and y-intercept help create equations of lines? How do they help graph the equation?
4. How does direct variation relate to linear functions? How does direct variation appear in real life?
5. What inductive and deductive conclusions can be made from linear functions?
What conclusions can be made from their graphs? Technology Related:
1. How can a graphing calculator be used to graph linear functions? 2. How can a graphing calculator help predict trend lines?
Return to the Table of Contents
Predicting Peirce’s Population
Mrs. Megan Hoopes-Myers – EDTECH 542 Page 5
Plan the Assessment
Step 1: Define the products for the project. What will you assess?
Early in the Project:
Students will determine the difference between slope-intercept form ( bmxy ) and
two-point form
12
1
12
1
xx
xx
yy
yy. Students will explore graphs and determine the
equation of a line based off of plotting two points. Graphing calculators will be used to
establish the line of best fit for different forms of data.
During the Project:
Students will be engaged in higher order thinking, recording their thoughts in a reflective
journal. Students will create linear equations, find trend lines, and make predictions
resulting in technology incorporation.
End of the Project:
Students will recognize connections between mathematics, history, and marketing.
Students will conclude their research and computations with the creation of a pamphlet
providing graphics, research, linear concepts, and a linear function logo.
Step 2: State the criteria for exemplary performance for each product:
Product: Engage, Explore, & Explain Real World Problems Criteria: (Formative Assessment)
To be completed early in the project. “Engage, Explore, & Explain Real World Problems” worksheet (located below)
Product: Reflecting Journal Entries Criteria: (Formative Assessment)
To be completed during the project. “Reflective Journal Entry Topics” (located below)
Product: Predicting Peirce’s Population Pamphlet Criteria: (Summative Assessment)
To be completed at the end of the project. “Predicting Peirce’s Population Pamphlet” (located below)
“Predicting Peirce’s Population Pamphlet Rubric” (located below)
Predicting Peirce’s Population
Mrs. Megan Hoopes-Myers – EDTECH 542 Page 6
Predicting Peirce’s Population “Engage, Explore, & Explain Real World Problems”
ENGAGE:
1. Investigate the two-point form formula:
http://www.easycalculation.com/analytical/learn-two-point.php
2. Predict the equation of a line:
http://illuminations.nctm.org/ActivityDetail.aspx?ID=146
a. Plot two points & develop the equation of the line
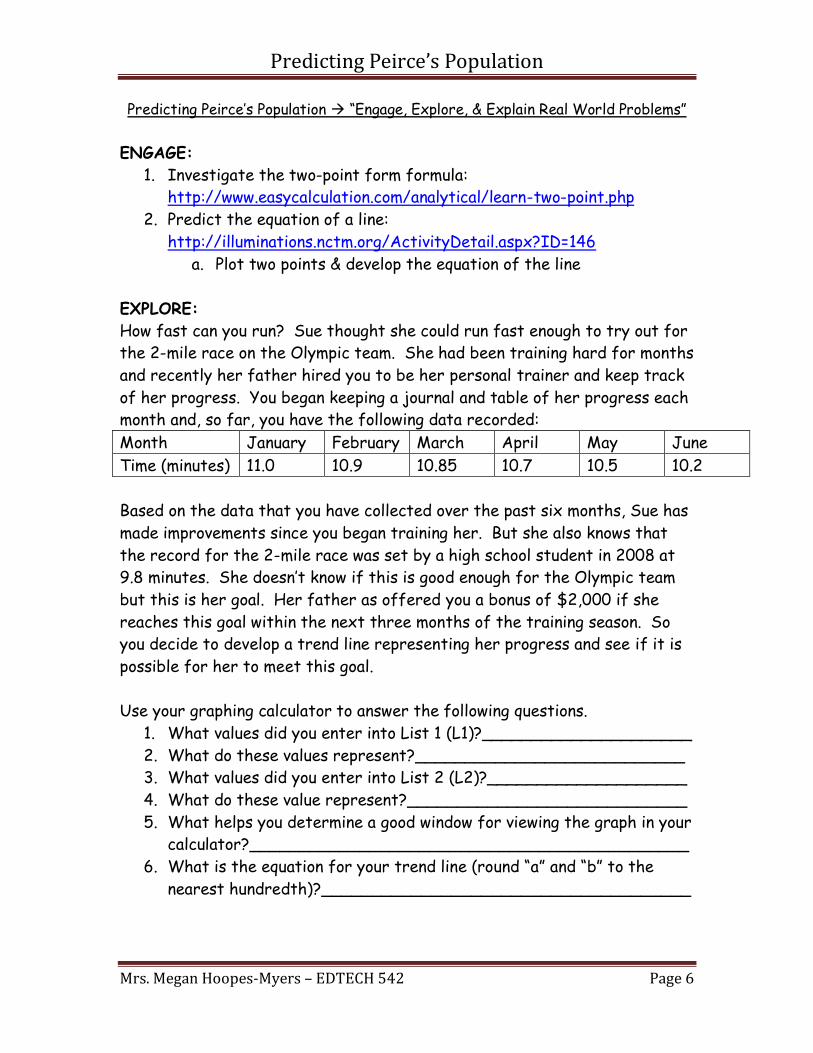
EXPLORE:
How fast can you run? Sue thought she could run fast enough to try out for
the 2-mile race on the Olympic team. She had been training hard for months
and recently her father hired you to be her personal trainer and keep track
of her progress. You began keeping a journal and table of her progress each
month and, so far, you have the following data recorded:
Month January February March April May June
Time (minutes) 11.0 10.9 10.85 10.7 10.5 10.2
Based on the data that you have collected over the past six months, Sue has
made improvements since you began training her. But she also knows that
the record for the 2-mile race was set by a high school student in 2008 at
9.8 minutes. She doesn’t know if this is good enough for the Olympic team
but this is her goal. Her father as offered you a bonus of $2,000 if she
reaches this goal within the next three months of the training season. So
you decide to develop a trend line representing her progress and see if it is
possible for her to meet this goal.
Use your graphing calculator to answer the following questions.
1. What values did you enter into List 1 (L1)?_____________________
2. What do these values represent?___________________________
3. What values did you enter into List 2 (L2)?____________________
4. What do these value represent?____________________________
5. What helps you determine a good window for viewing the graph in your
calculator?____________________________________________
6. What is the equation for your trend line (round “a” and “b” to the
nearest hundredth)?_____________________________________
Predicting Peirce’s Population
Mrs. Megan Hoopes-Myers – EDTECH 542 Page 7
7. Draw a picture of your graph below. Be sure to label the axes
correctly.
8. Based on the data, what will be Sue’s time in July, August, and
September?
____________________________________________________
9. Will you receive your $2,000 bonus? Provide justification for your
response.
____________________________________________________
____________________________________________________
____________________________________________________
EXPLAIN
1. Use the following data, write an equation and then use your calculator
to develop the trend line.
(5, 15), (7, 16), (10, 21), (14, 25), (17, 28)
Predicting Peirce’s Population
Mrs. Megan Hoopes-Myers – EDTECH 542 Page 8
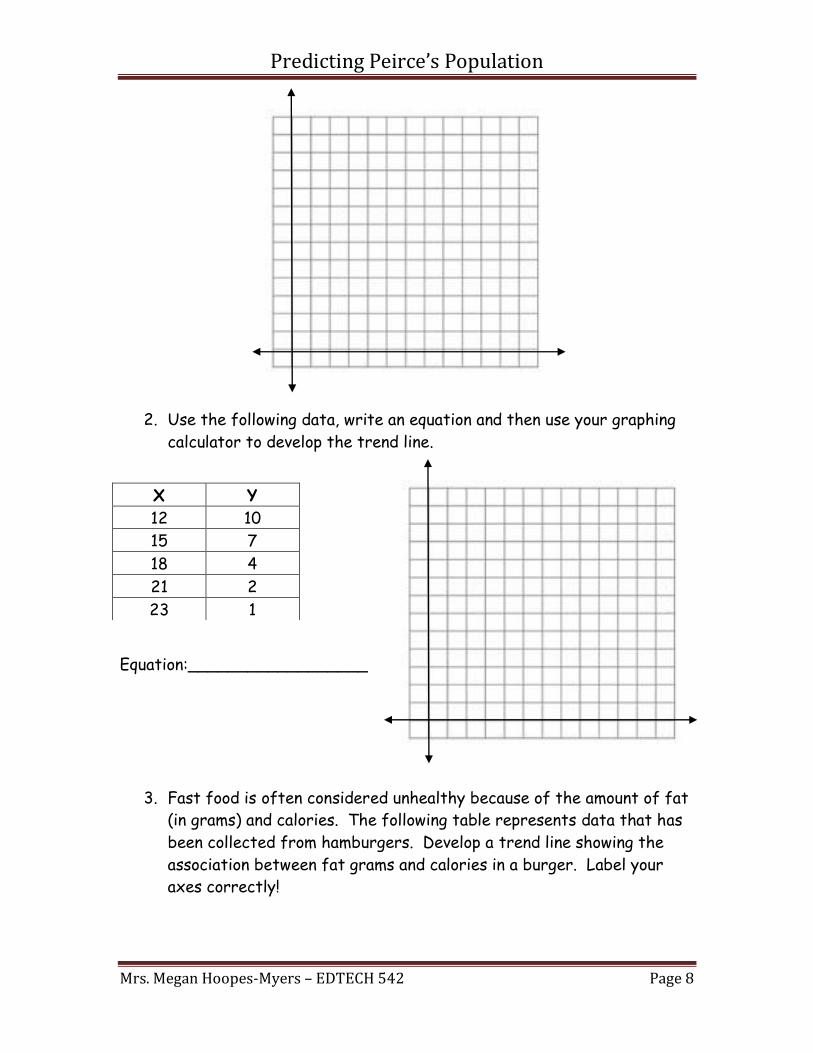
2. Use the following data, write an equation and then use your graphing
calculator to develop the trend line.
Equation:__________________
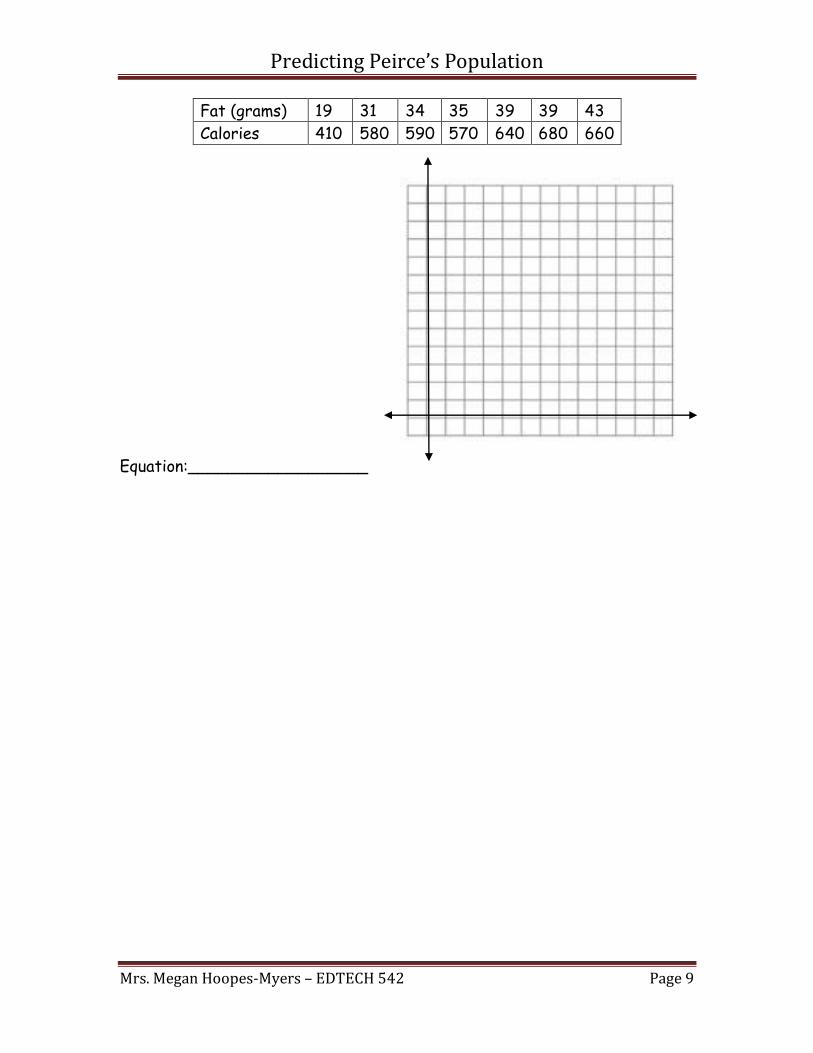
3. Fast food is often considered unhealthy because of the amount of fat
(in grams) and calories. The following table represents data that has
been collected from hamburgers. Develop a trend line showing the
association between fat grams and calories in a burger. Label your
axes correctly!
X Y
12 10
15 7
18 4
21 2
23 1
Predicting Peirce’s Population
Mrs. Megan Hoopes-Myers – EDTECH 542 Page 9
Fat (grams) 19 31 34 35 39 39 43
Calories 410 580 590 570 640 680 660
Equation:__________________
Predicting Peirce’s Population
Mrs. Megan Hoopes-Myers – EDTECH 542 Page 10
Predicting Peirce’s Population “Reflecting Journal Entries”
Reflecting Journal Entry Topics:
To be answered during the ENGAGE portion. 1. Discuss the difference between slope-intercept and two-point form.
2. Record notes and data for plotting two points and predicting the
equation of the line.
a. Why is your guess so different from the computer guess?
What can you do to make your guess more accurate?
b. List the “equation of a line” results discussed in your group.
To be answered during the EXPLORE portion. 1. What is the mathematical term for XMIN and XMAX?
2. What is the mathematical term from YMIN and YMAX?
3. What help you determine how to set your window for good viewing?
4. What is the difference in a “trend line” and a linear equation?
5. Is it possible to continue decreasing Sue’s speed at this same rate?
Why or why not? What other factors could affect her speed?
To be answered during the EXPLAIN portion. 1. Write the graphing calculator steps required to calculate a line of
best fit.
2. List the pros and cons of a trend line.
3. Why is your equation found by hand different from other groups?
To be answered during the PAMPHLET portion. 1. What similarities and differences did you notice from other group’s
pamphlets?
2. Discuss other ways of finding populations and other information that
would be useful to have on the pamphlet if students were interested
in attending Peirce Middle School.
3. Discuss the usefulness of linear functions in real life and describe
other areas where linear functions are seen in the real world.

Predicting Peirce’s Population
Mrs. Megan Hoopes-Myers – EDTECH 542 Page 11
Predicting Peirce’s Population Pamphlet
You and your group need to create a pamphlet that includes Peirce’s
demographics, population statistics and trends, a linear function logo, and
inviting information as to why students should attend Peirce Middle School.
You will use technology to gather and analyze population growth/decay over
the past 20-25 years. The School Board President will present your
pamphlet at the next School Board meeting.
Part 1:
1. Research the data representing the population growth/decay of
Peirce Middle School from 1986-1990 at the following site:
http://documents.wcasd.k12.pa.us/dsweb/Get/Document-
1682/DAE459.pdf
[Note: this site will not give you all of the information that you need.
You will need to perform additional research]
Make a table showing the population from 1986-1990.
2. Use the data in the above table to calculate the equation for the
trend line and graph that data below (label your axes correctly).
Equation: _________________________
Predicting Peirce’s Population
Mrs. Megan Hoopes-Myers – EDTECH 542 Page 12
3. Use your line to predict the population for the years 1996 and 2000.
1996:____________________ 2000:____________________
4. In 2008, the population of Peirce was estimated to be 907 students
and 70 teachers. Does your trend line indicate a higher or lower
population and by how
much?_______________________________________________
____________________________________________________
____________________________________________________
____________________________________________________
____________________________________________________
5. List a minimum of three additional ways we can apply linear functions
in real-life.____________________________________________
____________________________________________________
____________________________________________________
____________________________________________________
____________________________________________________
Part 2:
Part two of your project is to develop your logo using only linear functions.
Use the bottom of this page to brainstorm your design. Please note that the
logo cannot take up more than two inches at the top of your pamphlet, but it
can be scaled to fit in the appropriate area of the page. After
brainstorming designs, draw a 20 x 20 grid on graph paper to chart your
final design. Upon completion of your drawing, calculate the equations for
each of your lines and document them neatly on your graph.

Predicting Peirce’s Population
Mrs. Megan Hoopes-Myers – EDTECH 542 Page 13
Part 3:
Complete the pamphlet. Your pamphlet must include your population analysis
(table, graph, predictions, and justifications), your logo, Peirce’s
demographics, and inviting information as to why students should attend
Peirce Middle School.
Predicting Peirce’s Population
Mrs. Megan Hoopes-Myers – EDTECH 542 Page 14
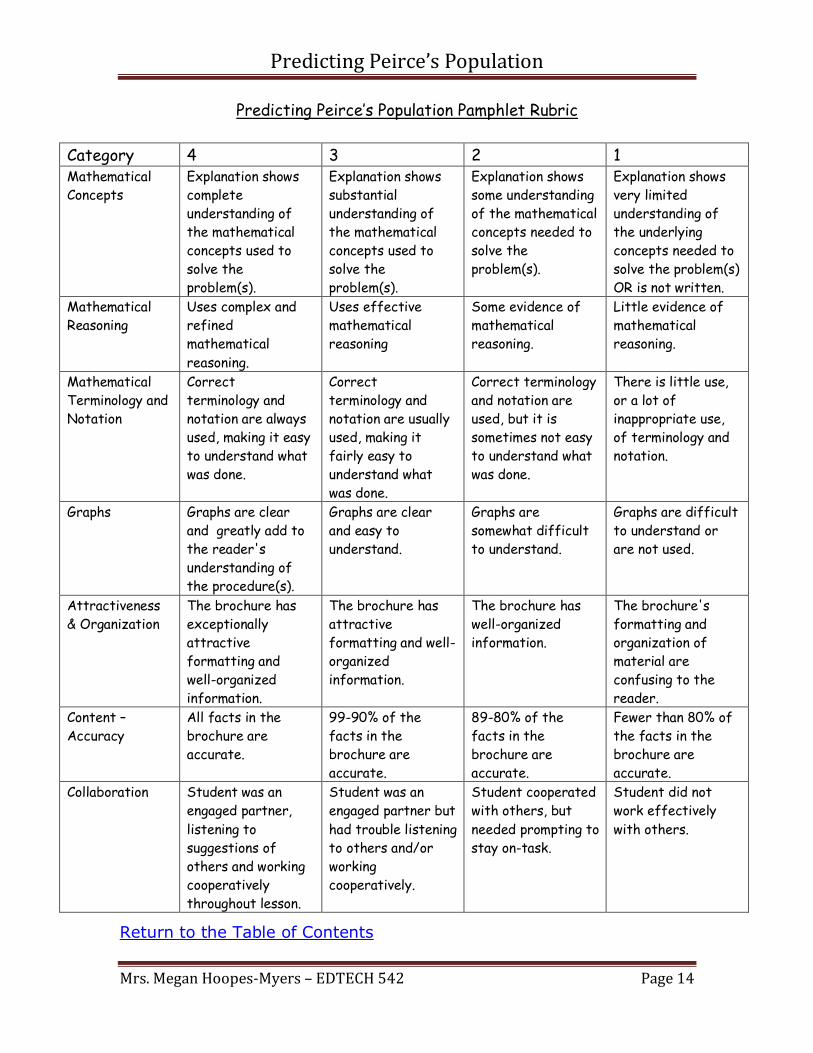
Predicting Peirce’s Population Pamphlet Rubric
Category 4 3 2 1 Mathematical
Concepts
Explanation shows
complete
understanding of
the mathematical
concepts used to
solve the
problem(s).
Explanation shows
substantial
understanding of
the mathematical
concepts used to
solve the
problem(s).
Explanation shows
some understanding
of the mathematical
concepts needed to
solve the
problem(s).
Explanation shows
very limited
understanding of
the underlying
concepts needed to
solve the problem(s)
OR is not written.
Mathematical
Reasoning
Uses complex and
refined
mathematical
reasoning.
Uses effective
mathematical
reasoning
Some evidence of
mathematical
reasoning.
Little evidence of
mathematical
reasoning.
Mathematical
Terminology and
Notation
Correct
terminology and
notation are always
used, making it easy
to understand what
was done.
Correct
terminology and
notation are usually
used, making it
fairly easy to
understand what
was done.
Correct terminology
and notation are
used, but it is
sometimes not easy
to understand what
was done.
There is little use,
or a lot of
inappropriate use,
of terminology and
notation.
Graphs Graphs are clear
and greatly add to
the reader's
understanding of
the procedure(s).
Graphs are clear
and easy to
understand.
Graphs are
somewhat difficult
to understand.
Graphs are difficult
to understand or
are not used.
Attractiveness
& Organization
The brochure has
exceptionally
attractive
formatting and
well-organized
information.
The brochure has
attractive
formatting and well-
organized
information.
The brochure has
well-organized
information.
The brochure's
formatting and
organization of
material are
confusing to the
reader.
Content –
Accuracy
All facts in the
brochure are
accurate.
99-90% of the
facts in the
brochure are
accurate.
89-80% of the
facts in the
brochure are
accurate.
Fewer than 80% of
the facts in the
brochure are
accurate.
Collaboration Student was an
engaged partner,
listening to
suggestions of
others and working
cooperatively
throughout lesson.
Student was an
engaged partner but
had trouble listening
to others and/or
working
cooperatively.
Student cooperated
with others, but
needed prompting to
stay on-task.
Student did not
work effectively
with others.
Return to the Table of Contents
Predicting Peirce’s Population
Mrs. Megan Hoopes-Myers – EDTECH 542 Page 15
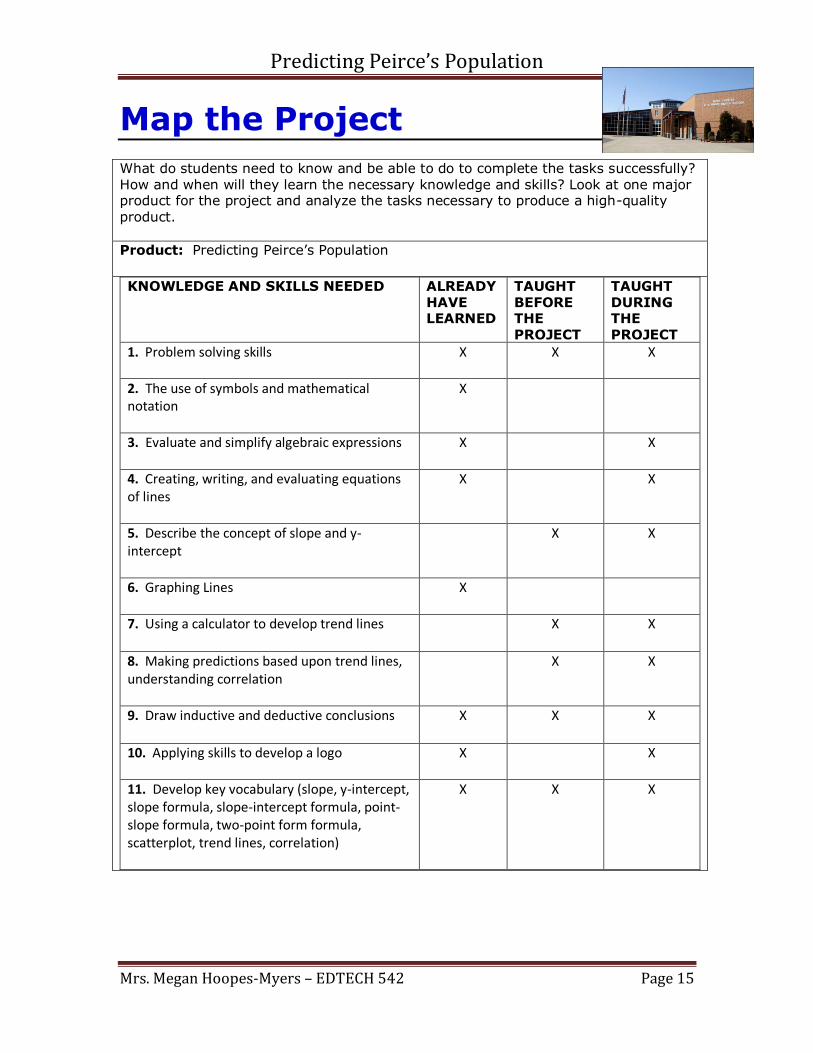
Map the Project
What do students need to know and be able to do to complete the tasks successfully? How and when will they learn the necessary knowledge and skills? Look at one major product for the project and analyze the tasks necessary to produce a high-quality product.
Product: Predicting Peirce’s Population
KNOWLEDGE AND SKILLS NEEDED ALREADY HAVE LEARNED
TAUGHT BEFORE THE PROJECT
TAUGHT DURING THE PROJECT
1. Problem solving skills
X X X
2. The use of symbols and mathematical notation
X
3. Evaluate and simplify algebraic expressions
X X
4. Creating, writing, and evaluating equations of lines
X X
5. Describe the concept of slope and y-intercept
X X
6. Graphing Lines
X
7. Using a calculator to develop trend lines
X X
8. Making predictions based upon trend lines, understanding correlation
X X
9. Draw inductive and deductive conclusions
X X X
10. Applying skills to develop a logo
X X
11. Develop key vocabulary (slope, y-intercept, slope formula, slope-intercept formula, point-slope formula, two-point form formula, scatterplot, trend lines, correlation)
X X X
Predicting Peirce’s Population
Mrs. Megan Hoopes-Myers – EDTECH 542 Page 16
What project tools will you use?
□ Know/need to know lists
□ Daily goal sheet
□ Task lists
□ Reflection journals
□ Graphing calculators
□ Computers with Internet access
□ Problem-solving worksheets
□ Pamphlet guidelines
□ Graph paper
□ Writing utensil
□ Art supplies
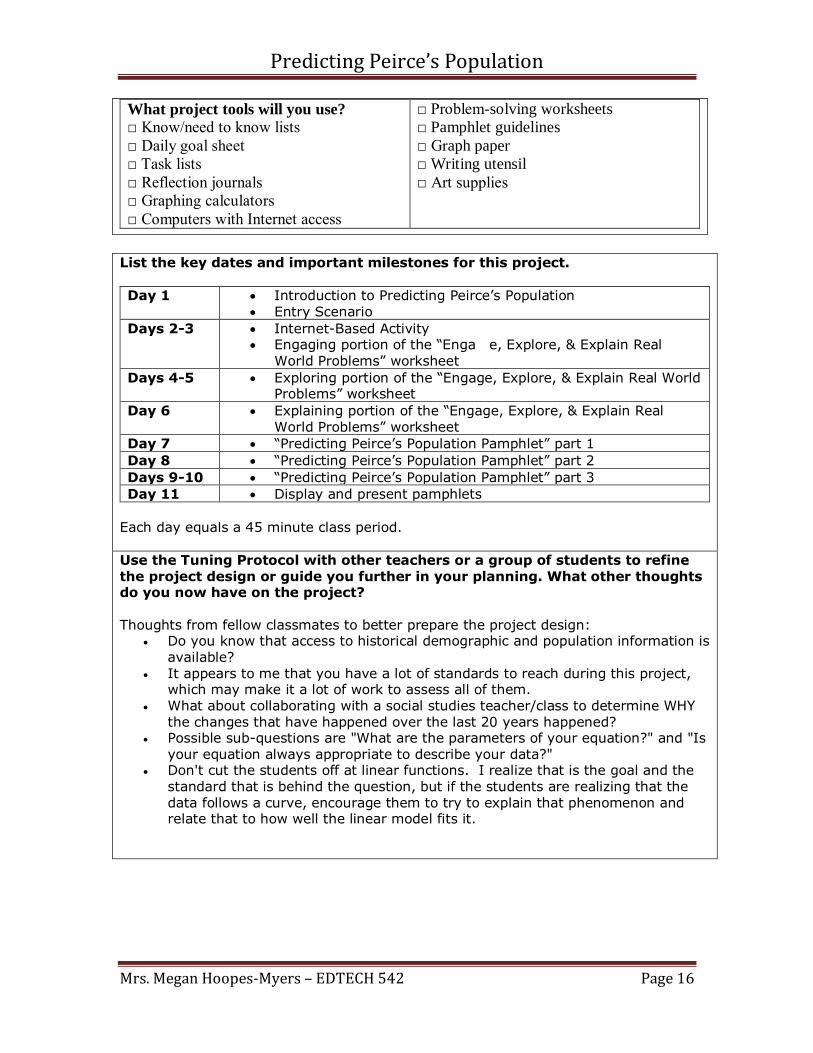
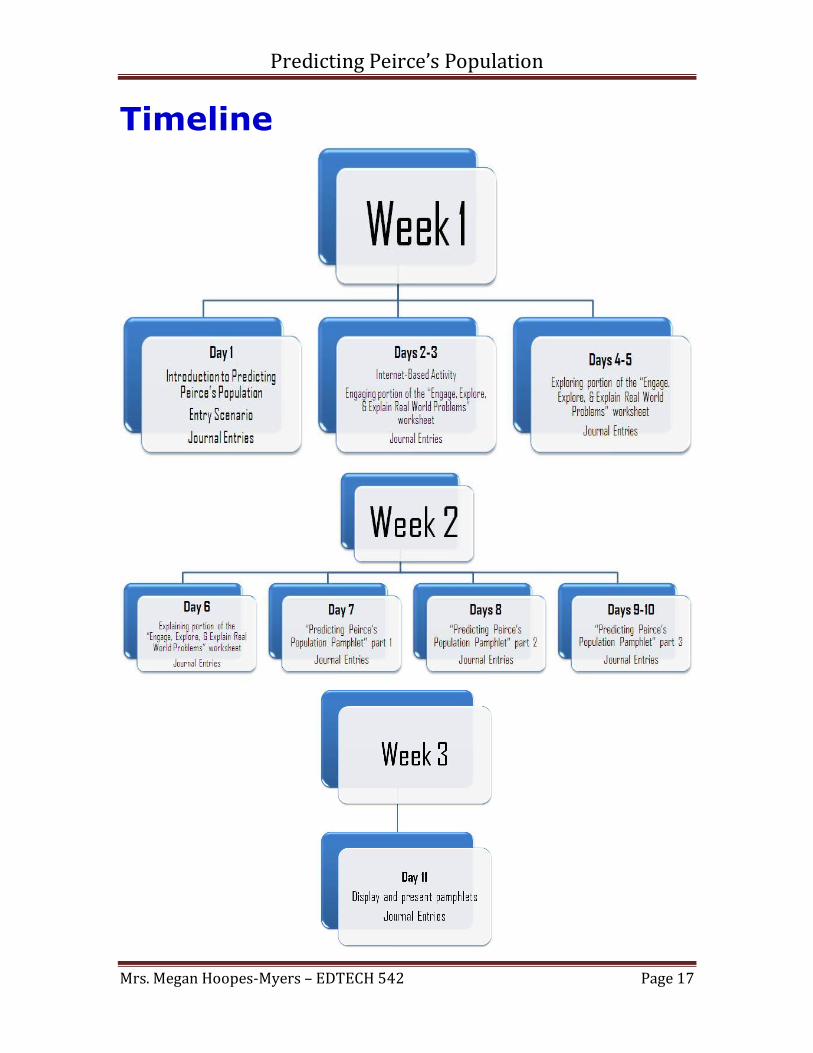
List the key dates and important milestones for this project.
Day 1 Introduction to Predicting Peirce’s Population Entry Scenario
Days 2-3 Internet-Based Activity Engaging portion of the “Enga e, Explore, & Explain Real
World Problems” worksheet
Days 4-5 Exploring portion of the “Engage, Explore, & Explain Real World Problems” worksheet
Day 6 Explaining portion of the “Engage, Explore, & Explain Real World Problems” worksheet
Day 7 “Predicting Peirce’s Population Pamphlet” part 1
Day 8 “Predicting Peirce’s Population Pamphlet” part 2
Days 9-10 “Predicting Peirce’s Population Pamphlet” part 3
Day 11 Display and present pamphlets
Each day equals a 45 minute class period.
Use the Tuning Protocol with other teachers or a group of students to refine the project design or guide you further in your planning. What other thoughts do you now have on the project? Thoughts from fellow classmates to better prepare the project design:
Do you know that access to historical demographic and population information is available?
It appears to me that you have a lot of standards to reach during this project, which may make it a lot of work to assess all of them.
What about collaborating with a social studies teacher/class to determine WHY the changes that have happened over the last 20 years happened?
Possible sub-questions are "What are the parameters of your equation?" and "Is your equation always appropriate to describe your data?"
Don't cut the students off at linear functions. I realize that is the goal and the standard that is behind the question, but if the students are realizing that the data follows a curve, encourage them to try to explain that phenomenon and relate that to how well the linear model fits it.
Predicting Peirce’s Population
Mrs. Megan Hoopes-Myers – EDTECH 542 Page 17
Timeline

Predicting Peirce’s Population
Mrs. Megan Hoopes-Myers – EDTECH 542 Page 18
Entry Scenario You and your group need to create a pamphlet that includes Peirce’s demographics,
population statistics and trends, a linear function logo, and inviting information as to why students should attend Peirce Middle School. You will use technology to gather and analyze population growth/decay over the past 20-25 years. The School Board President will present your pamphlet at the next School Board meeting. But before the construction of a pamphlet takes place, you and your group will travel
on a linear functions journey. On this journey you will reinforce your skills at writing equations of lines and use those skills to find trend lines so you can make predictions.
Internet-Based Activity The Internet will be a required resource during the engaging portion of the “Engage, Explore, & Explain Real World Problems” worksheet and during part 1 and part 3 of the “Predicting Peirce’s Population Pamphlet”. The following introduction activity will take place during Day 1 of the project. This website will give the students a brief overview of what to expect during the project.
Slope-Intercept Form http://www.mathwarehouse.com/algebra/linear_equation/slope-intercept-form.php
Video tutorial on Slope Intercept Form Slope intercept equation of vertical and horizontal lines overview Interactive slope intercept form Interactive slope-intercept form of graphed lines Interactive slope-intercept form for lines (given the slope & y-intercept)
All notes, answers, and observations will be recorded in the student’s reflection journal.

Predicting Peirce’s Population
Mrs. Megan Hoopes-Myers – EDTECH 542 Page 19
Introductory Letter
Dear Students and Parents/Guardians: Over the next three weeks my students will be collaborating to create a “Predicting Peirce’s Population Pamphlet” for the School Board’s President. Through this journey the following standards-based topics will be covered:
Identify and graph the linear parent function.
Describe and predict the effect of changing the slope (“m”) and the y-intercept (“b”) on the parent graph.
Establish how to identify linear functions by making connections between the various representations.
Define slope and intercepts of linear equations and functions. Calculate slope (rate of change) and intercepts from various representations. Explain how direct variations are related to linear functions.
The students will be responsible for writing daily journal entries, calculating multiple real-world problems presented through multimedia resources and worksheets, mastering graphing calculator techniques, and recognizing relationships between mathematics, history, and marketing. While on this journey, the students will be answering the essential question, “How can linear functions help predict population
trends?” This is an engaging project-based learning activity, which requires critical thinking, problem solving, collaboration, and various forms of communication. By completing this activity, students will gain a deeper understanding of linear functions and build lifelong habits of learning!
I have read and understand the three-week long activity entitled, “Predicting Peirce’s Population.” I realize it is my responsibility to communicate with my group if I plan to miss class due to enrichment, band lessons, or field trips. It is my responsibility
to make-up all missed work. _________________________________ _________________________________ Printed Student Name Student Signature
I have read and understand the three-week long activity entitled, “Predicting Peirce’s Population.” _________________________________ _________________________________
Printed Parent/Guardian Name Parent/Guaridan Signature
Return to the Table of Contents
Predicting Peirce’s Population
Mrs. Megan Hoopes-Myers – EDTECH 542 Page 20
Manage the Process
List preparations necessary to address needs for differentiated instruction for ELL students, special-needs students, or students with diverse learning styles.
English Language Learners (ELL): may complete the project using an English
electronic translator. ELL students may complete a modified version of the project, based on his/her transition step, which will be created by the individual’s ELL teacher.
Special-Needs Students: may complete a modified version of the project that will be created by the individual’s case worker. An adjusted schedule and “chunking” will be provided based off of each student’s individualized education plan (IEP). The
resource room will be provided to those in need.
At-Risk Students: will be creatively placed in groups with motivating and encouraging students. Gifted Students: An adjusted schedule and enrichment will be provided based off
of each student’s gifted individualized education plan (GIEP).
How will you and your students reflect on and evaluate the project?
□ Class Discussions: held throughout the project (led by students and/or teacher)
□ Student Learning Log*: used to prompt writings in Reflective Journal
□ Group-Member Observation Checklist*: to be completed throughout the project
□ The Fishbowl Method*: used to display and present pamphlets
□ Oral Presentation Checklist**: used to prepare pamphlet presentation
□ End-of-Project Self-Assessment*: to be completed at the conclusion of the project
*Modifications made from Project Management Tools
**Modifications made from Project Based Learning Checklists
Predicting Peirce’s Population
Mrs. Megan Hoopes-Myers – EDTECH 542 Page 21
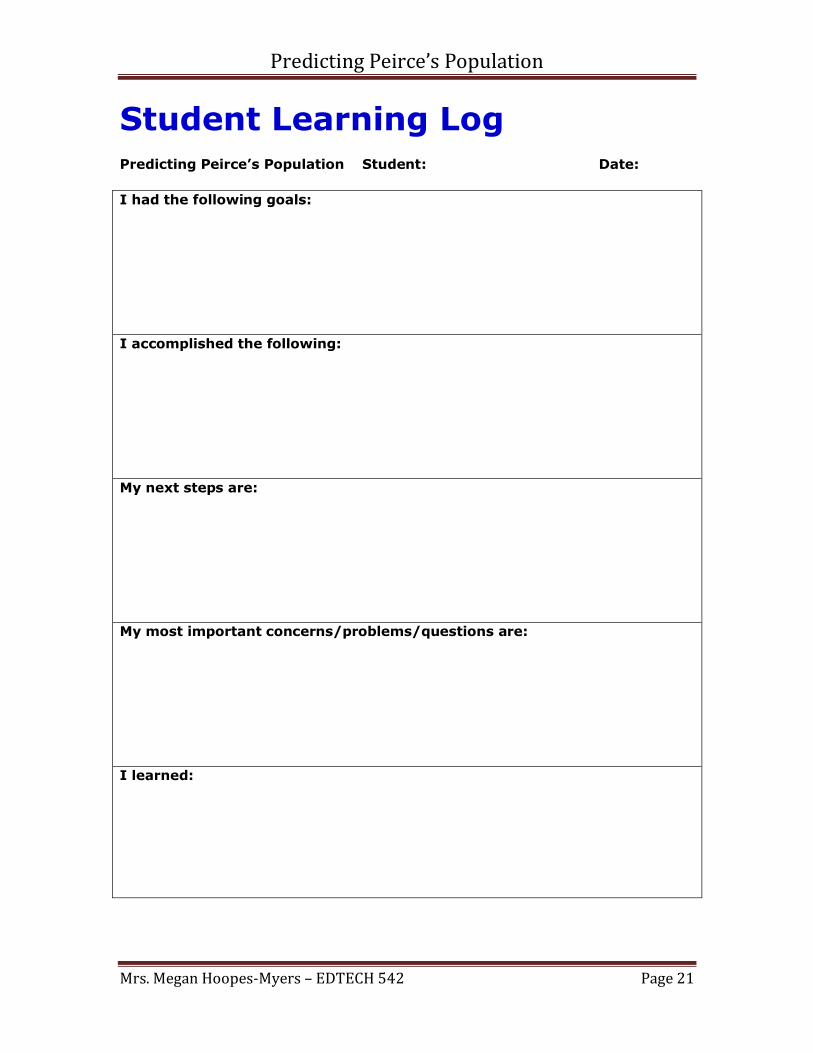
Student Learning Log
Predicting Peirce’s Population Student: Date:
I had the following goals:
I accomplished the following:
My next steps are:
My most important concerns/problems/questions are:
I learned:
Predicting Peirce’s Population
Mrs. Megan Hoopes-Myers – EDTECH 542 Page 22
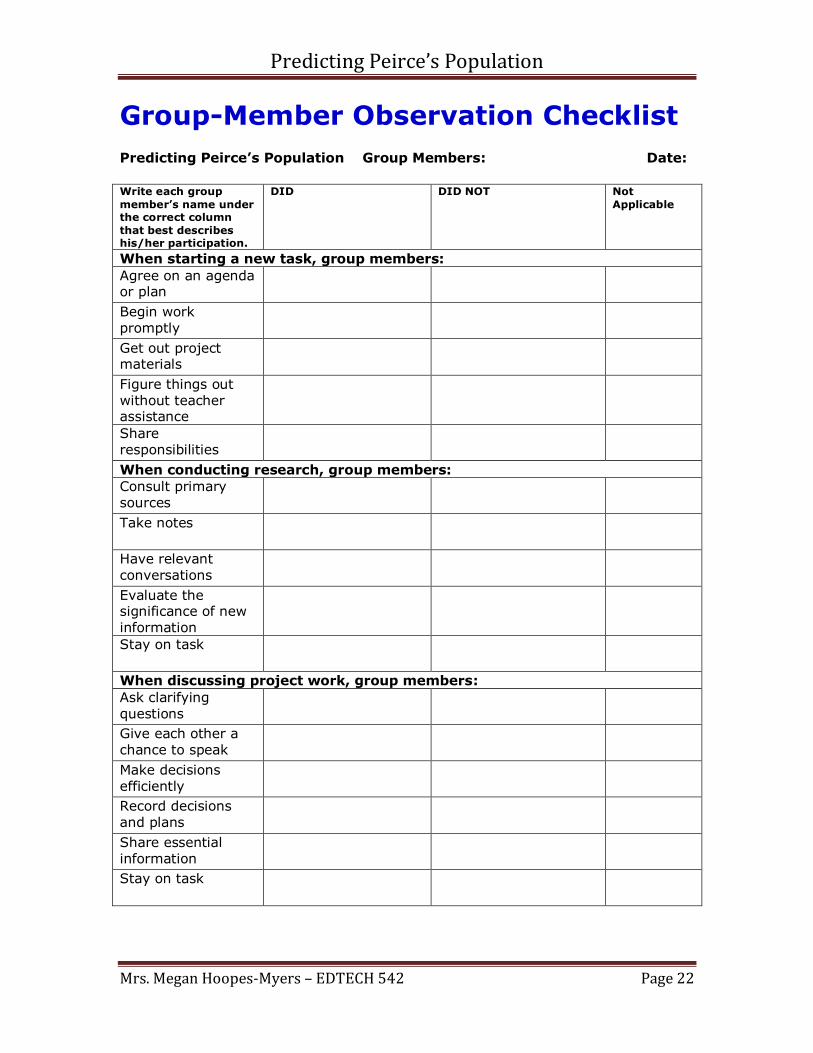
Group-Member Observation Checklist
Predicting Peirce’s Population Group Members: Date:
Write each group
member’s name under the correct column
that best describes his/her participation.
DID DID NOT Not
Applicable
When starting a new task, group members:
Agree on an agenda or plan Begin work promptly Get out project materials Figure things out without teacher assistance
Share responsibilities When conducting research, group members:
Consult primary sources Take notes
Have relevant
conversations Evaluate the significance of new information
Stay on task
When discussing project work, group members:
Ask clarifying questions Give each other a chance to speak Make decisions efficiently Record decisions and plans Share essential information Stay on task

Predicting Peirce’s Population
Mrs. Megan Hoopes-Myers – EDTECH 542 Page 23
The Fishbowl Method
The Fishbowl Method will be used on Day 11 (display and present projects)
1. Arrange students in a large circle. 2. Place a smaller circle of five to seven chairs in the center of the larger circle. 3. Have one group sit in the inside circle. Keep one chair vacant. 4. Students in the inner circle discuss the outcomes of their project. The
audience in the outer circle listens. 5. The vacant chair is for any member of the audience who wants to join the
discussion to add a comment or ask a question. Once the comment has been made or the question asked, the participant returns to the audience so that another member of the audience may join the inner circle.
6. Repeat steps 3-5 until all groups have presented their project.
Note: Only one day is allotted for project presentations. Divide the time for presentations by the number of groups in the class.
Oral Presentation Checklists
Predicting Peirce’s Population Student Name: Date:
Content I used facts and logical appeals where appropriate.
I was well-informed on my topic.
I presented information that others didn't know.
I was able to answer questions from the audience. Delivery My body language was alert and relaxed.
My voice varied in pitch. It was not monotone.
I used notes sparingly. I did not read from them unless
presenting a quote.
I spoke to the entire audience, not just one or two people.
My volume was neither too loud nor too soft. Organization I included necessary background information.
The body or the presentation contained support for the
main points.
The audience could distinguish the introduction, body
and conclusion. Presentation Aids Presentation aids were used during the speech.
Presentation aids were relevant to the topic.
Visual aids were easy to read or see.

Predicting Peirce’s Population
Mrs. Megan Hoopes-Myers – EDTECH 542 Page 24
End-of-Project Self-Assessment
Predicting Peirce’s Population Student: Date:
I completed the following tasks during the project:
As a result, I learned the following:
About the subject matter
About working in a group About creating a pamphlet
About presenting to an audience
I learned that my strengths are:
I learned I need to work on:
I would make the following changes if I were to do the project again:
Return to the Table of Contents
Predicting Peirce’s Population
Mrs. Megan Hoopes-Myers – EDTECH 542 Page 25
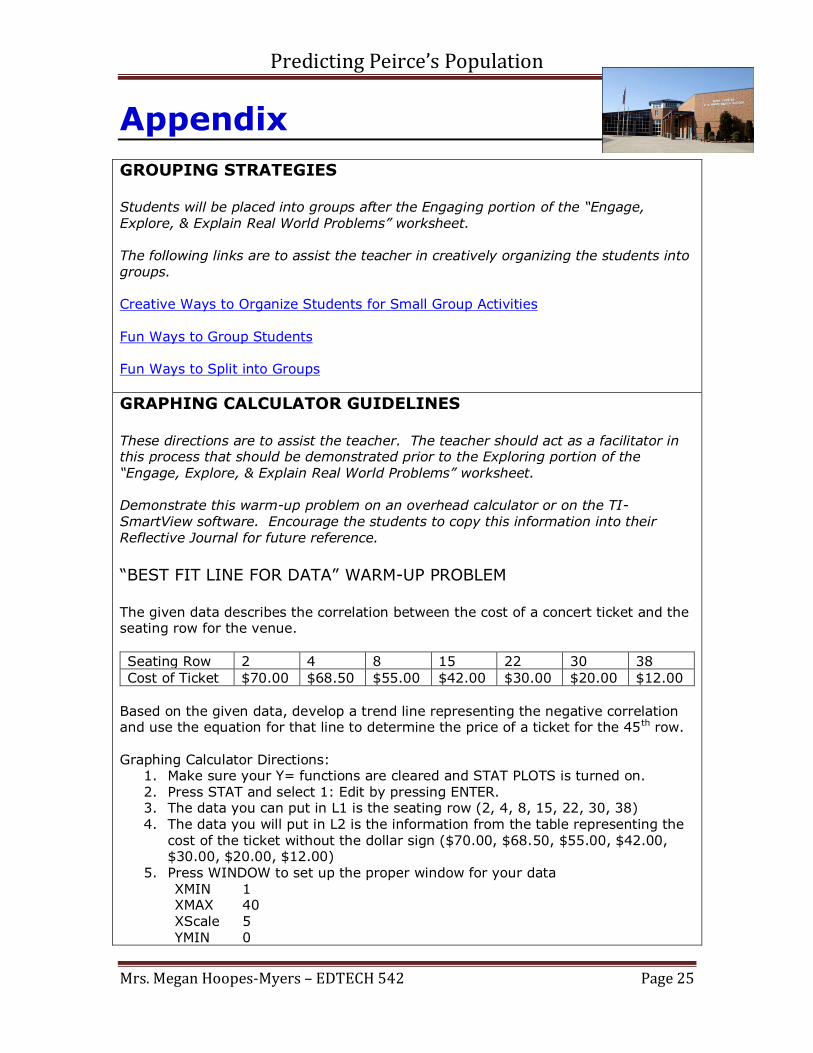
Appendix
GROUPING STRATEGIES
Students will be placed into groups after the Engaging portion of the “Engage, Explore, & Explain Real World Problems” worksheet. The following links are to assist the teacher in creatively organizing the students into groups. Creative Ways to Organize Students for Small Group Activities Fun Ways to Group Students
Fun Ways to Split into Groups
GRAPHING CALCULATOR GUIDELINES
These directions are to assist the teacher. The teacher should act as a facilitator in this process that should be demonstrated prior to the Exploring portion of the
“Engage, Explore, & Explain Real World Problems” worksheet. Demonstrate this warm-up problem on an overhead calculator or on the TI-SmartView software. Encourage the students to copy this information into their Reflective Journal for future reference.
“BEST FIT LINE FOR DATA” WARM-UP PROBLEM
The given data describes the correlation between the cost of a concert ticket and the seating row for the venue.
Seating Row 2 4 8 15 22 30 38
Cost of Ticket $70.00 $68.50 $55.00 $42.00 $30.00 $20.00 $12.00
Based on the given data, develop a trend line representing the negative correlation and use the equation for that line to determine the price of a ticket for the 45th row. Graphing Calculator Directions:
1. Make sure your Y= functions are cleared and STAT PLOTS is turned on. 2. Press STAT and select 1: Edit by pressing ENTER. 3. The data you can put in L1 is the seating row (2, 4, 8, 15, 22, 30, 38) 4. The data you will put in L2 is the information from the table representing the
cost of the ticket without the dollar sign ($70.00, $68.50, $55.00, $42.00, $30.00, $20.00, $12.00)
5. Press WINDOW to set up the proper window for your data XMIN 1 XMAX 40 XScale 5 YMIN 0

Predicting Peirce’s Population
Mrs. Megan Hoopes-Myers – EDTECH 542 Page 26
YMAX 75 YScale 5
6. Press STAT again and select CALC: 4. This will generate the equation for your
trend line (also known as a linear regression). 7. Round off the “a” and “b” to the nearest hundredth and enter your equation in
Y1. 8. Graph your line on graph paper. Be sure to label your axes correctly.
Return to the Table of Contents