Embed Size (px)
Citation preview

Predicting Readmissions (and other outcomes)
Doesn’t Take a PhDJohn Showalter, MD MSIS
Chief Health Information Officer
University of Mississippi Medical CenterNovember 12, 2013

Section name here
Objectives
Discuss why advanced mathematical modeling is not always superior to straight-forward calculations.
Describe how readily available administrative data can be used to predict risk for readmission at your institution.
Explain certainty factor analysis and how it can be applied to healthcare analytics
Section name here
Punch-line
You can predict readmissions:– At the time of admission – With data you already have– Without advanced analytics software

Section name here
MYCIN
Computer program that used a rule based system to suggest treatment for serious infections
Developed in the early 1970s Outperformed specialists in treatment
selection Based on a novel method of handling
uncertainty in decision making (Certainty Factors)

Section name here
Certainty Factors
Designed to handle dependency between variables
Based on individual estimates of certainty Scale: -100 (absolute certainty of no event)
to 100 (absolute certainty of event) Calculates the strength of a belief not a
probability Widely used in rule-based computer
programs for a short period

Section name here
Fall of Certainty Factors
Mathematically proven to be inferior to advanced conditional probabilistic models– Except for simple belief calculations
Development of Belief Networks for both simple and advanced belief calculations
Only allows forward reasoning Infrequently used and even more
infrequently mentioned in the last 20 years

Section name here
Why use Certainty Factors in healthcare?
Almost all variables are dependent– Weight effects diabetes risk– Age effects heart attack risk– Treatments effect outcomes
It is designed for rule based logic systems– Almost all/if not all clinical decision support
systems are rule-based systems
The math is straight-forward and can be handled in the vast majority of EHRs

Section name here
Necessary Modifications to Certainty Factors
Only explore the certainty of the event occurring (i.e. 0 – 100)
Calculate Certainty Factors based on rates since data is readily available
Correlate strength of belief (Certainty Factor)with risk stratification of potential event

Section name here
Predicting Readmission Study Create a method of predicting
readmissions at the time of admission Use readily available administrative data Compare modified certainty factor analysis
to advanced machine learning algorithms 6,448 discharges for the Internal Medicine
Service 30 day readmissions

Section name here
Predicting Readmission Study Used four administrative variables
– Number of diagnoses bill in 1 year prior to admission– Boolean (Y/N)
• Hospital admission within 1 year prior to current admission• ED visit within 1 year prior to current admission• Outpatient clinic visit within 1 year prior to current admission
Compared Several Predictive Model– Certainty Factors– Bayesian Network– 2 Artificial Neural Networks– Support Vector Machine

Section name here
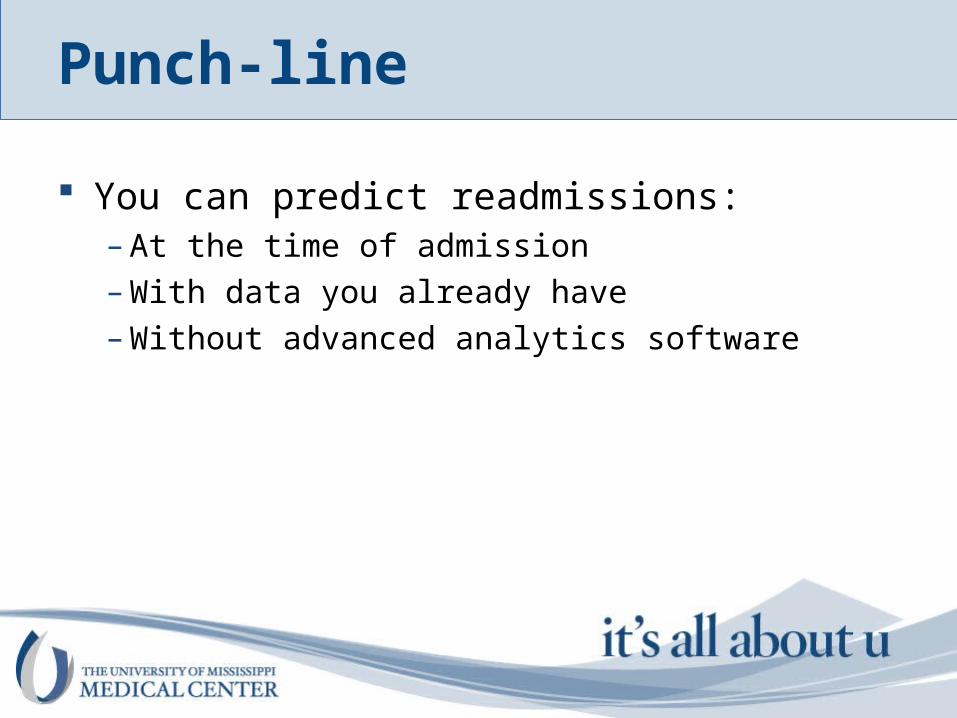
Study Results – All Readmissions
Certainty Factors
Bayesian Network
ANN Multilayer Perception
ANN Radial Basis
FunctionNumber of Discharges
Number of Readmissio
nsRate
Number of
Discharges
Number of Readmission
sRate
Number of Discharges
Number of Readmissions
Rate
Number of
Discharges
Number of Readmission
sRate
LowRisk
1,032(37.6)
108(26.5%)
10.5%
1,754(63.9)
217(53.3)
12.3%
1,453(53.0)
173(42.3)
11.8%
1,720(62.7)
202(49.6)
11.7%
ModerateRisk
1,441(52.5)
212(52.1)
14.7%
741(27.0)
115(28.3)
15.5%
999(36.4)
140(34.4)
14.0%
741(27.0)
115(28.3)
15.5%
High Risk
270(9.8)
87(21.4)
32.3%
248(9.0)
75(18.4)
30.2%
291(10.6)
95(23.3)
32.6%
282(10.3)
90(22.1)
31.9%
AUC 0.596 0.587 0.599 0.615
Section name here
Study Results – All Readmissions
Certainty Factors
Bayesian Network
ANN Multilayer Perception
ANN Radial Basis
FunctionNumber of Discharges
Number of Readmissio
nsRate
Number of
Discharges
Number of Readmission
sRate
Number of Discharges
Number of Readmissions
Rate
Number of
Discharges
Number of Readmission
sRate
LowRisk
1,032(37.6)
108(26.5%)
10.5%
1,754(63.9)
217(53.3)
12.3%
1,453(53.0)
173(42.3)
11.8%
1,720(62.7)
202(49.6)
11.7%
ModerateRisk
1,441(52.5)
212(52.1)
14.7%
741(27.0)
115(28.3)
15.5%
999(36.4)
140(34.4)
14.0%
741(27.0)
115(28.3)
15.5%
High Risk
270(9.8)
87(21.4)
32.3%
248(9.0)
75(18.4)
30.2%
291(10.6)
95(23.3)
32.6%
282(10.3)
90(22.1)
31.9%
AUC 0.596 0.587 0.599 0.615

Section name here
Study Results – Unplanned Readmissions*
Certainty Factors
Bayesian Network
ANN Multilayer Perception
ANN Radial Basis
FunctionNumber of Discharges
Number of Readmissio
nsRate
Number of
Discharges
Number of Readmission
sRate
Number of Discharges
Number of Readmissions
Rate
Number of
Discharges
Number of Readmission
sRate
LowRisk
1,032(37.6)
56(18.5)
5.4%
2,335(85.1)
216(71.3)
9.3%2,055(74.9)
163(53.8)
7.9%2,173(79.2)
183(60.4)
8.4%
ModerateRisk
1,441(52.5)
165(54.4)
11.5%
160(5.8)
21(6.9)
13.1%
274(10.0)
38(12.5)
13.9%
279(10.2)
34(11.2)
12.2%
High Risk
270(9.8)
82(27.1)
27.1%
248(9.0)
66(21.8)
26.6%
415(15.1)
102(33.7)
24.6%
291(10.6)
86(28.4)
29.6%
AUC 0.648 0.620 0.647 0.686
* Defined by readmission to the Internal Medicine Service

Section name here
UMMC Preliminary Results –All Readmissions
Certainty Factors
Number of Discharges
Number of Readmissio
nsRate
LowRisk
2,566(59.7)
84(21.9)
3.3%
ModerateRisk
1,045(24.4)
135(35.2)
12.9%
High Risk
675(15.7)
165(43.0)
24.4%
AUC 0.744

Section name here
Create Certainty Factor Model
Certainty Factor of Usage (CFU)Prior IP
Prior OP Prior ED Readmission Rate (CFU)
Yes Yes Yes
Yes Yes No
Yes No Yes
Yes No No
No Yes Yes
No Yes No
No No Yes
No No No
Certainty Factor of Diagnosis (CFD)Number of Diagnoses in Prior Year
Readmission Rate (CFD)
0
1-10
Greater than 10
General EquationCFT = CF1 + CF2 * (1 – CF1 ) + (CF3*(1-(CF1 + CF2 * (1 – CF1 ))))...
Study CFR Cut-offsLow Risk 0–0.199 Moderate Risk 0.2–0.352High Risk 0.353–0.6
Equation for readmssion modelCFR = CFU + CFD * (1 – CFU)
Calculate CFR and then select risk level cut-offs

Section name here
Certainty Factors –Potential Applications
Risk stratification based on historic data– Incidental finding on chest x-ray
Risk assessment based on current data– Mortality from infection/sepsis
Real-time alerts about changes in risk– Failure to rescue
Section name here
Recap
You don’t need “Big Data” to make predictions
You don’t need a PhD to do the math Timely, actionable knowledge is possible
with Certainty Factors