Embed Size (px)
Citation preview
Predicting Sales from the Language of Product DescriptionsReid Pryzant
Stanford [email protected]
Young-joo ChungRakuten Institute of Technology
Dan JurafskyStanford University
ABSTRACTWhat can a business say to attract customers? E-commerce vendorsfrequently sell the same items but use different marketing strate-gies to present their goods. Understanding consumer responses tothis heterogeneous landscape of information is important both asbusiness intelligence and, more broadly, a window into consumerattitudes. When studying consumer behavior, the existing litera-ture is primarily concerned with product reviews. In this paper weposit that textual product descriptions are also important determi-nants of consumer choice. We mine 90,000+ product descriptionson the Japanese e-commerce marketplace Rakuten and identify ac-tionable writing styles and word usages that are highly predictiveof consumer purchasing behavior. In the process, we observe theinadequacies of traditional feature extraction algorithms, namelytheir inability to control for the implicit effects of confounds likebrand loyalty and pricing strategies. To circumvent this problem,we propose a novel neural network architecture that leverages anadversarial objective to control for confounding factors, and atten-tional scores over its input to automatically elicit textual featuresas a domain-specific lexicon. We show that these textual featurescan predict the sales of each product, and investigate the narrativeshighlighted by these words. Our results suggest that appeals to au-thority, polite language, and mentions of informative and seasonallanguage win over the most customers.
CCS CONCEPTS• Information systems → Content analysis and feature se-lection; • Computing methodologies → Information extrac-tion; Neural networks;
KEYWORDSe-commerce, feature selection, neural networks, adversarial learn-ing, natural language processing
ACM Reference format:Reid Pryzant, Young-joo Chung, and Dan Jurafsky. 2017. Predicting Salesfrom the Language of Product Descriptions. In Proceedings of SIGIR, Tokyo,Japan, August 2017 (SIGIR 2017 eCom), 10 pages.
1 INTRODUCTIONThe internet has dramatically altered consumer shopping habits.Whereas customers of physical stores can physically manipulate,
Permission to make digital or hard copies of part or all of this work for personal orclassroom use is granted without fee provided that copies are not made or distributedfor profit or commercial advantage and that copies bear this notice and the full citationon the first page. Copyrights for third-party components of this work must be honored.For all other uses, contact the owner/author(s).SIGIR 2017 eCom, August 2017, Tokyo, Japan© 2017 Copyright held by the owner/author(s).
test, and evaluate products before making purchasing decisions,the remote nature of e-commerce renders such tactile evaluationsobsolete.
In lieu of in-store evaluation, online shoppers increasingly relyon alternative sources of information. This includes “word-of-mouth”recommendations from outside sources [9] and local product re-views [13, 18, 20]. These factors, though well studied, are onlyindirectly controllable from a business perspective [25, 52]. Busi-ness owners have considerably stronger control over their ownproduct descriptions. The same products may be sold by multiplevendors, with each item having a different textual description (notethat we take product to mean a purchasable object, and item to meanan individual e-commerce listing). Studying consumers’ reactionsto these descriptions is valuable both as business intelligence andas a new window into consumer attitudes.
The hypothesis that business-generated product descriptionsaffect consumer behavior (manifested in sales) has received strongsupport in prior empirical studies [22, 26, 34, 37, 39]. However, thesestudies have only used summary statistics of these descriptions (i.e.readability, length, completeness). We propose that embedded inthese product descriptions are narratives that affect shoppers, whichcan be studied by examining the words in each description.
Our hypothesis is that product descriptions are fundamentallya kind of social discourse, one whose linguistic contents have realcontrol over consumer purchasing behavior. Business owners em-ploy narratives to portray their products, and consumers reactaccordingly according to their beliefs and attitudes.
To test this hypothesis, we mine 93,591 product descriptions andsales records from the Japanese e-commerce website rakuten.co.jp(“Rakuten”). We build models that can explain how the textual con-tent of product descriptions impacts sales. Second, we use thesemodels to conduct a explanatory analysis, identifying what linguis-tic aspects of product descriptions are the most important determi-nants of success.
We seek to unearth actionable phrases that can help e-commerce vendors increase their sales regardless of what’sbeing sold. Thus, we want to study the effect of language on salesin isolation, i.e. find textual features that are untangled from theeffects of pricing strategies [15], brand loyalty [17, 48], and productidentity. Choosing features for such a task is a challenging problem,because product descriptions are embedded in a larger e-commerceexperience that leverages the shared power of these confounds tomarket a product. For a not-so-subtle example, product descrip-tions frequently boast “free shipping!”, overtly pointing to a pricingstrategy with known power over consumer choice [19].
We develop a new text feature selection algorithm to operatein this confound-controlled setting. This algorithm makes use of anovel neural network architecture. The network uses attentional
scores over its input and an adversarial objective to select a lexi-con that is simultaneously predictive of consumer behavior andcontrolled for confounds such as brand and price.
We evaluate our feature selection algorithm on two pools of fea-ture candidates: morphemes obtained with the JUMAN tokenizer1,and sub-word units obtained via byte-pair encoding (“BPE”) [47].From these pools we select features with either (1) our proposedneural network, (2) odds ratios [10], (3) mutual information [41],and (4) the features with nonzero coefficients of a L1 regularizedlinear regression. Our results suggest that lexicons produced by theneural model are both less correlated with confounding factors andthe most powerful predictors of sales.
In summary, our contributions are as follows:• Wedemonstrate that the narratives embedded in e-commerce
product descriptions influence sales.• We propose a novel neural architecture to mine features
for the task.• We discover actionable writing styles and words that have
especially high influence on these outcomes.
2 PREDICTING SALES FROM DESCRIPTIONSOur task is to predict consumer demand (measured in log(sales))from the narratives embedded in product descriptions. To do so,we mine features from these textual data and fit a statistical model.In this section, we review our feature-mining baselines, presentour novel approach to feature-mining, and outline our statisticaltechnique for predicting sales from these features while accountingfor confounding factors like brand loyalty and product identity.
2.1 Feature Mining PreliminariesWe approach the featurization problem by first segmenting prod-uct descriptions into sequences of tokens, then selecting tokensfrom the vocabulary of tokens that are predictive of high sales.We take subsets of these vocabularies (rather than one feature pervocabulary item) because (1) we need to be able to examine thelinguistic contents of the resulting feature sets, and (2) we needmodels that are highly generalizable, and not too closely adaptedto the peculiarities of these data’s vocabulary distributions.
We select predictive subsets of the data’s tokenized vocabulariesin four ways. Three of these (Section 2.2) are traditional featureselection methods that serve as strong baselines for our proposedmethod (Section 2.3).
2.2 Traditional Feature MiningOdds Ratio (OR) finds words that are over-represented in a partic-ular copora when compared to another (e.g. descriptions of highselling items verses those of low-selling counterparts). Formally,this is:
pi/(1 − pi )pj/(1 − pj )
(1)
where pi is the probability of the word in copora i (e.g high-sellingdescriptions) and pj is the probability of the word in copora j
1JUMAN (a User-Extensible Morphological Analyzer for Japanese), http://nlp.ist.i.kyoto-u.ac.jp/EN/index.php?JUMAN
(e.g low-selling descriptions). Note that this method requires di-chotomized targets, which we discuss further in Section 3.1.
Mutual information (MI) is a measurement of how informativethe presence of a token is to making correct classification decisions.Formally, the mutual informationMI (t , c) of a token t and binaryclass c is
MI (t , c) =∑
It ∈{1,0}
∑It ∈{1,0}
P(It , Ic ) logP(It , Ic )
P(It )P(IC )(2)
where It and Ic are indicators on term presence and class label fora given description. Like OR, this method requires dichotomizedsales targets.
Lasso Regularization (L1) can perform variable selection on alinear regression model [51] by including a regularization term tothe least squares objective. This term penalizes the L1 norm of themodel parameters:
argmin{ N∑i=1
(yi − β0 −
∑jβjxi j
)}, (3)
subject to∑j
|βj | ≤ α (4)
.Where yi is the ith target, β0 is an intercept, βj is the jth coefficientof the ith predictor xi . α is pre-specified parameter that determinesthe amount of regularization. The parameter α can be obtained byminimizing the error in cross-validation.
2.3 Deep Adversarial Feature MiningAn important limitation of all the aforementioned feature selectionmethods is that they are incapable of selecting features that aredecorrelated from confounds like brand and price. Recall fromSection 1 the price-related example of “free shipping!”. Considerthe brand-related example of “the quality you know and love fromDaison”. Though effective marketing tools, these phrases leveragethe power of pricing strategies and brand loyalty, factors withknown power over consumers. We wish to study the impact oflinguistic structures in product descriptions in isolation, beyondthose indicators of price or branding. Thus, we consider brand,product, and price information as confounding factors that confusethe effect of language on consumers.
As a solution to this problem,we propose a novel feature-selectingneural network (RNN+/-GF), sketched in Figure 1. The model usesan attention mechanism to produce estimates for log(sales), brand ,and price . We omit product because it is only present in our testdata; see Section 3.1 for details. During training, the model usesan adversarial objective to discourage feature effectiveness withrespect to two of these prediction targets: brand and price . That is,the model finds features that are good at predicting sales, and badat predicting brand and price.
Deep learning review.Beforewe describe themodel, we reviewits primary building blocks.
Feedforward Neural Networks (FFNNs) are composed of aseries of fully connected layers, where each layer takes on the form
y = f (Wx + b). (5)
2

Figure 1: An illustration of the proposed RNN+GF model operating on an example product description with three timesteps.All operations and dimensionalities are explicitly shown. Vectors are depicted as rounded rectangles, matrix multiplicationsas squared rectangles, and scalars as circles. Trainable parameters are grey, while dynamically computed values are colored.Gradient reversal layers multiply gradients by -1 as they backpropagate from the prediction networks to the encoder. In thisexample, themodel attends to the description’s final token themost, so that would be themost likely candidate for a generatedlexicon.
Note that x ∈ Rn is a vector of inputs (e.g. from a previous layer),W ∈ Ry×n is a matrix of parameters, b ∈ Ry is a vector of biases,y ∈ Ry is an output vector, and f (·) is some nonlinear activationfunction, e.g. the ReLU: ReLU (x) = max{0,x}.
Recurrent Neural Networks (RNNs) are effective tools forlearning structure from sequential data [14]. RNNs take a vectorxt at each timestep. They compute a hidden state vector ht ∈ Rhat each timestep by applying nonlinear maps to the the previoushidden stateht−1 and the current input xt (note thath0 is initializedto ®0):
ht = σ(W (hx )xt +W (hh)ht−1
). (6)
W (hx ) ∈ Rh×n ,W (hh) ∈ Rx×h are parameterized matrices. Weuse Long Short-Term Memory Network (LSTM) cells, a variant ofthe traditional RNN cell that can more effectively model long-termtemporal dependencies [23].
Attention mechanisms. Attentional mechanisms allow neuralmodels to focus on parts of the encoded input before producingpredictions. We calculate Bahdanau-style attentional contexts [3]because these have been shown to perform well for other taskslike translation and language modeling [11, 31], and preliminaryexperiments suggested that this mechanism worked best for ourproblem setting.
Bahdanau-style attention computes the attentional context as aweighted average of hidden states. The weights are computed asfollows: pass each hidden state hi through a fully-connected neuralnetwork, then compute a dot product with a vector of parameters toproduce an intermediary scalar ai (eq. 7). Next, the ai ’s are scaledby a softmax function so that they map to a distribution over hidden
states (eq. 8). Finally, this distribution is used to compute a weightedaverage of hidden states c (eq. 9). Formally, this can be written as:
ai = v⊺a tanh(Wahi ) (7)
a = softmax(a) (8)
c =∑jajhj (9)
Our model.We continue by describing our adversarial featureminingmodel. The process of obtaining features from themodel canbe thought of as a three-stage algorithm: (1) forward pass, wherepredictions are generated, (2) backward pass, where parametersare updated, and, after repeated iterations of 1 and 2, (3) featureselection, where we use attentional scores to elicit lexicons.
The forward pass operates as follows:
(1) The segmented input is fed into an LSTM to produce hiddenstate encodings for each timestep.
(2) We compute an attentional summary of these hidden statesto obtain a single vector encoding of the input.
(3) We feed this encoding into three FFNNs. One is a regres-sion network that tries to minimize L = | |y − x | |2, thesquared loss between the predicted and true log(price).The second and third are classification networks, whichpredict a likelihood distribution over all possible labels,and are trained to minimize L = − logp(y), the negativelog probability of the correct class label. We attach classi-fication networks for brand id and a dochotomization ofprice (see Section 3.1 for details). We dichotomized sales inthis way to create a fair comparison between this method
3

and the baselines: other feature selection algorithms (OR,MI) are not so flexible and require dichotomized targets.
The backward pass draws on prior work in leveraging adver-sarial objective functions to match feature distributions in differentsettings [40]. In particular, we draw from a line of research in thestyle of [16], [8], and [27]. This method involves passing gradientsthrough a gradient reversal layer, which multiplies gradients bya negative constant, i.e. -1, as they propagate back through thenetwork. Intuitively, this encourages parameters to update awayfrom the optimization objective.
If Lsales , Lbrand , Lpr ice are the regression and classificationlosses from each prediction network, then the final loss we are opti-mizing isL = Lsales+Lbrand+Lpr ice . However, when backprop-agating from each prediction network to the encoder, we reversethe gradients of the networks that are predicting confounds. Thismeans that the prediction networks still learn to predict brand andprice , but the encoder is forced to learn brand- and price-invariantrepresentations which are not useful to these downstream tasks.We hope that such representations encourage the model to attendto confound-decorrelated tokens.
The lexicon induction stage uses a trainedmodel defined aboveto select textual features that are predictive of sales, but control forthe influence of brand and price. This stage operates as follows:
(1) Generate predictions for each test item, but rather thansaving those predictions, save the attentional distributionover each source sequence.
(2) Standardize these distributions. For each input i , standard-ize the distribution over timesteps p(i) by computing
z(i) =p(i) − µ(i)p
σ (i)p
(10)
(3) Merge these standardized distribution over each input se-quence. If there is a word collision (i.e. we observe the sametoken in multiple input sequences and the model assignedeach observation a different z-score), take the max of thosewords’ z-scores.
(4) Select the k tokens with highest z-scores. This is our in-duced lexicon.
2.4 Using Features to Predict SalesOnce we have mined textual features from product descriptions, weneed a statistical model that accounts for the effects of confoundingvariables like product identity and brand loyalty in predicting thesales of each item. We use a mixed-effects model, a type of hierar-chical regression that assumes observations can be explained withtwo types of categorical variables: fixed effect variables and randomeffect variables [7].
We model textual features as fixed effects. We take the productthat each item corresponds to and the brand selling each item asrandom effects. Thus, we force the model to assume that productand brand information is decorrelated from everything else, and weexpect to observe the explanatory power of text features withoutthe influence of brand or product. Note that the continuous natureof the “price” confound precludes our ability to model it (Section3.1).
We proceed with a formal description of our mixed-effects model.Let yi jk be the log(sales) of item i , which is product j and soldby brand k . The description for this item is written as xi jk , andeach x
(h)i jk ∈ xi jk is the hth feature of this description. With these
definitions, we can write our mixed-effects model model as
yi jk = β0 +∑h
βhx(h)i jk + γj + αk + ϵi jk (11)
γj ∼ N(0,σ 2γ ) (12)
αk ∼ N(0,σ 2α ) (13)
ϵi jk ∼ N(0,σ 2ϵ ) (14)
whereγj andαk are the random effects of product and brand, respec-tively, and ϵi jk is an item-specific effect, i.e. this item’s deviationfrom the mean item sales.
Nakagawa and Schielzeth [44] introduced the marginal and con-ditional R2 (R2m and R2c ) as summary statistics of mixed-effects mod-els. Marginal R2m is the R2 of the textual effects only. It reports theproportion of variance in the model’s predictions can be explainedwith fixed effects variables x (h)i jk . It is written as;
R2m =σ 2f
σ 2f + σ
2γ + σ
2α + σ
2ϵ, (15)
σ 2f = var
(∑h
βhx(h)i jk
). (16)
Conditional R2c is the R2 of the entire model (text + product +brand). It conditions on the variances of the random factors we arecontrolling for (product and brand):
R2c =σ 2f + σ
2γ + σ
2α
σ 2f + σ
2γ + σ
2α + σ
2ϵ. (17)
3 EXPERIMENTSWe now detail a series of experiments that were conducted to evalu-ate the effectiveness of each feature set, and, more generally, to testthe hypothesis that narratives embedded in product descriptionsare indeed predictive of sales.
3.1 Product and Sales DataWe obtained data on e-commerce product descriptions, sales, ven-dors, and prices from a December 2012 snapshot of the Rakutenmarketplace2. We focused on items belonging to two product cate-gories: chocolate and health. These two categories are both popularon the marketplace, but their characteristics are different. There ismore variability among chocolate products than health products;many vendors are boutiques that sell handmade goods. Health ven-dors, on the other hand, are often large providers of pharmaceuticalsgoods, sometimes wholesale.
We segment product descriptions twoways. First, we tokenize de-scriptions into morphological units (morphemes) with the JUMANtokenizer3. Second, we break descriptions into frequently occurring2Please refer to https://rit.rakuten.co.jp/opendata.html for details on data acquisition.3Using JUMAN (a User-Extensible Morphological Analyzer for Japanese),http://nlp.ist.i.kyoto-u.ac.jp/EN/index.php?JUMAN
4

sub-word units 4. From here on we refer to the morpheme featuresas “morph”, and sub-word features as “BPE”.
Details of these data can be found in Table 1. Notably, the ratioof the size of vocabulary (unique keywords) to the size of tokens(occurrence of keywords) in the chocolate category is twice as largeas that of the health category as listed in (%) in Table 1. This impliesthat product descriptions in the chocolate category are written withmore diverse language.
Recall that some feature selection algorithms (OR, MI) requiredichotomized prediction targets. Thus, we dichotomized the dataon log(sales), taking the top-selling 30% and bottom-selling 30% aspositive and negative examples, respectively. Our textual featureswere selected using these dichotomized data.
In order to evaluate mixed-effects regression models on thesedata, we consider the vendor selling an item as its “brand identifier”(vendors have unique branding on the Rakuten platform). We alsoneed to know what product each item corresponds to, somethingnot present in the data. Thus, we hand-labeled 2,131 items withproduct identifiers and separated these into a separate dataset fortesting (Table 2). Our experimental results are reported on this testdata set.
Table 1: Characteristics of the Rakuten data. These data con-sist of 93,591 product descriptions, vendors, prices, and salesfigures.
Chocolate Health
# items 32,104 61,487# vendors 1,373 1,533# morph tokens 5,237,277 11,544,145# BPE tokens 6,581,490 16,706,646# morph vocab (%) 18,807 (0.36%) 20,669 (0.18%)# BPE vocab (%) 16,000 (0.24%) 16,000 (0.10%)
Table 2: Characteristics of the test data. Product identifierswere manually assigned to these data for evaluation.
Chocolate Health
# items 924 1207# products 186 50# vendors 201 384avg. # items per product 4 9(min, max) (2, 26) (2, 134)
3.2 Experimental ProtocolAll deep learning models were implemented using the Tensor-flow framework [1]. In order to obtain features from the proposedRNN+GF model, we conducted a brief hyperparameter search on aheld-out development set. This set consisted of of 2,000 examplesrandomly drawn from the pool of training data. The final modelused 32-dimensional word vectors, an LSTM with 64-dimensional4Using https://github.com/google/sentencepiece
hidden states, and 32-dimensional intermediate Bahdanau vectorsas described in Figure 1. Dropout at a rate of 0.2 was applied to theinput of each LSTM cell. We optimized using Adam, a batch sizeof 128, and a learning rate of 0.0001 [30]. All models took approx-imately three hours to reach convergence on a Nvidia TITAN XGPU.
The L1 regularization parameter α was obtained with the scikit-learn library [45] by minimizing the error in the four-fold crossvalidation on training set.
In all of our experiments, we analyzed the log(sales) of an itemas a function of textual description features. We used mixed-effectsregression to model the relationship between these two entities.We included linguistic features obtained by the methods of Section2.2 and 2.3 as fixed effect variables, and the confounding prod-uct/vendor identifiers in the test set as random effect variables. Weused the “lme4” package in the R software environment v. 3.3.3to perform these analyses [6]. To evaluate feature effectivenessand goodness of fit, we obtained conditional and marginal R2 val-ues with the “MuMIn” R package [5]. We also performed t-teststo obtain significance measurements on the model’s fitted parame-ters. For this we obtained degrees of freedom with Satterthwaiteapproximations [46] with the “lmerTest” R package[32].
In addition to keywords, we experimented with two additionaltypes of features: description length in number of keywords andpart-of-speech tags obtained with JUMAN.
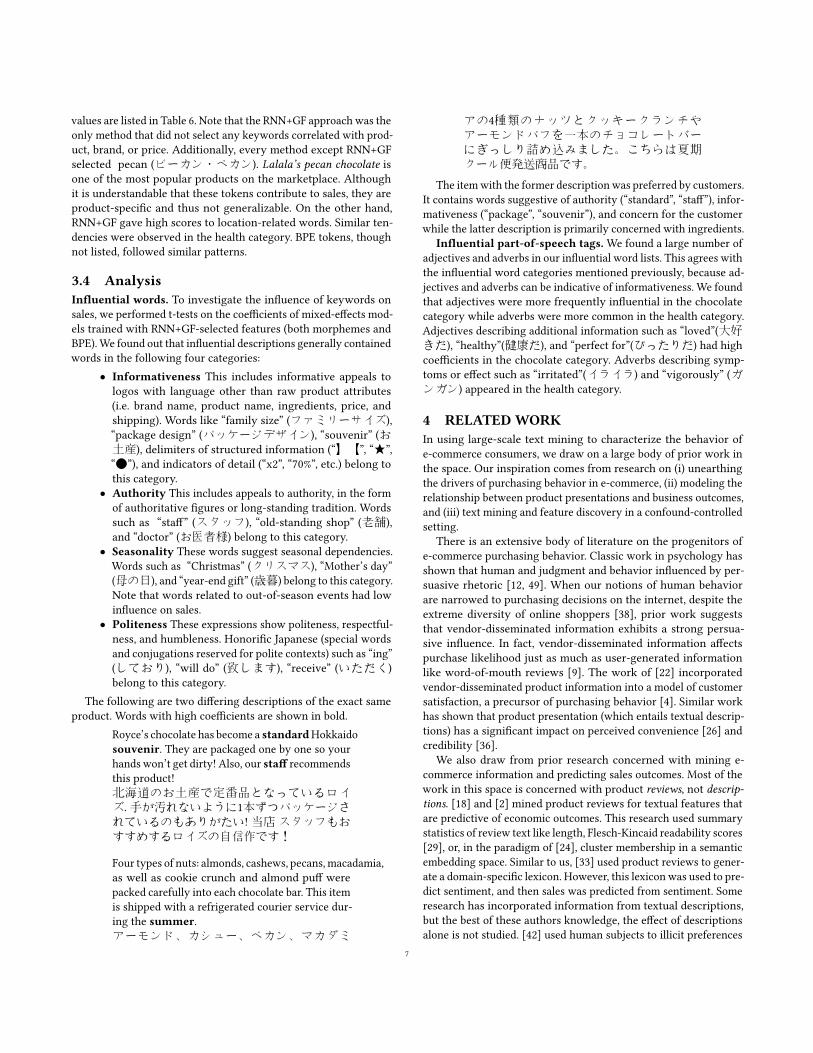
3.3 Experimental ResultsInfluence of narratives. Figure 2 depicts the performance ofmixed-effects regression models fitted with the top 500 featuresfrom each approach. Overall, these results strongly support thehypothesis that narrative elements of product descriptions are pre-dictive of consumer behavior. Adding text features to the modelincreased its explanatory power in all settings. ThemarginalR2m ’s ofeach approach are listed on Table 3. The RNN+GF method selectedfeatures superior in both marginal and conditional R2. This impliesthat it could select features that perform well in both isolated andconfound-combined settings.
To investigate whether the high performance of RNN+GF fea-tures is simply a phenomenon of model capacity, we comparedRNN+GF and one of the best-performing baselines, that of the lasso.We varied the number of features each algorithm is allowed toselect and compared the resulting conditional R2 values, findingthat RNN+GF features are consistently on-par with or outperformthat of the lasso, regardless of feature count as shown in Figure 3.
Effect of gradient reversal To determine the role of gradientreversal in the efficacy of the RNN+GF features, we conductedan ablation test, toggling the gradient reversal layer of our modeland observing the performance of the elicited features. From Ta-ble 4, it is apparent that the confound-invariant representationsencouraged by gradient reversal lead to more effective featuresbeing selected. Apart from summary statistics, this observationcan be seen in the features themselves. For example, one of thehighest scoring morphemes without gradient reversal was無料
5
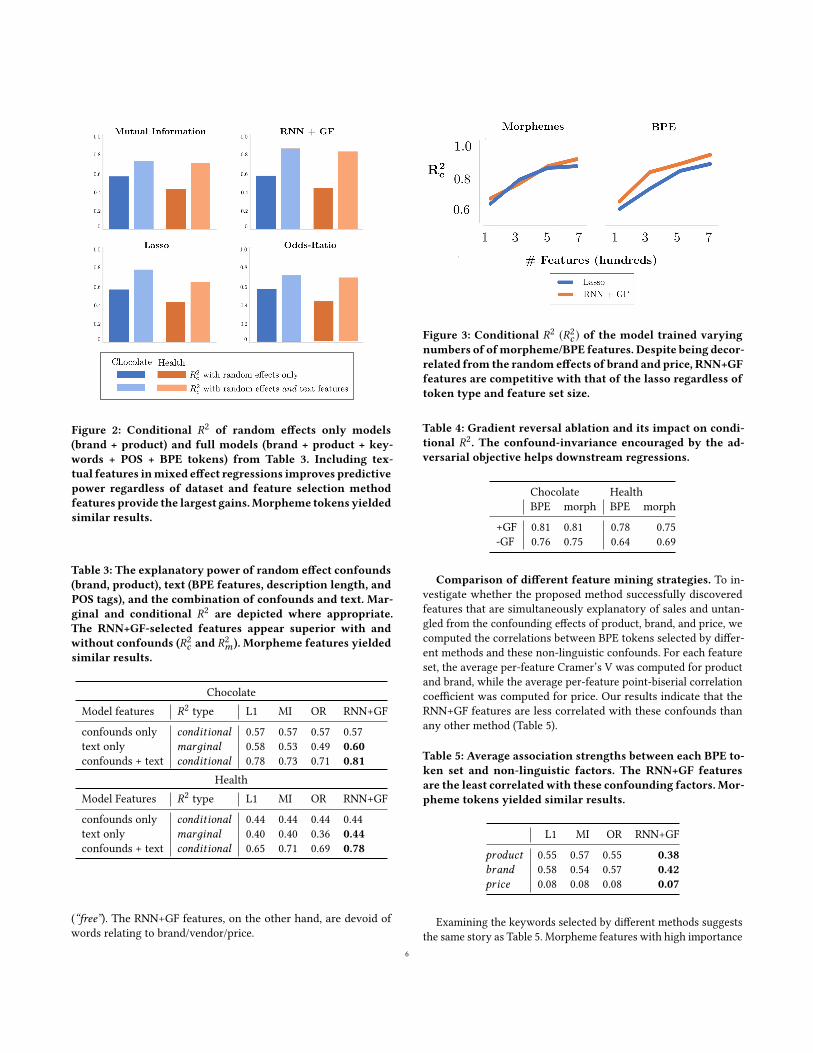
Figure 2: Conditional R2 of random effects only models(brand + product) and full models (brand + product + key-words + POS + BPE tokens) from Table 3. Including tex-tual features inmixed effect regressions improves predictivepower regardless of dataset and feature selection methodfeatures provide the largest gains.Morpheme tokens yieldedsimilar results.
Table 3: The explanatory power of random effect confounds(brand, product), text (BPE features, description length, andPOS tags), and the combination of confounds and text. Mar-ginal and conditional R2 are depicted where appropriate.The RNN+GF-selected features appear superior with andwithout confounds (R2c and R2m ). Morpheme features yieldedsimilar results.
ChocolateModel features R2 type L1 MI OR RNN+GF
confounds only conditional 0.57 0.57 0.57 0.57text only marдinal 0.58 0.53 0.49 0.60confounds + text conditional 0.78 0.73 0.71 0.81
HealthModel Features R2 type L1 MI OR RNN+GF
confounds only conditional 0.44 0.44 0.44 0.44text only marдinal 0.40 0.40 0.36 0.44confounds + text conditional 0.65 0.71 0.69 0.78
(“free”). The RNN+GF features, on the other hand, are devoid ofwords relating to brand/vendor/price.
Figure 3: Conditional R2 (R2c ) of the model trained varyingnumbers of ofmorpheme/BPE features. Despite being decor-related from the randomeffects of brand and price, RNN+GFfeatures are competitive with that of the lasso regardless oftoken type and feature set size.
Table 4: Gradient reversal ablation and its impact on condi-tional R2. The confound-invariance encouraged by the ad-versarial objective helps downstream regressions.
Chocolate HealthBPE morph BPE morph
+GF 0.81 0.81 0.78 0.75-GF 0.76 0.75 0.64 0.69
Comparison of different feature mining strategies. To in-vestigate whether the proposed method successfully discoveredfeatures that are simultaneously explanatory of sales and untan-gled from the confounding effects of product, brand, and price, wecomputed the correlations between BPE tokens selected by differ-ent methods and these non-linguistic confounds. For each featureset, the average per-feature Cramer’s V was computed for productand brand, while the average per-feature point-biserial correlationcoefficient was computed for price. Our results indicate that theRNN+GF features are less correlated with these confounds thanany other method (Table 5).
Table 5: Average association strengths between each BPE to-ken set and non-linguistic factors. The RNN+GF featuresare the least correlatedwith these confounding factors. Mor-pheme tokens yielded similar results.
L1 MI OR RNN+GF
product 0.55 0.57 0.55 0.38brand 0.58 0.54 0.57 0.42price 0.08 0.08 0.08 0.07
Examining the keywords selected by different methods suggeststhe same story as Table 5. Morpheme features with high importance
6
values are listed in Table 6. Note that the RNN+GF approach was theonly method that did not select any keywords correlated with prod-uct, brand, or price. Additionally, every method except RNN+GFselected pecan (ピーカン・ペカン). Lalala’s pecan chocolate isone of the most popular products on the marketplace. Althoughit is understandable that these tokens contribute to sales, they areproduct-specific and thus not generalizable. On the other hand,RNN+GF gave high scores to location-related words. Similar ten-dencies were observed in the health category. BPE tokens, thoughnot listed, followed similar patterns.
3.4 AnalysisInfluential words. To investigate the influence of keywords onsales, we performed t-tests on the coefficients of mixed-effects mod-els trained with RNN+GF-selected features (both morphemes andBPE).We found out that influential descriptions generally containedwords in the following four categories:
• Informativeness This includes informative appeals tologos with language other than raw product attributes(i.e. brand name, product name, ingredients, price, andshipping). Words like “family size” (ファミリーサイズ),“package design” (パッケージデザイン), “souvenir” (お土産), delimiters of structured information (“】【”, “★”,“●”), and indicators of detail (“x2”, “70%”, etc.) belong tothis category.
• Authority This includes appeals to authority, in the formof authoritative figures or long-standing tradition. Wordssuch as “staff” (スタッフ), “old-standing shop” (老舗),and “doctor” (お医者様) belong to this category.
• Seasonality These words suggest seasonal dependencies.Words such as “Christmas” (クリスマス), “Mother’s day”(母の日), and “year-end gift” (歳暮) belong to this category.Note that words related to out-of-season events had lowinfluence on sales.
• Politeness These expressions show politeness, respectful-ness, and humbleness. Honorific Japanese (special wordsand conjugations reserved for polite contexts) such as “ing”(しており), “will do” (致します), “receive” (いただく)belong to this category.
The following are two differing descriptions of the exact sameproduct. Words with high coefficients are shown in bold.
Royce’s chocolate has become a standardHokkaidosouvenir. They are packaged one by one so yourhands won’t get dirty! Also, our staff recommendsthis product!北海道のお土産で定番品となっているロイズ.手が汚れないように1本ずつパッケージされているのもありがたい!当店スタッフもおすすめするロイズの自信作です!
Four types of nuts: almonds, cashews, pecans, macadamia,as well as cookie crunch and almond puff werepacked carefully into each chocolate bar. This itemis shipped with a refrigerated courier service dur-ing the summer.アーモンド、カシュー、ペカン、マカダミ
アの4種類のナッツとクッキークランチやアーモンドパフを一本のチョコレートバーにぎっしり詰め込みました。こちらは夏期クール便発送商品です。
The itemwith the former description was preferred by customers.It contains words suggestive of authority (“standard”, “staff”), infor-mativeness (“package”, “souvenir”), and concern for the customerwhile the latter description is primarily concerned with ingredients.
Influential part-of-speech tags. We found a large number ofadjectives and adverbs in our influential word lists. This agrees withthe influential word categories mentioned previously, because ad-jectives and adverbs can be indicative of informativeness. We foundthat adjectives were more frequently influential in the chocolatecategory while adverbs were more common in the health category.Adjectives describing additional information such as “loved”(大好きだ), “healthy”(健康だ), and “perfect for”(ぴったりだ) had highcoefficients in the chocolate category. Adverbs describing symp-toms or effect such as “irritated”(イライラ) and “vigorously” (ガンガン) appeared in the health category.
4 RELATEDWORKIn using large-scale text mining to characterize the behavior ofe-commerce consumers, we draw on a large body of prior work inthe space. Our inspiration comes from research on (i) unearthingthe drivers of purchasing behavior in e-commerce, (ii) modeling therelationship between product presentations and business outcomes,and (iii) text mining and feature discovery in a confound-controlledsetting.
There is an extensive body of literature on the progenitors ofe-commerce purchasing behavior. Classic work in psychology hasshown that human and judgment and behavior influenced by per-suasive rhetoric [12, 49]. When our notions of human behaviorare narrowed to purchasing decisions on the internet, despite theextreme diversity of online shoppers [38], prior work suggeststhat vendor-disseminated information exhibits a strong persua-sive influence. In fact, vendor-disseminated information affectspurchase likelihood just as much as user-generated informationlike word-of-mouth reviews [9]. The work of [22] incorporatedvendor-disseminated product information into a model of customersatisfaction, a precursor of purchasing behavior [4]. Similar workhas shown that product presentation (which entails textual descrip-tions) has a significant impact on perceived convenience [26] andcredibility [36].
We also draw from prior research concerned with mining e-commerce information and predicting sales outcomes. Most of thework in this space is concerned with product reviews, not descrip-tions. [18] and [2] mined product reviews for textual features thatare predictive of economic outcomes. This research used summarystatistics of review text like length, Flesch-Kincaid readability scores[29], or, in the paradigm of [24], cluster membership in a semanticembedding space. Similar to us, [33] used product reviews to gener-ate a domain-specific lexicon. However, this lexicon was used to pre-dict sentiment, and then sales was predicted from sentiment. Someresearch has incorporated information from textual descriptions,but the best of these authors knowledge, the effect of descriptionsalone is not studied. [42] used human subjects to illicit preferences
7

Table 6: The highest-scoring morpheme tokens according to each feature selection algorithm. Tokens relating to confoundslike brand, vendor or price are denoted with an asterisk. RNN+GF is the only method that avoided such tokens.
Chocolate
Lasso Mutual Information Odds-ratio RNN+GF
*小川 (vendor address) 高温 (hot) ペカン (pecan) 神戸 (kobe)*商店 (vendor name) 株式 (Co. Ltd) 百貨店 (store dept.) 説明 (description)送信 (send) 詳細だ (detailed) ピーカン (pecan) フランス (france)さまざまだ (various) *ロイズコンフェクト (name) 新宿 (shinjuku) オーストラリア (australia)*有料 (charge) *ロイズ (brand name) 名人 (master) タイ (thailand)ショ糖 (sucrose) 温度 (temperature) 玉露 (gyokuro) イタリア (italy)同時に (simultaneous) 以下 (under) *ラララ (product name) 老舗 (long-standing shop)制限 (limit) セット (set) 伴う (come along) ハワイ (hawaii)*買い得 (bargain) 常温 (room temp.) 会議 (award name) ミルキー (milky)ピーカン (pecan) 保存 (preserve) 会頭 (award name) 蒜山 (hiruzen)
Health
Lasso Mutual Information Odds-ratio RNN+GF
倍数 (bulk unit) 消費 (consumption) *アウトレット (discount outlet) ダイエット (weight loss)ビック (big) *爽快 (vendor name) アラゴナイト (aragonite) 確認 (confirmation)*淀川 (vendor address) 見る (see) ソマチット (somatid) オレンジ (orange)*アウトレット (discount outlet) ブラウザ (brower) ダントツ (the very best) 予告 (notice)*爽快 (vendor name) 相談 (consult) *アース (brand name) 商品 (product)支店 (branch) 形状 (shape) *コリー (product name) 注文 (order)地区 (district) 対応 (support) 筋骨 (bones) 入金 (payment)鹿児島 (kagoshima) ネット (internet) ランナー (runner) サプリ (supplement)*スカルプ (product name) 取り寄せる (stock) *ガレノス (brand name) 説明 (explanation)くだもの (fruit) 合す (mix) 内外 (inside and outside) ます (is (formal))
between descriptions and actual products, but did not comparebetween descriptions. [53] tagged product descriptions with senti-ment information and used this alongside review information topredict sales. Similarly, [21] and [54] used description labellings andsummary statistics alongside other features to predict purchasingintent. Importantly, none of the prior work in this space seeks tountangle the influence of confounding hidden variables (e.g. brandloyalty, pricing strategies) from mined features.
Another body of research we draw from is that concerned withtext mining and lexicon discovery in a confound-controlled setting.Using odds ratios to select features and hierarchical regression todetermine their importance is a canonical technique in the compu-tational linguistics literature [19, 28]. In general, alternative featuremining methods for downstream regression or classification tasksare rarely explored. [50] began with a set of hand-compiled corpora,then ran t-tests to prune these corpora of insignificant keywords.[43] developed a neural architecture that picks out keywords froma passage. However, this group did not use an attention mechanismto pick these words, and the model was developed for summariza-tion applications. In the e-commerce literature, work alternativesto odds-ratio still rely on uncontrolled co-occurrence statistics [35].
5 CONCLUSIONIn this paper, we discovered that that seasonal, polite, authorita-tive and informative product descriptions led to the best businessoutcomes in Japanese e-commerce.
In making these observations, we presented a statistical methodthat infers consumer demand from e-commerce product descrip-tions. We showed for the first time that words in the embeddednarratives of product descriptions are important determinants ofsales, even when accounting for the influence of factors like brandloyalty and item identity.
In the process, we noted the inadequacies of traditional textfeature-selection algorithms, namely their ability to select featuresthat are decorrelated from these factors. To this end we presenteda novel neural network feature selection method. The featuresgenerated by this model are both high-performance and confound-decorrelated.
There are many directions for future work. These include extend-ing our feature selectors to the broader setting of generalized lexi-con induction, and applying our statistical models to e-commercemarkets in other consumer cultures.
ACKNOWLEDGMENTSWe are grateful to David Jurgens andWill Hamilton for their advice.
8
REFERENCES[1] Martín Abadi, Ashish Agarwal, Paul Barham, Eugene Brevdo, Zhifeng Chen,
Craig Citro, Greg S Corrado, Andy Davis, Jeffrey Dean, Matthieu Devin, andothers. 2016. Tensorflow: Large-scale machine learning on heterogeneous dis-tributed systems. arXiv preprint arXiv:1603.04467 (2016).
[2] Nikolay Archak, Anindya Ghose, and Panagiotis G Ipeirotis. 2011. Deriving thepricing power of product features by mining consumer reviews. ManagementScience 57, 8 (2011), 1485–1509.
[3] Dzmitry Bahdanau, Kyunghyun Cho, and Yoshua Bengio. 2015. Neural machinetranslation by jointly learning to align and translate. International Conference onLearning Representations (ICLR) (2015).
[4] Billy Bai, Rob Law, and Ivan Wen. 2008. The impact of website quality oncustomer satisfaction and purchase intentions: Evidence from Chinese onlinevisitors. International journal of hospitality management 27, 3 (2008), 391–402.
[5] Kamil Bartoń. 2013. MuMIn: Multi-model inference. R package version 1.9. 13.The Comprehensive R Archive Network (CRAN), Vienna, Austria (2013).
[6] Douglas Bates, Martin Mächler, Ben Bolker, and Steve Walker. 2015. FittingLinear Mixed-Effects Models Using lme4. Journal of Statistical Software 67, 1(2015), 1–48.
[7] Douglas M Bates. 2010. lme4: Mixed-effects modeling with R. (2010).[8] Shai Ben-David, John Blitzer, Koby Crammer, Fernando Pereira, and others.
2007. Analysis of representations for domain adaptation. Advances in neuralinformation processing systems 19 (2007), 137.
[9] Barbara Bickart and Robert M Schindler. 2001. Internet forums as influentialsources of consumer information. Journal of interactive marketing 15, 3 (2001),31–40.
[10] J Martin Bland and Douglas G Altman. 2000. The odds ratio. Bmj 320, 7247(2000), 1468.
[11] Denny Britz, Anna Goldie, Thang Luong, and Quoc Le. 2017. Massive Explorationof Neural Machine Translation Architectures. arXiv preprint arXiv:1703.03906(2017).
[12] Shelly Chaiken, Mark P Zanna, James M Olson, and C Peter Herman. 1987. Theheuristic model of persuasion. In Social influence: the ontario symposium, Vol. 5.Hillsdale, NJ: Lawrence Erlbaum, 3–39.
[13] Judith A Chevalier and Dina Mayzlin. 2006. The effect of word of mouth on sales:Online book reviews. Journal of marketing research 43, 3 (2006), 345–354.
[14] Jeffrey L Elman. 1990. Finding structure in time. Cognitive science 14, 2 (1990),179–211.
[15] Richard Friberg, Mattias Ganslandt, and Mikael Sandström. 2001. Pricing strate-gies in e-commerce: Bricks vs. clicks. Technical Report. IUI working paper.
[16] Yaroslav Ganin, Evgeniya Ustinova, Hana Ajakan, Pascal Germain, HugoLarochelle, François Laviolette, Mario Marchand, and Victor Lempitsky. 2016.Domain-adversarial training of neural networks. Journal of Machine LearningResearch 17, 59 (2016), 1–35.
[17] David Gefen. 2002. Customer loyalty in e-commerce. Journal of the associationfor information systems 3, 1 (2002), 2.
[18] Anindya Ghose and Panagiotis G Ipeirotis. 2011. Estimating the helpfulness andeconomic impact of product reviews: Mining text and reviewer characteristics.IEEE Transactions on Knowledge and Data Engineering 23, 10 (2011), 1498–1512.
[19] Anindya Ghose and Arun Sundararajan. 2006. Evaluating pricing strategy usinge-commerce data: Evidence and estimation challenges. Statist. Sci. (2006), 131–142.
[20] David Godes and Dina Mayzlin. 2004. Using online conversations to studyword-of-mouth communication. Marketing science 23, 4 (2004), 545–560.
[21] Dennis Herhausen, Jochen Binder, Marcus Schoegel, and Andreas Herrmann.2015. Integrating bricks with clicks: retailer-level and channel-level outcomes ofonline–offline channel integration. Journal of Retailing 91, 2 (2015), 309–325.
[22] Chin-Fu Ho and Wen-Hsiung Wu. 1999. Antecedents of customer satisfactionon the Internet: an empirical study of online shopping. In Systems Sciences, 1999.HICSS-32. Proceedings of the 32nd Annual Hawaii International Conference on.IEEE, 9–pp.
[23] SeppHochreiter and Jürgen Schmidhuber. 1997. Long short-termmemory. Neuralcomputation 9, 8 (1997), 1735–1780.
[24] Minqing Hu and Bing Liu. 2004. Mining and summarizing customer reviews.In Proceedings of the tenth ACM SIGKDD international conference on Knowledgediscovery and data mining. ACM, 168–177.
[25] Nan Hu, Jie Zhang, and Paul A Pavlou. 2009. Overcoming the J-shaped distribu-tion of product reviews. Commun. ACM 52, 10 (2009), 144–147.
[26] Ling Jiang, Zhilin Yang, and Minjoon Jun. 2013. Measuring consumer perceptionsof online shopping convenience. Journal of Service Management 24, 2 (2013),191–214.
[27] Fredrik D. Johansson, Uri Shalit, and David Sontag. 2016. Learning Representa-tions for Counterfactual Inference. In Proceedings of the 33rd International Con-ference on International Conference on Machine Learning - Volume 48 (ICML’16).JMLR.org, 3020–3029.
[28] Dan Jurafsky, Victor Chahuneau, Bryan R Routledge, and Noah A Smith. 2014.Narrative framing of consumer sentiment in online restaurant reviews. First
Monday 19, 4 (2014).[29] J Peter Kincaid, Robert P Fishburne Jr, Richard L Rogers, and Brad S Chissom.
1975. Derivation of new readability formulas (automated readability index, fogcount and flesch reading ease formula) for navy enlisted personnel. TechnicalReport. DTIC Document.
[30] Diederik Kingma and Jimmy Ba. 2014. Adam: A method for stochastic optimiza-tion. International Conference for Learning Representations (2014).
[31] Ryan Kiros, Ruslan Salakhutdinov, and Richard S Zemel. 2014. Unifying visual-semantic embeddings with multimodal neural language models. arXiv preprintarXiv:1411.2539 (2014).
[32] Alexandra Kuznetsova, Per Bruun Brockhoff, and Rune Haubo Bojesen Chris-tensen. 2015. Package ‘lmerTest’. R package version 2 (2015).
[33] Raymond YK Lau, Wenping Zhang, Peter D Bruza, and Kam-Fai Wong. 2011.Learning domain-specific sentiment lexicons for predicting product sales. Ine-Business Engineering (ICEBE), 2011 IEEE 8th International Conference on. IEEE,131–138.
[34] Eun-Ju Lee and Soo Yun Shin. 2014. When do consumers buy online productreviews? Effects of review quality, product type, and reviewer’s photo. Computersin Human Behavior 31 (2014), 356–366.
[35] Thomas Lee and Eric T Bradlow. 2007. Automatic construction of conjointattributes and levels from online customer reviews. University Of Pennsylvania,The Wharton School Working Paper (2007).
[36] Ziqi Liao and Michael Tow Cheung. 2001. Internet-based e-shopping and con-sumer attitudes: an empirical study. Information & management 38, 5 (2001),299–306.
[37] Moez Limayem, Mohamed Khalifa, and Anissa Frini. 2000. What makes con-sumers buy from Internet? A longitudinal study of online shopping. IEEE Trans-actions on Systems, Man, and Cybernetics-Part A: Systems and Humans 30, 4 (2000),421–432.
[38] Ying Liu, Hong Li, Geng Peng, Benfu Lv, and Chong Zhang. 2015. Onlinepurchaser segmentation and promotion strategy selection: evidence fromChineseE-commerce market. Annals of Operations Research 233, 1 (2015), 263–279.
[39] Gerald L Lohse and Peter Spiller. 1998. Quantifying the effect of user interfacedesign features on cyberstore traffic and sales. In Proceedings of the SIGCHIconference on Human factors in computing systems. ACM Press/Addison-WesleyPublishing Co., 211–218.
[40] Daniel Lowd and Christopher Meek. 2005. Adversarial learning. In Proceedingsof the eleventh ACM SIGKDD international conference on Knowledge discovery indata mining. ACM, 641–647.
[41] Christopher D Manning, Hinrich Schütze, and others. 1999. Foundations ofstatistical natural language processing. Vol. 999. MIT Press.
[42] Deborah Brown McCabe and Stephen M Nowlis. 2003. The effect of examiningactual products or product descriptions on consumer preference. Journal ofConsumer Psychology 13, 4 (2003), 431–439.
[43] Rui Meng, Sanqiang Zhao, Shuguang Han, Daqing He, Peter Brusilovsky, and YuChi. 2017. Deep Keyphrase Generation. Annual Meeting of the Association forComputational Linguistics (2017).
[44] Shinichi Nakagawa and Holger Schielzeth. 2013. A general and simple method forobtaining R2 from generalized linear mixed-effects models. Methods in Ecologyand Evolution 4, 2 (2013), 133–142.
[45] F. Pedregosa, G. Varoquaux, A. Gramfort, V. Michel, B. Thirion, O. Grisel, M.Blondel, P. Prettenhofer, R. Weiss, V. Dubourg, J. Vanderplas, A. Passos, D. Cour-napeau, M. Brucher, M. Perrot, and E. Duchesnay. 2011. Scikit-learn: MachineLearning in Python. Journal of Machine Learning Research 12 (2011), 2825–2830.
[46] Franklin E Satterthwaite. 1946. An approximate distribution of estimates ofvariance components. Biometrics bulletin 2, 6 (1946), 110–114.
[47] Rico Sennrich, Barry Haddow, and Alexandra Birch. 2016. Neural MachineTranslation of Rare Words with Subword Units. In Proceedings of the 54th AnnualMeeting of the Association for Computational Linguistics, ACL 2016, August 7-12,2016, Berlin, Germany.
[48] Srini S Srinivasan, Rolph Anderson, and Kishore Ponnavolu. 2002. Customerloyalty in e-commerce: an exploration of its antecedents and consequences.Journal of retailing 78, 1 (2002), 41–50.
[49] Brian Sternthal, Ruby Dholakia, and Clark Leavitt. 1978. The persuasive effectof source credibility: Tests of cognitive response. Journal of Consumer research 4,4 (1978), 252–260.
[50] Chenhao Tan, Lillian Lee, and Bo Pang. 2014. The effect of wording on messagepropagation: Topic-and author-controlled natural experiments on Twitter. InProceedings of the 52nd Annual Meeting of the Association for ComputationalLinguistics. ACL, Baltimore, Maryland, 175–185.
[51] Robert Tibshirani. 1996. Regression shrinkage and selection via the lasso. Journalof the Royal Statistical Society. Series B (Methodological) (1996), 267–288.
[52] Lou W Turley and Ronald E Milliman. 2000. Atmospheric effects on shoppingbehavior: a review of the experimental evidence. Journal of business research 49,2 (2000), 193–211.
[53] Hui Yuan, Wei Xu, Qian Li, and Raymond Lau. 2017. Topic sentiment miningfor sales performance prediction in e-commerce. Annals of Operations Research
9

(2017), 1–24.[54] Cai-Nicolas Ziegler, Lars Schmidt-Thieme, and Georg Lausen. 2004. Exploiting
semantic product descriptions for recommender systems. In Proceedings of the2nd ACM SIGIR Semantic Web and Information Retrieval Workshop. 25–29.
10


![Predicting Sales from the Language of Product Descriptionsrpryzant/data/papers/ecommerce_2017.pdf · effects of pricing strategies [15], brand loyalty [17, 48], and product identity](https://img.pdfslide.net/doc/110x75/5f67730de7f7cf79bf3ca38e/predicting-sales-from-the-language-of-product-descriptions-rpryzantdatapapersecommerce2017pdf.jpg)