Embed Size (px)
Citation preview

Predicting Segmentation Accuracy for BiologicalCell Images
Adele P. Peskin1, Alden A. Dima2, Joe Chalfoun2, and John T. Elliot2
1 NIST, Boulder, CO 803052 NIST, Gaithersburg, MD 20899
Abstract. We have performed segmentation procedures on a large num-ber of images from two mammalian cell lines that were seeded at lowdensity, in order to study trends in the segmentation results and makepredictions about cellular features that affect segmentation accuracy. Bycomparing segmentation results from approximately 40000 cells, we finda linear relationship between the highest segmentation accuracy seen fora given cell and the fraction of pixels in the neighborhood of the edge ofthat cell. This fraction of pixels is at greatest risk for error when cells aresegmented. We call the ratio of the size of this pixel fraction to the sizeof the cell the extended edge neighborhood and this metric can predictsegmentation accuracy of any isolated cell.
1 Introduction
Cell microscopy is being used extensively to monitor cellular behavior under ex-perimental settings. The common use of CCD cameras and the availability ofmicroscopes with excellent optics, light sources, and automated stages and filterwheels allows collection of quantitative multiparameter image sets of large num-bers of cells [1]. When combined with image analysis procedures, these image setscan provide several measurements of cellular behavior under the experimentalconditions.
One of the most common image analysis procedures for cellular images issegmentation of an image object from the remainder of the image. For example,for images of cells stained with a fluorescent dye that covalently attaches tocellular proteins [2], segmentation procedures can be used to identify image pixelsthat are associated with the cell and separate them from the background. Theresults of this type of segmentation on images of cells that are at low density(i.e. minimal cell-cell contact) can be used to generate metrics such as spreadingarea, cell shape, and edge perimeter and provide high quality information aboutthe morphological shape of the cells. This information is characteristic of cellphenotype or state and provides measurements that can be used to compareexperimental conditions [3].
0 This contribution of NIST, an agency of the U.S. government, is not subject tocopyright.

2 Adele P. Peskin, Alden A. Dima, Joe Chalfoun, and John T. Elliot
There is extensive literature on procedures used to segment whole cells. De-pending on the properties of the imaged cells, automated segmentation algo-rithms can provide differential results even when applied to the same image.New sophisticated algorithms such as level sets and active contours can segmentparticular cell features, but they are not necessarily readily available for conven-tional users of image analysis software. Automated segmentation routines basedon histogram analysis or simple gradient-based edge detection routines are morecommon in most image analysis software. Although these methods can provideappropriate cell segmentation under many conditions, these segmentation rou-tines often fail to adequately segment certain cells. In this study, we segmenteda large number of cells from cellular images with various algorithms to identifywhat features in a cell object can influence segmentation outcome for a particu-lar cell. A metric that evaluates the staining properties at the edge of a cell wasdeveloped to score the cell edge properties. This metric, called the edge neigh-borhood fraction, was found to be predictive of segmentation accuracy underseveral experimental conditions.
Because image segmentation is critical to biological image analysis, manysegmentation methods have been published, including histogram-based, edge-detection-based, watershed, morphological, and stochastic techniques [4]. Thereare few examples of systematic comparisons of image analysis algorithms for cellimage data; these include a comparison of cell shape analysis, a recent reportcomparing segmentation algorithms [5] and a study on predicting confidencelimits in segmentation of cells [6]. An ongoing study in our group comparesnine different segmentation techniques to manually segmented cells on a smallnumber of cell images [7]. The study presented here evaluates cells from imagesof two different cell lines under five different sets of imaging conditions. Overall,we evaluated over 40000 cells from both NIH3T3 fibroblast and A10 smoothmuscle cells in 9000 images. The 40000 cells represent 4 replicate wells of each of2000 unique cells imaged under five different settings which varied edge quality. Astudy on this scale was large enough to produce statistically reliable results aboutthe accuracy of the segmentation methods evaluated here and form predictiveinformation for individual cells in different cell lines over a range of representativeimaging conditions.
2 Data description
The data used in this study examine two cell lines and five imaging conditions.These images consist of A10 rat smooth vascular muscle cells and NIH3T3 mousefibroblasts stained with a fluorescent Texas Red-C2-maleimide cell body stain[2]. The overall geometric shape of the cell lines differ. A10 cells are well spreadlarge cells. NIH3T3 cells are smaller fibroblasts with a spindly shape. The fiveimaging conditions varied in both the exposure time and the filter settings. Thesesettings resulted in varying the line per mm resolution and the signal to noiseratio. Multiple cells are present on most images.

Predicting Segmentation Accuracy for Biological Cell Images 3
Both cell lines were maintained as previously described [8]. Cells were seededat 1200 (NIH3T3) or 800 (A10) cells/cm2, in 6 well tissue culture PS platesand incubated overnight. The cells were fixed with 1% PFA in PBS, and stainedwith Texas-Red maleimide and DAPI as previously described [2]. Images of thestained cells were collected with an Zeiss automated microscope with automatedfilter wheels controlled by Axiovision software. For optimal filter conditions,the stained cells were visualized with a Texas Red filter set (Chroma Technol-ogy, Excitation 555/28, #32295; dichroic beamsplitter #84000; Emission 630/60,#41834). For non-optimal filter conditions, the cells were imaged with Texas Redexcitation filter (Chroma Technology, Excitation 555/28 filter dichroic beam-splitter #84000; Emission 740lp, #42345). These imaging conditions result inreduced intensity signal to noise ratios and introduce blurring.3 Exposure timeswere selected to use either 1/4, full, or partially saturated dynamic range of theCoolSnap HQ2 camera. The five imaging conditions are summarized in Table 1.
To segment each of the cells and generate reference data that closely mimicshuman drawn segmentations, we used a procedure that was developed basedon the analysis of manual segmentation processes. The procedure is described inreference [9]. This algorithm was applied to images with the highest contrast (i.e.conditions 3, Table 1) and edge pixels were identified as pixels with at least oneneighbor pixel with an intensity less than 0.7 of its adjacent value. This intensitygradient feature has been shown to correlate well with manually selected edgepixels. Figure 1 shows a typical image and the reference data cell masks.
Table 1. The five sets of imaging conditions.
Image Exposure Exposure Filter typetime(s) A10 time(s) NIH3T3
1 0.015 0.01 optimal filter2 0.08 0.05 optimal filter3 0.3 0.15 optimal filter4 1.0 1.0 non-optimal filter5 5.0 5.0 non-optimal filter
3 Extended Edge Neighborhood
The apparent cell edges vary widely in clarity and sharpness across the fivedifferent images of the same cells. In particular, the images vary in terms ofthe number of pixel lengths (distance between pixels) needed to represent the
3 Certain trade names are identified in this report only in order to specify the experi-mental conditions used in obtaining the reported data. Mention of these products inno way constitutes endorsement of them. Other manufacturers may have productsof equal or superior specifications.

4 Adele P. Peskin, Alden A. Dima, Joe Chalfoun, and John T. Elliot
Fig. 1. The outlines in green of masks resulting from our semi-automated method formimicing the manual segmentation process; A close-up of one cell near the bottom ofthe image, with the mask in red and the cell outline in green.
thickness of the edge regions of the cells. We have previously quantified thisthickness with a metric we call the cell edge quality index (QI) [10]. In the nextsection we describe how we find and quantify the fraction of pixels that are atrisk for inaccuracy during a segmentation, using the quality index and the cellgeometry.
In an accompanying paper, we compare manual segmentation masks on aset of 16 of the images used here, with type 3 imaging conditions from Table1. We find that the our manual segmentation sets differ from one another, andthat the extent of misalignment from one set to another depends upon the cellgeometry [7] [9]. We observed that smaller, less round cells were more at riskfor error in the selection. The smaller the cell, the less likely that two peoplehand selecting a mask would pick a large fraction of exactly the same pixels forthe mask: if most of the pixels are near an edge, a cell is more at risk for anykind of segmentation error. In addition to cell size and shape, the gradient of thepixel intensity at the cell edge also plays a large role in determining whether acell image can be segmented properly. We combine these concepts into a singlequantity that can be calculated quickly for each cell. The metric represents thesize of the extended edge neighborhood of pixels and is a fraction derived fromthe ratio of pixels at risk to the total area of the cell. The pixels at risk aredetermined by multiplying the cell perimeter by a factor determined from thequality index (QI), that represents the physical thickness (Th) of the cell edge.
4 Quality Index and Edge Thickness Calculation
For each cell in an image, we evaluate the pixel intensities within an isolatedregion containing the cell and background pixels. The quality index is calculatedas follows [10]:
Predicting Segmentation Accuracy for Biological Cell Images 5
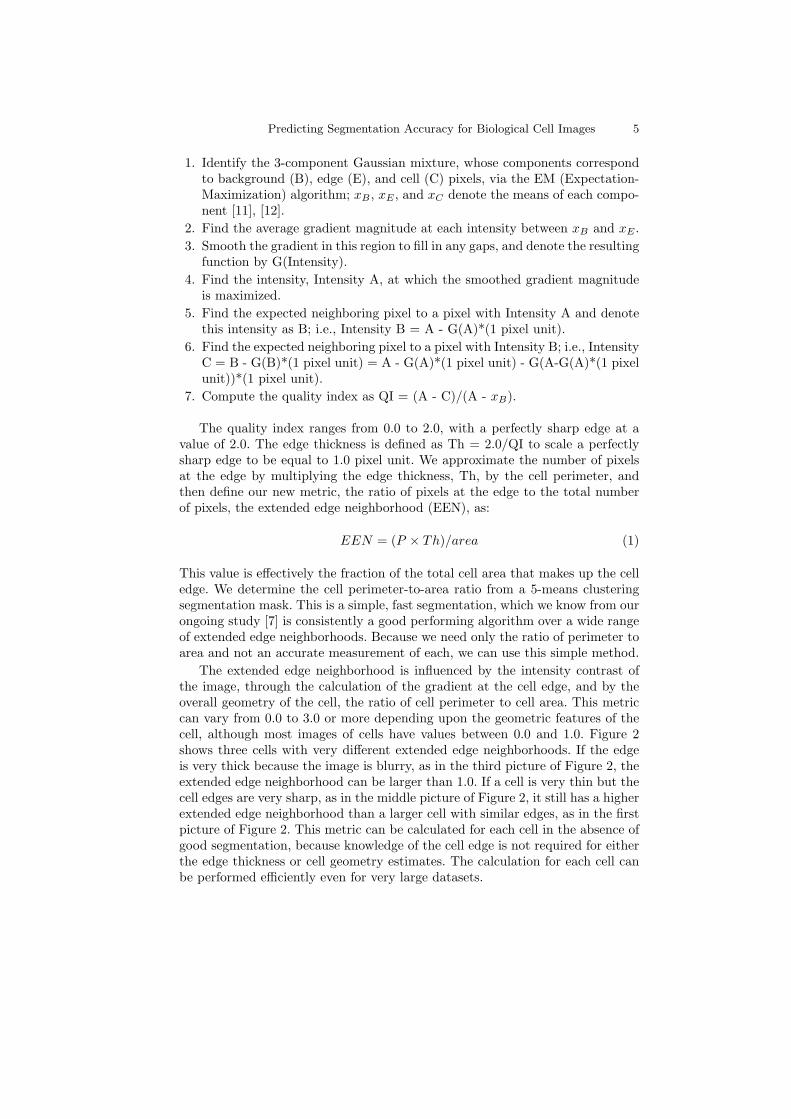
1. Identify the 3-component Gaussian mixture, whose components correspondto background (B), edge (E), and cell (C) pixels, via the EM (Expectation-Maximization) algorithm; xB , xE , and xC denote the means of each compo-nent [11], [12].
2. Find the average gradient magnitude at each intensity between xB and xE .3. Smooth the gradient in this region to fill in any gaps, and denote the resulting
function by G(Intensity).4. Find the intensity, Intensity A, at which the smoothed gradient magnitude
is maximized.5. Find the expected neighboring pixel to a pixel with Intensity A and denote
this intensity as B; i.e., Intensity B = A - G(A)*(1 pixel unit).6. Find the expected neighboring pixel to a pixel with Intensity B; i.e., Intensity
C = B - G(B)*(1 pixel unit) = A - G(A)*(1 pixel unit) - G(A-G(A)*(1 pixelunit))*(1 pixel unit).
7. Compute the quality index as QI = (A - C)/(A - xB).
The quality index ranges from 0.0 to 2.0, with a perfectly sharp edge at avalue of 2.0. The edge thickness is defined as Th = 2.0/QI to scale a perfectlysharp edge to be equal to 1.0 pixel unit. We approximate the number of pixelsat the edge by multiplying the edge thickness, Th, by the cell perimeter, andthen define our new metric, the ratio of pixels at the edge to the total numberof pixels, the extended edge neighborhood (EEN), as:
EEN = (P × Th)/area (1)
This value is effectively the fraction of the total cell area that makes up the celledge. We determine the cell perimeter-to-area ratio from a 5-means clusteringsegmentation mask. This is a simple, fast segmentation, which we know from ourongoing study [7] is consistently a good performing algorithm over a wide rangeof extended edge neighborhoods. Because we need only the ratio of perimeter toarea and not an accurate measurement of each, we can use this simple method.
The extended edge neighborhood is influenced by the intensity contrast ofthe image, through the calculation of the gradient at the cell edge, and by theoverall geometry of the cell, the ratio of cell perimeter to cell area. This metriccan vary from 0.0 to 3.0 or more depending upon the geometric features of thecell, although most images of cells have values between 0.0 and 1.0. Figure 2shows three cells with very different extended edge neighborhoods. If the edgeis very thick because the image is blurry, as in the third picture of Figure 2, theextended edge neighborhood can be larger than 1.0. If a cell is very thin but thecell edges are very sharp, as in the middle picture of Figure 2, it still has a higherextended edge neighborhood than a larger cell with similar edges, as in the firstpicture of Figure 2. This metric can be calculated for each cell in the absence ofgood segmentation, because knowledge of the cell edge is not required for eitherthe edge thickness or cell geometry estimates. The calculation for each cell canbe performed efficiently even for very large datasets.

6 Adele P. Peskin, Alden A. Dima, Joe Chalfoun, and John T. Elliot
Fig. 2. 3 cells are colored according to pixel intensity, with the full range shown dividedinto 40 different colors: a large, round cell with low extended edge neighborhood; asmall, thin cell similar edges but a higher extended edge neighborhood; the same cellbut a blurrier image, where the extended edge neighborhood is greater than 1.0.
5 Testing 40000 Cells
Figure 3 shows a histogram plot of the EEN metric for 40000 cells. It showsthat the A10 cells have lower EEN values on average than the NIH3T3 cells. Todetermine if the extended edge neighborhood metric is predictive of accuracyfor segmentation algorithms, we studied the accuracy of four segmentation algo-rithms that use different methods to identify cell edges as a function of extendededge neighborhood for each cell. The algorithms tested were 3-means clustering,4-means clustering, 5-means clustering, and a Canny edge method. Segmenta-tion masks were generated from the k-means clustering algorithms by assumingthat the cluster with the lowest centroid represents the background and the re-maining clusters belong to the cells. To determine an accuracy metric for eachcell that is segmented by an automated segmentation, we compared the resultsof the algorithm to that of a reference segmentation data set derived with ana computer assisted manual segmentation and expert visual inspection, usingbivariate similarity metrics, previously described in [7] [9]. Definitions of thesemetrics and a justification for their use are summarized in the next section.
6 Bivariate Similarity Index
Various similarity metrics have been used to evaluate segmentation algorithmperformance. The commonly used Jaccard similarity index [13], for example,compares a reference data set, T, with another set of estimates, E, defined by:
S = |T ∩ E|/|T ∪ E|, (2)
where 0.0 ≤ S ≤ 1.0. If an estimate matches the truth, T ∩ E = T ∪ E and S =1. If an algorithm fails, then E = 0 and S = 0. However, S cannot discriminatebetween certain underestimation and overestimation cases. For example, if thetrue area = 1000, then both the underestimated area of 500, and the overesti-mated area of 2000 yield the same value for the similarity index S = 500/1000

Predicting Segmentation Accuracy for Biological Cell Images 7
Fig. 3. Numbers of cells as a function of extended edge neighborhood for the A10 cellsin red, and the NIH3T3 cells in blue.
= 1000/2000 = 0.5. Here we used a set of bivariate similarity indices that candistinguish between underestimation and overestimation.
Fig. 4. Plot of TET vs. TEE for 3,000 A10 cells.
We define these indices as follows, to compare the reference pixel set T, witha segmentation mask, pixel set E:
TET = |T ∩ E|/|T |, 0.0 ≤ TET ≤ 1.0 (3)
TEE = |T ∩ E|/|E|, 0.0 ≤ TEE ≤ 1.0 (4)
Each similarity metric varies between 0 and 1. If the estimate matches the ref-erence mask, both TET and TEE = 1.0. TET and TEE were constructed to beindependent and orthogonal and divides performance into four regions: Dislo-cation: TET and TEE are small; Overestimation: TET is large, TEE is small;
8 Adele P. Peskin, Alden A. Dima, Joe Chalfoun, and John T. Elliot
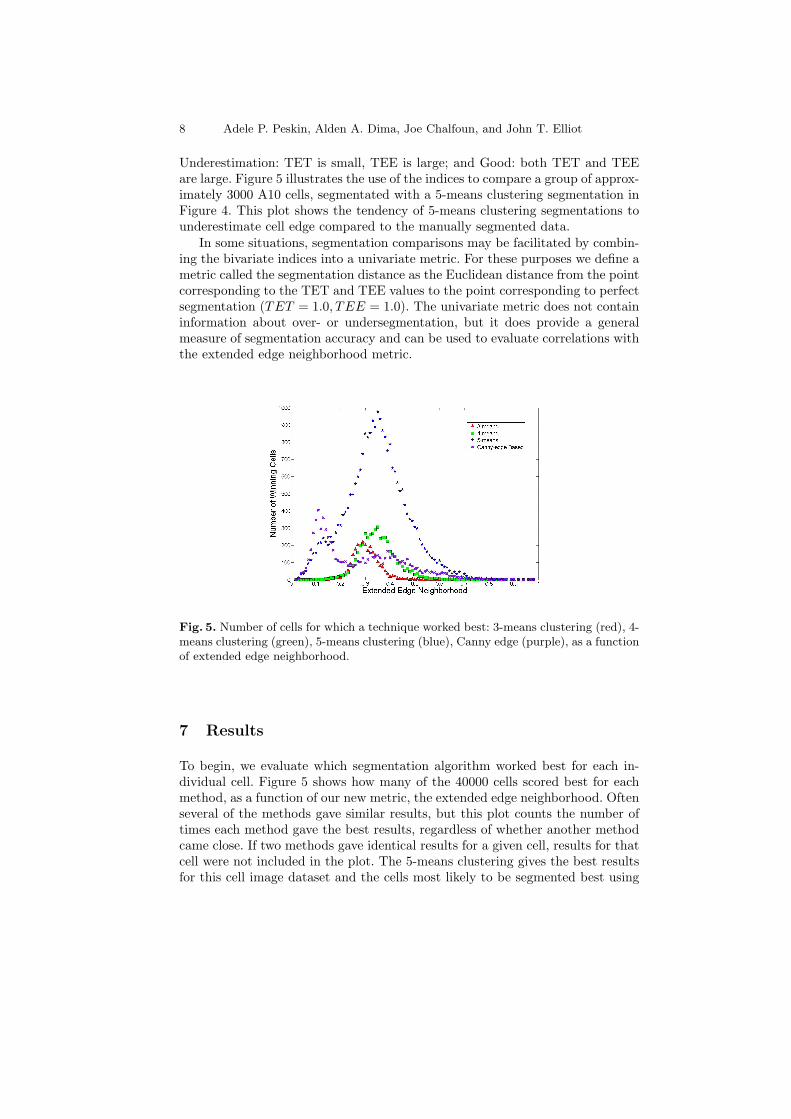
Underestimation: TET is small, TEE is large; and Good: both TET and TEEare large. Figure 5 illustrates the use of the indices to compare a group of approx-imately 3000 A10 cells, segmentated with a 5-means clustering segmentation inFigure 4. This plot shows the tendency of 5-means clustering segmentations tounderestimate cell edge compared to the manually segmented data.
In some situations, segmentation comparisons may be facilitated by combin-ing the bivariate indices into a univariate metric. For these purposes we define ametric called the segmentation distance as the Euclidean distance from the pointcorresponding to the TET and TEE values to the point corresponding to perfectsegmentation (TET = 1.0, TEE = 1.0). The univariate metric does not containinformation about over- or undersegmentation, but it does provide a generalmeasure of segmentation accuracy and can be used to evaluate correlations withthe extended edge neighborhood metric.
Fig. 5. Number of cells for which a technique worked best: 3-means clustering (red), 4-means clustering (green), 5-means clustering (blue), Canny edge (purple), as a functionof extended edge neighborhood.
7 Results
To begin, we evaluate which segmentation algorithm worked best for each in-dividual cell. Figure 5 shows how many of the 40000 cells scored best for eachmethod, as a function of our new metric, the extended edge neighborhood. Oftenseveral of the methods gave similar results, but this plot counts the number oftimes each method gave the best results, regardless of whether another methodcame close. If two methods gave identical results for a given cell, results for thatcell were not included in the plot. The 5-means clustering gives the best resultsfor this cell image dataset and the cells most likely to be segmented best using

Predicting Segmentation Accuracy for Biological Cell Images 9
Fig. 6. Averaged segmentation distance for each group of cells with the same extendededge neighborhood for 3-means clustering (red), 4-means clustering (green), 5-meansclustering (blue), and Canny edge (purple); Standard deviations of 5-means clusteringaveraged segmentation distance results as a function of extended edge neighborhoodfor the A10 cells (blue); for the NIH3T3 cells (red); for all 40000 cells (purple).
this method tended to have a mean EEN value greater than 0.2. Interestingly,the Canny edge segmentation method works very well in only a small regionof the extended edge neighborhood curve, at low extended edge neighborhoodsbetween 0.0 and approximately 0.15, which represents larger cells with sharpedges. In this region the Canny algorithm segmentation results are more similarto manual segmentation than 5-means clustering, 4-means clustering, or 3-meansclustering. 3-means clustering and 4-means clustering methods did best for onlya small number of cells in the extended edge neighborhood region between 0.2and 0.4, where the accuracy using any method was not very high.
Figure 6 shows all of the segmentation results for each of four methods overthe whole range of our extended edge neighborhood metric. The results arepresented in terms of the averaged segmentation distance for groups of cells withthe same extended edge neighborhoods. We can draw a number of conclusionsfrom this data. In general, the accuracy of these methods varies monotonicallywith extended edge neighborhood, and the 5-means clustering results are onaverage always better than the 4-means clustering, which are always better onaverage than the 3-means clustering. An occasional cell has better results for3-means clustering than 4-means clustering or 5-means clustering. However, theresults show that in general, the extended edge neighborhood metric predicts theaccuracy of k-means algorithms in segmenting these cell images. The standarddeviations of segmentation distances averaged over a group of cells with the sameextended edge neighborhoods are low, suggesting a high level of predictabilityfor most cells. As an example, the standard deviation results for the 5-meansclustering data are shown in the second plot of Figure 6. The data show thatfor A10 smooth muscle cells, the standard deviation in segmentation accuracy is

10 Adele P. Peskin, Alden A. Dima, Joe Chalfoun, and John T. Elliot
low for the EEN range 0.0 to 0.2. The standard deviation for the NIH3T3 cellsis low for the range 0.2 to 0.5.
The Canny edge segmentation results are similar to the 5-means clusteringmethod at low extended edge neighborhoods. Above we saw that more cellswere segmented accurately in this extended edge neighborhood than with 5-means clustering, but the variability of the Canny edge results produce a similarplot on data averaged over all of the cells, in the region between 0.0 and 0.15extended edge neighborhood. Overall, we see a fairly linear trend in the bestaveraged segmentation as a function of extended edge neighborhood.
To investigate further the relationship between the EEN metric, the extendededge neighborhood, and the best averaged segmentation results, we look only atdata for which there are a large number of cells. We find the region on theextended edge neighborhood curves for each cell line that includes 90 % of thecell data in each cell line. The first two plots of Figures 7 overlay plots of cellcounts for the A10 and NIH3T3 cell lines respectively with the segmentationdistances from a 5-means clustering for each cell line. In the third plot of Figure7, we graph the A10 cells in the extended edge region from 0.02 to 0.2, and theNIH3T3 results in the extended edge region 0.2 to 0.5, where 90% of the cellsfrom each cell line occur. Both of these data sets are fitted with a linear model,which is also plotted in Figure 7: predicted distance = 0.051 + EEN × 0.477,with a correlation coefficient of 0.9815.
8 Conclusions and future work
From this large scale test, we define a method to pre-process images and de-termine their vulnerability to segmentation error. The accuracy that is possiblefrom any given segmentation technique is directly proportional to the extendededge neighborhood of each individual cell within an image. Rounder, larger cellshave a lower extended edge neighborhood than smaller less round cells, andsegmentation will more closely align with manual segmentation for these cellimages. Our results suggest that of the four segmentation methods tested here,a 5-means clustering segmentation is the most reliable. The Canny edge seg-mentation method performs best with cells within a very small extended edgeneighborhood range that is less than approximately 0.15. We can now use themethods outlined in this paper to look at a wider range of segmentation algo-rithms for identifying more accurate segmentation techniques. We have writtena software segmentation pre-processor that calculates extended edge neighbor-hood for each cell in an image and then provides the best technique and expectedaccuracy for the segmentation of each cell based on these four algorithms, whichcan evolve as we compare more algorithms. We believe that this processor willbe of great use for optimizing the segmentation of cells seeded at low density andstained as described here. The EEN can also be used as a metric to rank cells formost-likely best segmentation. Measurements of cell function can be weighted bythis ranking to potentially improve the measurement robustness in a cell-based

Predicting Segmentation Accuracy for Biological Cell Images 11
Fig. 7. Averaged segmentation distance for the A10 cells (red), along with a plot of cellnumbers as a function of extended edge neighborhood (blue); Same for the NIH3T3cells; Results from the A10 cells (red) and NIH3T3 cells (blue) from the first two plots.A straight line is fitted to this data.

12 Adele P. Peskin, Alden A. Dima, Joe Chalfoun, and John T. Elliot
assay. The EEN metric will have significant value in determining which cells ina data set are most at risk during a segmentation procedure.
9 Acknowledgements
James Filliben of NIST’s Statistical Engineering Division, Anne Plant and MichaelHalter, of NIST’s Biochemical Science Division, provided helpful discussion.
References
1. Plant, A.L., Elliott, J.T., Tona, A., McDaniel, D., Langenbach, K.J.: Tools forQuantitative and Validated Measurements of Cells. High Content Screening: APowerful Approach to Systems Cell Biology and Drug Discovery. Humana Press,Taylor,L., Giuliano,K., and Haskins,J., ed. (2006)
2. Elliott,J.T., Tona,A. Plant,A.L.: Comparison of reagents for shape analysis offixed cells by automated fluorescence microscopy. Cytometry. 52A:90-100 (2003)
3. Elliott,J.T., Woodward,J.T., Langenbach,K.J., Tona,A., Jones,P.L., Plant,A.L.:Vascular smooth muscle cell response on thin films of collagen. Matrix Biol. 24(7),489-502 (Oct 2005)
4. Zhou X., Wong, S.T.C.: High content cellular imaging for drug development. IEEESignal Processing Magazine. 23(2), 170–174 (March 2006)
5. Coelho, L.P.,Shariff, A., Murphy, R.F.: Nuclear Segmentation in Microscope CellImages: A Hand-Segmented Dataset and Comparison of Algorithms. ISBI (2009)
6. Cardinale,J.,Rauch, A.,Barral,Y.,Szkely, G.,Sbalzarini,I.F.: Bayesian image anal-ysis with on-line confidence estimates and its application to microtubule tracking.IEEE International Symposium of Biomedical Imaging. 1091-1094 (June 2009)
7. Dima,A.,Elliott,J.T.,Filliben,J.J.,Halter,M.,Peskin,A.,Bernal,J.,Stotrup,B.L.,Kociolek,M.,Brady,M.C.,Tang,H.C.,Plant,A.L.: Comparison ofsegmentation algorithms for flourescence microscopy images of cells. CytometryPart A. submitted.
8. Langenbach, K.J., Elliott, J.T., Tona, A., and Plant, A.L.: Evaluating the cor-relation between fibroblast morphology and promoter activity on thin films ofextracellular matrix proteins. BMC-Biotechnology 6(1):14 (2006)
9. Chalfoun,J., Dima, A., Peskin, A.P., Elliot,J., Filliben, J.J.: A Human InspiredLocal Ratio-Based Algorithm for Edge Detection in Fluorescent Cell Images, 6thInternational Symposium on Visual Computing 2010
10. Peskin, A.P., Kafadar, K., Dima, A.: A Quality Pre-Processor for Biological Cells.2009 International Conference Visual Computing (2009)
11. Hastie, T., Tibshirani, R.; Friedman, J.H.: The Elements of Statistical Learning:Data Mining, Inference, And Prediction. New York, Springer (2001)
12. Peskin, A.P., Kafadar, K., Santos, A.M., Haemer, G.G.: Robust Volume Cal-culations of Tumors of Various Sizes. 2009 International Conference on ImageProcessing. Computer Vision, and Pattern Recognition (2009)
13. Rand,W.M.: Objective criteria for the evaluation of clustering methods, Journalof the American Statistical Association. 66(336), 846-850 (Dec 1971)


![peskin chapter 4 - Trinity College, Dublinpowersr/New/peskin-chapter-4.pdf · 1 Physics 615 Oct. 26, 2006 Homework Solutions #7 1 [20 pts] Do problem 4.3 from Peskin and Schroeder](https://img.pdfslide.net/doc/110x75/5a8754477f8b9ac96a8dabcb/peskin-chapter-4-trinity-college-powersrnewpeskin-chapter-4pdf1-physics-615.jpg)