Embed Size (px)
Citation preview

San Jose State University San Jose State University
SJSU ScholarWorks SJSU ScholarWorks
Master's Projects Master's Theses and Graduate Research
Spring 5-22-2020
Predicting Students’ Performance by Learning Analytics Predicting Students’ Performance by Learning Analytics
Sandeep Subhash Madnaik San Jose State University
Follow this and additional works at: https://scholarworks.sjsu.edu/etd_projects
Part of the Artificial Intelligence and Robotics Commons, and the Other Computer Sciences Commons
Recommended Citation Recommended Citation Madnaik, Sandeep Subhash, "Predicting Students’ Performance by Learning Analytics" (2020). Master's Projects. 941. DOI: https://doi.org/10.31979/etd.6jjb-ua9w https://scholarworks.sjsu.edu/etd_projects/941
This Master's Project is brought to you for free and open access by the Master's Theses and Graduate Research at SJSU ScholarWorks. It has been accepted for inclusion in Master's Projects by an authorized administrator of SJSU ScholarWorks. For more information, please contact [email protected].

Predicting Students’ Performance by Learning Analytics
A Project
Presented to
The Faculty of the Department of Computer Science
San Jose State University
In Partial Fulfillment
of the Requirements for the Degree
Master of Science
by
Sandeep Subhash Madnaik
May 2020

c○ 2020
Sandeep Subhash Madnaik
ALL RIGHTS RESERVED

The Designated Project Committee Approves the Project Titled
Predicting Students’ Performance by Learning Analytics
by
Sandeep Subhash Madnaik
APPROVED FOR THE DEPARTMENTS OF COMPUTER SCIENCE
SAN JOSE STATE UNIVERSITY
May 2020
Dr. Katerina Potika Department of Computer Science
Dr. Suneuy Kim Department of Computer Science
Dr. Nada Attar Department of Computer Science

ABSTRACT
Predicting Students’ Performance by Learning Analytics
by Sandeep Subhash Madnaik
The field of Learning Analytics (LA) has many applications in today’s technology
and online driven education. Learning Analytics is a multidisciplinary topic for learn-
ing purposes that uses machine learning, statistic, and visualization techniques [1].
We can harness academic performance data of various components in a course, along
with the data background of each student (learner), and other features that might
affect his/her academic performance. This collected data then can be fed to a sys-
tem with the task to predict the final academic performance of the student, e.g., the
final grade. Moreover, it allows students to monitor and self-assess their progress
throughout their studies and periodically perform a self-evaluation. From the edu-
cators’ perspective, predicting student grades can help them be proactive, in guiding
students towards areas that need improvement. Moreover, this study also takes into
consideration social factors that might affect students’ performance.

ACKNOWLEDGMENTS
I take this opportunity to express my sincere gratitude to my advisor, Prof.
Katerina Potika for advising me on this project. Her guidance, patience, and support
have helped to complete this project. I humbly thank her for always being available
and accommodating to my situations. I would like to thank her for her time and
efforts in advising me on this project.
I am grateful to Prof. Suneuy Kim and Prof. Nada Attar for being a part of
my project committee. I thank them for their valuable inputs and their time and
efforts towards my project. I also would like to thank my family and friends for their
continued support and belief in me.
v
TABLE OF CONTENTS
CHAPTER
1 Introduction . . . . . . . . . . . . . . . . . . . . . . . . . . . . . . . . 1
1.1 Project overview . . . . . . . . . . . . . . . . . . . . . . . . . . . 2
1.2 Problem Definition . . . . . . . . . . . . . . . . . . . . . . . . . . 2
1.3 Motivation . . . . . . . . . . . . . . . . . . . . . . . . . . . . . . . 3
1.4 Organization . . . . . . . . . . . . . . . . . . . . . . . . . . . . . . 4
2 Terminology . . . . . . . . . . . . . . . . . . . . . . . . . . . . . . . . 6
2.1 An introduction to EDM . . . . . . . . . . . . . . . . . . . . . . . 6
2.2 Classifiers . . . . . . . . . . . . . . . . . . . . . . . . . . . . . . . 7
2.2.1 Decision Trees . . . . . . . . . . . . . . . . . . . . . . . . . 8
2.2.2 Multi-layer Perceptron Classifier . . . . . . . . . . . . . . . 8
2.2.3 XGBoost . . . . . . . . . . . . . . . . . . . . . . . . . . . . 8
2.2.4 Logistic Regression . . . . . . . . . . . . . . . . . . . . . . 9
2.2.5 Random Forests . . . . . . . . . . . . . . . . . . . . . . . . 9
2.2.6 K-Nearest Neighbors Classifier . . . . . . . . . . . . . . . . 9
2.2.7 Extra Trees Classifier . . . . . . . . . . . . . . . . . . . . . 9
2.2.8 Naïve Bayes . . . . . . . . . . . . . . . . . . . . . . . . . . 10
2.2.9 AdaBoost Classifier . . . . . . . . . . . . . . . . . . . . . . 10
2.3 Classification Report . . . . . . . . . . . . . . . . . . . . . . . . . 11
3 Related Work . . . . . . . . . . . . . . . . . . . . . . . . . . . . . . . 13
3.1 Correlating academics achievements with interaction data . . . . . 14
vi

vii
3.2 Hellenic-Open University Analysis . . . . . . . . . . . . . . . . . . 15
4 Methodology . . . . . . . . . . . . . . . . . . . . . . . . . . . . . . . 17
4.1 EuroStat data set . . . . . . . . . . . . . . . . . . . . . . . . . . . 17
4.2 xAPI data set . . . . . . . . . . . . . . . . . . . . . . . . . . . . . 19
4.2.1 Comparison between current work and previous work . . . 22
4.2.2 Results . . . . . . . . . . . . . . . . . . . . . . . . . . . . . 22
5 Information Visualizations and Results . . . . . . . . . . . . . . . 25
5.1 EuroStat data set visualizations . . . . . . . . . . . . . . . . . . . 25
5.2 xAPI data set visualizations . . . . . . . . . . . . . . . . . . . . . 28
5.2.1 Feature importance . . . . . . . . . . . . . . . . . . . . . . 34
5.2.2 Evaluation Metrics . . . . . . . . . . . . . . . . . . . . . . 35
6 Conclusion . . . . . . . . . . . . . . . . . . . . . . . . . . . . . . . . . 38
LIST OF REFERENCES . . . . . . . . . . . . . . . . . . . . . . . . . . . 40

LIST OF TABLES
1 Classification accuracies using the Eurostat dataset. . . . . . . . . 19
2 Comparison between methods in the previous work and current work. 22
3 Comparison between prediction scores for the previous work andcurrent work. . . . . . . . . . . . . . . . . . . . . . . . . . . . . . 23
viii
LIST OF FIGURES
1 The cycle of applying data mining in educational systems [2]. . . 7
2 Common attributes and machine learning methods for predictingstudent’s performance [3]. . . . . . . . . . . . . . . . . . . . . . . 14
3 List of features for EuroStat data set [4]. . . . . . . . . . . . . . . 18
4 Decision tree classifier for EuroStat data set to classify studentsgrade into binary classes, Pass and Fail. . . . . . . . . . . . . . . 24
5 Histogram distribution of average grade of students. . . . . . . . . 25
6 Distribution of students according to age and sex. . . . . . . . . . 26
7 Effects of father’s job on student’s grade. Error bars indicate thestandard deviation. . . . . . . . . . . . . . . . . . . . . . . . . . . 27
8 Effects of mother’s job on student’s grade. Error bars indicate thestandard deviation. . . . . . . . . . . . . . . . . . . . . . . . . . . 28
9 Occurrences of students per grade interval. . . . . . . . . . . . . . 29
10 Comparison of student grades for each semester. . . . . . . . . . . 30
11 Nationality of the students in the data set. . . . . . . . . . . . . . 31
12 Gender distribution and grade comparison based on gender. . . . 32
13 Comparison of students’ hands raised based on gender. . . . . . . 33
14 Comparison of resources visited based on gender. . . . . . . . . . 34
15 Feature importance ranked for the xAPI data set. . . . . . . . . . 35
16 Scores of all classifier models on xAPI data set. . . . . . . . . . . 36
17 Classifiers applied on the xAPI data set and their accuracy scores.Error bars indicate the standard deviation. . . . . . . . . . . . . . 36
ix

CHAPTER 1
Introduction
The field of Learning Analytics (LA) [5, 1], and more specifically, Educational
Data Mining (EDM), have gained a high growth in the number of published papers
among researchers and adoptions by practitioners of Technology Enhanced Learn-
ing (TEL) [6]. The LA field is a multi-disciplinary field that borrows ideas and
techniques from various other disciplines such as Machine Learning (ML), Artificial
Intelligence (AI), Information Retrieval (IR), Data Visualization, and Statistics. The
field of EDM [2, 7] deals with “developing, researching, and applying computerized
methods to detect patterns in large collections of educational data that would oth-
erwise be hard or impossible to analyze due to the enormous volume of data within
which they exist" [8]. This is closely related to the fast increase in online courses and
online educational platforms. Nowadays, all courses online or in-person offer applica-
tions and Learning Management Systems (LMS), such as Canvas [9] or Piazza [10],
allows teachers and administrators to store/monitor students’ grades and progress.
The main goal of this project is to predict educational outcomes based on various
features of students by building models based on data that is collected from online
classes and applications. Moreover, we use Visualization approaches to gain a better
understanding of the various features of educational data sets.
Another benefit of applying LA and EDM in educational data sets is that it
enhances the understanding of the educational process by the various stakeholders,
such as students, teachers, instructors, and administrators [6]. Therefore the field
of LA finds this extra application as a support system to the learning process by
providing academic analytics, acts as a recommender system, and acts as a personal-
1
ized adaptive learning system that is based on students’ evaluation data. The most
popular related methods applicable to educational data are prediction, classification,
clustering, and relationship mining [11].
1.1 Project overview
This project explores various predictions of the feature pass or fail of a student,
and is treated as a classification problem. In order to do this process, we use logis-
tic regression and binary classification models. Different categories of features are
explored and analyzed of two different data sets. Some of the categories are purely
academic, such as grades, academic behavior, and others are related to social behav-
ior. Furthermore, we consider features that are not purely academic and are more
related to social factors, such as the profession of the father and mother of a student.
We implement a regression model to evaluate the effects that these factors might
have on the results that are based on purely academic features. Next, the results
from the prediction model are compared with other models by implementing different
algorithms such as ADA Boost and decision trees. This helps to identify algorithms
that offer the best performance for different sets of features available to us from the
data sets.
1.2 Problem Definition
The research objectives of this study are related to the next main topics:
1. Offer a study of the existing methods in predicting students’ success in a course.
2. Extend to incorporate also non-academic features by creating a model that
predicts academic performance.
2

3. Compare and analyze with existing work.
4. Identify, visualize, and evaluate key social factors that affect a student’s perfor-
mance.
1.3 Motivation
The education sector has re-invented itself with the availability of the World
Wide Web. A number of online courses are available for students to study after hours
or learn something new completely. This resulted in the increasing popularity of
Massive Open Online Courses(MOOC). The majority of universities have also tried
to incorporate this into their own courses. At the very least, universities offer Learning
Tools Inter-Operability (LTI) interfaces that integrate all the online resources for the
course. At San Jose State University, tools such as Canvas, allow the faculty to
distribute, grade and track the assignments given to the students. At the same time,
it allows students to see assignments and their deadlines. It also helps keep a record of
their submitted assignments and a portal to submit completed assignments. Hence,
even when it is an in-person teaching course, we have an LTI tool to track student
progress.
There is an increasing trend of applying machine learning algorithms to deduct
some insightful derivations from the data set. Since we have an online module that
tracks students’ progress or even whole courses, we can have a range of features
within the data set. By applying machine learning algorithms on top of LTI modules
of different universities, we can gather additional information for students from the
university’s registrar’s database. Some interesting social features that we believe
would shed more light on the academic performance of students are various social-
economic information that is related to the background of students, such as belonging
3
to minorities or first-generation university students or the highest degree of their
parents. All these extra features might be helpful to factor in could potentially affect
students’ performance. However, most of this information is considered private and
hard to obtain, most countries have special laws such as FERPA [12] in the USA.
The objective of a good LA system is to predict student performance within
courses and also across courses and offer alerts for improvement of the performance.
Each student can now track their academic progress for every single activity they
do. Therefore, such a system additionally allows them to predict their own course
progress and perform corrections. Moreover, such a system can also be expanded to
learn about drop-out tendencies among students [13] and help alleviate the drop-out
numbers. In conclusion, a complete LTI system with an integrated prediction model
can provide students and faculty a better learning/teaching experience.
1.4 Organization
Our work is divided into the next five sections. In Chapter 2, we will describe
the concept of educational data mining, the classifiers, and in detail go over all the
terminologies used throughout this report. Moreover, it will explain the various clas-
sifiers that are used in our approach. Next, in Chapter 3, we will discuss all the
related work in the field of LA and EDM that is related to our methodology and the
used data sets. We will mention the types of data sets that were used and the various
types of features taken into consideration. Additionally, we describe the methods that
are used by previous contributors. In the end, we include their metrics and results.
In Chapter 4, we describe the methodology that is used in this project. First, we
will go over the data sets and describe them in more detail. We will list the features
and categorize them based on their types. The various categories are important for
4

our work since we have non-academic ones. We compare it with the results from
the previous results. The experimental results are in Chapter 5. In this chapter,
we begin by providing information visualizations of some feature representations to
extract insightful knowledge and rank features according to their importance. We fi-
nally provide our results from different models and compare them based on the scores
using f1 or accuracy. We conclude in Chapter 6 by discussing the inferences made
from this project. We will also list possible applications for student grade prediction
and future work/scope which would help in utilizing such student data sets.
5

CHAPTER 2
Terminology
2.1 An introduction to EDM
Educational data mining (EDM) is a subset of LA [1] that uses data machine
learning techniques to classify the academic data set(s) at different levels [14, 15, 16,
17]. Binary classification such as pass or fail can provide an overview of performance
and a statistical measure for the faculty. Multi-class classification can be used to rate
the students’ performance and also the improvement in his/her performance over the
course of a semester. A regression approach can predict an output that ranges between
0 and 100, which could signify the grade accomplished by the student. Classification
techniques, such as Naïve Bayes and ensemble methods such as Random Forests, can
be used to perform such classification of the data set. For non-linearity in the data
set, neural networks can be designed to accommodate these features.
As a first step, the existing data sets are studied to identify the most important
attributes for performing educational data mining. Based on this insight, a data set
from a current course can be acquired. It includes intermediate grades, as well as
other factors that might affect the students’ grades. In the next step, depending on
the course structure and previous grades, a model is trained to predict the final grades
for a student. Additionally, insightful data related to the attributes affecting the grads
can be extracted. This helps the instructor/teacher to assess the course setting and
how it impacts students’ learning process as a whole. Moreover, it alerts students
of all the other factors that are affecting their performance (directly or indirectly).
Then, they may concentrate on specific aspects of their learning in order to improve
their learning process and outcomes. In Figure 1 one can see a general framework of
6

the cycle of an EDM. Educators design, plan, build and maintain the course structure
in order to build a good education system. They might use traditional classrooms
along with online assessments or completely e-learning systems. Students interact
with these established systems throughout the course. We can collect this usage and
interaction data along with the course and students’ information to build a data set
for data mining. Applying data mining techniques such as clustering, classification,
and pattern matching can provide students with corrective recommendations and
educators with newly discovered knowledge about the course and the students.
Figure 1: The cycle of applying data mining in educational systems [2].
We next present various binary classifiers. We will briefly describe them for more
details see scikit-learn.
2.2 Classifiers
If the goal is to predict students’ performance we build a predictive model based
on the available data. We can use classification, regression, and/or categorization to
build the predictive model. Various classification methods can be used to build these
predictive models in order to determine binary values. The following subsections
explain various algorithms that are used to predict student performances.
7

2.2.1 Decision Trees
One of the most popular and simple techniques for classification and regression
problems is Decision Trees. It is a supervised learning model. The method is used to
create a model that can predict a target value after applying some learning decision
rules, which are created from the data set features. It is a simple and comprehensible
for a small or large data set with minimal data pre-processing. The tree can be broken
down into If-Else statements for better understanding. A major advantage of using
a decision tree is the ability to visualize the trees after a model is created.
2.2.2 Multi-layer Perceptron Classifier
One simple, special class of feed-forward artificial neural networks is the multi-
layer perceptron (MLP). the structure of an MLP consists of at least three layers of
nodes, e.g., an input layer, a hidden layer, and an output layer. Each node is a neuron
that uses a nonlinear activation function, with the exception of the input nodes. It
utilizes a supervised learning technique called back-propagation for training. Having
multiple layers, and the non-linear activation is what sets this apart from a linear
perceptron. More specifically, it is good for distinguishing non-linear data.
2.2.3 XGBoost
XGBoost is a well known optimized distributed gradient boosting library that is
designed to be efficient, flexible, and portable. In that library, many machine learn-
ing algorithms are implemented under the Gradient Boosting framework. XGBoost
provides a parallel tree implementation that boosts the solving process of many Data
Science problems in a very fast and accurate way.
8

2.2.4 Logistic Regression
Logistic Regression is a useful algorithm when the output required is categorical
in nature. It is based on the logistic or sigmoid function from statistics. The Logistic
Regression class from the linear models’ package in the scikit-learn library was used
to build the model in python.
2.2.5 Random Forests
Random Forests, as the name suggests, is a group of Decision Trees. Moreover, it
is a meta estimator that actually fits a number of various decision tree classifiers that
are based on various sub-samples of the data set and then uses average evaluations
to improve the predictive accuracy and the control of over-fitting. In addition to
classification, it can also be used for regression. It can successfully create a model
despite missing values and also be used for feature engineering. The Random Forest
Classifier class from the scikit-learn library was used to build the model in python.
2.2.6 K-Nearest Neighbors Classifier
The K-Nearest Neighbors (KNN) classifier, is a type of "lazy" learning algorithm.
The algorithm uses the data points to create the model structure. It uses all the data
points in the testing phase to determine groups and clusters in the data set. It is highly
efficient when the data set does not follow mathematical theoretical assumptions.
2.2.7 Extra Trees Classifier
The Extra Trees classifier is a type of extremely randomized tree classifier. The
main difference from a classic Decision Tree lies in the way it does the splits. The
splits to create two groups in the tree are determined randomly according to the
9

value of the max_features variable and the best one is chosen. The max_features
is a parameter that is used to control the number of features to be considered for
obtaining the best split at every level. It could have values from integer to float. If it
is set to ’None’, it essentially means max_features is set to the number of features.
On the other hand, if max_features is set to 1, the resulting tree would be completely
random.
2.2.8 Naïve Bayes
The Naïve Bayes(NB) classifiers are a family of easy to train classifiers, which
are powerful in determining the probability of the outcome based on a given set of
conditions to the Bayes theorem. In this approach, the conditional probabilities are
inverted to represent the data as a function of measurable quantities.
∙ The Gaussian model is a Naïve Bayes classifier, which is a continuous distribu-
tion characterized by mean and variance.
∙ The Bernoulli model is a Naïve Bayes classifier that generates Binary/Boolean
indicators, in contrast to the multinomial NB model. The BernoulliNB class
from the scikit-learn library was used to build the model in python.
2.2.9 AdaBoost Classifier
Boosting is a general ensemble method that usually adds layers of weak classi-
fiers to create a strong classifier. In this method, once a model is created from the
training data, additional copies of the classifier are created to correct errors from
the initial model. The subsequent classifiers focus mainly on the errors and difficult
cases by adjusting weights of incorrectly classified instances. AdaBoost or Adaptive
Boosting Classifier works great to boost the performance of Decision Trees on binary
10

classification problems.
2.3 Classification Report
To measure how good are prediction is we will count how many of the predicted
values are equal to the actual values, some of them are positive and some are negative.
For binary classification problems, the four important quantities are True Positives,
False Positives, True Negatives, and False Negatives. They are defined as follows and
use the actual and predicted values:
∙ True Positive: This is the case where the actual and predicted values were
both positive.
∙ False Positive: This is the case where the actual value was negative but the
predicted value was positive.
∙ True Negative: This is the case where the actual and predicted values were
both negative.
∙ False Negative: This is the case where the actual value was positive but the
predicted value was negative.
Based on these values, we can generate four main classification metrics called
Precision, Recall, F1-score, and Support. The definition of these follow:
∙ Precision: It measures the proficiency of the classifier to not label negative
instances as positive. It indicates how well the classifier labels the positive
predictions. The formula for Precision is as follows:
Precision =𝑇𝑟𝑢𝑒𝑃𝑜𝑠𝑖𝑡𝑖𝑣𝑒
(𝑇𝑟𝑢𝑒𝑃𝑜𝑠𝑖𝑡𝑖𝑣𝑒+ 𝐹𝑎𝑙𝑠𝑒𝑃𝑜𝑠𝑖𝑡𝑖𝑣𝑒)
11

∙ Recall: It measures the proficiency of the classifier to predict all the positive
instances. It indicates how many correct positive labels are assigned by the
classifier. The formula for Recall is as follows:
Recall =𝑇𝑟𝑢𝑒𝑃𝑜𝑠𝑖𝑡𝑖𝑣𝑒
(𝑇𝑟𝑢𝑒𝑃𝑜𝑠𝑖𝑡𝑖𝑣𝑒+ 𝐹𝑎𝑙𝑠𝑒𝑁𝑒𝑔𝑎𝑡𝑖𝑣𝑒)
∙ F1score: It is an accuracy measure that utilizes a combination of Precision and
Recall. It is a harmonic or weighted average of Precision and Recall where the
𝐹1score is between 0 and 1. It is denoted by the following formula:
𝐹1𝑠𝑐𝑜𝑟𝑒 = 2 * (𝑃𝑟𝑒𝑐𝑖𝑠𝑖𝑜𝑛 *𝑅𝑒𝑐𝑎𝑙𝑙)
(𝑃𝑟𝑒𝑐𝑖𝑠𝑖𝑜𝑛+𝑅𝑒𝑐𝑎𝑙𝑙)
∙ Support: It is the total number of occurrences of each label in the actual
values. It is the number of samples of true responses that lie in that particular
class and is to measure imbalances in the data set.
12
CHAPTER 3
Related Work
Before we present our methodology and results let us discuss related work. The
objective of this project is to create a framework that collects and analyzes the aca-
demic performance of students with the goal to understand the learning behavior
of students. Moreover, for our experiments, we use existing data sets. In the data
collection part, an e-learning portal can be created that monitors the activity log of
students. We can mine data such as time spent on the portal and this can be used
to predict the outcome (grade) of the students in an exam. Our approach could be
based on continual observation of the student’s activities on the particular course
during the semester [18]. The factors in the behavior of students that we try to learn
are in terms of interactions and intermediate performances; and thus will identify its
impact on their final grades. The study focus on identifying which factors are more
important at affecting student performance. These factors would be gathered from
students in a simulated course. Such a system can be implemented to help identify
key statistics with respect to performance for the students as well as for the faculty.
13

Figure 2: Common attributes and machine learning methods for predictingstudent’s performance [3].
Figure 2 shows typical attributes and methods that are used to predict stu-
dents’ performance. Student demographics, internal assessments, external assess-
ments, CGPA, psychometric factors, social network interactions are few examples of
attributes that can be utilized as features of a data set for machine learning. Sup-
port Vector Machines, Naïve Bayes, Neural networks, K-Nearest Neighbor are a few
examples of methods that are used to build various predictive models. The nature
of attributes also dictates the machine learning methods that are used. For example,
when the data set has attributes such as internal assessments, GPA, and student de-
mographics Naïve Bayes is preferred for building a model. For data sets that account
for psychometric factors and social interactions, decision trees and neural networks
are preferred to build the model.
3.1 Correlating academics achievements with interaction data
LA is a continuously evolving field and many applications have been developed,
with various approaches, to achieve great insights. In [6] the authors take activity logs
14

from an e-learning portal and predicted the final grades. They attempt to identify the
impact of various activities during an e-learning course. Machine learning algorithms
such as Decision tree classifiers and Neural Networks were designed to help predict the
students’ outcome on the final exam. The student activities were clustered and plotted
against the grades to get a better understanding of the data set. The data set in [6]
contains recordings of 115 students’ activities captured by a logging application. This
data set contains students’ time series of performance in activities during six sessions
of laboratory sessions of a digital electronics course. It contains data for each student
per session, per exercise. It consists of 13 features such as activity, start_time, and
end_time. These features reflect all the activities performed by the students during
the session. It also has the final question set and the grades for two attempts on
the final exam by all the students. The approach taken by the paper was to apply
Process Mining (PM) to compare students’ learning process obtained through the six
sessions of the digital design course from the e-learning portal. Complexity metric
is a metric to measure the complexity of the software that determines difficulty to
maintain, change, and understand software. They used the Cyclomatic complexity
metric (CM) and compared the average CM of different student clusters that are
based on their academic achievements. CM can be typically used to determine the
difficulty of a particular assignment. They also interviewed the course instructors and
collected their interpretation and feedback on the data.
3.2 Hellenic-Open University Analysis
Another study [19] aimed to determine the students’ marks at the Hellenic Open
University. This study used regression methods on key demographics of the students
along with marks from a small number of written assignments. Demographics such
15

as marital status, occupation, and computer literacy were considered to train the
regression model. It indicated the rank of each attribute according to its impact
on the data set. The approach was to divide the training phase into 5 consecutive
steps. During each step, they incorporate different features of the data set. In the
first step, the first two written assignments and a face to face meeting along with the
demographic data such as sex, age, occupation, and computer literacy were included.
For the second step, the next face to face meeting was included. The next step
included the last written assignment and the fourth step included the last (4th) face-
to-face meeting. At the end in the fifth and final step, all the features are included.
16

CHAPTER 4
Methodology
We have applied machine learning models on two data sets for this project. The
first data set is from two Portuguese schools and was used in a study [4] to determine
the impact of various factors that are affecting the failure rates at these schools. The
second data set is from Jordan and is built on using an LMS called Kalboard by
collecting data for a number of features.
4.1 EuroStat data set
The EuroStat [4] data set was collected with the aim to identify key social factors
affecting a student’s performance. Social issues such as parents’ jobs, parents’ edu-
cation, alcohol consumption, and student’s health were taken into consideration. We
will see how these environmental factors which are not directly related to studying
and grades, affect a student’s performance.
This data set, in addition to two numeric intermediate grades value, used many
social factors related to the students. These factors included numeric value indicators
for traveling time, past failures, extra-curricular activities, quality of life, guardians,
alcohol consumption, etc. The features used include binary as well as numeric at-
tributes which help in both binary and regression classification. Figure 3 shows the
list of features from the EuroStat data set. G1, G2, and G3 are numeric values de-
noting the grades ranging from 0 to 20. Parents’ education value ranges from 0 to 4
where 0 indicates no education and 4 indicates higher education. Parents’ jobs are
nominal fields where the parents can mention their jobs such as teachers, health care,
etc.
17

The included features contain purely academic features and other non academic
one.
Figure 3: List of features for EuroStat data set [4].
We used train_test_split function from scikit-learn and divided it into a training
data set and a testing data set with an 80− 20 split. We applied Logistic Regression
on our data set to fit it onto our training data set. We used the testing data set to
make predictions using the fitted Logistic regression model. The classification report
after applying Logistic Regression for performing Binary Classification is shown in
18

Table 1. It shows the Precision, Recall, F1score, and Support for output label ’0’ in
the first row and output label ’1’ in the second row. Here label ’0’ denotes class Fail
and label ’1’ denotes Pass. We can observe that the accuracy of the model is 0.72.
Precision Recall F1score Support0 0.76 0.42 0.54 31
1 0.71 0.92 0.80 48
Accuracy 0.72Table 1: Classification accuracies using the Eurostat dataset.
4.2 xAPI data set
This data set was first provided by a paper [20] and aimed to incorporate be-
havioral features. It also included survey responses from parents. This data set was
also made available on Kaggle as a machine learning challenge and UCI’s Machine
Learning Repository.
We used the data set of [20] that is an educational one and was collected from
a learning management system (LMS) that is called Kalboard 360. Kalboard 360
has a design that facilitates learning by using cutting edge technology. It provides
users with synchronous access to a lot of educational resources through an Internet
connection. The data was collected with the use of learner activity tracker tool, called
experience API (xAPI). Moreover, the xAPI is a part of the broader training and
learning architecture (TLA) that makes it possible to monitor learning progress and
students’ actions, like reading an article or watching an online video. The application
makes it possible for institutes to determine the student, its activities, and all the
objects that describe and characterize a learning experience. The size of the data set
is 480 student records with 16 features each.
The 16 features can be categorized into three major groups:
19

1. Demographic, i.e., gender and nationality.
2. Academic background, i.e., educational stage, grade level, and section.
3. Behavioral, i.e. number of raised hands, open resources, answers on a survey
by parents, and school satisfaction.
Breaking the data set further based on gender it has 305 males and 175 females.
The origin-country of students: 179 are from Kuwait, 172 are from Jordan, 28 from
Palestine, 22 are from Iraq, 17 from Lebanon, 12 from Tunis, 11 from Saudi Arabia,
9 from Egypt, 7 from Syria, 6 from the USA, Iran, and Libya, 4 from Morocco and
one from Venezuela.
The data set was collected during two semesters: the first semester of 245 records
and the second semester of 235. Additionally, the data set includes the school atten-
dance and the students are grouped into two groups based on their absence days: 7
or more days total 191, and less than 7 days 289.
This data set contains a new type feature: parent participation. Parent par-
ticipation is collected through two quantities: Parent Answering Survey and Parent
School Satisfaction. A total of 270 parents answered the survey and a total of 210
did not. Regarding the satisfaction quantity, a total of 292 parents are satisfied, and
a total of 188 are not satisfied with the school.
The xAPI data set [20] contains a total number of 16 features . The features are
nominal as well as discrete numeric numbers.
1. Gender (’Male’/’Female’)
2. Nationality (out of the list ’Kuwait’,’ Lebanon’,’ Egypt’,’ SaudiArabia’,’ USA’,’
20

Jordan’,’ Venezuela’,’ Iran’,’ Tunis’,’ Morocco’,’ Syria’,’ Palestine’,’ Iraq’,’ Ly-
bia’)
3. Place of birth (out of the list ’Kuwait’,’ Lebanon’,’ Egypt’,’ SaudiArabia’,’
USA’,’ Jordan’,’Venezuela’,’ Iran’,’ Tunis’,’ Morocco’,’ Syria’,’ Palestine’,’
Iraq’,’ Lybia’)
4. Educational Stages (out of the list of ’lowerlevel’,’MiddleSchool’,’HighSchool’)
5. Grade Levels (out of the list’G-01’, ’G-02’, ’G-03’, ’G-04’, ’G-05’, ’G-06’, ’G-07’,
’G-08’, ’G-09’, ’G-10’, ’G-11’, ’G-12 ’)
6. Section ID (classroom student belongs to:’A’,’B’,’C’)
7. Topic (out of’ English’,’ Spanish’, ’French’,’ Arabic’,’ IT’,’ Math’,’ Chemistry’,
’Biology’, ’Science’,’ History’,’ Quran’,’ Geology’)
8. Semester (’ First’/’Second’)
9. Parent responsible for student (’Mom’/’Father’)
10. Raised hand- times raising hand on class (0 . . . 100)
11. Visited resources(0 . . . 100)
12. Viewing announcements- times the student checks the new
announcements(0 . . . 100)
13. Discussion groups- times the student participate on discussion(0 . . . 100)
14. Parent Answering Survey (’Yes’/’No’)
15. Parent School Satisfaction (’Yes’/’No’)
21
16. Student Absence Days-(above-7/under-7)
Although features such as ’Gender’, ’Semester’, or ’Parent responsible’ are of
nominal data type, they can be converted to a binary data type. However, nominal
data such as ’Nationality’ and ’Topic’ cannot be converted into binary.
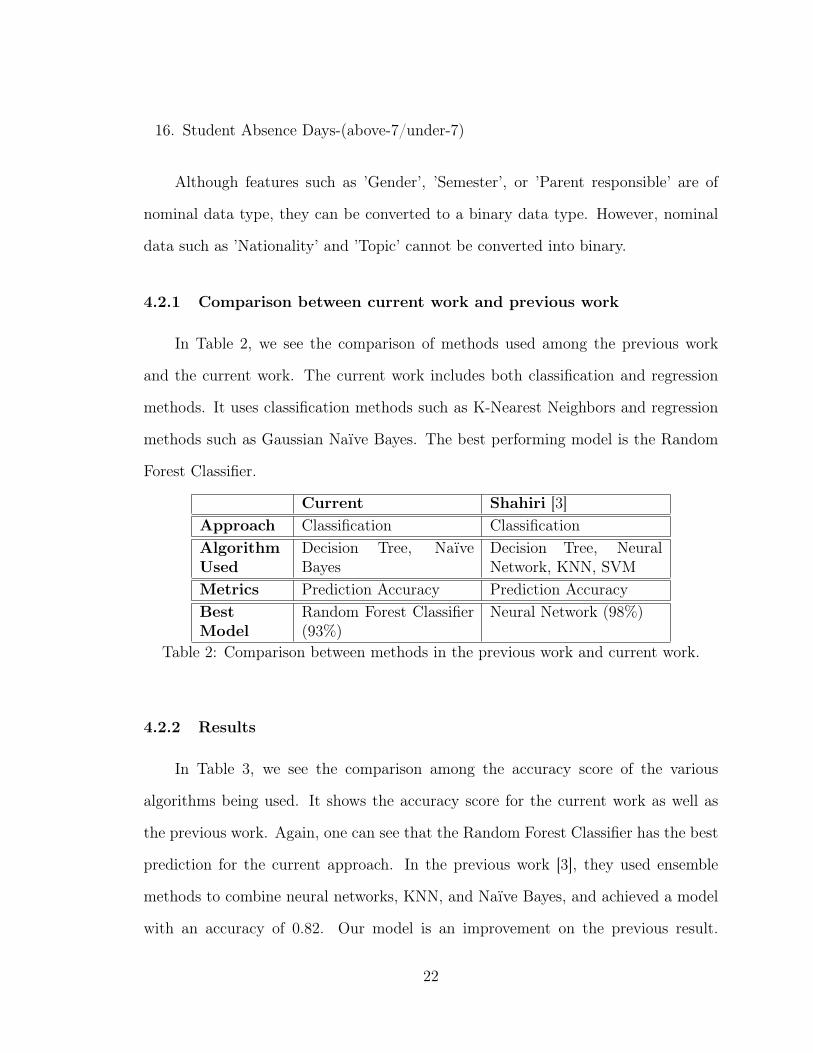
4.2.1 Comparison between current work and previous work
In Table 2, we see the comparison of methods used among the previous work
and the current work. The current work includes both classification and regression
methods. It uses classification methods such as K-Nearest Neighbors and regression
methods such as Gaussian Naïve Bayes. The best performing model is the Random
Forest Classifier.
Current Shahiri [3]Approach Classification ClassificationAlgorithmUsed
Decision Tree, NaïveBayes
Decision Tree, NeuralNetwork, KNN, SVM
Metrics Prediction Accuracy Prediction AccuracyBestModel
Random Forest Classifier(93%)
Neural Network (98%)
Table 2: Comparison between methods in the previous work and current work.
4.2.2 Results
In Table 3, we see the comparison among the accuracy score of the various
algorithms being used. It shows the accuracy score for the current work as well as
the previous work. Again, one can see that the Random Forest Classifier has the best
prediction for the current approach. In the previous work [3], they used ensemble
methods to combine neural networks, KNN, and Naïve Bayes, and achieved a model
with an accuracy of 0.82. Our model is an improvement on the previous result.
22
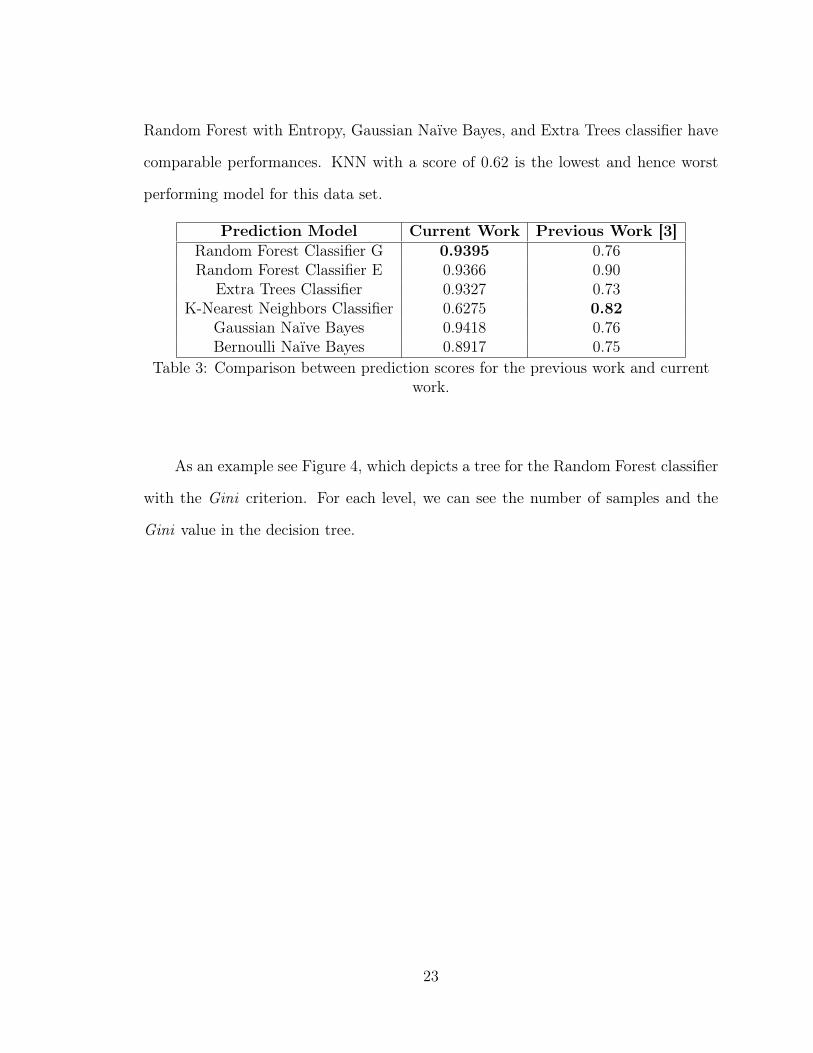
Random Forest with Entropy, Gaussian Naïve Bayes, and Extra Trees classifier have
comparable performances. KNN with a score of 0.62 is the lowest and hence worst
performing model for this data set.
Prediction Model Current Work Previous Work [3]Random Forest Classifier G 0.9395 0.76Random Forest Classifier E 0.9366 0.90
Extra Trees Classifier 0.9327 0.73K-Nearest Neighbors Classifier 0.6275 0.82
Gaussian Naïve Bayes 0.9418 0.76Bernoulli Naïve Bayes 0.8917 0.75
Table 3: Comparison between prediction scores for the previous work and currentwork.
As an example see Figure 4, which depicts a tree for the Random Forest classifier
with the Gini criterion. For each level, we can see the number of samples and the
Gini value in the decision tree.
23

Figure 4: Decision tree classifier for EuroStat data set to classify students grade intobinary classes, Pass and Fail.
24

CHAPTER 5
Information Visualizations and Results
In this section, we will see various information visualizations that highlight the
features in different ways to give a clear overview of the data distribution in the data
sets.
5.1 EuroStat data set visualizations
In Figure 5, we can see the histogram distribution of the average grades (out of
𝐺1, 𝐺2 and 𝐺3) of the students. We observe that the average student grade is closer
to 9 (not passing).
Figure 5: Histogram distribution of average grade of students.
25

In the next Figure 6, we see the student histogram distribution according to age
and sex. Notice that there are more female students than males (except very young
or very old students) and that the age range is varied mostly from 15 to 18.
Figure 6: Distribution of students according to age and sex.
In Figure 7 and Figure 8, we can see box-plots for correlating parents’ jobs and
average grade. We can see the medians for the grades. For example, median grades
for a student whose father is a teacher is 12.5. The box indicates the average grade
range with the box itself indicating 25 percentile to 75 percentile which is 10 and
15.5 respectively when the father is a teacher. We see how parents’ jobs correspond
to the average grades of students. The highest grades for students are when their
father or mother is a teacher or a healthcare worker. This might indicate that they
are stable or are involved in their child’s education. On the other hand, services and
26

other jobs correlate with lower average grades for students. We can see that stay
at home mothers isn’t correlating to better average grades. Hence, this isn’t a clear
correlation that these factors affect grades but are generally a good indicator.
Figure 7: Effects of father’s job on student’s grade. Error bars indicate the standarddeviation.
27

Figure 8: Effects of mother’s job on student’s grade. Error bars indicate thestandard deviation.
In Figure 8, the box plots show us the medians for the average grades plotted
against the student’s mother job. For students whose mothers work in services, we see
that the average grades range from 2.5 to 28.5. The box represents 25 percentile to
75 percentile that ranges from 9.5 to 13. We observe 1 outlier in the services column
which is denoted by a diamond symbol.
5.2 xAPI data set visualizations
Figure 9 is shows the histogram distribution of students occurring over the three
categories of grades, i.e., lower-level, middle-level, and high-level. Note that
∙ L (low-level) 0 to 69
28

∙ M (middle-level) 70 to 89
∙ H (high-level) 90 to 100
Count denotes the number of students. It shows a good spread of students across
the three categories. Most numbers of students are at the middle-level and the number
of students at a high-level is bigger than the low-level.
Figure 9: Occurrences of students per grade interval.
Figure 10 indicates the grade class comparison of students for each of the two
semesters. Note that ’F’ denotes the first semester whereas ’S’ denotes the second
semester. As we can see the average grades of a lot of students improved in the ’S’
for students who scored low in the ’F’ semester. The average grade of students with
middle-level grades remained largely unchanged.
29

Figure 10: Comparison of student grades for each semester.
The count on the vertical axis denotes the number of students. The various
origins are shown in Figure 11 with the nationalities of the students in the data set.
One can observe that the majority of the students in the data set are from Kuwait
or Jordan.
30

Figure 11: Nationality of the students in the data set.
Figure 12 indicates the distribution of student grades across the three categories
with the data separated by gender. It indicates more male students fall under lower or
mid-level grades whereas the female students edge their male counter-parts by scoring
high-level grades.
31

Figure 12: Gender distribution and grade comparison based on gender.
In Figure 13, the histogram distribution of raised hands in class from students
across different gender is provided. We can clearly observe that raised hands form a
cluster in the lower grade at a lower count of raised hands. Students raising hands less
often relates to lower grades. Another cluster can be an observer in the high-grade
cluster at higher raised hands count. This signifies most hands raised correlates to
higher grades. This is something that is observed in practice by most educators. It
is interesting to actually confirm this hypothesis with data.
32

Figure 13: Comparison of students’ hands raised based on gender.
Figure 14 indicates the histogram distribution of resources visited by students
across different gender.
33
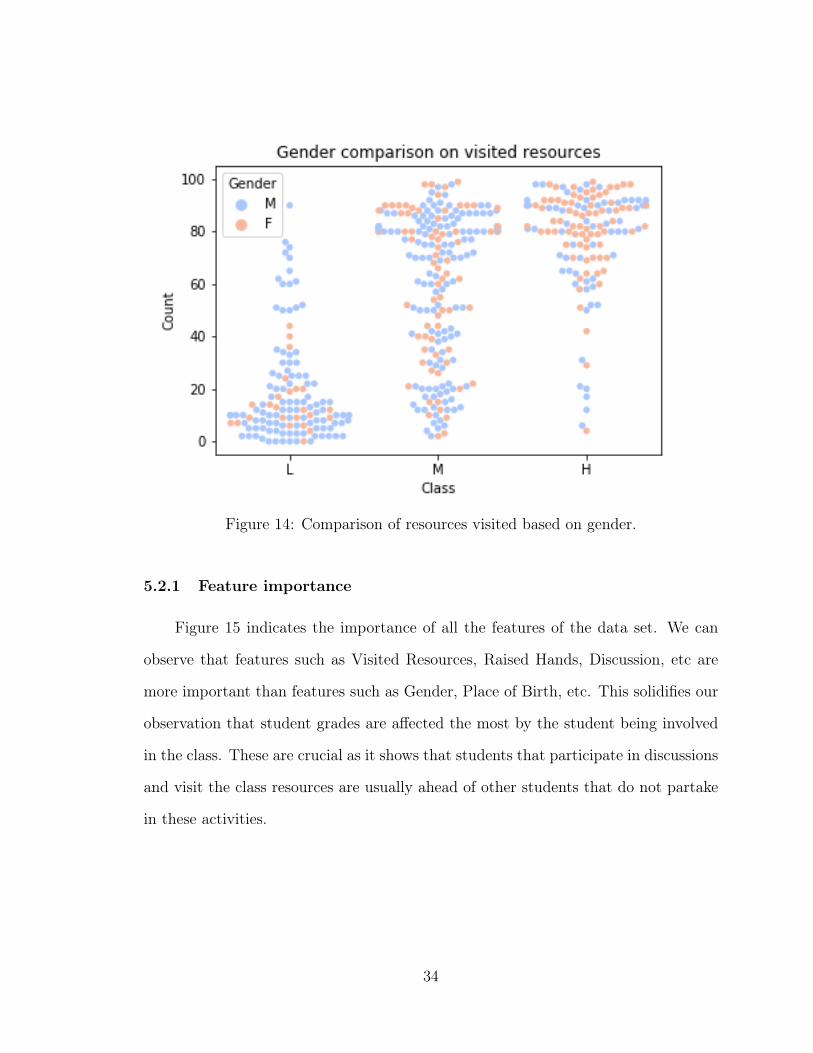
Figure 14: Comparison of resources visited based on gender.
5.2.1 Feature importance
Figure 15 indicates the importance of all the features of the data set. We can
observe that features such as Visited Resources, Raised Hands, Discussion, etc are
more important than features such as Gender, Place of Birth, etc. This solidifies our
observation that student grades are affected the most by the student being involved
in the class. These are crucial as it shows that students that participate in discussions
and visit the class resources are usually ahead of other students that do not partake
in these activities.
34

Figure 15: Feature importance ranked for the xAPI data set.
5.2.2 Evaluation Metrics
Figure 16 shows the scores for various classifiers applied to the data set. It also
shows the scores with and without the application of One-hot-encoding.
35

Figure 16: Scores of all classifier models on xAPI data set.
Figure 17: Classifiers applied on the xAPI data set and their accuracy scores. Errorbars indicate the standard deviation.
36

Figure 17 indicates the scores from the various classifiers applied to the data
set. The Score is an F1 score which is a metric for accuracy of a machine learning
model. There are a couple of outliers for the Random Forest classifier, denoted
by a diamond symbol, as seen in Figure 17. We can observe that the K-nearest
Neighbors classifier and Extra Trees classifier are the worst-performing algorithms in
this instance whereas Random Forest classifier results in the highest score and proves
to be the best-performing classifier for the data set
37

CHAPTER 6
Conclusion
In this paper, we cover various approaches for mining student records for helpful
data attributes to predict their academic performance. We consider test performance
as well as social and physiological factors to determine the key features that affect
student performance. We carried out the experiment on two data sets and compared
the results among various approaches. Additionally, we compare those results (when
possible) with a few previous works using the same data sets. In this project, we can
extract the conclusion that the primary features that directly are affecting students’
grades are the one that is related to their participation in class. Raising hands in
classes, which implies asking questions, and the number of extra resources visited has
been the most influential aspect in scoring better grades. On the other hand, social
factors such as parents’ involvement that is implied by their job have been a minor
but important factor affecting the grades. We observe that classifiers such as Random
Forest provided the best results on our data sets.
An application of our work for MOOC courses is that it could help to determine
topics of the material which are difficult for students. Hence, this can be used by
students to track their progress and identify these difficult topics in addition to the
number of students that complete a course. By faculty, it can assist to identify
students performing poorly or determining a topic that needs extra attention and
activities for the students. As these online courses have a larger number and varied
backgrounds of participating students, the setting could provide more features that
might be crucial for predicting students’ grades.
38

For future work, we can use similar data sets to determine student dropouts
rates. Given a larger data set with more features could provide better insights. We
could integrate these predictions with university LTI modules, such as Canvas to
update regularly students about their progress at various stages during the course of a
semester. Furthermore, we could incorporate course difficulty and professors’ reviews
into the data sets. Repeating this across multiple courses for the same students could
provide us a broader understanding of the students’ performance. This could, in turn,
be used as a way to measure how difficult a course or instructor is.
39
LIST OF REFERENCES
[1] M. A. Chatti, A. L. Dyckhoff, U. Schroeder, and H. Thüs, “A reference model forlearning analytics,” Int. J. Technol. Enhanc. Learn., vol. 4, no. 5/6, pp. 318–331,jan 2012. [Online]. Available: http://dx.doi.org/10.1504/IJTEL.2012.051815
[2] C. Romero and S. Ventura, “Educational data mining: A survey from 1995 to2005,” Expert systems with applications, vol. 33, no. 1, pp. 135–146, 2007.
[3] A. M. Shahiri, W. Husain, and N. A. Rashid, “A review on predicting studentsperformance using data mining techniques,” Procedia Computer Science, TheThird Information Systems International Conference 2015, vol. 72, pp. 414–422,2015.
[4] P. Cortez and A. Silva, “Using data mining to predict secondary school studentperformance,” Proceedings of 5th Annual FUture BUsiness TEChnology Confer-ence (FUBUTEC 2008), Porto, Portugal, pp. 5–12, April 2008.
[5] R. Ferguson, “Learning analytics: drivers, developments and challenges,” Inter-national Journal of Technology Enhanced Learning, vol. 4, no. 5/6, pp. 304–317,2012.
[6] M. Vahdat, L. Oneto, D. Anguita, M. Funk, and M. Rauterberg, “A learninganalytics approach to correlate the academic achievements of students with in-teraction data from an educational simulator,” in Design for Teaching and Learn-ing in a Networked World : 10th European Conference on Technology EnhancedLearning, EC-TEL 2015, Toledo, Spain, September 15–18, 2015 : Proceedings,ser. LNCS, G. Conole, T. Klobucar, C. Rensing, J. Konert, and E. Lavoue, Eds.Germany: Springer, 2015, pp. 352–366.
[7] C. Romero and S. Ventura, “Educational data mining: a review of the state ofthe art,” IEEE Transactions on Systems, Man, and Cybernetics, Part C (Appli-cations and Reviews), vol. 40, no. 6, pp. 601–618, 2010.
[8] C. Romero, S. Ventura, M. Pechenizkiy, and R. S. Baker, “Handbook of educa-tional data mining,” Data Mining and Knowledge Discovery Series, 2010.
[9] https://www.instructure.com/canvas/.
[10] https://www.piazza.com.
[11] L. C. Liñán and A. A. J. Pérez, “Educational data mining and learning analyt-ics: differences, similarities, and time evolution,” Learning Analytics: IntelligentDecision Support Systems for Learning Environments, vol. 12, pp. 98–112, 2015.
40

[12] https://www2.ed.gov/policy/gen/guid/fpco/ferpa/index.html.
[13] S. Rovira, E. Puertas, and L. Igual, “Data-driven system to predict academicgrades and dropout,” PLoS ONE, vol. 12, no. 2, 2017. [Online]. Available:https://doi.org/10.1371/journal.pone.0171207
[14] M. Pandey and S. Taruna, “Towards the integration of multiple classifier per-taining to the student’s performance prediction,” Perspectives in Science, vol. 8,pp. 364–366, 2016.
[15] M. W. Rodrigues, S. Isotani, and L. E. Zárate, “Educational data mining: A re-view of evaluation process in the e-learning,” Telematics and Informatics, vol. 35,no. 6, pp. 1701–1717, 2018.
[16] M. Zaffar, K. Savita, M. A. Hashmani, and S. S. H. Rizvi, “A study of featureselection algorithms for predicting students academic performance,” Int. J. Adv.Comput. Sci. Appl, vol. 9, no. 5, pp. 541–549, 2018.
[17] N. Z. Zacharis, “Predicting student academic performance in blended learningusing artificial neural networks,” International Journal of Artificial Intelligenceand Applications, vol. 7, no. 5, pp. 17–29, 2016.
[18] M. Simjanoska, M. Gusev, and A. M. Bogdanova, “Intelligent modelling for pre-dicting students’ final grades,” in 37th International Convention on Informationand Communication Technology, Electronics and Microelectronics (MIPRO), ser.LNCS. Opatija, Croatia: IEEE, 2014, pp. 352–366.
[19] S. B. Kotsiantis and P. E. Pintelas, “Predicting students’ marks in hellenic openuniversity,” in ICALT ’05 Proceedings of the Fifth IEEE International Conferenceon Advanced Learning Technologies, IEEE Computer Society Washington, DC,USA, 2005, pp. 664–668.
[20] E. Amrieh, T. Hamtini, and I. Aljarah, “Mining educational data to predictstudentś academic performance using ensemble methods,” International Journalof Database Theory and Application, vol. 9, pp. 119–136, 09 2016.
41