Embed Size (px)
Citation preview

1
Predicting tablet tensile strength with a model derived from the 1
gravitation-based high-velocity compaction analysis data 2
Tanner Timo, Antikainen Osmo, Pollet Arne, Räikkönen Heikki, Ehlers Henrik, 3
Juppo Anne, Yliruusi Jouko 4
5
Abstract 6
In the present study, a model was developed to estimate tablet tensile strength utilizing the 7
gravitation-based high-velocity (G-HVC) method introduced earlier. Three different 8
formulations consisting of microcrystalline cellulose (MCC), dicalcium phosphate dihydrate 9
(DCP), hydroxypropyl methylcellulose (HPMC), theophylline and magnesium stearate were 10
prepared. The formulations were granulated using fluid bed granulation and the granules 11
were compacted with the G-HVC method and an eccentric tableting machine. Compaction 12
energy values defined from G-HVC data predicted tensile strength of the tablets surprisingly 13
well. It was also shown, that fluid bed granulation improved the compaction energy intake 14
of the granules in comparison to respective physical mixtures. In addition, general 15
mechanical properties and elastic recovery were also examined for all samples. In this study 16
it was finally concluded, that the data obtained by the method was of practical relevance in 17
pharmaceutical formulation development. 18
19
20
21

2
1. Introduction 22
Among pharmaceutical products, tablets are still most widely used. The ease of use, 23
relatively simple manufacture and good shelf-life are some of the benefits of this dosage 24
form. Tablets can be compressed directly from original, physical powder mixtures, but this 25
method is not always feasible, often due to insufficient powder flow. Granulation can 26
improve powder flow, ingredient uniformity and also compression properties in some cases, 27
leading to more successful tablet formulations. 28
When compressing powder sample inside the die, it undergoes particle rearrangement, 29
fragmentation and deformation (Jain 1999; Jivraj et al. 2000; Mohan 2012). Primarily 30
fragmenting materials are known as brittle. Deformation of the particle can be reversible 31
(elastic) or irreversible (plastic). Under pressure, powder particles deform reversibly until a 32
point known as elastic limit is exceeded. After this point, particles fragment or undergo 33
plastic deformation and after the pressure is lifted, the elastic portion is recovered. While 34
some of these compression mechanics are typically dominant for each material, all materials 35
are capable of undergoing each of these phenomena to some extent. Multiple factors, such 36
as powder particle size, compression speed and water content of the sample, may affect the 37
compression physics of the powder (Amidon & Houghton 1995; Nokhodchi et al. 1996; 38
Akande et al. 1997; Sun & Grant 2001; Nokhodchi 2005). Microcrystalline cellulose is known 39
as a plastic material, starch as an elastic material and dicalcium phosphate as a brittle 40
material, to mention a few (Wu & Sun 2007; Rashid et al. 2013; Thoorens et al. 2014; Tanner 41
et al. 2018). Excessively elastic formulations may cause defects in tablets, such as capping 42
(Akseli et al. 2013; Furukawa et al. 2015). Contrarily, excessive tablet hardness may result in 43
3
insufficient disintegration in the GI-tract and reduced absorption rate of the active 44
substance (Dor & Fix 2000; Gupta et al. 2009). 45
When powder particles are rearranged and packed under pressure, new interparticle bonds 46
are formed and a compact is produced (Jain 1999; Jivraj et al. 2000; Zhang et al. 2003; Li et 47
al. 2004; Patel et al. 2006; Mohan 2012). Bonding mechanisms include, but are not limited 48
to hydrogen bonding, Van Der Waals bonding, solid bridge formation by local melting and 49
mechanical interlocking. Work consumed during particle rearrangement and compact 50
formation is typically quantified by calculating the area under curve of the force-punch 51
displacement plots obtained during tableting (Jain 1999; Antikainen & Yliruusi 2003; 52
Busignies et al. 2006). This work is generally referred to as compaction energy and may be 53
used as a measure of tablet hardness. Sufficient tensile strength (roughly recommended to 54
be at least 2 MPa) is an important property of a tablet so that it can withstand stress from 55
further manufacturing unit operations after compaction (Sun et al. 2009; Pitt & Heasley 56
2013; Shang et al. 2013; Leane et al. 2015). 57
In the present work, we utilized our previously developed gravitation-based high-velocity 58
compaction analysis (G-HVC) method (Tanner et al. 2017 & 2018) to clarify how accurately 59
tablet tensile strength could be predicted by the compaction energy observed during G-HVC 60
measurement. The way the compaction energy is calculated by G-HVC method is novel and 61
is primarily based on the rebound height of the freely falling compressor bar, among some 62
other factors. Without any corrective methods (which may be difficult to refine), the typical 63
area under force-displacement curve includes some errors, including the deformation of 64
steel, which is then included in the result. During G-HVC measurement, the displacement 65
patterns of the compressor bar and the base of the system successfully reveal some of the 66

4
error-inducing factors, such as steel deformation. We prepared three different tablet 67
formulations (consisting of five ingredients) with varying microcrystalline cellulose and 68
hydroxypropyl methylcellulose content and granulated them using a fluid bed granulator. 69
The granules were then compressed with the G-HVC method and a tableting machine. Our 70
primary aim was to see if the compaction energy calculated by our method would correlate 71
to the tensile strength of tablets produced by a tableting machine and consequently predict 72
the tablet tensile strength based on the G-HVC data. We also examined the compression 73
mechanics of individual ingredients in their original form and the mixtures, both as physical 74
mixtures and as fluid bed granules. 75
76
2. Materials and methods 77
2.1. Ingredients and powder mixtures 78
The ingredients used in the study were microcrystalline cellulose (MCC) (Vivapur 101, JRS 79
Pharma), dicalcium phosphate dihydrate (DCP) (Chemische Fabrik Budenheim), 80
hydroxypropyl methylcellulose (HPMC) (Methocel, DOW Chemical Company), theophylline 81
(Ph.Eur./USP, BASF) and magnesium stearate (Ph.Eur., Yliopiston Apteekki). Three different 82
formulations (PM1-PM3) were mixed and granulated for compression studies (Table 1). 83
Fractions of HPMC and MCC varied between mixtures. True density measurements were 84
performed with a helium pycnometer (Multivolume Pycnometer 1305, Micromeritics Inst. 85
Corp., Norcross, Georgia, USA) and water activity values were measured with Aqualab 86
(Series 3, Decagon Devices Inc., Pullman, Washington, USA). Powder compressions were 87
carried out in a room with controlled temperature and humidity. Controlled temperature 88
5
stayed at 24.7 -26.4 ○C, humidity at 41.8-46.3 % and water activity of samples at 0.34-0.43 89
throughout the study. 90
91
2.2. Fluid bed granulation 92
Granulation of the powder mixtures was performed in a fluid bed system (Glatt WSG 5, Glatt 93
GmbH, Binzen, Germany). HPMC was mixed in the formulations and water was used as 94
granulation liquid. Granules were forced through a 1000 μm-sieve to obtain the batches for 95
the experiment (FBG1-FBG3) (Table 1). The particle size distribution of the granules was 96
measured with in-line particle probe (Parsum IPP 70-SE, Parsum GmbH, Chemnitz, 97
Germany). 98
99
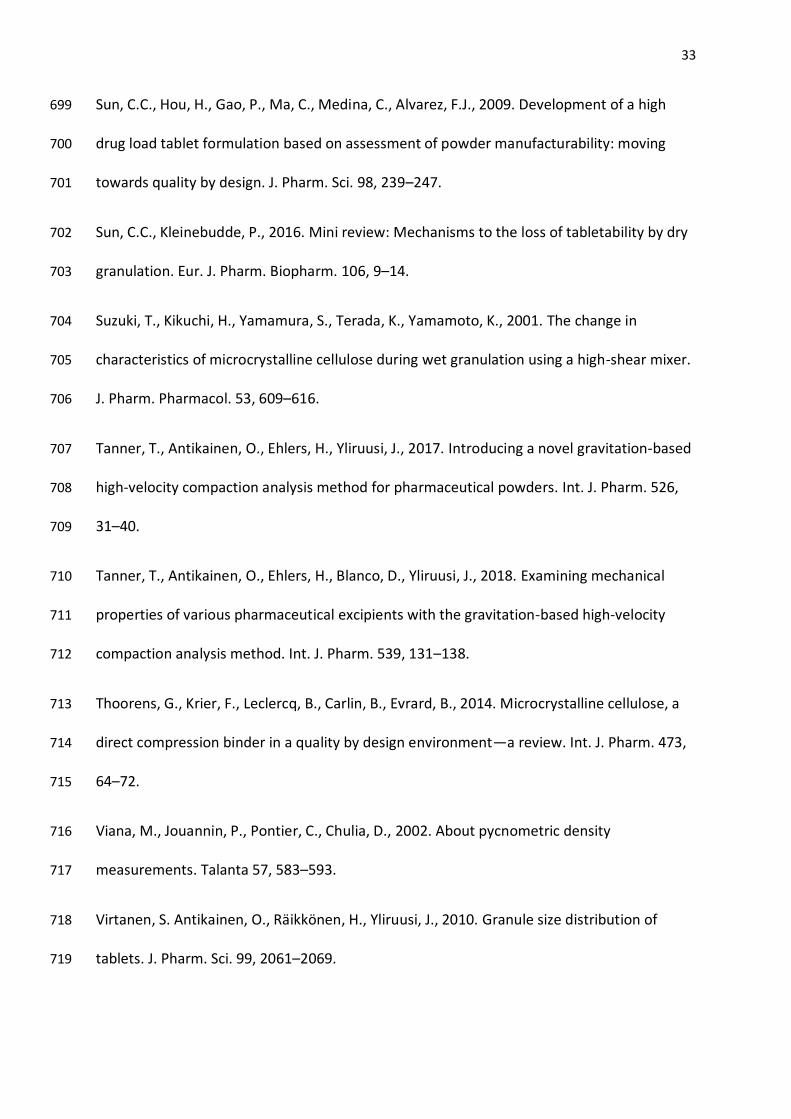
Table 1: Powder mixtures (PM=physical mixture; FBG=Fluid bed granules) 100
101
2.3. Tableting 102
Tablets were produced from each granule batch with an instrumented eccentric, single-103
station tablet press (Korsch EK 0, Erweka GmbH, Heusenstamm, Germany) with a 9-mm, 104
round and flat-faced punch. Three different force levels were used. For each batch and force 105
level, one hundred tablets were produced and collected sequentially inside transparent 106
plastic tubes so that the properties of selected samples could be compared with the 107
corresponding upper punch pressure during tableting. Twenty tablets were selected from 108
each tube for tensile strength measurement, equalling 180 tablets in total to be measured. 109
Tablet dimensions were measured with a digital micrometer (Sony DZ521, Tokyo, Japan) and 110
6
crushing strength values were measured with a hardness tester (Schleuniger 2E, Dr 111
Schleuniger Pharmatron AG, Solothurn, Switzerland). This was done to enable studying 112
upper punch pressure-dependent tensile strength correlation for each batch. 113
2.4. Gravitational high-velocity compression (G-HVC) measurements 114
G-HVC method has been described in our earlier studies (Tanner et al. 2017 & 2018). In the 115
present study, the weight of the falling compressor bar was 6.27 kg and the die diameter 8.2 116
mm. The displacement lasers (Keyence LK-H087, Keyence Corporation of America, Itasca, 117
Illinois, USA) were set at 20 kHz sample rate and 1 μm measurement accuracy. The zero 118
point of the displacement measurement was set at the bottom of the empty die so that 119
maximum displacement point and final displacement level depict the height of the sample 120
inside the die. Magnesium stearate-in-acetone (5 % w/w) suspension was applied on the 121
punch before each set of consecutive measurements. 122
Each sample of individual main ingredients (MCC, DCP, HPMC and theophylline), granules 123
and physical mixtures was compressed five times consecutively, in triplicate. The sample 124
was not removed from the die between the consecutive compressions. Before the first 125
compression, the samples were precompressed by gently lowering the weight on the punch 126
by rotating the adjustment bolt, to induce particle rearrangement without further 127
consolidation. The weight was kept on top of the punch for 60 seconds. This was done to 128
mostly eliminate the rearrangement phase during actual compressions, which is imperative 129
for reliable compaction energy calculations with this method. Sample weights were fixed so 130
that, should the powder reach true density during the measurement, the thickness of the 131
sample would be uniform among all samples. Thus, the sample sizes were affected by the 132
differences in true density. Sample weights were consequently set at 75 mg for MCC and 133
7
theophylline, 65 mg for HPMC, 125 mg for DCP and 85 mg for the mixtures. The initial height 134
for the falling compressor bar was set at 20 mm distance from the powder bed height after 135
the precompression. Consequently, the kinetic energy of the freely falling bar before the 136
impact was of equal magnitude for all samples, during first compressions of each set. The 137
falling height remained the same throughout later compressions in each set, despite the 138
powder consolidation occurring during the measurement. The differences in the magnitude 139
of powder consolidation were small enough to render height adjustment unnecessary. 140
2.5. Compaction energy calculations with the G-HVC method 141
When utilizing the G-HVC method, estimating the amount of compaction energy in the 142
sample is primarily based on the rebound height of the falling compressor occurring after 143
the impact. There is no pre-determined displacement pattern for the compressor, unlike in 144
traditional tableting machines. Thus, each sample is allowed to freely resist deformation 145
depending on its properties. The rebound height, too, is ultimately determined by the 146
mechanical properties of the sample. 147
The total energy input during each compression is the potential energy of the falling 148
compressor, which is determined by the distance between the initial falling height and the 149
maximum displacement point of the compression: 150
Etot=m x g x (yinit - ymax) (Eq. 1) 151
Where Etot=total energy input to the system (J); m=weight of the falling compressor (kg); 152
g=gravitational acceleration (m/s2); yinit=initial falling height (m); ymax=maximum 153
displacement point (m). 154
8
The zero point of the displacement, y0, was set at the bottom of the die and equalled zero. 155
Consequently, the displacement value depicted the distance between the compressor and 156
the bottom of the die constantly. It is of importance to understand, that the compressor 157
could move freely and depicted the powder bed height only during certain moments, most 158
importantly during maximum displacement point and final displacement level. 159
The collision between the compressor and the punch is non-elastic, meaning that fraction of 160
the total energy is dissipated during impact. The amount of this non-elastic energy can be 161
determined from the rebound height of the compressor after collision: 162
Ene= Etot – (m x g x yreb) (Eq. 2) 163
Where Ene=total non-elastic energy after collision (J); yreb=the highest rebounded position of 164
the compressor reached after the collision (m). 165
During compressions, the resulting non-elastic energy consists of compaction energy of the 166
sample, other sample-originated factors and machine-originated factors. During powder 167
compressions, to determine the machine-originated factors, the base of the system had to 168
be monitored with a second displacement laser (Tanner et al. 2017 & 2018). When running 169
the machine without powder, a correlation between the energy loss and the maximum 170
velocity of the deformation wave in the base after collision can be found: 171
Eml=a x Vbmax2 + b x Vbmax (Eq. 3) 172
Where Eml=machine-originated energy loss (J); Vbmax=highest velocity of the deformation 173
wave observed in the base after collision (m/s); a and b= resulting constants from 174
correlation determination. After collision, the amount of non-elastic energy during no-175
powder-compression equals the amount of energy loss which is then compared to the 176

9
deformation wave velocity. To clarify, at this point there was no powder deformation 177
present, so the energy loss was completely related to the method itself. 178
The correlation can be implemented, when running the machine with powder sample by 179
monitoring the deformation wave in the base. The hypothesis was, that a similar amount of 180
energy is required to cause a similar deformation wave in the base, whether there was 181
powder in the die or not. The machine-originated energy loss factors include, for instance, 182
friction, vibrations, steel-on-steel heat dissipation and sound. The method does not 183
differentiate these factors, but the deformation wave in the base serves as an indicator of 184
the total machine-originated energy loss determined from the rebound height of the 185
compressor, when there is no powder in the die. As discussed in our introductory study, the 186
correlation includes errors as some factors (such as heat) are presumably of different 187
magnitude, depending on whether there is powder in the die or not (Tanner et al. 2017). In 188
this study, machine-originated energy loss correlation was determined by dropping the 189
compressor bar from six different heights (10-60 mm in 10 mm increments), in triplicate. 190
The amount of immediate elastic energy recovered can be directly seen from the 191
displacement data: 192
Erec=m x g x (yfinal - ymax) (Eq. 4) 193
Where Erec=recovered elastic energy in-die immediately after the compression (J); yfinal=final 194
displacement level (m). 195
In our earlier studies we noticed, that there were also other sample-originated factors 196
contributing to the total energy loss, besides compaction energy (Tanner et al. 2018). 197
Although there was no change in sample consolidation after five compressions, there was 198

10
still detectable internal energy change occurring in the sample. This was assumed to be 199
mainly caused by temporary elastic potential in the sample after the collision. This finding 200
was further supported by noticing that the amount of this internal energy change seemed to 201
increase as the elastic recovery in the sample increased. When powder is compressed under 202
pressure, it undergoes elastic deformation and when the material-dependent yield point (or 203
elastic limit) has been exceeded the material undergoes fragmentation or plastic 204
deformation. During decompression phase, the material recovers its elastic fraction. In our 205
present work, it was assumed that the amount of this elastic energy stayed similar 206
throughout five compressions (or in other words, the elastic limit of the material remained 207
unchanged). The prerequisite for this assumption was, that the rearrangement phase had to 208
be eliminated from the first compression by precompressing the sample. Otherwise, the 209
amount of elastic energy could have been less than expected, due to amount of energy 210
consumed during powder rearrangement. Also, the sample must have consolidated to the 211
point where there was no more permanent deformation occurring, after the five 212
compressions. Therefore, the remaining non-elastic energy detected after the fifth 213
compression, Esl, equals the other sample-originated energy loss besides compaction 214
energy: 215
Esl= Ene5 - Eml5 - Erec5 (Eq. 5) 216
Where Ene5=total non-elastic energy after collision during fifth compression (J); 217
Eml5=machine-originated energy loss during fifth compression (J); Erec5=recovered elastic 218
energy immediately after the fifth compression (J). Esl is determined from the fifth 219
compression and is utilized as a constant throughout all compressions within a set. 220
11
Finally, the compaction energy bound in the sample, Ecomp, is determined by subtracting the 221
other factors from the total non-elastic energy observed: 222
Ecomp= Ene - Eml - Erec - Esl (Eq. 6) 223
The equation is adjusted so that the compaction energy after the fifth compression, Ecomp5, 224
equals zero: 225
Ecomp5=Ene5 – Eml5 – Erec5 – Esl; 226
Esl=Ene5 – Eml5 – Erec5; 227
Ecomp5=Esl – Esl = 0 (Eq. 7) 228
Relationship between the compaction energy and the sample size can be shown as: 229
Ecomps=Ecomp/ws (Eq. 8) 230
Where Ecomps=specific compaction energy (J/g); ws=sample weight (g). 231
In summary, to determine the compaction energy in the sample with the current method, 232
machine-originated factors, elastic recovery and other sample-originated factors are 233
subtracted from the total non-elastic energy. In this current work, the compaction energy 234
during fifth compression is always considered zero. It is required that before the first 235
compression, the rearrangement phase has been substantially eliminated through 236
precompression and that there is no more consolidation occurring after the fifth 237
compression. 238
2.6. Machine deformation and powder elastic recovery estimation 239
When estimating immediate in-die axial elastic recovery of the samples, the machine 240
deformation had to be accounted for. This was determined from the same data as the 241
12
machine-originated energy loss, where the compressor was dropped without powder in the 242
die. When the zero point of the displacement laser was set at the bottom of the die, 243
negative distance values were obtained during collision, due to machine deformation. The 244
magnitude of this value is force-dependent, so a correlation could be made: 245
ymach=c x F2 + d x F (Eq. 9) 246
Where ymach=absolute value of axial machine deformation (m); F=compression force (N); c 247
and d= resulting constants from correlation determination. 248
Therefore, immediate in-die axial elastic recovery of the sample, eliia (%), is calculated as: 249
eliia=100 x (yfinal – (ymax + ymach))/yfinal (Eq. 10) 250
2.7. MATLAB derivations 251
G-HVC program was coded with MATLAB software (version R2018a, Mathworks Inc, Natick, 252
Massachusetts, USA). The settings and the principle of the program were same as in our 253
previous study (Tanner et al. 2018). Savitzky-Golay derivation (second-order polynomial fit, 254
window size 21) was used to obtain velocity from the displacement data. Velocity data was 255
smoothed with a sigmoidal fit to obtain the second derivative, acceleration. Due to 256
sigmoidal fit, acceleration data required no more filtering. Compression force and pressure 257
could be directly calculated from the acceleration data, since the weight of the compressor 258
and the surface area of the punch were known. 259
260
261
262
13
3. Results and discussion 263
3.1. Granule particle size distribution 264
Particle size distribution of granules (FBG1-FBG3) can be seen in Table 2. Some of the 265
original granule batches contained very large particles, so the sieving was carried out to 266
decrease the possible disturbance caused by them. Particles too large may be problematic 267
during the tableting process in many ways, for instance, by decreasing the available contact 268
area between particles or by affecting the final product through uneven content uniformity 269
(Rohrs et al. 2006; Virtanen et al. 2010). Also, increase in particle size may possibly enhance 270
the fragmentation of the sample (Sun & Grant 2001; Patel et al. 2007). Granule particle size 271
increased with increasing HPMC content, which was to be expected (Planinšek et al. 2000; 272
Chitu et al. 2011). 273
274
Table 2: Particle size distribution of granules (n=3; average±standard deviation) 275
276
3.2. Tensile strength of tablets 277
During tableting, even if the machine settings are kept constant, there is variation in upper 278
punch pressure, depending on the amount of powder inside the hopper and other factors 279
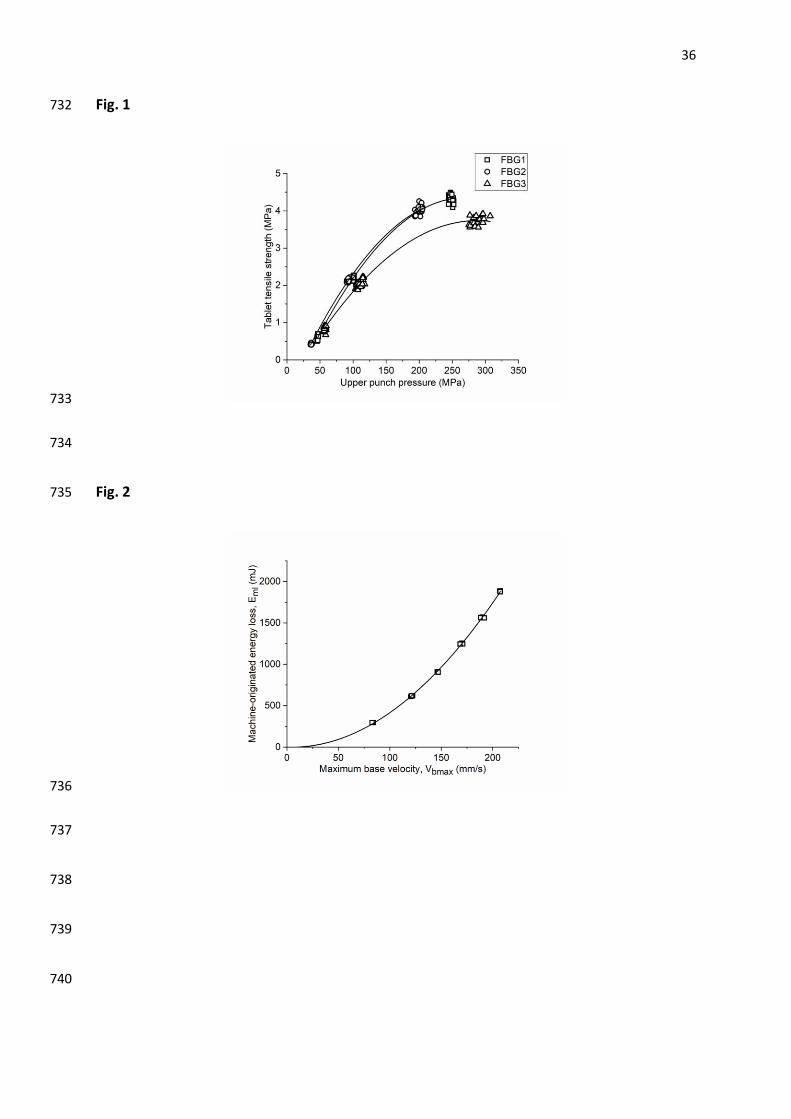
affecting powder flow, such as, machine vibration. Therefore, tablets were collected inside 280
tubes so that the measured tensile strength value could be compared to the corresponding 281
upper punch pressure for each tablet (Fig. 1). All batches showed good correlation between 282
the upper punch pressure and the resulting tensile strength. Due to differences in pressure 283
at the highest force level, the overall results of this work could only be compared up to 200 284

14
MPa, to avoid the possible errors caused by extrapolation. It was assumed, that differences 285
in deformation resistance of the material during tableting caused variation in the 286
compaction pressure. Consequently, there is some variation between the force levels, even 287
though the predetermined tableting parameters were kept constant. FBG3, which 288
contained the highest fraction of HPMC and the lowest fraction of MCC, showed lowest 289
tensile strength of all batches. FBG1 and FBG2 showed no significant difference between 290
them. The sudden change in tabletability of the mixture, when the MCC content drops from 291
68 to 58% (from FBG2 to FBG3), can be explained by percolation theory (Kuentz & 292
Leuenberger 2000; Amin & Fell 2004). It was reasonable to assume, that a percolation 293
threshold existed between FBG3 and the rest of the mixtures. It is essential to add, that 294
powder flow was sufficient during tableting and the tablet weight within all batches only 295
varied between 255 and 266 mg. Furthermore, the weight variation was random and no 296
trends indicating exceptional die filling for any specific batch was detected. 297
298
Fig. 1: The correlation between the upper punch pressure and the tensile strength of the 299
tablets. 300
301
3.3. Machine-originated energy loss and machine deformation correlations for G-HVC 302
measurements 303
The correlations concerning machine-originated energy loss and machine deformation can 304
be seen in Fig. 2 & 3. The correlation for machine-originated energy loss, Eml, was expectedly 305
very similar to our previous studies (Fig. 2). When the machine was being run with powder 306
15
in the die, the maximum velocity of the deformation wave in the base was utilized as an 307
indicator for the energy loss according to this correlation. The machine-originated factors 308
were assumed to be similarly force-dependent, whether there was powder inside the die or 309
not. This assumption contained a small error, since it was possible that the relative amount 310
of some factors, such as heat dissipation, could have occurred differently when the powder 311
sample was present. The correlation was considered accurate enough for the present work. 312
313
Fig. 2: Machine-originated energy loss during G-HVC measurements, determined from 314
compressions without powder sample (n=3). 315
316
When estimating the displacement due to machine deformation, the results randomly 317
showed some deviation from the trendline (Fig. 3). This was assumed to occur due to small 318
position changes in the base of the system between compressions. According to this 319
hypothesis, when the surfaces of the compressor and the punch were facing each other 320
without any contact angle, the system allowed more deformation during collision. The 321
correlation was considered to be accurate enough for this study and the phenomenon was 322
already expected to occur based on our previous studies. It is of importance to understand 323
that ymach determined here refers to all machine deformation and not only the deformation 324
of the punch. Without thorough analysis and study of its own, it is impossible to determine 325
specifically which parts of the system deform and to what degree. 326
327
Fig. 3: Machine deformation during G-HVC measurements without powder sample (n=3). 328
16
329
3.4. Porosity change and elastic recovery of samples determined by G-HVC measurement 330
Porosity change after five consecutive compressions for the mixtures and individual main 331
ingredients can be seen in Fig. 4. Small amount of lubricant was considered a necessary 332
ingredient for any formulation and therefore magnesium stearate was not specifically 333
studied in this work. It is generally known that excessive amount of magnesium stearate in a 334
formulation produces weaker tablets (Aoshima et al. 2005; Late et al. 2009; Koskela et al. 335
2018). In the present study, the amount of magnesium stearate in the mixtures was 336
reasonable. 337
338
Fig. 4: Sample porosity after each compression for A) individual ingredients and B-D) 339
mixtures (average±standard deviation, n=3). 340
341
MCC and DCP showed similar compression mechanics as in our earlier works (Fig. 4A). MCC 342
showed steady decrease in porosity which implied plastic behaviour. DCP showed small 343
change in porosity and remained most porous of all ingredients. It was already known, that 344
the compression pressure in our setup would not exceed the high yield point of fragmenting 345
DCP, which is reported to be over 300 MPa (Doldán et al. 1995; Nicklasson et al. 2009). 346
Presumably, instead of extensive destruction of the particles, fragmentation for DCP only 347
occurred at high-stress contact points. HPMC reached a steady level at around 10 % porosity 348
which is logical due to its high elastic recovery (which is discussed further later in the text). 349
Theophylline showed most interesting behaviour of all studied materials in a way, that 350
17
negative porosity was already reached after the first compression. It has been reported that 351
theophylline deforms plastically and shows excellent compressibility (Suihko et al. 2001; 352
Chattoraj et al. 2010; Chang & Sun 2017). However, the porosity values shown were based 353
on true density values obtained from helium pycnometer (Table 3). It is possible, that during 354
helium pycnometry measurement, some of the pores inside the particles may be 355
unmeasurable or the loosely bound water content of the sample may distort the result 356
(Viana 2002; Sun 2004; Sun 2005). Consequently, the measured volume is too high and true 357
density value too low. True density of theophylline is reported to be roughly 1.5 g/cm3, 358
which is higher than the value obtained in the present work, as seen in Table 3 (Viana 2002; 359
Sun 2004; Hadžović et al. 2010). This could explain the remarkable negative value obtained. 360
However, even if the value 1.5 was used instead of the measured value, the porosity of 361
theophylline would still reach negative values. MCC and HPMC could also temporarily reach 362
negative porosity during the maximum displacement point which could also be explained by 363
the type of true density measurement. While theophylline could be susceptible to 364
polymorphic changes, it has also been shown not to occur during compaction (Suihko et al. 365
2001; Hadžović et al. 2010). Wet granulation process (with hydroxypropyl cellulose, HPC), on 366
the other hand, has been reported to affect the structure of theophylline, namely the 367
transition to amorphous form (Sakamoto et al. 2016). However, the individual ingredients 368
were not granulated in this work, while studying them with G-HVC method. For the aims of 369
this work, the specific reason for the negative porosity of theophylline is not discussed 370
further. Also, the small amount of theophylline served as a marker ingredient and it 371
presumably affected the results very little, when mixtures were being examined. 372
373

18
Table 3: True density values of the ingredients (average±standard deviation, n=3) 374
375
In Fig. 4B-4D, the differences between physical mixtures and granules seemed rather subtle. 376
The graphs mostly differ at the first compression and after that start resembling each other. 377
Formulations 1 and 3 seemed to consolidate more in granular form compared to their 378
physical mixture forms after all compressions but according to Student’s t-test, there is no 379
significant difference between the results. The most significant difference between the 380
physical mixtures and granules was that the porous fluid bed granules were not as 381
consolidated after the first compression as their respective physical mixtures for 382
Formulations 2 and 3. The fluid bed granules were more porous to begin with and therefore 383
it was not surprising that there were differences in consolidation after first compressions. 384
In-die axial elastic recovery of the samples after the first compression of each set is depicted 385
in Fig. 5. MCC and DCP behaved similarly as in our earlier studies (Tanner et al. 2017 & 386
2018). HPMC showed remarkable elastic recovery, comparable to that of Starch 1500 in our 387
previous study. This is interesting, since HPMC is used as a binder. Despite its binding effect, 388
excessive amount could produce weaker tablets due to its high elastic recovery. This could 389
have been the reason for tablets made of FBG3-granules having the lowest tensile strength 390
in the present work (Fig. 1). Plastic theophylline showed very little elastic recovery, which 391
further contributed to the excellent compressibility of the material. The obtained elastic 392
recovery values of the individual ingredients were in agreement with the existing literature 393
(Picker 2001; Hardy et al. 2006; Chattoraj et al. 2010; Haware et al. 2010; Chang & Sun 394
2017). It is of importance to understand, that in the present work, only immediate in-die 395
19
axial elastic recovery was studied. The elastic recovery values could have been higher, had 396
the samples been removed from the die. 397
Elastic recovery of physical mixtures and the corresponding granules did not seem to differ 398
greatly (Fig. 5). The mixtures contained mostly HPMC and MCC which explained their overall 399
elastic recovery values being between 10 and 15 %. It was slightly unexpected that 400
Formulation 3 did not appear more elastic than the rest of the mixtures even though it 401
contained the largest amount of HPMC. It has been reported that wet granulation may 402
cause changes in MCC structure, for instance, hardening of the material, which could 403
presumably affect elastic recovery (Parker et al. 1991; Suzuki et al. 2001; Badawy et al. 404
2006). It is also possible that within all mixtures, the large amount of MCC dominates the 405
mechanical properties according to the percolation theory and encapsulates the elastic 406
HPMC in its structure. This could also mean, that the compacts made of FBG3-granules 407
contained more stored elastic potential within them after the compressions, when 408
compared to rest of the mixtures. This phenomenon could cause problems later, as the 409
elastic portion could recover slowly during storage, possibly fracturing the compact. In the 410
present work, however, this phenomenon could not be confirmed by these results alone. 411
412
Fig. 5: Immediate in-die axial elastic recovery of samples during the first compression of 413
each set (n=3; average±standard deviation). 414
415
416
417

20
3.5. Compaction energy determined by G-HVC method 418
By adjusting the sample sizes depending on their true density, the total energy input for all 419
the compressions only varied between 1.25 and 1.35 J. Specific compaction energy values 420
for the individual ingredients can be seen in Fig. 6. The fifth compressions were omitted, 421
due to the assumption that there was no more consolidation occurring during the fifth 422
compression and the compaction energy value equalled zero in all cases. Most energy in 423
total was bound to MCC of all samples. The energy intake for theophylline was initially high, 424
but it drastically decreased during later compressions. It is of importance to note that due to 425
high density of DCP (and consequently greater sample size in this work), the amount of 426
specific compaction energy in joules per gram was lowest for DCP. Similarly, HPMC showed 427
surprisingly high energy intake, since its sample size was lowest. It has been reported that 428
MCC shows generally higher values of compaction energy in joules per gram when 429
compared to DCP (Coffin-Beach & Hollenbeck 1983; Aburub et al. 2007; Michaut et al. 430
2010). This was also apparent in our earlier work (Tanner et al. 2018). (Studies comparing 431
HPMC or theophylline to MCC or DCP were not found.) Having uniform sample size could 432
solve the issue of having to explain some of the differences in the results, but for the 433
present work, having uniform total energy input was considered more important. 434
Furthermore, the sample sizes were uniform among the study of mixtures, which was the 435
main object of interest in this work. 436
437
Fig 6: Specific compaction energy for individual ingredients through compressions 1-4 438
(n=3; average±standard deviation). 439
440

21
Comparing energy intake in this manner could be important, when approximating the 441
tabletability of precompressed materials and mixtures. Again, the precompression in this 442
study was done by gently lowering the compressor bar on top of the sample to cause 443
rearrangement in the sample, which did not cause huge impact on the sample. However, 444
when tablets are produced with a rotary tableting machine or when the physical mixture is 445
granulated from a precompressed ribbon, the amount of bound energy during 446
precompaction can be substantial enough to affect the tabletability of the mixture (Patel et 447
al. 2011; Sun & Kleinebudde 2016; Grote & Kleinebudde 2018). As results in Fig. 6 showed, 448
theophylline lost a substantial amount of its energy intake potential between the first and 449
second compression. Based on this result, one could exercise caution when precompressing 450
theophylline, to prevent the loss of tabletability. MCC, on the other hand, showed 451
preferable behaviour for precompression as the difference between first and subsequent 452
compression was smaller. 453
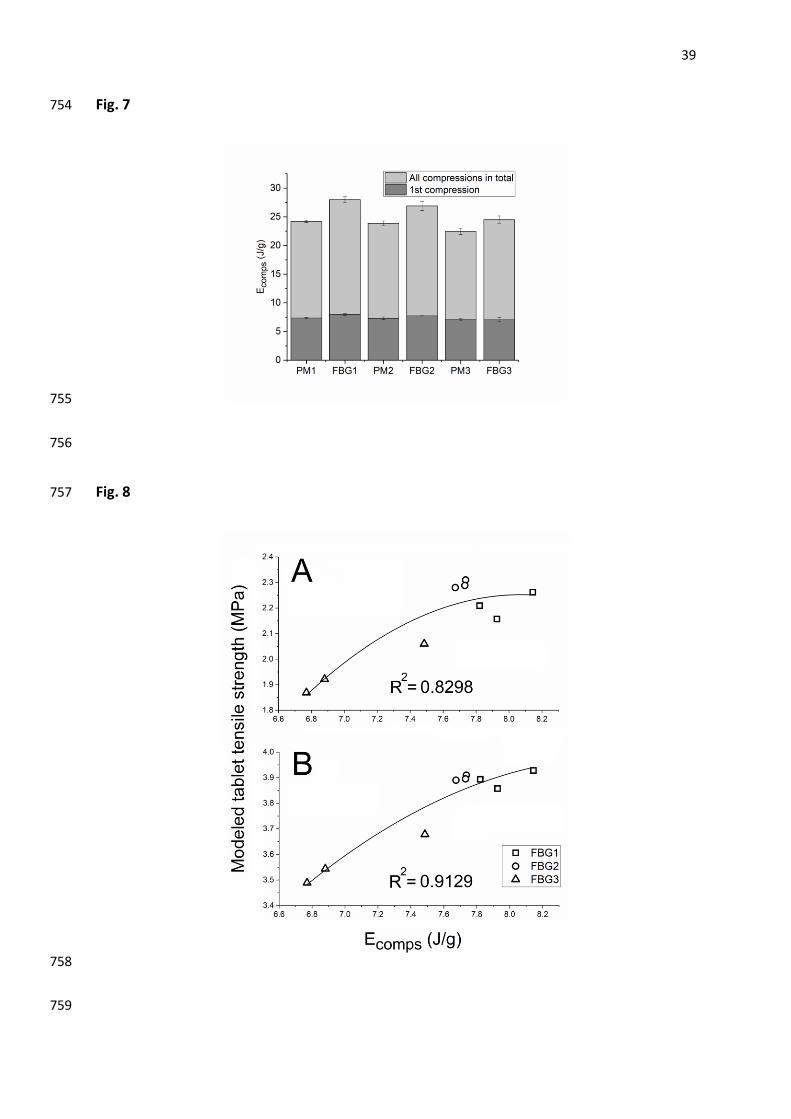
The compaction energy results for the mixtures can be seen in Fig. 7. The results clearly 454
pointed that the total compaction energy for fluid bed granules was generally higher than 455
that of the respective physical mixture. This was not entirely surprising, since fluid bed 456
systems and wet granulation in general may enhance the tabletability of the mixture (Li & 457
Peck 1990; Arndt et al. 2018). The results for Formulations 1 and 2 seemed quite similar, 458
while Formulation 3 showed lower energy intake. 459
460
Fig 7: Compaction energy for mixtures (n=3; average±standard deviation). 461
462
22
3.6. Compaction energy of granule mixtures vs. tablet tensile strength 463
The primary aim of this study was to see if the compaction energy value obtained for the 464
granules by G-HVC method could predict the tensile strength of the tablets made of the 465
same granules. Since the falling compressor bar is slowed down in a unique manner, 466
depending on the properties of powder, the compression pressure varied between different 467
samples (and also between repetitions for a sample). The compression pressure for G-HVC 468
was deliberately set at a lower level than that of the tableting machine and varied between 469
40 and 64 MPa during first compressions. When comparing these numbers to the results 470
from tableting (Fig. 1), it could be seen that a coherent tablet was barely produced during 471
the first compression in G-HVC measurement. Despite this, we aimed to see whether the 472
differences in the compaction energy intake of the samples, even when pressure is low, 473
would predict the strength of tablets produced with a tableting machine. Also, the sample 474
size in G-HVC measurements was smaller (85 mg) than that during the tableting experiment 475
(260 mg). Lower amount of particle contact points assumedly increased the pressure per 476
contact point during G-HVC measurements, allowing the materials to yield as seen in Fig. 4. 477
According to Fig. 1, between 100 and 200 MPa compression pressure, the tensile strength of 478
tablets varied roughly between 2 and 4 MPa. These two compression pressure values were 479
chosen for the models, since all granule mixtures could be then compared without 480
extrapolation. The model predicting tablet tensile strength can be seen in Fig. 8. In this 481
model, only the first compression of each G-HVC-set was considered relevant. During G-HVC 482
measurements, there was also naturally variation in compression pressure. Therefore, in 483
this model, the lowest pressure value obtained during repetitions of the sample was set at 484
100 or 200 MPa and the rest of the repetitions obtained relatively same pressure variation 485
23
as in G-HVC measurements. The model showed good correlation between the compaction 486
energy and tensile strength. 487
488
Fig 8: The correlation between compaction energy obtained from the first compression of 489
each set determined by G-HVC method and the tensile strength of the tablets produced 490
with the tableting machine. A) 100 MPa model pressure; B) 200 MPa model pressure 491
492
It can be stated, that in this study, the determination of compaction energy using the G-HVC 493
method was accurate enough to predict the tensile strength of the tablets. Based on G-HVC 494
results alone, one could have discarded FBG3, had the aim been to produce tablets with 495
higher tensile strength (Fig. 8). There were no remarkable differences between FBG1 and 496
FBG2 and the same result was obtained from both, G-HVC measurements and actual 497
tableting. It is of importance to clarify, that the selection of ingredients and their fractions 498
were only considered for their mechanical properties. Their pharmacological or 499
biopharmaceutical functions were not relevant for this study. 500
3.7. Other general discussion 501
For the tensile strength prediction to succeed by this method, one major issue has to be 502
considered. Low pressure was deliberately used during G-HVC measurements to show 503
whether the material characteristics would predict the energy intake ability and subsequent 504
tablet hardness after compaction with a tableting machine. The material or mixture, 505
however, should not presumably show any drastic differences in their compression 506
mechanics within this pressure range. For instance, had we studied a fragmenting material 507
24
with a yield pressure point somewhere between the G-HVC pressure and actual tableting 508
pressure, major errors could have occurred. It is reasonable to suggest, that the 509
components of the mixture should yield with both pressure levels (during G-HVC and 510
tableting). In our study, we showed that all individual materials consolidated during G-HVC 511
as seen in Fig. 4. Furthermore, coherent compacts were produced from all samples during 512
G-HVC measurements. Therefore, it was assumed that the compression mechanics of the 513
ingredients were not significantly different during G-HVC measurements or actual tableting. 514
One might also argue that the compression pressure during G-HVC should be set at a higher 515
level by default. However, to obtain accurate results with the method, the tooling must not 516
undergo any amount of deformation that is not recovered immediately during the 517
measurement window. We have examined higher pressure levels during G-HVC, only to see 518
that steel can rather easily undergo the type of deformation, that takes more than seconds 519
to recover. 520
This study alone is not sufficient to prove that the compaction energy would always 521
correlate similarly to tensile strength. For instance, having only fragmenting materials in the 522
mixture could give completely different energy values compared to the plastic-elastic 523
compositions depending on which of the bonding phenomena would be dominantly 524
present. One might assume, that the compaction energy could contribute differently to the 525
tensile strength, if the main type of bonding was, for instance, hydrogen bonding instead of 526
Van der Waals bonding, or other way around. It is also important to remember that decent 527
tensile strength is only one of many requirements for a good tablet. 528
The results of this work encourage studying G-HVC method further as an aid in screening for 529
the feasible formulation, primarily during the early stages of pharmaceutical development. 530
25
The setup is rather inexpensive and small in size when compared to tableting machines. 531
Individual samples can be quickly measured with high accuracy. Compaction energy is 532
calculated in a novel and unique manner with the G-HVC method. Machine deformation and 533
other factors affecting energy dissipation during compression have been considered in 534
compaction energy calculations, providing accurate and reproducible results. All data is 535
solely based on the displacement patterns of the compressor and the base of the system 536
without the need for excessive amount of various equipment. Also, the properties of each 537
powder sample ultimately determine the displacement profile, providing unique data for 538
each examined sample even if the differences between their mechanical properties were 539
minor. 540
541
4. Conclusions 542
In conclusion, G-HVC method was successfully utilized to correlate with differences in tablet 543
tensile strength for three different fluid bed granule formulations, with varying MCC and 544
HPMC content. One could have correctly discarded the formulation with the highest HPMC 545
content based on G-HVC results alone, had the aim been to produce tablets with higher 546
tensile strength. Compaction energy, calculated in a novel manner with the method, 547
showed good correlation with the tensile strength of the corresponding tablets. Porosity, 548
elastic recovery and compaction energy for both mixtures and individual ingredients were 549
also examined. All data was solely based on the distance-time data, which was unique for 550
each powder sample. Even minor differences seen in the G-HVC data, reflected the results 551
from actual tableting, proving the method to be applicable in practical pharmaceutical 552
formulation development. 553

26
554
Conflicts of interest 555
None 556
557
Acknowledgements 558
This paper is dedicated to emeritus professor Jouko Yliruusi’s remarkable career as a 559
pharmacist, teacher, supervisor and researcher. His boundless imagination has inspired 560
many and his impact in the field of pharmacy is too large to measure. His positive and easy-561
going attitude has given strength to us all, his students and colleagues. With gratitude, we 562
wish him peaceful days of retirement. Yet knowing him, the work is not over. 563
Also, we would like to kindly acknowledge Tuomas Saarinen, Robin De Corte and Visa 564
Mattila for collaboration. 565
This research did not receive any specific grant from funding agencies in the public, 566
commercial, or not-for-profit sectors. 567
568
569
570
571
572
573
27
References 574
Aburub, A., Mishra, D., Buckner, I., 2007. Use of compaction energetics for understanding 575
particle deformation mechanism. Pharm. Dev. Technol. 12, 405–414. 576
Akande, O.F., Rubinstein, M.H., Rowe, P.H., Ford, J.L., 1997. Effect of compression speeds on 577
the compaction properties of a 1:1 paracetamol–microcrystalline cellulose mixture prepared 578
by single compression and by combinations of pre-compression and main-compression. Int. 579
J. Pharm. 157, 127–136. 580
Akseli, I., Ladyzhynsky, N., Katz, J., He, X., 2013. Development of predictive tools to assess 581
capping tendency of tablet formulations. Powder Technol. 236, 139–148. 582
Amidon, G.E., Houghton, M.E., 1995. The effect of moisture on the mechanical and powder 583
flow properties of microcrystalline cellulose. Pharm. Res 12, 923–929. 584
Amin, M.C.I., Fell, J.T., 2004. Comparison studies on the percolation thresholds of binary 585
mixture tablets containing excipients of plastic/brittle and plastic/plastic deformation 586
properties. Drug Dev. Ind. Pharm. 30, 937–945. 587
Antikainen, O., Yliruusi, J., 2003. Determining the compression behaviour of pharmaceutical 588
powders from the force-distance compression profile. Int. J. Pharm. 252, 253–261. 589
Aoshima, H., Miyagisnima, A., Nozawa, Y., Sadzuka, Y., Sonobe, T., 2005. Glycerin fatty acid 590
esters as a new lubricant of tablets. Int. J. Pharm. 293, 25–34. 591
Arndt, O.-R., Baggio, R., Adam, A.K., Harting, J., Franceschinis, E., Kleinebudde, P., 2018. 592
Impact of different dry and wet granulation techniques on granule and tablet properties: A 593
comparative study. J. Pharm. Sci. 107, 3143–3152. 594
28
Badawy, S.I.F., Gray, D.B., Hussain, M.A., 2006. A study on the effect of wet granulation on 595
microcrystalline cellulose particle structure and performance. Pharm. Res. 23, 634–640. 596
Busignies, V., Leclerc, B., Porion, P., Evesque, P., Couarraze, G., Tcholeroff, P., 2006. 597
Compaction behaviour and new predictive approach to the compressibility of binary 598
mixtures of pharmaceutical excipients. Eur. J. Pharm. Biopharm. 64, 66–74. 599
Chang, S.-Y., Sun, C.C., 2017. Superior plasticity and tabletability of theophylline 600
monohydrate. Mol. Pharm. 14, 2047–2055. 601
Chattoraj, S., Shi, L., Sun, C.C., 2010. Understanding the relationship between crystal 602
structure, plasticity and compaction behaviour of theophylline, methyl gallate, and their 1:1 603
co-crystal. CrystEngComm 12, 2466–2472. 604
Chitu, T.M., Oulahna, D., Hemati, M., 2011. Wet granulation in laboratory scale high shear 605
mixers: Effect of binder properties. Powder Technol. 206, 25–33. 606
Coffin-Beach, D.P., Hollenbeck, R.G., 1983. Determination of the energy of tablet formation 607
during compression of selected pharmaceutical powders. Int. J. Pharm. 17, 313–324. 608
Doldán, C., Souto, C., Concheiro, A., Martínez-Pacheco, R., Gómez-Amoza, J.L., 1995. 609
Dicalcium phosphate dihydrate and anhydrous dicalcium phosphate for direct compression: 610
a comparative study. Int. J. Pharm. 124, 69–74. 611
Dor, P.J.M., Fix, J.A., 2000. In vitro determination of disintegration time of quick-dissolve 612
tablets using a new method. Pharm. Dev. Technol. 5, 575–577. 613
Furukawa, R., Chen, Y., Horiguchi, A., Takagaki, K., Nishi, J., Konishi, A., Shirakawa, Y., 614
Sugimoto, M., Narisawa, S., 2015. Numerical evaluation of the capping tendency of 615
29
microcrystalline cellulose tablets during a diametrical compression test. Int. J. Pharm. 493, 616
182–191. 617
Grote, S., Kleinebudde, P., 2018. Roll compaction/dry granulation of dibasic calcium 618
phosphate anhydrous—Does the morphology of the raw material influence the tabletability 619
of dry granules? J. Pharm. Sci. 107, 1104–1111. 620
Gupta, A., Hunt, R.L., Shah, R.B., Sayeed, V.A., Khan, M.A., 2009. Disintegration of highly 621
soluble immediate release tablets: a surrogate for dissolution. AAPS PharmSciTech 10, 495–622
499. 623
Hadžović, E., Betz, G., Hadžidedić, Š., El-Arini, S.K., Leuenberger, H., 2010. Roller compaction 624
of different pseudopolymorphic forms of theophylline: Effect on compressibility and tablet 625
properties. Int. J. Pharm. 396, 53–62. 626
Hardy, I.J., Cook, W.G., Melia, C.D., 2006. Compression and compaction properties of 627
plasticised high molecular weight hydroxypropylmethylcellulose (HPMC) as a hydrophilic 628
matrix carrier. Int. J. Pharm. 311, 26–32. 629
Haware, R.V., Tho, I., Bauer-Brandl, A., 2010. Evaluation of a rapid approximation method 630
for the elastic recovery of tablets. Powder Technol. 202, 71–77. 631
Jain, S., 1999. Mechanical properties of powders for compaction and tableting: an overview. 632
Pharm. Sci. Technol. Today 2, 20–31. 633
Jivraj, M., Martini, L.G., Thomson C.M., 2000. An overview of the different excipients useful 634
for the direct compression of tablets. Pharm. Sci. Technol. Today 3, 58–63. 635

30
Koskela, J., Morton, D.A.V., Stewart, P.J., Juppo, A.M., Lakio, S., 2018. The effect of 636
mechanical dry coating with magnesium stearate on flowability and compactibility of 637
plastically deforming microcrystalline cellulose powders. Int. J. Pharm. 537, 64–72. 638
Kuentz, M., Leuenberger, H., 2000. A new theoretical approach to tablet strength of a binary 639
mixture consisting of a well and a poorly compactable substance. Eur. J. Pharm. Biopharm. 640
49, 151–159. 641
Late, S.G., Yu, Y.-Y., Banga, A.K., 2009. Effects of disintegration-promoting agent, lubricants 642
and moisture treatment on optimized fast disintegrating tablets. Int. J. Pharm. 365, 4–11. 643
Leane, M., Pitt, K., Reynolds, G., The Manufacturing Classification System (MCS) Working 644
Group, 2015. A proposal for a drug product Manufacturing Classification System (MCS) for 645
oral solid dosage forms. Pharm. Dev. Technol. 20, 12-21. 646
Li, Q., Rudolph, V., Weigl, B., Earl, A., 2004. Interparticle van der Waals force in powder 647
flowability and compactibility. Int. J. Pharm. 280, 77–93. 648
Li, L.C., Peck, G.E., 1990. The effect of agglomeration methods on the micromeritic 649
properties of a maltodextrin product, Maltrin 150™. Drug Dev. Ind. Pharm. 16, 1491–1503. 650
Michaut, F., Busignies, V., Fouquereau, C., Huet De Barochez, B., Leclerc, B., Tchoreloff, P., 651
2010. Evaluation of a rotary tablet press simulator as a tool for the characterization of 652
compaction properties of pharmaceutical products. J. Pharm. Sci. 99, 2874–2885. 653
Mohan, S., 2012. Compression physics of pharmaceutical powders: a review. Int. J. Pharm. 654
Sci. Res. 3, 1580–1592. 655
31
Nicklasson, F., Johansson, B., Alderborn, G., 1999. Occurrence of fragmentation during 656
compression of pellets prepared from a 4 to 1 mixture of dicalcium phosphate dihydrate 657
and microcrystalline cellulose. Eur. J. Pharm. Sci. 7, 221–229. 658
Nokhodchi, A., Ford, J.L., Rowe, P.H., Rubinstein, M.H., 1996. The effects of compression 659
rate and force on the compaction properties of different viscosity grades of 660
hydroxypropylmethylcellulose 2208. Int. J. Pharm. 129, 21–31. 661
Nokhodchi, A., 2005. An overview of the effect of moisture on compaction and compression. 662
Pharm. Technol. 29, 46–66. 663
Parker, M.D., York, P., Rowe, R.C., 1991. Binder-substrate interactions in wet granulation. 2: 664
The effect of binder molecular weight. Int. J. Pharm. 72, 243–249. 665
Patel, S., Kaushal, A.M., Bansal, A.K., 2006. Compression physics in the formulation 666
development of tablets. Crit. Rev. Ther. Drug Carrier Syst. 23, 1–65. 667
Patel, S., Kaushal, A.M., Bansal, A.K., 2007. Effect of particle size and compression force on 668
compaction behavior and derived mathematical parameters of compressibility. Pharm. Res. 669
24, 111–124. 670
Patel, S., Dahiya, S., Sun, C.C., Bansal, A.K., 2011. Understanding size enlargement and 671
hardening of granules on tabletability of unlubricated granules prepared by dry granulation. 672
J. Pharm. Sci. 100, 758–766. 673
Picker, K.M., 2001. Time dependence of elastic recovery for characterization of tableting 674
materials. Pharm. Dev. Technol. 6, 61–70. 675
Pitt, K.G., Heasley, M.G., 2013. Determination of the tensile strength of elongated tablets. 676
Powder Technol. 238, 169–175. 677
32
Planinšek, O., Pišek, R., Trojak, A., Srčič, S., 2000. The utilization of surface free-energy 678
parameters for the selection of a suitable binder in fluidized bed granulation. Int. J. Pharm. 679
207, 77–88. 680
Rashid, I., Mahmoud, M.H., Omari, A., Badwan, A.A., 2013. From native to multifunctional 681
starch-based excipients designed for direct compression formulation. Starch 65, 552–571. 682
Rohrs, B.R., Amidon, G.E., Meury, R.H., Secreast, P.J., King, H.M., Skoug, C.J., 2006. Particle 683
size limits to meet USP content uniformity criteria for tablets and capsules. J. Pharm. Sci. 95, 684
1049–1059. 685
Sakamoto, T., Sasaki, T., Katori, N., Goda, Y., 2016. Analysis of pseudo-polymorphism 686
conversion of theophylline during wet granulation and drying processes and effect of binder 687
on dehydration and amorphization. J. Infrared Millim. Terahertz Waves 37, 1007–1020. 688
Shang, C., Sinka, I.C., Jayaraman, B., Pan, J., 2013. Break force and tensile strength 689
relationships for curved faced tablets subject to diametrical compression. Int. J. Pharm. 442, 690
57–64. 691
Suihko, E., Lehto, V.-P., Ketolainen, J., Laine, E., Paronen, P., 2001. Dynamic solid-state and 692
tableting properties of four theophylline forms. Int. J. Pharm. 217, 225–236. 693
Sun, C., Grant, D.J.W., 2001. Effects of initial particle size on the tableting properties of L-694
lysine monohydrochloride dihydrate powder. Int. J. Pharm. 215, 221–228. 695
Sun, C.C., 2004. A novel method for deriving true density of pharmaceutical solids including 696
hydrates and water-containing powders. J. Pharm. Sci. 93, 646–653. 697
Sun, C.C., 2005. True density of microcrystalline cellulose. J. Pharm. Sci. 94, 2132–2134. 698
33
Sun, C.C., Hou, H., Gao, P., Ma, C., Medina, C., Alvarez, F.J., 2009. Development of a high 699
drug load tablet formulation based on assessment of powder manufacturability: moving 700
towards quality by design. J. Pharm. Sci. 98, 239–247. 701
Sun, C.C., Kleinebudde, P., 2016. Mini review: Mechanisms to the loss of tabletability by dry 702
granulation. Eur. J. Pharm. Biopharm. 106, 9–14. 703
Suzuki, T., Kikuchi, H., Yamamura, S., Terada, K., Yamamoto, K., 2001. The change in 704
characteristics of microcrystalline cellulose during wet granulation using a high-shear mixer. 705
J. Pharm. Pharmacol. 53, 609–616. 706
Tanner, T., Antikainen, O., Ehlers, H., Yliruusi, J., 2017. Introducing a novel gravitation-based 707
high-velocity compaction analysis method for pharmaceutical powders. Int. J. Pharm. 526, 708
31–40. 709
Tanner, T., Antikainen, O., Ehlers, H., Blanco, D., Yliruusi, J., 2018. Examining mechanical 710
properties of various pharmaceutical excipients with the gravitation-based high-velocity 711
compaction analysis method. Int. J. Pharm. 539, 131–138. 712
Thoorens, G., Krier, F., Leclercq, B., Carlin, B., Evrard, B., 2014. Microcrystalline cellulose, a 713
direct compression binder in a quality by design environment—a review. Int. J. Pharm. 473, 714
64–72. 715
Viana, M., Jouannin, P., Pontier, C., Chulia, D., 2002. About pycnometric density 716
measurements. Talanta 57, 583–593. 717
Virtanen, S. Antikainen, O., Räikkönen, H., Yliruusi, J., 2010. Granule size distribution of 718
tablets. J. Pharm. Sci. 99, 2061–2069. 719

34
Wu, S-J., Sun, C.C., 2007. Insensitivity of compaction properties of brittle granules to size 720
enlargement by roller compaction. J. Pharm. Sci. 96, 1445–1450. 721
Zhang, Y., Law, Y., Chakrabarti, S., 2003. Physical properties and compact analysis of 722
commonly used direct compression binders. AAPS PharmSciTech 4, 489–499. 723
724
35
Table 1 725
Weight-%
MCC DCP HPMC Theophylline Magn.stear.
Formulation 1:
PM1/FBG1
73 20 5 1 1
Formulation 2:
PM2/FBG2
68 20 10 1 1
Formulation 3:
PM3/FBG3
58 20 20 1 1
726
Table 2 727
d10 (μm) d50 (μm) d90 (μm)
FBG1 91±1 292±6 481±8
FBG2 94±3 497±14 788±20
FBG3 266±3 639±5 984±21
728
Table 3 729
True density (g/cm3)
MCC 1.439±0.002
DCP 2.365±0.014
HPMC 1.233±0.005
Theophylline 1.382±0.005
Magnesium stearate 1.026±0.008
730
731
36
Fig. 1 732
733
734
Fig. 2 735
736
737
738
739
740

37
Fig. 3 741
742
743
Fig. 4 744
745
746
747

38
Fig. 5 748
749
750
Fig. 6 751
752
753
39
Fig. 7 754
755
756
Fig. 8 757
758
759