Embed Size (px)
Citation preview
Hydrol. Earth Syst. Sci., 20, 4031–4042, 2016www.hydrol-earth-syst-sci.net/20/4031/2016/doi:10.5194/hess-20-4031-2016© Author(s) 2016. CC Attribution 3.0 License.
Predicting the salt water intrusion in the Shatt al-Arab estuaryusing an analytical approachAli D. Abdullah1,2,3, Jacqueline I. A. Gisen4,5, Pieter van der Zaag1,2, Hubert H. G. Savenije2, Usama F. A. Karim6,Ilyas Masih1, and Ioana Popescu1,7
1Department of Integrated Water System and Governance, UNESCO-IHE Institute for Water Education,Westvest 7, 2611 AX, Delft, the Netherlands2Water Resources Section, Delft University of Technology, Delft, the Netherlands3Department of Civil Engineering, Basra University, Basra, Iraq4Centre for Earth Resources Research and Management, University Malaysia Pahang, Lebuhraya Tun Razak,Gambang, 26300 Kuantan, Pahang, Malaysia5Faculty of Civil Engineering and Earth Resources, University Malaysia Pahang, Lebuhraya Tun Razak,Gambang, 26300 Kuantan, Pahang, Malaysia6Department of Civil Engineering, University of Twente, P.O. Box 217, 7500 AE, Enschede, the Netherlands7Faculty of Civil Engineering, Politehnica University of Timisoara, Romania
Correspondence to: Ali D. Abdullah ([email protected], [email protected])
Received: 22 March 2016 – Published in Hydrol. Earth Syst. Sci. Discuss.: 28 April 2016Revised: 21 September 2016 – Accepted: 22 September 2016 – Published: 6 October 2016
Abstract. Longitudinal and vertical salinity measurementsare used in this study to predict the extent of inland seawaterintrusion in a deltaic river estuary. A predictive model is con-structed to apply to the specific tidal, seasonal, and dischargevariability and geometric characteristics of the Shatt al-ArabRiver (SAR) situated along the border of Iraq and Iran. Reli-able hydrologic simulation of salinity dynamics and seawa-ter intrusion was lacking prior to this study. Tidal excursionis simulated analytically using a 1-D analytical salt intrusionmodel with recently updated equations for tidal mixing. Themodel was applied under different river conditions to analysethe seasonal variability of salinity distribution during wet anddry periods near spring and neap tides between March 2014and January 2015. A good fit is possible with this model be-tween computed and observed salinity distribution. Estimat-ing water abstractions along the estuary improves the perfor-mance of the equations, especially at low flows and with awell-calibrated dispersion–excursion relationship of the up-dated equations. Salt intrusion lengths given the current datavaried from 38 to 65 km during the year of observation. Withextremely low river discharge, which is highly likely there,we predict a much further distance of 92 km. These new pre-dictions demonstrate that the SAR, already plagued with ex-
treme salinity, may face deteriorating water quality levels inthe near future, requiring prompt interventions.
1 Introduction
Discharge of fresh river water into the ocean is closely re-lated to vertical and longitudinal salinity variations along anestuary (e.g. Savenije et al., 2013; Whitney, 2010; Becker etal., 2010; Wong, 1995; MacKay and Schumann, 1990). Riverdischarge also has a noticeable effect on the tidal range, pri-marily through the friction term (the amount of energy perunit width lost by friction) (Savenije, 2005). A decrease inriver discharge into an estuary could increase the tidal rangeand the wave celerity, and consequent increase in salinity lev-els (Cai et al., 2012). Upstream developments of large damsand water storage facilities change the nature of river flowand subsequently alter river hydrology and quality (Vörös-marty and Sahagian, 2000; Helland-Hansen et al., 1995). TheShatt al-Arab River (SAR) which discharges through its estu-ary at the border between Iran and Iraq into the gulf is facingserious reductions in freshwater inflows upstream and fromits tributaries, as well as significant salt intrusion downstream
Published by Copernicus Publications on behalf of the European Geosciences Union.
4032 A. D. Abdullah et al.: Predicting the salt water intrusion in the Shatt al-Arab estuary
(Abdullah et al., 2015). The alteration of river discharge alsoaffects the estuarine ecosystem in terms of sediments, nutri-ents, dissolved oxygen, and bottom topography (Sklar andBrowder, 1998). All these problems are strongly featured inthe SAR.
The increases in salinity along the SAR, particularlycaused by salt intrusion, have become a threat to the peo-ple and environment alike. Generally, salt water intrusionmakes the river water unfit for human consumption and un-acceptable for irrigation practices (Abdullah et al., 2016; Al-Tawash et al., 2013). Saline water in the SAR estuary comesfrom both natural (seawater intrusion) and anthropogenicsources. Thus, the pattern of the salinity variation is com-plex because of the dynamic spatial and temporal interactionbetween salinity sources. Available studies on the SAR iden-tify the escalating pressure of salinity increment and its con-sequences for water users as well as the ecosystem (e.g. Ab-dullah et al., 2016; Al-Tawash et al., 2013; Fawzi and Mahdi,2014), but detailed information on the extent of salt water in-trusion under different conditions is lacking. Hence, there isa need to investigate the impact of seawater intrusion amongother sources on the river salinity, and to analyse the dynam-ics of the saline water–freshwater interface for effective wa-ter management.
Different approaches have been used to study the rela-tionship between saline water and freshwater in estuaries.Alber (2002) proposed a conceptual model for managingfreshwater discharge into estuaries. Wang et al. (2011) usedan empirical approach, conducting three hydrological sur-veys along six locations around the Yellow River mouthto investigate the effect of abrupt changes in the river dis-charge on the salinity variations. Using a numerical model,Bobba (2002) analysed the mechanism of salt water andfreshwater flow in the Godavari Delta and found that fresh-water withdrawals contribute to the advance in seawater in-trusion. Liu et al. (2004) applied a 2-D model to estimate thesalinity changes in the Tanshui River, showing that the sig-nificant salinity increase is a result of reservoir constructionand bathymetric changes. A 3-D model was used by Vaz etal. (2009) to study the patterns of saline water in the Espin-heiro tidal channel. The result indicates that the model under-estimated the salinity distributions for high river inflow. Daset al. (2012) used a hydrology–hydrodynamics model to ex-amine salinity variations under different water diversion sce-narios in the Barataria estuary, and discovered that the diver-sions have a strong impact on salinity in the middle sectionof the estuary and a minor impact in the upper section.
Analytical approaches describing salinity distribution inestuaries have been used by Ippen and Harlemen (1961),Prandle (1985), and Savenije (1986). An analytical solutionis able to provide important knowledge about the relation-ship between the tide, river flow, and geometry of the tidalchannel. The 1-D modelling is usually based on a number ofassumptions to simplify the set of equations. Several avail-able models generally assumed a constant tidal channel cross
section to linearize and simplify the calculation processes. Inthis study the 1-D analytical salt intrusion model proposedby Savenije (1986, 1989, 1993) is considered, which usesthe more natural exponential geometry and requires a min-imal amount of data. The model has been successfully ap-plied to several single-channel estuaries worldwide (e.g. Ris-ley et al., 1993; Horrevoets et al., 2004; Gisen et al., 2015a).Moreover, it can also describe the tidal propagation in multi-channel estuaries (Zhang et al., 2012) as well as estuarieswith a slightly sloping bottom (Nguyen and Savenije, 2006;Cai et al., 2015).
The aim of this study is to determine the real extent ofsalt intrusion into the SAR estuary. This is done by apply-ing the 1-D analytical salt intrusion model combined withthe revised predictive equations for tidal mixing of Gisen etal. (2015b). Then the predictive model was used to examinethe consequences of changes in river flow for the salinity dis-tribution.
2 Research area
The SAR is located in southern Iraq and its estuary is con-nected to the gulf (Fig. 1). The total length of the river is195 km, of which the last 95 km serve as a boundary betweenIraq and Iran. The estuary receives freshwater from fourmain tributaries. The Tigris and Euphrates rivers originate inTurkey and form the SAR at their confluence near the city ofQurna, Iraq. The other two tributaries, Karkheh and Karun,originate in Iran. The Karkheh is connected with the SARthrough a system of marshes, while the Karun discharges intothe SAR at approximately 87 km from the mouth.
The estuary experiences a tidal cycle of approximately12 h 25 min with notable flood and ebb tides (Fig. 2). Theestuary has a mixed-diurnal and semi-diurnal tide with suc-cessive spring and neap tide. The tidal range (the differencebetween the water levels at high water (HW) and low water(LW)) varies from 1 m (neap) to 3 m (spring). Salinity levelsfluctuate at an hourly scale depending on the tide cycles andfreshwater discharge. Salinity increases during flood tidesand decreases during ebb. The impact of freshwater inflowscan be clearly recognized during neap tide and ebb periods.The salinity level also varies along the year; for example, thehighest value measured in the year 2014 was 40 kg m−3 dur-ing summer and the lowest value was 0.7 kg m−3.
The SAR is the main surface water source for daily con-sumption and agricultural uses in the region and servesaround 3 million people, the majority living in Basra. Ru-ral communities live along the river and around the marshesand derive their livelihoods mainly from agriculture and live-stock. The main agricultural lands extend along the riverbanks with large date palm plantations. A variety of hu-man activities along the SAR and its tributaries deterioratesthe water quality and has significantly increased the salin-ity concentration over time. In addition, the decreases in
Hydrol. Earth Syst. Sci., 20, 4031–4042, 2016 www.hydrol-earth-syst-sci.net/20/4031/2016/

A. D. Abdullah et al.: Predicting the salt water intrusion in the Shatt al-Arab estuary 4033
Figure 1. The salient features of the Shatt al-Arab region (left) and the aerial view of the estuary from Google Earth with the measurementlocations (not to scale) (right).
Figure 2. Tidal elevation at Faw station in June 2014.
freshwater inflows into the estuary due to upstream waterwithdrawals have allowed the seawater to intrude furtherupstream. Currently the Tigris is the main source of fresh-water for the SAR; its discharge ranges between 30 and100 m3 s−1. The total discharge from other tributaries, ex-cept the Karun, ranges between 0 and 10 m3 s−1. The avail-able information on discharge of the Karun is limited andinconclusive. Most relevant is Ahvaz station in Iran (UN-ESCWA and BGR, 2013; Salarijazi et al., 2012; Afkhamiet al., 2007), the most downstream gauging station but stilllocated approximately 200 km upstream of the confluencewith the SAR. Due to large-scale water developments, themean annual discharge of the Karun has experienced a con-sistent negative trend from 818 to 615 m3 s−1 before and after1963 respectively (UN-ESCWA and BGR, 2013). WhereasSalarijazi et al. (2012) reported a mean annual river dis-
charge at Ahvaz of 1442 m3 s−1 for the period 1954–2005,the mean monthly river discharge for the period between1978 and 2009 was only 667 m3 s−1 (Meysam Salarijazi, per-sonal communication, 2015). However, the Karun River dis-charge into the SAR is believed to have decreased even morein recent years due to continued increases in water abstrac-tions upstream. The combination of tide and fluctuating riverdischarge makes it difficult to recognize the real extent ofsalt intrusion and its impact on the horizontal salinity patternalong the river under different conditions.
Adding to the complexity of studying salt intrusion in theShatt al-Arab is that it is the border river between Iraq andIran, with strict security conditions. This does not make iteasy to organize hydrometric surveys by speedboat and carryout salinity observations during an entire tidal cycle. As aresult, the field data collected during this study and the resultsobtained by the analytical model form a unique data set forthe region.
3 Theory of the analytical model
During a tidal cycle, the tidal velocity is near zero just be-fore the tidal current changes direction. This situation isknown as high water slack (HWS) just before the directionchanges seaward, and low water slack (LWS) just before thedirection changes landward. The model originally proposedby Savenije (1989), calibrated with measurements made atHWS, describes the salinity distribution in convergent estu-
www.hydrol-earth-syst-sci.net/20/4031/2016/ Hydrol. Earth Syst. Sci., 20, 4031–4042, 2016

4034 A. D. Abdullah et al.: Predicting the salt water intrusion in the Shatt al-Arab estuary
Figure 3. Sketch of the estuary, the longitudinal profile, and the topview.
aries as a function of the tide, river flow, and geometry, us-ing Van der Burgh’s coefficient (K) and the dispersion co-efficient (D0) at the mouth. A conceptual sketch of the 1-Dmodel of salt intrusion is shown in Fig. 3.
The geometry of an estuary can be presented by expo-nential functions describing the convergence of the cross-sectional area and width along the estuary as
A= Ao exp−xa1 for 0< x ≤ x1, (1)
A= A1 exp−(x−x1)a2 for x > x1, (2)
B = Bo exp−xb1 for 0< x ≤ x1, (3)
B = B1 exp−(x−x1)b2 for x > x1, (4)
where Ao and Bo are the cross-sectional area (L2) and width(L) at the estuary mouth (x = 0), A1 and B1 are the cross-sectional area and width at the inflection point (x = x1), anda1,2 and b1,2 are the cross-sectional and width convergencelengths (L) at x ≤ x1 and x > x1 respectively.
Combining Eq. (1) with Eq. (2), and Eq. (3) with Eq. (4),describes the longitudinal variation of the depth:
h= hoexp−x(a1−b1)a1b1 for 0< x ≤ x1, (5)
h= h1exp−(x−x1)(a2−b2)
a2b2 for x > x1, (6)
where h, ho, and h1 are the cross-sectional average waterdepths (L) at distance x from the mouth, at the estuary mouth,and at the inflection point respectively.
Integrating the geometry equations into the salt balanceequation of Van der Burgh (1972) yields a steady-state longi-tudinal salinity distribution along the estuary (see Savenije,2005) under HWS condition:
S− Sf = So− Sf
(D
Do
) 1K
for 0< x ≤ x1, (7)
S− Sf = S1− Sf
(D
D1
) 1K
for x > x1, (8)
where Do, D, and D1 (L2 T−1) are the dispersion coefficientat the estuary mouth, at any distance x, and at the inflection
point, S0, S1 and S (M L−3) are the salinity at the estuarymouth, inflection point, and distance x respectively, Sf is thefreshwater salinity, and K is the Van der Burgh coefficientwhich according to Savenije (2005) has a value between 0and 1, where
D
Do= 1−βo
(exp
(x
a1
)− 1
)for 0< x ≤ x1, (9)
and
D
D1= 1−β1
(exp
(x− x1
a2
)− 1
)for x > x1, (10)
with
βo =Ka1Qf
DoAofor 0< x ≤ x1, (11)
β1 =Ka2Qf
D1A1for x > x1. (12)
βo and β1 are the dispersion reduction rate (–) at the estuarymouth and at the inflection point respectively, and Qf is thefreshwater discharge.
The salt intrusion model is used to estimate the salt intru-sion length, which can be determined using low water slack(LWS, the lower extreme salt intrusion), high water slack(HWS, the upper salt intrusion), or tidal average (TA, theaverage of the full tidal cycle). Savenije (2012) proposed tocalibrate the model on measurements carried out at HWS.This is to obtain the maximum salt intrusion over the tidalcycle. The salinity distribution can be computed at LWS andTA based on the relation between salinity distributions dur-ing the three conditions. The salt distribution curve at HWScould be shifted downstream over a horizontal distance equalto the tidal excursion length (E) and half of the tidal excur-sion length (E/2) to obtain the salt distribution curve at LWSand TA conditions respectively. The model variables can bedetermined from field observations and shape analysis, whilethe two parameters K and D0 remain unknown, in additionto Qf, which is difficult to determine in the tidal region. Tofacilitate the calibration process, D0 and Qf are combined inone variable, the mixing coefficient α0 (L−1):
α0 =D0
Qf(13)
After model calibration, the values for K and α0 are knownand the salinity at any point along the estuary can be cal-culated. Finally the salt intrusion length (L) during HWS isobtained by
LHWS= x1+ a2 ln
(1β1+ 1
). (14)
The calibration parameters can be obtained based on fieldmeasurements, but to turn the model into a predictive model,a separate equation for D0 is required. A predictive equationfor D0 was presented by Savenije (1993) and then improved
Hydrol. Earth Syst. Sci., 20, 4031–4042, 2016 www.hydrol-earth-syst-sci.net/20/4031/2016/
A. D. Abdullah et al.: Predicting the salt water intrusion in the Shatt al-Arab estuary 4035
by Gisen et al. (2015b), who moved the boundary conditionto a more identifiable inflection point x1, based on observa-tions made for a large number of estuaries worldwide as
D1 = 0.1167E1υ1N0.57R (15)
with
NR =1ρ ghQfT
ρAEυ2 (16)
and
E =υT
π. (17)
NR is the estuarine Richardson number (–), the ratio of po-tential energy of the buoyant freshwater to the kinetic energyof the tide, ρ and 1ρ (M L−3) are the water density and thedensity difference over the intrusion length, g is the gravita-tional acceleration (L T−2), T is the tidal period (T), υ is thevelocity amplitude (L T−1), and E is the tidal excursion (L).
This study tests the predictive performance of the 1-D an-alytical salt intrusion model, combined with new revised pre-dictive equations to analyse the real extent of seawater intru-sion in the SAR estuary under different river discharge con-ditions.
4 Data collection
The 1-D analytical salt intrusion model is based on a num-ber of parameters that can be obtained through field sur-veys. Variables such as K and D0 are not directly measur-able, and therefore they are obtained by calibrating the sim-ulated salinity curve to the data sets from the salt intrusionmeasurements. For this study four measurement campaignswere conducted, mainly measuring salt concentrations andwater levels. The measurements took place during the wetand dry periods at spring and neap tides. These were on 26March (neap-wet), 16 May (spring-dry), 24 September 2014(spring-dry), and 5 January 2015 (spring-wet).
Salinity measurements were conducted at the moment justbefore the flow changes direction (HWS and LWS). TheHWS and LWS represent the envelope of the vertical salinityvariation during tidal cycles, and are also used to determinethe longitudinal tidal excursion. A moving boat techniquewas used in the field survey in which the boat moved with thespeed of the tidal wave to capture the slack moment. Startingfrom the mouth of the estuary and in the middle of the course,the salinity variations during the tidal cycle were observed.A conductivity meter, YSI EC300A (https://www.ysi.com)with a cable length of 10 m, was used to measure the verticalsalinity profile for each meter depth from the bottom to thesurface, and it was done repetitively at an interval of 3–4 km(longitudinally) until the river salinity was reached (in thiscase 1.5 kg m−3).
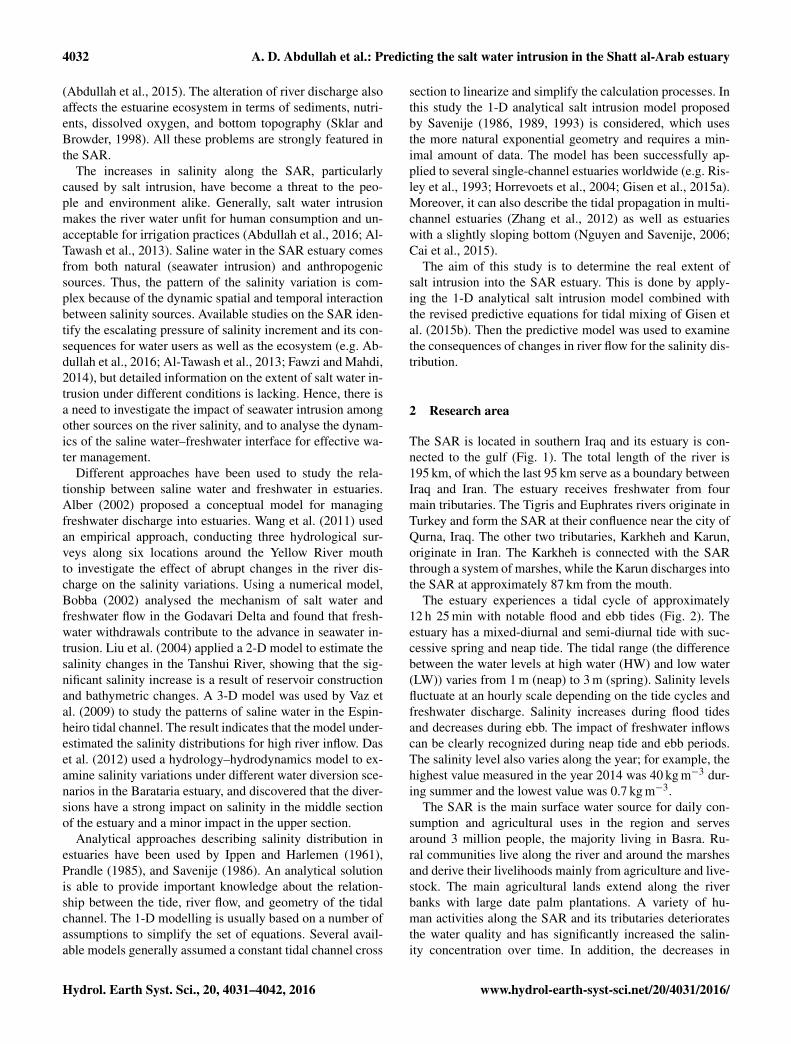
Figure 4. SAR geometric characteristics (A, B, h: measured; A′,B ′, h′: Eqs. 1–6).
The required information on river discharge and cross-sectional profiles was provided by the local water authority.It is difficult to measure the discharge accurately in an es-tuary considering the tidal fluctuation. Hence, the dischargedata from the nearest (most downstream) station were usedin the analysis. The daily streamflow data of all the tribu-taries within the country were obtained from the Departmentof Water Resources in Iraq. However, there were no data onthe discharge of one tributary, the Karun River, located inneighbouring Iran. Experts of the water resources authorityin Basra indicated that the average discharge of the KarunRiver was estimated at 40 m3 s−1. River cross-sectional datawere collected based on the last survey carried out in 2012by the GDSD (General Directorate of Study and Design).
5 Salinity modelling
5.1 Geometric characteristics
Results of the cross-sectional area, width, and depth are pre-sented in a semi-logarithmic scale plot in Fig. 4. This fig-ure shows a good agreement between the computed cross-sectional areas A, width B, and depth h based on Eqs. (1)–(6) and the observed data, except for the part between 40and 50 km, which is shallower in comparison to the rest ofthe estuary. The cross-sectional area A and width B are di-vided into two reaches with the convergence lengths a1 anda2 of 22 and 26 km respectively (see Table 1). The geome-try changes in a decreasing pattern landwards following anexponential function. In an alluvial estuary, the wide mouthand shorter convergence length in the seaward part is gen-erally wave-dominated, while the landward part with longerconvergence length is tide-dominated. The average depth h isalmost constant, with a very slight decrease along the estuaryaxis (a depth convergence length of 525 km).
5.2 Vertical salinity profile
In Fig. 5 the results of the observed vertical salinity profileat HWS are presented. It can be seen that the salt intrusion
www.hydrol-earth-syst-sci.net/20/4031/2016/ Hydrol. Earth Syst. Sci., 20, 4031–4042, 2016

4036 A. D. Abdullah et al.: Predicting the salt water intrusion in the Shatt al-Arab estuary
Table 1. The geometry characteristic of the SAR estuary.
A0 (m2) A1 (m2) B0 (m) B1 (m) a1 (m) a2 (m) b1 (m) b2 (m) h (m)
8050 4260 910 531 22 000 160 000 26 000 230 000 7.9
A0 and A1 are cross-sectional areas at the mouth and inflection point respectively. B0 and B1 are channel widths at themouth and inflection point respectively, and a1, a2, and b1, b2 are locations of the convergence length of the cross-sectionalarea and width respectively. h is the average depth over the estuary length (of 60 km).
Figure 5. Vertical salinity distribution of the estuary measured between 0 and 58 km at HWS.
mechanism is well mixed for the entire observation period.During the wet period when river discharge is relatively high,a partially mixed condition can be observed particularly inthe downstream area (Fig. 5a and d). In the neap-wet condi-tion as shown in Fig. 5a, there is more stratification and thepartially mixed pattern occurs in almost the entire stretch ofthe estuary. This is because at neap tide, the tidal flows aresmall compared to the high freshwater discharge during thewet season. Conversely, during the spring-dry period whenthe river discharge is significantly low and the tidal range islarge (Fig. 5b and c), the vertical salinity distribution alongthe estuary is well mixed.
5.3 Longitudinal salinity profile
The measurements of salinity during HWS and LWS are pre-sented in Fig. 6. Calculations of the longitudinal salinity pro-
files are based on Eqs. (7)–(14), where the dispersion D de-creases over x until it reaches zero at the end of the salt in-trusion length. Coefficients K , D0, and E were calibrated toobtain the best fit between measured salinity data and sim-ulated salinity variations. The longitudinal salinity distribu-tions during a tidal cycle are demonstrated by three curves:(1) the maximum salinity curve at HWS; (2) the minimumsalinity curve at LWS; and (3) the average of HWS and LWSrepresenting the average salinity curve at TA. Tidal excur-sion (E) is determined from the horizontal distance betweenthe salinity curves of HWS and LWS. This distance is con-sidered constant along the estuary axis during the tidal cycle.In this study, the tidal excursion is found to be 14 km on 24September and 10 km for the other observations (Table 2).
The results show good agreement between measured andsimulated salinity profiles, with few deviations between the
Hydrol. Earth Syst. Sci., 20, 4031–4042, 2016 www.hydrol-earth-syst-sci.net/20/4031/2016/

A. D. Abdullah et al.: Predicting the salt water intrusion in the Shatt al-Arab estuary 4037
Figure 6. Predicted and measured salinity distribution during HWS, TA, and LWS.
Table 2. Characteristic values of the estuary, including the maximum salinity at the mouth So, the river discharge Qf, tidal excursion E, Vander Burgh coefficient K , the dispersion coefficient Do, mixing number αo, and salt intrusion length L.
Period So Qf E K Do αo L
(kg m−3) (m3 s−1) (km) (m2 s−1) (m−1) (km)
26 March 2014 24 109 10 0.65 403 3.7 3216 May 2014 28 91 10 0.65 473 5.2 4224 September 2014 34.6 48 15.5 0.65 442 9.2 655 January 2015 28 53 10 0.65 281 5.3 42
observed and modelled salinities. The small deviations maybe due to the timing errors in which the boat movement speeddid not coincide exactly with the tidal wave. In Fig. 6 (a andd), it can be seen that the measured salinity at distances 20and 24 km during HWS are higher than the simulated values.There is a sub-district (with considerable agricultural com-munities) and a commercial harbour, and it is believed thatall of their effluents and drainage water are discharged intothe river. This could be the reason for the salinity being alittle higher than expected. In Fig. 6c, the last measurementpoint is lower than the simulated one. This may be due to
the relatively shallow stretch between 40 and 50 km, whichcan substantially reduce the salt intrusion. Also, a timing er-ror may be an explanation for this deviation: the boat did notmove fast enough as it was delayed for short stops at policecheckpoints.
All the field surveys indicate that the maximum salinityat the mouth ranged from 24 to 35 kg m−3 (Table 2). Thelowest maximum salinity is during the neap-wet period andthe highest is during the spring-dry period. It can be seen thatthe seawater intrudes furthest in September (spring-driest pe-riod) and shortest in March (neap-wet). These findings are
www.hydrol-earth-syst-sci.net/20/4031/2016/ Hydrol. Earth Syst. Sci., 20, 4031–4042, 2016

4038 A. D. Abdullah et al.: Predicting the salt water intrusion in the Shatt al-Arab estuary
Figure 7. Comparison between the predicted and calibrated values of D0 and L.
logical because during the wet season, the estuary is in adischarge-dominated condition and the lower tide (neap) canbe easily pushed back by the river discharge. On the otherhand, during the dry season the estuary is tide-dominated andthe higher tide (spring) managed to travel further inland with-out much obstruction (low freshwater discharge). The tidalranges recorded during field surveys are 1.7, 3.2, 2.1, and 2.6respectively as the same date shown in Fig. 6a–d.
Besides seawater intrusion, human activities in the up-stream part of the estuary also contribute to the salinity levelsalong the river. From observations, the river salinity in the in-land part varies in space and time between 1 and 2 kg m−3.Thus, the salt concentrations are the result of a combinationof anthropogenic and marine sources (Abdullah et al., 2016).The findings from the longitudinal salinity distribution indi-cate that there is a need to analyse and classify the effects ofnatural and anthropogenic factors on estuary salinity.
5.4 The predictive model
The dispersion coefficient D is not a physical parameter thatcan be measured directly. It represents the mixing of salinewater and freshwater, and can be defined as the spreading of asolute along an estuary induced by density gradient and tidalmovement. Knowing the river discharge is crucial for deter-mining a dispersion coefficientD from Eq. (9). However, it isdifficult to measure the river discharge accurately in the tidalregion due to the tidal fluctuation. In this study, the river dis-charge data on the days of the measurements were used fromthe gauging station located at the most downstream part ofthe river network.
For the situation where measured salinity is known, thedispersion coefficient D0 and the salt intrusion length L atHWS were calibrated by fitting the simulated salinity curve(Eqs. 7–14) against the field data. In case no field data areavailable, the dispersion coefficient D1 was estimated usingEq. (15). The predicted D1 then was used to determine thepredicted D0 (using Eq. 9) and L (using Eq. 14). Compar-isons between the calibrated and predicted values were doneto evaluate the performance of the model. The prediction per-
Table 3. Measured and adjusted river discharge considering waterconsumptions on the days of measurements.
Date Measured river Adjusted riverdischarge1 discharge2
(m3 s−1) (m3 s−1)
26 March 2014 109 11416 May 2014 91 9624 September 2014 48 585 January 2015 53 63
1 not counting water abstractions and excluding the Karun inflows;2 deducting water abstractions and including the Karun inflows.
formance was evaluated with two model accuracy statistics:the root mean squared error (ERMS) and the Nash–Sutcliffeefficiency (ENS) (Eqs. 18 and 19 respectively).
ERMS =
√1n
n∑i=1(Pi −Oi)
2, (18)
ENS = 1−∑Ni=1(Oi −Pi)
2∑Ni=1(Oi −O)
2, (19)
where P and O are the predictive and observed variables re-spectively, and O is the observed mean. The index (ENS)
ranges from−∞ to 1. It describes the degree of accurate pre-diction. An efficiency of one indicates complete agreementbetween predicted and observed variables, whereas an effi-ciency of less than zero indicates that the prediction varianceis larger than the data variance.
Figure 7 presents poor correlations between the calibratedand predicted values ofD; the situation is better in the case ofL values. Table 4 displays the correlation between predictedand measured values. The ENS obtained for D is −0.09 andreflects weak predictive performance. Generally the modelappears to overestimate the values of the dispersion coeffi-cient compared to the calibrated ones during the wet periodand to underestimate the value during the drought period inSeptember. This could be due to the use of the measured dis-charge at the end of the tidal domain, which gives higher or
Hydrol. Earth Syst. Sci., 20, 4031–4042, 2016 www.hydrol-earth-syst-sci.net/20/4031/2016/
A. D. Abdullah et al.: Predicting the salt water intrusion in the Shatt al-Arab estuary 4039
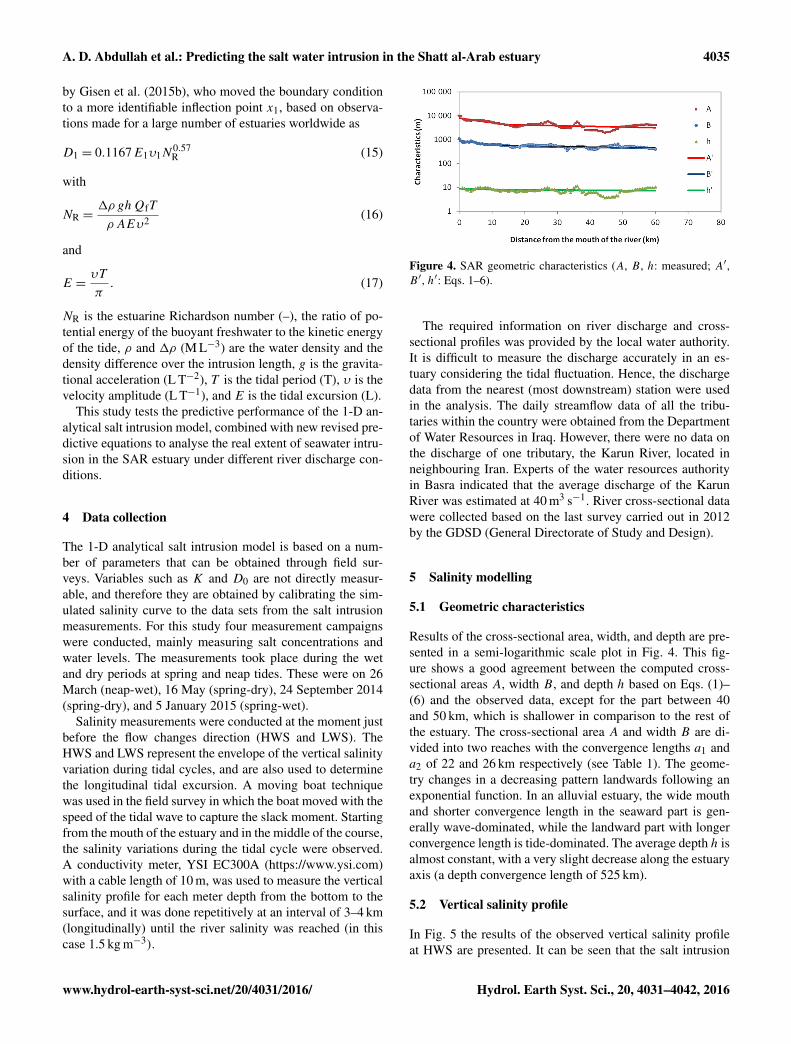
Table 4. The predicted and calibrated values of Do and L considering measured and adjusted river discharge.
Measured river discharge Adjusted river discharge
Calibrated values Predicted values Calibrated values Predicted values
Do (m2 s−1) L (km) Do (m2 s−1) L (km) Do (m2 s−1) L (km) Do (m2 s−1) L (km)
403 32 495 38 422 32 509 37473 42 507 44 499 42 528 43441 65 416 70 533 65 529 65281 42 395 51 335 42 400 48
Figure 8. Comparison between the predicted and calibrated values of D0 and L using the improved discharge data.
lower values than the exact freshwater discharging into theestuary, as it does not account for the discharge of the KarunRiver at the downstream end and the water consumption andwater losses within the system (see Table 3). The SAR isthe main freshwater source for irrigation, domestic, and in-dustrial activities in the region. Hence, water consumptioncould highly affect the performance of a predictive model,especially in the region where water withdrawals can consid-erably reduce river discharge into the estuary.
In order to reduce the uncertainty in the discharge data,some alternative approach has to be adopted. Gisen etal. (2015a) estimated the discharges for the downstream areasby extrapolating the correlation of the gauged area with theungauged areas. Cai et al. (2014) developed an analytical ap-proach to predict the river discharge into an estuary based ontidal water level observations. This method is only applica-ble in estuaries with a considerable river discharge comparedto the tidal flows. In this study, a simple approach has beenused to assess the discharge in the SAR estuary by deduct-ing the water withdrawals in the downstream region from thedischarge data collected at the lowest gauging points. In asimilar way the average discharge of the Karun was also es-timated (Table 3). Data on water withdrawals were collectedfrom the water resources authority and water distribution de-partments. Besides irrigation and domestic supply, the indus-trial sector, including the oil industry, is also a significantwater user. Unfortunately this study could not obtain infor-mation on water usage and disposal by the oil industry.
Table 5. Results of the model performance in terms of root meansquared error (ERMS) and Nash–Sutcliffe efficiency (ENS).
NSE RMSE
Measured river discharge
D0 −0.09 76 m2 s−1
L 0.75 6 km
Adjusted river discharge
D0 0.46 60 m2 s−1
L 0.9 4 km
The adjusted river discharge data are then applied inthe predictive model to evaluate the improvement of thesechanges in predicting values of D and L (Table 4). Theresults obtained after the adjustment are shown in Fig. 8.The figures demonstrate the improvements in predicting thedispersion and maximum salt intrusion length and showthe importance of computing the freshwater discharge accu-rately. Furthermore the correlations between predictive andobserved values are improved for both D0 and L, 0.46 and0.9 respectively, and the ERMS also reduced to 60 m2 s−1 and4 km for D0 and L respectively (Table 5).
The prediction performance of the model is demonstratedin Fig. 9, where the salinity curves were computed from thepredictive equation of D1 and the adjusted river discharges.
www.hydrol-earth-syst-sci.net/20/4031/2016/ Hydrol. Earth Syst. Sci., 20, 4031–4042, 2016

4040 A. D. Abdullah et al.: Predicting the salt water intrusion in the Shatt al-Arab estuary
Figure 9. Comparing the salinity curves of the calibrated results(dashed lines) and the predicted results (solid lines) to the observedsalinity during the four periods of 2014.
Figure 9 shows that the prediction salinity curves performvery well compared to the calibrated one during all periods,except January 2015. This could be because the average dis-charge used for the Karun River, in which the value is lowerthan the actual discharge, being the month of January, is inthe middle of the wet season. At such a time the SAR isexpected to receive high flow rates from the Karun River.On the other hand, during this season more return flows aredrained into the SAR from the large irrigation scheme ser-viced by the Karun water system, increasing anthropogenicsalinity levels. Accurate estimation of river discharge into theestuary is important in improving the predictive skill of themodel.
The ultimate objective of the modelling is to assess theinfluence of upstream development on the estuarine environ-ment, and also to find the real extent of salt intrusion. Thesalinity distribution along the estuary is highly linked to up-stream conditions, such as flow regulation and water with-drawals. For the purpose of improving the SAR estuary man-agement, the model can lead to estimation of a salt intru-sion length for a given freshwater discharge. This is usefulfor water supply managers to determine the appropriate loca-tion (salinity-free region) for water intake stations. Figure 10demonstrates the salt intrusion length (L) associated with dif-ferent river discharges corresponding to water released fromthe Tigris River into the SAR. The salt intrusion lengths areplotted against a range of freshwater discharges from 5 to120 m3 s−1. The main finding is that the length of salt intru-
Figure 10. Relationship between river discharge and predicted saltintrusion length.
sion increases in a non-linear way with decreasing river dis-charge. The salt intrusion length is very sensitive to river dis-charge when the flow is low. From the plot it can also be seenthat the maximum salt intrusion could reach 92 km from theSAR estuary at 5 m3 s−1 river discharge. This outcome ex-ceeds a preliminary estimate by Abdullah et al. (2016) basedon a 1-year data series, who found the salinity to reach up to80 km considering the annual salinity peaks along the river.An 80 km intrusion length corresponds to a measured riverdischarge of 58 m3 s−1, whereas for the predictive model thisdistance corresponds to a much lower discharge (7 m3 s−1).It is, however likely that the true river discharge was lower,since during the lowest discharge the irrigation demand isrelatively high. It should also be realized that in the regionof 40–50 km the depth and cross-sectional areas are substan-tially less. Such a shallow reach can reduce the salt intrusionlength substantially, as can be seen from Eq. (14), where β1is inversely proportional to A.
6 Conclusions
A 1-D analytical salt intrusion model was applied to the SARestuary based on four survey campaigns in 2014 and 2015.This model is used to determine longitudinal salinity distri-bution and the length of salt intrusion. The analytical modelis shown to describe well the exponential shape of the estuaryin the upstream direction. Moreover, the results show goodagreement between computed and observed salinity underdifferent river conditions. This indicates that the analyticalmodel is capable of describing the extent of seawater intru-sion along the SAR estuary.
Results for the dispersion coefficient Do indicate that themeasured river discharge out of the tidal range is higher thanthe real discharge into the estuary. This can be attributed towater withdrawals along the tidal domain. In the case of lowriver discharge, water withdrawals have a considerable effecton the predicted salt intrusion length. The river dischargeinto the estuary was revised considering water withdrawalsof the irrigation and domestic sectors. Using adjusted river
Hydrol. Earth Syst. Sci., 20, 4031–4042, 2016 www.hydrol-earth-syst-sci.net/20/4031/2016/

A. D. Abdullah et al.: Predicting the salt water intrusion in the Shatt al-Arab estuary 4041
discharge improved the performance of the predictive equa-tions. For further improvement, it is recommended to obtainmore accurate estimation of the river discharge into the estu-ary.
Seawater intrusion is driven by the discharge kineticsfrom tidal seawater and the hydrostatic potential energy fromfreshwater fluctuations. Intrusion lengths of 38, 40, 65, and43 km correspond to tidal ranges of 1.7, 3.2, 2.1, and 2.6 mduring March, May, and September 2014, and January 2015respectively. The longer salt intrusion distance is caused bylow river discharge, as evident for September (dry period).
The SAR is the main source of freshwater for daily con-sumption and irrigation. Decreased freshwater discharge andincreased seawater intrusion will exacerbate an already criti-cal situation in that important agricultural and ecological re-gion. The model shows a scenario in which decreasing riverdischarge, considered a likely event, can result in an increasein seawater intrusion further upstream to a distance of 92 km.Additional salinity sources from anthropogenic activities willdiminish the volume of freshwater, leading to very serioushealth problems and water and food insecurity. Calibrationof the model can be enhanced with further monitoring of dis-charge and salinity from all the tributaries and used to makenew estimates of longitudinal salinity distribution under ex-treme conditions. Preventing salt intrusion of these magni-tudes can only be achieved if the water quantity and qual-ity of the upstream sources as well as along the SAR arepromptly and strictly regulated.
7 Data availability
Data used in this paper is available upon request to the cor-respondence author.
Acknowledgements. The authors highly appreciate the support ofMeysam Salarijazi providing required information. We acknowl-edge the editor M. Vanclooster for the valuable comments. Wethank the two anonymous reviewers for their interesting commentsand suggestions.
Edited by: M. VancloosterReviewed by: two anonymous referees
References
Abdullah, D. A., Masih, I., Van der Zaag, P., Karim, U. F. A.,Popescu, I., and Al Suhail, Q.: The Shatt al-Arab System underEscalating Pressure: a preliminary exploration of the issues andoptions for mitigation, Int. J. River Basin Manage., 13, 215–227,2015.
Abdullah, A. D., Karim, U. F. A., Masih, I., Popescu, I., and vander Zaag, P.: Anthropogenic and tidal influences on salinity lev-els and variability of the Shatt al-Arab River, Int. J. River BasinManage., submitted, 2016.
Afkhami, M., Shariat, M., Jaafarzadeh, N., Ghadiri, H., andNabizadeh, R.: Development a Water Quality ManagementModel for Karun and Dez Rivers, Iran. J. Environ. Health. Sci.Eng., 4, 99–106, 2007.
Alber, M.: A Conceptual Model of Estuarine Freshwater InflowManagement, Estuaries, 25, 1246–1261, 2002.
Al-Tawash, B., Al-Lafta, S. H., and Merkel, B.: Preliminary Assess-ment of the Shatt al Arab Riverine Environment, Basra Govern-ment, Southern Iraq, J. Nat. Sci. Res., 3, 120–136, 2013.
Becker, M. L., Luettich, R. A., and Mallin, M. A.: HydrodynamicBehaviour of the Cape Fear River and Estuarine: A Synthesisand Observational Investigation of Discharge–Salinity IntrusionRelationships, Estuar. Coast Shelf S., 88, 407–418, 2010.
Bobba, A. G.: Numerical Modelling of Salt-water Intrusion due toHuman Activities and Sea-level Change in the Godavari Delta,India, Special Issue: Towards integrated Water Resources Man-agement for sustainable Development, Hydrol. Sci., 47, S67–S80, 2002.
Cai, H., Savenije, H. H. G., Yang, Q., Ou, S., and Lei, Y.: Influenceof River Discharge and Dredging on Tidal Wave Propagation:Modaomen Estuary Case, J. Hydraul. Eng., 138, 885–896, 2012.
Cai, H., Savenije, H. H. G., and Jiang, C.: Analytical approach forpredicting fresh water discharge in an estuary based on tidal wa-ter level observations, Hydrol. Earth Syst. Sci., 18, 4153–4168,doi:10.5194/hess-18-4153-2014, 2014.
Cai, H., Savenije, H. H. G., and Gisen, J. I. A.: A coupled analyticalmodel for salt intrusion and tides in convergent estuaries, Hy-drol. Sci. J., 61, 402–419, doi:10.1080/02626667.2015.1027206,2015.
Das, A., Justic, D., Inoue, M., Hoda, A., Huang, H., and Park, D.:Impacts of Mississippi River Diversions on Salinity Gradients ina Deltaic Louisiana Estuary: Ecological and Management Impli-cations, Estuar. Coast Shelf S., 111, 17–26, 2012.
Fawzi, M. N. and Mahdi, A. B.: Iraq’s Inland Water Quality andTheir Impact on the North-Western Arabian Gulf, Marsh Bul-letin, 9, 1–22, 2014.
Gisen, J. I. A., Savenije, H. H. G., Nijzink, R. C., and Wahab, A. K.:Testing a 1-D analytical salt intrusion model and its predictiveequations in Malaysian estuaries, Hydrol. Sci. J., 60, 156–172,2015a.
Gisen, J. I. A., Savenije, H. H. G., and Nijzink, R. C.: Revised pre-dictive equations for salt intrusion modelling in estuaries, Hy-drol. Earth Syst. Sci., 19, 2791–2803, doi:10.5194/hess-19-2791-2015, 2015b.
Helland-Hansen, E., Holtedahl, T. and Liye, K. A.: EnviromentalEffects. Vol. 3. Hydropower Development, Norwegian Instituteof Technology, Trondheim, 1995.
Horrevoets, A. C., Savenije, H. H. G., Schuurman, J. N., and Graas,S.: The Influence of River Discharge on Tidal Damping in Allu-vial Estuaries, J. Hydrol., 294, 213–228, 2004.
Ippen, A. T. and Harlemen, D. R. F.: One-Dimensional Analysis ofSalinity Intrusion in Estuaries, Technical Bulletin No. 5, Com-mittee on Tidal Hydraulics, Corps of Engineers, US Army, 1961.
Liu, W., Hsu, M., Wu, C., Wang, C., and Kuo, A. Y.: Modeling SaltWater Intrusion in Tanshui River Estuarine System-Case-StudyContrasting Now and then, J. Hydraul. Eng., 130, 849–859, 2004.
MacKay, H. M. and Schumann, E. H.: Mixing and circulation in thesundays river estuary, South Africa, Estuar. Coast Shelf S., 31,203–216, 1990.
www.hydrol-earth-syst-sci.net/20/4031/2016/ Hydrol. Earth Syst. Sci., 20, 4031–4042, 2016

4042 A. D. Abdullah et al.: Predicting the salt water intrusion in the Shatt al-Arab estuary
Nguyen, A. D. and Savenije, H. H.: Salt intrusion in multi-channelestuaries: a case study in the Mekong Delta, Vietnam, Hydrol.Earth Syst. Sci., 10, 743–754, doi:10.5194/hess-10-743-2006,2006.
Prandle, D.: On Salinity Regimes and the Vertical Structure ofResidual Flows in Narrow Estuaries, Estuar. Coast Shelf S., 20,615–635, 1985.
Risley, J. C., Guertin, D. P., and Fogel, M. M.: Salinity IntrusionForecasting System for Gambia River Estuary, J. Water Res. Pl.-ASCE, 119, 339–352, 1993.
Salarijazi, M., Akhond-Ali, A.-M., Adib, A., and Daneshkhah, A.:Trend and change-point detection for the annual stream-flow se-ries of the Karun River at the Ahvaz hydrometric station, Afr. J.Agric. Res., 7, 4540–4552, 2012.
Savenije, H. H. G.: One-Dimensional Model for Salinity Intrusionin Alluvial Estuaries, J. Hydrol., 85, 87–109, 1986.
Savenije, H. H. G.: Salinity Intrusion Model for High-Water Slack,Low Water-Slack, and Mean Tide on Spread Sheet, J. Hydrol.,107, 9–18, 1989.
Savenije, H. H. G.: Predictive Model for Salt Intrusion in Estuaries,J. Hydrol., 148, 203–218, 1993.
Savenije, H. H. G.: Salinity and tides in alluvial estuaries, Amster-dam: Elsevier, 1–150, 2005.
Savenije, H. H. G.: Salinity and tides in alluvial estuaries, com-pletely revised 2nd Edn., Delft University of Technology, avail-able at: http://salinityandtides.com (last access: 20 January2015), 2012.
Savenije, H., Cai, H., and Gisen, J.: Developing a coupled analyticalmodel for analyzing salt intrusion in alluvial estuaries, AGU FallMeeting Abstracts 1, 1664, 2013.
Sklar, F. H. and Browder, J. A.: Coastal Environment ImpactsBrought about by Alteration to Freshwater Flow in the Gulf ofMexico, Environ. Manage., 22, 547–562, 1998.
UN-ESCWA and BGR (United nations Economic and Social Com-mission for Western Asia; Bundesanstalt für Geowissenschaftenund Rohstoffe): Inventory of Shared Water Resources in WesternAsia, Beirut, 2013.
Van der Burgh, P.: Ontwikkeling van een methode voor voorspellenvan zoutverdelingen in estuaria, kanalen en zeeen, Rijkswater-staat Rapp, 10–72, 1972.
Vaz, N., Dias, J. M., and Leitao, P. C.: Three-Dimensional Mod-elling of a Tidal Channel: The Espinheiro Channel (Portugal),Cont. Shelf Res., 29, 29–41, 2009.
Vörösmarty, C. J. and Sahagian, D.: Anthropogenic Disturbance ofthe Terrestrial Water Cycle, BioScience, 50, 753–765, 2000.
Wang, Y., Liu, Z., Gao, H., Ju, L., and Guo, X.: Response of SalinityDistribution around the Yellow River mouth to Abrupt Changesin River Discharge, Cont. Shelf Res., 31, 685–694, 2011.
Whitney, M. M.: A Study on River Discharge and Salinity Variabil-ity in the Middle Atlantic Bight and Long Island Sound, Cont.Shelf Res., 30, 305–318, 2010.
Wong, K. C.: On the relationship between long-term salin-ity variations and river discharge in the middle reach ofthe Delaware estuary, J. Geophys. Res., 100, 20705–20713,doi:10.1029/95JC01406, 1995.
Zhang, E. F., Savenije, H. H. G., Chen, S. L., and Mao, X.H.: An analytical solution for tidal propagation in the YangtzeEstuary, China, Hydrol. Earth Syst. Sci., 16, 3327–3339,doi:10.5194/hess-16-3327-2012, 2012.
Hydrol. Earth Syst. Sci., 20, 4031–4042, 2016 www.hydrol-earth-syst-sci.net/20/4031/2016/


![[halshs-00348145, v1] The modified form of Shatt …llacan.vjf.cnrs.fr/publications/Shatt_nouns.pdfThe modified form of Shatt Damam nouns and its Daju cognates Pascal Boyeldieu (CNRS)](https://img.pdfslide.net/doc/110x75/5b02469d7f8b9a0c028f8c94/halshs-00348145-v1-the-modified-form-of-shatt-modified-form-of-shatt-damam.jpg)