Embed Size (px)
Citation preview
Abstract—In this paper, we propose a model to predict
resource utilization matrix for a given workload by mining the
information residing in application as well as system logs for
resource utilization. Unlike regression based or queuing
network based approaches, our mechanism neither requires
estimating per-function resource utilization nor does it require
to benchmark individual business transactions in order to
derive resource utilization matrix for the desired workload. In
our experimental analysis, we have tried to predict the
utilization of server resources like cpu, memory, disk and
network usage based on several workload pattern. Across all
experiments, we find the average absolute error in predicting
utilization of all resources was less than 6%. This model
becomes particularly helpful in the scenario where there are
only few data-points available for system running with light
workload and it is essential to analyze the impact of any change
in workload pattern demanding heavy resource usage. Our
model is not only useful for resource provisioning and what-if
analysis to assess the impact of any workload change but also
can be used for bottleneck analysis and early alert generating
engine.
Index Terms—Resource utilization, system demand,
performance analytics, workload analysis.
I. INTRODUCTION
Evolution of distributed, parallel and virtualized systems,
where numerous components act in synergy to provide desire
functionality, has changed the face of traditional IT system.
In a service oriented world, performance plays a vital role for
the success of any IT system. Modeling workload dynamics
and performance of such complex system has become
essential not only to predict resource requirements and
capacity planning to handle the anticipated workload but also
to predict the impact of any planned or unplanned change in
workload and/or change in system configuration on the
performance of individual components or the entire system.
Such performance engineering analytics and building models
involve estimation of resource utilization, i.e., estimating
time spent by each system resource (cpu, memory, disks,
network, etc.) in serving a work unit. The nature of modern
age applications, however, makes modeling and analytics
difficult.
In this paper, we present a mechanism to cross-relate the
information from system as well as application logs to
estimate the overall resource utilization and to predict
performance of each individual components and thereby the
entire complex system for an anticipated workload. The idea
is to use such aggregate measurements (throughput and
resource utilization) in order to estimate the service times
using extended Utilization Law as follows.
Manuscript received September 23, 2013; revised November 10, 2013.
Mehul Vora is with Innovation Labs, PERC, TATA Consultancy Services
(TCS) Ltd., Mumbai, India (e-mail: [email protected]).
𝑈 = 𝑢0 + 𝑥𝑐𝑢𝑐
𝐶
𝑐=1
(1)
Here 𝐶 is the number of request classes (business
transactions, software functions, etc.); 𝑢𝑐 is the mean
resource consumption for class c requests; xc represents the
mean arrival rate for class c requests; 𝑢0 is the residual
utilization due to operating system activities and
non-modeled request classes. While the utilization law
expresses a linear relationship between resource utilization
and the workload submitted to a computing system and its
utilization, the analysis and performance modeling of real
world applications is far from trivial. Unfortunately, resource
usage measurements at class level are rarely available in real
systems and obtaining them might require invasive
techniques such as benchmarking, load testing, profiling,
application instrumentation or kernel instrumentation.
Moreover, such activities are often intrusive, time consuming
and not feasible in real production systems. On the other hand,
aggregate measurements such as the application throughput,
number of concurrent users and the overall resource
utilization are relatively easy to collect. We can obtain this
workload or throughput information from application logs
and resource usage measurements can be obtained from
system utilization logs.
Major challenge in predicting resource utilization is in
obtaining a proper training dataset. Accurate resource
utilization estimation requires the selection of the workload
mixes which better describe the system behavior.
Traditionally, for each business transaction or request class c,
resource utilization is estimated individually or benchmarked
independently and used for estimating overall resource
utilization. However in today’s dynamic world, a workload
mix does not contain truly independent request classes. These
multicollinearities among request classes and even system
enhancements (e.g. increased usage of caching) pose a
problem for such traditional performance models. Moreover,
the relative mix of those request classes in the overall
workload changes over time causing a change in system
resource usage pattern. As a result, models that incorporate a
mix of workload classes can accurately perform capacity
planning and predict impact of any change in workload
pattern.
The approach presented here for predicting resource
utilization exploits the fundamentals from the field of linear
algebra. Basically, for the system under investigation,
training data is obtained by collecting application and
resource utilization logs (primarily cpu, memory, disk and
network bandwidth usage logs) for several different
transaction mixes from all nodes. So each training sample
consists of different transaction mix and associated resource
utilization measurements serve as algebraic basis. Desired or
targeted workload is also a transaction mix that is very
different from the mix of any training data point. However
Predicting Utilization of Server Resources from Log Data
Mehul Nalin Vora
International Journal of Computer Theory and Engineering, Vol. 6, No. 2, April 2014
118DOI: 10.7763/IJCTE.2014.V6.848
the targeted transaction mix may be estimated as a linear
combination of the pre-existing transaction mixes of the
training data points. Thus by identifying linear weights of
each training data points in constructing targeted workload
mix, we can estimate total resource utilization for each
component of the system from individual training data-points.
This model becomes particularly helpful in the scenario
where there are only few data-points available for system
running with light workload (typically consumption of all
system resources like cpus, disks etcetera below 50 to 60%)
and wants to analyze the impact of any change in workload
pattern demanding heavy resource usage (utilization of one
or more resources more than 50%).
Apart from capacity planning and workload based what-if
analysis; model described in this paper is very useful for
bottleneck identification and in many case it can be used for
early alert generating engine as well. Performance problems
often arise due to a resource bottleneck in the system.
Locating performance bottlenecks in modern systems can be
difficult because direct measurement is often not available.
Since the results from solving the model include the
utilization at all nodes in the system, model becomes handy in
identifying one or more components which are responsible
for causing bottlenecks and it can accordingly generate alert
so that system administrator may be able to take
precautionary actions and prevent a failure just in time. This
model can also be used to develop tests for load testing.
Instead of testing a wide variety of parameters in search of a
bottleneck, this model can direct a tester to concentrate on
those tests which focus on the identified bottlenecks.
Reducing the number of tests should speed up the testing
process and decrease the cost of testing.
Rest of the paper is organized as follows: Section II
describes the proposed model for resource utilization matrix
prediction from workload at great length. Section III covers
the experimental setup, process and analysis. Finally Section
IV relates our work with existing approaches followed by
final concluding Section V.
II. MODEL
One way to collect training data-points by running
different transaction mix over the system under investigation
and collect the respective application as well as system logs
for the resource utilization. For a system already running in a
production environment, where running individual
transaction mix may not be possible, one can alternatively
collect the training data points by observing the system and
collecting these logs for a fairly long period of time. Then
training data is obtained by dividing these logs into equal
partition of predetermined time interval length of . So each
training sample consists of different transaction mix and
associated resource utilization measurements.
Let be the number of unique functions observed in
application logs for these transaction mixes. Then,
calculate the workload matrix 𝑊 in terms of application
throughputs 𝑡𝑗 for each function 𝑗 1 ≤ 𝑗 ≤ identified
earlier as follows.
𝑊 =
𝑡11 ⋯ 𝑡1𝜐
⋮ ⋱ ⋮𝑡𝜂1 ⋯ 𝑡𝜂𝜐
𝜂×𝜐
Here each row represents one data-point i.e. one
transaction-mix or one partition of the observed time period.
Similarly compose the resource utilization matrix R
corresponding to each row of 𝑊 as follows. Here
represents the number of resources being measured.
𝑅 =
𝑟11 ⋯ 𝑟1𝜌
⋮ ⋱ ⋮𝑟𝜂1 ⋯ 𝑟𝜂𝜌
𝜂×𝜌
To perform what-if analysis, consider a vector T of desired
workload mix in terms of functional throughputs. Here we
assume that the mapping from user-defined functionality to
application function calls is already known so that for a given
desired workload of user-specific functionality, targeted
workload vector 𝑇 = 𝑡1 … 𝑡𝜐 1×𝜐 can be easily
computed in terms of application’s functional throughputs. In
extreme cases where this information is not available, one
can still use this approach by considering workload pattern in
terms of number of concurrent users executing diverse
business transactions. Let be the number of different
business transaction available under current application
setup, then workload vector can be computed as 𝑇 =𝑛1…𝑛𝜐1×𝜐 where 𝑛𝑗 represents the number of concurrent
users executing 𝑗𝑡ℎ 1 ≤ 𝑗 ≤ business transaction.
In either case, to estimate the resource utilization for this
desired workload T, first we need to estimate an influence
vector 𝑉 = 𝑣1 … 𝑣𝜂 1×𝜂 such that
𝑉 × 𝑊 = 𝑇 (2)
Once we have this influence vector V, we can obtain an
estimate for resource utilization matrix
𝑈 = 𝑟1 … 𝑟𝜌 1×𝜌
as follows:
𝑈 = 𝑉 × 𝑅 (3)
Major challenge here is to obtain an estimate of the
influence vector V. There are numerous approaches and
algorithms have been proposed in the literature varying from
linear regression to iterative methods. Here we are going to
adopt the fundamentals from the linear algebra.
One trivial solution to the problem is 𝑉 = 𝑇 × 𝑊−1 if W is
a square, non-singular matrix. Often this is not the case. For
all practical purposes, W is a non-square (typically >) and
often a singular, non-invertible matrix. In this case, solution
for equation (2) is given by equation (4) [1].
𝑉 = 𝑇 × 𝐺 (4)
Here G is a generalized inverse matrix [2], [3]
(dimension 𝜐 × 𝜂 ) of the workload matrix W and it is
computed using Rank Factorization algorithm as follows:
Consider a factorization of the matrix W as W = AB where A
is a matrix made up of the pivot columns of the workload
matrix W while row reducing W to row-echelon form (in the
same order as they are in W) and matrix B is comprised of
non-zero rows of row-echelon form of the workload matrix
W. Then generalized inverse matrix G is calculated as
equation (5).
𝐺 = 𝐵𝑇 𝐵𝐵𝑇 −1 𝐴𝑇𝐴 −1𝐴𝑇 (5)
International Journal of Computer Theory and Engineering, Vol. 6, No. 2, April 2014
119
To validate equation (5), let’s verify if essential condition
for generalized inverse matrix (i.e. WGW = W) holds true.
Consider
𝑊 × 𝐺 × 𝑊 = 𝐴 × 𝐵 × 𝐵𝑇 𝐵𝐵𝑇 −1 𝐴𝑇𝐴 −1𝐴𝑇
× 𝐴 × 𝐵
Rearranging the order of right hand side, and considering
𝐵𝐵𝑇 𝐵𝐵𝑇 −1 = 𝐼 as well 𝐴𝑇𝐴 −1𝐴𝑇𝐴 = 𝐼 where I is an
identity matrix, right hand side simplifies to 𝐴 × 𝐼 × 𝐼 × 𝐵 =𝐴 × 𝐵 = 𝑊 confirming to the essential condition for a
generalized inverse matrix.
Once we have a generalized inverse matrix G of workload
matrix W, we can conduct thorough what-if analysis and
assess the performance impact of any change in the workload
pattern. For a desired workload vector T, we can estimate the
influence vector V using equation (4) and subsequently
estimate overall resource utilization U using equation (3).
The model described here is based on the paradigm of build
once, reuse multiple times, making it very light on
computational resources.
In addition to what-if analysis engine and resource
provisioning estimator, this model can be used for bottleneck
analysis and alert generating engine as well. For a running
system, application and resource utilization logs can be
collected for a time interval of length . From the application
logs, we can calculate the input workload vector and this
vector can be used in the prescribed model as an input T.
Estimated resource utilization from equation (3) then can be
compared with the observed resource consumption. One can
trivially generate an alert when resource consumption crosses
the pre-set threshold. When resource consumption is well
within bound but error in resource utilization estimation is
greater than the pre-set limit, system can generate an alert
indicating an unforeseen change in environment or
application behavior and pin-pointing to a resource and a
component which has the largest contribution to the error and
causing the performance bottleneck. This model can also be
used to develop tests for load testing. Instead of testing a wide
variety of parameters in search of a bottleneck, this model can
direct a tester to concentrate on those tests which focus on the
identified bottlenecks. Reducing the number of tests should
speed up the testing process and decrease the cost of testing.
The most important advantage of this model is that data
used to build the model is obtained from the real system itself
and therefore all characteristics of application, system and
interactions between them are implicitly captured in the
model. Please note that same principles can be applied for a
system under development running workload proportionate
to the anticipated workload with random variations. This
estimated resource utilization matrix (𝑈) then becomes an
important precursor for the resource provisioning and
capacity planning exercise. One can also note that the
mechanism described here neither require per-function
demand estimations nor benchmarking of any individual
business logic or application functionality in deriving overall
system resource utilization estimate. This model does not
even require any code or kernel instrumentations as well.
III. RESULTS AND ANALYSIS
To demonstrate efficiency and efficacy of the proposed
model for predicting resource utilization for a given
workload input, we have chosen a customized server-client
application communicating using an in-house developed
messaging framework - Universal Message Communication
(UMC). The UMC is a high speed, reliable, messaging
framework for sending and receiving messages. It shields an
application from the complexities of underlying
communication technologies and intends to simplify the way
communication is done by an application.
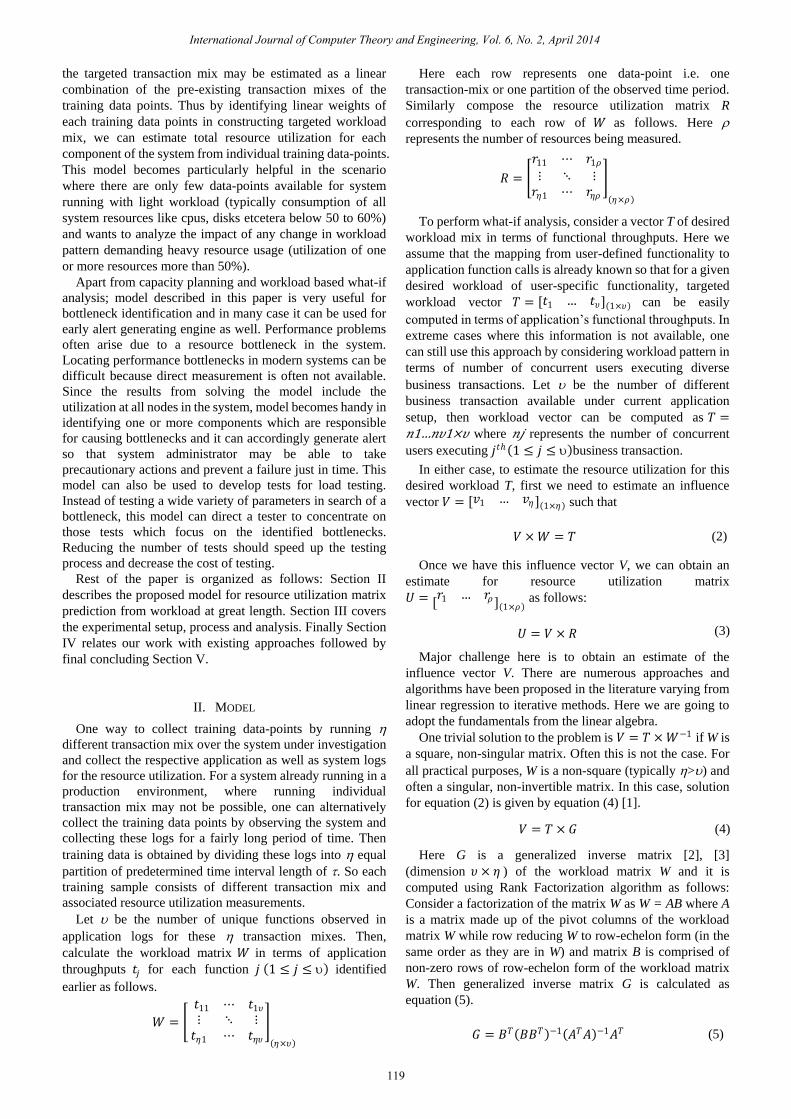
A. Setup
Fig. 1. Experimental setup.
Fig. 1 shows a typical setup where several clients
communicate concurrently over a network using TCP to a
remote application server via UMC framework [4]. The
application server here consists of a custom application
containing mainly four functions. Each function is written in
such a way that it consumes one of the resources (vizcpu,
memory, disk and network) more than any others. Cpu
intensive function simply loops over a square root functions.
Memory intensive function uses malloc function calls. Disk
intensive function reads a random block of large size from a
sufficiently large text file and writes it to a file. And finally
network intensive function sends and receives large size
network packets over UMC framework to crate the network
load. Host server is an AMD opteron 2.19 GHz 4 core, 4GB
RAM machine whereas clients were hosted on an Intel Xeon
3.2 GHz 2 core, 2 GB RAM machine. Both machines were
connected via 1 Gbps Ethernet network.
B. Process
To validate the proposed model, we have collected the
server data (number of concurrent users, application
throughput and utilization of server resources) for about 250
different transaction mixes. The execution process for each
transaction mix can be summarized as follows: 1) For each
functionality 𝑖, (1 ≤ 𝑖 ≤ 4) , choose random number of
clients 𝑛𝑖 . Maximum number of concurrent clients for
cpu-intensive function was 95; 115 for memory-intensive
function; 115 for disk-intensive function and 50 for
network-intensive function. 2) During the predetermined
length of an experiment, all clients are executing
concurrently and each client sequentially submits their
respective functionality request to the server via UMC
framework. 3) Upon receiving a client’s request, server
executes respective functionality and then sends a response
via UMC framework back to that particular client. 4) On
completion of an experiment, calculate the functional
throughputs from the application logs and average utilization
International Journal of Computer Theory and Engineering, Vol. 6, No. 2, April 2014
120
of server resources (vizcpu, memory, disk and network) from
the system logs ignoring the initial period of instability.
Utilization of system resources is measured using atop utility
with a sampling interval of 2 seconds.
TABLE I: RANGE OF SERVER RESOURCE UTILIZATION (AVERAGE)
CPU MEM DSK NET
Training Set
(50 samples)
Min 27.79% 3.39% 7.29% 8.86%
Max 54.16% 52.45% 52.24% 52.01%
Prediction Set
(200 samples)
Min 33.80% 2.69% 7.19% 8.39%
Max 81.54% 63.27% 84.46% 74.75%
C. Analysis
Validation of the proposed model was done in two ways:
by cross-validation and by the way of prediction set. To do
so, out of 250 data points for varied transaction mix, 50 data
points of relatively light workload (such that all measured
system resource utilization is below 55%) were chosen for
training dataset. Remaining 200 data points for relatively
heavy workload (such that utilization for one or more system
resource is greater than 55%) were set aside as prediction set.
Table I describes the range of average server resource
utilization for training and prediction datasets.
Cross-validation study was carried out as follows: 1) First
workload matrix (W) and resource utilization (R) matrix were
derived for 49 data points from the 50 data-point training set
leaving one sample out. 2) Subsequently generalized inverse
matrix (G) was computed using equation 5 followed by the
computation of an influence vector (V) using equation 4 3)
Using workload of the remaining one data point as an input
workload vector (T), resource utilization matrix (U) for that
particular data point was computed using equation 3. 4)
Finally, the error is computed as an absolute difference
between the measured and estimated utilization of server
resources. Such exercise was repeated 50 times, once for each
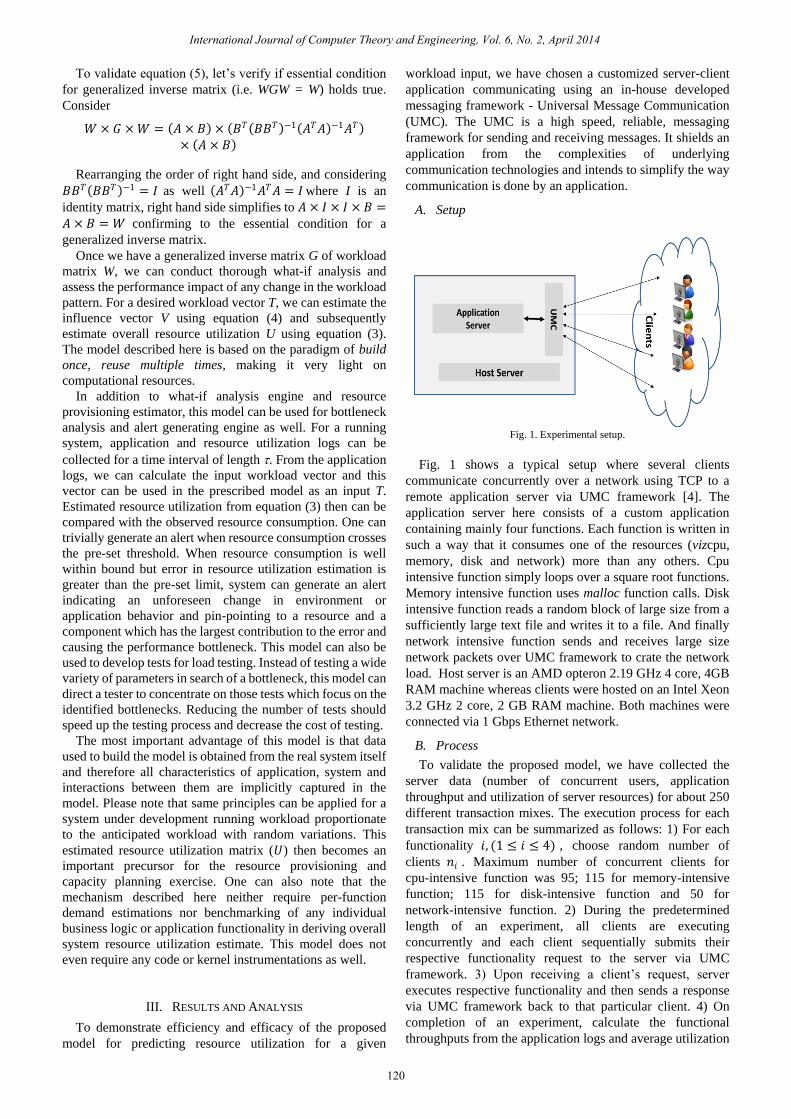
data point in the training set. Table II describes the average
absolute error for each resource across the 50 data points
whereas Fig. 2 shows the percentile distribution of the
absolute error in this cross-validation study.
Second and practical way of validating the proposed model
is using the prediction set. The generalized inverse matrix (G)
and thereby the influence vector (V) were calculated using
entire training dataset (50 data points). Then resource
utilization matrix (U) was computed using the throughput
vectors (T) of each prediction set sample. Absolute error was
then computed using this estimated matrix (U) and utilization
matrix (R) of the prediction set.
TABLE II: AVERAGE ERROR IN RESOURCE UTILIZATION PREDICTION USING
APPLICATION THROUGHPUTS
CPU MEM DSK NET
Cross-Validation 1.21% 1.67% 0.75% 0.01%
Prediction Set 2.20% 3.32% 2.42% 0.03%
Table II also describes the average absolute error for each
measured resource across the 200 data points from the
prediction set study whereas Fig. 3 shows the percentile
distribution of the absolute error in this study.Table II, Fig. 2
and Fig. 3 are the strong indicators for the success of the
proposed model for the prediction of resource utilization
matrix. Across all experiments, the average absolute error in
predicting utilization of all four resources is less than 6%.
The 95th percentile of the absolute error in predicting cpu
utilization is about 5.4%; whereas for memory utilization is
about 8.6%; for disk utilization is about 5.7% and finally for
network utilization is about 0.1%.
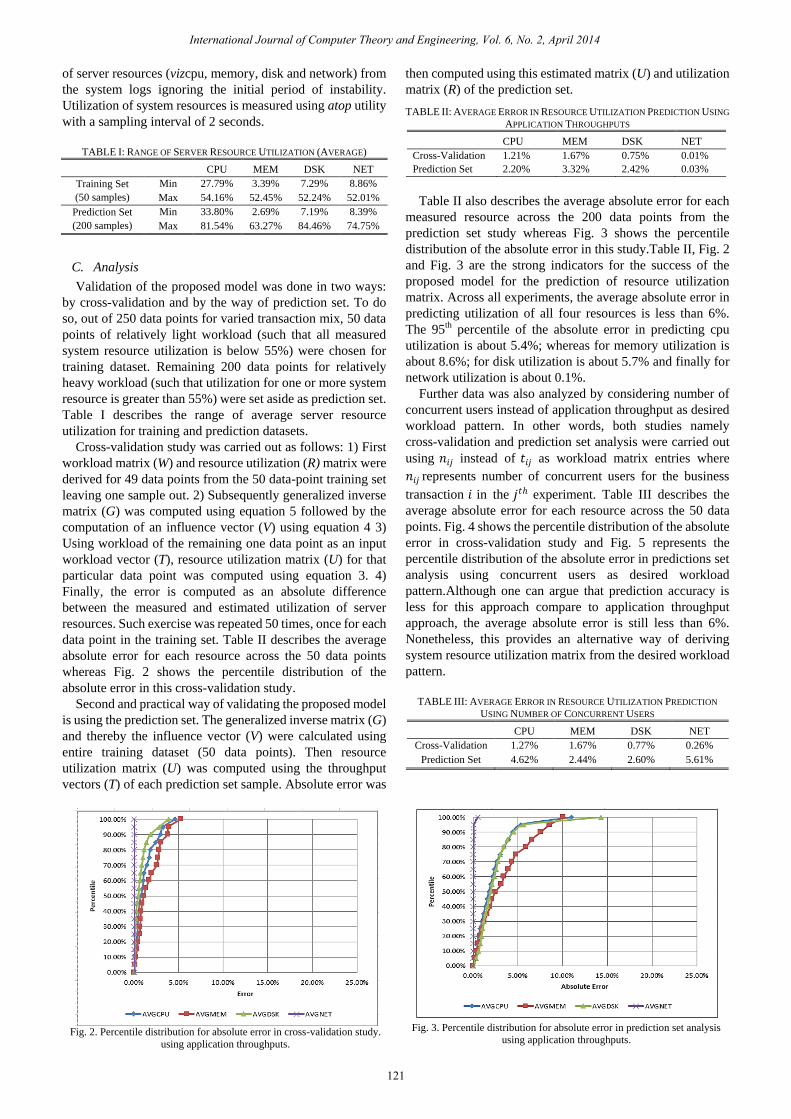
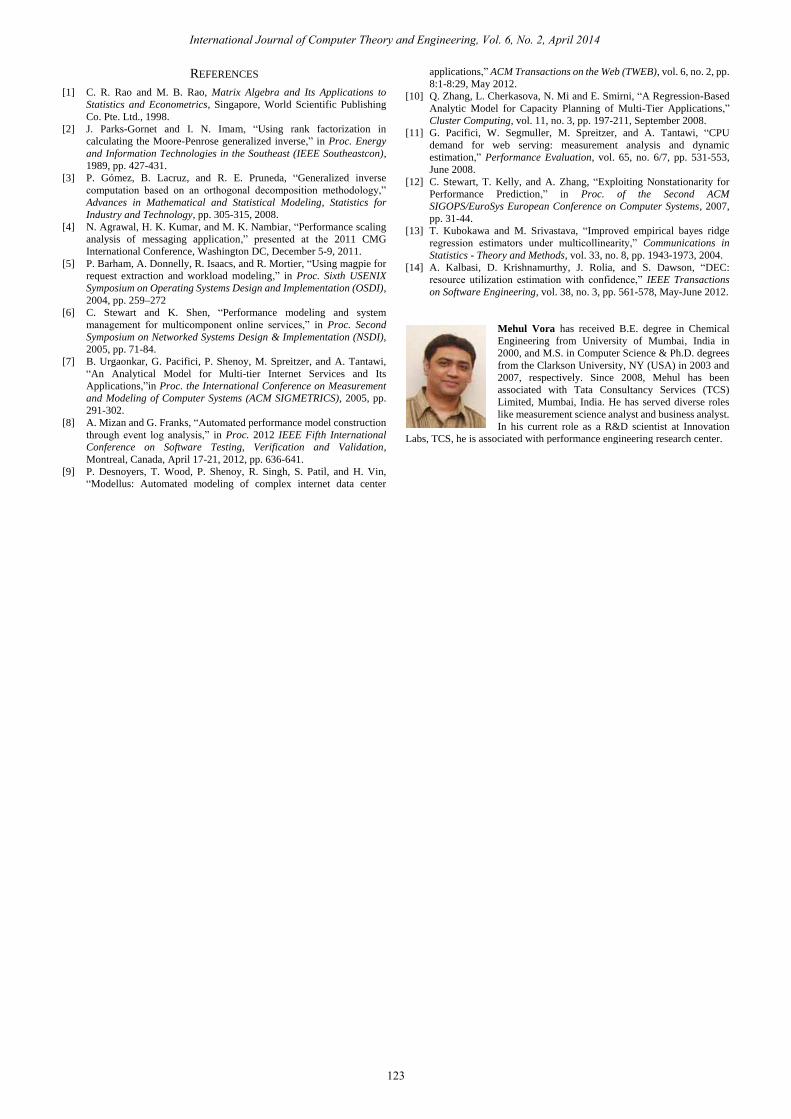
Further data was also analyzed by considering number of
concurrent users instead of application throughput as desired
workload pattern. In other words, both studies namely
cross-validation and prediction set analysis were carried out
using 𝑛𝑖𝑗 instead of 𝑡𝑖𝑗 as workload matrix entries where
𝑛𝑖𝑗 represents number of concurrent users for the business
transaction 𝑖 in the 𝑗𝑡ℎ experiment. Table III describes the
average absolute error for each resource across the 50 data
points. Fig. 4 shows the percentile distribution of the absolute
error in cross-validation study and Fig. 5 represents the
percentile distribution of the absolute error in predictions set
analysis using concurrent users as desired workload
pattern.Although one can argue that prediction accuracy is
less for this approach compare to application throughput
approach, the average absolute error is still less than 6%.
Nonetheless, this provides an alternative way of deriving
system resource utilization matrix from the desired workload
pattern.
TABLE III: AVERAGE ERROR IN RESOURCE UTILIZATION PREDICTION
USING NUMBER OF CONCURRENT USERS
CPU MEM DSK NET
Cross-Validation 1.27% 1.67% 0.77% 0.26%
Prediction Set 4.62% 2.44% 2.60% 5.61%
Fig. 2. Percentile distribution for absolute error in cross-validation study.
using application throughputs.
Fig. 3. Percentile distribution for absolute error in prediction set analysis
using application throughputs.
International Journal of Computer Theory and Engineering, Vol. 6, No. 2, April 2014
121
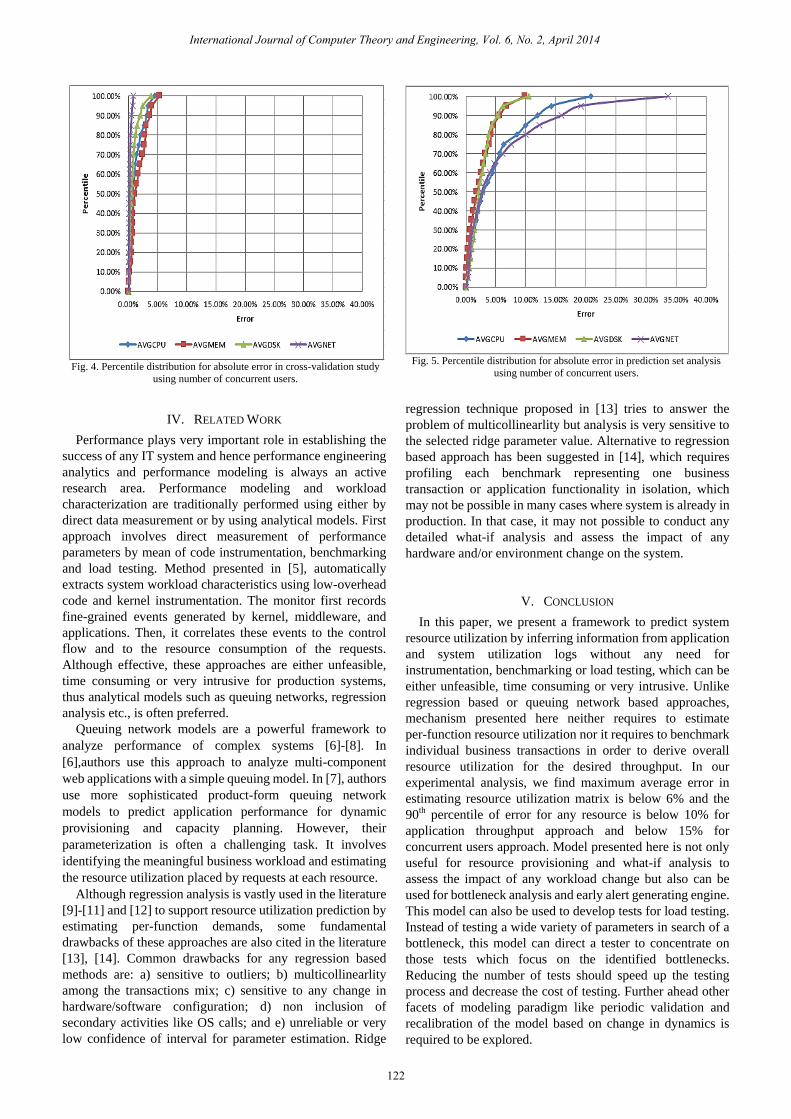
Fig. 4. Percentile distribution for absolute error in cross-validation study
using number of concurrent users.
Fig. 5. Percentile distribution for absolute error in prediction set analysis
using number of concurrent users.
IV. RELATED WORK
Performance plays very important role in establishing the
success of any IT system and hence performance engineering
analytics and performance modeling is always an active
research area. Performance modeling and workload
characterization are traditionally performed using either by
direct data measurement or by using analytical models. First
approach involves direct measurement of performance
parameters by mean of code instrumentation, benchmarking
and load testing. Method presented in [5], automatically
extracts system workload characteristics using low-overhead
code and kernel instrumentation. The monitor first records
fine-grained events generated by kernel, middleware, and
applications. Then, it correlates these events to the control
flow and to the resource consumption of the requests.
Although effective, these approaches are either unfeasible,
time consuming or very intrusive for production systems,
thus analytical models such as queuing networks, regression
analysis etc., is often preferred.
Queuing network models are a powerful framework to
analyze performance of complex systems [6]-[8]. In
[6],authors use this approach to analyze multi-component
web applications with a simple queuing model. In [7], authors
use more sophisticated product-form queuing network
models to predict application performance for dynamic
provisioning and capacity planning. However, their
parameterization is often a challenging task. It involves
identifying the meaningful business workload and estimating
the resource utilization placed by requests at each resource.
Although regression analysis is vastly used in the literature
[9]-[11] and [12] to support resource utilization prediction by
estimating per-function demands, some fundamental
drawbacks of these approaches are also cited in the literature
[13], [14]. Common drawbacks for any regression based
methods are: a) sensitive to outliers; b) multicollinearlity
among the transactions mix; c) sensitive to any change in
hardware/software configuration; d) non inclusion of
secondary activities like OS calls; and e) unreliable or very
low confidence of interval for parameter estimation. Ridge
regression technique proposed in [13] tries to answer the
problem of multicollinearlity but analysis is very sensitive to
the selected ridge parameter value. Alternative to regression
based approach has been suggested in [14], which requires
profiling each benchmark representing one business
transaction or application functionality in isolation, which
may not be possible in many cases where system is already in
production. In that case, it may not possible to conduct any
detailed what-if analysis and assess the impact of any
hardware and/or environment change on the system.
V. CONCLUSION
In this paper, we present a framework to predict system
resource utilization by inferring information from application
and system utilization logs without any need for
instrumentation, benchmarking or load testing, which can be
either unfeasible, time consuming or very intrusive. Unlike
regression based or queuing network based approaches,
mechanism presented here neither requires to estimate
per-function resource utilization nor it requires to benchmark
individual business transactions in order to derive overall
resource utilization for the desired throughput. In our
experimental analysis, we find maximum average error in
estimating resource utilization matrix is below 6% and the
90th percentile of error for any resource is below 10% for
application throughput approach and below 15% for
concurrent users approach. Model presented here is not only
useful for resource provisioning and what-if analysis to
assess the impact of any workload change but also can be
used for bottleneck analysis and early alert generating engine.
This model can also be used to develop tests for load testing.
Instead of testing a wide variety of parameters in search of a
bottleneck, this model can direct a tester to concentrate on
those tests which focus on the identified bottlenecks.
Reducing the number of tests should speed up the testing
process and decrease the cost of testing. Further ahead other
facets of modeling paradigm like periodic validation and
recalibration of the model based on change in dynamics is
required to be explored.
International Journal of Computer Theory and Engineering, Vol. 6, No. 2, April 2014
122
REFERENCES
[1] C. R. Rao and M. B. Rao, Matrix Algebra and Its Applications to
Statistics and Econometrics, Singapore, World Scientific Publishing
Co. Pte. Ltd., 1998.
[2] J. Parks-Gornet and I. N. Imam, “Using rank factorization in
calculating the Moore-Penrose generalized inverse,” in Proc. Energy
and Information Technologies in the Southeast (IEEE Southeastcon),
1989, pp. 427-431.
[3] P. Gómez, B. Lacruz, and R. E. Pruneda, “Generalized inverse
computation based on an orthogonal decomposition methodology,”
Advances in Mathematical and Statistical Modeling, Statistics for
Industry and Technology, pp. 305-315, 2008.
[4] N. Agrawal, H. K. Kumar, and M. K. Nambiar, “Performance scaling
analysis of messaging application,” presented at the 2011 CMG
International Conference, Washington DC, December 5-9, 2011.
[5] P. Barham, A. Donnelly, R. Isaacs, and R. Mortier, “Using magpie for
request extraction and workload modeling,” in Proc. Sixth USENIX
Symposium on Operating Systems Design and Implementation (OSDI),
2004, pp. 259–272
[6] C. Stewart and K. Shen, “Performance modeling and system
management for multicomponent online services,” in Proc. Second
Symposium on Networked Systems Design & Implementation (NSDI),
2005, pp. 71-84.
[7] B. Urgaonkar, G. Pacifici, P. Shenoy, M. Spreitzer, and A. Tantawi,
“An Analytical Model for Multi-tier Internet Services and Its
Applications,”in Proc. the International Conference on Measurement
and Modeling of Computer Systems (ACM SIGMETRICS), 2005, pp.
291-302.
[8] A. Mizan and G. Franks, “Automated performance model construction
through event log analysis,” in Proc. 2012 IEEE Fifth International
Conference on Software Testing, Verification and Validation,
Montreal, Canada, April 17-21, 2012, pp. 636-641.
[9] P. Desnoyers, T. Wood, P. Shenoy, R. Singh, S. Patil, and H. Vin,
“Modellus: Automated modeling of complex internet data center
applications,” ACM Transactions on the Web (TWEB), vol. 6, no. 2, pp.
8:1-8:29, May 2012.
[10] Q. Zhang, L. Cherkasova, N. Mi and E. Smirni, “A Regression-Based
Analytic Model for Capacity Planning of Multi-Tier Applications,”
Cluster Computing, vol. 11, no. 3, pp. 197-211, September 2008.
[11] G. Pacifici, W. Segmuller, M. Spreitzer, and A. Tantawi, “CPU
demand for web serving: measurement analysis and dynamic
estimation,” Performance Evaluation, vol. 65, no. 6/7, pp. 531-553,
June 2008.
[12] C. Stewart, T. Kelly, and A. Zhang, “Exploiting Nonstationarity for
Performance Prediction,” in Proc. of the Second ACM
SIGOPS/EuroSys European Conference on Computer Systems, 2007,
pp. 31-44.
[13] T. Kubokawa and M. Srivastava, “Improved empirical bayes ridge
regression estimators under multicollinearity,” Communications in
Statistics - Theory and Methods, vol. 33, no. 8, pp. 1943-1973, 2004.
[14] A. Kalbasi, D. Krishnamurthy, J. Rolia, and S. Dawson, “DEC:
resource utilization estimation with confidence,” IEEE Transactions
on Software Engineering, vol. 38, no. 3, pp. 561-578, May-June 2012.
Mehul Vora has received B.E. degree in Chemical
Engineering from University of Mumbai, India in
2000, and M.S. in Computer Science & Ph.D. degrees
from the Clarkson University, NY (USA) in 2003 and
2007, respectively. Since 2008, Mehul has been
associated with Tata Consultancy Services (TCS)
Limited, Mumbai, India. He has served diverse roles
like measurement science analyst and business analyst.
In his current role as a R&D scientist at Innovation
Labs, TCS, he is associated with performance engineering research center.
International Journal of Computer Theory and Engineering, Vol. 6, No. 2, April 2014
123