Embed Size (px)
Citation preview
7/24/2019 Prediction and Observation of Pore Pressure Due to Pile Driving
http://slidepdf.com/reader/full/prediction-and-observation-of-pore-pressure-due-to-pile-driving 1/7
Missouri University of Science and Technology
Scholars' Mine
I#aa* C$##!# Ca# H# G##!&!a* E%##%
(1993) - 7 I#aa* C$##!# Ca#H# G##!&!a* E%##%
J 1, 12:00 AM
Prediction and observation of pore pressure due topile driving
S. Chandra
Md.I. Hossain
F** & a aa* a: &8://!&*a+#.+.#/!!&%#
7 A !*# - C$##!# !##% %& 5 $ $## a # a!!# 5 &# G#!#!# a G#*%!a* a P#*#+ E%##% a
S!&*a' M#. I &a ## a!!## $ !* I#aa* C$##!# Ca# H# G##!&!a* E%##% 5 a a&#
a+a $ S!&*a' M#. F +# $+a, *#a# !a! #a#@+.#.
R#!++## CaS. C&aa a M.I. Ha, "P#! a #a $ # ## # *# %" ( J# 1, 1993). InternationalConference on Case Histories in Geotechnical Engineering. Pa# 46.&8://!&*a+#.+.#/!!&%#/3!!&%#/3!!&%#-#01/46
7/24/2019 Prediction and Observation of Pore Pressure Due to Pile Driving
http://slidepdf.com/reader/full/prediction-and-observation-of-pore-pressure-due-to-pile-driving 2/7
roceedings: Third International Conference on Case Histories in Geotechnical Engineering
St.
Louis Missouri
June 1-4 1993 Paper No.
1.66
Prediction and Observation
of
Pore Pressure Due
to
Pile Driving
S
Chandra
Md.
I
Hossain
Associate
Professor of Civil Engineering I.I.T., Kanpur India
Graduate Student School of Engineering University of Oklahoma
SYNOPSIS
In th i s study,
pore
pressure response due
t o p i l e
driving has been observed in the f i e ld .
cavi ty
Expansion
theory
using c r i t i c a l s t a t e parameters of t he so i l has been used to predic t the t rend o f
the
pore
pressure
development and diss ipa t ion . Parametric study has
been
carr ied out
to
know
the
sens i t iv i ty of
var ious
parameters
on the predic ted r e su l t s .
A comparison
has
been made
between
the
predicted
and
observed resu l t s .
INTRODUCTION
The
behaviour of displacement
pi l e s in
c lay i s
an important and s ign i f i can t problem in
geotechnical
engineering.
When
displacement
pi les a re
dr iven
in to a cohesive
so i l ,
l a rge
excess pore pressures are generated close to
the
pile. The high pore pressures
down the p i l e
shaf t
reduce
the act ive s t r e s s e s
and
t hus
fac i l i ta te
the process of
driving
the
p i l e
to
the required
depth
of penetra t ion. At t e same
time, t h i s
may crea te problem
o f
l a rge
displacement
o f pi l e
head. Pi l e dr iv ing
operations are
sometimes
grea t ly
in ter rup ted o r
even
stopped due to the
development
of excessive
pore pressures may af fec t the s t a b i l i t y of
slopes in to which the pi les a re driven.
In
order
to explore these problems, a knowledge of
the magnitude and
dis t r ibu t ion
of the
induced
pore
pressures
with respect
to
both depth and
dis tance from the
pi l e
axis i s essent ia l .
This study
concentra tes
on the p red ic t ion of
pore
pressure
response
due to p i l e dr iv ing and
compares it
with the
observat ions
n
t h e
f i e ld .
The use of the cavi ty
expansion
theory
to
predic t t he
pore pressure
i s one of
the
methods
t r i ed in
t he
pas t . Ladyani 1963) inves t iga ted
analyt ical ly
t he
expansion of a cav i ty n a
sa tura ted clay
medium consider ing
di f f e r en t
cases o f s t r e s s
dis t r ibu t ion around
the cav i ty .
General so lu t ions to the problems o f expansion
of spherica l and cy l indr ica l cav i t i e s
in an
ideal per fec t ly pla s t i c
so i l possessing
both
cohession
and
f r ic t ion
have
been
presented
by
Vesic 1972). These
so lu t ions can
be used
to
evaluate
t he
s t r e s s
and
pore
pressure
genera ted
during the undrained
cav i ty
expansion.
Desai
1978)
studied
theore t i ca l ly
the changes
in s t r e s s and pore water pressure due
to p i l e
driving on the
bas i s
of the cav i ty expansion
approach and
used
f in i t e element
procedure:
Randolph and Wroth
1979)
presented
an
analy t ica l so lu t ion fo r the conso l ida t ion
of
soi l around a
dr iven pi le ,
based
on
the
r ad ia l
of pore water .
They
showed t h a t
the
r a t e of
di ss ipa t ion of
pore pressure depends on the
79
maximum pore
dr iving and
pi le
_falls
coef f i c ien t of
consol idat ion and
pressure developed
during
the pi l e
tha t the
pore
pressure close to the
off very rapidly i n i t i a l l y .
RANDOLPH
e t . a l .
1979)
showed
tha t ,
by
using
the
f i n i t e element
method
incoporated with the
modified cam-clay
model, the
ra te of
increase in
shear
s t reng th
of so i l
a f t e r
pi le
dr iving can
be
predicted.
CARTER e t . a l .
1979) presented a
more
rigorous
analys i s ofthe
dissipat ion
of excess pore
pressure the
solut ion
have been obtained
using a
f in i t e element analysis incorporat ing
the
modified
cam-clay
model. t has been concluded
t h a t the
dissipat ion
of pore
pressure
with t ime
i s r e l a t i v e l y unaffected
by
the choice of the
s o i l model and
a good
estimate
can
be
obtained
by assuming a l inear
e la s t i c
so i l with sensible
choice of parameters.
The
development and
di ss ipa t ion of
pore
pressure ,
in
t h i s
study have been predic ted
by
using the computer program
CAMFE
f in i t e element
representat ion of undrained cy l indr ica l
cavi ty
expansion with
modified Cam-clay as model).
The
pred ic ted
values were
compared
with
observed
values and n general , t he aggrement
between
the
two was
very
encouraging.
FIELD INVESTIGATIONS
In
orde r
to check the val id i ty of CAMFE program
for Bangkok
so i l and
to
observe t he inf luence of
d i f f e r en t so i l parameters
on
the response
of
pore
pressure during
pi l e driving,
f i e ld
observat ions
were made a t Thammasat University,
Rangsi t campus, Bangkok he
depth of
explora t ion was l imited to
15 meters
s ince the
s tudy was concerned
mainly with the
sof t clay
l ayer
o f
Bangkok subsoi l . Excess pore pressure
was observed from eighteen piezometers
surrounding
the
pi le
and observat ions were
recorded from
the
t ime
o f
p i l e
ins ta l l a t ion
7/24/2019 Prediction and Observation of Pore Pressure Due to Pile Driving
http://slidepdf.com/reader/full/prediction-and-observation-of-pore-pressure-due-to-pile-driving 3/7
(October 28,
1986) un t i l
15th February, 1987.
In
addi t ion to
th i s ,
6 dutch cone penet ra t ion
t e s t s , 6 vane shear t e s t and
two
boreholes
upto
15
meters depth were
car r ied
out .
The
locat ion
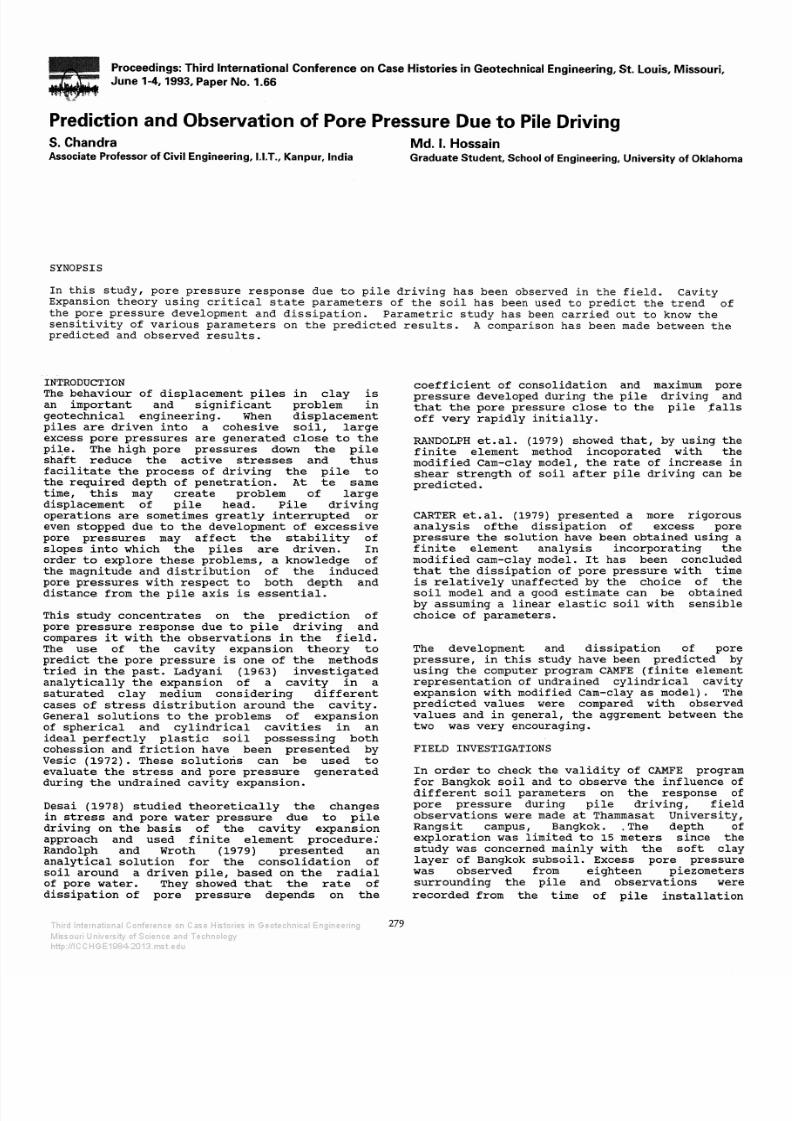
of these t e s t s and the arrangements of
piezometers
i s
shown
in Fig. 1.
Hlm
,..__...Scale
o Borehole
n Pile
• Test pile
Active piezometers
• Dummy piezometers
x Field
vane
A Dutch cone
Pore
pressure measuring
board
•••
·---.,
B•
•
:n
n
n:
•n
n:
_ _ _ _
.
Fig. l
Location
of piles,
Piezometers
soreholes,Field
li an
tests,and
Dutch Cone Tests
The
measurement
of
excess pore pressure was
car r ied out by
using
AIT hydraulic type
piezometers.Open
stand pipes
were
used
as
Dummy piezometers and a
closed hydraul ic
system
was
used
for
the
ac t ive
piezometers.
As
a
large
no of pi les
were
dr iven ear l i e r
a t the
s i t e ,
some excess
porewater
pressure was
already
exsis t ing
a t the s i t e . As the
diss ipat ion
of
pore
pressure of
the ea r l i e r
driven
pi l e s became
very
slow a t
tha t stage ,
t
was
therefore
expected t h a t
the
pore pressure measurements due
to the t e s t
p i le
driving
would
not be effected
much.
Under
th i s condi t ion the
pi l e
driving
opera t ion
of the t e s t p i le s ta r ted .
The excess
pore pressure due to th i s
was
monitered
continuously
dur ing the pi l e
driving
and was
continued un t i l the maximum
value was reached.
After
t ha t
the
readings were taken a t cer ta in
in te rva l s
o f t ime. The measurements
were
continued for 3 months and
15
days un t i l most o f
the excess pore
pressure
dissipated.
LABORATORY
TESTS : In the labora tory, t r i ax ia l
t e s t s were
performed
on so i l
samples
from BHl
and BH2 a t the
depths
3.0 ,
6.0
and 9.0 m below
ground l eve l to ge t
preconsol ida t ion
pressure,
compression index swel l ing index coef f i c ien t
o f
consol idat ion
and coef f i c ien t of permeabi l i ty .
CIU
t e s t s were performed to get normalized
s t r es s - s t r a in
curves
to evaluate the undrained
Youngs Modulus
and
undrained shear modulus. The
plo t
of
mean
ef fec t ive
s t r e s s
(P) verses
devioter ic
s t r es s q) was a lso made to
get
the
s t r es s r a t io a t the fa i lure
M) and the earth
pressure a t
r e s t
(k
) .
280
INPUT DATA FOR THE PROGRAM
In order to run
the
program some
so i l
propertie
and
i n i t i a l s t a t e of s t resses were needed. Thes
parameters
were
obtained from the
l b o r t o ~
t e s t s on the
samples
of the s i t e . The p r o g r ~
was run
with
the standard values and also wi
the upperbound
and
lower
bound values
o
di f fe rent
parameters
for
the
Bangkok soi l .
Thes
values are l i s t e d
in
Table I . The parameter
were divided i n to following three categories
t
observe
t he i r
inf luence
in
the predict ion o
excess pore pressure.
(i) c r i t i c a l
s ta te
parameters (1,
k,
e,
M
( i i ) shear
modulus
(G)
( i i i )permeabi l i ty (K)
Table 1 Input
parameters for
C MFE
Nogram
Para-
From
Past
Lower
Upper
meters
lab
work
bound bound
Depth
3·0m
Ko
---
0·60
---
---
rrvr/
35·6
---
---
---
kn/m2
pc
100·1
---
---
---
knlm
2
M
1-12
1·00 0·95
1-15
}
0·456
0-51
0·40
0·55
K
p-oa1 0·091
0·075
0·10
ecs
2·75
2·16
2·5
3·0
kh
0·89
89
10E-8
8·90
10
m/min
G
3500
---
1500
3500
kn/m2
PILE
GEOMETRY
The t e s t p i l e which
was
used to observe the por
pressure response
was
0.6 x 0.26 x 21.0
I - sec t ion pres t r essed concrete pi le .
I t
wa
assumed t h a t the so i l n
between
the flange
were also ac t ive in expanding the
cavi ty
an
the equivalent radius of
p i l e was
taken
a
0.147 m. The i n i t i a l radius of cyl indrica
cav i ty ,
therefore ,
was
taken as
0.147
m.
Th
phenomenon o f
cavi ty expansion
was
modelled
consider ing the expansions of a pre exist in
cav i ty o f
i n i t i a l
radius r
=
a
to
a new
c v i t
of radius r = 2a •
Three
node elements were used for the analysi
The nodes are so
spaced
tha t the
radia
coordinates o f
any
two adjacent nodes are
f ixed proport ion. The only mesh data required
a
input
for the program
are
the number of node
the
i n i t i a l
r ad ia l coordinates
of
the interio
node and
the ra idius r a t io . The arrangement
the Nodes in
an element
i s shown in Fig.
with maximum number of
elements
as 99.
7/24/2019 Prediction and Observation of Pore Pressure Due to Pile Driving
http://slidepdf.com/reader/full/prediction-and-observation-of-pore-pressure-due-to-pile-driving 4/7
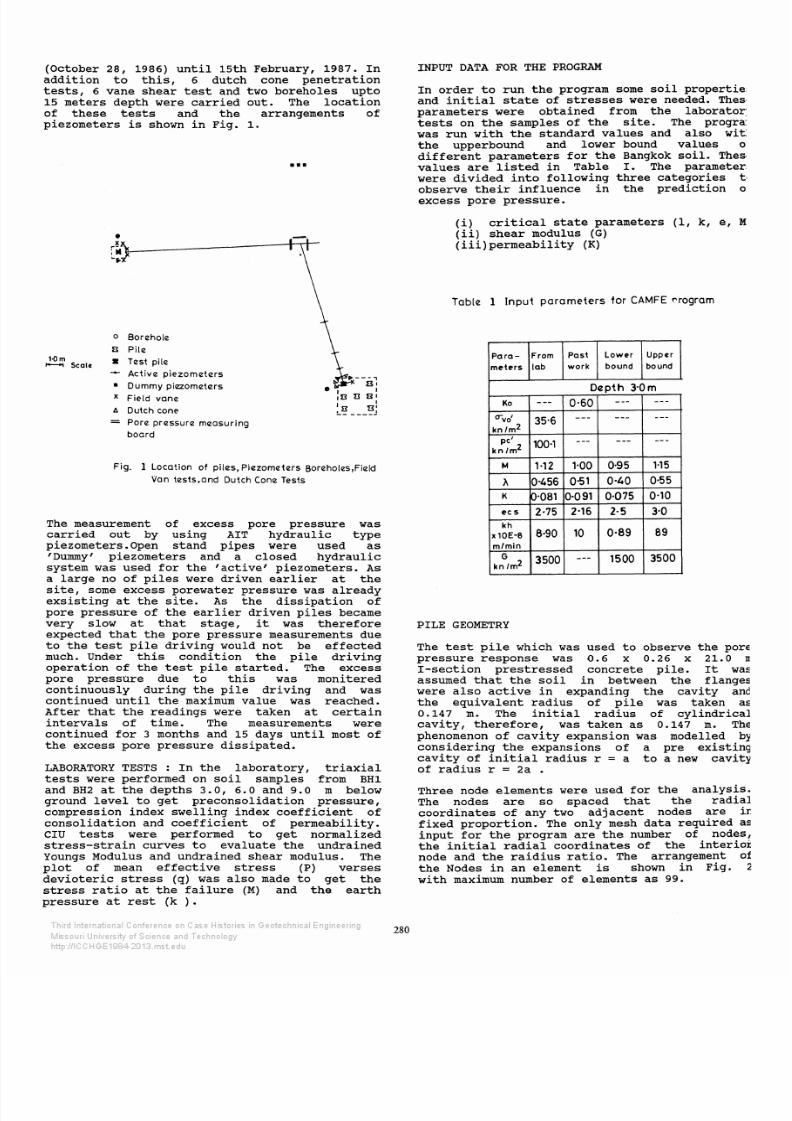
I ~ Z m e n t 2i-1
Fig. 2 A Typical
f in i te
element
TIME
STEPS
AND
CAVITY EXPANSION
i+2
r
The expansion
of the cav i ty has
been
analysed
using 190 t ime
steps and
a t each
s tep the inner
boundary of the
so i l
s displaced outward by a
specified
amount. Small
displacement s teps are
required
during
ear ly par t
o f
the
expansion
when
element of
the
so i l adjacent to the
cav i ty are
yield ing
and
approaching
the
fa i lure
~ o r
cr i t i ca l s ta te ) condi t ions . The
t ime
s tep s1ze
is progress ively en larged as
the
cav i ty expands.
I f
the
ra te
of
expansion s
taken
as
0.1
mjmin.,
then
t
wil l take
a
t o t a l
t ime
of 0.847 min to
double
the
cavi ty s ize .
This
time s considered
small
enough
to
adequate t ly approximate
an
undrained expansion and yet
large
enough to
avoid numerical
problems
with
the solut ion
routine.
The
reconsol idat ion
of
s o i l
af t e r
the
cavity expansion
i s
assumed, n t h i s case , to
be achieved n
34
t ime
s teps of varying s izes .
8 0 . ~ ~
o ~ - - ~ - - ~ - - - - ~ - - - 3 7 - - - ~ - - ~ s
Time
log scole),mins
o
0·4m + 0-5m
o 1m A
2m x 4m
Fig.
} Predicted time
history
of
ex ess
pore pressure
at
different
radial distances
from the
pile
axis
at 3·0m
deoth
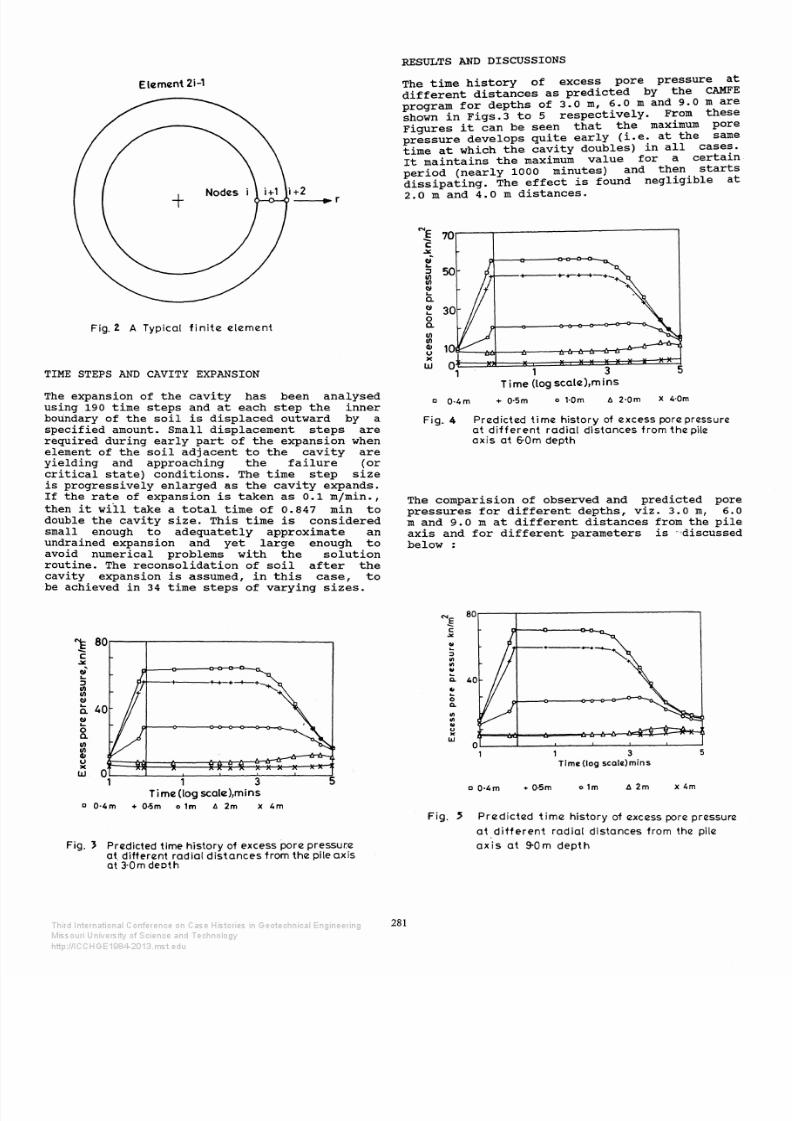
RESULTS
AND
DISCUSSIONS
The t ime his to ry o f
excess
pore pressure a t
di f fe rent dis tances as
predicted
by the
CAMFE
program
fo r
depths
of 3.0
m,
~ - 0
m and 9.0 m
are
shown n Figs .3 to
5
respect1vely. F ~ o m
these
Figures t can
be
seen t ha t
the
max1mum pore
pressure
develops
qui te ear ly
i . e .
a t the same
t ime
a t which the cav i ty doubles)
n
a l l c a s e ~ .
I t mainta ins the
maximum
value
for a certa1n
period near ly 1000 minutes) and t h ~ n s ta r t s
diss ipa t ing .
The ef fec t
i s
found
negl1g1ble
a t
2.0
m
and
4.0
m
distances.
281
'E
70
-
:
X
Cl
::J
ll
ll
Cl
a.
I)
0
a.
ll
ll
CIJ
u
'
J
1 3
5
Time
log
scole),mins
c
0·4m
+ O·Sm
o 1·0m
6 2·0m
x 4·0m
Fig. 4
Predicted
t ime
history of excess
pore
pressure
at
di f ferent
radial distances from the
pile
axis at 6·0m
depth
The
comparis ion
of observed and predicted pore
pressures fo r
di f fe rent depths, viz .
3.0 m 6.0
m
and
9.0
m
a t di f fe rent di s t ances
from
the
pi le
axis
and
fo r di f fe rent parameters i s -·discussed
below :
~
c
::>
Ill
Ill
Q.
0
Q.
Ill
Ill
u
'
JJ
8 0 r - - - - T - - - - - - - - - - - - - - - - - - - - - - - - - ,
Q L L ~ ~ ~ ~ ~
1 1 3 5
Time leg scale)mins
c 0·4m
+ 0·5m
o 1m A 2m
x 4m
Fig.
Predicted
t ime
history
of
excess porcz
pressurcz
at
di f ferent radial distances from the
pile
axis
at
9·0m
depth
7/24/2019 Prediction and Observation of Pore Pressure Due to Pile Driving
http://slidepdf.com/reader/full/prediction-and-observation-of-pore-pressure-due-to-pile-driving 5/7
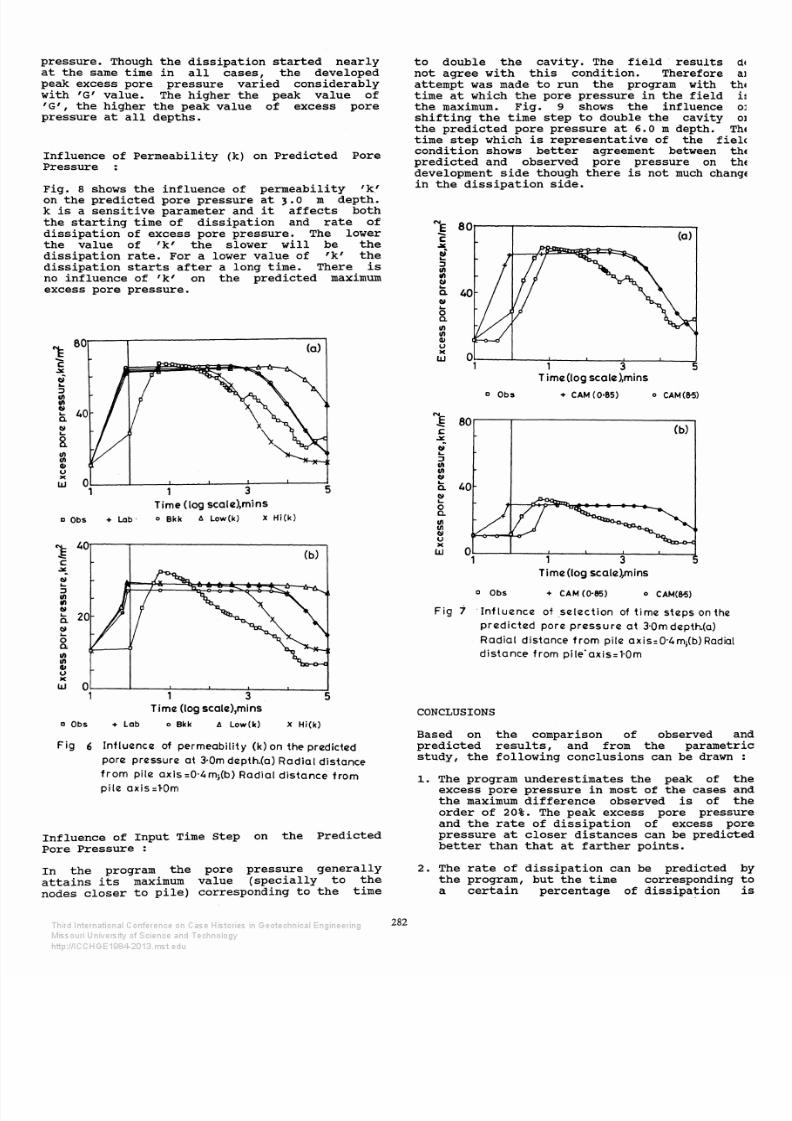
pressure . Though the
diss ipat ion
s ta r ted near ly
a t the
same t ime
in
a l l
cases, the
developed
peak
excess pore pressure var ied cons iderably
with 'G'
value.
The
higher the peak value of
G , the higher the peak value of excess
pore
pressure a t
a l l
depths.
Influence
of Permeabi l i ty
(k)
on Predic ted Pore
Pressure
Fig.
8
shows
the
inf luence of permeabi l i ty
k
on the
predicted
pore pressure
a t
, .o m
depth.
k i s a sens i t ive parameter and
t
af fec t s
both
the
s t a r t i ng
t ime of diss ipat ion
and
r a te o f
d iss ipa t ion of excess pore
pressure.
The lower
the
value
of k
the
slower
wil l be the
diss ipat ion
ra te . For a
lower
value of
k
the
diss ipat ion s t a r t s
af te r a long t ime. There i s
no
inf luence of k on the predicted maximum
excess pore
pressure.
1: 80
(a)
c
. .¥
,;
...
Sl
Cil
_
a.
Ci
Cll
u
o, 3 5
Time
(log
scale),mins
aQbs + l a b ·
oBkk
6L.ow(k) XHi k )
1
40
(b)
c:
- :.
Ci
_
I l l
.
Ci
....
a.
Cil
....
0
Q;
Ill
I ll
Cll
u
>
0
,
3
5
Time
(log scate),mins
a Obs
+ L.ab
o Bkk
t
L.ow(k) X
Hi(k)
Fig 6 Influence of permeability
(k) on
the
predicted
pore pressure
at
3·0m depth.(a) Radial distance
from
pile
axis
=0·4 m;(b)
Radial
distance
from
pile axis:l-Om
Inf luence o f
Input
Time Step
on the Predicted
Pore Pressure :
In the program the pore pressure genera l ly
a t ta ins i t s maximum value (special ly to the
nodes c loser to
p i l e ) corresponding to
the
t ime
282
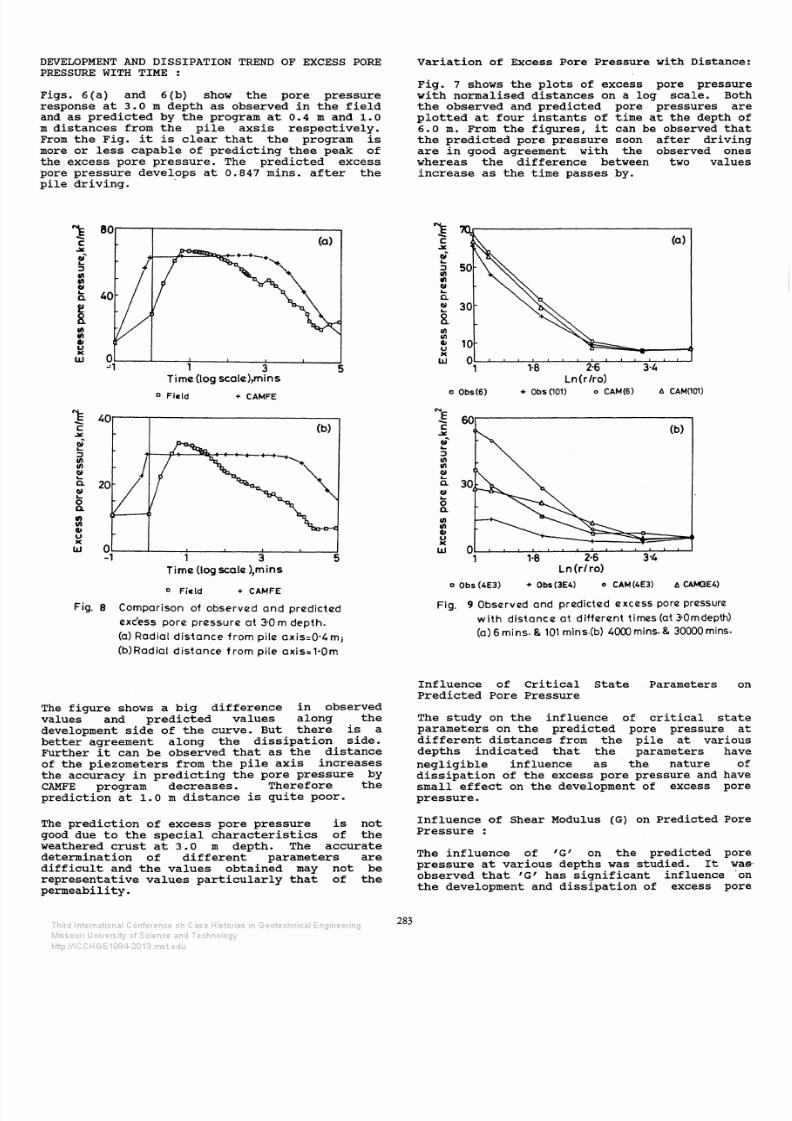
to
double
the cavi ty .
The
f ie ld resul ts d
not agree with th i s condit ion. Therefore
a
at tempt
was made to
run
the program with th
t ime
a t
which the pore pressure in the
f ield
i
the
maximum.
Fig.
9
shows the
influence
O
sh i f t i ng the t ime s tep to double the cavity 0
the
pred ic ted pore
pressure a t
6.0 m
depth.
Th
t ime s tep which i s r epresen ta t ive of the
fiel<
condi t ion shows bet te r
agreement
between
thE
pred ic ted and
observed
pore pressure
on
thE
development s ide though there i s not much chang
in the diss ipa t ion s ide.
'E
80r . .
~
_ .
F
Ill
Ill
a.
40
Ci
....
0
a.
Ill
Ill
Cll
u
w
0 ~ - - ~ - - - - ~ - - ~ ~ - - ~ - - - - ~ - - - d
, 1 3
Time(log
c a l e ~ m i n s
a Obs
+
CAM
(0·85)
o CAM(8-5)
~
s o . . ~
c
..><
Cll
...
Ill
Ill
Cll
a.
40
Il l
....
8.
Ill
Ci
u
>
w
o Obs
3
Time (log
scale),mins
+
CAM
(0·85)
o CAM( 5)
Fig 7
· Inf luence of .selection
of t ime steps on the
predicted
pore
pressure at 3·0m depth.(a)
Radial
distance
from
pile axis:0·4m;(b)
Radial
distance
from pile axis=1-0m
CONCLUSIONS
Based on the comparison of observed a
predicted r esu l t s , and from the parametr
s tudy,
the
following conclusions
can be
drawn
The program
underes t imates
the peak of th
excess pore
pressure in most of
the
cases an
the maximum di f ference observed i s of th
order
of 20 .
The
peak
excess pore
pressu
and
the r a t e of diss ipat ion of
excess po
pressure
a t
c loser dis tances can be predicte
be t te r
than
t h a t a t fa r ther
points .
2.
The
r a t e
of d i s s ipa t ion can be predicted
the program, but the t ime corresponding
a ce r t a in percentage
of
dissipat ion
7/24/2019 Prediction and Observation of Pore Pressure Due to Pile Driving
http://slidepdf.com/reader/full/prediction-and-observation-of-pore-pressure-due-to-pile-driving 6/7
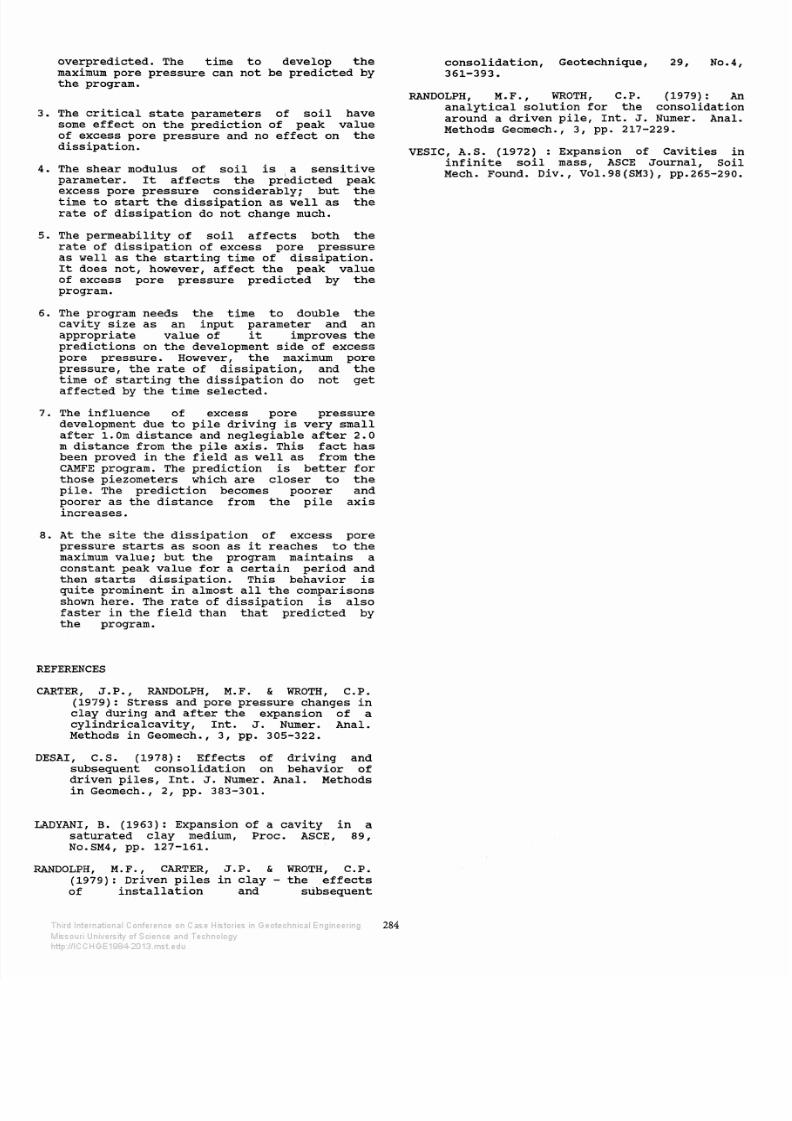
DEVELOPMENT AND DISSIPATION
TREND
OF
EXCESS
PORE
PRESSURE WITH TIME :
Figs. 6(a)
and 6(b) show the
pore
pressure
response
a t
3.0 m depth as observed
in
the f i e ld
and
as
predicted
by the program
a t
0.4 m and 1 .0
m
dis tances
from the
p i l e axsis respect ively .
From
the
Fig. t i s c lear tha t
the program
i s
more or
l e s s
capable of pred ic t ing thee
peak
o f
the excess pore pressure. The predicted excess
pore pressure develops
a t
0.847 mins. af t e r
the
pi le
dr iv ing .
·
80
c:
a)
..¥
01
:1
=
1
c.
Ill
Ill
0
-'1
1
3
5
TimG
log
sc:ale),mins
a
Field
+
CAMFE
1:
-40
-
:
(b)
..¥
t i
:1
Il l
Il l
Cll
Q.
1
8
=u
>C
w
0
-1
1
3
5
Time
(log
scal12
)
1
m
ins
D Field
+
CAMFE
Fig. 8
Comparison of
observ12d and priZdicted
exc'ess pore pr12ssur12 at 3·0 m depth.
(a) Radial distance from pile
axis:0·4
m
b)Radial distance from pile axis=1·0m
The f igure shows a big d i f f erence in
observed
values
and pred ic ted
values along
the
development
s ide
o f
the
curve. But there i s a
bet t e r agreement along the diss ipa t ion s ide .
Further
t
can
be observed
t h a t
as
the
dis tance
of
the
piezometers
from the
p i l e
ax i s increases
the accuracy
in
pred ic t ing the
pore
pressure by
CAMFE
program
decreases . Therefore the
predict ion a t
1 .0 m dis tance i s
qui te
poor.
The
predict ion
o f excess pore
pressure
i s not
good
due
to the spec ia l charac te r i s t ics
of the
weathered
c r us t a t 3.0
m
depth . The
accurate
determinat ion
o f
d i f f e r en t
parameters
are
d i f f i c u l t and t he
values
obtained may not be
representat ive values
pa r t i cu l a r ly
t h a t of the
permeabi l i ty .
283
var ia t ion of
Excess
Pore Pressure
w ~
Distance
Fig. 7 shows the plo t s of excess pore
pressur
wi th normalised
dis tances
on a
log scale. Bo
the
observed
and
predicted
pore pressures
ar
p lo t t ed a t
four ins tants
of t ime a t the depth
o
6 .0 m.
From
the f igures t can be observed tha
the pred ic ted pore pressure soon af te r drivin
are in
good agreement
with the
observed one
whereas the dif ference between two value
increase
as
the
t ime
passes
by.
(a)
..¥
t
:1
Il l
Ill
1
c.
1
30
8
I ll
Ill
10
u
C
0
1·8
2·6
3·4
Ln rlro)
o Obs 6)
+ Obs(101)
o CAM(6) A CAM(101)
NE
60
-
:
(b)
..¥
w'
:1
Il l
Ill
Cll
c.
Cll
0
Q.
Ill
Ill
u
>C
w
0
1
1·8
2·6
3·4
Ln r/ro)
a Obs 4E3)
+ Obs 3E4)
o CAM(4E3)
A
CAM(3E4)
Fig.
9 Observed
and
predicted
excess pore pressure
with distance
at
differ12nt times (at
3-0m
depth)
(a) 6 mi ns. 101 mins.(b) 4000 mins. 30000 mins.
Inf luence of Cri t ica l s t a t e
Predicted
Pore Pressure
Parameters o
The study on the inf luence of cr i t i ca l s ta t
parameters on the
predicted pore
pressure a
d i f f e r en t
dis tances from the
p i l e a t
variou
depths
indicated
t ha t the
parameters
hav
negl igible
inf luence as the nature o
diss ipa t ion
o f
the
excess pore
pressure
and hav
small ef fec t on the
development
of excess por
pressure.
Inf luence of Shear Modulus G) on Predicted
Por
Pressure
:
The
inf luence of
G
on
the
predicted
por
pressure a t various depths was studied. I t
wa
observed
t ha t G
has s ign i f i can t influence ··o
the
development
and
diss ipat ion
of excess por
7/24/2019 Prediction and Observation of Pore Pressure Due to Pile Driving
http://slidepdf.com/reader/full/prediction-and-observation-of-pore-pressure-due-to-pile-driving 7/7
overpredicted. The t ime to
develop
the
maximum
pore
pressure can
not
be
predicted
by
the
program.
3. The
cr i t i ca l
s t a t e
parameters of so i l have
some
ef fec t on
the
pred ic t ion of
peak value
of
excess pore
pressure and no
ef fec t
on the
diss ipat ion.
4. The shear modulus of
s o i l i s
a sens i t ive
parameter . t af fec ts
the p r ~ d i t e d
peak
excess pore
pressure
considerably;
but
the
time to s t a r t
the
diss ipat ion as well as the
ra te
of diss ipat ion
do not
change
much.
5. The
permeabi l i ty of
so i l af fec t s both the
ra te
of diss ipat ion
of excess
pore pressure
as well
as the
s ta r t ing time o f diss ipa t ion .
I t does
not ,
however, af fec t
the
peak
value
of excess pore
pressure
predicted by the
program.
6.
The
program
needs
the t ime to double the
cavi ty s ize as an input parameter
and
an
appropria te
value of it improves the
predict ions on the
development
s ide
of excess
pore pressure. However, the maximum pore
pressure,
the r a te of
diss ipat ion and the
time
of
s t a r t i ng the diss ipat ion
do
not
get
affected by the
t ime
selected .
7.
The
inf luence of excess
pore
pressure
development due
to p i le
driving
i s very small
af te r 1.0m
dis tance
and neglegiable a f t e r
2.0
m dis tance from the p i le axis . This
f ac t
has
been proved in the
f i e ld
as well as from the
CAMFE program.
The
predict ion i s be t te r fo r
those piezometers which are
closer
to the
pi le .
The pred ic t ion becomes poorer and
poorer as the d is tance from the p i l e ax is
increases .
8. At the s i t e the
diss ipat ion
of excess pore
pressure s t a r t s as soon
as
it reaches to the
maximum
value;
but the program maintains a
constant
peak
value
for
a
cer ta in
period
and
then s ta r t s
diss ipat ion.
This behavior i s
quite prominent
in
almost a l l the comparisons
shown
here .
The r a te of diss ipat ion
i s
also
fas te r
n the
f i e ld
than tha t predicted by
the
program.
REFERENCES
CARTER
J .P .
RANDOLPH M.F.
WROTH
C.P.
1979): Stress and pore
pressure
changes
in
clay
during
and
af te r the
expansion
o f
a
cyl indricalcavi ty
Int . J . Numer.
Anal.
Methods n
Geomech.,
3, pp. 305-322.
DESAI
c . s .
1978):
Effects of driv ing
and
subsequent
consol idat ion
on behavior of
driven piles. , In t . J .
Numer.
Anal. Methods
n Geomech., 2, pp. 383-301.
LADYANI
B.
1963):
Expansion of a cav i ty in a
sa tu ra ted c lay medium, Proc.
ASCE
89,
No.SM4 pp.
127-161.
M.F., CARTER J .P . WROTH C.P.
1979):
Driven
p i les in c l a y - the . e f fec t s
o f
in s ta l l a t ion and
subsequent
284
consolidat ion Geotechnique,
361-393.
29,
No.4,
RANDOLPH
M.F., WROTH
C.P. 1979):
n
ana lyt ica l so lu t ion for the
consol idat ion
around
a
driven
p i le Int . J . Numer. Anal.
Methods
Geomech.,
3, pp.
217-229.
VESIC
A.S. 1972)
: Expansion
of cav i t ies n
i n f in i t e so i l mass, ASCE Journal , Soil
Mech. Found.
Div. ,
Vol.98 SM3),
pp.265-290.


![Pile Foundation Design[1] - ITDmtp.itd.co.th/ITD-CP/data/PileFoundationDesign.pdf · Introduction to pile foundations Pile foundation design Load on piles Single pile design Pile](https://img.pdfslide.net/doc/110x75/5a6ffb387f8b9ab1538b8376/pile-foundation-design1-itdmtpitdcothitd-cpdatapilefoundationdesignpdfpdf.jpg)


![[04899] - Design of Pile & Pile-Cap](https://img.pdfslide.net/doc/110x75/5695d3331a28ab9b029d273d/04899-design-of-pile-pile-cap.jpg)