Embed Size (px)
Citation preview
HAL Id: hal-00740247https://hal.archives-ouvertes.fr/hal-00740247
Submitted on 9 Oct 2012
HAL is a multi-disciplinary open accessarchive for the deposit and dissemination of sci-entific research documents, whether they are pub-lished or not. The documents may come fromteaching and research institutions in France orabroad, or from public or private research centers.
L’archive ouverte pluridisciplinaire HAL, estdestinée au dépôt et à la diffusion de documentsscientifiques de niveau recherche, publiés ou non,émanant des établissements d’enseignement et derecherche français ou étrangers, des laboratoirespublics ou privés.
Prediction of Alzheimer’s disease in subjects with mildcognitive impairment from the ADNI cohort using
patterns of cortical thinning.Simon Eskildsen, Pierrick Coupé, Daniel García-Lorenzo, Vladimir Fonov,
Jens C Pruessner, D Louis Collins
To cite this version:Simon Eskildsen, Pierrick Coupé, Daniel García-Lorenzo, Vladimir Fonov, Jens C Pruessner,et al.. Prediction of Alzheimer’s disease in subjects with mild cognitive impairment from theADNI cohort using patterns of cortical thinning.. NeuroImage, Elsevier, 2012, 65, pp.511-521.�10.1016/j.neuroimage.2012.09.058�. �hal-00740247�

Title: Prediction of Alzheimer’s disease in subjects with mild cognitive impairment from the ADNI cohort
using patterns of cortical thinning
Authors: Simon F. Eskildsena,b,*, Pierrick Coupéb,c, Daniel García-Lorenzob,d, Vladimir Fonovb, Jens C.
Pruessnere, D. Louis Collinsb and the Alzheimer’s Disease Neuroimaging Initiative**
a Center of Functionally Integrative Neuroscience, Aarhus University, Aarhus, Denmark
b McConnell Brain Imaging Centre, Montreal Neurological Institute, McGill University, Montreal, Canada
c Laboratoire Bordelais de Recherche en Informatique, Unité Mixte de Recherche CNRS (UMR 5800),
Bordeaux, France
d Centre de neuro-imagerie de recherhe, Institut du Cerveau et de la Moelle épinière, Paris, France
e Departments of Psychiatry, Neurology and Neurosurgery, McGill University, Montreal, Canada
Word count: 7816 (excluding figure and table captions)
6 tables and 5 figures
*Corresponding author:
Simon Fristed Eskildsen
Center of Functionally Integrative Neuroscience, Aarhus University, Nørrebrogade 44, Aarhus, Denmark
Telephone: +45-7846-9939, mobile: +45-2210-1234, fax: +45-8949-4400
Email: [email protected]
** Data used in the preparation of this article were obtained from the Alzheimer's Disease Neuroimaging Initiative
(ADNI) database (www.loni.ucla.edu/ADNI). As such, the investigators within the ADNI contributed to the design
and implementation of ADNI and/or provided data but did not participate in analysis or writing of this report.
Complete listing of ADNI investigators is available at http://adni.loni.ucla.edu/wp-
content/uploads/how_to_apply/ADNI_Authorship_List.pdf).

Prediction of AD in subjects with MCI 2
Abstract Predicting Alzheimer’s disease (AD) in individuals with some symptoms of cognitive decline may have
great influence on treatment choice and disease progression. Structural magnetic resonance imaging
(MRI) has the potential of revealing early signs of neurodegeneration in the human brain and may thus
aid in predicting and diagnosing AD. Surface-based cortical thickness measurements from T1-weighted
MRI have demonstrated high sensitivity to cortical gray matter changes. In this study we investigated
the possibility for using patterns of cortical thickness measurements for predicting AD in subjects with
mild cognitive impairment (MCI). We used a novel technique for identifying cortical regions potentially
discriminative for separating individuals with MCI who progress to probable AD, from individuals with
MCI who do not progress to probable AD. Specific patterns of atrophy were identified at four time
periods before diagnosis of probable AD and features were selected as regions of interest within these
patterns. The selected regions were used for cortical thickness measurements and applied in a classifier
for testing the ability to predict AD at the four stages. In the validation, the test subjects were excluded
from the feature selection to obtain unbiased results. The accuracy of the prediction improved as the
time to conversion from MCI to AD decreased, from 70% at 3 years before the clinical criteria for AD was
met, to 76% at 6 months before AD. By inclusion of test subjects in the feature selection process, the
prediction accuracies were artificially inflated to a range of 73% to 81%. Two important results emerge
from this study. First, prediction accuracies of conversion from MCI to AD can be improved by learning
the atrophy patterns that are specific to the different stages of disease progression. This has the
potential to guide the further development of imaging biomarkers in AD. Second, the results show that
one needs to be careful when designing training, testing and validation schemes to ensure that datasets
used to build the predictive models are not used in testing and validation.
Keywords— AD, MCI, MRI, cortical thickness, prediction.
Eskildsen et al. 3
1. Introduction
The ability to diagnose and predict Alzheimer’s disease (AD) at an early or even pre-clinical stage has
great impact on the possibility for improving treatment choices of the disease. This may in turn lead to
reduced costs associated with long-term care. In addition, accurate prediction may also reduce costs
associated with selecting subjects for pharmaceutical trials when performing large scale tests on disease
modifying drugs, since false positives can be excluded in the initial stage. AD is characterized by
accumulation of amyloid-β (Aβ) and hyperphosphorylated tau in the brain, eventually leading to
neurodegeneration. To support an early diagnosis of AD, various biomarkers are currently being
investigated. Even though the accumulation of Aβ can be detected in the cerebrospinal fluid (CSF), or by
using positron emission tomography (PET) years before structural changes can be detected, structural
imaging markers based on magnetic resonance imaging (MRI) are considered more sensitive to change
after the first symptoms appear (Frisoni et al., 2010). Signs of atrophy in the medial temporal lobes may
aid in differentiating AD from other pathologies as MRI examinations often are part of the clinical
assessment standard of care in patients with mild cognitive impairment (MCI). While studies
investigating the usefulness of medial temporal lobe atrophy in the diagnosis of AD are ongoing (Coupe
et al., 2012; Cuingnet et al., 2011; Jack et al., 2011; Wolz et al., 2011), the assessment of patterns of
cortical thinning across the cerebrum may aid to increase the specificity of the diagnosis for the disease
(Apostolova and Thompson, 2008; Vemuri et al., 2008).
The high tissue contrast offered by T1-weighted (T1w) MRI enables accurate structural neuroimaging
analysis, which may be used as a possible surrogate biomarker for diagnosing and predicting AD (Ritchie
and Lovestone, 2002). However, so far the image processing techniques have not been able to
accurately predict future probable AD in patients with MCI (Cuingnet et al., 2011). Measurements of
cortical thickness based on MRI are highly sensitive to small structural changes across the cortex and
have been widely used to investigate cortical structural changes and differences in various diseases and
disorders, such as dementia, schizophrenia and obsessive compulsive disorder (Lerch et al., 2008; Narr
et al., 2005; Shin et al., 2007). However, results from previous studies suggest that cortical thickness
measurements do not perform better than other techniques when trying to predict AD in subjects with
MCI, yielding accuracies from 56% to 70% depending on the technique (Cuingnet et al., 2011; Wolz et
al., 2011). Cortical thickness is usually measured at a very high resolution (tens of thousands of points on
Prediction of AD in subjects with MCI 4
the cerebral cortex). Using such high numbers of measurements in prediction may lead to over-fitting in
a discriminatory model. The dimensionality can be reduced by defining regions of interests (ROI) in
which measurements are averaged or by transformation of the feature space, such as principal
component analysis (Yoon et al., 2007). The latter obstructs any meaningful functional or anatomical
interpretation of the features. Defining ROIs reduces the inherent noise of high resolution data and
reduces the risk of over-fitting. Usually such ROIs are predefined from a structural or functional
perspective. However, the pattern of neurodegeneration may not follow standard definitions for
anatomical or functional regions, thus such ROIs may lead to loss of discriminative information.
Therefore, data-driven approaches to select discriminative cortical thickness ROIs, independent of any
predefined parcellation, may lead to better prediction results.
Another factor preventing high predictive power is the heterogeneity of images when training a
classifier. Usually, a classifier is trained with images from individuals who convert to AD at some future
time point and images from individuals who do not convert to AD in the follow-up period. Inherently,
there is variability in the degree of neurodegeneration simply due to the variability of when the
converters actually convert. This variability affects how well the coefficients of the classifier can be
fitted. By homogenizing the images with respect to “time to conversion” and thereby the patterns of
atrophy, the classifier may learn the specific pattern and better fit the coefficients of the model.
In practice, a classifier must deal with MCI patients with variable “time to conversion”. Thus, to be
clinically applicable, the learned patterns of time-homogenized data must be incorporated into a single
classifier identifying the patterns in subjects with unknown status and predict a possible time to
conversion. To achieve this, it should first be established if improved classification accuracy can be
obtained with time-homogenized data. This is the overall question we address in this paper.
1.1. Previous work Recently, the task of predicting conversion from MCI to AD has received a lot of attention, mainly driven
by the emergence of large multi-center studies collecting data from hundreds of patients and controls
(Ellis et al., 2009; Lovestone et al., 2009; Mueller et al., 2005). Numerous approaches using structural
imaging have been suggested (Cho et al., 2012; Chupin et al., 2009; Cuingnet et al., 2011; Davatzikos et
al., 2011; Koikkalainen et al., 2011; Misra et al., 2009; Querbes et al., 2009; Westman et al., 2011; Wolz
et al., 2011). See Yuan et al. (2009) for a meta-analysis of work prior to 2009. Previously published
results indicate that using images obtained on a single scanner yield better prediction accuracies (Plant
et al., 2010) than images acquired in multi-center studies (Cuingnet et al., 2011; Wolz et al., 2011).
Eskildsen et al. 5
However, to be useful from a clinical point of view, an imaging marker should be effective across sites
and scanners. Therefore, the evaluation of this marker should be performed on data acquired over a
range of sites and scanners. The Alzheimer’s Disease Neuroimaging Initiative (ADNI) has made such
multi-site data publicly available, and thus has enabled the comparison of predictive accuracy of
different methods under similar circumstances. Here, we briefly review work on ADNI data for the
prediction of conversion from MCI to AD, i.e. classification of progressive MCI subjects (pMCI) over MCI
subjects who remain stable (sMCI). Results are summarized in Table 1.
Using baseline data, Chupin et al. (2009) automatically segmented the hippocampus and used the
volume in a k-means classifier to predict MCI conversion to AD within 18 months. They achieved an
overall classification accuracy of 64%. Global hippocampal volume might be prone to large inter-
individual differences and might not be specific for dementia prediction (Lupien et al., 2007).
Misra et al. (2009) used voxel-based morphometry (VBM) to define highly discriminating regions
identified by statistical differences between pMCI vs. sMCI using various kernel sizes and number of
features. Their highest achieved accuracy of 81.5% is the best result published to date. However, the low
number of pMCI (n=27) makes it difficult to compare with other published methods on ADNI data,
where at least twice as many pMCI are included.
Querbes et al. (2009) obtained relatively high accuracy (73%) with high sensitivity (75%). They used
mean cortical thickness within ROIs, defined by grouped Brodmann areas, combined with age in a linear
discriminant analysis (LDA) classifier to select an optimal set of ROIs. These ROIs were used to calculate a
thickness index that was used for prediction. Unfortunately, they did not use independent training and
test sets: the subjects used for testing were also used in the process of selecting the ROIs. By including
subjects to be classified in the feature selection, the classification procedure is influenced by the
characteristics of the test set and will most likely overestimate the accuracy as discussed later in this
paper. Furthermore, the discrepancy in number of sMCI and pMCI compared to other studies on ADNI
data makes it hard to evaluate the results.
Koikkalainen et al. (2011) also obtained relatively high accuracy (72%) with high sensitivity (77%) using
tensor-based morphometry (TBM) within automatically selected ROIs. As in Querbes et al. (2009), the
ROIs were selected using statistical maps of differences between all pMCI and sMCI subjects, while the
classification was validated by constructing training and test sets. Since subjects from the test set were
Prediction of AD in subjects with MCI 6
used to define the ROIs, the training and testing was not completely independent, and their results may
be biased and the accuracies are most likely overestimated.
Davatzikos et al. (2011) used voxel-based morphometry (VBM) to predict the conversion. They achieved
a classification accuracy of 56% using the VBM maps, and an accuracy of 62% by including information of
t-tau from CSF samples in a support vector machine (SVM) classifier. Davatzikos and colleagues trained
the classifier on patients with AD and cognitively normal (CN) individuals. In AD, the atrophy spreads
from the medial temporal lobe structures to the rest of the cortex (Braak and Braak, 1991). In addition,
it is hypothesized that the atrophy is a non-linear process. Therefore, the characteristic structural traits
that discriminate between AD and CN may be less sensitive to separate pMCI from sMCI. This may
explain the relatively low accuracy obtained by Davatzikos and colleagues.
Westman et al. (2011) used predefined cortical thickness regions and subcortical volumes to predict
conversion. They combined ADNI data with data from a large European project, called AddNeuroMed
(Lovestone et al., 2009), to predict converters in the respective cohorts. For ADNI data, they obtained a
low accuracy (58%), while the accuracy for AddNeuroMed was higher (70%). It should be noted that the
AddNeuroMed data was collected at six different sites, while ADNI data was collected at more than 50
different sites. This may explain the superior prediction accuracy on AddNeuroMed data.
Cuingnet et al. (2011) evaluated the prediction power of ten different structural methods, including
hippocampal volume and shape, various VBM approaches, and cortical thickness. Using SVM, they
obtained accuracies in the range of 58% – 71%, but with relatively low sensitivities. The validation was
performed by splitting the subjects into equally sized training and test sets, which biases the results to
the random selection process. Furthermore, the comparison suffered from many image processing
failures leading to different training and test sets for each method evaluated. It should be noted that the
image processing pipeline used in Cuingnet et al. (2011) deviates from the pipelines of the originally
published methods evaluated in the study. Thus, the results may deviate from what can be obtained
using the original methods.
Cho et al. (2012) used noise-filtered cortical thickness, principal component analysis and LDA to classify
pMCI over sMCI. Their classifier performed relatively well (71% correct rate), but with low sensitivity
(63%). Cho and colleagues used the same samples as in Cuingnet et al. (2011) and obtained similar
results.
Eskildsen et al. 7
Wolz et al. (2011) recently published prediction results using the highest number of sMCI and pMCI
subjects available to date. Baseline scans of the entire MCI population from the ADNI cohort were
selected and multiple methods were applied to predict the conversion to AD. They also used statistical
maps to define ROIs for respectively TBM and cortical thickness. Since they included test subjects in
their ROI selection step, their results may be biased and the accuracy may be overestimated. In addition,
they evaluated hippocampal volume and manifold-based learning as predictors. Accuracies in the range
of 56% - 65% were obtained using the respective methods, while combining the methods increased the
accuracy to 68%. Wolz and colleagues also evaluated their methods using the exact same groups as used
in Cuingnet et al. (2011) and obtained superior prediction accuracies. As in Cuingnet et al. (2011),
comparison between methods was limited by the fact that 12% of the subjects failed the cortical
thickness estimation. However, this study is so far the most comprehensive work evaluating structural
methods for prediction of conversion to AD in subjects with MCI. This and the fact that Wolz et al.
obtained very competitive results suggest that their work is state of the art and a good candidate for
current and future methods.
Prediction of AD in subjects with MCI 8
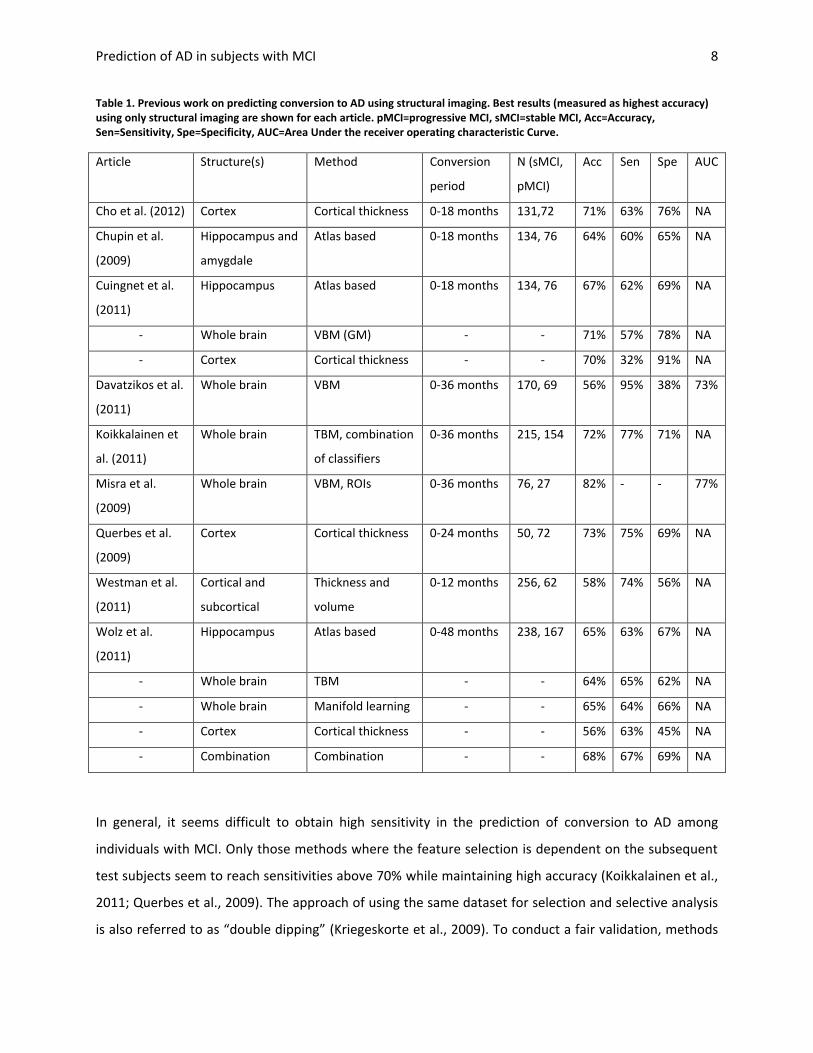
Table 1. Previous work on predicting conversion to AD using structural imaging. Best results (measured as highest accuracy) using only structural imaging are shown for each article. pMCI=progressive MCI, sMCI=stable MCI, Acc=Accuracy, Sen=Sensitivity, Spe=Specificity, AUC=Area Under the receiver operating characteristic Curve.
Article Structure(s) Method Conversion
period
N (sMCI,
pMCI)
Acc Sen Spe AUC
Cho et al. (2012) Cortex Cortical thickness 0-18 months 131,72 71% 63% 76% NA
Chupin et al.
(2009)
Hippocampus and
amygdale
Atlas based 0-18 months 134, 76 64% 60% 65% NA
Cuingnet et al.
(2011)
Hippocampus Atlas based 0-18 months 134, 76 67% 62% 69% NA
- Whole brain VBM (GM) - - 71% 57% 78% NA
- Cortex Cortical thickness - - 70% 32% 91% NA
Davatzikos et al.
(2011)
Whole brain VBM 0-36 months 170, 69 56% 95% 38% 73%
Koikkalainen et
al. (2011)
Whole brain TBM, combination
of classifiers
0-36 months 215, 154 72% 77% 71% NA
Misra et al.
(2009)
Whole brain VBM, ROIs 0-36 months 76, 27 82% - - 77%
Querbes et al.
(2009)
Cortex Cortical thickness 0-24 months 50, 72 73% 75% 69% NA
Westman et al.
(2011)
Cortical and
subcortical
Thickness and
volume
0-12 months 256, 62 58% 74% 56% NA
Wolz et al.
(2011)
Hippocampus Atlas based 0-48 months 238, 167 65% 63% 67% NA
- Whole brain TBM - - 64% 65% 62% NA
- Whole brain Manifold learning - - 65% 64% 66% NA
- Cortex Cortical thickness - - 56% 63% 45% NA
- Combination Combination - - 68% 67% 69% NA
In general, it seems difficult to obtain high sensitivity in the prediction of conversion to AD among
individuals with MCI. Only those methods where the feature selection is dependent on the subsequent
test subjects seem to reach sensitivities above 70% while maintaining high accuracy (Koikkalainen et al.,
2011; Querbes et al., 2009). The approach of using the same dataset for selection and selective analysis
is also referred to as “double dipping” (Kriegeskorte et al., 2009). To conduct a fair validation, methods
Eskildsen et al. 9
that rely on statistical maps should avoid double dipping by excluding from the feature generation the
test subjects used in the subsequent classifier validation. This includes VBM, TBM and cortical thickness
methods, which all operate on the voxel/vertex level and can generate features independent of
anatomical or functional parcellations.
Both Davatzikos et al. (2011) and Westman et al. (2011) obtained high sensitivities without a bias, but at
the cost of very low specificity. Misra et al. (2009) demonstrated superior classification accuracy without
bias, but with very few subjects compared to other methods and no sensitivity was reported. However,
the area under the receiver operating characteristic (ROC) curve (AUC) was 77%, which is relatively high.
AUC might be a better metric for evaluating classifiers when sample sizes differ. Unfortunately, most
studies do not report AUC.
An explanation for the limited predictive power in current methods may be the heterogeneity of the
data. Most studies label MCI patients as progressive or stable according to whether they converted to
AD within the time frame they were followed. This time frame varies from study to study and seems, at
least for studies on ADNI data, to depend on when the analysis was carried out. By including MCI
patients, who convert to AD in a time period ranging from a few months to three years, disease stage
specific patterns maybe missed and lead to reduced sensitivity.
In the present study we are striving to homogenize the data as much as possible by subdividing the
pMCI patients with regard to “time to conversion”. This way we are investigating if the predictive power
can be improved by focusing on disease stage specific atrophy patterns. In addition, to avoid double
dipping, we exclude test subjects from the group used to generate features for the classification. Finally,
we apply a stable and robust image processing pipeline to avoid the high exclusion rates reported in
previous studies on cortical thickness (Cuingnet et al., 2011; Wolz et al., 2011).
We aim to i) evaluate if prediction accuracies can be improved by subdividing MCI subjects, ii)
investigate the effect double dipping have on accuracy, and iii) test the robustness of our image
processing pipeline for cortical surface extraction.
Prediction of AD in subjects with MCI 10
2. Methods
2.1. Subjects and acquisition
All data used in the preparation of this article were obtained from the ADNI database
(www.loni.ucla.edu/ADNI). The ADNI was launched in 2003 by the National Institute on Aging, the
National Institute of Biomedical Imaging and Bioengineering, the Food and Drug Administration, private
pharmaceutical companies and non-profit organizations, as a $60 million, 5-year public-private
partnership. The primary goal of ADNI has been to test whether serial MRI, positron emission
tomography, other biological markers, and clinical and neuropsychological assessment can be combined
to measure the progression of MCI and early AD. Determination of sensitive and specific markers of very
early AD progression is intended to aid researchers and clinicians to develop new treatments and
monitor their effectiveness, as well as lessen the time and cost of clinical trials.
The ADNI database contains 1.5T and 3.0T T1w MRI scans for AD, MCI, and cognitively normal controls
(CN) at several time points. The aim was to follow and collect scans from MCI patients at baseline, 6
months, 12 months, 18 months, 24 months, 36 months and 48 months. The number of participating
subjects was reduced over the course of the study due to drop outs. At each time point a clinical
diagnosis was made to identify MCI subjects who converted to probable AD according to the NINCDS-
ADRDA Alzheimer's Criteria (McKhann et al., 1984).
As reviewed previously, several studies have used the ADNI data to predict which MCI patients would
convert to probable AD using a single MRI scan (Cho et al., 2012; Chupin et al., 2009; Cuingnet et al.,
2011; Davatzikos et al., 2011; Koikkalainen et al., 2011; Misra et al., 2009; Querbes et al., 2009;
Westman et al., 2011; Wolz et al., 2011). All of these studies have used baseline data for the analysis,
which rendered the group of pMCI heterogeneous with respect to “time to conversion”, since the pMCI
patients would convert anytime over the course of 6 months to 4 years follow-up. Such heterogeneity
may conceal the specific neurodegenerative processes that may be attributed to the different sub-
stages of the disease. For example, the pattern of atrophy may be different in patients one year before
diagnosis compared to the pattern two years earlier. In this study, we therefore utilized the full ADNI
database and selected scans at various intervals prior to diagnosis. We selected pMCI scans six months,
12 months, 24 months and 36 months prior to AD diagnosis and grouped these into time-homogeneous
groups of pMCI. To identify characteristic traits for disease progression in the pMCI groups and
determine if these could be used as markers for prediction, we compared with the group of stable MCI
Eskildsen et al. 11
(sMCI) patients who did not have a change of diagnosis over the course of the ADNI study. Our sMCI
group only included those MCI patients who were followed for at least three years. Thus, for the sMCI
group, we selected scans at baseline.
To compare the classification of the MCI substages to the more conventional approach of pooling
converters, we categorized the MCI subjects into converters and stables as done in Wolz et al. (2011),
where converters were defined as those that had converted as of July 2011 and the complementary MCI
subjects constituted the sMCI group. In this case only baseline scans were used in the classification. This
enabled us to evaluate our method in a head to head comparison with the methods published in Wolz et
al. (2011).
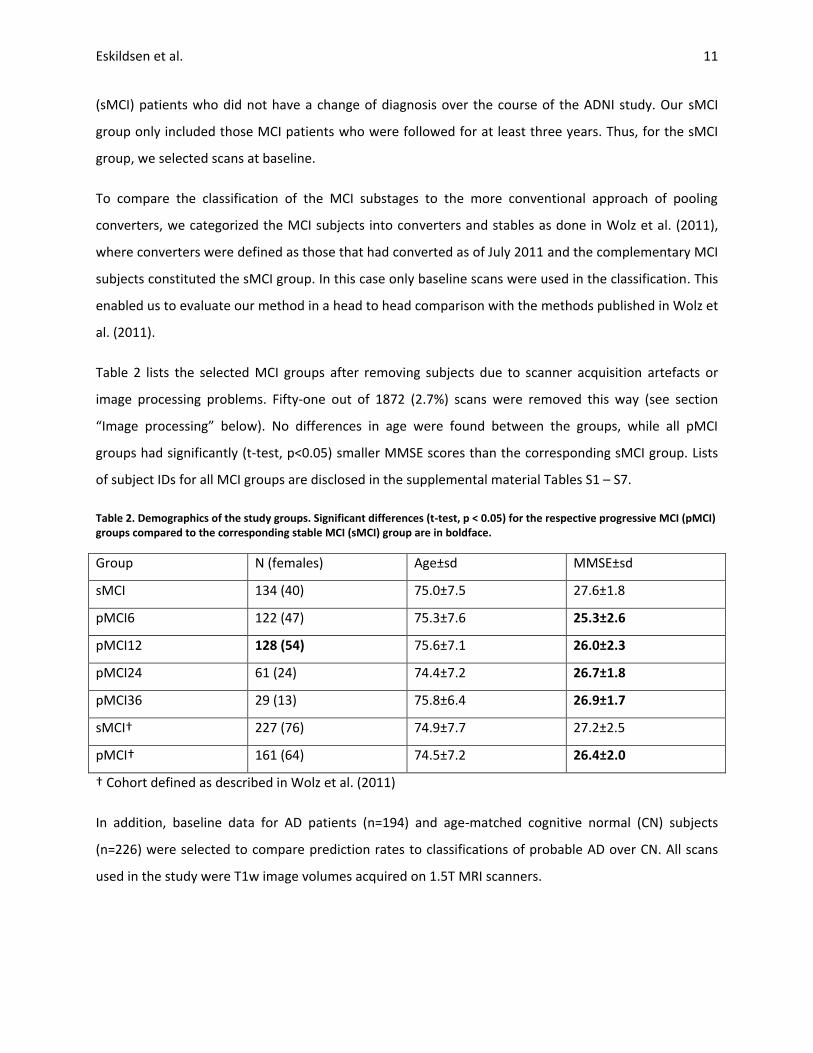
Table 2 lists the selected MCI groups after removing subjects due to scanner acquisition artefacts or
image processing problems. Fifty-one out of 1872 (2.7%) scans were removed this way (see section
“Image processing” below). No differences in age were found between the groups, while all pMCI
groups had significantly (t-test, p<0.05) smaller MMSE scores than the corresponding sMCI group. Lists
of subject IDs for all MCI groups are disclosed in the supplemental material Tables S1 – S7.
Table 2. Demographics of the study groups. Significant differences (t-test, p < 0.05) for the respective progressive MCI (pMCI) groups compared to the corresponding stable MCI (sMCI) group are in boldface.
Group N (females) Age±sd MMSE±sd
sMCI 134 (40) 75.0±7.5 27.6±1.8
pMCI6 122 (47) 75.3±7.6 25.3±2.6
pMCI12 128 (54) 75.6±7.1 26.0±2.3
pMCI24 61 (24) 74.4±7.2 26.7±1.8
pMCI36 29 (13) 75.8±6.4 26.9±1.7
sMCI† 227 (76) 74.9±7.7 27.2±2.5
pMCI† 161 (64) 74.5±7.2 26.4±2.0
† Cohort defined as described in Wolz et al. (2011)
In addition, baseline data for AD patients (n=194) and age-matched cognitive normal (CN) subjects
(n=226) were selected to compare prediction rates to classifications of probable AD over CN. All scans
used in the study were T1w image volumes acquired on 1.5T MRI scanners.
Prediction of AD in subjects with MCI 12
2.2. Image processing
Images were denoised (Coupe et al., 2008) using an estimated standard deviation of noise (Coupe et al.,
2010), bias field corrected (Sled et al., 1998), registered to MNI space (Collins et al., 1994) and skull
stripped (Eskildsen et al., 2011a). Cortical thickness was calculated using FACE (fast accurate cortex
extraction) (Eskildsen and Ostergaard, 2006) and mapped to the cortical surface of a population-specific
average non-linear anatomical template (Fonov et al., 2011). Cortical segmentations were manually
checked for errors by an expert and subjects were excluded if errors were found in one of the image
processing steps mentioned above. The quality control removed only 2.7% of the scans processed,
resulting in the group sizes listed in Table 2. In general, the scans were excluded due to image artefacts
(n=5), insufficient stereotaxic registration (n=7) and insufficient skull stripping (n=39).
2.3. Feature generation
In the experiments below, we use a leave-one-out (LOO) validation strategy where for each comparison
(e.g., pMCI12 vs sMCI), all the subjects (the ensemble of all pMCI12 and sMCI) except one are used to
select features and generate a classification model and the one subject left out is then used for testing.
This procedure is repeated for every subject in the two groups compared, thus validating the method
with every subject. Since the test subject is not used in the selection of features, nor in building the
classifier, we avoid any bias or “double dipping” in our efforts of predicting converters. It is important to
note that we obtain a unique set of features and classifier for each LOO test, for a total of 876 feature
sets for the MCI stages classification and 388 for the pMCI – sMCI classification with the groups defined
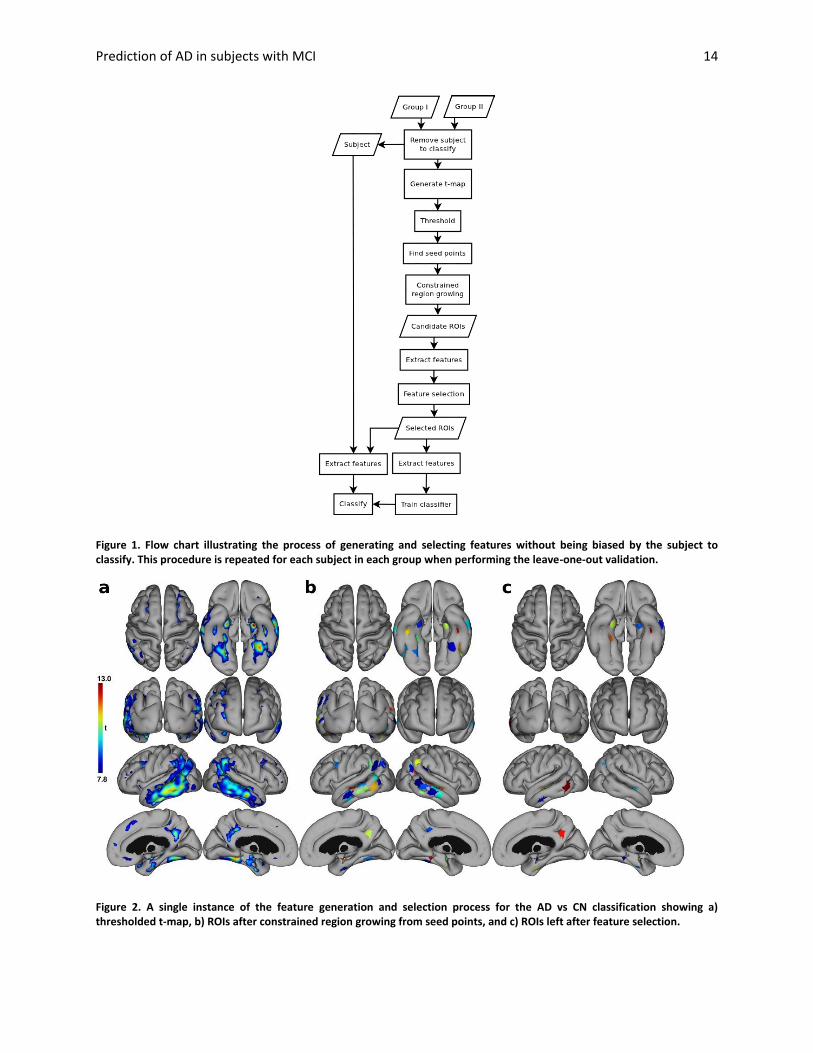
as in Wolz et al. (2011). See Fig. 1 for an overview of the feature generation, selection and subject
classification.
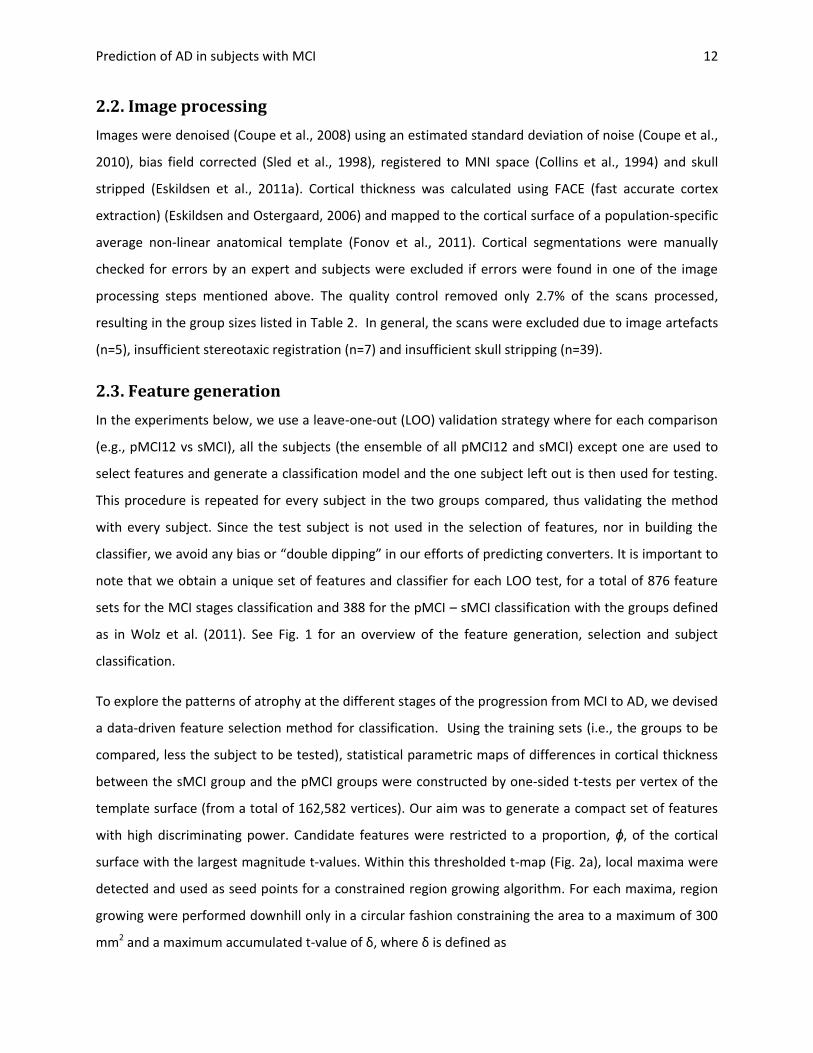
To explore the patterns of atrophy at the different stages of the progression from MCI to AD, we devised
a data-driven feature selection method for classification. Using the training sets (i.e., the groups to be
compared, less the subject to be tested), statistical parametric maps of differences in cortical thickness
between the sMCI group and the pMCI groups were constructed by one-sided t-tests per vertex of the
template surface (from a total of 162,582 vertices). Our aim was to generate a compact set of features
with high discriminating power. Candidate features were restricted to a proportion, ϕ, of the cortical
surface with the largest magnitude t-values. Within this thresholded t-map (Fig. 2a), local maxima were
detected and used as seed points for a constrained region growing algorithm. For each maxima, region
growing were performed downhill only in a circular fashion constraining the area to a maximum of 300
mm2 and a maximum accumulated t-value of δ, where δ is defined as
Eskildsen et al. 13
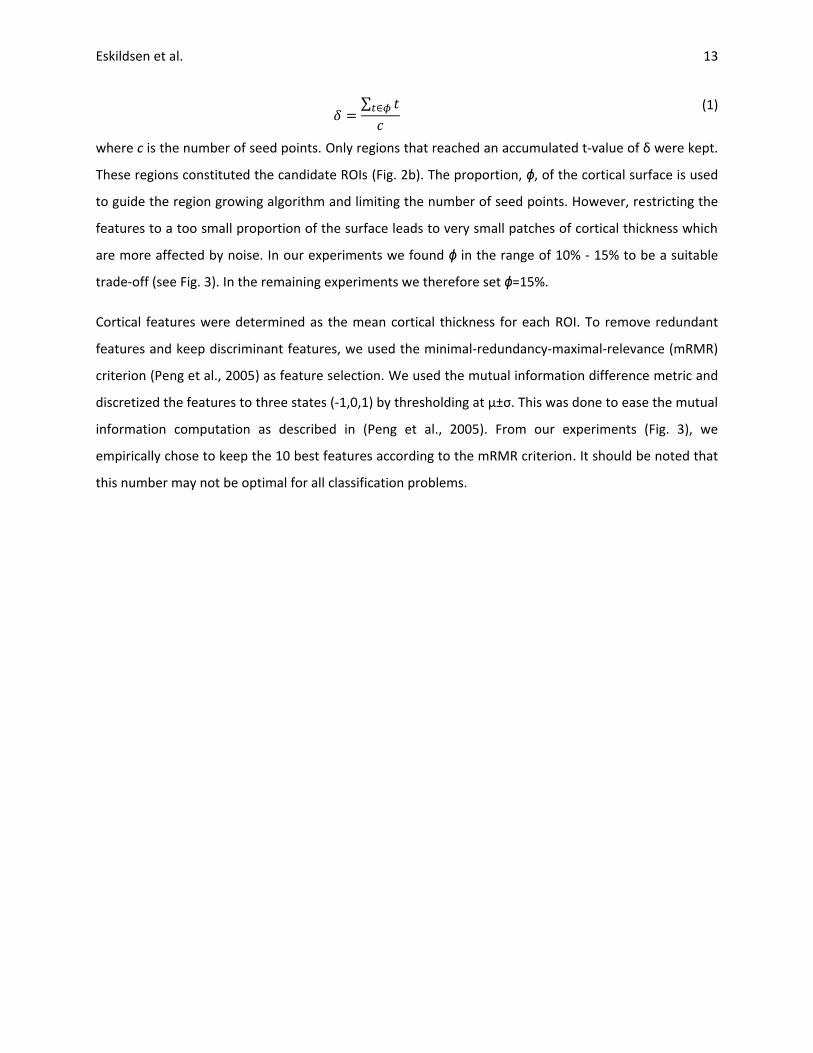
∑
(1)
where c is the number of seed points. Only regions that reached an accumulated t-value of δ were kept.
These regions constituted the candidate ROIs (Fig. 2b). The proportion, ϕ, of the cortical surface is used
to guide the region growing algorithm and limiting the number of seed points. However, restricting the
features to a too small proportion of the surface leads to very small patches of cortical thickness which
are more affected by noise. In our experiments we found ϕ in the range of 10% - 15% to be a suitable
trade-off (see Fig. 3). In the remaining experiments we therefore set ϕ=15%.
Cortical features were determined as the mean cortical thickness for each ROI. To remove redundant
features and keep discriminant features, we used the minimal-redundancy-maximal-relevance (mRMR)
criterion (Peng et al., 2005) as feature selection. We used the mutual information difference metric and
discretized the features to three states (-1,0,1) by thresholding at μ±σ. This was done to ease the mutual
information computation as described in (Peng et al., 2005). From our experiments (Fig. 3), we
empirically chose to keep the 10 best features according to the mRMR criterion. It should be noted that
this number may not be optimal for all classification problems.
Prediction of AD in subjects with MCI 14
Figure 1. Flow chart illustrating the process of generating and selecting features without being biased by the subject to classify. This procedure is repeated for each subject in each group when performing the leave-one-out validation.
Figure 2. A single instance of the feature generation and selection process for the AD vs CN classification showing a) thresholded t-map, b) ROIs after constrained region growing from seed points, and c) ROIs left after feature selection.
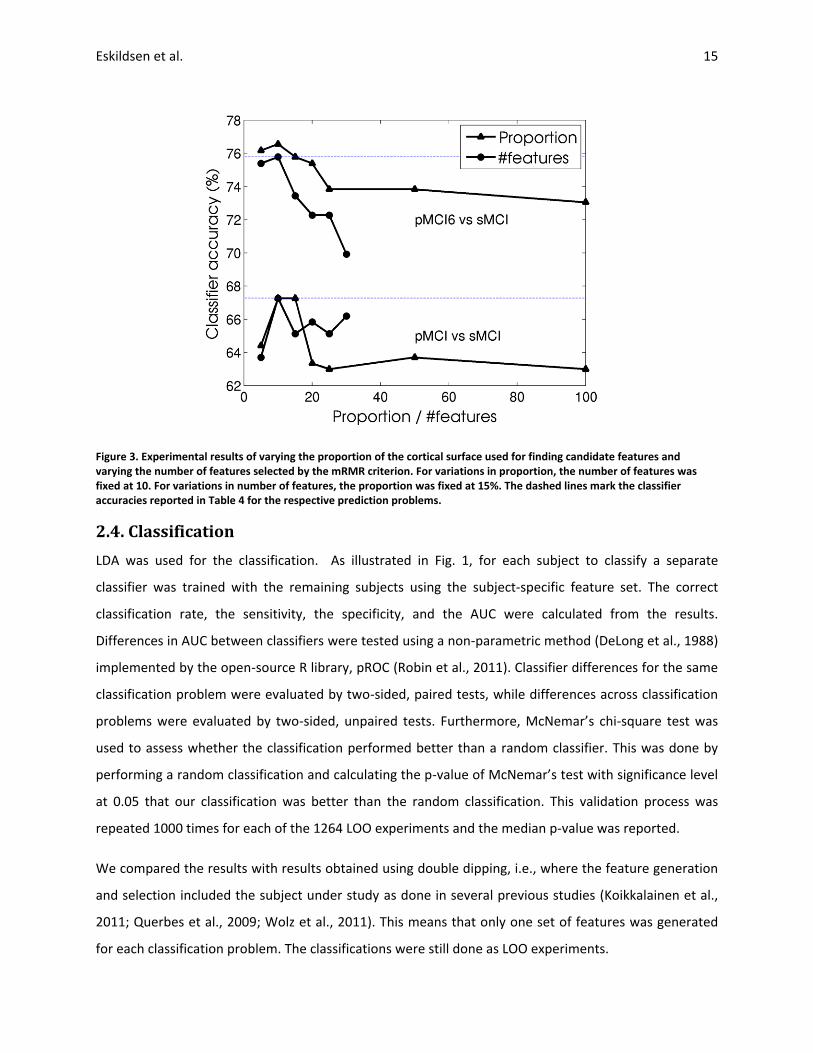
Eskildsen et al. 15
Figure 3. Experimental results of varying the proportion of the cortical surface used for finding candidate features and varying the number of features selected by the mRMR criterion. For variations in proportion, the number of features was fixed at 10. For variations in number of features, the proportion was fixed at 15%. The dashed lines mark the classifier accuracies reported in Table 4 for the respective prediction problems.
2.4. Classification
LDA was used for the classification. As illustrated in Fig. 1, for each subject to classify a separate
classifier was trained with the remaining subjects using the subject-specific feature set. The correct
classification rate, the sensitivity, the specificity, and the AUC were calculated from the results.
Differences in AUC between classifiers were tested using a non-parametric method (DeLong et al., 1988)
implemented by the open-source R library, pROC (Robin et al., 2011). Classifier differences for the same
classification problem were evaluated by two-sided, paired tests, while differences across classification
problems were evaluated by two-sided, unpaired tests. Furthermore, McNemar’s chi-square test was
used to assess whether the classification performed better than a random classifier. This was done by
performing a random classification and calculating the p-value of McNemar’s test with significance level
at 0.05 that our classification was better than the random classification. This validation process was
repeated 1000 times for each of the 1264 LOO experiments and the median p-value was reported.
We compared the results with results obtained using double dipping, i.e., where the feature generation
and selection included the subject under study as done in several previous studies (Koikkalainen et al.,
2011; Querbes et al., 2009; Wolz et al., 2011). This means that only one set of features was generated
for each classification problem. The classifications were still done as LOO experiments.
Prediction of AD in subjects with MCI 16
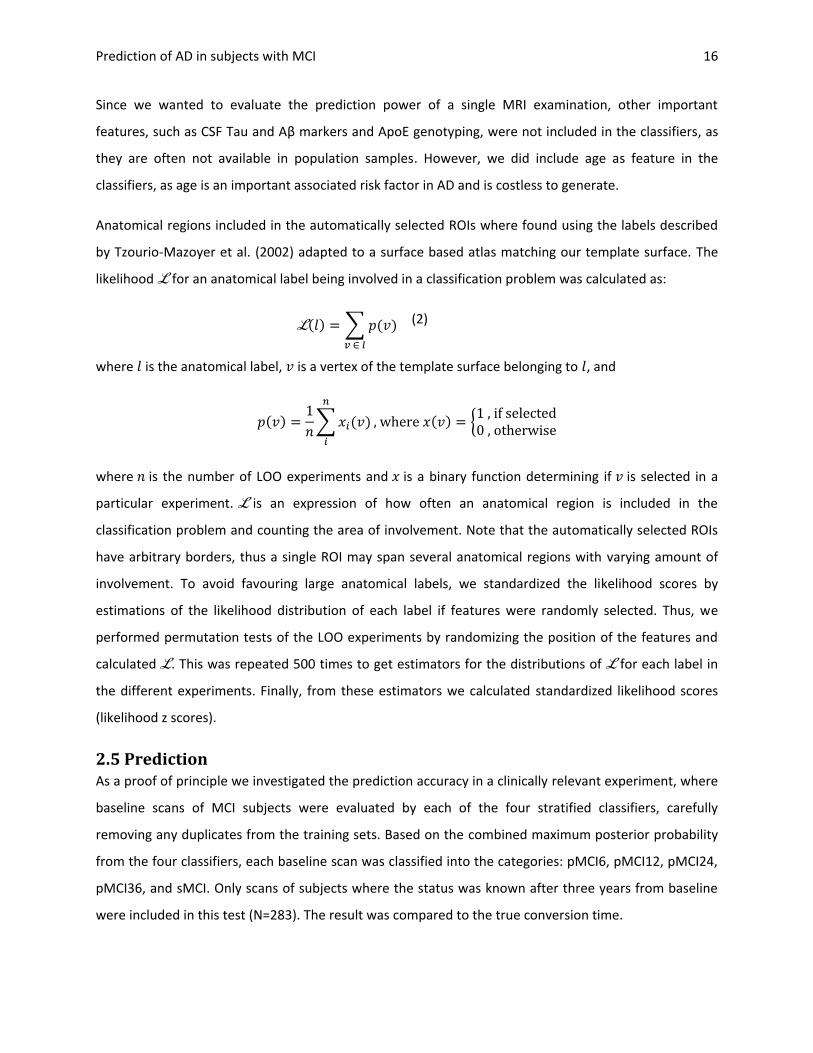
Since we wanted to evaluate the prediction power of a single MRI examination, other important
features, such as CSF Tau and Aβ markers and ApoE genotyping, were not included in the classifiers, as
they are often not available in population samples. However, we did include age as feature in the
classifiers, as age is an important associated risk factor in AD and is costless to generate.
Anatomical regions included in the automatically selected ROIs where found using the labels described
by Tzourio-Mazoyer et al. (2002) adapted to a surface based atlas matching our template surface. The
likelihood for an anatomical label being involved in a classification problem was calculated as:
( ) ∑ ( )
(2)
where is the anatomical label, is a vertex of the template surface belonging to , and
( )
∑ ( )
( ) {
where is the number of LOO experiments and is a binary function determining if is selected in a
particular experiment. is an expression of how often an anatomical region is included in the
classification problem and counting the area of involvement. Note that the automatically selected ROIs
have arbitrary borders, thus a single ROI may span several anatomical regions with varying amount of
involvement. To avoid favouring large anatomical labels, we standardized the likelihood scores by
estimations of the likelihood distribution of each label if features were randomly selected. Thus, we
performed permutation tests of the LOO experiments by randomizing the position of the features and
calculated . This was repeated 500 times to get estimators for the distributions of for each label in
the different experiments. Finally, from these estimators we calculated standardized likelihood scores
(likelihood z scores).
2.5 Prediction As a proof of principle we investigated the prediction accuracy in a clinically relevant experiment, where
baseline scans of MCI subjects were evaluated by each of the four stratified classifiers, carefully
removing any duplicates from the training sets. Based on the combined maximum posterior probability
from the four classifiers, each baseline scan was classified into the categories: pMCI6, pMCI12, pMCI24,
pMCI36, and sMCI. Only scans of subjects where the status was known after three years from baseline
were included in this test (N=283). The result was compared to the true conversion time.
Eskildsen et al. 17
3. Results
Table 3 lists the regions of cortical thickness chosen most often by the feature selection for each
classifier sorted by likelihood z score. These regions are also shown in the supplemental material, Figs.
S1 - S6. Medial temporal lobe structures were chosen in all classification problems. However, the
hippocampus, which is considered to be affected in the incipient stages of AD (Braak and Braak, 1991),
was not chosen in the pMCI36 classification problem.
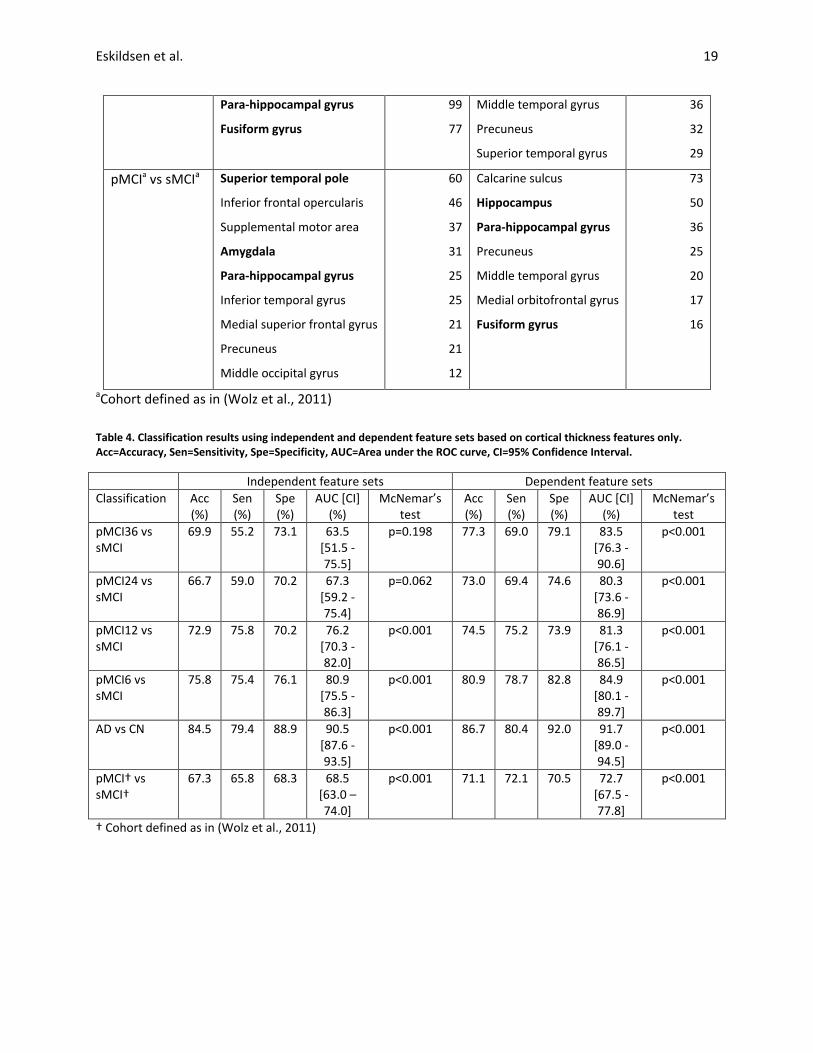
Classification performances for the six classification problems using both independent and dependent
(i.e., “double dipping”) feature sets are shown in Table 4. Using the dependent feature sets, we obtain
higher accuracies and AUCs in all classification problems. The ROC curves for the classifications are
shown in Fig. 4. The figure shows how the double dipping approach has a huge bias on the performance
of the classifier, which can be seen by the larger distance from the curves to the diagonal marking the
random guess. Furthermore, the order of “time to conversion” is clearly more consistent with the
independent features; pMCI36 prediction is worst, pMCI24 second worst, and so on.
Table 5 lists classification results after including age in the LDA. Not all accuracies are improved by
adding age information. However, all AUCs are improved except for the conventional classification of
pMCI vs. sMCI, which is slightly reduced after adding age information. None of the pMCI classifiers are
significantly (p>0.06) improved by adding age information. P-values for testing the true differences in
AUC across classification problems are given in Table 6. The AD vs. CN classifier is significantly (p<0.001)
better than the other classifiers as expected. The short-term prediction classifiers (<12 months) are
significantly better than the conventional baseline grouping of pMCI and sMCI, while the differences in
AUC between the long-term prediction classifiers (>12 months) and the conventional grouping did not
reach significance.
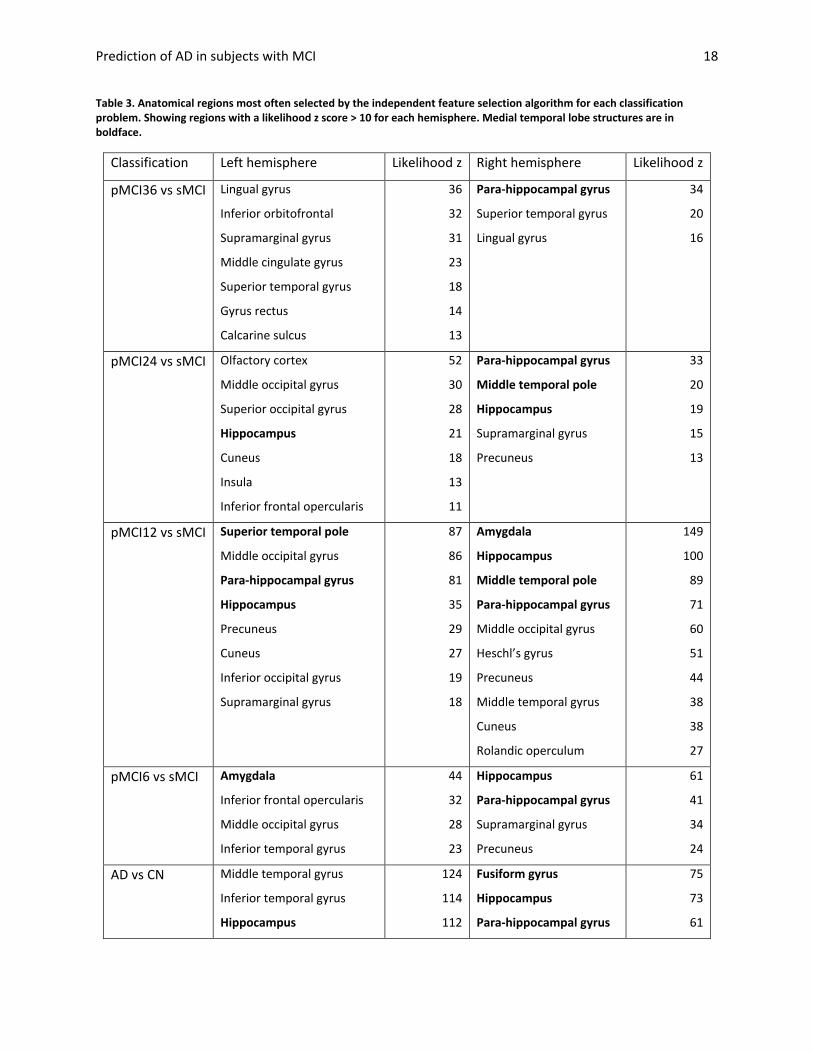
Prediction of AD in subjects with MCI 18
Table 3. Anatomical regions most often selected by the independent feature selection algorithm for each classification problem. Showing regions with a likelihood z score > 10 for each hemisphere. Medial temporal lobe structures are in boldface.
Classification Left hemisphere Likelihood z Right hemisphere Likelihood z
pMCI36 vs sMCI Lingual gyrus
Inferior orbitofrontal
Supramarginal gyrus
Middle cingulate gyrus
Superior temporal gyrus
Gyrus rectus
Calcarine sulcus
36
32
31
23
18
14
13
Para-hippocampal gyrus
Superior temporal gyrus
Lingual gyrus
34
20
16
pMCI24 vs sMCI Olfactory cortex
Middle occipital gyrus
Superior occipital gyrus
Hippocampus
Cuneus
Insula
Inferior frontal opercularis
52
30
28
21
18
13
11
Para-hippocampal gyrus
Middle temporal pole
Hippocampus
Supramarginal gyrus
Precuneus
33
20
19
15
13
pMCI12 vs sMCI Superior temporal pole
Middle occipital gyrus
Para-hippocampal gyrus
Hippocampus
Precuneus
Cuneus
Inferior occipital gyrus
Supramarginal gyrus
87
86
81
35
29
27
19
18
Amygdala
Hippocampus
Middle temporal pole
Para-hippocampal gyrus
Middle occipital gyrus
Heschl’s gyrus
Precuneus
Middle temporal gyrus
Cuneus
Rolandic operculum
149
100
89
71
60
51
44
38
38
27
pMCI6 vs sMCI Amygdala
Inferior frontal opercularis
Middle occipital gyrus
Inferior temporal gyrus
44
32
28
23
Hippocampus
Para-hippocampal gyrus
Supramarginal gyrus
Precuneus
61
41
34
24
AD vs CN Middle temporal gyrus
Inferior temporal gyrus
Hippocampus
124
114
112
Fusiform gyrus
Hippocampus
Para-hippocampal gyrus
75
73
61
Eskildsen et al. 19
Para-hippocampal gyrus
Fusiform gyrus
99
77
Middle temporal gyrus
Precuneus
Superior temporal gyrus
36
32
29
pMCIa vs sMCIa Superior temporal pole
Inferior frontal opercularis
Supplemental motor area
Amygdala
Para-hippocampal gyrus
Inferior temporal gyrus
Medial superior frontal gyrus
Precuneus
Middle occipital gyrus
60
46
37
31
25
25
21
21
12
Calcarine sulcus
Hippocampus
Para-hippocampal gyrus
Precuneus
Middle temporal gyrus
Medial orbitofrontal gyrus
Fusiform gyrus
73
50
36
25
20
17
16
aCohort defined as in (Wolz et al., 2011)
Table 4. Classification results using independent and dependent feature sets based on cortical thickness features only. Acc=Accuracy, Sen=Sensitivity, Spe=Specificity, AUC=Area under the ROC curve, CI=95% Confidence Interval.
Independent feature sets Dependent feature sets
Classification Acc (%)
Sen (%)
Spe (%)
AUC [CI] (%)
McNemar’s test
Acc (%)
Sen (%)
Spe (%)
AUC [CI] (%)
McNemar’s test
pMCI36 vs sMCI
69.9 55.2 73.1 63.5 [51.5 - 75.5]
p=0.198 77.3 69.0 79.1 83.5 [76.3 - 90.6]
p<0.001
pMCI24 vs sMCI
66.7 59.0 70.2 67.3 [59.2 - 75.4]
p=0.062 73.0 69.4 74.6 80.3 [73.6 - 86.9]
p<0.001
pMCI12 vs sMCI
72.9 75.8 70.2 76.2 [70.3 - 82.0]
p<0.001 74.5 75.2 73.9 81.3 [76.1 - 86.5]
p<0.001
pMCI6 vs sMCI
75.8 75.4 76.1 80.9 [75.5 - 86.3]
p<0.001 80.9 78.7 82.8 84.9 [80.1 - 89.7]
p<0.001
AD vs CN 84.5 79.4 88.9 90.5 [87.6 - 93.5]
p<0.001 86.7 80.4 92.0 91.7 [89.0 - 94.5]
p<0.001
pMCI† vs sMCI†
67.3 65.8 68.3 68.5 [63.0 – 74.0]
p<0.001 71.1 72.1 70.5 72.7 [67.5 - 77.8]
p<0.001
† Cohort defined as in (Wolz et al., 2011)
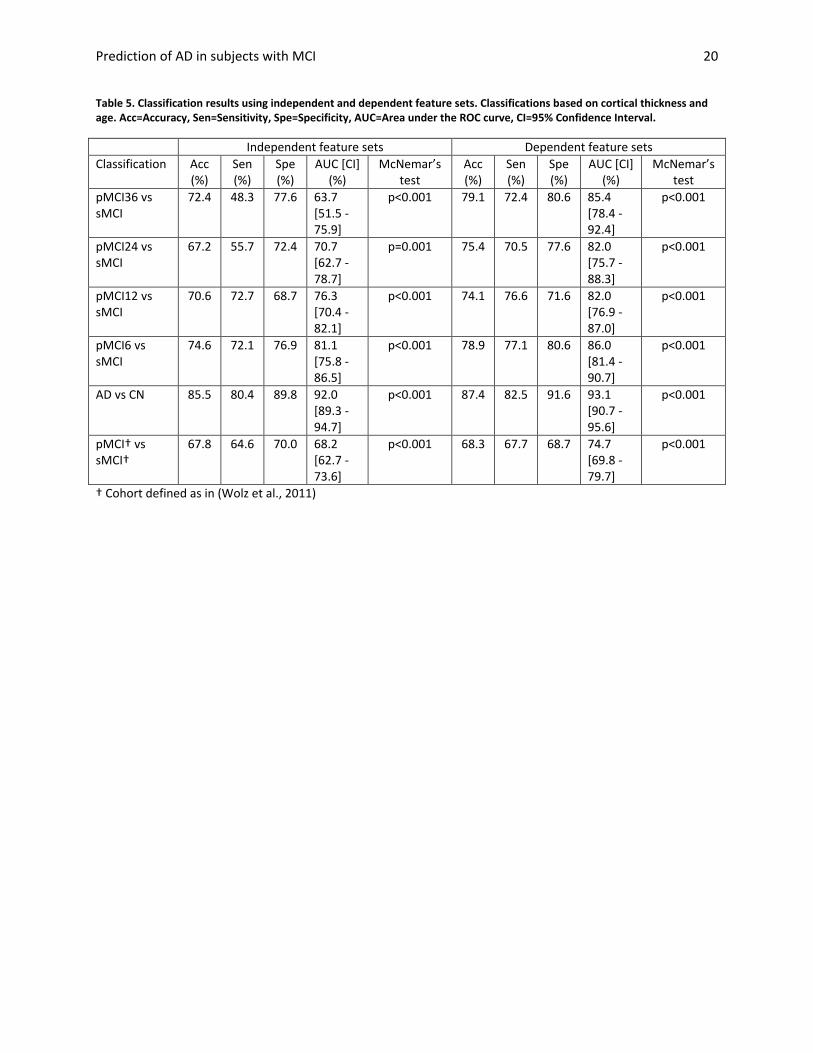
Prediction of AD in subjects with MCI 20
Table 5. Classification results using independent and dependent feature sets. Classifications based on cortical thickness and age. Acc=Accuracy, Sen=Sensitivity, Spe=Specificity, AUC=Area under the ROC curve, CI=95% Confidence Interval.
Independent feature sets Dependent feature sets
Classification Acc (%)
Sen (%)
Spe (%)
AUC [CI] (%)
McNemar’s test
Acc (%)
Sen (%)
Spe (%)
AUC [CI] (%)
McNemar’s test
pMCI36 vs sMCI
72.4 48.3 77.6 63.7 [51.5 - 75.9]
p<0.001 79.1 72.4 80.6 85.4 [78.4 - 92.4]
p<0.001
pMCI24 vs sMCI
67.2 55.7 72.4 70.7 [62.7 - 78.7]
p=0.001 75.4 70.5 77.6 82.0 [75.7 - 88.3]
p<0.001
pMCI12 vs sMCI
70.6 72.7 68.7 76.3 [70.4 - 82.1]
p<0.001 74.1 76.6 71.6 82.0 [76.9 - 87.0]
p<0.001
pMCI6 vs sMCI
74.6 72.1 76.9 81.1 [75.8 - 86.5]
p<0.001 78.9 77.1 80.6 86.0 [81.4 - 90.7]
p<0.001
AD vs CN 85.5 80.4 89.8 92.0 [89.3 - 94.7]
p<0.001 87.4 82.5 91.6 93.1 [90.7 - 95.6]
p<0.001
pMCI† vs sMCI†
67.8 64.6 70.0 68.2 [62.7 - 73.6]
p<0.001 68.3 67.7 68.7 74.7 [69.8 - 79.7]
p<0.001
† Cohort defined as in (Wolz et al., 2011)
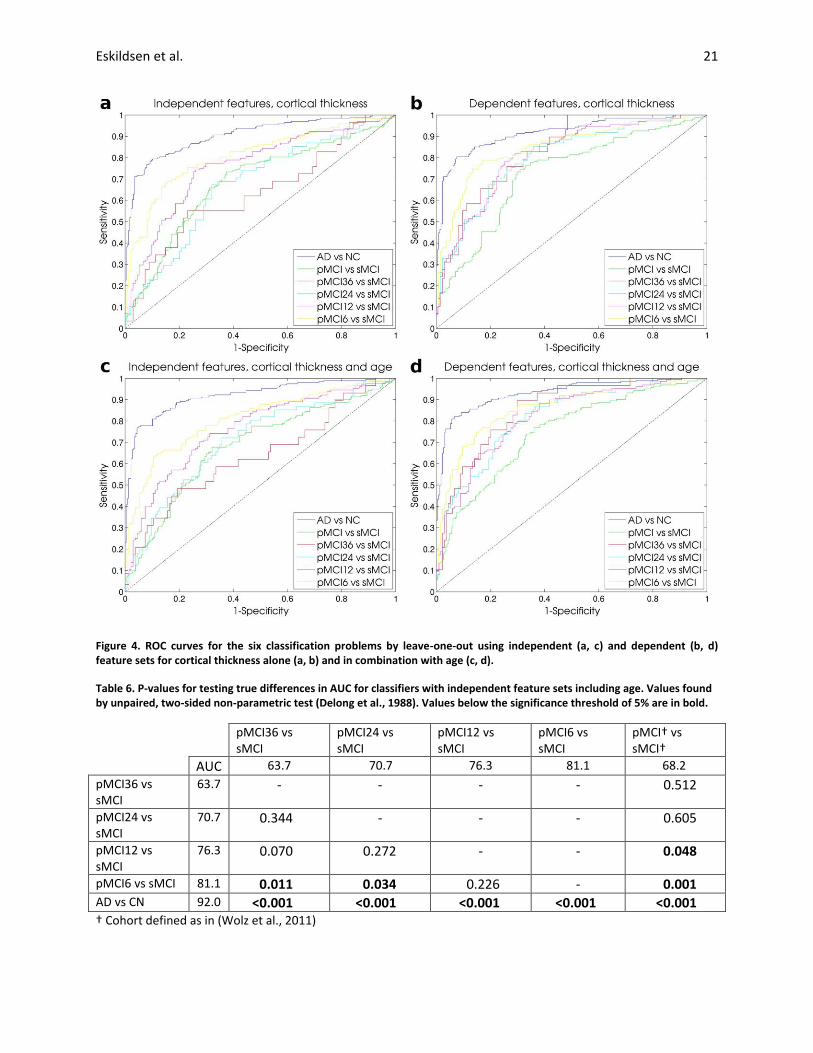
Eskildsen et al. 21
Figure 4. ROC curves for the six classification problems by leave-one-out using independent (a, c) and dependent (b, d) feature sets for cortical thickness alone (a, b) and in combination with age (c, d).
Table 6. P-values for testing true differences in AUC for classifiers with independent feature sets including age. Values found by unpaired, two-sided non-parametric test (Delong et al., 1988). Values below the significance threshold of 5% are in bold.
pMCI36 vs sMCI
pMCI24 vs sMCI
pMCI12 vs sMCI
pMCI6 vs sMCI
pMCI† vs sMCI†
AUC 63.7 70.7 76.3 81.1 68.2
pMCI36 vs sMCI
63.7 - - - - 0.512
pMCI24 vs sMCI
70.7 0.344 - - - 0.605
pMCI12 vs sMCI
76.3 0.070 0.272 - - 0.048
pMCI6 vs sMCI 81.1 0.011 0.034 0.226 - 0.001 AD vs CN 92.0 <0.001 <0.001 <0.001 <0.001 <0.001 † Cohort defined as in (Wolz et al., 2011)
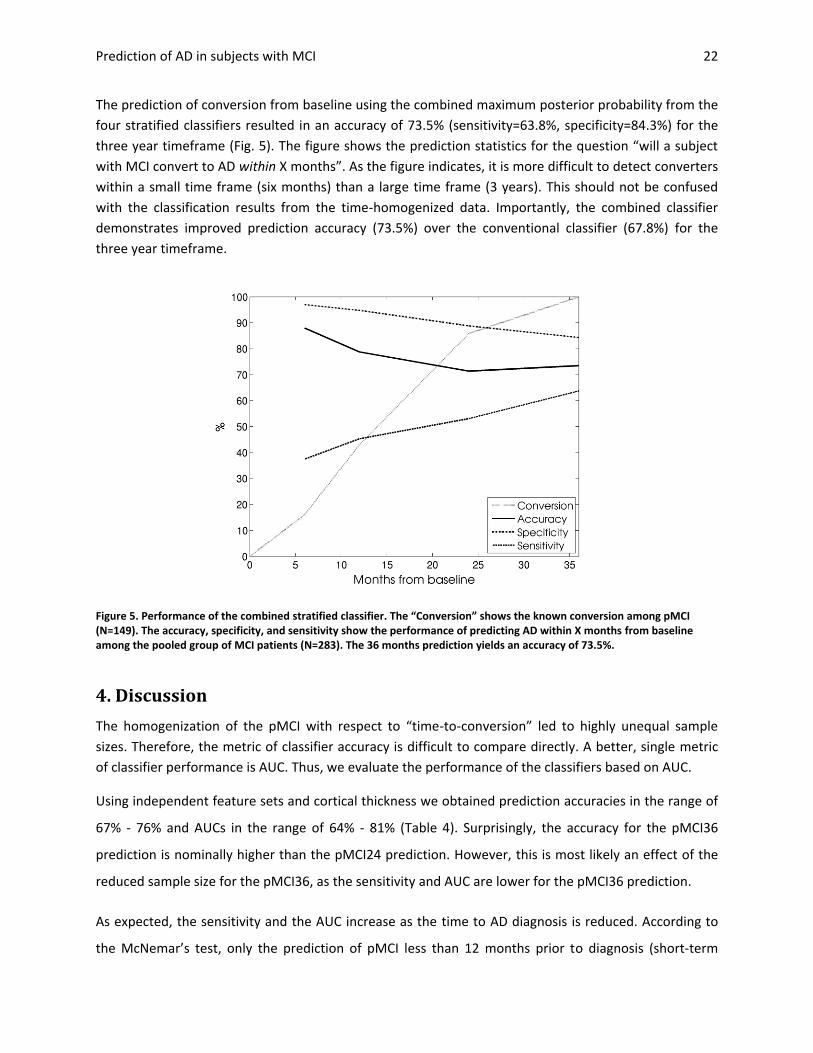
Prediction of AD in subjects with MCI 22
The prediction of conversion from baseline using the combined maximum posterior probability from the
four stratified classifiers resulted in an accuracy of 73.5% (sensitivity=63.8%, specificity=84.3%) for the
three year timeframe (Fig. 5). The figure shows the prediction statistics for the question “will a subject
with MCI convert to AD within X months”. As the figure indicates, it is more difficult to detect converters
within a small time frame (six months) than a large time frame (3 years). This should not be confused
with the classification results from the time-homogenized data. Importantly, the combined classifier
demonstrates improved prediction accuracy (73.5%) over the conventional classifier (67.8%) for the
three year timeframe.
Figure 5. Performance of the combined stratified classifier. The “Conversion” shows the known conversion among pMCI (N=149). The accuracy, specificity, and sensitivity show the performance of predicting AD within X months from baseline among the pooled group of MCI patients (N=283). The 36 months prediction yields an accuracy of 73.5%.
4. Discussion
The homogenization of the pMCI with respect to “time-to-conversion” led to highly unequal sample
sizes. Therefore, the metric of classifier accuracy is difficult to compare directly. A better, single metric
of classifier performance is AUC. Thus, we evaluate the performance of the classifiers based on AUC.
Using independent feature sets and cortical thickness we obtained prediction accuracies in the range of
67% - 76% and AUCs in the range of 64% - 81% (Table 4). Surprisingly, the accuracy for the pMCI36
prediction is nominally higher than the pMCI24 prediction. However, this is most likely an effect of the
reduced sample size for the pMCI36, as the sensitivity and AUC are lower for the pMCI36 prediction.
As expected, the sensitivity and the AUC increase as the time to AD diagnosis is reduced. According to
the McNemar’s test, only the prediction of pMCI less than 12 months prior to diagnosis (short-term
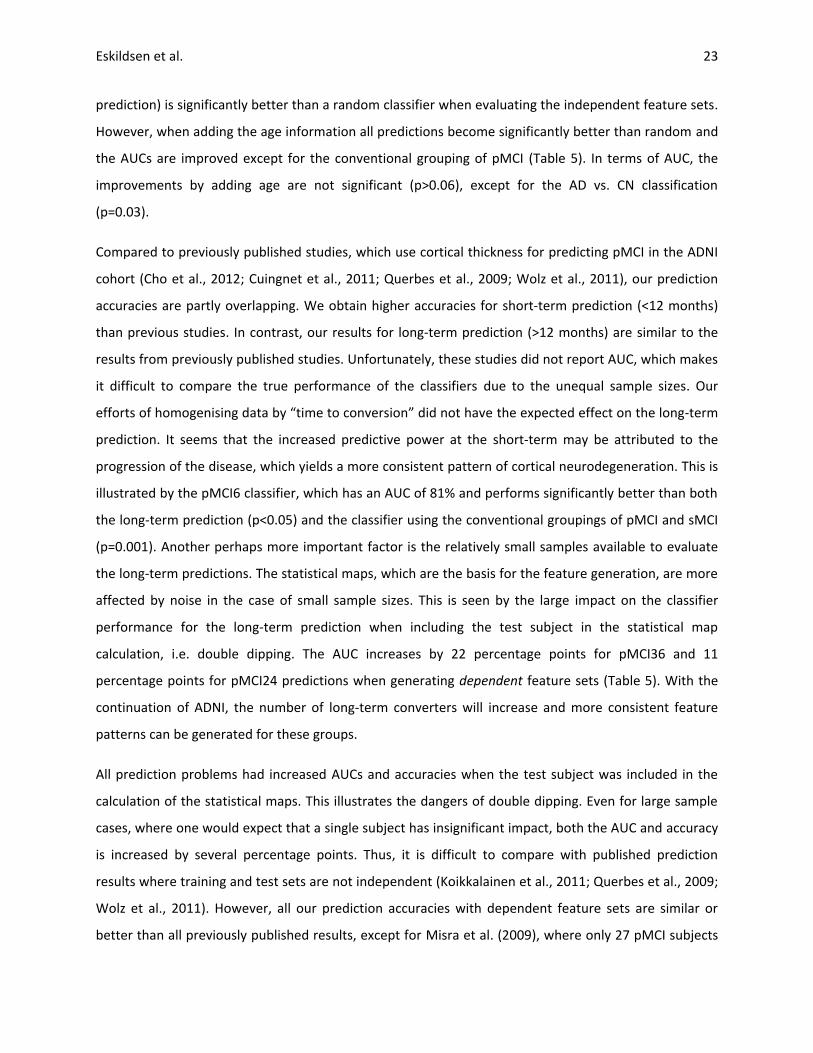
Eskildsen et al. 23
prediction) is significantly better than a random classifier when evaluating the independent feature sets.
However, when adding the age information all predictions become significantly better than random and
the AUCs are improved except for the conventional grouping of pMCI (Table 5). In terms of AUC, the
improvements by adding age are not significant (p>0.06), except for the AD vs. CN classification
(p=0.03).
Compared to previously published studies, which use cortical thickness for predicting pMCI in the ADNI
cohort (Cho et al., 2012; Cuingnet et al., 2011; Querbes et al., 2009; Wolz et al., 2011), our prediction
accuracies are partly overlapping. We obtain higher accuracies for short-term prediction (<12 months)
than previous studies. In contrast, our results for long-term prediction (>12 months) are similar to the
results from previously published studies. Unfortunately, these studies did not report AUC, which makes
it difficult to compare the true performance of the classifiers due to the unequal sample sizes. Our
efforts of homogenising data by “time to conversion” did not have the expected effect on the long-term
prediction. It seems that the increased predictive power at the short-term may be attributed to the
progression of the disease, which yields a more consistent pattern of cortical neurodegeneration. This is
illustrated by the pMCI6 classifier, which has an AUC of 81% and performs significantly better than both
the long-term prediction (p<0.05) and the classifier using the conventional groupings of pMCI and sMCI
(p=0.001). Another perhaps more important factor is the relatively small samples available to evaluate
the long-term predictions. The statistical maps, which are the basis for the feature generation, are more
affected by noise in the case of small sample sizes. This is seen by the large impact on the classifier
performance for the long-term prediction when including the test subject in the statistical map
calculation, i.e. double dipping. The AUC increases by 22 percentage points for pMCI36 and 11
percentage points for pMCI24 predictions when generating dependent feature sets (Table 5). With the
continuation of ADNI, the number of long-term converters will increase and more consistent feature
patterns can be generated for these groups.
All prediction problems had increased AUCs and accuracies when the test subject was included in the
calculation of the statistical maps. This illustrates the dangers of double dipping. Even for large sample
cases, where one would expect that a single subject has insignificant impact, both the AUC and accuracy
is increased by several percentage points. Thus, it is difficult to compare with published prediction
results where training and test sets are not independent (Koikkalainen et al., 2011; Querbes et al., 2009;
Wolz et al., 2011). However, all our prediction accuracies with dependent feature sets are similar or
better than all previously published results, except for Misra et al. (2009), where only 27 pMCI subjects
Prediction of AD in subjects with MCI 24
were tested (Table 1). The AUC reported in Misra et al. (2009) is similar to our 12 months prediction, but
lower than our 6 months prediction. These results highlight the competitive prediction accuracy
obtained by the proposed method.
Compared to the conventional grouping of pMCI and sMCI as published in Wolz et al. (2011), only the
independent pMCI24 prediction performed worse (67.2% vs. 67.8%). This is an indication of the
improved accuracy by homogenizing data. However, due to the unequal sample sizes and the absence of
AUC statistics, the improvements cannot with certainty be attributed to the homogenization. In the
head to head comparison using the exact same groupings, we obtained an accuracy of 68% using
independent feature sets. This is the same accuracy as the combined multivariate prediction based on
manifold learning, hippocampal volume, cortical thickness and TBM (68%), but higher than using cortical
thickness alone (58%) as published by Wolz et al. (2011). It should be noted that the features Wolz and
colleagues used in the cortical thickness and TBM analyses were dependent, i.e. double dipping
occurred. When we applied our dependent feature sets, we obtained an accuracy of 71%.
The classifier performance obtained for the pMCI sub-groups demonstrates a theoretical improvement
by the time-homogenization. In practice, predictions must be made on subjects with variable time to
conversion. Our attempt at using the stratified classifiers in a clinically relevant way demonstrated that
we could predict conversion from baseline within three years with an accuracy of 74%. While the
specificity of this prediction was high (84%), the sensitivity was relatively low (64%). This may be due to
the comparison of posterior probability across classifiers. Considering the uncertainties of the classifiers
and the fact that the outcome “sMCI” is possible in all four classifiers, this way of combining the
stratified classifiers may be conservative with respect to predicting pMCI. Other ways of combining the
classifiers may provide more balanced sensitivity and specificity.
With these new methods, superior prediction accuracies can be obtained. The specificity was higher
than the sensitivity for the long-term prediction. From an economic perspective a high specificity is very
important in clinical trials when recruiting subjects. Reducing the number of false positives in trials may
save time and reduce the associated costs. On the other hand, the sensitivity for the long-term
prediction lags behind. Here, clearly more research needs to be done to improve the technique, and to
be able to benefit from eventual neuroprotective therapies.
Eskildsen et al. 25
Image processing
In this study we used a combination of highly consistent and robust image processing methods to
measure the cortical thickness. Previous studies using cortical thickness have suffered from high
exclusion rates due weak links in the image processing pipeline (Cuingnet et al., 2011; Eskildsen et al.,
2011c; Wolz et al., 2011). In our experience, the main factor for excluding scans due to processing is the
skull stripping step. By using BEaST, a recent robust brain extraction algorithm (Eskildsen et al., 2011a),
we were able to effectively reduce the exclusion rate. In our study we excluded only 2.7% of all scans,
which, to the best of our knowledge, is the lowest exclusion rate of any published cortical thickness
analysis on ADNI data. The low exclusion rate enabled us to construct relatively large samples of pMCI
subjects homogenous with respect to time to conversion. Furthermore, our strategy of denoising the
images before cortical surface extraction has been shown to provide more accurate results than
processing unfiltered images (Eskildsen et al., 2011b).
Regions selected for prediction model
The ROIs most often chosen by the feature selection for prediction indicate which anatomical regions
are involved at different times prior to the progression from MCI to AD. As shown in Table 3, medial
temporal lobe structures are selected in all prediction problems. Hippocampus is included in all
predictions except the pMCI36, while the right parahippocampal gyrus is used in all cases. The para-
hippocampal gyrus has previously been found to be highly discriminative for separating AD patients
from healthy controls using cortical thickness and multivariate analysis, however in the absence of
hippocampal segmentation (Lerch et al., 2008). We speculate that a possible explanation for the specific
timeframe observed here might have to do with the proposed progression of the disease. Histological
studies suggest that the integrity of the entorhinal cortex (part of the parahippocampal gyrus) is among
the first affected, which is then only later followed by an atrophy of the hippocampus (Braak et al.,
1993). The fact that at 36 month prior to diagnosis the hippocampus is not yet a discriminative factor in
the MRI based analysis would thus nicely complement these histological findings. In addition to medial
temporal lobe structures, ROIs were mostly selected from the cingulate gyrus. The cingulate gyrus is well
known to be affected in early AD. What is surprising is the selection of ROIs in the occipital lobe, mostly
the left, for all pMCI predictions, but not for the AD vs. CN classification. This suggests that the occipital
lobes might also be affected early in the disease process, but that it might not be specific at later stages
in the disease process. However, other studies have reported cortical thinning in the occipital lobe in AD
recently as well (Hartikainen et al., 2012), and posterior cortical atrophy in general is associated with a
Prediction of AD in subjects with MCI 26
range of different pathologies, including AD (Crutch et al., 2012). In fact, posterior atrophy may aid
differentiation of AD from frontotemporal lobar degeneration (Lehmann et al., 2012). The lack of
selection of these regions for the AD vs. CN classification problem may be caused by the highly
significant differences of medial temporal regions rendering the more posterior regions superfluous for
the classifier.
Feature generation
The feature generation approach used in our study is similar in spirit to the approach suggested by Fan
et al. (2007), who used a watershed algorithm on the VBM-based statistical parametric map to select
ROIs. Using a watershed algorithm on the statistical maps generated by cortical thickness would yield
less compact ROIs, as the regions with high t-values often are elongated following a sulcus or gyrus
across several anatomical regions. In the proposed method we sought more focal features and therefore
applied the constrained region growing region as described above. We acknowledge that our method
for feature generation is just one among many possibilities using the statistical map. Nevertheless, we
expect the tendency of increased sensitivity by homogenising the data by time to conversion will remain
the same irrespective of the feature generation method applied.
Limitations
One of the main limitations in any AD study involving in vivo data, is the uncertainty of the diagnosis.
That is the reason why the diagnosis will always be “probable AD” until an autopsy can confirm the
diagnosis. An optimistic estimate of the correct diagnosis rate using the accepted AD criteria is
approximately 90% (Ranginwala et al., 2008). Even if AD type dementia is indeed present, the picture is
often distorted by other dementia types, such as vascular dementia. Thus, the patterns of
neurodegeneration, found in studies like the present, will have uncertainties due to the inherent
uncertainty from difficulties in assigning correct diagnoses.
Another problem related to diagnosis, is the term “conversion”. In this study, as in many other studies,
we have accepted the term “conversion” as an individual suffering from mild cognitive impairment who
then fulfils the AD diagnostic criteria at a subsequent clinical visit. The progression from mild symptoms
to a state where the diagnostic criteria are fulfilled is a gradual decline and not an abrupt change. Thus
the actual disease stage at time of diagnosis will be different from individual to individual. Our efforts in
trying to stage the progression by “time to conversion” may be futile due to the fuzziness of the
Eskildsen et al. 27
conversion term. However, it is currently the best we can do to compensate for the noise introduced by
pooling all converters.
Another nuisance variable is the uncertainty of the label “stable MCI”. Even though stable MCIs do not
progress to AD within the follow-up period included in the ADNI study, we do not know if they progress
to another type of dementia, which makes the classification harder as there may be overlapping
patterns of structural changes. In other studies (Westman et al., 2011; Wolz et al., 2011), authors have
simply generated their group of sMCI as the complementary of pMCI even including subjects dropping
out after baseline examinations. Here, we tried to homogenize our stable group by requiring a diagnosis
of MCI for at least three years. However, the uncertainty of influence from other pathologies still exists.
As described in the introduction, many studies have used data from the ADNI cohort to evaluate various
imaging markers and investigate the progression of AD. The question is if results obtained on ADNI data
can be transferred to other populations. First, the female / male ratio in the ADNI cohort is poor with
almost twice as many males as females. Second, the recruitment of MCI patients in ADNI tended to
select "late MCI" subjects. These issues may make it difficult to transfer the results to other cohorts.
Westman et al. (2011) found similar patterns in ADNI and the European study, AddNeuroMed. However,
their prediction accuracy could not be transferred from one cohort to the other. Nevertheless, ADNI
remains to be an excellent initiative enabling the comparison of methods across institutions.
Furthermore, the continuing ADNI study enrols new patients, and the ADNI GO and ADNI 2 projects will
enrol “early MCI” subjects. This will expand the possibilities for investigating the patterns of the
incipient neurodegeneration in AD.
5. Conclusion
Using patterns of characteristic cortical thinning in disease stages of progressive MCI compared to MCI
patients who remained stable for three years demonstrated promising results for the prediction of
patients with prodromal AD progressing to probable AD. By avoiding double dipping we obtained a more
accurate and unbiased estimate of the predictive power of cortical thickness measurements than
published to date. The prediction accuracies obtained by subgrouping progressive MCI patients with
respect to “time to conversion” were better than previously published results on the same cohort. The
improved accuracies are likely caused by this homogenization and improvements in the image
processing pipeline in terms of robustness and accuracy. The results demonstrate a theoretical
Prediction of AD in subjects with MCI 28
improvement and our preliminary experiments show that clinically relevant predictions may be
improved by learning time-homogenized patterns.
The experiments showed that prediction accuracies can be artificially inflated by including the subject
under analysis in the generation of the discriminant features. One should therefore be careful to avoid
double dipping in the estimation of classifications and predictions based on cortical thickness statistical
maps.
The specificity of predicting whether an MCI subject converts to AD within three years from baseline
was relatively high (84%), while the sensitivity was relatively low (64%). To be clinically applicable the
sensitivity for the long-term prediction needs to be improved to be able to benefit from eventual
neuroprotective therapies. The relatively high specificity for the long-term prediction holds promises of
reduced costs associated with recruiting subjects for clinical trials.
Acknowledgements
Data collection and sharing for this project was funded by the Alzheimer's Disease Neuroimaging
Initiative (ADNI) (National Institutes of Health Grant U01 AG024904). ADNI is funded by the National
Institute on Aging, the National Institute of Biomedical Imaging and Bioengineering, and through
generous contributions from the following: Abbott, AstraZeneca AB, Bayer Schering Pharma AG, Bristol-
Myers Squibb, Eisai Global Clinical Development, Elan Corporation, Genentech, GE Healthcare,
GlaxoSmithKline, Innogenetics, Johnson and Johnson, Eli Lilly and Co., Medpace, Inc., Merck and Co.,
Inc., Novartis AG, Pfizer Inc, F. Hoffman-La Roche, Schering-Plough, Synarc, Inc., as well as non-profit
partners the Alzheimer's Association and Alzheimer's Drug Discovery Foundation, with participation
from the U.S. Food and Drug Administration. Private sector contributions to ADNI are facilitated by the
Foundation for the National Institutes of Health (www.fnih.org). The grantee organization is the
Northern California Institute for Research and Education, and the study is coordinated by the
Alzheimer's Disease Cooperative Study at the University of California, San Diego. ADNI data are
disseminated by the Laboratory for Neuro Imaging at the University of California, Los Angeles. This
research was also supported by NIH grants P30AG010129, K01 AG030514, and the Dana Foundation.
The authors wish to thank Dr. Robin Wolz for supplying the list of subjects used in Wolz et al. (2011),
thus enabling a direct comparison between methods.
Eskildsen et al. 29
References Apostolova, L.G., Thompson, P.M., 2008. Mapping progressive brain structural changes in early Alzheimer's disease and mild cognitive impairment. Neuropsychologia 46, 1597-1612. Braak, H., Braak, E., 1991. Neuropathological stageing of Alzheimer-related changes. Acta Neuropathol 82, 239-259. Braak, H., Braak, E., Bohl, J., 1993. Staging of Alzheimer-related cortical destruction. Eur Neurol 33, 403-408. Cho, Y., Seong, J.K., Jeong, Y., Shin, S.Y., 2012. Individual subject classification for Alzheimer's disease based on incremental learning using a spatial frequency representation of cortical thickness data. NeuroImage 59, 2217-2230. Chupin, M., Gerardin, E., Cuingnet, R., Boutet, C., Lemieux, L., Lehericy, S., Benali, H., Garnero, L., Colliot, O., 2009. Fully automatic hippocampus segmentation and classification in Alzheimer's disease and mild cognitive impairment applied on data from ADNI. Hippocampus 19, 579-587. Collins, D.L., Neelin, P., Peters, T.M., Evans, A.C., 1994. Automatic 3D intersubject registration of MR volumetric data in standardized Talairach space. Journal of computer assisted tomography 18, 192-205. Coupe, P., Eskildsen, S.F., Manjon, J.V., Fonov, V.S., Collins, D.L., 2012. Simultaneous segmentation and grading of anatomical structures for patient's classification: application to Alzheimer's disease. NeuroImage 59, 3736-3747. Coupe, P., Manjon, J.V., Gedamu, E., Arnold, D., Robles, M., Collins, D.L., 2010. Robust Rician noise estimation for MR images. Med Image Anal 14, 483-493. Coupe, P., Yger, P., Prima, S., Hellier, P., Kervrann, C., Barillot, C., 2008. An optimized blockwise nonlocal means denoising filter for 3-D magnetic resonance images. IEEE transactions on medical imaging 27, 425-441. Crutch, S.J., Lehmann, M., Schott, J.M., Rabinovici, G.D., Rossor, M.N., Fox, N.C., 2012. Posterior cortical atrophy. Lancet Neurol 11, 170-178. Cuingnet, R., Gerardin, E., Tessieras, J., Auzias, G., Lehericy, S., Habert, M.O., Chupin, M., Benali, H., Colliot, O., 2011. Automatic classification of patients with Alzheimer's disease from structural MRI: a comparison of ten methods using the ADNI database. NeuroImage 56, 766-781. Davatzikos, C., Bhatt, P., Shaw, L.M., Batmanghelich, K.N., Trojanowski, J.Q., 2011. Prediction of MCI to AD conversion, via MRI, CSF biomarkers, and pattern classification. Neurobiology of aging 32, 2322 e2319-2327. DeLong, E.R., DeLong, D.M., Clarke-Pearson, D.L., 1988. Comparing the areas under two or more correlated receiver operating characteristic curves: a nonparametric approach. Biometrics 44, 837-845. Ellis, K.A., Bush, A.I., Darby, D., De Fazio, D., Foster, J., Hudson, P., Lautenschlager, N.T., Lenzo, N., Martins, R.N., Maruff, P., Masters, C., Milner, A., Pike, K., Rowe, C., Savage, G., Szoeke, C., Taddei, K., Villemagne, V., Woodward, M., Ames, D., 2009. The Australian Imaging, Biomarkers and Lifestyle (AIBL) study of aging: methodology and baseline characteristics of 1112 individuals recruited for a longitudinal study of Alzheimer's disease. Int Psychogeriatr 21, 672-687. Eskildsen, S.F., Coupe, P., Fonov, V., Manjon, J.V., Leung, K.K., Guizard, N., Wassef, S.N., Ostergaard, L.R., Collins, D.L., 2011a. BEaST: Brain extraction based on nonlocal segmentation technique. NeuroImage. Eskildsen, S.F., Coupe, P., Fonov, V., Østergaard, L.R., Collins, D.L., 2011b. Effect of non-local means denoising on cortical segmentation accuracy with FACE. 17th Annual Meeting of the Organization on Human Brain Mapping, Quebec City, p. 673. Eskildsen, S.F., Fonov, V., Coupé, P., Østergaard, L.R., Collins, D.L., 2011c. Prediction of Alzheimer’s Disease in Subjects with Mild Cognitive Impairment Using Structural Patterns of Cortical Thinning*. In: Dremstrup, K., Rees, S., Jensen, M.Ø. (Eds.), 15th Nordic-Baltic Conference on Biomedical Engineering and Medical Physics (NBC 2011). Springer Berlin Heidelberg, pp. 156-159.
Prediction of AD in subjects with MCI 30
Eskildsen, S.F., Ostergaard, L.R., 2006. Active surface approach for extraction of the human cerebral cortex from MRI. Medical image computing and computer-assisted intervention : MICCAI ... International Conference on Medical Image Computing and Computer-Assisted Intervention 9, 823-830. Fan, Y., Shen, D., Gur, R.C., Gur, R.E., Davatzikos, C., 2007. COMPARE: classification of morphological patterns using adaptive regional elements. IEEE transactions on medical imaging 26, 93-105. Fonov, V., Evans, A.C., Botteron, K., Almli, C.R., McKinstry, R.C., Collins, D.L., 2011. Unbiased average age-appropriate atlases for pediatric studies. NeuroImage 54, 313-327. Frisoni, G.B., Fox, N.C., Jack, C.R., Jr., Scheltens, P., Thompson, P.M., 2010. The clinical use of structural MRI in Alzheimer disease. Nature reviews. Neurology 6, 67-77. Hartikainen, P., Rasanen, J., Julkunen, V., Niskanen, E., Hallikainen, M., Kivipelto, M., Vanninen, R., Remes, A.M., Soininen, H., 2012. Cortical Thickness in Frontotemporal Dementia, Mild Cognitive Impairment, and Alzheimer's Disease. Journal of Alzheimer's disease : JAD 30, 857-874. Jack, C.R., Jr., Barkhof, F., Bernstein, M.A., Cantillon, M., Cole, P.E., Decarli, C., Dubois, B., Duchesne, S., Fox, N.C., Frisoni, G.B., Hampel, H., Hill, D.L., Johnson, K., Mangin, J.F., Scheltens, P., Schwarz, A.J., Sperling, R., Suhy, J., Thompson, P.M., Weiner, M., Foster, N.L., 2011. Steps to standardization and validation of hippocampal volumetry as a biomarker in clinical trials and diagnostic criterion for Alzheimer's disease. Alzheimer's & dementia : the journal of the Alzheimer's Association 7, 474-485 e474. Koikkalainen, J., Lotjonen, J., Thurfjell, L., Rueckert, D., Waldemar, G., Soininen, H., 2011. Multi-template tensor-based morphometry: application to analysis of Alzheimer's disease. NeuroImage 56, 1134-1144. Kriegeskorte, N., Simmons, W.K., Bellgowan, P.S., Baker, C.I., 2009. Circular analysis in systems neuroscience: the dangers of double dipping. Nat Neurosci 12, 535-540. Lehmann, M., Koedam, E.L., Barnes, J., Bartlett, J.W., Ryan, N.S., Pijnenburg, Y.A., Barkhof, F., Wattjes, M.P., Scheltens, P., Fox, N.C., 2012. Posterior cerebral atrophy in the absence of medial temporal lobe atrophy in pathologically-confirmed Alzheimer's disease. Neurobiology of aging 33, 627 e621-627 e612. Lerch, J.P., Pruessner, J., Zijdenbos, A.P., Collins, D.L., Teipel, S.J., Hampel, H., Evans, A.C., 2008. Automated cortical thickness measurements from MRI can accurately separate Alzheimer's patients from normal elderly controls. Neurobiology of aging 29, 23-30. Lovestone, S., Francis, P., Kloszewska, I., Mecocci, P., Simmons, A., Soininen, H., Spenger, C., Tsolaki, M., Vellas, B., Wahlund, L.O., Ward, M., 2009. AddNeuroMed--the European collaboration for the discovery of novel biomarkers for Alzheimer's disease. Ann N Y Acad Sci 1180, 36-46. Lupien, S.J., Evans, A., Lord, C., Miles, J., Pruessner, M., Pike, B., Pruessner, J.C., 2007. Hippocampal volume is as variable in young as in older adults: implications for the notion of hippocampal atrophy in humans. NeuroImage 34, 479-485. McKhann, G., Drachman, D., Folstein, M., Katzman, R., Price, D., Stadlan, E.M., 1984. Clinical diagnosis of Alzheimer's disease: report of the NINCDS-ADRDA Work Group under the auspices of Department of Health and Human Services Task Force on Alzheimer's Disease. Neurology 34, 939-944. Misra, C., Fan, Y., Davatzikos, C., 2009. Baseline and longitudinal patterns of brain atrophy in MCI patients, and their use in prediction of short-term conversion to AD: results from ADNI. NeuroImage 44, 1415-1422. Mueller, S.G., Weiner, M.W., Thal, L.J., Petersen, R.C., Jack, C., Jagust, W., Trojanowski, J.Q., Toga, A.W., Beckett, L., 2005. The Alzheimer's disease neuroimaging initiative. Neuroimaging clinics of North America 15, 869-877, xi-xii. Narr, K.L., Bilder, R.M., Toga, A.W., Woods, R.P., Rex, D.E., Szeszko, P.R., Robinson, D., Sevy, S., Gunduz-Bruce, H., Wang, Y.P., DeLuca, H., Thompson, P.M., 2005. Mapping cortical thickness and gray matter concentration in first episode schizophrenia. Cerebral cortex 15, 708-719.
Eskildsen et al. 31
Peng, H., Long, F., Ding, C., 2005. Feature selection based on mutual information: criteria of max-dependency, max-relevance, and min-redundancy. IEEE transactions on pattern analysis and machine intelligence 27, 1226-1238. Plant, C., Teipel, S.J., Oswald, A., Bohm, C., Meindl, T., Mourao-Miranda, J., Bokde, A.W., Hampel, H., Ewers, M., 2010. Automated detection of brain atrophy patterns based on MRI for the prediction of Alzheimer's disease. NeuroImage 50, 162-174. Querbes, O., Aubry, F., Pariente, J., Lotterie, J.A., Demonet, J.F., Duret, V., Puel, M., Berry, I., Fort, J.C., Celsis, P., 2009. Early diagnosis of Alzheimer's disease using cortical thickness: impact of cognitive reserve. Brain : a journal of neurology 132, 2036-2047. Ranginwala, N.A., Hynan, L.S., Weiner, M.F., White, C.L., 3rd, 2008. Clinical criteria for the diagnosis of Alzheimer disease: still good after all these years. Am J Geriatr Psychiatry 16, 384-388. Ritchie, K., Lovestone, S., 2002. The dementias. Lancet 360, 1759-1766. Robin, X., Turck, N., Hainard, A., Tiberti, N., Lisacek, F., Sanchez, J.C., Muller, M., 2011. pROC: an open-source package for R and S+ to analyze and compare ROC curves. BMC bioinformatics 12, 77. Shin, Y.W., Yoo, S.Y., Lee, J.K., Ha, T.H., Lee, K.J., Lee, J.M., Kim, I.Y., Kim, S.I., Kwon, J.S., 2007. Cortical thinning in obsessive compulsive disorder. Human brain mapping 28, 1128-1135. Sled, J.G., Zijdenbos, A.P., Evans, A.C., 1998. A nonparametric method for automatic correction of intensity nonuniformity in MRI data. IEEE transactions on medical imaging 17, 87-97. Tzourio-Mazoyer, N., Landeau, B., Papathanassiou, D., Crivello, F., Etard, O., Delcroix, N., Mazoyer, B., Joliot, M., 2002. Automated anatomical labeling of activations in SPM using a macroscopic anatomical parcellation of the MNI MRI single-subject brain. NeuroImage 15, 273-289. Vemuri, P., Whitwell, J.L., Kantarci, K., Josephs, K.A., Parisi, J.E., Shiung, M.S., Knopman, D.S., Boeve, B.F., Petersen, R.C., Dickson, D.W., Jack, C.R., Jr., 2008. Antemortem MRI based STructural Abnormality iNDex (STAND)-scores correlate with postmortem Braak neurofibrillary tangle stage. NeuroImage 42, 559-567. Westman, E., Simmons, A., Muehlboeck, J.S., Mecocci, P., Vellas, B., Tsolaki, M., Kloszewska, I., Soininen, H., Weiner, M.W., Lovestone, S., Spenger, C., Wahlund, L.O., 2011. AddNeuroMed and ADNI: similar patterns of Alzheimer's atrophy and automated MRI classification accuracy in Europe and North America. NeuroImage 58, 818-828. Wolz, R., Julkunen, V., Koikkalainen, J., Niskanen, E., Zhang, D.P., Rueckert, D., Soininen, H., Lotjonen, J., 2011. Multi-method analysis of MRI images in early diagnostics of Alzheimer's disease. PloS one 6, e25446. Yoon, U., Lee, J.M., Im, K., Shin, Y.W., Cho, B.H., Kim, I.Y., Kwon, J.S., Kim, S.I., 2007. Pattern classification using principal components of cortical thickness and its discriminative pattern in schizophrenia. NeuroImage 34, 1405-1415. Yuan, Y., Gu, Z.X., Wei, W.S., 2009. Fluorodeoxyglucose-positron-emission tomography, single-photon emission tomography, and structural MR imaging for prediction of rapid conversion to Alzheimer disease in patients with mild cognitive impairment: a meta-analysis. AJNR Am J Neuroradiol 30, 404-410.