Embed Size (px)
Citation preview
and William B. KannelPeter W. F. Wilson, Ralph B. D'Agostino, Daniel Levy, Albert M. Belanger, Halit Silbershatz
Prediction of Coronary Heart Disease Using Risk Factor Categories
Print ISSN: 0009-7322. Online ISSN: 1524-4539 Copyright © 1998 American Heart Association, Inc. All rights reserved.
is published by the American Heart Association, 7272 Greenville Avenue, Dallas, TX 75231Circulation doi: 10.1161/01.CIR.97.18.1837
1998;97:1837-1847Circulation.
http://circ.ahajournals.org/content/97/18/1837World Wide Web at:
The online version of this article, along with updated information and services, is located on the
http://circ.ahajournals.org//subscriptions/
is online at: Circulation Information about subscribing to Subscriptions:
http://www.lww.com/reprints Information about reprints can be found online at: Reprints:
document. Permissions and Rights Question and Answer this process is available in the
click Request Permissions in the middle column of the Web page under Services. Further information aboutOffice. Once the online version of the published article for which permission is being requested is located,
can be obtained via RightsLink, a service of the Copyright Clearance Center, not the EditorialCirculationin Requests for permissions to reproduce figures, tables, or portions of articles originally publishedPermissions:
at Rijksuniversiteit Leiden on August 21, 2013http://circ.ahajournals.org/Downloaded from
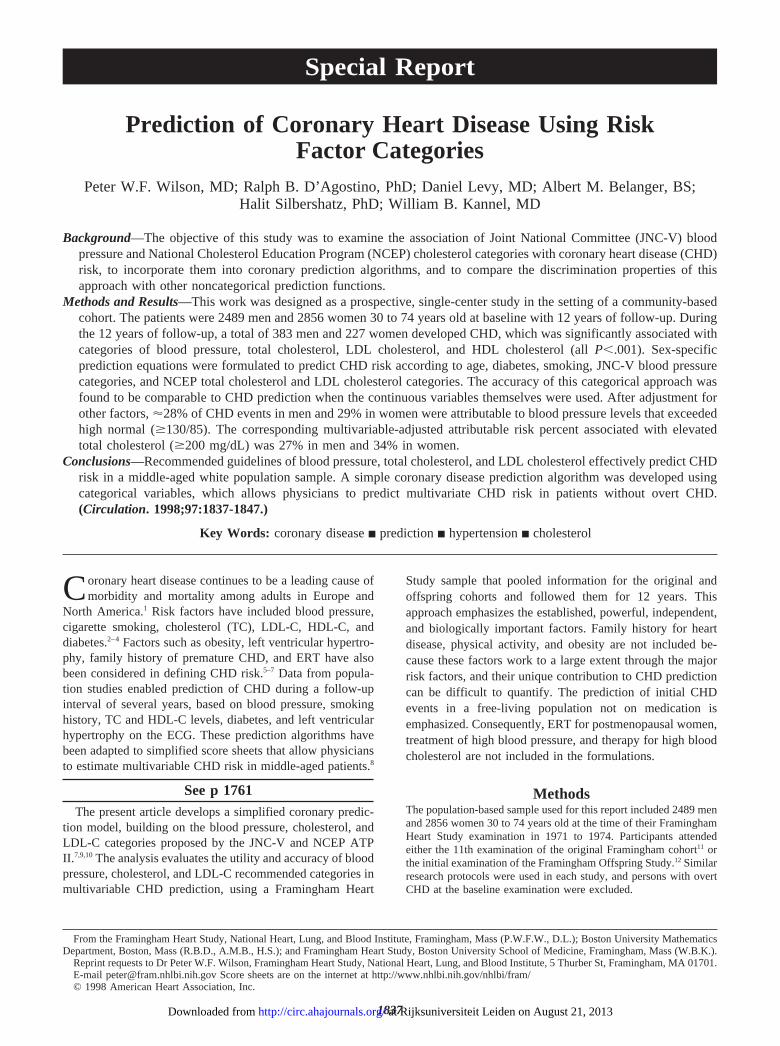
Prediction of Coronary Heart Disease Using RiskFactor Categories
Peter W.F. Wilson, MD; Ralph B. D’Agostino, PhD; Daniel Levy, MD; Albert M. Belanger, BS;Halit Silbershatz, PhD; William B. Kannel, MD
Background—The objective of this study was to examine the association of Joint National Committee (JNC-V) bloodpressure and National Cholesterol Education Program (NCEP) cholesterol categories with coronary heart disease (CHD)risk, to incorporate them into coronary prediction algorithms, and to compare the discrimination properties of thisapproach with other noncategorical prediction functions.
Methods and Results—This work was designed as a prospective, single-center study in the setting of a community-basedcohort. The patients were 2489 men and 2856 women 30 to 74 years old at baseline with 12 years of follow-up. Duringthe 12 years of follow-up, a total of 383 men and 227 women developed CHD, which was significantly associated withcategories of blood pressure, total cholesterol, LDL cholesterol, and HDL cholesterol (allP,.001). Sex-specificprediction equations were formulated to predict CHD risk according to age, diabetes, smoking, JNC-V blood pressurecategories, and NCEP total cholesterol and LDL cholesterol categories. The accuracy of this categorical approach wasfound to be comparable to CHD prediction when the continuous variables themselves were used. After adjustment forother factors,'28% of CHD events in men and 29% in women were attributable to blood pressure levels that exceededhigh normal ($130/85). The corresponding multivariable-adjusted attributable risk percent associated with elevatedtotal cholesterol ($200 mg/dL) was 27% in men and 34% in women.
Conclusions—Recommended guidelines of blood pressure, total cholesterol, and LDL cholesterol effectively predict CHDrisk in a middle-aged white population sample. A simple coronary disease prediction algorithm was developed usingcategorical variables, which allows physicians to predict multivariate CHD risk in patients without overt CHD.(Circulation. 1998;97:1837-1847.)
Key Words: coronary diseasen predictionn hypertensionn cholesterol
Coronary heart disease continues to be a leading cause ofmorbidity and mortality among adults in Europe and
North America.1 Risk factors have included blood pressure,cigarette smoking, cholesterol (TC), LDL-C, HDL-C, anddiabetes.2–4 Factors such as obesity, left ventricular hypertro-phy, family history of premature CHD, and ERT have alsobeen considered in defining CHD risk.5–7 Data from popula-tion studies enabled prediction of CHD during a follow-upinterval of several years, based on blood pressure, smokinghistory, TC and HDL-C levels, diabetes, and left ventricularhypertrophy on the ECG. These prediction algorithms havebeen adapted to simplified score sheets that allow physiciansto estimate multivariable CHD risk in middle-aged patients.8
See p 1761The present article develops a simplified coronary predic-
tion model, building on the blood pressure, cholesterol, andLDL-C categories proposed by the JNC-V and NCEP ATPII.7,9,10The analysis evaluates the utility and accuracy of bloodpressure, cholesterol, and LDL-C recommended categories inmultivariable CHD prediction, using a Framingham Heart
Study sample that pooled information for the original andoffspring cohorts and followed them for 12 years. Thisapproach emphasizes the established, powerful, independent,and biologically important factors. Family history for heartdisease, physical activity, and obesity are not included be-cause these factors work to a large extent through the majorrisk factors, and their unique contribution to CHD predictioncan be difficult to quantify. The prediction of initial CHDevents in a free-living population not on medication isemphasized. Consequently, ERT for postmenopausal women,treatment of high blood pressure, and therapy for high bloodcholesterol are not included in the formulations.
MethodsThe population-based sample used for this report included 2489 menand 2856 women 30 to 74 years old at the time of their FraminghamHeart Study examination in 1971 to 1974. Participants attendedeither the 11th examination of the original Framingham cohort11 orthe initial examination of the Framingham Offspring Study.12 Similarresearch protocols were used in each study, and persons with overtCHD at the baseline examination were excluded.
From the Framingham Heart Study, National Heart, Lung, and Blood Institute, Framingham, Mass (P.W.F.W., D.L.); Boston University MathematicsDepartment, Boston, Mass (R.B.D., A.M.B., H.S.); and Framingham Heart Study, Boston University School of Medicine, Framingham, Mass (W.B.K.).
Reprint requests to Dr Peter W.F. Wilson, Framingham Heart Study, National Heart, Lung, and Blood Institute, 5 Thurber St, Framingham, MA 01701.E-mail [email protected] Score sheets are on the internet at http://www.nhlbi.nih.gov/nhlbi/fram/© 1998 American Heart Association, Inc.
1837
Special Report
at Rijksuniversiteit Leiden on August 21, 2013http://circ.ahajournals.org/Downloaded from
At the 1971–1974 examination, a medical history was taken and aphysical examination was performed by a physician. Persons whosmoked regularly during the previous 12 months were classified assmokers. Height and weight were measured, and body mass index(kg/m2) was calculated. Two blood pressure determinations were madeafter the participant had been sitting at least 5 minutes, and the averagewas used for analyses. Hypertension was categorized according to bloodpressure readings by JNC-V definitions10: optimal (systolic,120 mm Hg and diastolic,80 mm Hg), normal blood pressure(systolic 120 to 129 mm Hg or diastolic 80 to 84 mm Hg), high normalblood pressure (systolic 130 to 139 mm Hg or diastolic 85 to89 mm Hg), hypertension stage I (systolic 140 to 159 mm Hg ordiastolic 90 to 99 mm Hg), and hypertension stage II–IV (systolic$160or diastolic$100 mm Hg). When systolic and diastolic pressures fellinto different categories, the higher category was selected for thepurposes of classification. Blood pressure categorization was madewithout regard to the use of antihypertensive medication.
Diabetes was considered present if the participant was under treat-ment with insulin or oral hypoglycemic agents, if casual blood glucosedeterminations exceeded 150 mg/dL at two clinic visits in the originalcohort, or if fasting blood glucose exceeded 140 mg/dL at the initialexamination of the Offspring Study participants. Blood was drawn at thebaseline examination after an overnight fast, and EDTA plasma wasused for all cholesterol and triglyceride measurements. Cholesterol wasdetermined according to the Abell-Kendall technique,13 and HDL-C wasmeasured after precipitation of VLDL and LDL proteins with heparin-magnesium according to the Lipid Research Clinics Program protocol.14
When triglycerides were,400 mg/dL, the concentration of LDL-C wasestimated indirectly by use of the Friedewald formula15; for triglycerides$400 mg/dL, the LDL-C was estimated directly after ultracentrifuga-tion of plasma and measurement of cholesterol in the bottom fraction(plasma density,1.006).16
Cutoffs for TC (,200, 200 to 239, 240 to 279, and$280 mg/dL),LDL-C (,130, 130 to 159, and$160 mg/dL), HDL-C (,35, 35 to59, and$60 mg/dL), cigarette smoking, diabetes, and age wereconsidered in this report. The cholesterol and LDL-C cutoffs aresimilar to those used for the NCEP ATP II guidelines and were partlydictated by the number of persons with higher levels of TC orLDL-C. For those reasons, we have provided information forcholesterol categories of 240 to 279 and$280 mg/dL and for LDL-C$160 mg/dL. Too few persons had LDL-C$190 mg/dL to providestable estimates for CHD risk. Study subjects were followed up overa 12-year period for the development of CHD (angina pectoris,
recognized and unrecognized myocardial infarction, coronary insuf-ficiency, and coronary heart disease death) according to previouslypublished criteria. “Hard CHD” events included total CHD withoutangina pectoris.17 Surveillance for CHD consisted of regular exam-inations at the Framingham Heart Study clinic and review of medicalrecords from outside physician office visits and hospitalizations.
Statistical tests included age-adjusted linear regression or logisticregression to test for trends across blood pressure, TC, LDL-C, andHDL-C categories.18 Age-adjusted Cox proportional hazards regres-sion and its accompanying c statistic were used to test for the relationbetween various independent variables and the CHD outcome and toevaluate the discriminatory ability of various prediction models.19,20
The 12-year follow-up was used in the proportional hazards models,and results were adapted to provide 10-year CHD incidence esti-mates. Separate score sheets were developed for each sex using TCand LDL-C categories. These sheets adapted the results of propor-tional hazards regressions by use of a system that assigned points foreach risk factor based on the value for the correspondingb-coeffi-cient of the regression analyses.
The relative risk, but not the attributable risk, for TC and CHDdeclines with advancing age.21 Quadratic terms for age were consid-ered in the models for the score sheets. Furthermore, CHD risk isassociated with HDL-C in the elderly,22–24 and interaction terms forTC and age were also considered in the development of theprediction models.22 Among women, an age-squared term was foundto be significant in the prediction models and was incorporated intothe score sheets. Neither age3TC nor age3LDL-C was found to besignificant in either sex.
Score sheets for prediction of CHD using TC and LDL-Ccategorical variables were developed from theb-coefficients of Coxproportional hazards models. The TC range was expanded in40-mg/dL increments to include$160 mg/dL and$280 mg/dL, theHDL-C range 35 to 59 mg/dL was partitioned to provide three levelsfor each sex, and both optimal and normal blood pressure categorieswere included. The score sheets provide comparison 10-year abso-lute risks for persons of the same age and sex for average total CHD,average hard CHD (total CHD without angina pectoris), and low-risktotal CHD. Risk factors are shaded, ranging from very low relativerisk to very high. Such distinctions are arbitrary but provide afoundation to determine the need for clinical intervention.
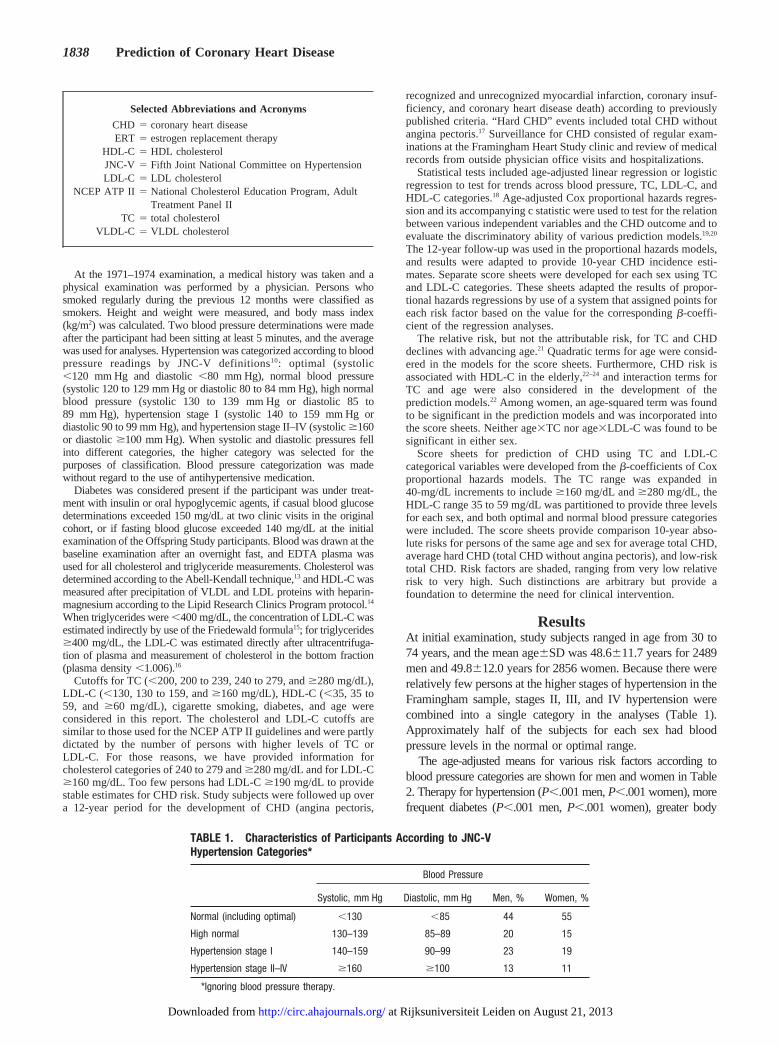
ResultsAt initial examination, study subjects ranged in age from 30 to74 years, and the mean age6SD was 48.6611.7 years for 2489men and 49.8612.0 years for 2856 women. Because there wererelatively few persons at the higher stages of hypertension in theFramingham sample, stages II, III, and IV hypertension werecombined into a single category in the analyses (Table 1).Approximately half of the subjects for each sex had bloodpressure levels in the normal or optimal range.
The age-adjusted means for various risk factors according toblood pressure categories are shown for men and women in Table2. Therapy for hypertension (P,.001 men,P,.001 women), morefrequent diabetes (P,.001 men,P,.001 women), greater body
Selected Abbreviations and Acronyms
CHD 5 coronary heart diseaseERT 5 estrogen replacement therapy
HDL-C 5 HDL cholesterolJNC-V 5 Fifth Joint National Committee on HypertensionLDL-C 5 LDL cholesterol
NCEP ATP II 5 National Cholesterol Education Program, AdultTreatment Panel II
TC 5 total cholesterolVLDL-C 5 VLDL cholesterol
TABLE 1. Characteristics of Participants According to JNC-VHypertension Categories*
Blood Pressure
Systolic, mm Hg Diastolic, mm Hg Men, % Women, %
Normal (including optimal) ,130 ,85 44 55
High normal 130–139 85–89 20 15
Hypertension stage I 140–159 90–99 23 19
Hypertension stage II–IV $160 $100 13 11
*Ignoring blood pressure therapy.
1838 Prediction of Coronary Heart Disease
at Rijksuniversiteit Leiden on August 21, 2013http://circ.ahajournals.org/Downloaded from
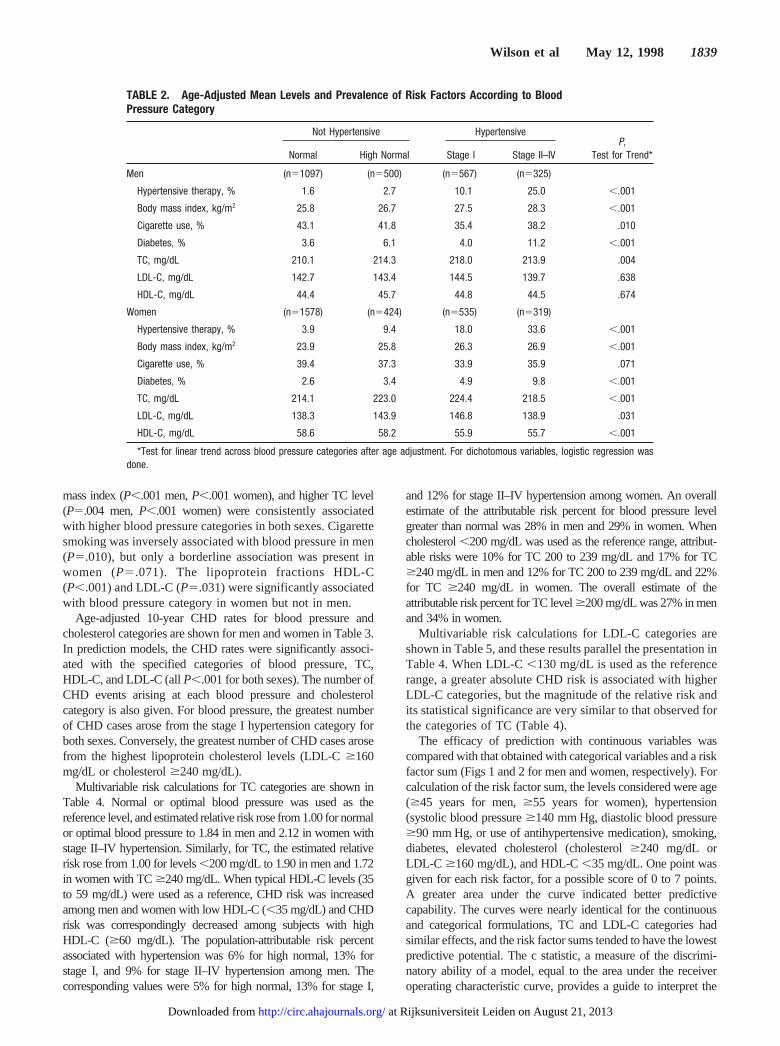
mass index (P,.001 men,P,.001 women), and higher TC level(P5.004 men,P,.001 women) wereconsistently associatedwith higher blood pressure categories in both sexes. Cigarettesmoking was inversely associated with blood pressure in men(P5.010), but only a borderline association was present inwomen (P5.071). The lipoprotein fractions HDL-C(P,.001) and LDL-C (P5.031) were significantly associatedwith blood pressure category in women but not in men.
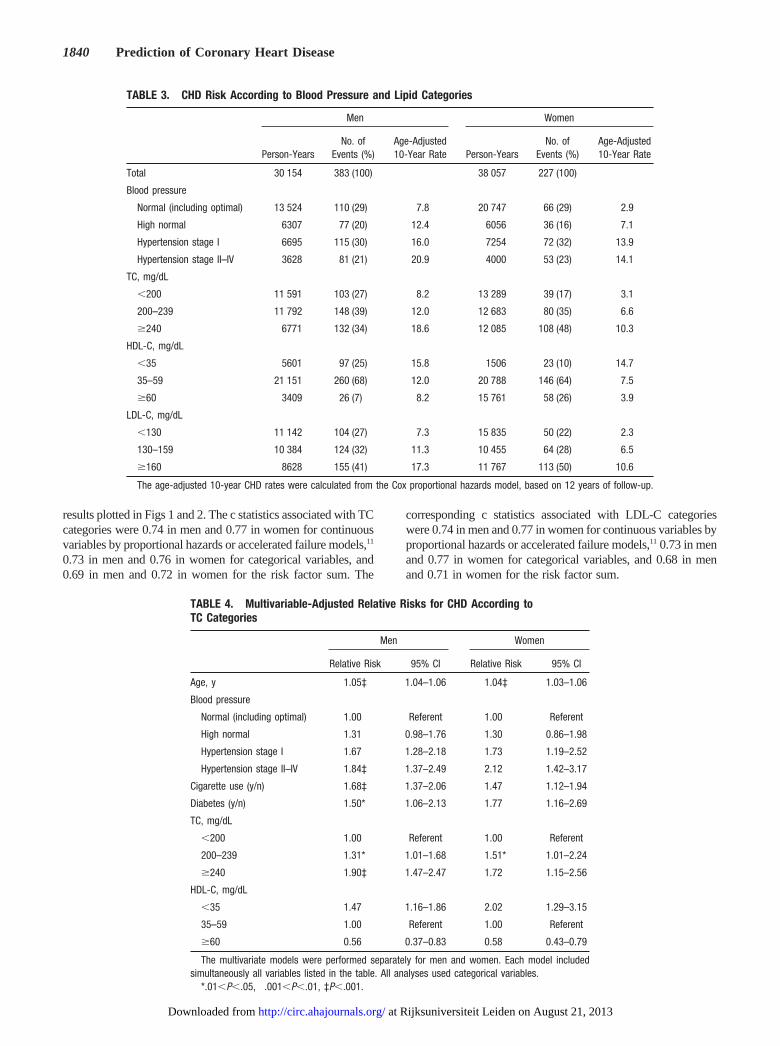
Age-adjusted 10-year CHD rates for blood pressure andcholesterol categories are shown for men and women in Table 3.In prediction models, the CHD rates were significantly associ-ated with the specified categories of blood pressure, TC,HDL-C, and LDL-C (allP,.001 for both sexes). The number ofCHD events arising at each blood pressure and cholesterolcategory is also given. For blood pressure, the greatest numberof CHD cases arose from the stage I hypertension category forboth sexes. Conversely, the greatest number of CHD cases arosefrom the highest lipoprotein cholesterol levels (LDL-C$160mg/dL or cholesterol$240 mg/dL).
Multivariable risk calculations for TC categories are shown inTable 4. Normal or optimal blood pressure was used as thereference level, and estimated relative risk rose from 1.00 for normalor optimal blood pressure to 1.84 in men and 2.12 in women withstage II–IV hypertension. Similarly, for TC, the estimated relativerisk rose from 1.00 for levels,200 mg/dL to 1.90 in men and 1.72in women with TC$240 mg/dL. When typical HDL-C levels (35to 59 mg/dL) were used as a reference, CHD risk was increasedamong men and women with low HDL-C (,35 mg/dL) and CHDrisk was correspondingly decreased among subjects with highHDL-C ($60 mg/dL). The population-attributable risk percentassociated with hypertension was 6% for high normal, 13% forstage I, and 9% for stage II–IV hypertension among men. Thecorresponding values were 5% for high normal, 13% for stage I,
and 12% for stage II–IV hypertension among women. An overallestimate of the attributable risk percent for blood pressure levelgreater than normal was 28% in men and 29% in women. Whencholesterol,200 mg/dL was used as the reference range, attribut-able risks were 10% for TC 200 to 239 mg/dL and 17% for TC$240 mg/dL in men and 12% for TC 200 to 239 mg/dL and 22%for TC $240 mg/dL in women. The overall estimate of theattributable risk percent for TC level$200 mg/dL was 27% in menand 34% in women.
Multivariable risk calculations for LDL-C categories areshown in Table 5, and these results parallel the presentation inTable 4. When LDL-C,130 mg/dL is used as the referencerange, a greater absolute CHD risk is associated with higherLDL-C categories, but the magnitude of the relative risk andits statistical significance are very similar to that observed forthe categories of TC (Table 4).
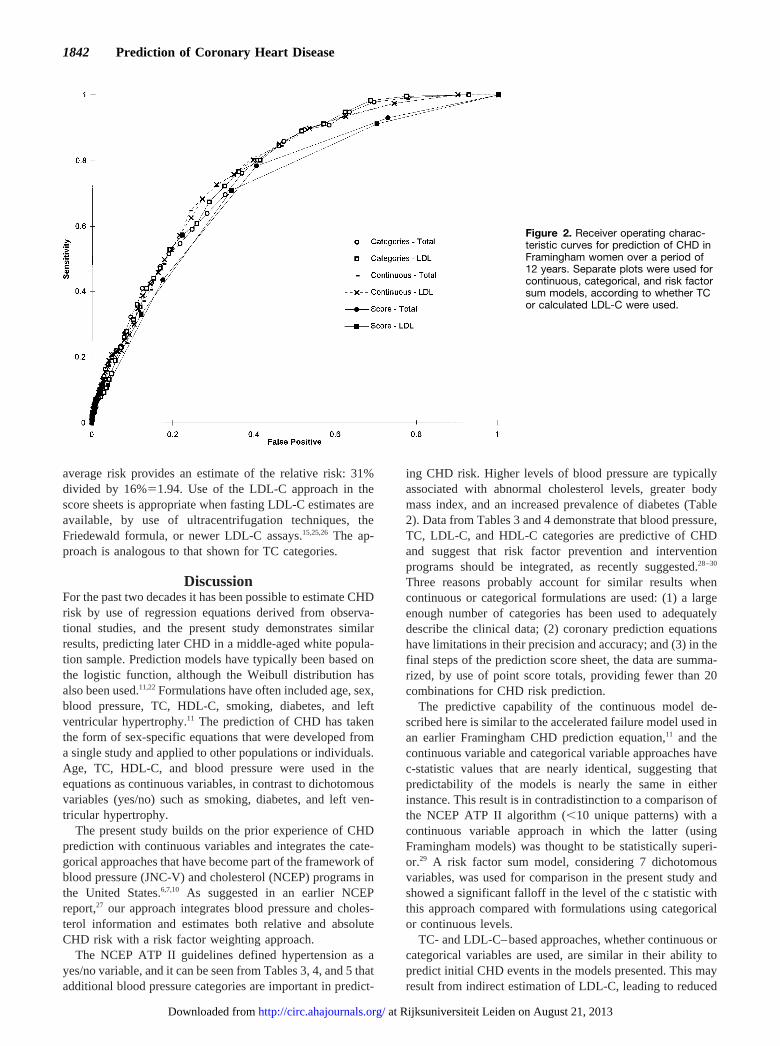
The efficacy of prediction with continuous variables wascompared with that obtained with categorical variables and a riskfactor sum (Figs 1 and 2 for men and women, respectively). Forcalculation of the risk factor sum, the levels considered were age($45 years for men,$55 years for women), hypertension(systolic blood pressure$140 mm Hg, diastolic blood pressure$90 mm Hg, or use of antihypertensive medication), smoking,diabetes, elevated cholesterol (cholesterol$240 mg/dL orLDL-C $160 mg/dL), and HDL-C,35 mg/dL. One point wasgiven for each risk factor, for a possible score of 0 to 7 points.A greater area under the curve indicated better predictivecapability. The curves were nearly identical for the continuousand categorical formulations, TC and LDL-C categories hadsimilar effects, and the risk factor sums tended to have the lowestpredictive potential. The c statistic, a measure of the discrimi-natory ability of a model, equal to the area under the receiveroperating characteristic curve, provides a guide to interpret the
TABLE 2. Age-Adjusted Mean Levels and Prevalence of Risk Factors According to BloodPressure Category
Not Hypertensive HypertensiveP,
Test for Trend*Normal High Normal Stage I Stage II–IV
Men (n51097) (n5500) (n5567) (n5325)
Hypertensive therapy, % 1.6 2.7 10.1 25.0 ,.001
Body mass index, kg/m2 25.8 26.7 27.5 28.3 ,.001
Cigarette use, % 43.1 41.8 35.4 38.2 .010
Diabetes, % 3.6 6.1 4.0 11.2 ,.001
TC, mg/dL 210.1 214.3 218.0 213.9 .004
LDL-C, mg/dL 142.7 143.4 144.5 139.7 .638
HDL-C, mg/dL 44.4 45.7 44.8 44.5 .674
Women (n51578) (n5424) (n5535) (n5319)
Hypertensive therapy, % 3.9 9.4 18.0 33.6 ,.001
Body mass index, kg/m2 23.9 25.8 26.3 26.9 ,.001
Cigarette use, % 39.4 37.3 33.9 35.9 .071
Diabetes, % 2.6 3.4 4.9 9.8 ,.001
TC, mg/dL 214.1 223.0 224.4 218.5 ,.001
LDL-C, mg/dL 138.3 143.9 146.8 138.9 .031
HDL-C, mg/dL 58.6 58.2 55.9 55.7 ,.001
*Test for linear trend across blood pressure categories after age adjustment. For dichotomous variables, logistic regression wasdone.
Wilson et al May 12, 1998 1839
at Rijksuniversiteit Leiden on August 21, 2013http://circ.ahajournals.org/Downloaded from
results plotted in Figs 1 and 2. The c statistics associated with TCcategories were 0.74 in men and 0.77 in women for continuousvariables by proportional hazards or accelerated failure models,11
0.73 in men and 0.76 in women for categorical variables, and0.69 in men and 0.72 in women for the risk factor sum. The
corresponding c statistics associated with LDL-C categorieswere 0.74 in men and 0.77 in women for continuous variables byproportional hazards or accelerated failure models,11 0.73 in menand 0.77 in women for categorical variables, and 0.68 in menand 0.71 in women for the risk factor sum.
TABLE 3. CHD Risk According to Blood Pressure and Lipid Categories
Men Women
Person-YearsNo. of
Events (%)Age-Adjusted10-Year Rate Person-Years
No. ofEvents (%)
Age-Adjusted10-Year Rate
Total 30 154 383 (100) 38 057 227 (100)
Blood pressure
Normal (including optimal) 13 524 110 (29) 7.8 20 747 66 (29) 2.9
High normal 6307 77 (20) 12.4 6056 36 (16) 7.1
Hypertension stage I 6695 115 (30) 16.0 7254 72 (32) 13.9
Hypertension stage II–IV 3628 81 (21) 20.9 4000 53 (23) 14.1
TC, mg/dL
,200 11 591 103 (27) 8.2 13 289 39 (17) 3.1
200–239 11 792 148 (39) 12.0 12 683 80 (35) 6.6
$240 6771 132 (34) 18.6 12 085 108 (48) 10.3
HDL-C, mg/dL
,35 5601 97 (25) 15.8 1506 23 (10) 14.7
35–59 21 151 260 (68) 12.0 20 788 146 (64) 7.5
$60 3409 26 (7) 8.2 15 761 58 (26) 3.9
LDL-C, mg/dL
,130 11 142 104 (27) 7.3 15 835 50 (22) 2.3
130–159 10 384 124 (32) 11.3 10 455 64 (28) 6.5
$160 8628 155 (41) 17.3 11 767 113 (50) 10.6
The age-adjusted 10-year CHD rates were calculated from the Cox proportional hazards model, based on 12 years of follow-up.
TABLE 4. Multivariable-Adjusted Relative Risks for CHD According toTC Categories
Men Women
Relative Risk 95% CI Relative Risk 95% CI
Age, y 1.05‡ 1.04–1.06 1.04‡ 1.03–1.06
Blood pressure
Normal (including optimal) 1.00 Referent 1.00 Referent
High normal 1.31 0.98–1.76 1.30 0.86–1.98
Hypertension stage I 1.67† 1.28–2.18 1.73† 1.19–2.52
Hypertension stage II–IV 1.84‡ 1.37–2.49 2.12† 1.42–3.17
Cigarette use (y/n) 1.68‡ 1.37–2.06 1.47† 1.12–1.94
Diabetes (y/n) 1.50* 1.06–2.13 1.77† 1.16–2.69
TC, mg/dL
,200 1.00 Referent 1.00 Referent
200–239 1.31* 1.01–1.68 1.51* 1.01–2.24
$240 1.90‡ 1.47–2.47 1.72† 1.15–2.56
HDL-C, mg/dL
,35 1.47† 1.16–1.86 2.02† 1.29–3.15
35–59 1.00 Referent 1.00 Referent
$60 0.56† 0.37–0.83 0.58† 0.43–0.79
The multivariate models were performed separately for men and women. Each model includedsimultaneously all variables listed in the table. All analyses used categorical variables.
*.01,P,.05, †.001,P,.01, ‡P,.001.
1840 Prediction of Coronary Heart Disease
at Rijksuniversiteit Leiden on August 21, 2013http://circ.ahajournals.org/Downloaded from
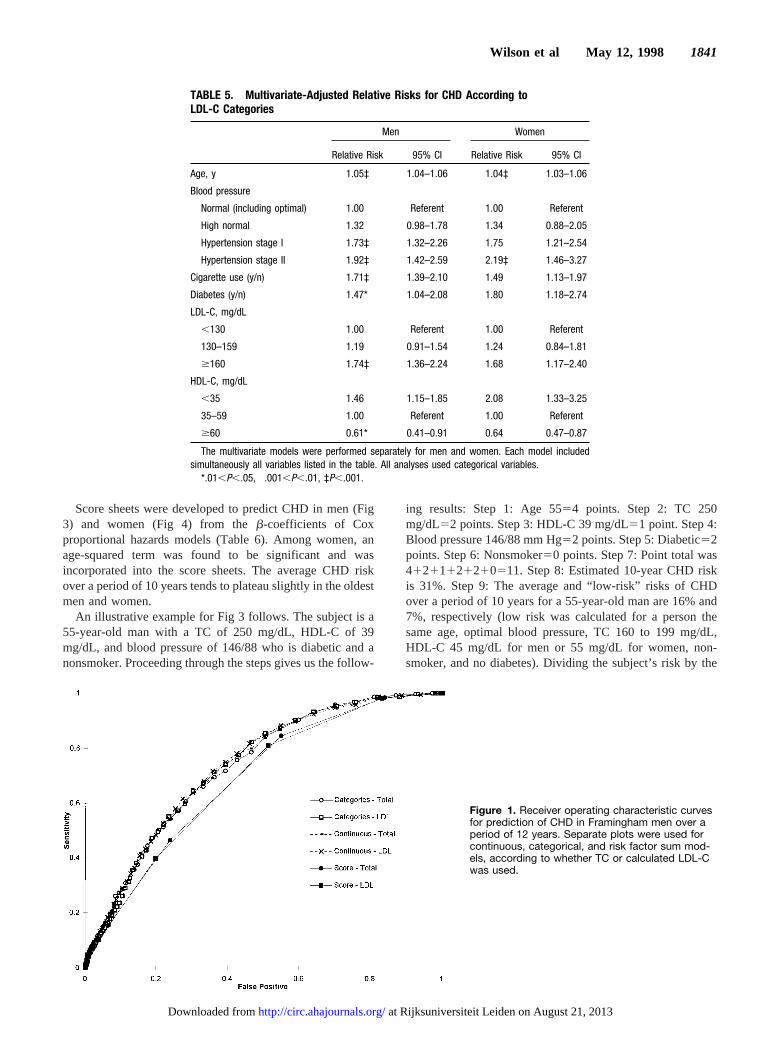
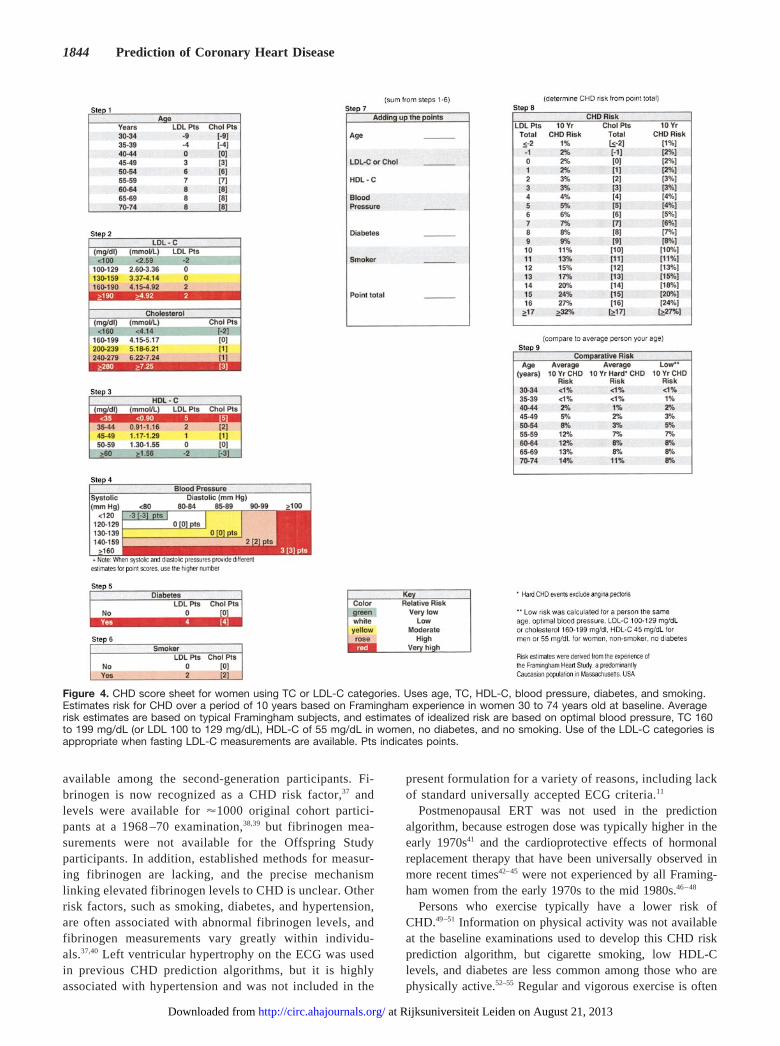
Score sheets were developed to predict CHD in men (Fig3) and women (Fig 4) from theb-coefficients of Coxproportional hazards models (Table 6). Among women, anage-squared term was found to be significant and wasincorporated into the score sheets. The average CHD riskover a period of 10 years tends to plateau slightly in the oldestmen and women.
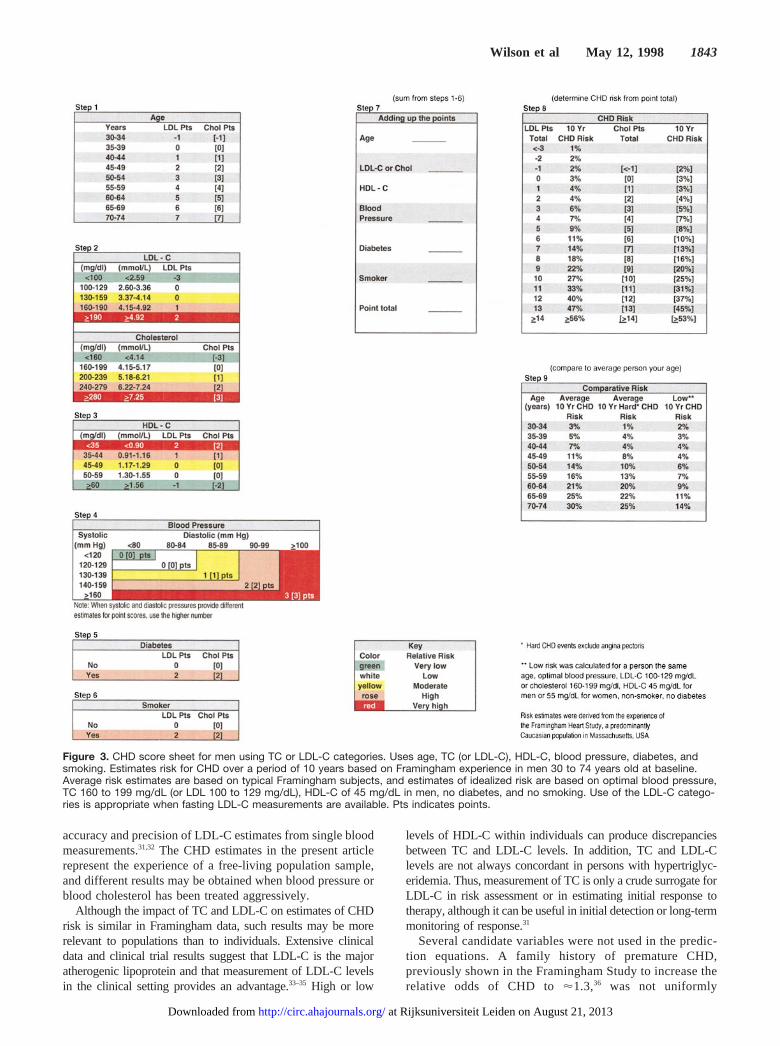
An illustrative example for Fig 3 follows. The subject is a55-year-old man with a TC of 250 mg/dL, HDL-C of 39mg/dL, and blood pressure of 146/88 who is diabetic and anonsmoker. Proceeding through the steps gives us the follow-
ing results: Step 1: Age 5554 points. Step 2: TC 250mg/dL52 points. Step 3: HDL-C 39 mg/dL51 point. Step 4:Blood pressure 146/88 mm Hg52 points. Step 5: Diabetic52points. Step 6: Nonsmoker50 points. Step 7: Point total was41211121210511. Step 8: Estimated 10-year CHD riskis 31%. Step 9: The average and “low-risk” risks of CHDover a period of 10 years for a 55-year-old man are 16% and7%, respectively (low risk was calculated for a person thesame age, optimal blood pressure, TC 160 to 199 mg/dL,HDL-C 45 mg/dL for men or 55 mg/dL for women, non-smoker, and no diabetes). Dividing the subject’s risk by the
Figure 1. Receiver operating characteristic curvesfor prediction of CHD in Framingham men over aperiod of 12 years. Separate plots were used forcontinuous, categorical, and risk factor sum mod-els, according to whether TC or calculated LDL-Cwas used.
TABLE 5. Multivariate-Adjusted Relative Risks for CHD According toLDL-C Categories
Men Women
Relative Risk 95% CI Relative Risk 95% CI
Age, y 1.05‡ 1.04–1.06 1.04‡ 1.03–1.06
Blood pressure
Normal (including optimal) 1.00 Referent 1.00 Referent
High normal 1.32 0.98–1.78 1.34 0.88–2.05
Hypertension stage I 1.73‡ 1.32–2.26 1.75† 1.21–2.54
Hypertension stage II 1.92‡ 1.42–2.59 2.19‡ 1.46–3.27
Cigarette use (y/n) 1.71‡ 1.39–2.10 1.49† 1.13–1.97
Diabetes (y/n) 1.47* 1.04–2.08 1.80† 1.18–2.74
LDL-C, mg/dL
,130 1.00 Referent 1.00 Referent
130–159 1.19 0.91–1.54 1.24 0.84–1.81
$160 1.74‡ 1.36–2.24 1.68† 1.17–2.40
HDL-C, mg/dL
,35 1.46† 1.15–1.85 2.08† 1.33–3.25
35–59 1.00 Referent 1.00 Referent
$60 0.61* 0.41–0.91 0.64† 0.47–0.87
The multivariate models were performed separately for men and women. Each model includedsimultaneously all variables listed in the table. All analyses used categorical variables.
*.01,P,.05, †.001,P,.01, ‡P,.001.
Wilson et al May 12, 1998 1841
at Rijksuniversiteit Leiden on August 21, 2013http://circ.ahajournals.org/Downloaded from
average risk provides an estimate of the relative risk: 31%divided by 16%51.94. Use of the LDL-C approach in thescore sheets is appropriate when fasting LDL-C estimates areavailable, by use of ultracentrifugation techniques, theFriedewald formula, or newer LDL-C assays.15,25,26 The ap-proach is analogous to that shown for TC categories.
DiscussionFor the past two decades it has been possible to estimate CHDrisk by use of regression equations derived from observa-tional studies, and the present study demonstrates similarresults, predicting later CHD in a middle-aged white popula-tion sample. Prediction models have typically been based onthe logistic function, although the Weibull distribution hasalso been used.11,22Formulations have often included age, sex,blood pressure, TC, HDL-C, smoking, diabetes, and leftventricular hypertrophy.11 The prediction of CHD has takenthe form of sex-specific equations that were developed froma single study and applied to other populations or individuals.Age, TC, HDL-C, and blood pressure were used in theequations as continuous variables, in contrast to dichotomousvariables (yes/no) such as smoking, diabetes, and left ven-tricular hypertrophy.
The present study builds on the prior experience of CHDprediction with continuous variables and integrates the cate-gorical approaches that have become part of the framework ofblood pressure (JNC-V) and cholesterol (NCEP) programs inthe United States.6,7,10 As suggested in an earlier NCEPreport,27 our approach integrates blood pressure and choles-terol information and estimates both relative and absoluteCHD risk with a risk factor weighting approach.
The NCEP ATP II guidelines defined hypertension as ayes/no variable, and it can be seen from Tables 3, 4, and 5 thatadditional blood pressure categories are important in predict-
ing CHD risk. Higher levels of blood pressure are typicallyassociated with abnormal cholesterol levels, greater bodymass index, and an increased prevalence of diabetes (Table2). Data from Tables 3 and 4 demonstrate that blood pressure,TC, LDL-C, and HDL-C categories are predictive of CHDand suggest that risk factor prevention and interventionprograms should be integrated, as recently suggested.28–30
Three reasons probably account for similar results whencontinuous or categorical formulations are used: (1) a largeenough number of categories has been used to adequatelydescribe the clinical data; (2) coronary prediction equationshave limitations in their precision and accuracy; and (3) in thefinal steps of the prediction score sheet, the data are summa-rized, by use of point score totals, providing fewer than 20combinations for CHD risk prediction.
The predictive capability of the continuous model de-scribed here is similar to the accelerated failure model used inan earlier Framingham CHD prediction equation,11 and thecontinuous variable and categorical variable approaches havec-statistic values that are nearly identical, suggesting thatpredictability of the models is nearly the same in eitherinstance. This result is in contradistinction to a comparison ofthe NCEP ATP II algorithm (,10 unique patterns) with acontinuous variable approach in which the latter (usingFramingham models) was thought to be statistically superi-or.29 A risk factor sum model, considering 7 dichotomousvariables, was used for comparison in the present study andshowed a significant falloff in the level of the c statistic withthis approach compared with formulations using categoricalor continuous levels.
TC- and LDL-C–based approaches, whether continuous orcategorical variables are used, are similar in their ability topredict initial CHD events in the models presented. This mayresult from indirect estimation of LDL-C, leading to reduced
Figure 2. Receiver operating charac-teristic curves for prediction of CHD inFramingham women over a period of12 years. Separate plots were used forcontinuous, categorical, and risk factorsum models, according to whether TCor calculated LDL-C were used.
1842 Prediction of Coronary Heart Disease
at Rijksuniversiteit Leiden on August 21, 2013http://circ.ahajournals.org/Downloaded from
accuracy and precision of LDL-C estimates from single bloodmeasurements.31,32 The CHD estimates in the present articlerepresent the experience of a free-living population sample,and different results may be obtained when blood pressure orblood cholesterol has been treated aggressively.
Although the impact of TC and LDL-C on estimates of CHDrisk is similar in Framingham data, such results may be morerelevant to populations than to individuals. Extensive clinicaldata and clinical trial results suggest that LDL-C is the majoratherogenic lipoprotein and that measurement of LDL-C levelsin the clinical setting provides an advantage.33–35 High or low
levels of HDL-C within individuals can produce discrepanciesbetween TC and LDL-C levels. In addition, TC and LDL-Clevels are not always concordant in persons with hypertriglyc-eridemia. Thus, measurement of TC is only a crude surrogate forLDL-C in risk assessment or in estimating initial response totherapy, although it can be useful in initial detection or long-termmonitoring of response.31
Several candidate variables were not used in the predic-tion equations. A family history of premature CHD,previously shown in the Framingham Study to increase therelative odds of CHD to'1.3,36 was not uniformly
Figure 3. CHD score sheet for men using TC or LDL-C categories. Uses age, TC (or LDL-C), HDL-C, blood pressure, diabetes, andsmoking. Estimates risk for CHD over a period of 10 years based on Framingham experience in men 30 to 74 years old at baseline.Average risk estimates are based on typical Framingham subjects, and estimates of idealized risk are based on optimal blood pressure,TC 160 to 199 mg/dL (or LDL 100 to 129 mg/dL), HDL-C of 45 mg/dL in men, no diabetes, and no smoking. Use of the LDL-C catego-ries is appropriate when fasting LDL-C measurements are available. Pts indicates points.
Wilson et al May 12, 1998 1843
at Rijksuniversiteit Leiden on August 21, 2013http://circ.ahajournals.org/Downloaded from
available among the second-generation participants. Fi-brinogen is now recognized as a CHD risk factor,37 andlevels were available for'1000 original cohort partici-pants at a 1968 –70 examination,38,39 but fibrinogen mea-surements were not available for the Offspring Studyparticipants. In addition, established methods for measur-ing fibrinogen are lacking, and the precise mechanismlinking elevated fibrinogen levels to CHD is unclear. Otherrisk factors, such as smoking, diabetes, and hypertension,are often associated with abnormal fibrinogen levels, andfibrinogen measurements vary greatly within individu-als.37,40 Left ventricular hypertrophy on the ECG was usedin previous CHD prediction algorithms, but it is highlyassociated with hypertension and was not included in the
present formulation for a variety of reasons, including lackof standard universally accepted ECG criteria.11
Postmenopausal ERT was not used in the predictionalgorithm, because estrogen dose was typically higher in theearly 1970s41 and the cardioprotective effects of hormonalreplacement therapy that have been universally observed inmore recent times42–45 were not experienced by all Framing-ham women from the early 1970s to the mid 1980s.46–48
Persons who exercise typically have a lower risk ofCHD.49–51 Information on physical activity was not availableat the baseline examinations used to develop this CHD riskprediction algorithm, but cigarette smoking, low HDL-Clevels, and diabetes are less common among those who arephysically active.52–55 Regular and vigorous exercise is often
Figure 4. CHD score sheet for women using TC or LDL-C categories. Uses age, TC, HDL-C, blood pressure, diabetes, and smoking.Estimates risk for CHD over a period of 10 years based on Framingham experience in women 30 to 74 years old at baseline. Averagerisk estimates are based on typical Framingham subjects, and estimates of idealized risk are based on optimal blood pressure, TC 160to 199 mg/dL (or LDL 100 to 129 mg/dL), HDL-C of 55 mg/dL in women, no diabetes, and no smoking. Use of the LDL-C categories isappropriate when fasting LDL-C measurements are available. Pts indicates points.
1844 Prediction of Coronary Heart Disease
at Rijksuniversiteit Leiden on August 21, 2013http://circ.ahajournals.org/Downloaded from
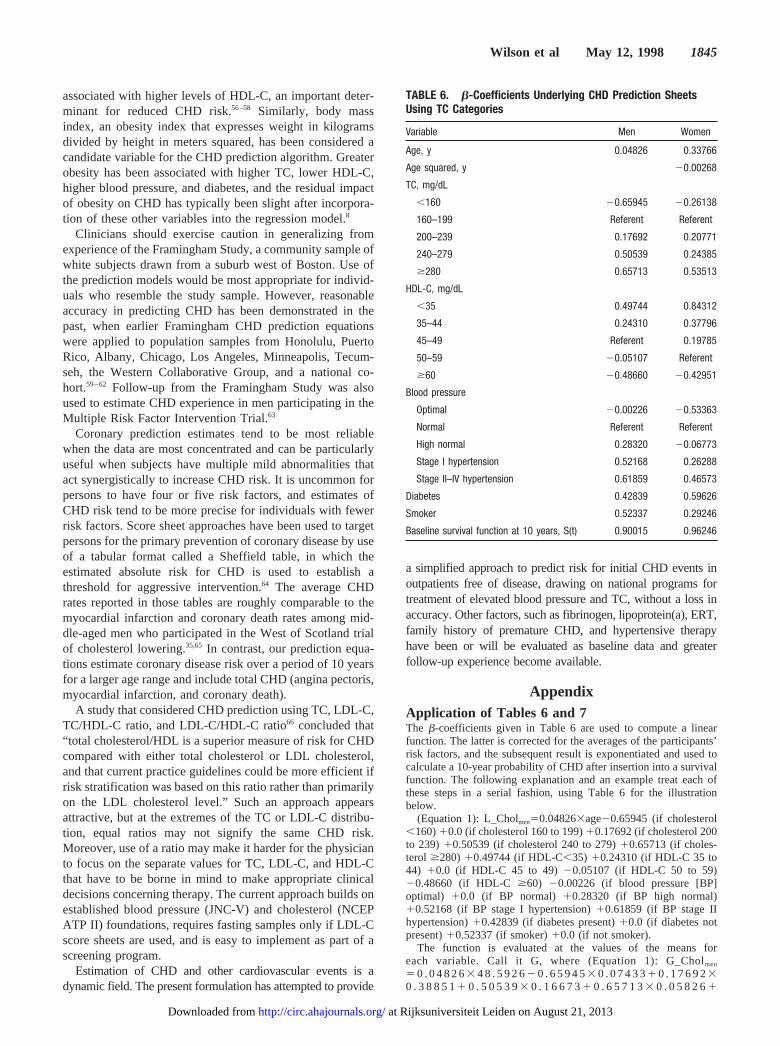
associated with higher levels of HDL-C, an important deter-minant for reduced CHD risk.56–58 Similarly, body massindex, an obesity index that expresses weight in kilogramsdivided by height in meters squared, has been considered acandidate variable for the CHD prediction algorithm. Greaterobesity has been associated with higher TC, lower HDL-C,higher blood pressure, and diabetes, and the residual impactof obesity on CHD has typically been slight after incorpora-tion of these other variables into the regression model.8
Clinicians should exercise caution in generalizing fromexperience of the Framingham Study, a community sample ofwhite subjects drawn from a suburb west of Boston. Use ofthe prediction models would be most appropriate for individ-uals who resemble the study sample. However, reasonableaccuracy in predicting CHD has been demonstrated in thepast, when earlier Framingham CHD prediction equationswere applied to population samples from Honolulu, PuertoRico, Albany, Chicago, Los Angeles, Minneapolis, Tecum-seh, the Western Collaborative Group, and a national co-hort.59–62 Follow-up from the Framingham Study was alsoused to estimate CHD experience in men participating in theMultiple Risk Factor Intervention Trial.63
Coronary prediction estimates tend to be most reliablewhen the data are most concentrated and can be particularlyuseful when subjects have multiple mild abnormalities thatact synergistically to increase CHD risk. It is uncommon forpersons to have four or five risk factors, and estimates ofCHD risk tend to be more precise for individuals with fewerrisk factors. Score sheet approaches have been used to targetpersons for the primary prevention of coronary disease by useof a tabular format called a Sheffield table, in which theestimated absolute risk for CHD is used to establish athreshold for aggressive intervention.64 The average CHDrates reported in those tables are roughly comparable to themyocardial infarction and coronary death rates among mid-dle-aged men who participated in the West of Scotland trialof cholesterol lowering.35,65 In contrast, our prediction equa-tions estimate coronary disease risk over a period of 10 yearsfor a larger age range and include total CHD (angina pectoris,myocardial infarction, and coronary death).
A study that considered CHD prediction using TC, LDL-C,TC/HDL-C ratio, and LDL-C/HDL-C ratio66 concluded that“total cholesterol/HDL is a superior measure of risk for CHDcompared with either total cholesterol or LDL cholesterol,and that current practice guidelines could be more efficient ifrisk stratification was based on this ratio rather than primarilyon the LDL cholesterol level.” Such an approach appearsattractive, but at the extremes of the TC or LDL-C distribu-tion, equal ratios may not signify the same CHD risk.Moreover, use of a ratio may make it harder for the physicianto focus on the separate values for TC, LDL-C, and HDL-Cthat have to be borne in mind to make appropriate clinicaldecisions concerning therapy. The current approach builds onestablished blood pressure (JNC-V) and cholesterol (NCEPATP II) foundations, requires fasting samples only if LDL-Cscore sheets are used, and is easy to implement as part of ascreening program.
Estimation of CHD and other cardiovascular events is adynamic field. The present formulation has attempted to provide
a simplified approach to predict risk for initial CHD events inoutpatients free of disease, drawing on national programs fortreatment of elevated blood pressure and TC, without a loss inaccuracy. Other factors, such as fibrinogen, lipoprotein(a), ERT,family history of premature CHD, and hypertensive therapyhave been or will be evaluated as baseline data and greaterfollow-up experience become available.
AppendixApplication of Tables 6 and 7The b-coefficients given in Table 6 are used to compute a linearfunction. The latter is corrected for the averages of the participants’risk factors, and the subsequent result is exponentiated and used tocalculate a 10-year probability of CHD after insertion into a survivalfunction. The following explanation and an example treat each ofthese steps in a serial fashion, using Table 6 for the illustrationbelow.
(Equation 1): L_Cholmen50.048263age20.65945 (if cholesterol,160)10.0 (if cholesterol 160 to 199)10.17692 (if cholesterol 200to 239)10.50539 (if cholesterol 240 to 279)10.65713 (if choles-terol $280) 10.49744 (if HDL-C,35) 10.24310 (if HDL-C 35 to44) 10.0 (if HDL-C 45 to 49) 20.05107 (if HDL-C 50 to 59)20.48660 (if HDL-C $60) 20.00226 (if blood pressure [BP]optimal) 10.0 (if BP normal) 10.28320 (if BP high normal)10.52168 (if BP stage I hypertension)10.61859 (if BP stage IIhypertension)10.42839 (if diabetes present)10.0 (if diabetes notpresent)10.52337 (if smoker)10.0 (if not smoker).
The function is evaluated at the values of the means foreach variable. Call it G, where (Equation 1): G_Cholmen
5 0 . 0 4 8 2 63 4 8 . 5 9 2 62 0 . 6 5 9 4 53 0 . 0 7 4 3 31 0 . 1 7 6 9 230 . 3 8 8 5 11 0 . 5 0 5 3 93 0 . 1 6 6 7 31 0 . 6 5 7 1 33 0 . 0 5 8 2 61
TABLE 6. b-Coefficients Underlying CHD Prediction SheetsUsing TC Categories
Variable Men Women
Age, y 0.04826 0.33766
Age squared, y 20.00268
TC, mg/dL
,160 20.65945 20.26138
160–199 Referent Referent
200–239 0.17692 0.20771
240–279 0.50539 0.24385
$280 0.65713 0.53513
HDL-C, mg/dL
,35 0.49744 0.84312
35–44 0.24310 0.37796
45–49 Referent 0.19785
50–59 20.05107 Referent
$60 20.48660 20.42951
Blood pressure
Optimal 20.00226 20.53363
Normal Referent Referent
High normal 0.28320 20.06773
Stage I hypertension 0.52168 0.26288
Stage II–IV hypertension 0.61859 0.46573
Diabetes 0.42839 0.59626
Smoker 0.52337 0.29246
Baseline survival function at 10 years, S(t) 0.90015 0.96246
Wilson et al May 12, 1998 1845
at Rijksuniversiteit Leiden on August 21, 2013http://circ.ahajournals.org/Downloaded from
0 . 4 9 7 4 43 0 . 1 9 2 8 51 0 . 2 4 3 1 03 0 . 3 5 4 7 62 0 . 0 5 1 0 730 . 1 9 6 4 62 0 . 4 8 6 6 03 0 . 1 0 7 2 72 0 . 0 0 2 2 63 0 . 2 0 0 4 810 . 2 8 3 2 03 0 . 2 0 0 4 81 0 . 5 2 1 6 83 0 . 2 2 8 2 01 0 . 6 1 8 5 930.1305710.4283930.0522310.5233730.4045853.0975. Simi-larly, for women, G_Chol59.92545. For the LDL score sheets,G_LDL for men is 3.00069 and for women 9.914136.
This value of G is subtracted from function L to produce functionA (Equation 2), which is then exponentiated, to produce B (Equation3). The latter represents the relative odds for CHD. The survivalvalue s(t) is exponentiated by B and subtracted from 1.0 to calculatethe 10-year probability of CHD (Equation 4).
(Equation 2): A5L2G (where G_Chol53.0975 for men,9.92545 for women; similarly for Table 7, G_LDL53.00069 formen, 9.914136 for women).
(Equation 3): B5eA.(Equation 4):P512[s(t)]B [where s(t)_Chol 10 years50.90015 for
men, 0.96246 for women; similarly for Table 7, s(t)_LDL 10years50.90017 for men, 0.9628 for women].
Consider a 55-year-old man with cholesterol of 250 mg/dL, HDL-Cof 39 mg/dL, blood pressure (146/88 mm Hg) that falls into stage Ihypertension, and no diabetes, who is a smoker. In this instance, afterEquation 1, L55530.0482610.5053910.2431010.5216810.5233754.4478. After Equation 2, A54.447823.097551.3503, and afterEquation 3, B5e1.350353.85874. Finally, after Equation 4,P5120.900153.858745120.6663750.3336, for a 33% chance of devel-oping CHD over 10 years. According to the point score sheet, 55 yearsold (4 points)1cholesterol of 250 mg/dL (2 points)1HDL-C of 39mg/dL (1 point)1stage I blood pressure (2 points)1smoker (2points)511 points, corresponding to a 31% chance of developing CHDover 10 years. An average 55-year-old man has a 16% risk, and an idealman has a 7% risk. Similar calculations can be done for women and forthe LDL-C prediction models and score sheets.
AcknowledgmentsThis work is from the National Heart, Lung, and Blood Institute’sFramingham Heart Study, supported by NIH/NHLBI contract N01-HC-38038. The authors would like to acknowledge the carefulreview and helpful criticism by Dr James Cleeman, Coordinator ofthe National Cholesterol Education Program at the National Heart,Lung, and Blood Institute.
References1. McGovern PG, Pankow JS, Shahar E, Doliszny KM, Folsom AR,
Blackburn H, Luepker RV, the Minnesota Heart Survey Investigators.Recent trends in acute coronary heart disease: mortality, morbidity,medical care, and risk factors.N Engl J Med. 1996;334:884–890.
2. Gordon T, Kannel WB. Multiple risk functions for predicting coronaryheart disease: the concept, accuracy, and application.Am Heart J. 1982;103:1031–1039.
3. Kannel WB, McGee DL. Diabetes and glucose tolerance as risk factors forcardiovascular disease: the Framingham Study.Diabetes Care. 1979;2:120–126.
4. Gordon T, Castelli WP, Hjortland MC, Kannel WB, Dawber TR.Diabetes, blood lipids, and the role of obesity in coronary heart diseaserisk for women.Ann Intern Med. 1977;87:393–397.
5. The Expert Panel. Report of the National Cholesterol Education ProgramExpert Panel on detection, evaluation, and treatment of high blood cho-lesterol in adults.Arch Intern Med. 1988;34:193–201.
6. Expert Panel on Detection, Evaluation, and Treatment of High BloodCholesterol in Adults. Summary of the second report of the NationalCholesterol Education Program (NCEP) expert panel on detection, eval-uation, and treatment of high blood cholesterol in adults (Adult TreatmentPanel II).JAMA. 1993;269:3015–3023.
7. The Expert Panel. National Cholesterol Education Program Second Report. Theexpert panel on detection, evaluation, and treatment of high blood cholesterol inadults (Adult Treatment Panel II).Circulation. 1994;89:1333–1445.
8. Anderson KM, Odell PM, Wilson PWF, Kannel WB. Cardiovasculardisease risk profiles.Am Heart J. 1991;121:293–298.
9. The Expert Panel. Expert panel on detection, evaluation and treatment ofhigh blood cholesterol in adults: summary of the second report of theNCEP expert panel (Adult Treatment Panel II).JAMA. 1993;269:3015–3023.
10. Joint National Committee. The fifth report of the Joint National Com-mittee on detection, evaluation, and treatment of high blood pressure(JNC V). Arch Intern Med. 1993;153:154–183.
11. Anderson KM, Wilson PWF, Odell PM, Kannel WB. An updated coro-nary risk profile: a statement for health professionals.Circulation. 1991;83:357–363.
12. Kannel WB, Feinleib M, McNamara PM, Garrison RJ, Castelli WP. Aninvestigation of coronary heart disease in families: the FraminghamOffspring Study.Am J Epidemiol. 1979;110:281–290.
13. Abell LL, Levy BB, Brodie BB, Kendall FE. A simplified method for theestimation of total cholesterol in serum and demonstration of its speci-ficity. J Biol Chem. 1952;195:357–366.
14. Lipid Research Clinics Program.Manual of Laboratory Operation.Bethesda, Md: National Institutes of Health; 1974:75–628.
15. Friedewald WT, Levy RI, Fredrickson DS. Estimation of the concen-tration of low-density lipoprotein cholesterol in plasma, without the use ofthe preparative ultracentrifuge.Clin Chem. 1972;18:499–502.
16. Manual of Laboratory Operations: Lipid Research Clinics Program,Lipid and Lipoprotein Analysis. Washington, DC: National Institutes ofHealth, US Department of Health and Human Services; 1982.
17. Kannel WB, Wolf PA, Garrison RJ. MonographSection 34: Some RiskFactors Related to the Annual Incidence of Cardiovascular Disease andDeath Using Pooled Repeated Biennial Measurements: FraminghamHeart Study, 30-Year Followup. Springfield, Mass: National TechnicalInformation Service; 1987:1–459.
18. Neter J, Wasserman W. Multiple regression. In:Applied Linear StatisticalModels. Homewood, Ill: Irwin; 1974:214–272.
19. Cox DR. Regression models and life tables.J R Stat Soc B. 1972;34:187–220.
20. Harrell FE Jr, Lee KL, Mark DB. Multivariable prognostic models: issuesin developing models, evaluating assumptions and adequacy, and mea-suring and reducing errors.Stat Med. 1996;15:361–387.
21. Benfante R, Reed D. Is elevated serum cholesterol level a risk factor forcoronary heart disease in the elderly?JAMA. 1990;263:393–396.
22. Wilson PWF, Castelli WP, Kannel WB. Coronary risk prediction inadults: the Framingham Heart Study.Am J Cardiol. 1987;59:91–94.
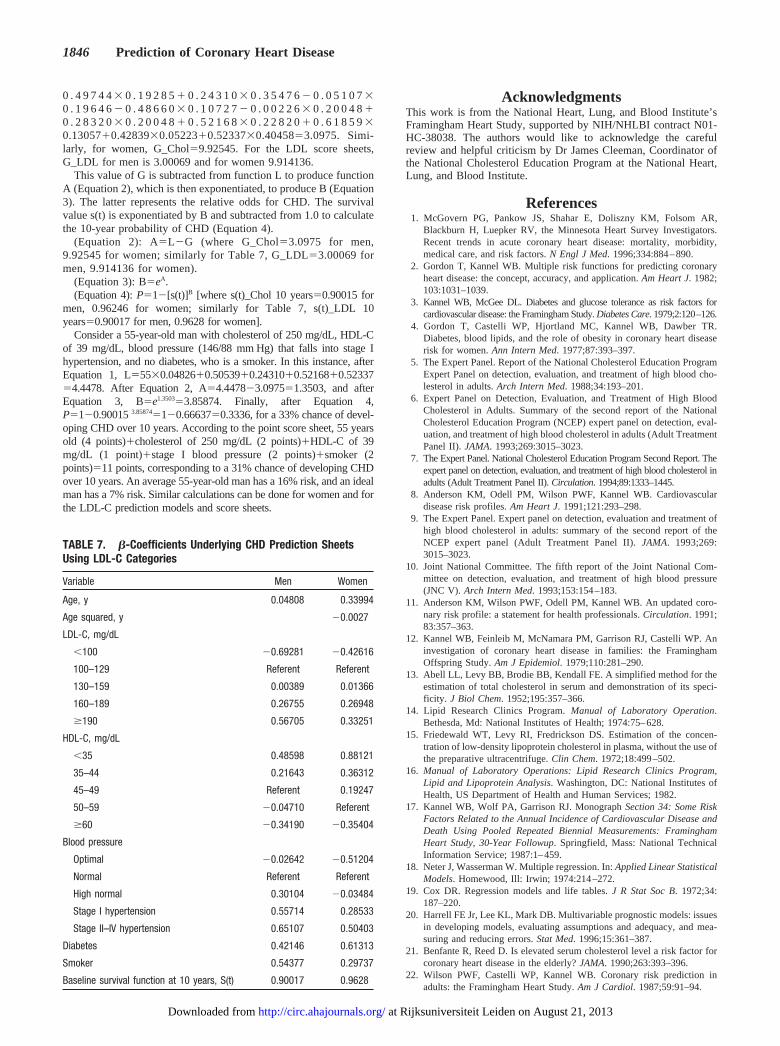
TABLE 7. b-Coefficients Underlying CHD Prediction SheetsUsing LDL-C Categories
Variable Men Women
Age, y 0.04808 0.33994
Age squared, y 20.0027
LDL-C, mg/dL
,100 20.69281 20.42616
100–129 Referent Referent
130–159 0.00389 0.01366
160–189 0.26755 0.26948
$190 0.56705 0.33251
HDL-C, mg/dL
,35 0.48598 0.88121
35–44 0.21643 0.36312
45–49 Referent 0.19247
50–59 20.04710 Referent
$60 20.34190 20.35404
Blood pressure
Optimal 20.02642 20.51204
Normal Referent Referent
High normal 0.30104 20.03484
Stage I hypertension 0.55714 0.28533
Stage II–IV hypertension 0.65107 0.50403
Diabetes 0.42146 0.61313
Smoker 0.54377 0.29737
Baseline survival function at 10 years, S(t) 0.90017 0.9628
1846 Prediction of Coronary Heart Disease
at Rijksuniversiteit Leiden on August 21, 2013http://circ.ahajournals.org/Downloaded from
23. Corti MC, Guralnik JM, Salive ME, Harris T, Field TS, Wallace RB,Berkman LF, Seeman TE, Glynn RJ, Hennekens CH, Havlik RJ. HDLcholesterol predicts coronary heart disease mortality in older persons.JAMA. 1995;274:539–544.
24. Wilson PWF, Kannel WB. Hypercholesterolemia and coronary risk in theelderly: the Framingham Study.Am J Geriat Cardiol. 1993;2:52–56.
25. McNamara JR, Cohn JS, Wilson PWF, Schaefer EJ. Calculated values forlow-density lipoprotein cholesterol in the assessment of lipid abnor-malities and coronary disease risk.Clin Chem. 1990;36:36–42.
26. McNamara JR, Cole TG, Contois JH, Ferguson CA, Ordovas JM,Schaefer EJ. Immunoseparation method for measuring low-densitylipoprotein cholesterol directly from serum evaluated.Clin Chem. 1995;41:232–240.
27. National Education Programs Working Group report on the managementof patients with hypertension and high blood cholesterol.Ann Intern Med.1991;114:224–237.
28. Grover SA, Abrahamowicz M, Joseph L, Brewer C, Coupal L, Suissa S. Thebenefits of treating hyperlipidemia to prevent coronary heart disease: estimatingchanges in life expectancy and morbidity.JAMA. 1992;267:816–822.
29. Grover SA, Coupal L, Hu XP. Identifying adults at increased risk ofcoronary disease: how well do the current cholesterol guidelines work?JAMA. 1995;274:801–806.
30. Levy D. Have expert panel guidelines kept pace with new concepts inhypertension?Lancet. 1995;346:1112.
31. Cooper GR, Myers GL, Smith J, Schlant RC. Blood lipid measurements:variations and practical utility.JAMA. 1992;267:1652–1660.
32. Wilson PWF. Cholesterol screening: once is not enough.Arch InternMed. 1995;155:2146–2147.
33. Blankenhorn DH, Nessim SA, Johnson RL, Sanmarco ME, Azen SP,Cashin-Hemphill L. Beneficial effects of combined colestipol-niacintherapy on coronary atherosclerosis and coronary venous bypass grafts.JAMA. 1987;257:3233–3240.
34. The 4S Group. Randomised trial of cholesterol lowering in 4444 patientswith coronary heart disease: the Scandinavian Simvastatin Survival Study(4S).Lancet. 1994;344:1383–1389.
35. Shepherd J, Cobbe SM, Ford I, Isles CG, Lorimer AR, MacFarlane PW,McKillop JH, Packard CJ, West of Scotland Coronary Prevention StudyGroup. Prevention of coronary heart disease with pravastatin in men withhypercholesterolemia.N Engl J Med. 1995;333:1301–1307.
36. Myers RH, Kiely DK, Cupples LA, Kannel WB. Parental history is anindependent risk factor for coronary artery disease: the FraminghamStudy.Am Heart J. 1990;120:963–969.
37. Ernst E, Resch KL. Fibrinogen as a cardiovascular risk factor: a meta-analysis and review of the literature.Ann Intern Med. 1993;118:956–963.
38. Kannel WB, Wolf R, Castelli WP, D’Agostino RB. Fibrinogen and risk ofcardiovascular disease: the Framingham Study.JAMA. 1987;258:1183–1186.
39. Kannel WB, D’Agostino RB, Wilson PWF, Belanger AJ, Gagnon DR.Diabetes, fibrinogen, and risk of cardiovascular disease: the Framinghamexperience.Am Heart J. 1990;120:672–676.
40. Barasch E, Benderly M, Graff E, Behar S, Reicher-Reiss H, Caspi A,Pelled B, Reisin L, Roguin N, Goldbourt U. Plasma fibrinogen levels andtheir correlates in 6457 coronary heart disease patients: the BezafibrateInfarction Prevention (BIP) Study.J Clin Epidemiol. 1995;48:757–765.
41. Pasley BH, Standfast SJ, Katz SH. Prescribing estrogen during meno-pause: physician survey of practices in 1974 and 1981.Public HealthRep. 1984;99:424–429.
42. Bush TL, Cowan LD, Barrett-Connor EL, Criqui MH, Karon JM, WallaceRB, Tyroler HA, Rifkind BM. Estrogen use and all-cause mortality.JAMA. 1983;249:903–906.
43. Barrett-Connor EL, Bush TL. Estrogen and coronary heart disease inwomen.JAMA. 1991;265:1861–1867.
44. Stampfer MJ, Colditz GA, Willett WC, Manson JE, Rosner B, SpeizerFE, Hennekens CH. Postmenopausal estrogen therapy and cardiovasculardisease: ten-year follow-up from the Nurses’ Health Study.N Engl J Med.1991;325:756–762.
45. Stampfer MJ, Colditz GA. Estrogen replacement therapy and coronaryheart disease: quantitative assessment of the epidemiologic evidence.Prev Med. 1991;20:47–63.
46. Wilson PWF, Garrison RJ, Castelli WP. Postmenopausal estrogen use,cigarette smoking, and cardiovascular morbidity: the Framingham Study.N Engl J Med. 1985;313:1038–1043.
47. Eaker ED, Castelli WP. Coronary heart disease and its risk factors amongwomen in the Framingham Study. In: Eaker ED, Packard B, Wenger NK,Clarkson TB, Tyroler HA, eds.Coronary Heart Disease in Women. NewYork, NY: Haymarket Doyma Inc; 1987:122–130.
48. Petitti DB. Reporting results. In:Meta-Analysis, Decision Analysis, andCost-Effectiveness Analysis. New York, NY: Oxford; 1994:197–211.
49. Powell KE, Thompson PD, Caspersen CJ, Kendrick JS. Physical activityand the incidence of coronary heart disease.Annu Rev Public Health.1987;8:253–287.
50. Lee IM, Hsieh CC, Paffenbarger RS Jr. Exercise intensity and longevityin men: the Harvard Alumni Health Study.JAMA. 1995;273:1179–1184.
51. Berlin JA, Colditz GA. A meta-analysis of physical activity in the pre-vention of coronary heart disease.Am J Epidemiol. 1990;132:612–628.
52. Wilson PWF. High-density lipoprotein, low-density lipoprotein and cor-onary artery disease.Am J Cardiol. 1990;66(suppl A):7–10.
53. Anderson KM, Wilson PWF, Garrison RJ, Castelli WP. Longitudinal and seculartrends in lipoprotein cholesterol measurements in a general population sample:the Framingham Offspring Study.Atherosclerosis. 1987;68:59–66.
54. Helmrich SP, Ragland DR, Leung RW, Paffenbarger RS Jr. Physicalactivity and reduced occurrence of non-insulin-dependent diabetesmellitus.N Engl J Med. 1991;325:147–152.
55. Burchfiel CM, Curb JD, Sharp DS, Rodriguez BL, Arakaki R, Chyou PH,Yano K. Distribution and correlates of insulin in elderly men: the HonoluluHeart Program.Arterioscler Thromb Vasc Biol. 1995;15:2213–2221.
56. Wood PD. Physical activity, diet, and health: independent and interactiveeffects.Med Sci Sports Exerc. 1994;26:838–843.
57. Dannenberg AL, Keller JB, Wilson PWF, Castelli WP. Leisure time physicalactivity in the Framingham Offspring Study: description, seasonal variation,and risk factor correlates.Am J Epidemiol. 1989;129:76–87.
58. Wood PD, Haskell WL, Klein H, Lewis S, Stern MP, Farquhar JW. Thedistribution of plasma lipoproteins in middle-aged male runners.Metab-olism. 1976;25:1249–1257.
59. Gordon T, Garcia-Palmieri MR, Kagan A, Kannel WB, Schiffman J.Differences in coronary heart disease in Framingham, Honolulu andPuerto Rico.J Chronic Dis. 1974;27:329–344.
60. McGee D, T Gordon.The Framingham Study applied to four other U. S.based epidemiological studies of cardiovascular disease (Section No. 31).Bethesda, Md: US Department of Health, Education, and Welfare, NIH;1976:76–1083.
61. Brand RJ, Rosenman RH, Scholtz RI. Multivariate prediction of coronaryheart disease in the Western Collaborative Group Study compared to thefindings of the Framingham Study.Circulation. 1976;53:348–355.
62. Leaverton PE, Sorlie PD, Kleinman JC, Dannenberg AL, Ingster-MooreL, Kannel WB, Cornoni-Huntley JC. Representativeness of the Fram-ingham risk model for coronary heart disease mortality: a comparisonwith a national cohort study.J Chronic Dis. 1987;40:775–784.
63. The Multiple Risk Factor Intervention Trial Group. Statistical designconsiderations in the NHLI multiple risk factor intervention trial(MRFIT). J Chronic Dis. 1977;30:261–275.
64. Ramsay LE, Haq IU, Jackson PR, Yeo WW, Pickin DM, Payne JN.Targeting lipid-lowering drug therapy for primary prevention of coronarydisease: an updated Sheffield table.Lancet. 1996;348:387–388.
65. West of Scotland Coronary Prevention Group. West of Scotland CoronaryPrevention Study: identification of high-risk groups and comparison withother cardiovascular intervention trials.Lancet. 1996;348:1339–1342.
66. Kinosian B, Glick H, Garland G. Cholesterol and coronary heart disease:predicting risks by levels and ratios.Ann Intern Med. 1994;121:641–647.
Wilson et al May 12, 1998 1847
at Rijksuniversiteit Leiden on August 21, 2013http://circ.ahajournals.org/Downloaded from