Embed Size (px)
Citation preview
DEPARTMENT OF INFORMATION SCIENCE AND ENGINEERING
A PROJECT REPORT ON
“PREDICTION OF DIABETES USING LOGISTIC REGRESSION”
Submitted in the partial fulfillment of the requirements in the 8th semester of
BACHELOR OF ENGINEERING
IN
INFORMATION SCIENCE AND ENGINEERING
By
MADUKARA 1NH15IS057
Under the guidance of
Mrs. K. K. KAVITHA Assistant Professor
Dept. of ISE, NHCE
DEPARTMENT OF INFORMATION SCIENCE AND ENGINEERING
CERTIFICATE
Certified that the project work entitled “Prediction of Diabetes using logistic
Regression”, carried out by Mr.Madukara-1NH15IS057 bonafide students of NEW HORIZON
COLLEGE OF ENGINEERING, Bengaluru,in partial fulfillment for the award of Bachelor of
Engineering in Information Science and Engineering of the Visveswaraya Technological
University, Belgaum during the year 2018-19.It is certified that all corrections/suggestions
indicated for Internal Assessment have been incorporated in the Report deposited in the
departmental library.
The project report has been approved as it satisfies the academic requirements in respect of
Project work prescribed for the said Degree.
-------------------------------- --------------------------------- -----------------------------------
Prof. K. K. Kavitha Dr. R J Anandhi Dr. Manjunatha
Internal Guide HOD, Dept. of ISE Principal, NHCE
External Viva
Name of the Examiners Signature with Date
1. ______________________
2.

DEPARTMENT OF INFORMATION SCIENCE AND ENGINEERING
DECLARATION
I hereby declare that I have followed the guidelines provided by the Institution in
preparing the project report and presented report of project titled “Diabetes
Prediction”, andis uniquely prepared by me after the completion of the project
work. I also confirm that the report is only prepared for my academic requirement
and the results embodied in this report have not been submitted to any other
University or Institution for the award of any degree.
Signature of the Student Name: Madukara
USN: 1NH15IS057

i
ABSTRACT
Diabetes is a disease caused due to the increase level of blood glucose. Diabetes is a chronic
disease with the potential to cause a worldwide health care crisis. According to International
Diabetes Federation 382 million people are living with diabetes across the whole world. By
2035, this will be doubled as 592 million. Various traditional methods, based on physical and
chemical tests, are available for diagnosing diabetes. However, early prediction of diabetes is
quite challenging task for medical practitioners due to complex interdependence on various
factors as diabetes affects human organs such as kidney, eye, heart, nerves, foot etc. Data
science methods have the potential to benefit other scientific fields by shedding new light on
common questions. One such task is to help make predictions on medical data. Machine
learning is an emerging scientific field in data science dealing with the ways in which machines
learn from experience. The aim of this project is to develop a system which can perform early
prediction of diabetes for a patient with a higher accuracy by combining the results of machine
learning technique. This project aims to predict diabetes via supervised machine learning
methods Logistic regression. This project also aims to propose an effective technique for earlier
detection of the diabetes disease.

ii
ACKNOWLEDGEMENT
Any achievement, be it scholastic or otherwise does not depend solely on the individual efforts
but on the guidance, encouragement and cooperation of intellectuals, elders and friends. A
number of personalities, in their own capacities have helped me in carrying out this project. I
would like to take an opportunity to thank them all.
First and foremost I thank the management, Dr. Mohan Manghnani, Chairman, New Horizon
Educational Institutions for providing us the opportunity to do internship.
I would like to thank Dr.Manjunatha, Principal, New Horizon College of Engineering,
Bengaluru, for his constant encouragement and support extended to us towards completing my
internship.
I extend my sincere gratitude to Dr. R J Anandhi, Head of the Department, Information Science
and Engineering, New Horizon College of Engineering, Bengaluru for her valuable suggestions
and expert advice.
I deeply express my sincere gratitude to my guide Mrs. K. K. Kavitha, Assistant Professor,
Department of ISE, NHCE, Bengaluru, for his able guidance, regular source of encouragement
and assistance throughout my internship period.
Last, but not the least, I would like to thank my peers and friends who provided me with valuable
suggestions to improve my project.
Madukara
(1NH15IS057)
iii
TABLE OF CONTENTS
Abstract i
Acknowledgement ii
Table of Contents iii
List of Figures v
1. Preamble 1
1.1 Introduction 1
1.2 Relevance of the Project 3
1.3 Purpose 3
1.4 Scope of the Project 4
1.5 Problem Statement and Definition 4
1.6 Objective of study 5
1.7 Existing System 6
1.8 Proposed system 6
2. Literature Survey 8
3. System Requirements and specifications 13
3.1 General Description of the system 13
3.1.1 Overview of Functional requirements 13
3.1.2 Overview of Data requirements 15
3.2 Technical Requirements of the System 17
3.2.1 Hardware Requirements 17
3.2.2 Software Requirements 17
iv
3.3 Language specification 17
3.3.1 Python 17
3.3.2 Machine Learning Features 18 3. 3. 3 Logistic Regression 19
4. System Design and Analysis 21
4.1 Preliminary Design 21
4.2 System Architecture 22
4.3 Data Flow Diagram 23
4.3.1 DFD for Data Extraction 24
4.3.2 DFD for Classification of Data 24
4.3 Use Case Diagram 25
5. Implementation 26
5.1 Different modules of the project 31
5.2 Flow Chart Of The Proposed System 32
6. Experimental Results 33
6.1 Outcomes of the Proposed System 33
7. Testing 34
7.1 Testing and Validations 34
7.2 Testing Levels 31
7.2.1 Functional Testing 35
7.2.2 Non-Functional Testing 35
7.3 White Box Testing 37
7.4 Different Stages of Testing 38
7.4.1 Unit Testing 38
7.4.2 Integration Testing 40
7.4.3 System Testing 41
7.4.4 Acceptance Testing 41
8. Conclusion and Future Enhancement 42
8.1 Conclusion 42
v
LIST OF FIGURES
Figure no Figure Name Page no
Figure 1.1 Predicting Diabetes Using Machine Learning
1
Figure 1.2 Representation of Diabetes Level Checking
2
Figure 3.1 Training and test set 14
Figure 4.1 Preliminary design of Diabetes Prediction system
21
Figure 4.2 Architecture of Diabetes Prediction System
22
Figure 4.3 Data Flow Diagram 23
Figure 4.4 DFD for Data Extraction 24
Figure 4.5 DFD for Classification of Data 24
Figure 4.6 Use Case Diagram 25
Figure 5.1 Confusion matrix 27
Figure 5.2 ndarray 29
Figure 5.3 Dataset 31
Figure 5.2 Flowchart of the proposed system
32
Figure 6.1 Data distribution 33
Figure 7.1 Non-Functional Testing 36

vi
Diabetes Prediction
Dept of ISE, NHCE Page 1
Chapter 1
Preamble
Diabetes is one of the deadliest diseases in the world. It is not only a disease but also
a creator of kinds of diseases like heart attack , blindness, kidney diseases etc. The
normal identifying process is that patients needs to visit a diagnostic center, consult
their doctor, and sit for a day or more to get their reports. But with the rise of
Machine Learning approaches we have the ability to find a solution to this issue.
1.1 Introduction
Diabetes mellitus is an endless infection portrayed by hyperglycemia. It might cause
numerous inconveniences. As per the developing bleakness as of late, in 2040, the
world's diabetic patients will achieve 642 million, which implies that one of the ten
grown-ups later on is experiencing diabetes. There is no uncertainty this disturbing
figure needs extraordinary consideration. World Health Organization has assessed 12
million passings happen around the world, consistently because of Heart maladies. A
large portion of the passings in the United States and other created nations are
expected to cardio vascular maladies. The early visualization of cardiovascular
sicknesses can help in settling on choices on way of life changes in high hazard
patients and thus decrease the intricacies. This exploration means to pinpoint the
most significant/hazard elements of coronary illness just as anticipate the general
hazard utilizing calculated relapse. Machine Learning has been connected to
numerous parts of medicinal wellbeing. In this project, we utilized Logistic regression
to anticipate diabetes mellitus.
Figure 1.1 : Predicting Diabetes Using Machine Learning
Diabetes Prediction
Dept of ISE, NHCE Page 2
The dataset is originally from the National Institute of Diabetes and Digestive and
Kidney Diseases. The objective of the dataset is to diagnostically predict whether or
not a patient has diabetes, based on certain diagnostic measurements included in
the dataset.
Several constraints were placed on the selection of these instances from a larger
database. In particular, all patients here are females at least 21 years old of Pima
Indian heritage.
The datasets consist of several medical predictor (independent) variables and one
target (dependent) variable, Outcome. Independent variables include the number of
pregnancies the patient has had, their BMI, insulin level, age, and so on.
Proposed model is to anticipate diabetes that specialists can be valuable as a model
to help foresee diabetes. In this examination, analyzed the connection between
difficulties in diabetic patients and their properties, for example, blood glucose,
circulatory strain, tallness, weight, and hemoglobin and weight record of the
patients. The point of this examination is to foresee confusions dependent on their
manifestations.
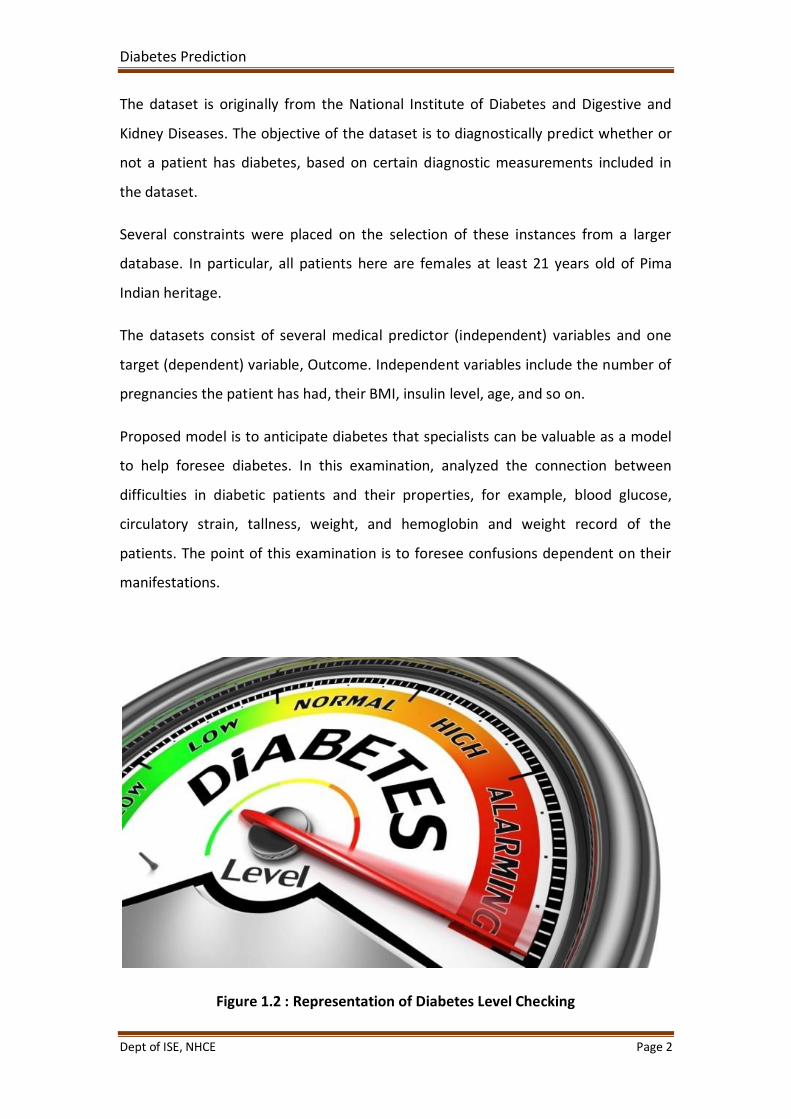
Figure 1.2 : Representation of Diabetes Level Checking
Diabetes Prediction
Dept of ISE, NHCE Page 3
The above figure 1.2 shows how the diabetes level will be checked and gives the
alert upon increase in the level of diabetes.
1.2 Relevance of the Project
In recent years, using Machine Learning has been used with increasing frequency to
predict the possibility of disease. Many algorithms and toolkits have been created
and studied by researchers. These have highlighted the tremendous potential of
this research field.
Based on several studies, we found that a commonly used dataset was the Pima
Indians Diabetes Dataset from the University of California, Irvine (UCI) Machine
Learning Database. In this project logistic regression aimed at validating a chosen
class label of given data and aimed at building the final classifier model. All the
studies presented above used the same Pima Indians Diabetes Dataset as the
experimental material.
1.3 Purpose
Large amount of data has been continuously generated in field of engineering and
science. Recent advances in technology have resulted in big electronic data that
allow data to be captured, processed, analyzed and stored rather inexpensively.
This change leads to new trends in market as well as industry such as Internet
banking and e-commerce, insurance, financial transactions, supermarket, healthcare,
communications, location of data that generate huge amount of electronic data. The
need to understand huge, complex, information rich data sets is important to
virtually all fields in business, science, engineering and medical. The data used in
data warehouses and data marts has been extracted from knowledge hidden in that
data. This knowledge is becoming vital in today’s increasingly competitive world. The
greatest problem of today is how to teach people to ignore the irrelevant data.
With the rise of Machine Learning approaches we have the ability to find a solution
diabetes prediction, we have developed a system using machine learning which has
the ability to predict whether the patient has diabetes or not. Furthermore,
Diabetes Prediction
Dept of ISE, NHCE Page 4
predicting the disease early leads to treating the patients before it becomes critical.
Machine Learning has the ability to extract hidden knowledge from a huge amount
of diabetes-related data. Because of that, it has a significant role in diabetes
research, now more than ever. The aim of this research is to develop a system which
can predict the diabetic risk level of a patient with a higher accuracy. This research
has focused on developing a system based on logistic regression.
1.4 Scope of the Project
The early intervention of diabetes can reduce the prevalence of diabetes and hence
the economic burden due to it. Machine Learning techniques play an important role
in treatment plan workout, rehabilitation, chronic diseases management plan etc.
Long term follow up plan may be easily guided and keen supervision is possible. The
systems may definitely helpful in reduction of cost of patient management by
avoiding unnecessary investigations and patients follow up. These prediction
systems will add accuracy and time management. Computer-based patient support
systems benefit patients by providing informational support that increases their
participation in health care.
1.5 Problem Statement and Definition
To identify whether a given person in dataset will be diabetic, non diabetic or pre-
diabetic will be done on basis of attribute values. Values exceeding a specific value
may contribute to identify whether a person is diabetic, non diabetic or pre-diabetic.
The aim of prediction of diabetes is to make aware people about diabetes and what
it takes to treat it and gives the power to control.
The model can be used by the endocrinologists, dietitians, ophthalmologists and
podiatrists to predict if or if not the patient is likely to suffer from diabetes, if yes,
how intense it could be.
The dataset consists of features comprising the medical details of the patients that
are useful in determining the health condition of the patient.
Goals of the System:-
Diabetes Prediction
Dept of ISE, NHCE Page 5
Convert manual to computerize. Before this, majority of the process is done
manually. After converting it to computerize it will be easy to predict.
By computerizing, it is easier to understand the doctor's report which is hardly
understood with different and complicated handwriting.
Easy to maintain record.
Enable to predict various type of diabetes.
Ensure the system useful to doctor and patient.
1.6 Objective of the study
Easy to use: The primary objective of this assignment is to broaden a
platform so as to be simple and smooth to apply, as right here one have to
provide the patient’s scientific details and primarily based on the features
extracted the algorithm will then discover diabetes and its type. As right here
set of rules does the task hence a well trained version is much less certain to
make errors in predicting diabetes and its type consequently, in short
accuracy is advanced and thereby it additionally saves time and makes
simpler for doctors in addition to sufferers to expect whether or not they
may be vulnerable to any type of diabetes or not, that is otherwise we
difficult to do without health practitioner’s involvement.
No human intervention required: To predict diabetes one must provide
scientific details which includes age, BMI, and so on. And right here the set of
rules will offer the effects based on the capabilities extracted and
consequently here probabilities of mistakes been made are very minimal
given that there is no human intervention and it also saves lot of time for the
sufferers or doctors and they could similarly continue for treatments or
different tactics should quicker. This is in case whilst consequences are
provided quicker to them. This can in-turn make the precaution/prevention
for diabetes faster while it saves medical doctors and affected person the
essential time, to be able to cross on to in addition treatments and
precautions to be taken to minimize the effect of that diabetes.
Diabetes Prediction
Dept of ISE, NHCE Page 6
Not simplest hit upon the diabetes kind but additionally suggest precautions:
In this mission our goal isn't only to find and are expecting the kind of
diabetes but pin point towards the precautions to be taken to minimize the
impact of the diabetes. Getting hints on precautions to be taken will help the
doctors and sufferers to progress without problems to similarly steps of their
treatment.
1.7 Existing system
The healthcare enterprise collects big quantities of healthcare facts which, unluckily,
are not “mined” to find out hidden information. Clinical decisions are frequently
made based totally on docs‟ intuition and enjoy instead of at the knowledge wealthy
statistics hidden in the database. This exercise ends in unwanted biases, errors and
excessive medical. The existing process is very slow to give the result. It is very
difficult to find diabetes or not.
1.8 Proposed system
Diabetes prediction is an internet-primarily based device gaining knowledge of
utility, skilled through a Pima Indian dataset. The person inputs its particular clinical
information to get the prediction of diabetes. The set of rules will calculate the
opportunity of presence of diabetes. Thus, minimizing the price and time required to
are expecting the disorder. Format of statistics plays essential element on this
software. At the time of uploading the user information utility will take a look at its
right record format and if it no longer as consistent with want then ERROR dialog box
may be induced. Our device might be implementing the algorithm: Logistic
Regression. The algorithms may be educated the use of the statistics set obtained
from University of California, Irvine. 75% of the entries in the statistics set can be
used for education and the last 25% for testing the accuracy of the set of rules.
Furthermore, a few steps can be taken for optimizing the algorithms thereby
enhancing the accuracy.
Advantages of the system:-
Diabetes Prediction
Dept of ISE, NHCE Page 7
Our proposed System has the following benefits:
Powerful, flexible, and easy to use.
Increased efficiency of doctor.
Improved patient satisfaction.
Reduce the use of papers.
Simple and Quick.
More accurate result.
Diabetes Prediction
Dept of ISE, NHCE Page 8
Chapter 2
Literature Survey
The Pima Indians are genetically predisposed to diabetes, and it was noted that
their diabetic rate was 19 times that of a typical town in Minnesota. The National
Institute of Diabetes and Digestive and kidney Disease of the National Institute
of Health (NIH) originally owned the Pima Indian diabetes Database (PIDD) [18].
The number of patients (n) in the database n=768 each with 9 attribute variables.
Out of the nine conditional attributes, six are due to physical examination rest of the
attributes are chemical examination. Of these 9 attributes, there are eight inputs
and last one being the output. The goal is to use the first 8 variables to predict
attribute values of the 9th variables.
The aim is to be development of a hybrid model for classifying Pima Indian
Diabetic Database. The datasets were identified and the incorrectly classified
instances were eliminated using K-means clustering. Then using decision Tree
classifier the classification is done on these correctly clustered instances. The
resultant dataset is used to train and test the diabetic data set using two method
dividing training data and test data using 60- q40 ratio and 10 fold cross
Validation method. Experimental results show the improvement in accuracy of
diabetic data set using proposed cascaded method: k-means with decision tree by
an order of 19.50% of classification compared to decision tree alone with
unprocessed data.
Weka is popular machine learning software developed in Java at University of
Waikato, New Zealand. It is open source software available at GNU (General Public
License). It consists of visualization tools and algorithms which are used in data
analysis and predictive modeling with graphical user interface for easy
functionality access. Weka supports several data mining tasks such as data pre-
processing, clustering, regression, visualization and feature selection. The
attributes available in Weka are of one of these types Nominal: one of predefined
Diabetes Prediction
Dept of ISE, NHCE Page 9
list of values, Numeric: A real or integer number, String, Date, Relational. Key
features of this tool are open source and platform independent. This consists of
various algorithm for data mining and machine learning.
Diabetes a non-communicable disease is leading to long-term complications and
serious health problems. A report from the World Health Organisation addresses
diabetes and its complications that impact on individual physically, financially,
economically over the families. The survey says about 1.2 million deaths due to the
uncontrolled stage of health lead to death. About 2.2 million deaths occurred due to
the risk factors of diabetes like a cardiovascular and other diseases.
Diabetes is an ailment caused due to the extended level of sugar obsession in the
blood. In this paper, discussed various classifiers, decision support system is
proposed that uses the AdaBoost algorithm with Decision Stump as a base classifier
for classification. Moreover, Support Vector Machine, Naive Bayes and Decision Tree
have additionally executed as a base classifiers for AdaBoost calculation for
exactness confirmation. The exactness got for AdaBoost calculation with choices
stump as a base classifier is 80.72%, which is more note worthy contrasted with that
of Support Vector Machine, Naive Bayes and Decision Tree.
Artificial intelligence is having more effect is machine realizing, which creates
calculations ready to take in examples and choice standards from information.
Machine learning calculations have been implanted into information mining
pipelines, which can consolidate them with established measurable techniques, to
remove learning from information. Inside the EU-financed MOSAIC undertaking, an
information mining pipeline has been utilized to determine an arrangement of
prescient models of sort 2 diabetes mellitus (T2DM) entanglements in light of
electronic wellbeing record information of almost one thousand patients. Such
pipeline includes clinical focus profiling, prescient model focusing on, prescient
model development and model approval. In the wake of having managed to miss
information by methods for irregular woods (RF) and having connected appropriate
methodologies to deal with class unevenness, we have utilized Logistic Regression
Diabetes Prediction
Dept of ISE, NHCE Page 10
with the stepwise component choice to foresee the beginning of retinopathy,
neuropathy, or nephropathy, at various time situations, at 3, 5, and 7 years from the
main visit at the Hospital Center for Diabetes (not from the conclusion). Considered
factors are sexual orientation, age, time of determination, weight file (BMI), glycated
haemoglobin (HbA1c), hypertension, and smoking propensity. Lust models, custom
fitted as per the complexities, gave an exact up to 0.838. Diverse factors were
chosen for every complexity and time situation, prompting particular models simple
to mean the clinical practice.
In this paper, analysis of a Pima Indian dataset is done using various classification
techniques like Naïve Bayes, Zero R, J48, random forest, MLP, logistic regression.
Comparison and prediction whether positive and negative diabetes. Diagnosing
diabetes through data mining tool using the WEKA tool, in terms of accuracy and
performance MLP is better.
Patients with diabetes should ceaselessly screen their blood glucose levels and
modify insulin measurements, endeavouring to keep blood glucose levels as near
typical as would be prudent. Blood glucose levels that veer off from the typical range
can prompt genuine here and now and long-haul intricacies. A programmed
expectation shows that cautioned individuals of fast approaching changes in their
blood glucose levels would empower them to make a preventive move. In this paper,
we depict an answer that uses a bland physiological model of blood glucose
progression to produce enlightening highlights for a support vector regression
display that is prepared with tolerant particular information. The new model beats
diabetes specialists at foreseeing blood glucose levels and could be utilized to
envision right around a fourth of hypoglycaemic occasions 30 min ahead of time. In
spite of the fact that the comparing exactness is right now only 42%, most false
cautions are in close hypoglycaemic locales and hence patients reacting to these
hypoglycaemia alarms would not be hurt by intercession.
Diabetes mellitus is a standout amongst the most genuine wellbeing challenges in
both creating and created nations. As per the International Diabetes Federation,
Diabetes Prediction
Dept of ISE, NHCE Page 11
there are 285 million diabetic individuals around the world. This aggregate is relied
upon to ascend to 380 million in 20 years. Because of its significance, an outline of a
classifier for the recognition of Diabetes ailment with ideal cost and better execution
is the need of the age. The Pima Indian diabetic database at the UCI machine
learning research facility has turned into a standard for testing information mining
calculations to see their expectation exactness in diabetes information arrangement.
The proposed strategy utilizes SVM, a machine learning technique as the classifier
for analysis of diabetes. The machine learning strategy centre around arranging
diabetes illness from a high dimensional therapeutic dataset. The trial comes about
got demonstrate that help vector machine can be effectively utilized for diagnosing
diabetes illness.
The point of this examination is to the finding of diabetes illness, which is a standout
amongst the most vital infections in the restorative field utilizing Generalized
Discriminant Analysis (GDA) and Least Square Support Vector Machine (LS-SVM).
Likewise, we proposed another course learning framework in light of Generalized
Discriminant Analysis and Least Square Support Vector Machine. The proposed
framework comprises of two phases. The primary stage, we have utilized
Generalized Discriminant Analysis to discriminant highlight factors amongst sound
and patient (diabetes) information as a pre-preparing process. The second stage, we
have utilized LS-SVM so as to order of diabetes dataset. While LS-SVM acquired
78.21% grouping precision utilizing 10-overlap. cross approval, the proposed
framework called GDA–LS-SVM got 82.05% order exactness utilizing 10-crease across
approval. The heartiness of the proposed framework is inspected utilizing
arrangement precision, k-crease cross-approval technique and disarray lattice. The
acquired order exactness is 82.05% and it is exceptionally encouraging contrasted
with the beforehand detailed grouping strategies.
A proper and thorough literature survey concludes that there are various methods
that can be used to predict diabetes. Some of these approaches are:
Artificial Neural Network

Diabetes Prediction
Dept of ISE, NHCE Page 12
Bayesian Network
Neural Network
Hidden Markov Method
Genetic Algorithm
Diabetes Prediction
Dept of ISE, NHCE Page 13
Chapter 3
System Requirements and specifications
The System Requirements Specification document describes all data, functional and
behavioral requirements of the software under production or development. A
functional requirement document defines the functionality of a system or one of its
subsystems. It also depends upon the type of software, expected users and the type
of system where the software is used. Non-functional requirement is
a requirement that specifies criteria that can be used to judge the operation of a
system, rather than specific behaviors.
3.1 General Description of the System
3.1.1 Overview of Functional requirements
Preprocess Data
Data Preprocessing is a technique that is used to convert the raw data into a clean
data set. In other words, whenever the data is gathered from different sources it is
collected in raw format which is not feasible for the analysis.
Therefore, certain steps are executed to convert the data into a small clean data set.
This technique is performed before the execution of Iterative Analysis. The set of
steps is known as Data Preprocessing. It includes
Data Cleaning
Data Integration
Data Transformation
Data Reduction
Data Preprocessing is necessary because of the presence of unformatted real-world
data. Mostly real-world data is composed of –
Diabetes Prediction
Dept of ISE, NHCE Page 14
Inaccurate data (missing data) - There are many reasons for missing data such as
data is not continuously collected, a mistake in data entry, technical problems with
biometrics and much more.
The presence of noisy data (erroneous data and outliers) - The reasons for the
existence of noisy data could be a technological problem of gadget that gathers data,
a human mistake during data entry and much more.
Inconsistent data - The presence of inconsistencies are due to the reasons such that
existence of duplication within data, human data entry, containing mistakes in codes
or names, i.e., violation of data constraints and much more.
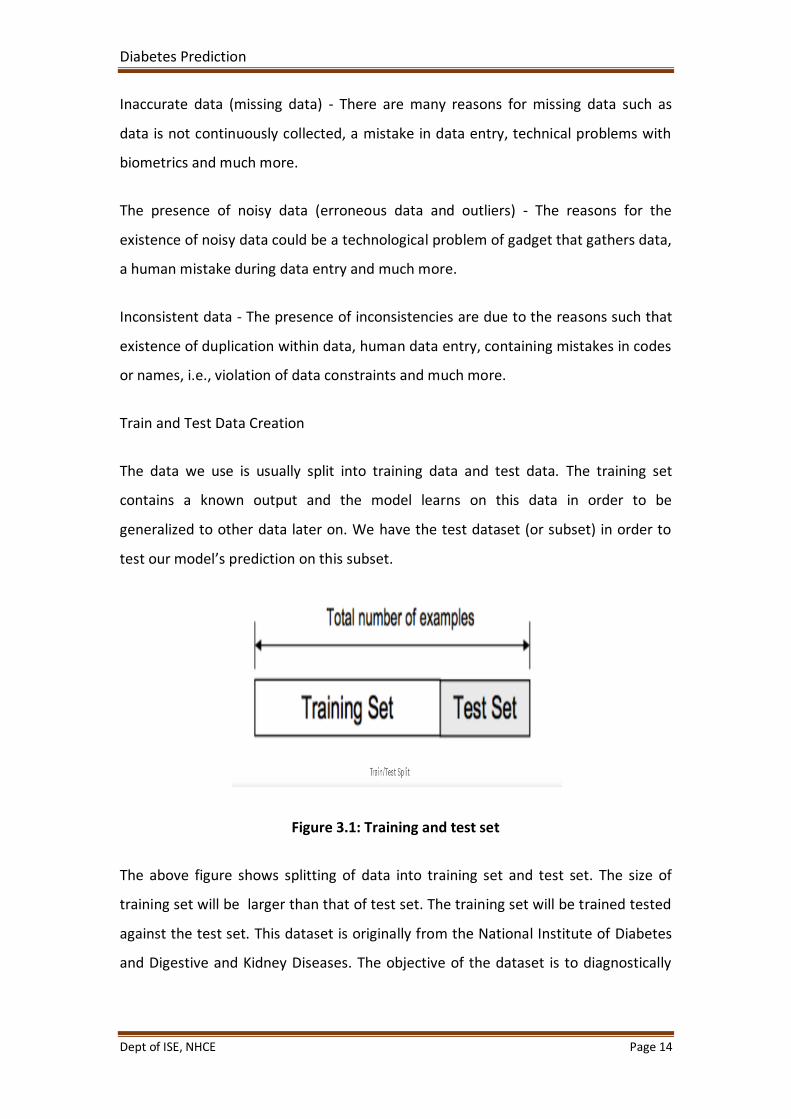
Train and Test Data Creation
The data we use is usually split into training data and test data. The training set
contains a known output and the model learns on this data in order to be
generalized to other data later on. We have the test dataset (or subset) in order to
test our model’s prediction on this subset.
Figure 3.1: Training and test set
The above figure shows splitting of data into training set and test set. The size of
training set will be larger than that of test set. The training set will be trained tested
against the test set. This dataset is originally from the National Institute of Diabetes
and Digestive and Kidney Diseases. The objective of the dataset is to diagnostically
Diabetes Prediction
Dept of ISE, NHCE Page 15
predict whether or not a patient has diabetes, based on certain diagnostic
measurements included in the dataset.
Model Creation
The process of training an ML model involves providing an ML algorithm (that
is, the learning algorithm) with training data to learn from. The term ML
model refers to the model artifact that is created by the training process.
The training data must contain the correct answer, which is known as a target
or target attribute. The learning algorithm finds patterns in the training data
that map the input data attributes to the target (the answer that you want to
predict), and it outputs an ML model that captures these patterns.
You can use the ML model to get predictions on new data for which you do
not know the target. For example, let's say that you want to train an ML
model to predict if an email is spam or not spam. You would provide training
data that contains emails for which you know the target. Machine would
train an ML model by using this data, resulting in a model that attempts to
predict diabetes or not.
In our project we are using Logistic Regression to build our Model on Pima
Indian Dataset.
Result Analysis:
In this final phase, we will test our model on our prepared dataset and also measure
the Diabetes prediction performance on our dataset. To evaluate the performance of
our created classification and make it comparable to current approaches, we use
Accuracy to measure the effectiveness of classifiers.
3.1.2 Overview of Data requirements
Reliability
The structure must be reliable and strong in giving the functionalities. The
movements must be made unmistakable by the structure when a customer
Diabetes Prediction
Dept of ISE, NHCE Page 16
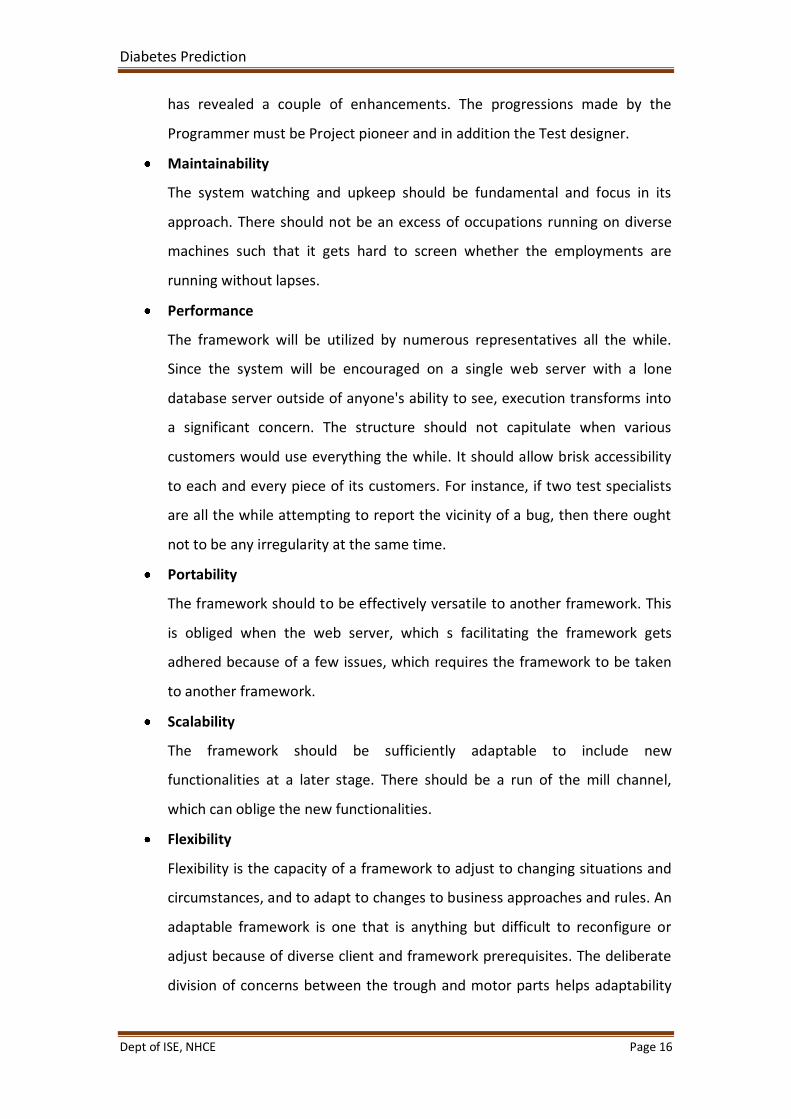
has revealed a couple of enhancements. The progressions made by the
Programmer must be Project pioneer and in addition the Test designer.
Maintainability
The system watching and upkeep should be fundamental and focus in its
approach. There should not be an excess of occupations running on diverse
machines such that it gets hard to screen whether the employments are
running without lapses.
Performance
The framework will be utilized by numerous representatives all the while.
Since the system will be encouraged on a single web server with a lone
database server outside of anyone's ability to see, execution transforms into
a significant concern. The structure should not capitulate when various
customers would use everything the while. It should allow brisk accessibility
to each and every piece of its customers. For instance, if two test specialists
are all the while attempting to report the vicinity of a bug, then there ought
not to be any irregularity at the same time.
Portability
The framework should to be effectively versatile to another framework. This
is obliged when the web server, which s facilitating the framework gets
adhered because of a few issues, which requires the framework to be taken
to another framework.
Scalability
The framework should be sufficiently adaptable to include new
functionalities at a later stage. There should be a run of the mill channel,
which can oblige the new functionalities.
Flexibility
Flexibility is the capacity of a framework to adjust to changing situations and
circumstances, and to adapt to changes to business approaches and rules. An
adaptable framework is one that is anything but difficult to reconfigure or
adjust because of diverse client and framework prerequisites. The deliberate
division of concerns between the trough and motor parts helps adaptability
Diabetes Prediction
Dept of ISE, NHCE Page 17
as just a little bit of the framework is influenced when strategies or principles
change.
3.2 Technical Requirements of the System
3.2.1 Hardware Requirements
System Processor : Core i3.
Hard Disk : 500 GB.
Ram : 4 GB.
Any desktop / Laptop system with above configuration or higher level.
3.2.2 Software Requirements
Operating system : Windows 8 / 10
Programming Language : Python
DL Libraries : Numpy, Pandas
3.3 Language specification
3.3.1 Python
Python is an easy to learn, powerful programming language. It has efficient high-
level data structures and a simple but effective approach to object-oriented
programming. Python’s elegant syntax and dynamic typing, together with its
interpreted nature, make it an ideal language for scripting and rapid application
development in many areas on most platforms.
The Python interpreter and the extensive standard library are freely available in
source or binary form for all major platforms from the Python Web
site, https://www.python.org/, and may be freely distributed. The same site also
Diabetes Prediction
Dept of ISE, NHCE Page 18
contains distributions of and pointers to many free third party Python modules,
programs and tools, and additional documentation.
The Python interpreter is easily extended with new functions and data types
implemented in C or C++ (or other languages callable from C). Python is also suitable
as an extension language for customizable applications.
Python is a high-level, interpreted, interactive and object-oriented scripting
language. Python is designed to be highly readable. It uses English keywords
frequently where as other languages use punctuation, and it has fewer syntactical
constructions than other languages.
Python is Interpreted − Python is processed at runtime by the interpreter.
You do not need to compile your program before executing it. This is similar
to PERL and PHP.
Python is Interactive − you can actually sit at a Python prompt and interact
with the interpreter directly to write your programs.
Python is Object-Oriented − Python supports Object-Oriented style or
technique of programming that encapsulates code within objects.
Python is a Beginner's Language − Python is a great language for the
beginner-level programmers and supports the development of a wide range
of applications from simple text processing to WWW browsers to games.
3.3.2 Machine Learning Features
Machine Learning is a method of statistical learning where each instance in a
dataset is described by a set of features or attributes. In contrast, the term “Deep
Learning” is a method of statistical learning that extracts features or attributes from
raw data. Deep Learning does this by utilizing neural networks with many hidden
layers, big data, and powerful computational resources. The terms seem somewhat
interchangeable, however, with Deep Learning method, The algorithm constructs
representations of the data automatically. In contrast, data representations are
Diabetes Prediction
Dept of ISE, NHCE Page 19
hard-coded as a set of features in machine learning algorithms, requiring further
processes such as feature selection and extraction, (such as PCA).
Both of these terms are in dramatic contrast with another class of classical artificial
intelligence algorithms known as Rule-Based Systems where each decision is
manually programmed in such a way that it resembles a statistical model.
In Machine Learning and Deep Learning, there are many different models that fall
into two different categories, supervised and unsupervised. In unsupervised
learning, algorithms such as k-Means, hierarchical clustering, and Gaussian mixture
models attempt to learn meaningful structures in the data. Supervised learning
involves an output label associated with each instance in the dataset. This output
can be discrete/categorical or real-valued. Regression models estimate real-valued
outputs, whereas classification models estimate discrete-valued outputs. Simple
binary classification models have just two output labels, 1 (positive) and 0 (negative).
Some popular supervised learning algorithms that are considered Machine Learning:
are linear regression, logistic regression, decision trees, support vector machines,
and neural networks, as well as non-parametric models such as k-Nearest Neighbors.
3. 3. 3 Logistic Regression
Logistic regression is a statistical method for analysing a dataset in which there are
one or more independent variables that determine an outcome. The outcome is
measured with a dichotomous variable (in which there are only two possible
outcomes). It is used to predict a binary outcome (1 / 0, Yes / No, True / False) given a
set of independent variables. To represent binary / categorical outcome, we use
dummy variables. We can also think of logistic regression as a special case of linear
regression when the outcome variable is categorical, where we are using log of odds
as dependent variable. In simple words, it predicts the probability of occurrence of an
event by fitting data to a logit function.
Logistic regression was developed by statistician David Cox in 1958. This binary
logistic model is used to estimate the probability of a binary response based on one
or more predictor (or independent) variables (features). It allows one to say that the
Diabetes Prediction
Dept of ISE, NHCE Page 20
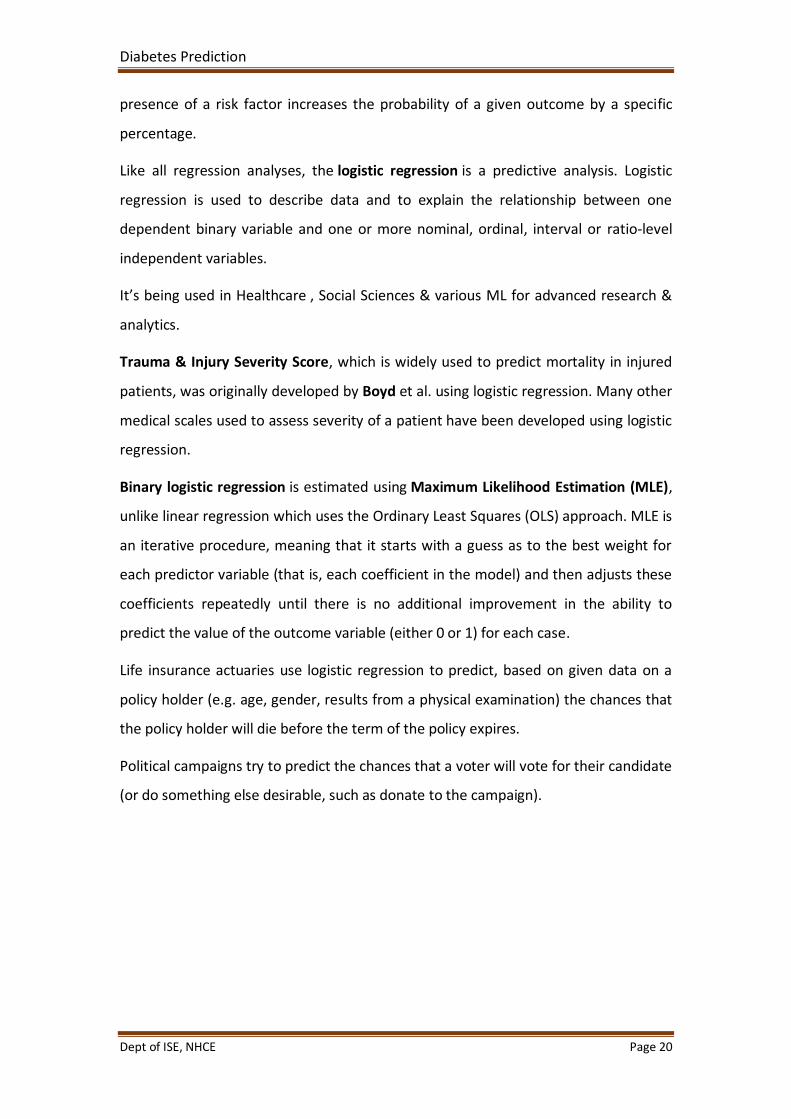
presence of a risk factor increases the probability of a given outcome by a specific
percentage.
Like all regression analyses, the logistic regression is a predictive analysis. Logistic
regression is used to describe data and to explain the relationship between one
dependent binary variable and one or more nominal, ordinal, interval or ratio-level
independent variables.
It’s being used in Healthcare , Social Sciences & various ML for advanced research &
analytics.
Trauma & Injury Severity Score, which is widely used to predict mortality in injured
patients, was originally developed by Boyd et al. using logistic regression. Many other
medical scales used to assess severity of a patient have been developed using logistic
regression.
Binary logistic regression is estimated using Maximum Likelihood Estimation (MLE),
unlike linear regression which uses the Ordinary Least Squares (OLS) approach. MLE is
an iterative procedure, meaning that it starts with a guess as to the best weight for
each predictor variable (that is, each coefficient in the model) and then adjusts these
coefficients repeatedly until there is no additional improvement in the ability to
predict the value of the outcome variable (either 0 or 1) for each case.
Life insurance actuaries use logistic regression to predict, based on given data on a
policy holder (e.g. age, gender, results from a physical examination) the chances that
the policy holder will die before the term of the policy expires.
Political campaigns try to predict the chances that a voter will vote for their candidate
(or do something else desirable, such as donate to the campaign).
Diabetes Prediction
Dept of ISE, NHCE Page 21
Chapter 4
System Design and Analysis
System Design is a process of planning a new business system or replacing an
existing system by defining its components or modules to satisfy the specific
requirements. Before planning, you need to understand the old system thoroughly
and determine how computers can best be used in order to operate efficiently.
System analysis is conducted for the purpose of studying a system or its parts in
order to identify its objectives. It is a problem solving technique that improves the
system and ensures that all the components of the system work efficiently to
accomplish their purpose.
4.1 Preliminary Design
Diabetes Prediction
Dept of ISE, NHCE Page 22
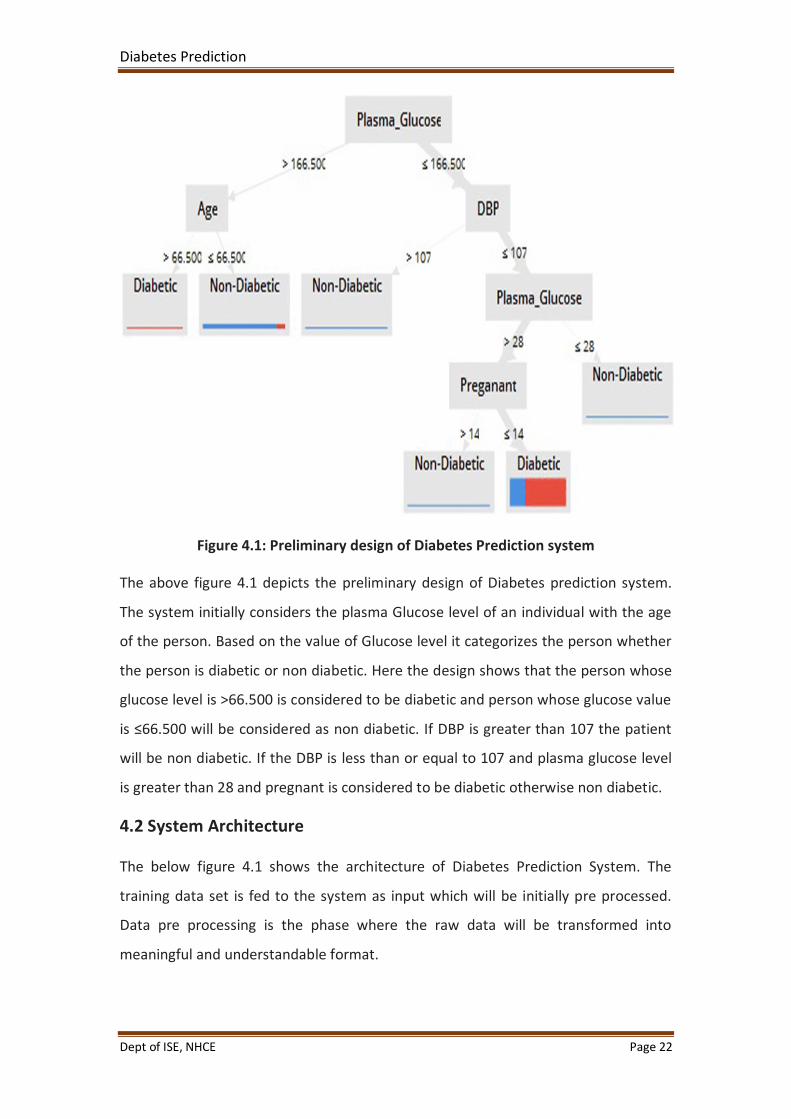
Figure 4.1: Preliminary design of Diabetes Prediction system
The above figure 4.1 depicts the preliminary design of Diabetes prediction system.
The system initially considers the plasma Glucose level of an individual with the age
of the person. Based on the value of Glucose level it categorizes the person whether
the person is diabetic or non diabetic. Here the design shows that the person whose
glucose level is >66.500 is considered to be diabetic and person whose glucose value
is ≤66.500 will be considered as non diabetic. If DBP is greater than 107 the patient
will be non diabetic. If the DBP is less than or equal to 107 and plasma glucose level
is greater than 28 and pregnant is considered to be diabetic otherwise non diabetic.
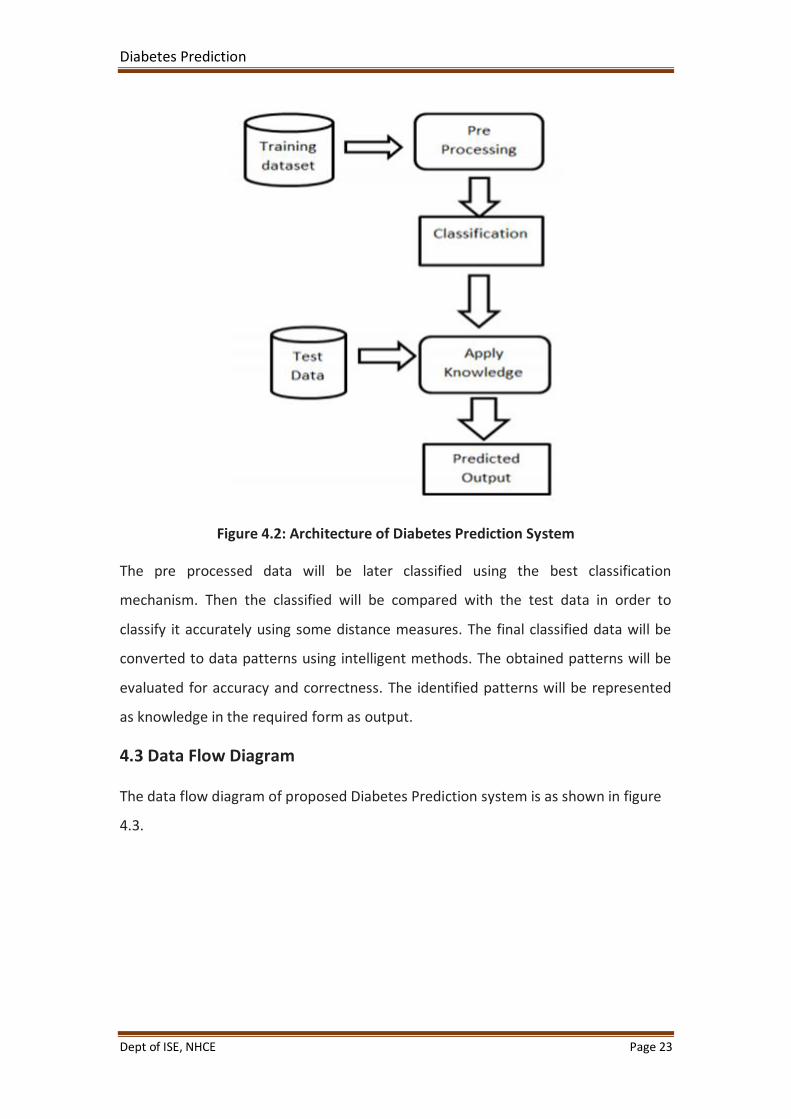
4.2 System Architecture
The below figure 4.1 shows the architecture of Diabetes Prediction System. The
training data set is fed to the system as input which will be initially pre processed.
Data pre processing is the phase where the raw data will be transformed into
meaningful and understandable format.
Diabetes Prediction
Dept of ISE, NHCE Page 23
Figure 4.2: Architecture of Diabetes Prediction System
The pre processed data will be later classified using the best classification
mechanism. Then the classified will be compared with the test data in order to
classify it accurately using some distance measures. The final classified data will be
converted to data patterns using intelligent methods. The obtained patterns will be
evaluated for accuracy and correctness. The identified patterns will be represented
as knowledge in the required form as output.
4.3 Data Flow Diagram
The data flow diagram of proposed Diabetes Prediction system is as shown in figure
4.3.
Diabetes Prediction
Dept of ISE, NHCE Page 24
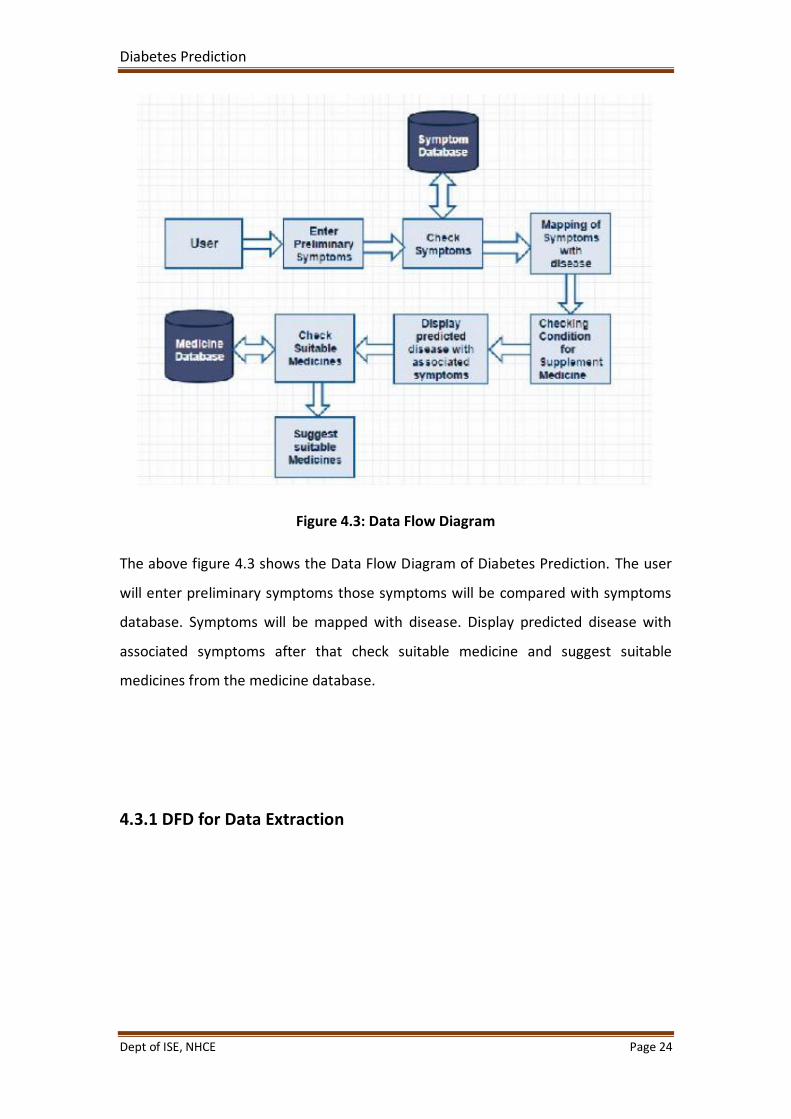
Figure 4.3: Data Flow Diagram
The above figure 4.3 shows the Data Flow Diagram of Diabetes Prediction. The user
will enter preliminary symptoms those symptoms will be compared with symptoms
database. Symptoms will be mapped with disease. Display predicted disease with
associated symptoms after that check suitable medicine and suggest suitable
medicines from the medicine database.
4.3.1 DFD for Data Extraction
Diabetes Prediction
Dept of ISE, NHCE Page 25
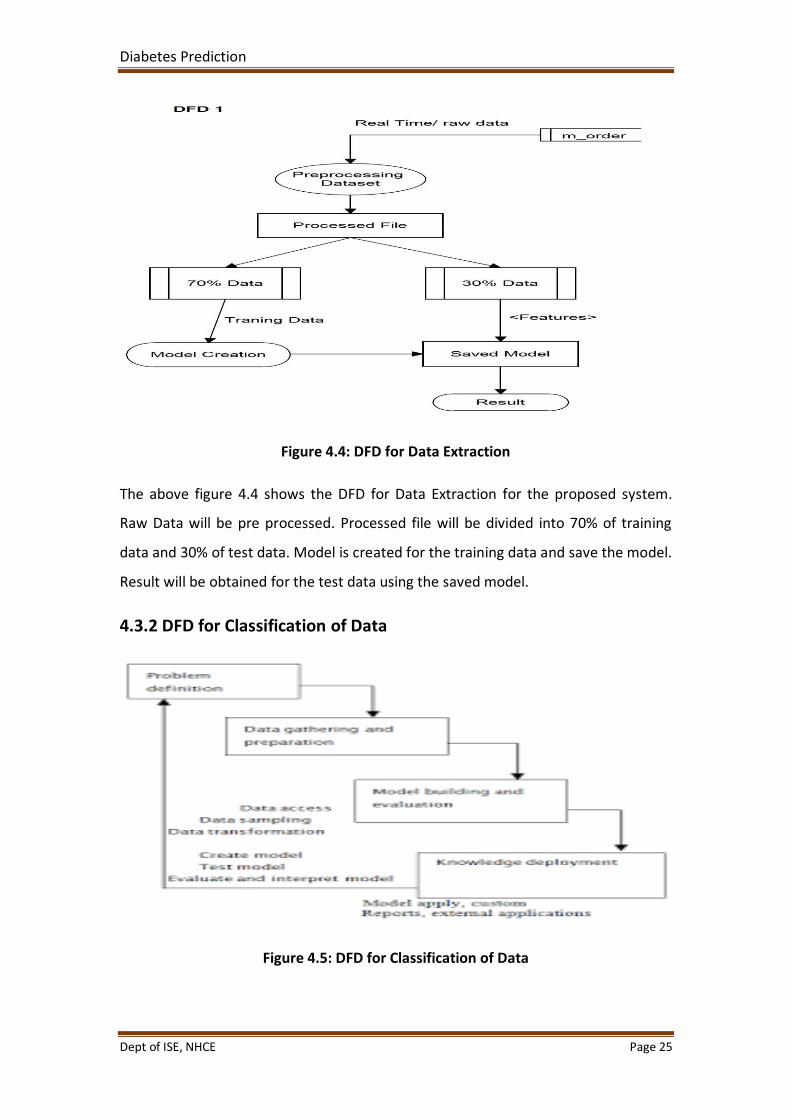
Figure 4.4: DFD for Data Extraction
The above figure 4.4 shows the DFD for Data Extraction for the proposed system.
Raw Data will be pre processed. Processed file will be divided into 70% of training
data and 30% of test data. Model is created for the training data and save the model.
Result will be obtained for the test data using the saved model.
4.3.2 DFD for Classification of Data
Figure 4.5: DFD for Classification of Data
Diabetes Prediction
Dept of ISE, NHCE Page 26
The above figure 4.5 shows the DFD for Classification of Data of the proposed
system. For the problem definition data will be collected and pre processed. Model
will be created for the gathered data and data access, data sampling, data
transformation will be done. After creating the model and evaluate and interpret it.
Created model is applied for external applications.
4.3 Use Case Diagram
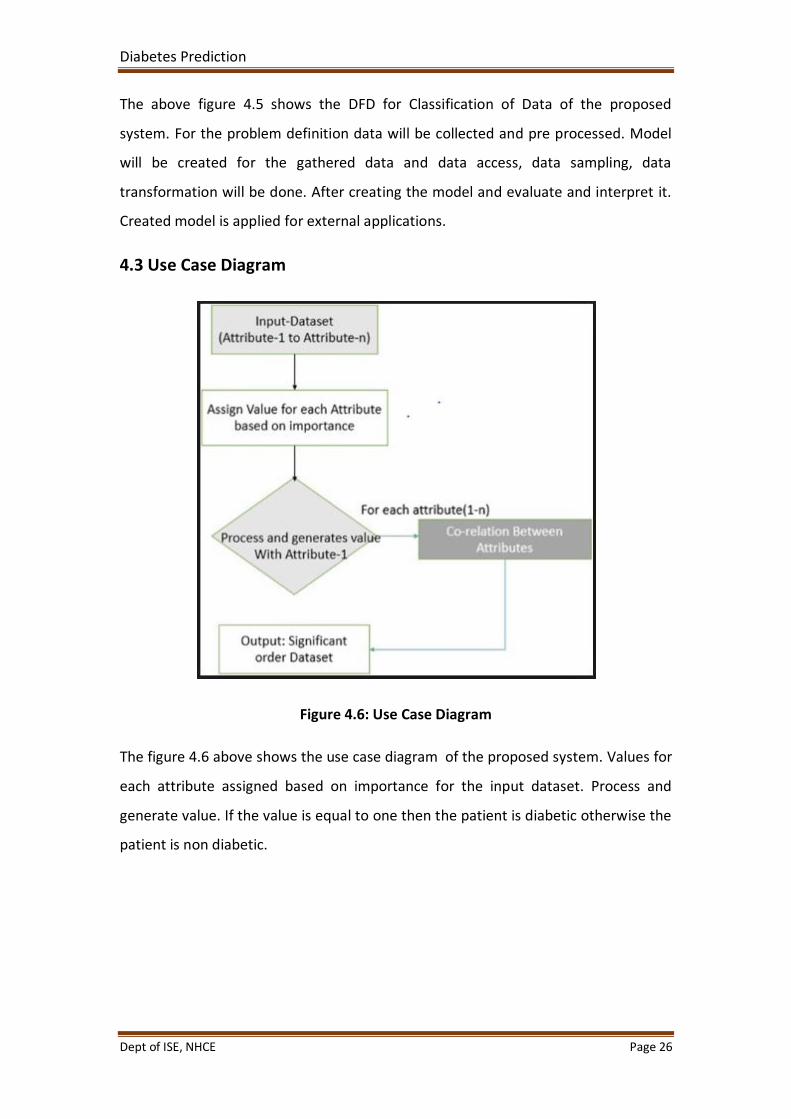
Figure 4.6: Use Case Diagram
The figure 4.6 above shows the use case diagram of the proposed system. Values for
each attribute assigned based on importance for the input dataset. Process and
generate value. If the value is equal to one then the patient is diabetic otherwise the
patient is non diabetic.
Diabetes Prediction
Dept of ISE, NHCE Page 27
Chapter 5
Implementation
In this work, a business intelligent model has been developed, to classify different
diabetes type, based on attribute values using a suitable machine learning
technique. The model was evaluated by a scientific approach to measure accuracy.
We are using Logistic Regression to build our model.
Analysis:
In this final phase, we will test our classification model on our prepared image
dataset and also measure the performance on our dataset. To evaluate the
performance of our created classification and make it comparable to current
approaches, we use accuracy to measure the effectiveness of classifiers.
After model building, knowing the power of model prediction on a new instance, is
very important issue. Once a predictive model is developed using the historical data,
one would be curious as to how the model will perform on the data that it has not
seen during the model building process. One might even try multiple model types for
the same prediction problem, and then, would like to know which model is the one
to use for the real-world decision making situation, simply by comparing them on
their prediction performance (e.g., accuracy). To measure the performance of a
predictor, there are commonly used performance metrics, such as accuracy, recall
etc. First, the most commonly used performance metrics will be described, and then
some famous estimation methodologies are explained and compared to each other.
"Performance Metrics for Predictive Modeling In classification problems, the primary
source of performance measurements is a coincidence matrix (classification matrix
or a contingency table)”. Above figure shows a coincidence matrix for a two-class
classification problem. The equations of the most commonly used metrics that can
be calculated from the coincidence matrix.
Diabetes Prediction
Dept of ISE, NHCE Page 28
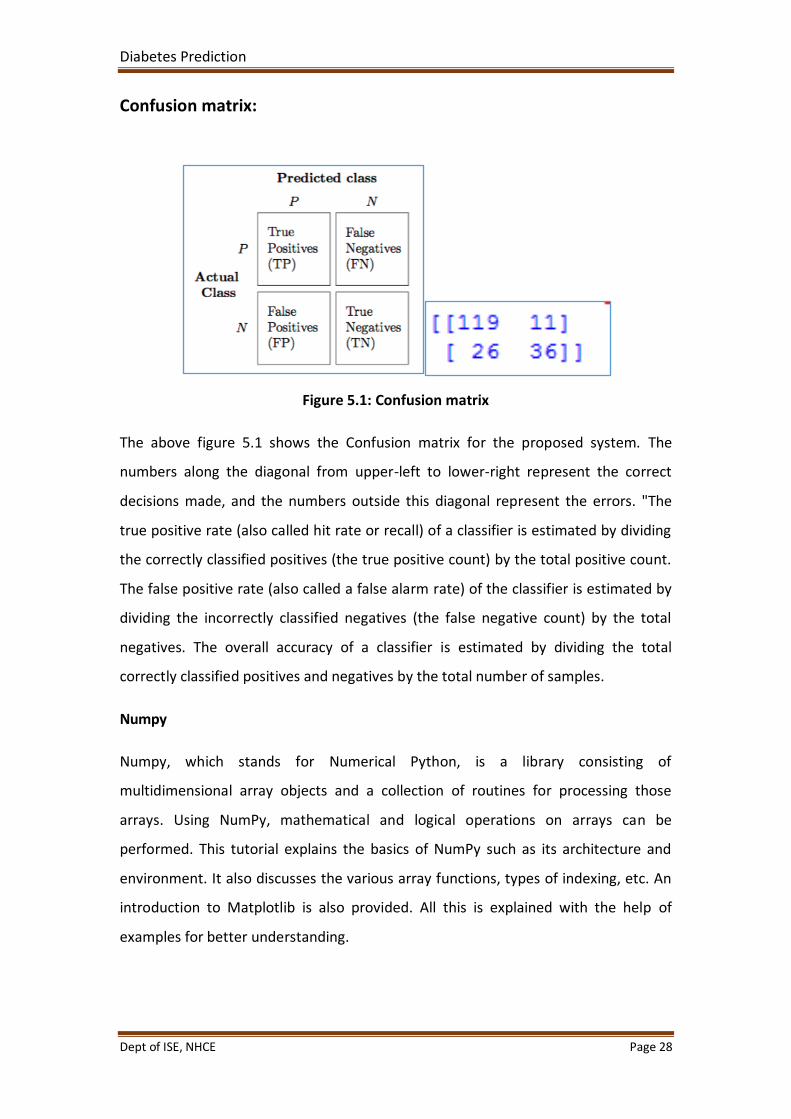
Confusion matrix:
Figure 5.1: Confusion matrix
The above figure 5.1 shows the Confusion matrix for the proposed system. The
numbers along the diagonal from upper-left to lower-right represent the correct
decisions made, and the numbers outside this diagonal represent the errors. "The
true positive rate (also called hit rate or recall) of a classifier is estimated by dividing
the correctly classified positives (the true positive count) by the total positive count.
The false positive rate (also called a false alarm rate) of the classifier is estimated by
dividing the incorrectly classified negatives (the false negative count) by the total
negatives. The overall accuracy of a classifier is estimated by dividing the total
correctly classified positives and negatives by the total number of samples.
Numpy
Numpy, which stands for Numerical Python, is a library consisting of
multidimensional array objects and a collection of routines for processing those
arrays. Using NumPy, mathematical and logical operations on arrays can be
performed. This tutorial explains the basics of NumPy such as its architecture and
environment. It also discusses the various array functions, types of indexing, etc. An
introduction to Matplotlib is also provided. All this is explained with the help of
examples for better understanding.
Diabetes Prediction
Dept of ISE, NHCE Page 29
Numpy is a Python package. It stands for 'Numerical Python'. It is a library consisting
of multidimensional array objects and a collection of routines for processing of
array.
Numeric, the ancestor of NumPy, was developed by Jim Hugunin. Another package
Numarray was also developed, having some additional functionality. In 2005, Travis
Oliphant created NumPy package by incorporating the features of Numarray into
Numeric package. There are many contributors to this open source project.
Operations using NumPy
Using NumPy, a developer can perform the following operations −
Mathematical and logical operations on arrays.
Fourier transforms and routines for shape manipulation.
Operations related to linear algebra. NumPy has in-built functions for linear
algebra and random number generation.
NumPy – A Replacement for Mat Lab
NumPy is often used along with packages like SciPy (Scientific Python)
and Mat−plotlib (plotting library). This combination is widely used as a replacement
for MatLab, a popular platform for technical computing. However, Python
alternative to MatLab is now seen as a more modern and complete programming
language.
It is open source, which is an added advantage of NumPy.
The most important object defined in NumPy is an N-dimensional array type
called ndarray. It describes the collection of items of the same type. Items in the
collection can be accessed using a zero-based index.
Every item in an ndarray takes the same size of block in the memory. Each element
in ndarray is an object of data-type object (called dtype).
Any item extracted from ndarray object (by slicing) is represented by a Python
object of one of array scalar types. The following diagram shows a relationship
between ndarray, data type object (dtype) and array scalar type −
Diabetes Prediction
Dept of ISE, NHCE Page 30
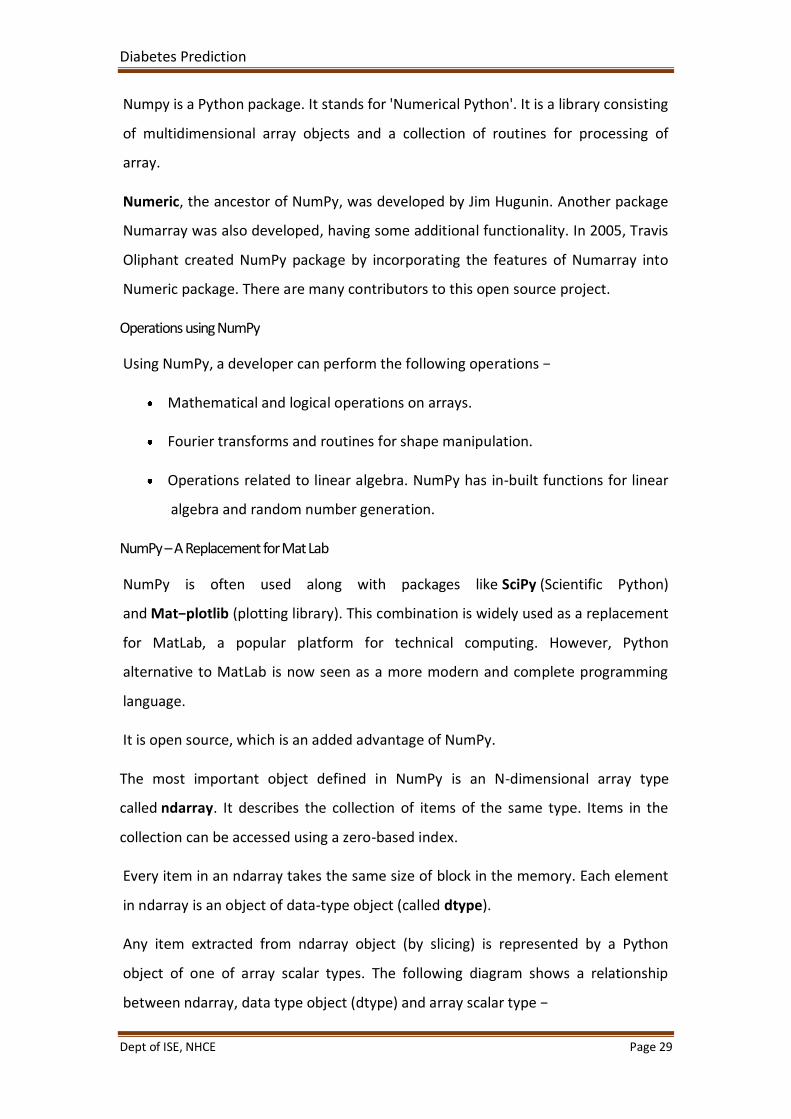
Figure 5.2: ndarray
The above figure 5.2 shows the ndarray. An instance of ndarray class can be
constructed by different array creation routines described later in the tutorial. The
basic ndarray is created using an array function in NumPy as follows −
numpy.array
It creates an ndarray from any object exposing array interface, or from any method
that returns an array.
The ndarray objects can be saved to and loaded from the disk files. The IO functions
available are −
load() and save() functions handle /numPy binary files (with npyextension)
loadtxt() and savetxt() functions handle normal text files
NumPy introduces a simple file format for ndarray objects. This .npy file stores
data, shape, dtype and other information required to reconstruct the ndarray in a
disk file such that the array is correctly retrieved even if the file is on another
machine with different architecture.
Steps involved in predicting the heart disease:
# import standard libraries
import pandas as pd
importmatplotlib.pyplot as plt
importnumpy as np
# import libraries for prepearing model
Diabetes Prediction
Dept of ISE, NHCE Page 31
fromsklearn.model_selection import train_test_split
fromsklearn import metrics
# import library for Logistic regression
fromsklearn.linear_model import LogisticRegression
# load dataset
pimaDataset = pd.read_csv("diabetes.csv")
# Show the information on fields
print(pimaDataset.describe())
# Show distribution of various columns
pimaDataset.hist()
plt.show()
#split dataset into features and target variable
y = pimaDataset['Outcome']
X = pimaDataset.drop(['Outcome'], axis = 1)
# split X and y into training and testing sets
X_train,X_test,y_train,y_test=train_test_split(X,y,test_size=0.25,random_state=0)
# instantiate the model (using the default parameters)
logreg = LogisticRegression()
Diabetes Prediction
Dept of ISE, NHCE Page 32
# fit the model with data
logreg.fit(X_train,y_train)
# predict values
y_pred=logreg.predict(X_test)
# print the confusion matrix to determine model accuracy
cnf_matrix = metrics.confusion_matrix(y_test, y_pred)
print(cnf_matrix)
5.1 Different modules of the project
Training Data
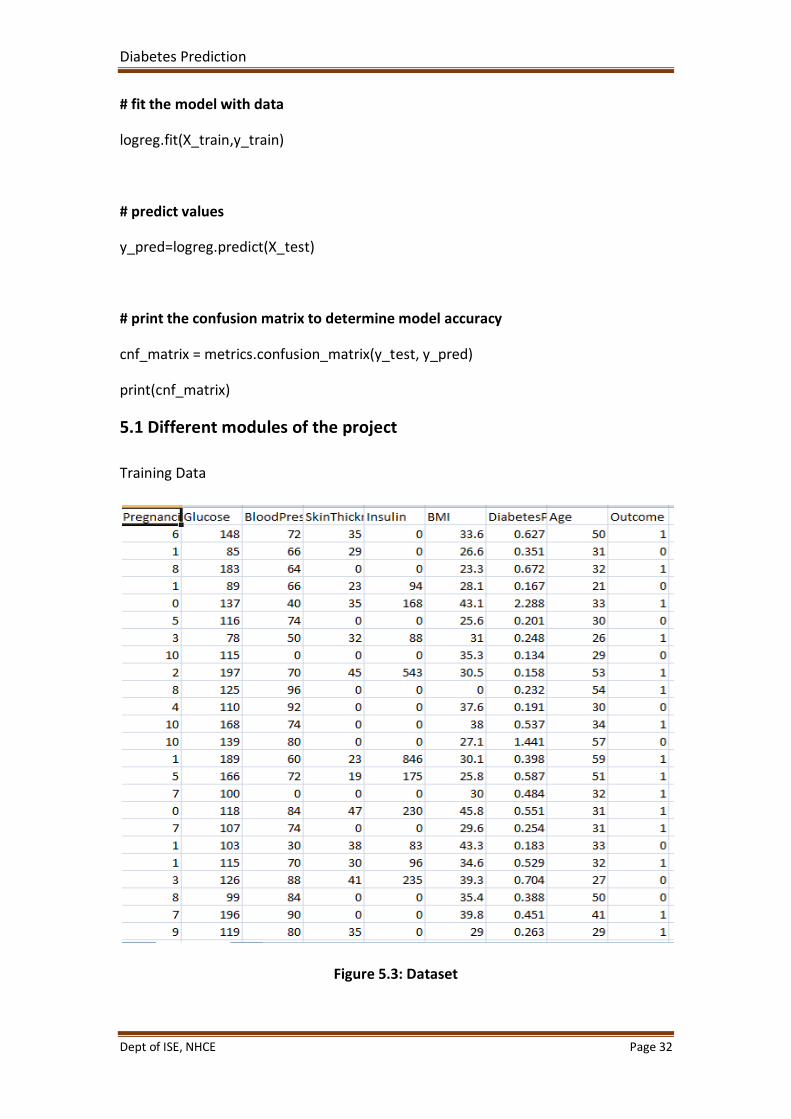
Figure 5.3: Dataset
Diabetes Prediction
Dept of ISE, NHCE Page 33
Figure 5.3 shows the dataset used to predict the diabetes. This dataset is originally
from the National Institute of Diabetes and Digestive and Kidney Diseases. The
objective of the dataset is to diagnostically predict whether or not a patient has
diabetes, based on certain diagnostic measurements included in the dataset. Several
constraints were placed on the selection of these instances from a larger database.
In particular, all patients here are females at least 21 years old of Pima Indian
heritage. The datasets consist of several medical predictor (independent) variables
and one target (dependent) variable, Outcome. Independent variables include the
number of pregnancies the patient has had, their BMI, insulin level, age, and so on.
5.2 Flowchart of the proposed system
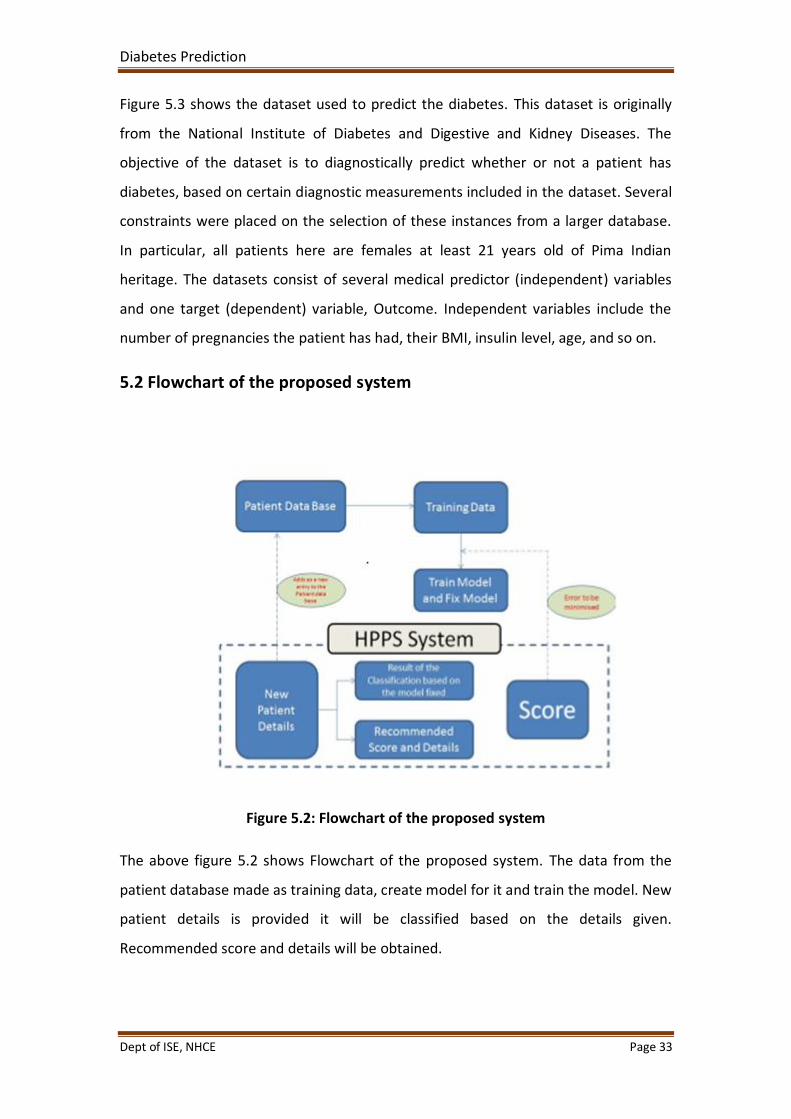
Figure 5.2: Flowchart of the proposed system
The above figure 5.2 shows Flowchart of the proposed system. The data from the
patient database made as training data, create model for it and train the model. New
patient details is provided it will be classified based on the details given.
Recommended score and details will be obtained.
Diabetes Prediction
Dept of ISE, NHCE Page 34
Chapter 6
Experimental Results
6.1 Outcomes of the Proposed System
Diabetes prediction is an internet-primarily based device gaining knowledge of
utility, skilled through a Pima Indian dataset. The person inputs its particular clinical
information to get the prediction of diabetes. The set of rules will calculate the
opportunity of presence diabetes.
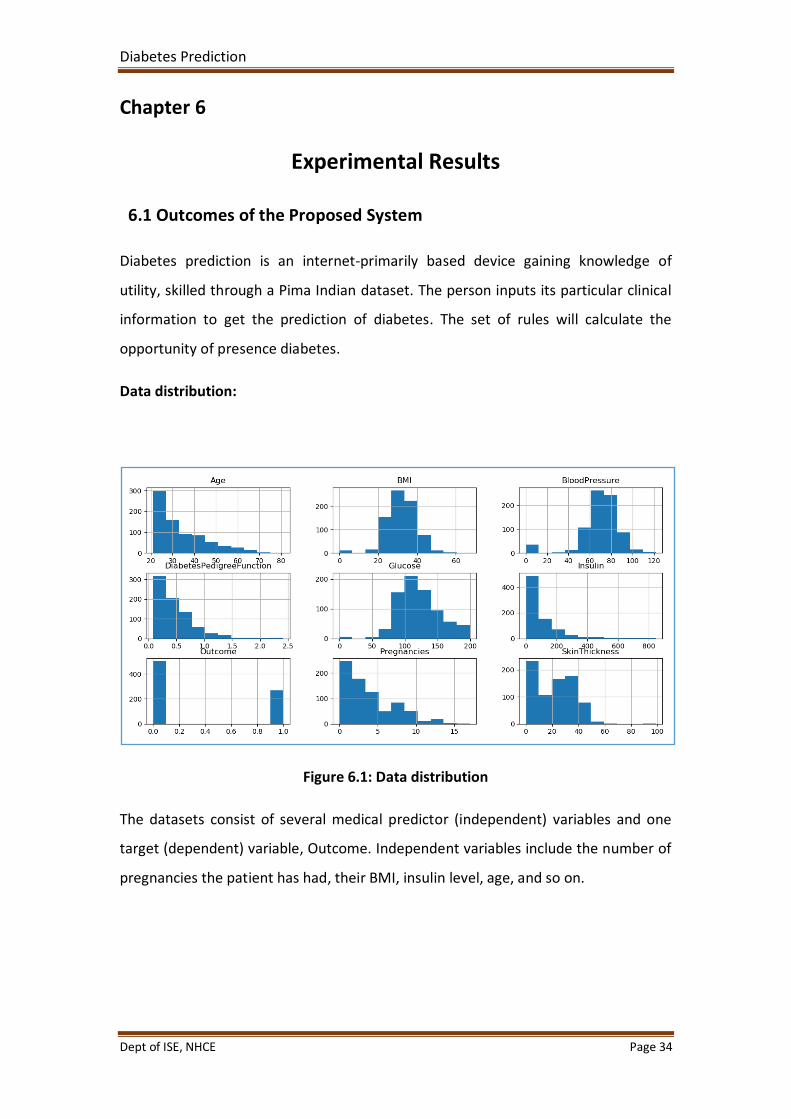
Data distribution:
Figure 6.1: Data distribution
The datasets consist of several medical predictor (independent) variables and one
target (dependent) variable, Outcome. Independent variables include the number of
pregnancies the patient has had, their BMI, insulin level, age, and so on.
Diabetes Prediction
Dept of ISE, NHCE Page 35
Chapter 7
Testing
Software testing is defined as an activity to check whether the actual results match
the expected results and to ensure that the software system is Defect free. It
involves execution of a software component or system component to evaluate one
or more properties of interest.
7.1 Testing and Validations
Validation is a complex process with many possible variations and options, so
specifics vary from database to database, but the general outline is:
Requirement Gathering
o The Sponsor decides what the database is required to do based on
regulations, company needs, and any other important factors.
o The requirements are documented and approved.
System Testing
o Procedures to test the requirements are created and documented.
o The version of the database that will be used for validation is set up.
o The Sponsor approves the test procedures.
o The tests are performed and documented.
o Any needed changes are made. This may require another, shorter
round of testing and documentation.
System Release
o The validation documentation is finalized.
o The database is put into production.
Diabetes Prediction
Dept of ISE, NHCE Page 36
7.2 Testing Levels
7.2.1 Functional Testing:
This type of testing is done against the functional requirements of the project.
Types:
Unit testing: Each unit /module of the project is individually tested to check for
bugs. If any bugs found by the testing team, it is reported to the developer for fixing.
Integration testing: All the units are now integrated as one single unit and checked
for bugs. This also checks if all the modules are working properly with each other.
System testing: This testing checks for operating system compatibility. It includes
both functional and non functional requirements.
Sanity testing: It ensures change in the code doesn’t affect the working of the
project.
Smoke testing: this type of testing is a set of small tests designed for each build.
Interface testing: Testing of the interface and its proper functioning.
Regression testing: Testing the software repetitively when a new requirement is
added, when bug fixed etc.
Beta/Acceptance testing: User level testing to obtain user feedback on the product.
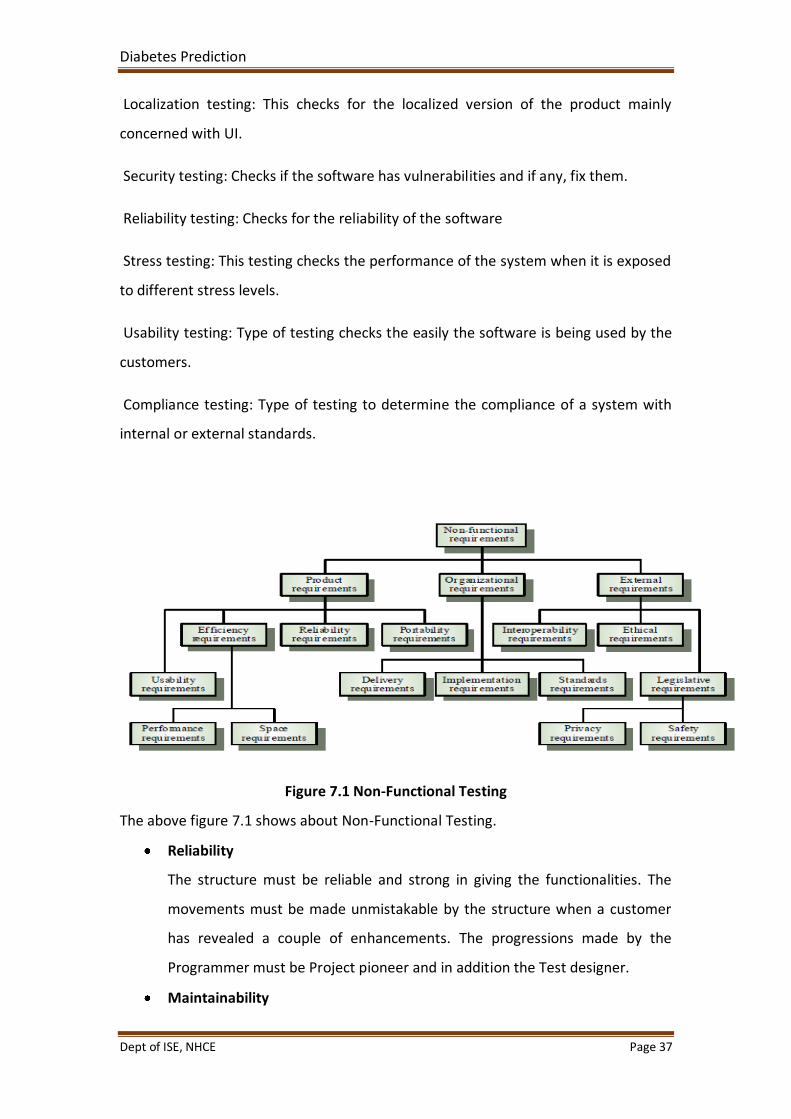
7.2.2 Non-Functional Testing:
This type of testing is mainly concerned with the non-functional requirements such
as performance of the system under various scenarios.
Performance testing: Checks for speed, stability and reliability of the software,
hardware or even the network of the system under test.
Compatibility testing: This type of testing checks for compatibility of the system with
different operating systems, different networks etc.
Diabetes Prediction
Dept of ISE, NHCE Page 37
Localization testing: This checks for the localized version of the product mainly
concerned with UI.
Security testing: Checks if the software has vulnerabilities and if any, fix them.
Reliability testing: Checks for the reliability of the software
Stress testing: This testing checks the performance of the system when it is exposed
to different stress levels.
Usability testing: Type of testing checks the easily the software is being used by the
customers.
Compliance testing: Type of testing to determine the compliance of a system with
internal or external standards.
Figure 7.1 Non-Functional Testing
The above figure 7.1 shows about Non-Functional Testing.
Reliability
The structure must be reliable and strong in giving the functionalities. The
movements must be made unmistakable by the structure when a customer
has revealed a couple of enhancements. The progressions made by the
Programmer must be Project pioneer and in addition the Test designer.
Maintainability
Diabetes Prediction
Dept of ISE, NHCE Page 38
The system watching and upkeep should be fundamental and focus in its
approach. There should not be an excess of occupations running on diverse
machines such that it gets hard to screen whether the employments are
running without lapses.
Performance
The framework will be utilized by numerous representatives all the while.
Since the system will be encouraged on a single web server with a lone
database server outside of anyone's ability to see, execution transforms into
a significant concern. The structure should not capitulate when various
customers would use everything the while. It should allow brisk accessibility
to each and every piece of its customers. For instance, if two test specialists
are all the while attempting to report the vicinity of a bug, then there ought
not to be any irregularity at the same time.
Portability
The framework should to be effectively versatile to another framework. This
is obliged when the web server, which s facilitating the framework gets
adhered because of a few issues, which requires the framework to be taken
to another framework.
Scalability
The framework should be sufficiently adaptable to include new
functionalities at a later stage. There should be a run of the mill channel,
which can oblige the new functionalities.
Flexibility
Flexibility is the capacity of a framework to adjust to changing situations and
circumstances, and to adapt to changes to business approaches and rules. An
adaptable framework is one that is anything but difficult to reconfigure.
7.3 White Box Testing
White Box Testing is defined as the testing of a software solution's internal structure,
design, and coding. In this type of testing, the code is visible to the tester. It focuses
primarily on verifying the flow of inputs and outputs through the application,
Diabetes Prediction
Dept of ISE, NHCE Page 39
improving design and usability, strengthening security. White box testing is also
known as Clear Box testing, Open Box testing, Structural testing, Transparent Box
testing, Code-Based testing, and Glass Box testing. It is usually performed by
developers.
It is one of two parts of the "Box Testing" approach to software testing. Its
counterpart, Blackbox testing, involves testing from an external or end-user type
perspective. On the other hand, Whitebox testing is based on the inner workings of
an application and revolves around internal testing.
The term "WhiteBox" was used because of the see-through box concept. The clear
box or WhiteBox name symbolizes the ability to see through the software's outer
shell (or "box") into its inner workings. Likewise, the "black box" in "Black Box
Testing" symbolizes not being able to see the inner workings of the software so that
only the end-user experience can be tested.
Internal security holes
Broken or poorly structured paths in the coding processes
The flow of specific inputs through the code
Expected output
The functionality of conditional loops
Testing of each statement, object, and function on an individual basis
The testing can be done at system, integration and unit levels of software
development. One of the basic goals of whitebox testing is to verify a working flow
for an application. It involves testing a series of predefined inputs against expected
or desired outputs so that when a specific input does not result in the expected
output, you have encountered a bug.
7.4 Different Stages of Testing
7.4.1 Unit Testing
Diabetes Prediction
Dept of ISE, NHCE Page 40
Unit Testing is a level of software testing where individual units/ components of a
software are tested. The purpose is to validate that each unit of the software
performs as designed. A unit is the smallest testable part of any software. It usually
has one or a few inputs and usually a single output. In procedural programming, a
unit may be an individual program, function, procedure, etc. In object-oriented
programming, the smallest unit is a method, which may belong to a base/ super
class, abstract class or derived/ child class. (Some treat a module of an application as
a unit. This is to be discouraged as there will probably be many individual units
within that module.) Unit testing frameworks, drivers, stubs, and mock/ fake objects
are used to assist in unit testing.
Unit Test Plan:
Unit Test Plan
o Prepare
o Review
o Rework
o Baseline
Unit Test Cases/Scripts
o Prepare
o Review
o Rework
o Baseline
Unit Test
o Perform
Benefits
Unit testing increases confidence in changing/ maintaining code. If good unit
tests are written and if they are run every time any code is changed, we will
be able to promptly catch any defects introduced due to the change. Also, if
codes are already made less interdependent to make unit testing possible,
the unintended impact of changes to any code is less.
Diabetes Prediction
Dept of ISE, NHCE Page 41
Codes are more reusable. In order to make unit testing possible, codes need
to be modular. This means that codes are easier to reuse.
Development is faster. How? If you do not have unit testing in place, you
write your code and perform that fuzzy ‘developer test’ (You set some
breakpoints, fire up the GUI, provide a few inputs that hopefully hit your
code and hope that you are all set.) But, if you have unit testing in place, you
write the test, write the code and run the test. Writing tests takes time but
the time is compensated by the less amount of time it takes to run the tests;
You need not fire up the GUI and provide all those inputs. And, of course, unit
tests are more reliable than ‘developer tests’. Development is faster in the
long run too. How? The effort required to find and fix defects found during
unit testing is very less in comparison to the effort required to fix
defects found during system testing or acceptance testing.
The cost of fixing a defect detected during unit testing is lesser in comparison
to that of defects detected at higher levels. Compare the cost (time, effort,
destruction, humiliation) of a defect detected during acceptance testing or
when the software is live.
Debugging is easy. When a test fails, only the latest changes need to be
debugged. With testing at higher levels, changes made over the span of
several days/weeks/months need to be scanned.
7.4.2 Integration Testing
Integration Testing is a level of software testing where individual units are combined
and tested as a group. The purpose of this level of testing is to expose faults in the
interaction between integrated units. Test drivers and test stubs are used to assist in
Integration Testing.
integration testing: Testing performed to expose defects in the interfaces
and in the interactions between integrated components or systems. See also
component integration testing, system integration testing.
component integration testing: Testing performed to expose defects in the
interfaces and interaction between integrated components.
Diabetes Prediction
Dept of ISE, NHCE Page 42
system integration testing: Testing the integration of systems and packages;
testing interfaces to external organizations (e.g. Electronic Data Interchange,
Internet).
Tasks
Integration Test Plan
o Prepare
o Review
o Rework
o Baseline
Integration Test Cases/Scripts
o Prepare
o Review
o Rework
o Baseline
Integration Test
7.4.3 System Testing
System Testing is a level of software testing where a complete and integrated
software is tested. The purpose of this test is to evaluate the system’s compliance
with the specified requirements. The process of testing an integrated system to
verify that it meets specified requirements.
7.4.4 Acceptance Testing
Acceptance Testing is a level of software testing where a system is tested for
acceptability. The purpose of this test is to evaluate the system’s compliance with
the business requirements and assess whether it is acceptable for delivery. Formal
testing with respect to user needs, requirements, and business processes conducted
to determine whether or not a system satisfies the acceptance criteria and to enable
the user, customers or other authorized entity to determine whether or not
to accept the system.
Diabetes Prediction
Dept of ISE, NHCE Page 43
Chapter 8
Conclusion and Future Enhancement
Project introduction is the first step in building a system. Basically it will tell what is
the application or a system that we are intended to build, what it will look like, brief
describe on the proposed project, setting up the project scope, defining project
objective, problem statements of the project and also the expected outcome. This
stage will be used as a reference to ensure system meet the project scope and
project objective.
8.1 Conclusion
Diabetes is vital health hassle in human society. This paper has summarised kingdom
of art techniques and to be had techniques for predication of this sickness. Deep
studying an rising region of Machine Learning showed a few promising bring about
different area of clinical diagnose with excessive accuracy. It continues to be an open
area waiting to get applied in Diabetes predication. Some strategies of deep studying
has been discussed which may be implemented for Diabetes predication, alongside
pioneer machine getting to know algorithms. An analytical assessment has been
completed for locating out best available algorithm for clinical dataset. In future our
purpose is to carry ahead the work of temporal scientific dataset, wherein dataset
varies with time and retraining of dataset is needed.
8.2 Future Enhancement
The proposed system is Diabetes prediction. We can enhance this system should
be efficient to predict the diseases and suggestion of medications using machine
learning. Further the system can be extended to N number diseases existing with
proper medications.
LIMITATIONS:
The size of the database increases day-by-day, increasing the load on the
database back update data maintenance activity.
Diabetes Prediction
Dept of ISE, NHCE Page 44
Training for simple computer operations is necessary for the users working on the
system.
Diabetes Prediction
Dept of ISE, NHCE Page 45
References
• https://www.academia.edu
• https://en.wikipedia.org/wiki/Clinical_data_management
• http://shodh.inflibnet.ac.in:8080/jspui/bitstream/123456789/4170/3/03_lite
rature%20review.pdf
• World Health Organization. Available online: http://www.who.int (accessed
on 14 September 2018).
• Baldwin, D. Wayfinding technology: A road map to the future. J. Vis. Impair.
Blind. 2003, 97, 612–620.
• Kavakiotis, I., Tsave, O., Salifoglou, A., Maglaveras, N., Vlahavas, I., &
Chouvarda, I. (2017). Machine learning and data mining methods in diabetes
research. Computational and structural biotechnology journal.
• Zheng, T., Xie, W., Xu, L., He, X., Zhang, Y., You, M., ... & Chen, Y. (2017). A
machine learning-based framework to identify type 2 diabetes through
electronic health records. International journal of medical informatics, 97,
120-127.
• Xu, W., Zhang, J., Zhang, Q., & Wei, X. (2017, February). Risk prediction of
type II diabetes based on random forest model. In Advances in Electrical,
Electronics, Information, Communication and BioInformatics (AEEICB), 2017
Third International Conference on (pp. 382-386). IEEE.
• Song, Y., Liang, J., Lu, J., & Zhao, X. (2017). An efficient instance selection
algorithm for k nearest neighbour regression. Neurocomputing, 251, 26-34.
• Komi, M., Li, J., Zhai, Y., & Zhang, X. (2017, June). Application of data mining
methods in diabetes prediction. In Image, Vision and Computing (ICIVC), 2017
2nd International Conference on (pp. 1006-1010). IEEE.
• Meza-Palacios, R., Aguilar-Lasserre, A. A., Ureña-Bogarín, E. L., Vázquez-
Rodríguez, C. F., Posada-Gómez, R., & Trujillo-Mata, A. (2017). Development
of a fuzzy expert system for the nephropathy control assessment in patients
with type 2 diabetes mellitus. Expert Systems with Applications, 72, 335-343
Diabetes Prediction
Dept of ISE, NHCE Page 46
• Rani, A. S., & Jyothi, S. (2016, March). Performance analysis of classification
algorithms under different datasets. In Computing for Sustainable Global
Development (INDIACom), 2016 3rd International Conference on (pp. 1584-
1589). IEEE.
• Pradeep, K. R., & Naveen, N. C. (2016, December). Predictive analysis of
diabetes using J48 algorithm of classification techniques. In Contemporary
Computing and Informatics (IC3I), 2016 2nd International Conference on (pp.
347-352). IEEE.
• Perveen, S., Shahbaz, M., Guergachi, A., & Keshavjee, K. (2016). Performance
analysis of data mining classification techniques to predict diabetes. Procedia
Computer Science, 82, 115-121.
• Santhanam, T., & Padmavathi, M. S. (2015). Application of K-means and
genetic algorithms for dimension reduction by integrating SVM for diabetes
diagnosis. Procedia Computer Science, 47, 76-83.
• Kandhasamy, J. P., & Balamurali, S. (2015). Performance analysis of classifier
models to predict diabetes mellitus. Procedia Computer Science, 47, 45-51.
• Bashir, S., Qamar, U., Khan, F. H., & Javed, M. Y. (2014, December). An
Efficient RuleBased Classification of Diabetes Using ID3, C4. 5, & CART
Ensembles. In Frontiers of Information Technology (FIT), 2014 12th
International Conference on (pp. 226-231). IEEE.
• Meng, X. H., Huang, Y. X., Rao, D. P., Zhang, Q., & Liu, Q. (2013). Comparison
of three data mining models for predicting diabetes or prediabetes by risk
factors. The Kaohsiung journal of medical sciences, 29(2), 93-99.
• Krati Saxena, D., Khan, Z., & Singh, S.(2014) Diagnosis of Diabetes Mellitus
using K Nearest Neighbor Algorithm.
• Saravananathan, K., & Velmurugan, T. (2016). Analyzing Diabetic Data using
Classification Algorithms in Data Mining. Indian Journal of Science and
Technology, 9(43).
• Guo, Y., Bai, G., & Hu, Y. (2012, December). Using bayes network for
prediction of type-2 diabetes. In Internet Technology And Secured
Transactions, 2012 International Conference for (pp. 471-472). IEEE.