Embed Size (px)
Citation preview

International Journal of Petroleum and Geoscience Engineering (IJPGE) 1 (4): 284-295, 2013 ISSN 2289-4713 © Academic Research Online Publisher
Research Article
Prediction of DSI Parameters from Conventional WellLog Data Using
Intelligent System and Clustering tool
Morteza Nouri Taleghania,*, Mina Karimi Khaledib aUniversity of Tehran, Iran P
bPPetroleum University of Technology, Iran
* Corresponding author. E-mail address: [email protected] U1T
A b s t r a c t Keywords: Compressional velocity, Shear velocity, Dipole sonic imaging, Neural network, Fuzzy logic, Multi-resolution graph-based clustering (MRGC), Mean square error (MSE).
Compressional and Shear velocity are two fundamental parameters which have many applications in petrophysical, geophysical, and geomechanical operations. These two parameters can be obtained using Dipole Sonic Imaging tool (DSI), but unfortunately this tool is run just in few wells of a field. Therefore it is important to predict compressional and shear velocity indirectly from the other conventional well logs that have good correlation with these parameters in given well without these logs. The overriding tool of this work is intelligent systems including Artificial Neural Network, Fuzzy Logic and clustering tool Multi-resolution graph-based clustering (MRGC) for prediction of Compressional and Shear velocity. In this paper 1328 data points from one formation which have Compressional and Shear velocity are used. These data are divided into two groups: 998 data points for construction of intelligent systems, and 330 data points used for model testing. The results showed that despite difference in concept, all of the intelligent techniques were successful for estimation of Compressional and Shear velocity but clustering tool is better than other method.
Accepted:07November 2013 © Academic Research Online Publisher. All rights reserved.
1. Introduction
Exact determination of rock elastic and strength properties is vital for reservoir stimulation, well bore
stability prediction, sand production and so many geochemical applications. The only procedure to
have accurate data of rock elastic properties is performing experiments on core plugs in laboratory.
Usually core data are restricted to discontinues points along the well and typically are not available. In
the absence of rock strength data of core samples it is assumed that strength properties are related to
wave velocity in rocks. Compressional and shear slowness are two most important parameters which
commonly are used to estimate elastic and strength properties. Another challenge which appears is
that these two parameters are determined through a dipole sonic imager tool and this tool is rarely run
in oil reservoirs. Therefore redesigning an improved models which are capable of synthesizing

Morteza Nouri Taleghani et al. / International Journal of Petroleum and Geoscience Engineering (IJPGE) 1 (4): 284-295, 2013
285 | P a g e
compressional and shear velocity in a more accurate and convenient way is necessary for reservoir
characterization study. Some researchers have applied intelligent systems to estimate several reservoir
parameters from well log responses [1-5]. So in this research neural network, fuzzy logic , Multi-
resolution graph-based clustering (MRGC) have been used for determination of Compressional and
Shear velocity one field, located in the southwest of Iran. in this study and the results of the different
models to choose the best intelligent systems in solving problems with different methodologies are
compared.
2. Methods
2.1. Fuzzy logic (FL)
A fuzzy inference system (FIS) is a procedure of formulating, from a set of input data to a set of
output data, using fuzzy sets theory [6]. Fuzzy-logic theory is an extension of Boolean logic (0, 1)
which permits the use of "partial truth" between "entirely true" and "entirely false" alternatives and
reflects the full range of choices between these alternatives [7].Each fuzzy set is signified by a
membership function (MF). MFs are of some types such as Gaussian, triangular, trapezoidal, sigmoid,
S-shape, Z-shape, etc. The procedure within fuzzy inference systems contains fuzzification of the
input variables, formulation of the fuzzy "If-Then" rule-base, expansion of the fuzzy inference (i.e.
application of the fuzzy rules), and defuzzification. Among different types of FIS, Sugeno fuzzy
inference system was employed in this study. Sugeno and Yasukawa introduced an FIS in which
output membership functions are constant or linear and are created via a fuzzy clustering process [8].
2.2. Artificial Neural Network
Artificial Neural Network has been defined as a computer model that attempts to mimic simple
biological learning process and simulate specific functions of human nervous system [5]. It also has
been referred to as an adaptive, parallel information processing system, which is able to develop
associations, transformations or mappings between objects or data. It is expected that ANN will
succeed in solving complex problems because it utilizes similar methods used by millions of neurons
in the brain to solve everyday problems. The neurons work together in parallel to solve tiny bits of a
big problem. This type of problem solving method has shown great successes in pattern recognition.
ANN is capable of learning in order to recognize, classify and generalize. Figure1 shows the
schematic diagram of an Artificial Neural Network.

Morteza Nouri Taleghani et al. / International Journal of Petroleum and Geoscience Engineering (IJPGE) 1 (4): 284-295, 2013
286 | P a g e
2.3. Multi-resolution graph-based clustering (MRGC)
Clustering deals with the problem of detection of clusters from a data set where a priori data structure
is unknown. There are several problems in most of the methods in literature [9] include:
We require to known the number of clusters as an input parameter.
More they are very sensitive to initial conditions and variations of parameter values.
Most methods make ellipsoidal structures but they cannot detect clusters of varied shapes.
There are multi-dimensional unsupervised clustering methods are categorized into metric and
statistical methods [10].
Statistical methods are containing two approaches parametric and Non-parametric: "parametric
methods" based on probabilistic modeling of the analyzed data structure, and "non- parametric
methods" without using any model. Parametric approach requires restrictive hypotheses such as the
knowledge about the number of clusters and their a priori PDF. Non-parametric approach does not
need any a priori knowledge about the structure of the analyzed data distributions. Consequently, this
approach is capable of recognizing clusters of varied shapes, but it is veiy sensitive to the irregularity
of the available data distribution [10].
Three Methods Graph-Based methods, based on discretizing observation space into Hypercubes and
K-Nearest-Neighbor (KNN) are different Non-parametric approaches [10]. Multi-resolution graph-
based clustering (MRGC) is a non-parametric method which is the mixture of Gan's KNN and graph
data representation, which taking advantages of both approaches for detecting clusters in data sets of
any dimension and of complex configuration. MRGC approach has the following characteristics [10]:
• Capable of recognizing natural partitions of log data that may reveal the organization of
geological facies.
• Independent toa priori knowledge of the data set.
• Automatically proposes optimal number of clusters.
• Reliable for processing real log date sets containing clusters of very complex configurations
(see previous section).
• Few parameters and the results should be stable while varying values of parameters.
• Without limitation in numbers of dimensions, of points and of clusters.
Neighboring Index (NI): This parameter replacements the distance parameter. As said before, when
two points are close to each other, they can be simply separated if they have high NI. Unlike other
hierarchical methods, depending on the faciesbehavior, the user can specify the number of facies.
Kernel Representative Index (KRI): It is a mixture of NI, distance and weighted distance function P(x,
y) which specifies the Neighborhood or the degree of membership for P(x, y). If it is low, it is affected

Morteza Nouri Taleghani et al. / International Journal of Petroleum and Geoscience Engineering (IJPGE) 1 (4): 284-295, 2013
287 | P a g e
by P(x, y); otherwise it has a high membership degree and is not affected by P(x, y). we have follow
eqeution:
NI(X) = � exp [−m(n, a)n−1
N=1
]
Where ‘m’ the neighbor ranking, ‘a’ is the resolution parameter.
KRI = NI(x) P(x, y) D(x, y)
In which P(x, y), is the weighting distance, D is the distance between x and y. First is specified kernel
or the center point which influences all of its neighboring members, and then all the members will be
compared. The members that are influenced by the kernel affect other members as well. The
boundaries are, therefore, specified where a member is affected by its previous member but cannot
affect other members. So, the boundaries control the Split point and distinguish dissimilar clusters
based on the limits and parameters [10].
3. Result and discussion
The data set for this study is obtained from a real reservoir in one of Iranian south west oil fields. The
total of 1328 data points is used to constructing the models. To have accurate predict log information
of three wells No.z1, No.z2 and No.z3 was used. The fullest logs consist of the following log plots:
Spectral Gamma ray log (CGR), bulk density log (RHOB), Neutron log (NPHI), resistivity log (RT)
and sonic travel time log (DT). The appropriate input data for predicting compressional and shear
velocity are selected by quick look correction coefficients. Appropriate inputs to construct intelligent
models are shown in follow (table 1). As mentioned before, the models were performed using two
different intelligent systems, fuzzy logic, ANN and MRGC clustering tool.
Table.1: Appropriate inputs to construct different models
Predicted velocity Compressional velocity Shear velocity
Inputs RHOB,DT,CGR,RT NPHI,RHOB,CGR ,RT
3.1. Fuzzy logic
3.1.1Sugeno FIS (SFIS)
In this work a TSK-FIS was implemented for prediction of compressional and shear velocity in
Matlab. All input and output membership functions (MFs) and their corresponding parameters were
attained by dint of a subtractive clustering method and then a set of fuzzy ‘if-then’ rules were
developed. Subtractive clustering is an operative procedure to estimation the number of fuzzy clusters

Morteza Nouri Taleghani et al. / International Journal of Petroleum and Geoscience Engineering (IJPGE) 1 (4): 284-295, 2013
288 | P a g e
and cluster centers in a Sugeno fuzzy inference system [11]. In subtractive clustering, each data point
is considered as a potential cluster center. In subtractive clustering when the influence range or cluster
radius (Ra) is varied, the number of the MFs and ‘if-then’ rules change
as well [12]. A small cluster radius usually yields more MFs and ‘if-then’ rules, whereas a large
cluster radius yields fewer MFs and ‘if-then’ rules [13]. With the view to obtaining optimal number of
rules and MFs, a set of values for the clustering radius were specified which ranges from 0 to 1.
Consequently several numbers of rules were generated. Then the MSE for each of two models was
measured. The model with highest performance (lowest error) was selected as optimum FIS (table 2).
Table. 2: The MSE and number of fuzzy ‘if-then’ rules for 10 TS-FISs generated by specifying a set of values
between the range of [0, 1] for clustering radius

Morteza Nouri Taleghani et al. / International Journal of Petroleum and Geoscience Engineering (IJPGE) 1 (4): 284-295, 2013
289 | P a g e
3.1.2Compressional velocity (Vp)
By specifying 0.4 for clustering radius, 7 Gaussian MFs were extracted for inputs. Generated fuzzy if
then rules are as below:
1. If (RHOB is mf1) and (DT is mf3) and (GR is mf5) and (RT is mf6) then (V p is mf 1).
2. If (RHOB is mf6) and (DT is mf2) and (GR is mf7) and (RT is mf8) then (V p is mf 1).
3. If (RHOB is mf3) and (DT is mf4) and (GR is mf4) and (RT is mf5) then (V p is mf 1).
4. If (RHOB is mf5) and (DT is mf6) and (GR is mf2) and (RT is mf1) then (V p is mf 1).
5. If (RHOB is mf7) and (DT is mf1) and (GR is mf3) and (RT is mf4) then (V p is mf 1).
6. If (RHOB is mf2) and (DT is mf5) and (GR is mf6) and (RT is mf3) then (V p is mf 1).
7. If (RHOB is mf1) and (DT is mf7) and (GR is mf1) and (RT is mf2) then (V p is mf 1).
3.1.3Shear velocity (Vs)
By specifying 0.3 for clustering radius, 8 Gaussian MFs were extracted for inputs. Generated fuzzy if
then rules are as below:
1. If (NPHI is mf3) and (RHOB is mf3) and (GR is mf2) and (RT is mf3) then (V s is mf7).
2. If (NPHI is mf1) and (RHOB is mf6) and (GR is mf5) and (RT is mf2) then (V s is mf4).
3. If (NPHI is mf5) and (RHOB is mf2) and (GR is mf3) and (RT is mf1) then (V s is mf5).
4. If (NPHI is mf6) and (RHOB is mf5) and (GR is mf8) and (RT is mf5) then (V s is mf6).
5. If (NPHI is mf4) and (RHOB is mf7) and (GR is mf4) and (RT is mf8) then (V s is mf3).
6. If (NPHI is mf8) and (RHOB is mf1) and (GR is mf1) and (RT is mf6) then (V s is mf2).
7. If (NPHI is mf7) and (RHOB is mf4) and (GR is mf7) and (RT is mf4) then (V s is mf8).
8. If (NPHI is mf2) and (RHOB is mf8) and (GR is mf6) and (RT is mf7) then (V s is mf1).
For example figure 1 shows TSK-FIS extracted Gaussian membership functions for prediction of
compressional velocity. Subsequent to preparation of the fuzzy models, the input matrix of test data
was input to the SFIS models. The measured Mean Squared Error (MSE) function for FL predicted
compressional and shear velocity in the test data were equal to 0.00144 and 0.00155, respectively.
The R2 between the measured and FL predicted compressional and shear velocity were 0.8862 and
0.8662, respectively (figure2). For example a contrast between the measured and FL predicted outputs
vs. depth in the test data is shown in figure3.

Morteza Nouri Taleghani et al. / International Journal of Petroleum and Geoscience Engineering (IJPGE) 1 (4): 284-295, 2013
290 | P a g e
Fig.1:Some of Membership functions for compressional velocity modeling by Sugeno FIS.
Fig.2: Cross plots showing the correlation coefficients between actual and predicted results using FL for compressional and shear velocity

Morteza Nouri Taleghani et al. / International Journal of Petroleum and Geoscience Engineering (IJPGE) 1 (4): 284-295, 2013
291 | P a g e
Fig.3: Comparison between the measured and predicted outputs vs. depth using FL.
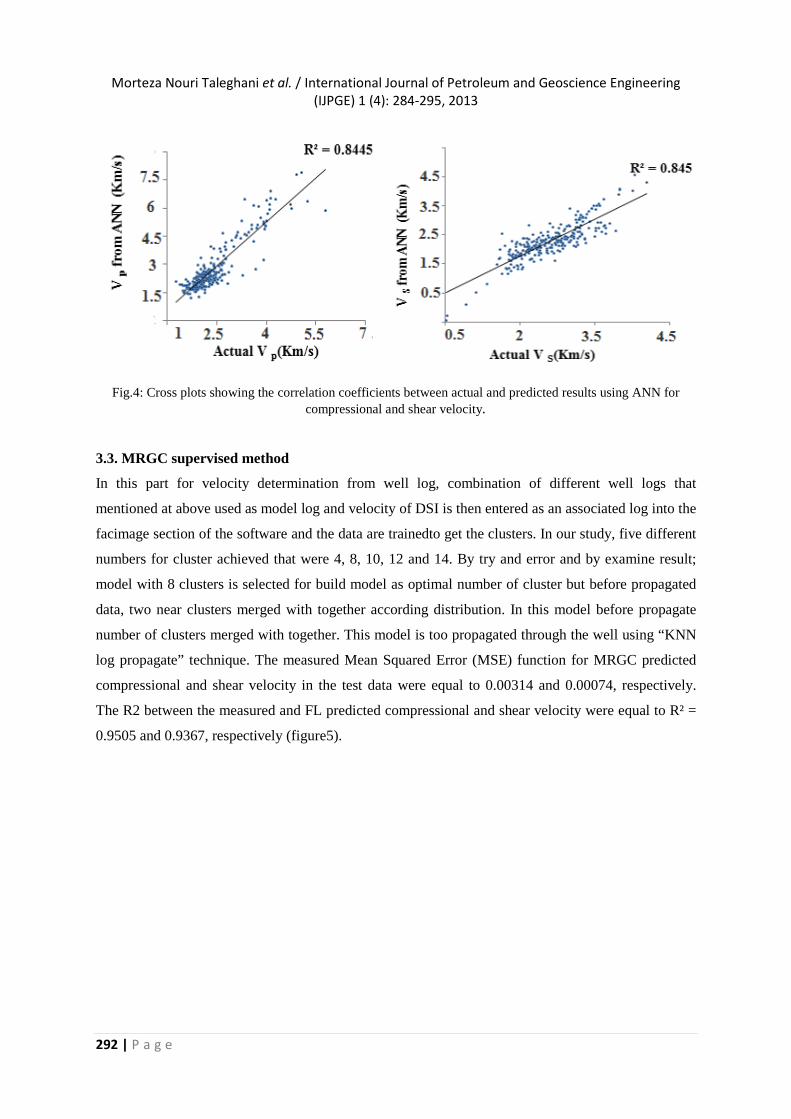
3.2. ANN
To prediction of parameters by ANN here a Backpropagation Network has been chosen because of its
high capabilities to generalize well in problems plagued with significant heterogeneity and
nonlinearity and it is the most commonly used intelligent technique for reservoir characterization. A
two-layer feed-forward back propagation network was used and the TRAINLM function was applied
for training the dataset which is network training function that updates weight and bias values
according to Levenberg-Marquardt optimization. The measured Mean Squared Error (MSE) function
for ANN predicted compressional and shear velocity in the test data were equal to 0.00329 and
0.00162, respectively. The R2 between the measured and FL predicted compressional and shear
velocity were equal to 0.8445 and 0.845, respectively (figure4).
Morteza Nouri Taleghani et al. / International Journal of Petroleum and Geoscience Engineering (IJPGE) 1 (4): 284-295, 2013
292 | P a g e
Fig.4: Cross plots showing the correlation coefficients between actual and predicted results using ANN for compressional and shear velocity.
3.3. MRGC supervised method
In this part for velocity determination from well log, combination of different well logs that
mentioned at above used as model log and velocity of DSI is then entered as an associated log into the
facimage section of the software and the data are trainedto get the clusters. In our study, five different
numbers for cluster achieved that were 4, 8, 10, 12 and 14. By try and error and by examine result;
model with 8 clusters is selected for build model as optimal number of cluster but before propagated
data, two near clusters merged with together according distribution. In this model before propagate
number of clusters merged with together. This model is too propagated through the well using “KNN
log propagate” technique. The measured Mean Squared Error (MSE) function for MRGC predicted
compressional and shear velocity in the test data were equal to 0.00314 and 0.00074, respectively.
The R2 between the measured and FL predicted compressional and shear velocity were equal to R² =
0.9505 and 0.9367, respectively (figure5).

Morteza Nouri Taleghani et al. / International Journal of Petroleum and Geoscience Engineering (IJPGE) 1 (4): 284-295, 2013
293 | P a g e
Fig.5: Cross plots showing the correlation coefficients between actual and predicted results using MRGC for
compressional and shear velocity
Table 2 shows the comparisons of error statistics for the test data using different intelligent systems
Containing FL, NN, and MRGC clustering method. The MSE achieved by these methods are so close
to each other and it could be concluded that all of this techniques exclusively could be a powerful tool
for estimation of compressional and shear velocity.The comparisons between measured and predicted
parameters using different methods show all techniques were successful but MRGC can predict better
than FL and ANN.
Table 4: Comparisons of MSE for (a) compressional velocity and (b) shear velocity in the test data using
different intelligent systems an MRGC
a Method MSE Rank TKS-F1S 0.00295 1 ANN 0.00329 3 MRGC 0.00314 2 b Method MSE Rank TKS-F1S 0.00144 2 ANN 0.00162 3 MRGC 0.00074 1

Morteza Nouri Taleghani et al. / International Journal of Petroleum and Geoscience Engineering (IJPGE) 1 (4): 284-295, 2013
294 | P a g e
4. Conclusion
This study indicated that intelligent synthesizing of petrophysical well logs by use of other well logs
data is a highly feasible method. Predicted and real well logs for a test well of the study field show a
good correlation. The comparisons between measured and predicted parameters using different
methods show all techniques were successful but MRGC can predict better than others. The
developed models do not incorporate depthor lithological as part of the input parameters which means
the utilized methodology is applicable to any field.
Reference
[1] Huang.Y., Gedeon. T.D., Wong. P.M., An integrated neural-fuzzy-genetic-algorithm using hyper-
surfacemembership functions to predict permeability in petroleum reservoirs,J. Eng. Appl. Artif.
Intell,2001,14:15–21
[2]Cuddy.S.J.,Litho-facies and permeability prediction from electrical logs using fuzzy logic, 8th Abu
Dhabi International Petroleum Exhibition and Conf. SPE 49470,1998.
[3]Mohaghegh, S., Virtual-intelligence applications in petroleum engineering: Part I. Artificial neural
networks,J. Pet. Technol.2000,52: 64–73.
[4]Soto. B.R., Ardila. J.F., Ferneynes. H.,Bejarano. A., Use of neural networks to predict the
permeability and porosity ofzone ‘C’ of the Cantagallo field in Colombia Proc, SPE Petroleum
Computer Conf. Dallas, TX, SPE 38134, 1997.
[5]Wong. P.M, Henderson D.J, Brooks L.J, Reservoir Permeability Determination from Well Log
Data using Artificial Neural Networks: An Example from the Ravva Field, Offshore India, SPE Paper
38034, 1997.
[6]Matlab user's Guide 2012.Fuzzy logic, Direct Search toolboxes, Matlab CD-ROM, by the
Mathworks, Inc.
[7]Zadeh. L.A., Fuzzy sets. Information and Control, 1965, 8:338–353.
[8]Sugeno.M., Yasukawa. T., A fuzzy-logic based approach to qualitative modelling,IEEE Trans.
Syst. Man Cybern,1993.
[9]Mourot. G., Bousghiri. S. Ragot, J., Pattern Recognition for Diagnosis of Technological Systems:
A Review, proceeding of the IEEE International Conference on System, Man and Cybernetics, Le
Touquet, France, 1993.
[10]Shin-Ju. Y.,Rabiller.P, A New Tool for Electrofacies Analysis: Multi-Resolution Graph- Based
Clustering, SPWLA 41P
stP Annual Logging Symposium, June, 2000.
[11]Jarrah. O.A., Halawani. A., Recognition of gestures in Arabic sign language using neuro-fuzzy
systems,Artificial Intelligence,200,1133:117–138.

Morteza Nouri Taleghani et al. / International Journal of Petroleum and Geoscience Engineering (IJPGE) 1 (4): 284-295, 2013
295 | P a g e
[12]Anifowose.F., Abdulraheem. A., Fuzzy logic-driven and SVM-driven hybrid computational
intelligence models applied to oil and gas reservoir characterization, Journal of Natural Gas Science
and Engineering,2011, 3:505-517.
[13]Chiu. S.,Extracting fuzzy rules from data for function approximation and pattern classification,
Fuzzy Information Engineering: A Guided Tour of Applications. John Wiley & Sons, New
York,1997, 149–162.