Embed Size (px)
Citation preview

http://ijd.sagepub.com/Mechanics
International Journal of Damage
http://ijd.sagepub.com/content/early/2011/09/12/1056789511419984The online version of this article can be found at:
DOI: 10.1177/1056789511419984
published online 19 September 2011International Journal of Damage MechanicsShadi Riahi, Ali Nazari and Davood Ghasemi
Fly Ash and Rice Husk Bark Ash by Fuzzy LogicPrediction of Resistance to Water Damage of Geopolymers With Seeded
- Aug 7, 2012version of this article was published on more recent A
Published by:
http://www.sagepublications.com
can be found at:International Journal of Damage MechanicsAdditional services and information for
http://ijd.sagepub.com/cgi/alertsEmail Alerts:
http://ijd.sagepub.com/subscriptionsSubscriptions:
http://www.sagepub.com/journalsReprints.navReprints:
http://www.sagepub.com/journalsPermissions.navPermissions:
What is This?
- Sep 19, 2011 OnlineFirst Version of Record>>
- Aug 7, 2012Version of Record
at UNIV TORONTO on August 12, 2014ijd.sagepub.comDownloaded from at UNIV TORONTO on August 12, 2014ijd.sagepub.comDownloaded from
XML Template (2011) [5.9.2011–5:09pm] [1–21]K:/IJD/IJD 419984.3d (IJD) [PREPRINTER stage]
Prediction of Resistance to WaterDamage of Geopolymers with SeededFly Ash and Rice Husk Bark Ash
by Fuzzy Logic
SHADI RIAHI, ALI NAZARI* AND DAVOOD GHASEMI
Department of Materials Science and Engineering, Saveh Branch,Islamic Azad University, Saveh, Iran
ABSTRACT: In this study, percentage of water absorption of geopolymers madefrom seeded fly ash and rice husk bark ash has been predicted by fuzzy logic.Different specimens, made from a mixture of fly ash and rice husk bark ash infine and coarse forms, together with alkali activator made (a solution of waterglass and NaOH), were subjected to permeability tests at 7 and 28 days of curing.The curing regime was different: one set of the specimens was cured at room tem-perature until 7 and 28 days and the other sets were oven cured for 36 h at the range40�90�C and then cured at room temperature until 7 and 28 days. A model based onfuzzy logic for predicting the percentage of water absorption of the specimens hasbeen presented. To build the model, training and testing using experimental resultsfrom 120 specimens were conducted. The data used as inputs of fuzzy logic model arearranged in a format of six parameters that cover the percentage of fine fly ash in theashes mixture, the percentage of coarse fly ash in the ashes mixture, the percentage offine rice husk bark ash in the ashes mixture, the percentage of coarse rice husk barkash in the ashes mixture, the temperature of curing, and the time of water curing.According to these input parameters, in the fuzzy logic model, the percentage ofwater absorption of each specimen was predicted. It has been found that fuzzy modelwill be valid within the ranges of variables. The training and testing results in thefuzzy logic model have shown a strong potential for predicting the percentage ofwater absorption of the geopolymer specimens.
KEY WORDS: fly ash, FT-IR, fuzzy logic, geopolymer, particle size, percentage ofwater absorption, rice husk bark ash.
*Author to whom correspondence should be addressed. E-mail: [email protected]
Figures 2�4, 6 and 7 appear in color online: http://ijd.sagepub.com
International Journal of DAMAGE MECHANICS, 2011 1
1056-7895/11/00 0001–17 $10.00/0 DOI: 10.1177/1056789511419984� The Author(s), 2011. Reprints and permissions:http://www.sagepub.co.uk/journalsPermissions.nav
at UNIV TORONTO on August 12, 2014ijd.sagepub.comDownloaded from
XML Template (2011) [5.9.2011–5:09pm] [1–21]K:/IJD/IJD 419984.3d (IJD) [PREPRINTER stage]
INTRODUCTION
INORGANIC POLYMERS, ALSO known as geopolymers, are X-ray amorphousmaterials, usually aluminosilicates, composed of a network of ran-
domly arranged silicate and aluminate tetrahedra in conjunction withcharge-balancing alkali metal cations (Davidovits, 1991; Barbosa, 2000).Aluminosilicate geopolymers are conventionally synthesized at approxi-mately ambient temperature by the reaction of a solid aluminosilicatesource, e.g., dehydroxylated kaolin clay (metakaolinite) with an alkalisilicate solution under highly alkaline conditions (Davidovits, 1991;Barbosa, 2000). Industrial wastes such as fly ash (FA) or blast furnaceslag have also been proposed as the solid reactants, especially for low-energy cement applications (Davidovits, 2008), but the resulting productsare more properly described as alkali-activated cements. The main prop-erties of geopolymers are: quick compressive strength development, lowpermeability, resistance to acid attack, good resistance to freeze�thawcycles, and the tendency to drastically decrease the mobility of mostheavy metal ions contained within the geopolymeric structure (vanJaarsveld et al., 1997). Such properties make them interesting structuralproducts, such as concrete replacements in various environments, andimmobilization systems for heavy metal containments (Alvarez-Ayusoet al., 2008).
The properties of inorganic polymers depend on both the ratio of Si/Aland the types of the utilized raw material. FA is recently used as a sourcematerial to produce geopolymer because of its suitable chemical composi-tion along with favorable size and shape. FA is a by-product of coal-firedelectric power stations. Literature survey specifies that FA is primarilycomposed of SiO2, Al2O3, and Fe2O3. Since the quality of FA depends onthe type and the quality of coal along with the performance of the powerplant, sometimes difficulties remain in controlling its chemical composition.In order to achieve a suitable chemical composition to producegeopolymers, the preferred method is to blend FA with another high silicasource (Wongpa et al., 2010).
Rice husk bark ash (RHBA) is a solid waste generated by biomass powerplants using rice husk and eucalyptus bark as fuel. The power plantcompany providing RHBA for this research reported that about 450 tons/day of RHBA are produced and discarded. The major chemical constituentof RHBA is SiO2 (about 75%; Sata et al., 2007; Tangchirapat et al., 2008).Therefore, blending FA and RHBA can adjust the ratio of Si/Al as required.
Over the past two decades, a different modeling method based on fuzzylogic (FL) has become popular and has been used by many researchers for avariety of engineering applications. Fuzzy control theory can be applied on
2 S. RIAHI ET AL.
at UNIV TORONTO on August 12, 2014ijd.sagepub.comDownloaded from
XML Template (2011) [5.9.2011–5:09pm] [1–21]K:/IJD/IJD 419984.3d (IJD) [PREPRINTER stage]
linear and nonlinear systems. There is no need to handle the tedious math-ematical models of the controlled body. It needs only a simple controllingmethod to be set, based on engineering experience. Therefore, it is particu-larly useful in studying complicated structural control systems (Akkurtet al., 2004; Baykasoglu et al., 2004; Nazari and Milani, 2011). The percent-age of water absorption (PWA) of geopolymers can be calculated using themodels built with FL. It is convenient and easy to use these models fornumerical experiments to review the effects of each variable on the PWAvalues.
As per the authors’ knowledge, there are no works on utilizing a mixtureof FA and RHBA with seeded distribution of particles to produce geo-polymers. In addition, since the concept of geopolymers is completely newand there are few works on their properties, application of computer pro-grams like FL to predict their properties is rarely reported. The aim of thisstudy is to investigate the PWA of geopolymers produced from seeded FAand RHBA mixture experimentally and to present a suitable model based onFL to predict their PWA. Both FA and RHBA with two different particlesize distributions have been mixed with different amounts to produce fourclasses of geopolymers. PWA of the produced specimens has been investi-gated after specific times of curing. Totally, 120 data of permeability tests indifferent conditions were collected, trained, and tested by means of FL. Theobtained results have been compared by experimental ones to evaluate thesoftware power for predicting the PWA of the geopolymer specimens.
EXPERIMENTAL PROCEDURE
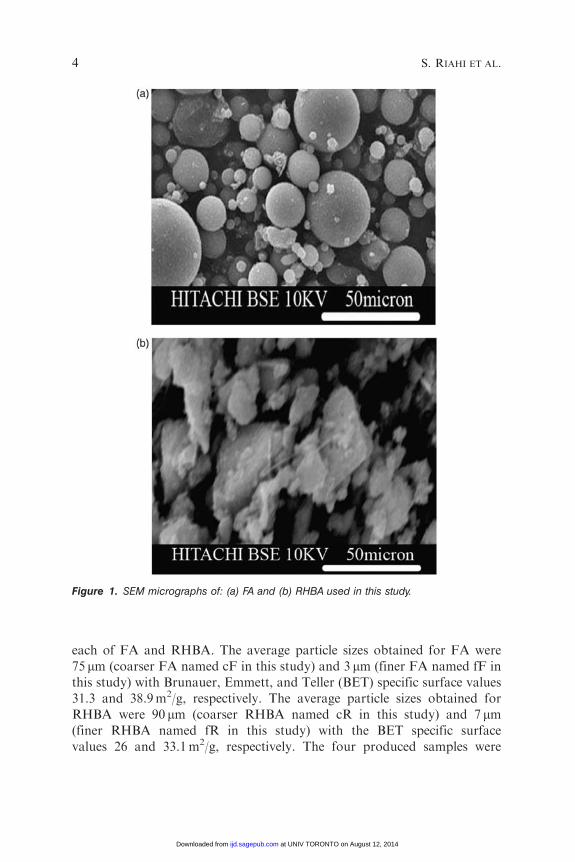
The cementitious materials used in this study were FA and RHBA. Theirchemical compositions have been illustrated in Table 1. In addition, Figure 1shows the scanning electron microscope (SEM) micrographs of the cemen-titious materials, respectively. The as-received ashes were sieved and theparticles passing the finesses of 150 and 33 mm grinded using Los Angelesmill for 30 and 180min, respectively, which yielded two different samples for
Table 1. Chemical compositions of FA, RHBA, and WG (wt%).
Material SiO2 Al2O3 Fe2O3 CaO SO3 Na2O Loss on ignition
FA 35.21 23.23 12.36 20.01 2.36 0.36 0.24RHBA 81.36 0.4 0.12 3.23 0.85 � 3.55WG 34.21 � � � � 13.11 �
Prediction Resistance to Water Damage 3
at UNIV TORONTO on August 12, 2014ijd.sagepub.comDownloaded from
XML Template (2011) [5.9.2011–5:09pm] [1–21]K:/IJD/IJD 419984.3d (IJD) [PREPRINTER stage]
each of FA and RHBA. The average particle sizes obtained for FA were75 mm (coarser FA named cF in this study) and 3 mm (finer FA named fF inthis study) with Brunauer, Emmett, and Teller (BET) specific surface values31.3 and 38.9m2/g, respectively. The average particle sizes obtained forRHBA were 90 mm (coarser RHBA named cR in this study) and 7 mm(finer RHBA named fR in this study) with the BET specific surfacevalues 26 and 33.1m2/g, respectively. The four produced samples were
Figure 1. SEM micrographs of: (a) FA and (b) RHBA used in this study.
4 S. RIAHI ET AL.
at UNIV TORONTO on August 12, 2014ijd.sagepub.comDownloaded from
XML Template (2011) [5.9.2011–5:09pm] [1–21]K:/IJD/IJD 419984.3d (IJD) [PREPRINTER stage]
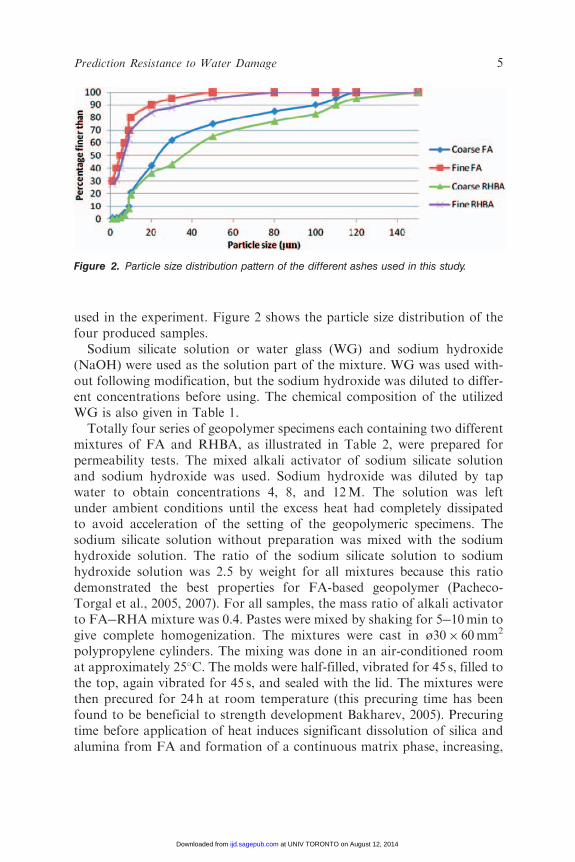
used in the experiment. Figure 2 shows the particle size distribution of thefour produced samples.
Sodium silicate solution or water glass (WG) and sodium hydroxide(NaOH) were used as the solution part of the mixture. WG was used with-out following modification, but the sodium hydroxide was diluted to differ-ent concentrations before using. The chemical composition of the utilizedWG is also given in Table 1.
Totally four series of geopolymer specimens each containing two differentmixtures of FA and RHBA, as illustrated in Table 2, were prepared forpermeability tests. The mixed alkali activator of sodium silicate solutionand sodium hydroxide was used. Sodium hydroxide was diluted by tapwater to obtain concentrations 4, 8, and 12M. The solution was leftunder ambient conditions until the excess heat had completely dissipatedto avoid acceleration of the setting of the geopolymeric specimens. Thesodium silicate solution without preparation was mixed with the sodiumhydroxide solution. The ratio of the sodium silicate solution to sodiumhydroxide solution was 2.5 by weight for all mixtures because this ratiodemonstrated the best properties for FA-based geopolymer (Pacheco-Torgal et al., 2005, 2007). For all samples, the mass ratio of alkali activatorto FA�RHA mixture was 0.4. Pastes were mixed by shaking for 5�10min togive complete homogenization. The mixtures were cast in ø30� 60mm2
polypropylene cylinders. The mixing was done in an air-conditioned roomat approximately 25�C. The molds were half-filled, vibrated for 45 s, filled tothe top, again vibrated for 45 s, and sealed with the lid. The mixtures werethen precured for 24 h at room temperature (this precuring time has beenfound to be beneficial to strength development Bakharev, 2005). Precuringtime before application of heat induces significant dissolution of silica andalumina from FA and formation of a continuous matrix phase, increasing,
Figure 2. Particle size distribution pattern of the different ashes used in this study.
Prediction Resistance to Water Damage 5
at UNIV TORONTO on August 12, 2014ijd.sagepub.comDownloaded from
XML Template (2011) [5.9.2011–5:09pm] [1–21]K:/IJD/IJD 419984.3d (IJD) [PREPRINTER stage]
therefore, the homogeneity of the geopolymeric materials (Bakharev, 2005;Chindaprasirt et al., 2007). After the precuring process, the samples andmolds were placed in a water bath to prevent moisture loss and thecarbonation of the surface. One batch of these samples was placed in anair-conditioned room at 25�C. The other batch was put in the oven atelevated temperatures of range 50�90�C for 36 h. To determine the mosteffective alkali concentration on PWA, one set of the specimens cured at80�C for 36 h was subjected to permeability tests. Afterward, the other setsof samples were tested at 7 and 28 days of curing (for the specimens cured inelevated temperature, the times of oven-curing were also considered).
To prepare the water permeability testing specimens, 1 cm was removedfrom the top and bottom of the samples from each mixture to avoid anyeffects caused by surface paste. Hence, the samples having ø30� 40mm2
were used as representative specimens for each mixture. Nonshrinkingepoxy resin was cast around all specimens with a thickness of 25mm toprevent water leakage. These specimens were installed in housing cells totest their water permeability. In this study, to evaluate the water permeabil-ity of the specimens, PWA is an evaluation of the pore volume or porosity ofconcrete after hardening, which is occupied by water in saturated state.Water absorption values of the samples were measured in accordance tothe ASTM C 642 after 7 and 28 days of moisture curing adapted to themethod employed for concrete specimens.
Table 2. Mixture proportioning of the utilized FA and RHBA to producegeopolymeric specimens.
Sampledesignation
Weightpercent
of fine FA(fF wt%)
Weightpercent ofcoarse FA(cF wt%)
Weightpercent offine RHBA(fR wt%)
Weightpercent
of coarseRHBA (cR wt%)
SiO2/Al2O3
ratio
fF�fR-1 60 0 40 0 3.81fF�fR-2 70 0 30 0 2.99fF�fR-3 80 0 20 0 2.38fF�cR-1 60 0 0 40 3.81fF�cR-2 70 0 0 30 2.99fF�cR-3 80 0 0 20 2.38cF�fR-1 0 60 40 0 3.81cF�fR-2 0 70 30 0 2.99cF�fR-3 0 80 20 0 2.38cF�cR-1 0 60 0 40 3.81cF�cR-2 0 70 0 30 2.99cF�cR-3 0 80 0 20 2.38
Note: Alkali activator (WGþNaOH) to FA�RHBA mixture ratio is 0.4.
6 S. RIAHI ET AL.
at UNIV TORONTO on August 12, 2014ijd.sagepub.comDownloaded from
XML Template (2011) [5.9.2011–5:09pm] [1–21]K:/IJD/IJD 419984.3d (IJD) [PREPRINTER stage]
The microstructural characteristic of geopolymeric specimens, made atthe optimum condition and with a high resistance to water absorption,was analyzed using Fourier transform infrared (FT-IR) spectroscopy. Thepowder samples were mixed with KBr at a concentration of 0.2�1.0 wt% tomake the KBr discs. Then the discs were evaluated using a Perkin ElmerFT-IR microscope.
EXPERIMENTAL RESULTS AND DISCUSSION
Percentage of Water Absorption
The PWA of the produced specimens has been illustrated in Table 3 for7 and 28 days of curing. Table 3 shows that the best strength has beenachieved for fF�fR2 specimen cured at 80�C for 36 h in both 7- and28-day curing regimes. As Table 3 shows, the optimum curing conditionfor all the mixtures is at 80�C. Curing temperature has a significant effecton the properties of geopolymers because it affects the specimens’ settingand hardening. Synthesized products are known to be very sensitive toexperimental conditions (Fernandez-Jimenez et al., 2007). However, thePWA begins to increase after curing for a certain period of time at ahigher temperature. Prolonged curing at higher temperatures can breakdown the granular structure of geopolymer mixture. This results in
Table 3. PWA values of the geopolymeric specimens (wt%).
Age of curing 7 day 28 day
Temperature ofoven curing 25�C 40�C 60�C 80�C 90�C 25�C 40�C 60�C 80�C 90�C
fF�fR-1 1.61 1.31 1.45 1.06 1.41 1.29 1.05 1.16 0.85 1.13fF�fR-2 1.26 1.39 1 0.9 1 1.01 1.11 0.8 0.72 0.8fF�fR-3 1.44 1.49 1.41 1.01 1.13 1.15 1.19 1.13 0.81 0.9fF�cR-1 1.76 1.49 1.61 1.12 1.49 1.42 1.2 1.3 0.9 1.2fF�cR-2 1.38 1.51 1.09 0.98 1.09 1.11 1.22 0.88 0.79 0.88fF�cR-3 1.57 1.62 1.54 1.1 1.23 1.27 1.31 1.24 0.89 0.99cF�fR-1 2.11 1.78 1.93 1.33 1.78 1.66 1.4 1.52 1.05 1.4cF�fR-2 1.65 1.82 1.31 1.17 1.31 1.3 1.43 1.03 0.92 1.03cF�fR-3 1.89 1.94 1.84 1.32 1.47 1.49 1.53 1.45 1.04 1.16cF�cR-1 2.63 2.22 2.41 1.66 2.22 2.04 1.72 1.87 1.29 1.72cF�cR-2 2.06 2.27 1.64 1.46 1.64 1.6 1.76 1.27 1.13 1.27cF�cR-3 2.36 2.43 2.3 1.65 1.84 1.83 1.88 1.78 1.28 1.43
Note: Alkali activator (WGþ silicate sodium) to FA�RHBA mixture ratio is 0.4.
Prediction Resistance to Water Damage 7
at UNIV TORONTO on August 12, 2014ijd.sagepub.comDownloaded from
XML Template (2011) [5.9.2011–5:09pm] [1–21]K:/IJD/IJD 419984.3d (IJD) [PREPRINTER stage]
dehydration and excessive shrinkage due to contraction of the gel,which does not transform into a more semi-crystalline form (vanJaarsveld et al., 2002).
On the whole, samples made with the fine RHBA and FA particles(fF�fR series) showed considerably higher resistance to water permeabilitythan the other series. This may be due to the production of more compactedspecimens. Fine particles are capable to fill the vacancies and produce moredensified specimens. This has been confirmed in some works done on con-crete specimens (Naji Givi et al., 2010), but as per authors’ knowledge, thereis no report confirming this matter in geopolymers.
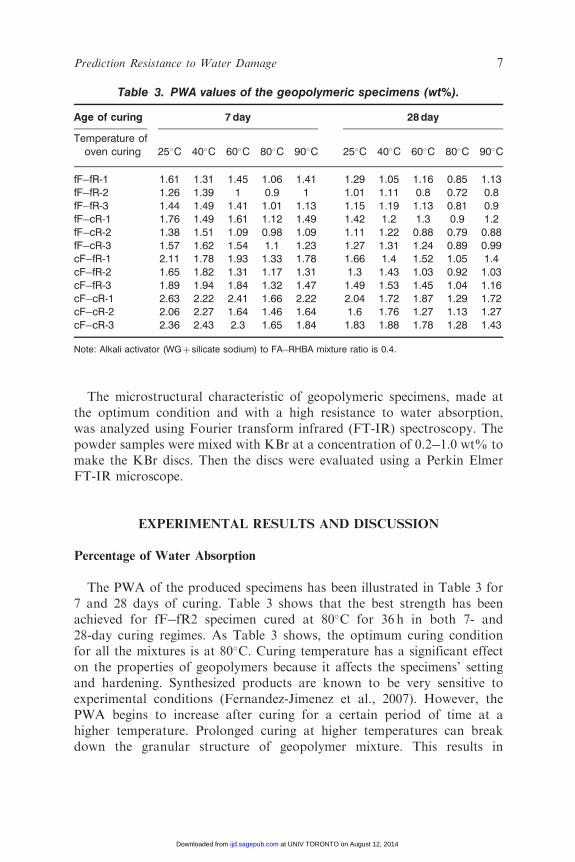
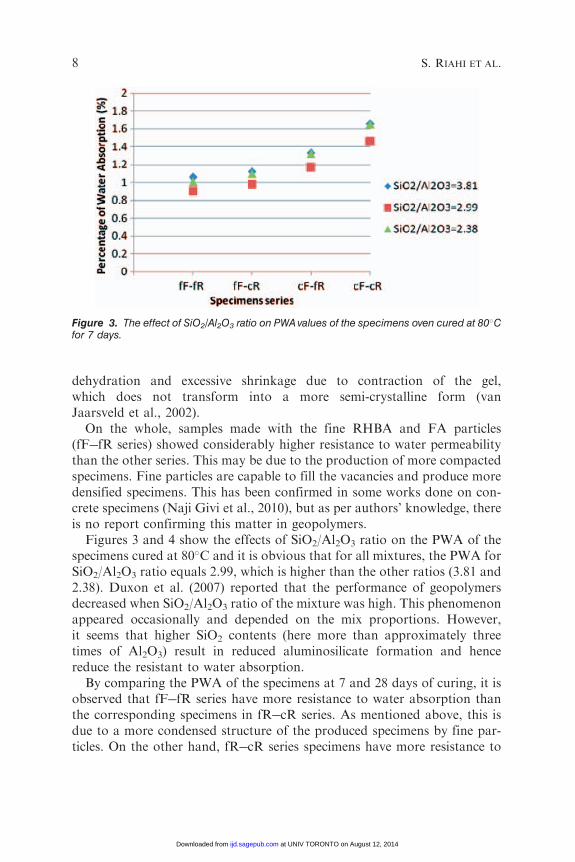
Figures 3 and 4 show the effects of SiO2/Al2O3 ratio on the PWA of thespecimens cured at 80�C and it is obvious that for all mixtures, the PWA forSiO2/Al2O3 ratio equals 2.99, which is higher than the other ratios (3.81 and2.38). Duxon et al. (2007) reported that the performance of geopolymersdecreased when SiO2/Al2O3 ratio of the mixture was high. This phenomenonappeared occasionally and depended on the mix proportions. However,it seems that higher SiO2 contents (here more than approximately threetimes of Al2O3) result in reduced aluminosilicate formation and hencereduce the resistant to water absorption.
By comparing the PWA of the specimens at 7 and 28 days of curing, it isobserved that fF�fR series have more resistance to water absorption thanthe corresponding specimens in fR�cR series. As mentioned above, this isdue to a more condensed structure of the produced specimens by fine par-ticles. On the other hand, fR�cR series specimens have more resistance to
Figure 3. The effect of SiO2/Al2O3 ratio on PWA values of the specimens oven cured at 80�Cfor 7 days.
8 S. RIAHI ET AL.
at UNIV TORONTO on August 12, 2014ijd.sagepub.comDownloaded from
XML Template (2011) [5.9.2011–5:09pm] [1–21]K:/IJD/IJD 419984.3d (IJD) [PREPRINTER stage]
water absorption than the corresponding specimens in cF�fR series.
Although fR has been used in cF�fR series, the higher content of cF inthese series results in the reduction of resistance to water absorption com-pared to the corresponding samples in fR�cR series. Once again, this con-firms that the higher content of fine particles would result in more resistanceto water absorption.
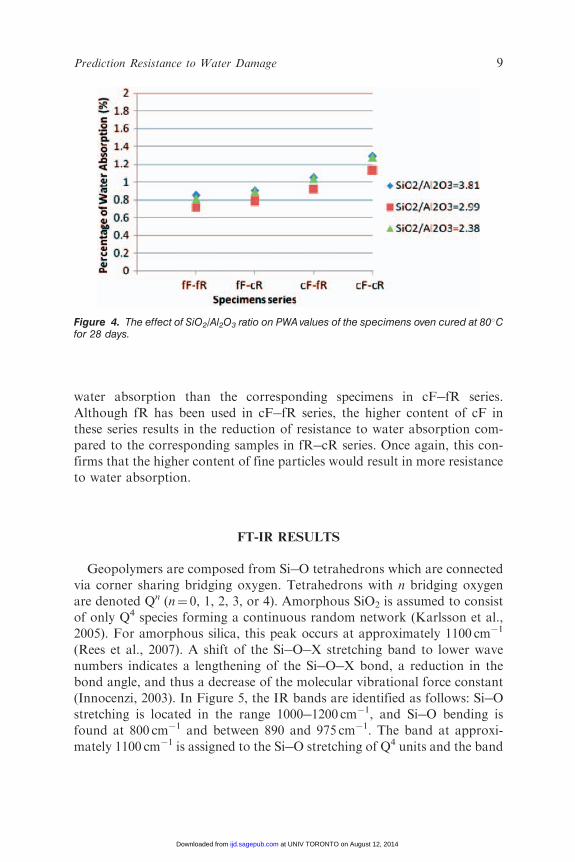
FT-IR RESULTS
Geopolymers are composed from Si�O tetrahedrons which are connectedvia corner sharing bridging oxygen. Tetrahedrons with n bridging oxygenare denoted Qn (n¼ 0, 1, 2, 3, or 4). Amorphous SiO2 is assumed to consistof only Q4 species forming a continuous random network (Karlsson et al.,2005). For amorphous silica, this peak occurs at approximately 1100 cm�1
(Rees et al., 2007). A shift of the Si�O�X stretching band to lower wavenumbers indicates a lengthening of the Si�O�X bond, a reduction in thebond angle, and thus a decrease of the molecular vibrational force constant(Innocenzi, 2003). In Figure 5, the IR bands are identified as follows: Si�Ostretching is located in the range 1000�1200 cm�1, and Si�O bending isfound at 800 cm�1 and between 890 and 975 cm�1. The band at approxi-
mately 1100 cm�1 is assigned to the Si�O stretching of Q4 units and the band
Figure 4. The effect of SiO2/Al2O3 ratio on PWA values of the specimens oven cured at 80�Cfor 28 days.
Prediction Resistance to Water Damage 9
at UNIV TORONTO on August 12, 2014ijd.sagepub.comDownloaded from
XML Template (2011) [5.9.2011–5:09pm] [1–21]K:/IJD/IJD 419984.3d (IJD) [PREPRINTER stage]
at 1050 cm�1 to Q3 units with a nonbridging oxygen (Si�O�NBO) per SiO4
tetrahedron (Zholobenko et al., 1997).From Figure 5, it is seen that an increase in the fine FA particles shifts the
position of the maximum absorbance of Si�O bands toward lower wavenumbers, indicating the transformation of Q4 units to Q3 units. Moreover,the emerging of a new band centered on 900 cm�1 is observed, which isassigned to Si�O stretching of Q2 unit with two nonbridging oxygens perSiO4 tetrahedron (Serra et al., 2002). The observed increase in the signal at2380 cm�1 can be assigned to CO2, which has reacted with increasingamounts of NaOH leading to the formation of HCO3
�.The observed change in the FT-IR spectra from mainly consisting of Q4
units to Q3 and Q2 units with increasing fine FA particles can be applied toinvestigate the change in composition during preparation.
ARCHITECTURE OF FUZZY LOGIC
Fuzzy set theory was developed by Lotfi Zadeh (1965) to deal with theimprecision and uncertainty that is often present in real-world applications(Ramezanianpour et al., 2004). Mamdani (1974) by applying Lotfi Zadeh’stheories of linguistic approach and fuzzy inference, successfully used the‘IF�THEN’ rule on the automatic operating control of steam generator.There is no need to handle the tedious mathematical models of a controlledbody. It needs only a simple controlling method to be set, based on
Figure 5. FT-IR results of the selected specimens: (a) fF�fR-2, (b) fF�cR-2, (c) cF�fR-2, and(d) cF�cR specimens.
10 S. RIAHI ET AL.
at UNIV TORONTO on August 12, 2014ijd.sagepub.comDownloaded from
XML Template (2011) [5.9.2011–5:09pm] [1–21]K:/IJD/IJD 419984.3d (IJD) [PREPRINTER stage]
engineering experience. Therefore, it is particularly useful in complicatedstructural control systems. Since it does not involve complicated mathemat-ical calculations and the time of system delay is reduced in the process ofoperations, lowering of its impact on the controlling effects can be expected.Furthermore, since the fuzzy control method is easy to comprehend and toamend, it can be adjusted according to the actual situation. Its effectivenessis therefore confirmed. Now, fuzzy control has become most successfully inthe application of fuzzy theory.
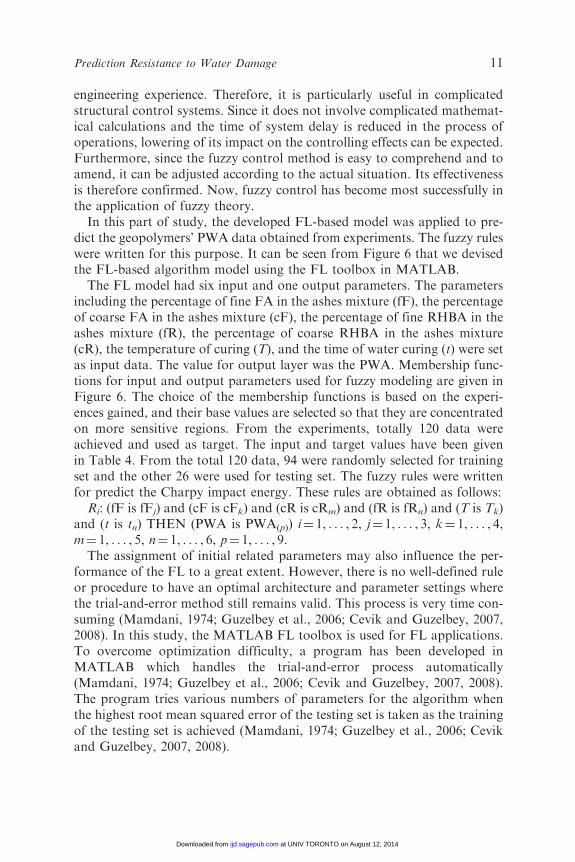
In this part of study, the developed FL-based model was applied to pre-dict the geopolymers’ PWA data obtained from experiments. The fuzzy ruleswere written for this purpose. It can be seen from Figure 6 that we devisedthe FL-based algorithm model using the FL toolbox in MATLAB.
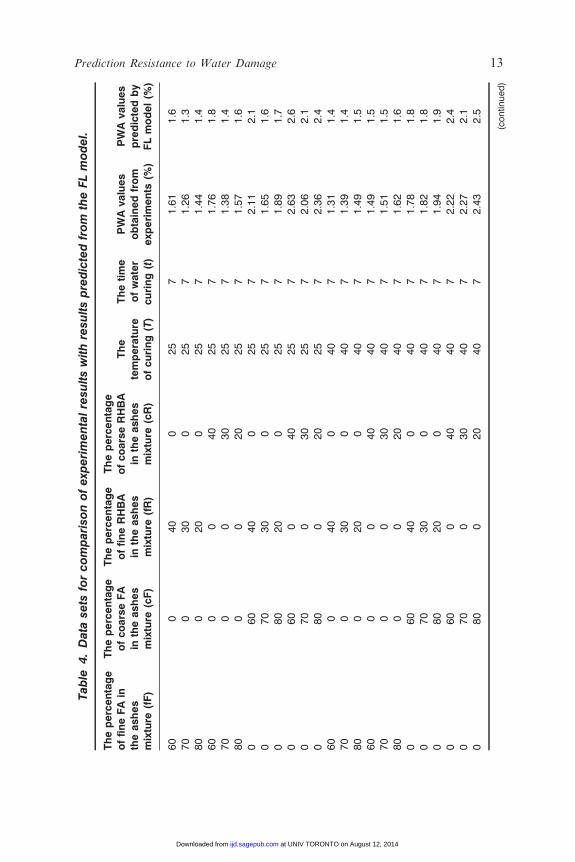
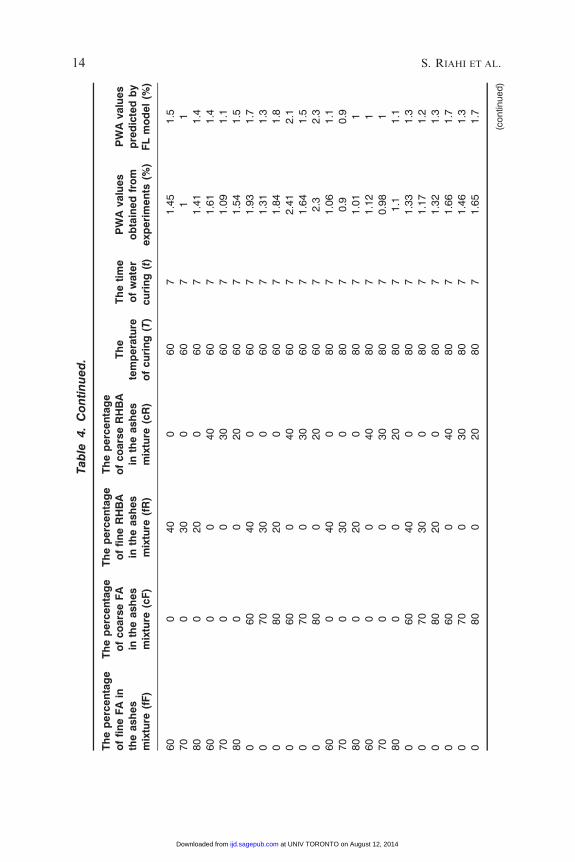
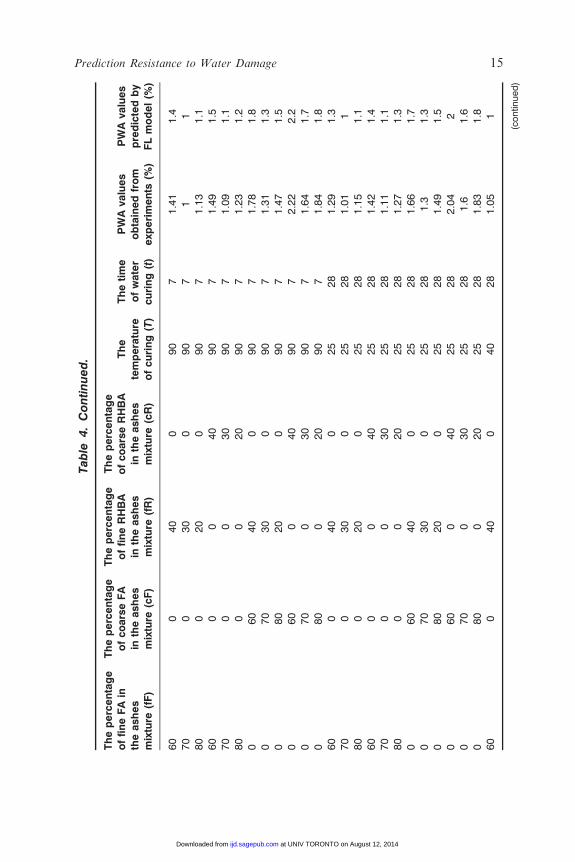
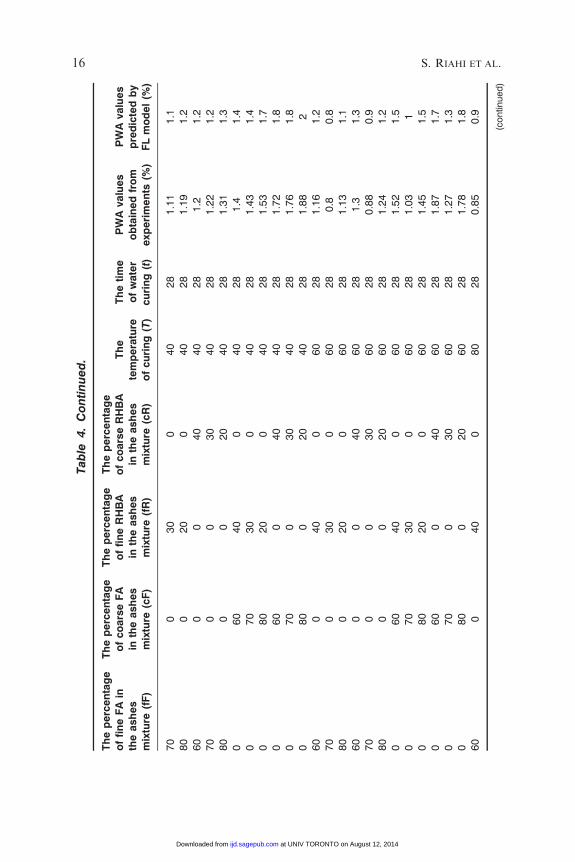
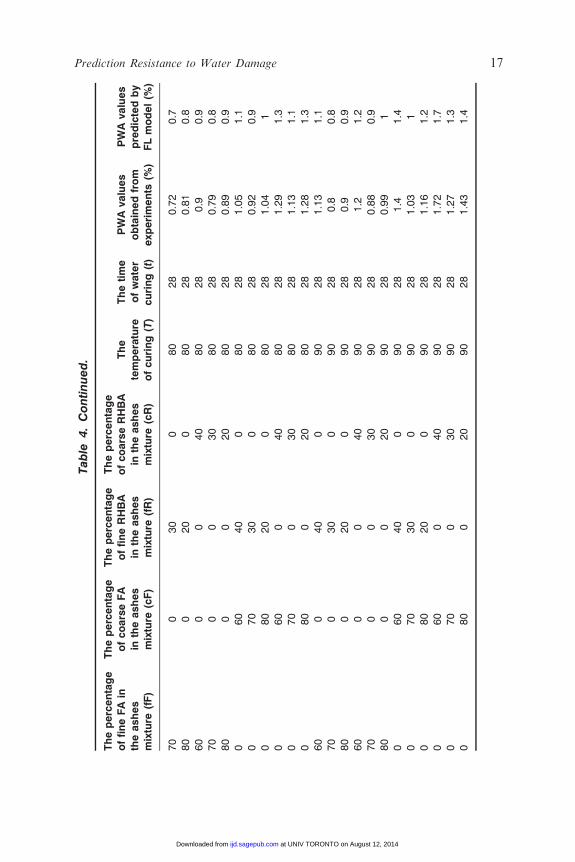
The FL model had six input and one output parameters. The parametersincluding the percentage of fine FA in the ashes mixture (fF), the percentageof coarse FA in the ashes mixture (cF), the percentage of fine RHBA in theashes mixture (fR), the percentage of coarse RHBA in the ashes mixture(cR), the temperature of curing (T), and the time of water curing (t) were setas input data. The value for output layer was the PWA. Membership func-tions for input and output parameters used for fuzzy modeling are given inFigure 6. The choice of the membership functions is based on the experi-ences gained, and their base values are selected so that they are concentratedon more sensitive regions. From the experiments, totally 120 data wereachieved and used as target. The input and target values have been givenin Table 4. From the total 120 data, 94 were randomly selected for trainingset and the other 26 were used for testing set. The fuzzy rules were writtenfor predict the Charpy impact energy. These rules are obtained as follows:
Ri: (fF is fFj) and (cF is cFk) and (cR is cRm) and (fR is fRn) and (T is Tk)and (t is tn) THEN (PWA is PWA(p)) i¼ 1, . . . , 2, j¼ 1, . . . , 3, k¼ 1, . . . , 4,m¼ 1, . . . , 5, n¼ 1, . . . , 6, p¼ 1, . . . , 9.
The assignment of initial related parameters may also influence the per-formance of the FL to a great extent. However, there is no well-defined ruleor procedure to have an optimal architecture and parameter settings wherethe trial-and-error method still remains valid. This process is very time con-suming (Mamdani, 1974; Guzelbey et al., 2006; Cevik and Guzelbey, 2007,2008). In this study, the MATLAB FL toolbox is used for FL applications.To overcome optimization difficulty, a program has been developed inMATLAB which handles the trial-and-error process automatically(Mamdani, 1974; Guzelbey et al., 2006; Cevik and Guzelbey, 2007, 2008).The program tries various numbers of parameters for the algorithm whenthe highest root mean squared error of the testing set is taken as the trainingof the testing set is achieved (Mamdani, 1974; Guzelbey et al., 2006; Cevikand Guzelbey, 2007, 2008).
Prediction Resistance to Water Damage 11
at UNIV TORONTO on August 12, 2014ijd.sagepub.comDownloaded from
XML Template (2011) [5.9.2011–5:09pm] [1–21]K:/IJD/IJD 419984.3d (IJD) [PREPRINTER stage]
PREDICTED RESULTS AND DISCUSSION
In this study, the error arose during the training and testing in FL model
can be expressed as absolute fraction of variance (R2) which are calculated
by Equation (1) (Topcu and Sarıdemir, 2008):
R2 ¼ 1�
Pi ðti � oiÞ
2Pi ðoiÞ
2
!ð1Þ
where t is the target value and o the output value
the percentage of fine fly ash in the ashes mixture
the percentage of coarse fly ash in the ashes mixture
the percentage of fine rice husk bark ash in the ashes mixture
the percentage of coarse rice husk bark ash in the ashes mixture
the temperature of curing
the time of water curing
Percentage of Water Absorption
Fuzzy Logic Model
Figure 6. Block diagram used for fuzzy modeling.
12 S. RIAHI ET AL.
at UNIV TORONTO on August 12, 2014ijd.sagepub.comDownloaded from
XML Template (2011) [5.9.2011–5:09pm] [1–21]K:/IJD/IJD 419984.3d (IJD) [PREPRINTER stage]
Tab
le4
.D
ata
sets
for
co
mp
ari
son
of
exp
eri
me
nta
lre
sult
sw
ith
resu
lts
pre
dic
ted
fro
mth
eFL
mo
de
l.
Th
ep
erc
en
tag
eo
ffi
ne
FA
inth
ea
sh
es
mix
ture
(fF
)
Th
ep
erc
en
tag
eo
fco
ars
eF
Ain
the
ash
es
mix
ture
(cF
)
Th
ep
erc
en
tag
eo
ffi
ne
RH
BA
inth
ea
sh
es
mix
ture
(fR
)
Th
ep
erc
en
tag
eo
fco
ars
eR
HB
Ain
the
ash
es
mix
ture
(cR
)
Th
ete
mp
era
ture
of
cu
rin
g(T
)
Th
eti
me
of
wa
ter
cu
rin
g(t
)
PW
Ava
lue
so
bta
ine
dfr
om
exp
eri
me
nts
(%)
PW
Ava
lue
sp
red
icte
db
yF
Lm
od
el
(%)
60
04
00
25
71
.61
1.6
70
03
00
25
71
.26
1.3
80
02
00
25
71
.44
1.4
60
00
40
25
71
.76
1.8
70
00
30
25
71
.38
1.4
80
00
20
25
71
.57
1.6
06
04
00
25
72
.11
2.1
07
03
00
25
71
.65
1.6
08
02
00
25
71
.89
1.7
06
00
40
25
72
.63
2.6
07
00
30
25
72
.06
2.1
08
00
20
25
72
.36
2.4
60
04
00
40
71
.31
1.4
70
03
00
40
71
.39
1.4
80
02
00
40
71
.49
1.5
60
00
40
40
71
.49
1.5
70
00
30
40
71
.51
1.5
80
00
20
40
71
.62
1.6
06
04
00
40
71
.78
1.8
07
03
00
40
71
.82
1.8
08
02
00
40
71
.94
1.9
06
00
40
40
72
.22
2.4
07
00
30
40
72
.27
2.1
08
00
20
40
72
.43
2.5
(co
ntin
ue
d)
Prediction Resistance to Water Damage 13
at UNIV TORONTO on August 12, 2014ijd.sagepub.comDownloaded from
XML Template (2011) [5.9.2011–5:09pm] [1–21]K:/IJD/IJD 419984.3d (IJD) [PREPRINTER stage]
Tab
le4
.C
on
tin
ue
d.
Th
ep
erc
en
tag
eo
ffi
ne
FA
inth
ea
sh
es
mix
ture
(fF
)
Th
ep
erc
en
tag
eo
fco
ars
eF
Ain
the
ash
es
mix
ture
(cF
)
Th
ep
erc
en
tag
eo
ffi
ne
RH
BA
inth
ea
sh
es
mix
ture
(fR
)
Th
ep
erc
en
tag
eo
fco
ars
eR
HB
Ain
the
ash
es
mix
ture
(cR
)
Th
ete
mp
era
ture
of
cu
rin
g(T
)
Th
eti
me
of
wa
ter
cu
rin
g(t
)
PW
Ava
lue
so
bta
ine
dfr
om
exp
eri
me
nts
(%)
PW
Ava
lue
sp
red
icte
db
yF
Lm
od
el
(%)
60
04
00
60
71
.45
1.5
70
03
00
60
71
18
00
20
06
07
1.4
11
.46
00
04
06
07
1.6
11
.47
00
03
06
07
1.0
91
.18
00
02
06
07
1.5
41
.50
60
40
06
07
1.9
31
.70
70
30
06
07
1.3
11
.30
80
20
06
07
1.8
41
.80
60
04
06
07
2.4
12
.10
70
03
06
07
1.6
41
.50
80
02
06
07
2.3
2.3
60
04
00
80
71
.06
1.1
70
03
00
80
70
.90
.98
00
20
08
07
1.0
11
60
00
40
80
71
.12
17
00
03
08
07
0.9
81
80
00
20
80
71
.11
.10
60
40
08
07
1.3
31
.30
70
30
08
07
1.1
71
.20
80
20
08
07
1.3
21
.30
60
04
08
07
1.6
61
.70
70
03
08
07
1.4
61
.30
80
02
08
07
1.6
51
.7
(co
ntin
ue
d)
14 S. RIAHI ET AL.
at UNIV TORONTO on August 12, 2014ijd.sagepub.comDownloaded from
XML Template (2011) [5.9.2011–5:09pm] [1–21]K:/IJD/IJD 419984.3d (IJD) [PREPRINTER stage]
Tab
le4
.C
on
tin
ue
d.
Th
ep
erc
en
tag
eo
ffi
ne
FA
inth
ea
sh
es
mix
ture
(fF
)
Th
ep
erc
en
tag
eo
fco
ars
eF
Ain
the
ash
es
mix
ture
(cF
)
Th
ep
erc
en
tag
eo
ffi
ne
RH
BA
inth
ea
sh
es
mix
ture
(fR
)
Th
ep
erc
en
tag
eo
fco
ars
eR
HB
Ain
the
ash
es
mix
ture
(cR
)
Th
ete
mp
era
ture
of
cu
rin
g(T
)
Th
eti
me
of
wa
ter
cu
rin
g(t
)
PW
Ava
lue
so
bta
ine
dfr
om
exp
eri
me
nts
(%)
PW
Ava
lue
sp
red
icte
db
yF
Lm
od
el
(%)
60
04
00
90
71
.41
1.4
70
03
00
90
71
18
00
20
09
07
1.1
31
.16
00
04
09
07
1.4
91
.57
00
03
09
07
1.0
91
.18
00
02
09
07
1.2
31
.20
60
40
09
07
1.7
81
.80
70
30
09
07
1.3
11
.30
80
20
09
07
1.4
71
.50
60
04
09
07
2.2
22
.20
70
03
09
07
1.6
41
.70
80
02
09
07
1.8
41
.86
00
40
02
52
81
.29
1.3
70
03
00
25
28
1.0
11
80
02
00
25
28
1.1
51
.16
00
04
02
52
81
.42
1.4
70
00
30
25
28
1.1
11
.18
00
02
02
52
81
.27
1.3
06
04
00
25
28
1.6
61
.70
70
30
02
52
81
.31
.30
80
20
02
52
81
.49
1.5
06
00
40
25
28
2.0
42
07
00
30
25
28
1.6
1.6
08
00
20
25
28
1.8
31
.86
00
40
04
02
81
.05
1
(co
ntin
ue
d)
Prediction Resistance to Water Damage 15
at UNIV TORONTO on August 12, 2014ijd.sagepub.comDownloaded from
XML Template (2011) [5.9.2011–5:09pm] [1–21]K:/IJD/IJD 419984.3d (IJD) [PREPRINTER stage]
Tab
le4
.C
on
tin
ue
d.
Th
ep
erc
en
tag
eo
ffi
ne
FA
inth
ea
sh
es
mix
ture
(fF
)
Th
ep
erc
en
tag
eo
fco
ars
eF
Ain
the
ash
es
mix
ture
(cF
)
Th
ep
erc
en
tag
eo
ffi
ne
RH
BA
inth
ea
sh
es
mix
ture
(fR
)
Th
ep
erc
en
tag
eo
fco
ars
eR
HB
Ain
the
ash
es
mix
ture
(cR
)
Th
ete
mp
era
ture
of
cu
rin
g(T
)
Th
eti
me
of
wa
ter
cu
rin
g(t
)
PW
Ava
lue
so
bta
ine
dfr
om
exp
eri
me
nts
(%)
PW
Ava
lue
sp
red
icte
db
yF
Lm
od
el
(%)
70
03
00
40
28
1.1
11
.18
00
20
04
02
81
.19
1.2
60
00
40
40
28
1.2
1.2
70
00
30
40
28
1.2
21
.28
00
02
04
02
81
.31
1.3
06
04
00
40
28
1.4
1.4
07
03
00
40
28
1.4
31
.40
80
20
04
02
81
.53
1.7
06
00
40
40
28
1.7
21
.80
70
03
04
02
81
.76
1.8
08
00
20
40
28
1.8
82
60
04
00
60
28
1.1
61
.27
00
30
06
02
80
.80
.88
00
20
06
02
81
.13
1.1
60
00
40
60
28
1.3
1.3
70
00
30
60
28
0.8
80
.98
00
02
06
02
81
.24
1.2
06
04
00
60
28
1.5
21
.50
70
30
06
02
81
.03
10
80
20
06
02
81
.45
1.5
06
00
40
60
28
1.8
71
.70
70
03
06
02
81
.27
1.3
08
00
20
60
28
1.7
81
.86
00
40
08
02
80
.85
0.9
(co
ntin
ue
d)
16 S. RIAHI ET AL.
at UNIV TORONTO on August 12, 2014ijd.sagepub.comDownloaded from
XML Template (2011) [5.9.2011–5:09pm] [1–21]K:/IJD/IJD 419984.3d (IJD) [PREPRINTER stage]
Tab
le4
.C
on
tin
ue
d.
Th
ep
erc
en
tag
eo
ffi
ne
FA
inth
ea
sh
es
mix
ture
(fF
)
Th
ep
erc
en
tag
eo
fco
ars
eF
Ain
the
ash
es
mix
ture
(cF
)
Th
ep
erc
en
tag
eo
ffi
ne
RH
BA
inth
ea
sh
es
mix
ture
(fR
)
Th
ep
erc
en
tag
eo
fco
ars
eR
HB
Ain
the
ash
es
mix
ture
(cR
)
Th
ete
mp
era
ture
of
cu
rin
g(T
)
Th
eti
me
of
wa
ter
cu
rin
g(t
)
PW
Ava
lue
so
bta
ine
dfr
om
exp
eri
me
nts
(%)
PW
Ava
lue
sp
red
icte
db
yF
Lm
od
el
(%)
70
03
00
80
28
0.7
20
.78
00
20
08
02
80
.81
0.8
60
00
40
80
28
0.9
0.9
70
00
30
80
28
0.7
90
.88
00
02
08
02
80
.89
0.9
06
04
00
80
28
1.0
51
.10
70
30
08
02
80
.92
0.9
08
02
00
80
28
1.0
41
06
00
40
80
28
1.2
91
.30
70
03
08
02
81
.13
1.1
08
00
20
80
28
1.2
81
.36
00
40
09
02
81
.13
1.1
70
03
00
90
28
0.8
0.8
80
02
00
90
28
0.9
0.9
60
00
40
90
28
1.2
1.2
70
00
30
90
28
0.8
80
.98
00
02
09
02
80
.99
10
60
40
09
02
81
.41
.40
70
30
09
02
81
.03
10
80
20
09
02
81
.16
1.2
06
00
40
90
28
1.7
21
.70
70
03
09
02
81
.27
1.3
08
00
20
90
28
1.4
31
.4
Prediction Resistance to Water Damage 17
at UNIV TORONTO on August 12, 2014ijd.sagepub.comDownloaded from
XML Template (2011) [5.9.2011–5:09pm] [1–21]K:/IJD/IJD 419984.3d (IJD) [PREPRINTER stage]
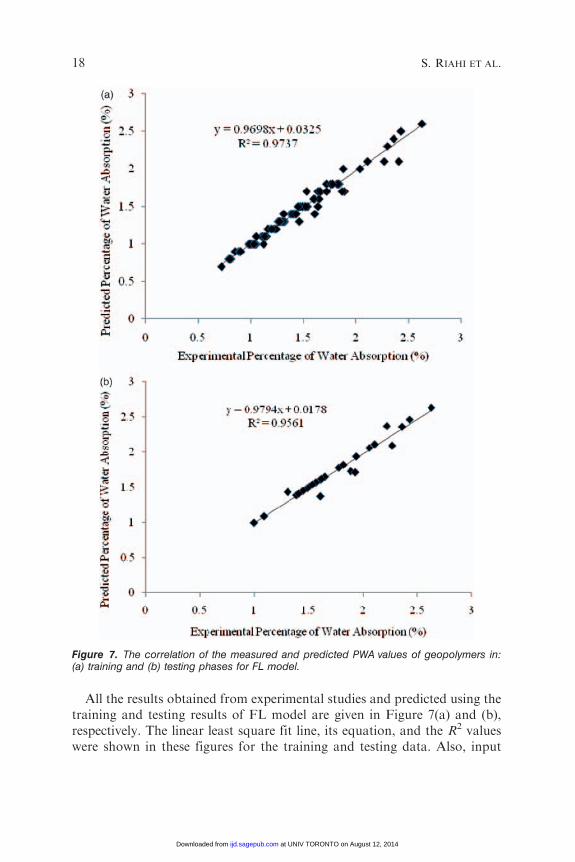
All the results obtained from experimental studies and predicted using thetraining and testing results of FL model are given in Figure 7(a) and (b),respectively. The linear least square fit line, its equation, and the R2 valueswere shown in these figures for the training and testing data. Also, input
Figure 7. The correlation of the measured and predicted PWA values of geopolymers in:(a) training and (b) testing phases for FL model.
18 S. RIAHI ET AL.
at UNIV TORONTO on August 12, 2014ijd.sagepub.comDownloaded from
XML Template (2011) [5.9.2011–5:09pm] [1–21]K:/IJD/IJD 419984.3d (IJD) [PREPRINTER stage]
values and experimental results with training and testing results obtainedfrom FL model were given in Table 4. As it is visible in Figure 7, the valuesobtained from the training and testing in FL model are very close to theexperimental results. The result of testing phase in Figure 7 shows that theFL model is capable of generalizing between input and output variables withreasonably good predictions.
The performance of the FL model is shown in Figure 7. The value of R2 is97.37% for training set and 95.61% for testing set in the FL model. All R2
values show that the proposed FL model is suitable and can predict thePWA values very close to the experimental values.
CONCLUSIONS
From the experimental procedure, the following results were obtained:
1. The PWA and pore volume of the specimens depend on the particle sizedistribution pattern of the ashes, time of oven curing, and the time ofroom condition curing. The finer the ashes particle size, the denser andhence the more resistance to water permeability and reduced pore volumespecimens. On the other hand, with regard to oven curing of thespecimens, 80�C was found to be the optimum temperature of curing ingeopolymeric specimens.
2. In all mixtures, the specimens with the SiO2/Al2O3 ratio equal to 2.99 hadthe highest resistance to water permeability. On the other hand, the high-est resistance to water permeability was achieved for the mixture of fineFA to fine RHBA of 70:30.
3. FL can be an alternative approach for the evaluation of the effect ofseeded mixture of FA and RHBA on the PWA values of geopolymerspecimens. It has been found that FL model will be valid within theranges of variables.
4. The obtained R2 values showed that FL models are capable to predict thesuitable results for PWA values of geopolymer specimens.
REFERENCES
Akkurt, S., Tayfur, G. and Can, S. (2004). Fuzzy Logic Model for Prediction of CementCompressive Strength, Cement and Concrete Research, 34: 1429�1433.
Alvarez-Ayuso, E., Querol, X., Plan, F., Alastuey, A., Moreno, N., Izquierdo, M. et al. (2008).Environmental, Physical and Structural Characterisation of Geopolymer MatrixesSynthesised from Coal (co-)combustion Fly Ashes, Journal of Hazardous Materials,154: 175�183.
Prediction Resistance to Water Damage 19
at UNIV TORONTO on August 12, 2014ijd.sagepub.comDownloaded from
XML Template (2011) [5.9.2011–5:09pm] [1–21]K:/IJD/IJD 419984.3d (IJD) [PREPRINTER stage]
Bakharev, T. (2005). Geopolymeric Materials Prepared Using Class F fly ash and ElevatedTemperature Curing, Cement and Concrete Research, 35: 1224�1232.
Barbosa, V.F.F., MacKenzie, K.J.D. and Thaurmaturgo, C. (2000). 2, Synthesis andCharacterisation of Materials Based on Inorganic Polymers of Alumina and Silica:Sodium Polysialate Polymers, International Journal of Inorganic Materials, 2: 309�317.
Baykasoglu, A., Dereli, T. and Tanıs, S. (2004). Prediction of Cement Strength Using SoftComputing Techniques, Cement and Concrete Research, 34: 2083�2090.
Cevik, A. and Guzelbey, I.H. (2007). A Soft Computing Based Approach for the Prediction ofUltimate Strength of Metal Plates in Compression, Engineering Structures, 29: 383�394.
Cevik, A. and Guzelbey, I.H. (2008). Neural Network Modeling of Strength Enhancement forCFRP Confined Concrete Cylinders, Building and Environment, 43: 751�763.
Chindaprasirt, P., Chareerat, T. and Sirivivatnanon, V. (2007). Workability and Strength ofCoarse High Calcium Fly Ash Geopolymer, Cement and Concrete Composites, 29:224�229.
Davidovits, J. (1991). Geopolymers: Inorganic Polymeric New Materials, Journal of ThermalAnalysis, 37: 1633�1656.
Davidovits, J. (2008). Geopolymer Chemistry and Applications, St. Quentin, GeopolymereInstitut.
Duxson, P., Mallicoat, S.W., Lukey, G.C., Kriven, W.M. and van Deventer, J.S.J. (2007). TheEffect of Alkali and Si/Al ratio on the Development of Mechanical Properties ofMetakaolin-Based Geopolymers, Colloids and Surfaces A, 292: 8�20.
Fernandez-Jimenez, A., Garcia-Lodeiro, I. and Palomo, A. (2007). Durability of Alkali-Activated Fly Ash Cementitious Materials, Journal of Material Science, 42: 3055�3065.
Guzelbey, I.H., Cevik, A. and ve Erklig, A. (2006). Prediction of Web Crippling Strength ofCold-Formed Steel Sheetings Using Neural Networks, Journal of Constructional SteelResearch, 62: 962�973.
Innocenzi, P. (2003). Infrared Spectroscopy of Sol-Gel Derived Silica-Based Films: A Spectra-Microstructure Overview, Journal of Non-Crystalline Solids, 316: 309�319.
Karlsson, C., Zanghellini, E., Swenson, J., Roling, B., Bowron, D.T. and Borjesson, L. (2005).Structure of Alkali Alkaline-Earth Silicate Glasses from Neutron Diffraction andVibrational Spectroscopy, Physical Review B Condensed Matter and Material Physics,72: 064206.
Lotfi Zadeh, A. (1965). Fuzzy Set, Information and Control, 8: 338�353.
Mamdani, E.H. (1974). Application of Fuzzy Algorithms for Control of Simple DynamicPlants, Proceedings of IEEE, 121: 1585�1588.
Naji Givi, A., Abdul Rashid, S., Nora, A., Aziz, F. and Mohd Salleh, M.A. (2010). Assessmentof the Effects of Rice Husk Ash Particle Size on Strength, Water Permeability andWorkability of Binary Blended Concrete, Construction and Building Materials, 24:2145�2150.
Nazari, A. and Milani, A.A. (2011). Modeling Ductile to Brittle Transition Temperature ofFunctionally Graded Steels by Fuzzy Logic, Journal of Material Science, 46: 6007–6017.
Pacheco-Torgal, F., Castro-Gomes, J.P. and Jalali, S. (2005). Studies about Mix Compositionof Alkali-Activated Mortars using Waste Mud from Panasqueira, In: Proceedings of theEngineering Conference, University of Beira Interior, Covilha, Portugal.
Pacheco-Torgal, F., Castro-Gomes, J. and Jalali, S. (2007). Investigation about the Effect ofAggregates on Strength and Microstructure of Geopolymeric Mine Waste Mud Binders,Cement and Concrete Research, 37: 933�941.
Ramezanianpour, A.A., Sobhani, M. and Sobhani, J. (2004). Application of Network BasedNeuro-Fuzzy System for Prediction of the Strength of High Strength Concrete, AmirkabirJournal of Science and Technology, 5(59-C): 78�93.
20 S. RIAHI ET AL.
at UNIV TORONTO on August 12, 2014ijd.sagepub.comDownloaded from
XML Template (2011) [5.9.2011–5:09pm] [1–21]K:/IJD/IJD 419984.3d (IJD) [PREPRINTER stage]
Rees, C.A., Provis, J.L., Lukey, G.C. and van Deventer, J.S.J. (2007). In Situ ATR-FTR Studyof the Early Stages of Fly Ash Geopolymer Gel Formation, Langmuir, 23: 8179.
Sata, V., Jaturapitakkul, C. and Kiattikomol, K. Influence of Pozzolan from Various bypro-duct Materials on Mechanical Properties of High-Strength Concrete, Construction andBuilding Materials, 21: 1589�1598.
Serra, J., Gonzalez, P., Liste, S., Chiussi, S., Leon, B. et al. (2002). Influence of the Non-Bridging Oxygen Groups on the Bioactivity of Silicate Glasses, Journal of MaterialScience Materials in Medicine, 13: 1221�1225.
Tangchirapat, W., Buranasing, R., Jaturapitakkul, C. and Chindaprasirt, P. (2008). Influenceof Rice Husk�Bark Ash on Mechanical Properties of Concrete Containing High Amountof Recycled Aggregates, Construction and Building Materials, 22: 1812�1819.
Topcu, I.B. and Sarıdemir, M. (2008). Prediction of Compressive Strength of ConcreteContaining Fly Ash Using Artificial Neural Network and Fuzzy Logic, ComputationalMaterial Science, 41: 305�311.
van Jaarsveld, J.G.S., van Deventer, J.S.J. and Lorenzen, L. (1997). The Potential Use ofGeopolymeric Materials to Immobilise Toxic Metals. Part I. Theory and applications,Minerals Engineering, 10: 659�669.
van Jaarsveld, J.G.S., van Deventer, J.S.J. and Lukey, G.C. (2002). The Effect of Compositionand Temperature on the Properties of Fly Ash- and Kaolinite-based Geopolymers,Chemical Engineering Journal, 89: 63�73.
Wongpa, J., Kiattikomol, K., Jaturapitakkul, C. and Chindaprasirt, P. (2010). CompressiveStrength, Modulus of Elasticity, and Water Permeability of Inorganic Polymer Concrete,Materials and Design, 31: 4748�4754.
Zholobenko, V.L., Holmes, S.M., Cundy, C.S. and Dwyer, J. (1997). Synthesis of MCM-41Materials: An in situ FTIR Study, Microporous Materials, 11: 83�86.
Prediction Resistance to Water Damage 21
at UNIV TORONTO on August 12, 2014ijd.sagepub.comDownloaded from