Embed Size (px)
Citation preview

Portland State University Portland State University
PDXScholar PDXScholar
Dissertations and Theses Dissertations and Theses
1-1-2011
Prediction of Soil Layer R-Value Dependence on Prediction of Soil Layer R-Value Dependence on
Moisture Content Moisture Content
Ziyang Liu Portland State University
Follow this and additional works at: https://pdxscholar.library.pdx.edu/open_access_etds
Let us know how access to this document benefits you.
Recommended Citation Recommended Citation Liu, Ziyang, "Prediction of Soil Layer R-Value Dependence on Moisture Content" (2011). Dissertations and Theses. Paper 125. https://doi.org/10.15760/etd.125
This Thesis is brought to you for free and open access. It has been accepted for inclusion in Dissertations and Theses by an authorized administrator of PDXScholar. Please contact us if we can make this document more accessible: [email protected].

Prediction of Soil Layer R‐Value Dependence on Moisture Content
by
Ziyang Liu
A thesis submitted in partial fulfillment of the requirements for the degree of
Master of Science in
Mechanical Engineering
Thesis Committee: Graig Spolek, Chair Derek Tretheway
Huafen Hu
Portland State University ©2011

i
Abstract
This study focuses on how green roof thermal performance is affected by the soil
moisture in summer condition. It aims to determine whether moist soil is a better
insulator during the summer months than dry soil.
A soil model is developed to predict simultaneous conduction, convection, and surface
evaporation for a layer of moist soil representing a green roof. It used to analyze
evaporation process and its affect on the soil resistance. The model considers only bare
soil without vegetation on the roof. The model predicts the soil surface temperature as
it is affected by soil moisture content, which can then be used to calculate heat transfer
through the soil layer. An experimental dry out test was conducted to measure the soil
moisture and soil temperature histories. Comparison of the predicted and measured sol
surface temperature shows that the model reasonably captures the actual behavior. The
evaporative cooling effectively reduces the soil surface temperature and heat flux in
moist soil and can be used as an effective way to insulate the roof.

ii
Acknowledgement
I would like to thank all the people who helped me, encouraged me and inspired me.
This thesis would not have been possible without all your help and support. Foremost, I
owe my deepest gratitude to my dedicated advisor, Dr. Graig Spolek for his support of
my study and research, for his able guidance, wisdom and patience. I feel sincerely
thankful to him being my advisor, who always believe in my potential and encourage me.
He is not only my academic advisor, but also a mentor for life. Besides, I am extremely
grateful to the rest of my thesis committee: Dr. Derek Tretheway and Dr.Huafen Hu.,
who give me very important advice for my thesis. Also, I thank all my lab mates at the
Green roof Lab. Thanks to Eduardo Guerrero, Debbie Beck, Bryce Cox, Harriet Bell,
Giorgina Castillo, Lisa, for that you all made our lab a nice place to work and study. I
especially want to show my appreciation to my family for their care and unconditional
love. I am indebted to my Mother and Father, Shuhua Ding and Kecheng Liu, who always
back up for me. Last but not least, special thanks should go to my dear friends: Wen
Fang, Wen Yang, Xiaofang Lu, Jiali Ju, Chengyu Xin, and Hank.

iii
Table of Contents
Abstract ................................................................................................................................ i
Acknowledgement ...............................................................................................................ii
List of Tables ........................................................................................................................ v
List of Figures ...................................................................................................................... vi
Chapter 1: Introduction ...................................................................................................... 1
Chapter 2 Literature review ................................................................................................ 7
Chapter 3 Project Objective .............................................................................................. 15
Chapter 4 Theoretical Model ............................................................................................ 16
Physical Model .................................................................................................................. 16
Chapter 5 Experimental Methods ..................................................................................... 27
5.1 Thermal conductivity test ....................................................................................... 27
5.2 Soil Dry out test ....................................................................................................... 29
Chapter 6 Results and Discussion ..................................................................................... 37
6.1 Experimental Results .............................................................................................. 37
6.2 Theoretical analysis of soil layer thermal performance and its comparison with
experimental results ..................................................................................................... 47
Conclusion ......................................................................................................................... 51

iv
References ........................................................................................................................ 52

v
List of Tables
Table 1 Effect of soil moisture content on green roof R‐value and U‐value (Alcazar and
Bass 2005) ......................................................................................................................... 12
Table 2 R‐value of different soil thickness with different moisture content (Wong, et al.
2003) ................................................................................................................................. 12

vi
List of Figures
Figure 1 Intensive roofs (right) and extensive roofs (left) .................................................. 2
Figure 2 The basic components of a green roof system ..................................................... 3
Figure 3 Namba park rooftop garden view ......................................................................... 6
Figure 4 Comparison of the energetic exchanges of the dry or wet green roof with a
traditional roof, starting from 100 incident solar irradiation units‐summer session.
(Lazzarin, et al.2005) ........................................................................................................... 9
Figure 5 Two factors affecting the soil R‐value ................................................................. 14
Figure 6 Soil evaportaion three stage changes by soil moisture content ........................ 19
Figure 7 Soil layer energy balance model ......................................................................... 20
Figure 8 Surface temperature model changed by soil moisture content......................... 26
Figure 9 The wind tunnel is cross sectional view and photograph ................................... 30
Figure 10 The load cell sensor located on the back side of the deck ............................... 33
Figure 11 The drain hole location on the tray .................................................................. 34
Figure 12 Soil thermal conductivity range from bone dry to saturated ........................... 38
Figure 13 Soil weight changes with time as the soil dries out due to evaporation. ......... 39
Figure 14 Unit area evaporation rate changes by time .................................................... 40
Figure 15 Soil volumetric water content changes by time ............................................... 41
Figure 16 Evaporation rate varies with the soil volumetric water content ...................... 42
Figure 17 Three site soil temperature changes in dry out test ........................................ 44
Figure 18 Soil surface and bottom temperature in different volumetric water content . 45

vii
Figure 19 Heal flux varied with volumetric water content in the test ............................. 46
Figure 20 Comparison of the soil surface temperature in model value with experimental
one .................................................................................................................................... 49
Figure 21 Comparison of heat flux in experimental value with model value. .................. 50

1
Chapter 1: Introduction
Introduction
Green roofs are rooftops which are covered with vegetation. This technology has been
in existence since ancient times. The first known historical references to manmade
gardens above grade were the ziggurats (stone pyramidal stepped towers) of ancient
Mesopotamia, built from the fourth millennium until around 600 B.C. Ancient green roof
can be found in France, Norway and New York (Theodore.1999). Some of them are still
in use today.
Nowadays, green roofs have been installed across America in steadily increasing
numbers over the past decade, and research is being conducted in universities on the
impact of green roofs on the environment, the economy, and energy conservation.
Overall growth from 2007 to 2008 of the North American Green Roof Industry in 2008,
compared to 2007, is 35 percent (Green Roof Industry Survey).
Description of systems
The green roof industry has developed two general classifications for rooftop vegetation
systems: extensive and intensive; see Figure 1.

2
Figure 1 Intensive roofs (right) and extensive roofs (left)
The extensive green roof is installed on flat and shallow pitched roofs. Commonly, it
contains only one or two plant species with low maintenance like grass and minimal
planting medium. It is commonly designed for maximum thermal and hydrological
performance and minimum weight load while being aesthetically pleasing. Typically,
only maintenance personnel have access to this type of roof.
The intensive green roof contains a variety of plant types. Some rooftop gardens
support fairly large trees and water features requiring substantial structural
reinforcement. The depth of an intensive green roof is usually greater than an extensive,
green roof. Generally, the roof has the public access.

3
Most green roofs are comprised of five layers. From top to bottom, the layers are plants,
growing medium, a drainage layer, a root barrier, and a waterproofing layer. Under the
waterproofing membrane is the conventional rooftop. Figure 2 shows the green roof
component.
Figure 2 The basic components of a green roof system

4
Green‐roof benefits
In an urban heat island, the temperature of metropolitan areas is higher than
surrounding areas. This is due to city building materials absorbing and retaining more
heat from the sun rays and the city area lacking vegetation to evapotranspire which can
absorb the heat from surrounding areas to reduce the air temperature. The other
reason is that energy usage for air conditioning generates waste heat which is emitted
to outdoor air. The urban heat island effect can change weather patterns, causing smog
development and increasing precipitation. Also, the effect can adversely affect human
health. Using green roofs can effectively improve the urban heat island effect, due to
the potential to decrease the surrounding air temperature by plants transpiration.
Lawrence Berkeley Laboratory has shown that a 5% increase in green space in a large
metropolitan area would reduce the average summer time temperature by 4 F, and
would reduce smog by 10% (Perry 2003).
A green roof can effectively moderate the temperatures of the building, due to the
shading of sunlight by the plants, the insulation of the soil, and the cooling effect of
evapotranspiration. The study of the National Research Council of Canada showed that
in summer time a green roof surface temperature can be 30 °C compared to a reference
roof temperature of 70 °C. Additionally a green roof’s mean daily temperature
fluctuation is 5‐7 °C, while the reference roof is from 42 to 47 °C. By moderating the roof

5
temperature, the heat flux into the building is reduced. This means the cooling demand
can be reduced (Liu 2003).
Green roofs systems often help solve the problem of storm water runoff. When a city
has precipitation, the over flow water puts pressure on the city sewer and drainage
system. It can cause flooding, erosion, sewage back up, and pollution of water supplies
system. Green roofs can retain about 70% to 90% of the rainfall, which stabilizes water
runoff and relieves overloaded drainage systems (Perry 2003). A 2002 National
Research Council of Canada (NRCC) project found that a green roof could delay storm
water run off and reduce peak run off rate and volume. The study found that the green
roof retained 245mm out of the 450 mm of rain fell during April to September 2002; this
is a reduction of 54% (Liu 2003).
The green roof technology can bring additional positive impacts to the city. First, it can
make a city aesthetically pleasing.
Figure 3 shows the rooftop garden in a Japan shopping mall called Namba Park. Second,
plants can reduce pollution by collecting dust and other pollutants and reemitting
oxygen (Perry 2003). The green roofs produce a substantial about of oxygen for an
urban area.

6
Figure 3 Namba park rooftop garden view

7
Chapter 2 Literature review
Presently, green roof performance is a priority research focus. Researchers build green
roof models, using software like Energy Plus (Sailor D. 2008) or eQuest to simulate the
green roof performance. Others gather experimental data on green roofs in the field or
lab.
Del Barrio(1998) proposed a green roof energy model with three major parts: the roof
support, the soil, and the canopy. The model combined the three layers together to
simulate the energy performance recorded during a climate data test in Athens in
August 1982. It takes a series sensitivity analysis on the canopy and green roof.
In the soil component, the primary factor is the heat flux variation with changes in soil
depth, soil density and water content. The model calculated the heat flux with respect
to two different soil water contents 20% and 40% respectively. When the moisture
content in the soil increased, the heat flux through the roof was reduced.

8
Takakura(2000) investigated the cooling effects of plants on buildings via modeling and
simulation. They concluded that evapotranspiration was a very important factor in
cooling ability of green roof but that accurate measurement of the evapotranspiration is
impossible.
Kunar, Kaushik(2005) developed a mathematical model to determine the effects of leaf
area index(LAI is the total leaf surface area contained in a volume of unit base) and plant
height on the green roof’s thermal performance. This model was built to improve upon
Del Barrio’s model. The model was validated by experimental data measurements from
an existing green roof in Yamuna Nagar, India. It concluded that the green roof
combined with solar thermal shading reduced averaged indoor air temperature by
5.11°C, from the average indoor air temperature for the bare roof. This suggests that a
larger LAI reduces the canopy air temperature, stabilized the fluctuating values and
reduced the penetrating flux. Here,the focus was on green roof shading effect.
Ondimu and Murase(2007) combined finite‐element modeling and neural networks
analysis together to determine the thermal conductivity of a sunagoke moss mat.
Sunagoke moss is a living biological material fabricated from sumagole moss, cotton
wool and PVC netting. The model considered three different moisture contents: 0%,
50%, and 100%. The material’s R‐value is higher when dry vs. wet.

9
Lazzarin, et al(2005) designed a green roof model using the finite difference method to
perform an energy balance on each layer. Data was acquired from a green roof on an
Italian hospital in 2002 and 2003. It analyzed the different heat performance for a dry
green roof, a wet green roof, and a traditional roof in summer and winter. It concluded
that evapotranspiration is very important with the model predicting better performance
in well‐watered conditions. Figure 4 shows the energetic exchanges of the green roof
and traditional roof in summer.
Figure 4 Comparison of the energetic exchanges of the dry or wet green roof with a
traditional roof, starting from 100 incident solar irradiation units‐summer session.
(Lazzarin, et al.2005)

10
Feng and Meng(2010) created a model to consider the green roof model and added
plant metabolism, specifically photosynthesis and respiration. An equation simply
determined the solar energy converted by net photosynthesis. From the field
experiment 9.5% of dissipated heat was by due to the net photosynthesis of plants. The
most important part is evapotranspiration which is 54.8%.
As green roof heat performance becomes more and more important, some disputes
have occurred.
Early studies like Curtis (1936), Mellor, et al(1964) revealed that the thermal radiation
from leaves was the key factor in reducing the heat transferred into the rooms beneath.
But Wong, et al(2003), Theodosio (2003), Barrio (1998), Takakura, et al(2000), Onmura,
et al(2001) studied the energy balance of green roofs and concluded that the dominant
method for absorbed heat to dissipate was evapotranspiration.
Medjelled, et al(2008) built a mathematical model that predicted the unsaturated
underground soil U‐value at different moistures. They developed a small scale
underground heat storage system to get the test data. The model was affected by the
conduction heat transfer only. As the thermal conductivity increased with the increase

11
in moisture,the soil U‐value also went up. This is consistent with the effect of green
roof soil moisture on thermal conductivity as measured by Sailor, et al (2008)
Alcazar and Bass (2005) compared the energy performance of a multi story residential
building in Madrid using three different roofing systems: a common flat roof, a green
roof and a green roof with water storage capacity. In the study, the moisture content in
the soil ranged from 0% to 100% (saturation level). Use ESP‐r modeled two values of
moisture content 20%, 80%; ESP‐r is an integrated modeling package for the simulation
of the thermal performance of buildings. Table 1 shows the overall conductance values
U and Resistance (R‐value) for all three systems with 0%, 20%, and 80% moisture
content. As shown in the table, the moisture content in the soil has a significant effect
on R‐value, which is the inverse of the conductance U. An increase in moisture content
in the soil from 0%‐20% produces a decrease in the soil R‐value from 0.67 to
0.11m2°C/W, an 84% decrease.

12
Table 1 Effect of soil moisture content on green roof R‐value and U‐value (Alcazar and
Bass 2005)
Wong, et al.(2003) used the DOE‐2 software to simulate the peak roof thermal transfer
value, which is the square roof of peak sensible cooling for roof component. The R‐value
of dry and 40% moisture content clay soil of different thickness are shown in Table 2.
The R‐value is greater when the soil moisture content decreases.
Table 2 R‐value of different soil thickness with different moisture content (Wong, et al.
2003)

13
From Del Barrio (1998)’s soil model, one can estimate the green roof insulation affect on
the thickness of the soil layer, density, and moisture content. As the density decreased
from 1500 to 1100kg/m3, the soil thermal conductivity decreased, and heat flux through
the roof decreased. In addition, the moisture content decreased from 40% to 20%,
which means the thermal conductivity decreased. However, the heat flux through the
roof increased. The augmentation of surface soil evaporation is a contributing factor.
Tabares‐velasco (2009) ran the green roof thermal performance test under laboratory
condition; he found that as the soil water content increased the latent heat flux
increased, but the total heat flux decreased.
Clearly, modeling and experimental results reported in the literature disagree on the
effect of soil moisture on green roof heat flux. The dispute over whether the R‐value of
moist soil is greater or less than the dry soil has not been settled conclusively. Prediction
of the R‐value at different moisture level is complicated. The presence of moisture could
increase the soil thermal conductivity since water is a better conductor than air in the
voids. This mean the R‐value of the soil should decrease. But when the soil is moist,
evaporative cooling will be enhanced. Evaporative cooling occurs as evaporative latent
heat, which is the thermal energy required to cause a phase changes from water to
vapor. As the surface of the soil dries, the capillary force will pull more moisture from

14
the soil below. But as the soil dries out, evaporative cooling decreases, so the effective
thermal resistance diminishes.
Likely, there should be some combination of both effects as shown in Figure 5. It is
unknown which factor will affect the soil layer R‐value more, as it is unknown if the
presence of more moisture in the soil would increase or decrease the ability for heat
transfer.
Figure 5 Two factors affecting the soil R‐value

15
Chapter 3 Project Objective
The objective of this study was to develop a soil model based on thermal performance
analysis which included the effect of soil moisture on evaporative cooling and
conduction. The model considered only bare soil without the complicating effects of
green roof plants. Model predictions were validated by experiment.

16
Chapter 4 Theoretical Model
Physical Model
Heat transfer processes taking place on a green roof are conduction, convection, net
radiation, evapotranspiration, thermal storage for the substrate, and metabolic storage
(photosynthesis and respiration).
Conduction is the transfer of thermal energy between neighboring molecules in a
substance due to a temperature gradient. In the summer season, the heat flux transfers
from hot ambient air through the building roof top to inner conditioned space. For the
green roof, the heat flux goes from top to bottom as the temperature gradient occurs.
Three things affect the rate at which soil conducts heat: the soil depth, the thermal
conductivity, and temperature difference. Soil thermal conductivity, in turn, is affected
by four factors: moisture content, density, composition and temperature. Of these,
moisture content has the greatest impact on the soil’s thermal conductivity. When
water is added to bone dry soil, a thin water film covers the soil particle, which creates
air gaps between the small soil particles. In other words, it can increase the effective
contact area between the soil particles, thus increasing heat flow, resulting in higher
thermal conductivity. Soil thermal conductivity also increases with the dry density of the

17
soil. With an increase in dry density, more soil particles are packed into a unit volume
and the number of contact points between the particles increases. This increase in
contact points provides a larger heat flow path and increases the soil thermal
conductivity (Becker, 1992).
Evapotranspiration is a term used to describe the sum of soil evaporation and plant
transpiration from a vegetated surface to the atmosphere. For water to change its state
from a liquid to a vapor, it requires absorption of energy. In a green roof, water that is
contained in the soil and in the plant evaporates into the surrounding air. When water is
released to the surrounding air in the form of vapors, evaporative latent heat is drawn
from the surrounding air and soil. For a soil bed without plant, soil moisture is
evaporated from the water filled surface pores.
The evaporation rate is the quantity of water evaporating per unit of time. As an initially
moist bed of soil dries out, the drying rate can be divided into three stages: the
constant‐rate, the falling‐rate, and the low‐rate stages as illustrated in Figure 6
(Suleiman and Ritchie,2003). The constant‐rate stage represents the period when soil
water is not limiting the evaporation rate; the evaporation rate is determined by the
available energy at the surface by convection and atmospheric conditions (relative
humidity, temperature, and wind velocity). During this stage, the evaporation rate

18
would be constant if the energy supply and atmospheric conditions are in a steady state.
In contrast, water loss from a soil with a dry surface layer is regulated primarily by soil
water resistances that limit the rate at which water moves upward to the evaporating
surface (Philip,1957). This causes the falling‐rate stage. It represents the period when
the evaporation rate is jointly controlled by the soil water supply to the surface, the
energy supply, and atmospheric conditions. During this stage, the rate of supply of
water to the surface from the soil below decreases, causing the surface water content
to become drier. In such a case, the surface layer cannot continue to provide enough
water from storage, and the evaporation rate becomes limited by the rate of water
movement to the soil surface. During this stage, the evaporation rate gradually
decreases. The low‐rate stage represents the final period when the evaporation rate is
controlled by the soil’s physical characteristics. This can take a long time, as the
evaporation rate is much less than the constant‐rate stage.

19
Figure 6 Soil evaportaion three stage changes by soil moisture content
For an extensive green roof model, the soil layer is relatively thin, so it may not hold
enough water for constant rate evaporation. Although some regions have large
precipitation, most of the water drains off due to thin soil layers. A model of energy
transfer in a thin layer of moist soil must allow for variable drying rate (evaporation rate)
as moisture content changes.

20
Figure 7 Soil layer energy balance model
Figure 7 shows three heat transfer process take place the soil layer. Conduction heat
transfer allows heat flux from the soil surface to the bottom, convection transfers heat
from the hot ambient air to soil surface, and evaporative cooling cools the soil surface
and ambient air temperature.
Mathematic Model
From the soil energy balance diagram, the soil balance heat equation is:
QQQconvevapcond
(1)
Soil [ K(M)]L
TS
TB
Qcon Qevap
Qcon
TH

21
condQ = the conduction heat flux in W/m2
evapQ = soil surface heat flux from evaporation W/m2
convQ = the convection heat flux in W/m2
The assumptions used to develop this model are:
1. The soil area is large enough to assume horizontal homogeneity and heat and mass
fluxes are assumed to be mainly vertical, so one‐dimensional models can be used to
describe the thermal performance by applying one‐dimensional (vertical) analysis.
2. The soil layer is thin enough to assume the whole soil layer’s water content is uniform.
Therefore, the soil layer’s thermal conductivity is also uniform.
3. The soil is homogeneous.
4. As the soil layer is drying out, heat transfer and mass transfer are decoupled so that
heat transfer can be assumed to be steady state while moisture transfers in transient.
5. Radiation, both short and long wave, can be included in the convective heat transfer.
Conduction:
The fundamental one‐dimensional conduction equation is as follows:

22
L
TTkQ BS
cond
(2)
condQ = the conduction heat flux in W/m2
ST = soil surface temperature in ℃
BT = soil bottom temperature in ℃
k = soil thermal conductivity W/m℃
L = soil layer thickness in m
Conductivity varies with soil water content: kk
= volumetric soil water content in %
Convection:
)( SHeffconv TThQ (3)
convQ = the convection heat flux in W/m2
heff= effective convection coefficient in W/m2℃
HT = hot air temperature in ℃

23
ST = soil surface temperature in ℃
Evapotranspiration:
fgevap hmQ (4)
Evaporation rate varies with soil water content:
)(mm
evapQ = soil surface heat flux from evaporation W/m2
m = soil surface evaporation rate W/m2
fgh = latent heat kJ/kg
In steady‐state conditions, an energy balance equation for soil’s surface yields
)( SHin TThQ (5)
fgBS
out hmL
TTkQ
(6)
When energy balance occurred at soil layer surface
outin QQ (7)

24
Solving for ST
fgHBS hmk
LBiTT
BiT
1
1 (8)
Where Biot Number khLBi /
Model Examination
The soil surface temperature is affected by conduction, convection and evaporation. To
compare the model with and without evaporative cooling effect, settingm is set to zero.
fgHBS hmk
LBiTT
BiT
1
1 (8)
which yields,
)1( Bi
TBiTT B
S
(9)
Although the evaporation rate is ignored, the thermal conductivity is affected by the
moist soil. Soil thermal conductivity (K) increases with increase moisture. When soil is
totally dry, K is small. Thus, Bi is large, and TS is close to T . At steady state, the surface
temperature is close to the hot air temperature. When the soil is saturated, K is quite
large, and Bi is small. TS approaches TC. This is an extreme condition that surface
temperature affected most by cold side conduction.

25
Next, add the evaporation term in the equation. Under ideal conditions, the surface soil
layer is always saturated due to capillary pressure. The capillary flow rate is greater than
the evaporation rate, so the evaporation process is at a constant rate. Assuming latent
heat is constant, the evaporation term is constant, and the model changes to:
)()( BSevapS TTL
KQTTh (10)
Solving for ST
)1( Bi
CTBiTT B
S
(11)
With K
LQC evap >0
From the new surface temperature equation, the surface temperature will be lower
than the surface temperature without evaporative cooling effect. This is because
evaporation requires absorption of heat, which cools down the soil surface temperature.
As the soil moisture goes up, TS have a similar trend like TS without evaporation.
Actually, the soil layer of green roof cannot remain saturated continuously. For most
granular materials, evaporation rate slows down as the soil water content decreases. So
the evaporation rate is a function of soil water content. The surface temperature
equation is:

26
fgHBS hmk
LBiTT
BiT
1
1 (8)
Wherem decreases with decreasing θ
Compared to the constant evaporation rate, as the moisture content increases, the
evaporation term grows. The Figure 8 shows this hypothetical relationship between soil
water content and TS. TS curve with soil moisture increase is greater than the constant
evaporation rate case TS curve and less than on evaporation rate case TS curve. For bone
dry soil, TS equals TS without evaporation.
TH
Tc
No evaporation model
Falling evaporation rate model
Constant evaporation rate model
Moisture
Sur
face
Tem
pera
ture
Figure 8 Surface temperature model changed by soil moisture content

27
Chapter 5 Experimental Methods
An experiment was performed to validate the energy balance model described above
and analyze the energy flow of typical extensive green roofs without plants. To avoid the
unsteady‐state condition, the experiment was conducted inside a controlled
environment (Bell and Spolek 2008).
Based on
fgHBS hmk
LBiTT
BiT
1
1
(8) where kk and ),( mTT SS , for constant L, h, TH, and hfg, two separate
experiments were performed.
5.1 Thermal conductivity test
In this test, a KD2 Pro dual probe sensor from Decagon Device was used. The dual probe
has two parallel needle probes separated by a distance of 6mm. The needles are 1.3mm
in diameter and are 30mm long. One probe contains a heater and the second probe is
the temperature sensor. The dual probe device is inserted into the soil, and for
measuring the thermal conductivity, a heat pulse is applied.

28
The device uses a transient heated needle and an approximation to the solution of the
differential equation for an infinite heat source as the method for finding thermal
conductivity.
For heat rate Q, the solution for the different equation for finite length 2b and
cylindrical probes with radius a is given by (KD2 Pro manual, 2006)
duur
berfrauIurauu
k
qT
Dtr)()/2(])/(exp[)exp(
4 02
4/
12
(11)
Where )(0 xI is a modified Bessel function of order zero, )(xerf is the error function, and
u is the integration variable.
The double probe thermal conductivity device was used to test the soil thermal
conductivity over a wide range of soil water content from bone dry to fully saturated.
To test the water holding ability of soil, soil was dried in an oven until bone dry. A
container with known volume (VT) and a small hole on the bottom was filled with dry
soil. Next, water was added into the soil continuously until minor leaking came from the
bottom hole. By measuring how much water was added (VW), the volumetric water
content was calculated by following equation:

29
T
W
V
V (12)
Where θ is the volumetric water content, WV is the volume of the water, and TV is the
total soil volume.
Intermediate values of between dry and S were obtained for the values of WV . The
thermal conductivity for each sample at different water contents was measured with
the conductivity device.
5.2 Soil Dry out test
To provide constant heat transfer conditions, a low speed wind tunnel shown in Figure 9
was used, representing warm summer conditions. Hot air was heated by electric heaters
and blow through the upper section at a fixed air speed and temperature. Cold air
propelled by an air conditioner flowed through the lower part to simulate an air
conditioned indoor space beneath a green roof. Two trays with bare soil were placed on
the deck between the hot and cold section. Sensor locations are illustrated on Figure 9.

30
Figure 9 The wind tunnel is cross sectional view and photograph
Heat Flux Meter
Weight Scale Sensors
COOLING
AIR FLOW
ECOROOHEATING
Thermocouple

31
Thermocouples
There are two methods to test the soil surface temperature: (1) IR camera, and (2)
thermocouples. Since continuous data was needed for this laboratory test,
thermocouples were chosen to monitor the temperature.
A thermocouple consists of a junction between two different metals that will produce a
voltage proportional to the temperature difference due to the Seebeck effect. Each type
of thermocouple has a well defined voltage output at a certain temperature.
A thermocouple type OMEGA TVC‐PC‐T‐24‐180 was used to monitor the temperature.
Type T thermocouples are suitable for a temperature range of ‐250 °C to 350 °C,
compared to the experimental range of temperatures of 7 °C to 40 °C. The standard
limit of error is ± 1°C.
TH, TC (cold air temperature), TS, TM (soil middle point temperature) and TB were
monitored. These were located approximately in the plan area center of tray. The air
thermocouples were fixed using adhesive plaster, and the sensor for surface
temperature was slightly covered by the surface soil. The thermocouples for the middle
soil temperature were held in position with a stick.

32
Heat flux
Heat flux is the rate of energy passing through a surface per unit area. In the experiment,
heat fluxes were directly measured with factory‐ calibrated heat flux meters. They were
applied to the underside of the deck holding the tray and located at the center of the
tray.
Load cell sensor
A OMEGA’s LC305 Series load cell was set under each of the deck’s four corners as
shown in Figure 10, to measure the weight of the deck and trays. The weight in the
whole test process was used to determine the soil water content changes.

33
Figure 10 The load cell sensor located on the back side of the deck
The load cell is a transducer that is used to convert a force into electrical signal. Through
a mechanical arrangement, the force being sensed deforms a strain gauge. The strain
gauge converts the deformation to electrical signals. A load cell usually consists of four
strain gauges in a Wheatstone bridge configuration.
backside of the deck Load cell

34
Test soil and tray
The size of the tray is 61cm by 58cm in wide and 3cm depth. In this test, the
soil was placed directly in the tray without drainage layer and waterproof layer
(common in green roofs) to avoid adding thermal resistance. A drain hole was located
on the middle of one side to allow excess water to drain when the soil was over
saturated, as shown in Figure 11.
Figure 11 The drain hole location on the tray
Drain Hole

35
The soil was classic Pro‐Gro extensive roof top media composed of special screened
pumice, fiber life compost, and paper fiber. Fiber life compost is a by‐product of a
anaerobic digestive process.
Calculation of bare wind tunnel R‐value
The deck without tray on it has its own thermal resistance. To test its R‐value,
thermocouples measured the deck surface temperature and cold side temperature.
With the heat flux sensor monitored heat transfer, the test was run for 30 minutes to
get a steady state R‐value, which was found to be 0.18ft2°Fhr/BTU.
With the wind tunnel R‐value test runs, the heat passes through the soil tray and test
bed in series. The respective resistances to heat flow is:
soildeckoverall RRR
So the net R‐value of each test soil tray was corrected with the overall R‐value.
Test procedure
Soil trays were initially watered to full saturation, as determined when water stopped
draining from the drain hole. Hot air at 40 °C and cold air at 7°C ware applied continually
to dry the wet soil. Tests continued until the weight of the soil was almost constant. This

36
meant the evaporation stage has changed to the third level or the every low‐rate soil
water content.
In the test the following variables were collected: heat flux, hot temperature, surface
temperature, middle temperature, bottom temperature, cold temperature, and weight.
Typical tests ran 84 hours to reach approximates steady state condition.

37
Chapter 6 Results and Discussion
6.1 Experimental Results
Figure 12 shows the soil thermal conductivity linearly increases with the soil moisture.
For bone dry soil, the soil thermal conductivity is 0.089W/m K. For saturated soil
( =0.4), the thermal conductivity is 0.325 W/m K. A least‐ squared curve fit was
generated for model use that predicts:
557.0104.0 K (13)
θ is the volumetric moisture content. The regression coefficient 977.02 r indicates
that the linear curve fit is a good approximation.

38
Figure 12 Soil thermal conductivity range from bone dry to saturated
Figure 13 shows the weight change of the soil tray drying out. The solid line is the
experimental data and illustrates a signal noise of about ± 0.5lb. In the test, the load cell
sensor could only test the total weight, which includes the soil, the water, the tray and
the wind tunnel deck. The tare due to the tray and empty decks weight was subtracted
to yield the soil and water weight. At the end of 80 hours, the weight changes slowly.
The trend line (dashed) in Figure 13 is fitted to the exponential equation
0 0.05 0.1 0.15 0.2 0.25 0.3 0.35 0.4 0.450.05
0.1
0.15
0.2
0.25
0.3
0.35
0.4
Volumetric Water Content
The
rmal
Con
duct
ivity
(W/m
K)
experiment
curve fit
39
tcfif eMMCMM 2)(1 , 1C is the correction coefficient, 2C is the decay coefficient
fM is the soil weight after the test, iM is the initial soil weight, and t is time. From the
data in Figure 13 the equation is teM 032.033.933.38 (14)
It matches experimental results reasonable well.
Figure 13 Soil weight changes with time as the soil dries out due to evaporation.
0 10 20 30 40 50 60 70 80 9038
40
42
44
46
48
50
Wei
ght(
lb)
Time(hr)
experiment
curve fit

40
During the test, water can only diminish by the evaporation (there is no drainage), so
the weight change is because of the water evaporation into the air. The evaporation
rate was determined as the weight change per unit time. As Figure 13 shows the weight
history, the slope of the weight change was found to be tem 032.0053.0 . Wherem is soil
layer evaporation rate in g/s m2. Figure 14 shows this graphically.
Figure 14 Unit area evaporation rate changes by time
0 10 20 30 40 50 60 70 80 900
0.01
0.02
0.03
0.04
0.05
0.06
Time(hr)
Eva
pora
tion
Rat
e(g/
s/m
2 )

41
Additionally, the soil volumetric water content was calculated from Figure 13, using the
water content definitionT
W
V
V , since the water volume could be related to the weight
of the water by its density. The soil volume was determined during filling of the tray.
From Figure 15, the volumetric water content decreases fast at the beginning, and at
the end of test, the volumetric water content is still around 20%.
Figure 15 Soil volumetric water content changes by time
0 10 20 30 40 50 60 70 80 900.18
0.2
0.22
0.24
0.26
0.28
0.3
0.32
0.34
0.36
0.38
Time(hr)
Vol
umet
ric W
ater
Con
tent

42
From the evaporation rate vs. time and volumetric water content vs. time, the
relationship between the evaporation rate and volumetric water content was calculated.
Figure 16 Evaporation rate varies with the soil volumetric water contentshows how
volumetric water content affects the evaporation rate during the test. The evaporation
rate was high at the soil saturated condition, reaching 0.054g/s/m2. After 84 hours it
reduced to 0.005g/s/m2. The curve fit is linear and approximated as 14.0m where
is fractional moisture content and m soil evaporation rate in unit of g/s m2.
Figure 16 Evaporation rate varies with the soil volumetric water content
0.18 0.2 0.22 0.24 0.26 0.28 0.3 0.32 0.34 0.36 0.380
0.01
0.02
0.03
0.04
0.05
0.06
Volumetric Water Content
Eva
pora
tion
Rat
e(g/
s/m
2 )

43
For soil layer heat conduction with no evaporation, the soil close to the surface should
have a higher temperature than the soil beneath it. But if the soil surface has large
moisture evaporation then Ts could be reduced by evaporative cooling. At this stage,
from experiment the two functional dependencies needed for model testing were
known,
557.0014.0 K (15)
14.0m (16)
Using these equations, the model was tested to predict soil surface temperature TS (θ)
according to Equation 8 experimental histories of Ts, along with TM and TB, were
recorded during dry out tests. These are shown in Figure 17 When the tray first entered
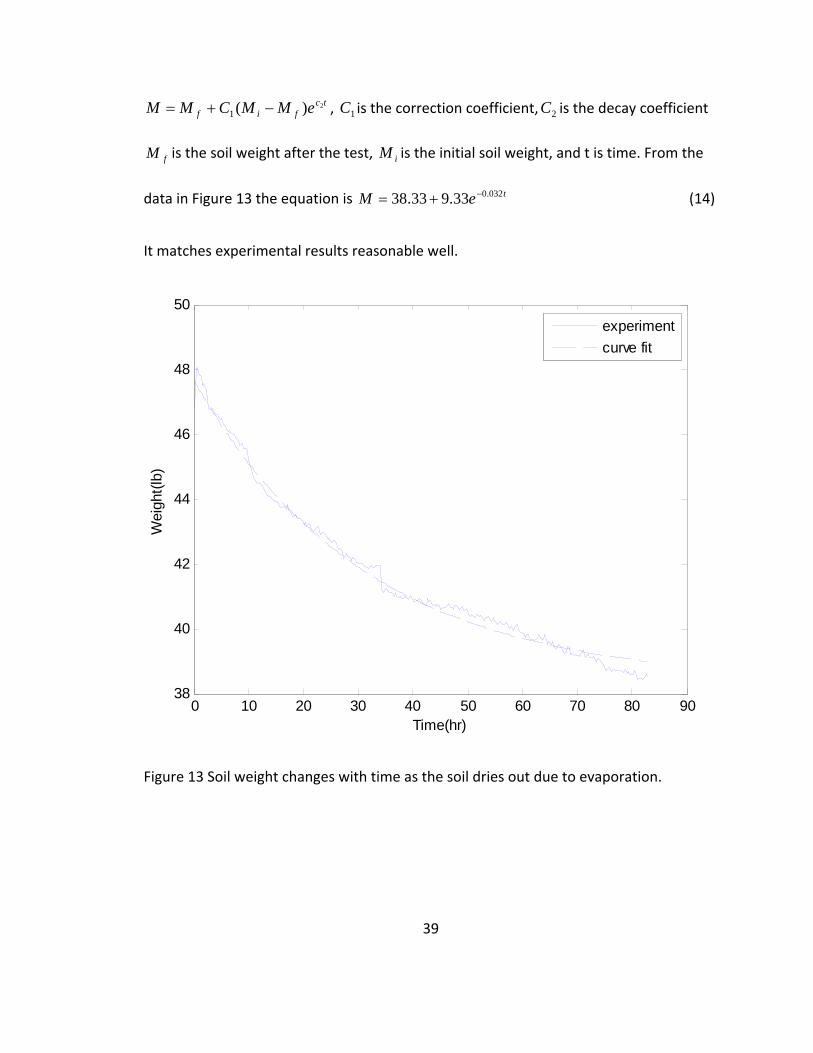
the test wind tunnel, its temperature was uniform and approximately 19 °C; this was
when the tray is still very moist, almost saturated. Within the first 4‐5 hours, the soil
temperature dropped at all three locations: top, middle, and bottom. This start‐up
phase, unavoidable as it was, affected the results for high‐moisture readings. The
temperature at the bottom dropped because of direct contact with the cold deck. The
temperature at the surface dropped because it experienced large evaporative cooling,
and then steadily increased throughout the 84‐hour test period as the evaporative
cooling diminished. The temperature at the center dropped as well, but not as much as
would be expected since, once the transient effects were essentially complete, it should
44
have tracked approximately half way between the surface and the bottom. The
recorded temperature at the middle appeared to be about 3‐4 °C high throughout the
duration of the test and has been adjusted in Figure 17 to demonstrate the probable
curve. The reason for this discrepancy is unknown. Possible explanations include sensor
misalignment (not actually located in the center), localized conduction through the
wooden support structure holding the thermocouple in place, or a faulty thermocouple.
Figure 17 Three site soil temperature changes in dry out test
0 10 20 30 40 50 60 70 80 9010
12
14
16
18
20
22
Time(hr)
Tem
pera
ture
(°C
)
surface temperature
middle temperature
bottom temperature

45
When the temperature change is converted from a time base to an average soil
moisture base, as shown in Figure 18, the same trend is observed. The key point here is
the dramatic change of surface temperature TS with θ, changing almost 8°C for a
moisture change from 035% to 20%.
Figure 18 Soil surface and bottom temperature in different volumetric water content
0.18 0.2 0.22 0.24 0.26 0.28 0.3 0.32 0.34 0.36 0.3810
12
14
16
18
20
22
Volumetric Water Content
Tem
pera
ture
(°C
)
surface temperature
bottom temperature

46
Figure 19 shows the change of conductive heat flux at the bottom of the soil layer, as it
changes with soil moisture. As the moisture content decreased, the heat flux went up.
The heat flux range is from 78 to 112 W/m2. The heat flux for θ>0.3, once again, was
artificially high due to extreme temperature gradients at the tray bottom during start‐up.
Figure 19 Heal flux varied with volumetric water content in the test
0.2 0.22 0.24 0.26 0.28 0.3 0.32 0.34 0.36
80
85
90
95
100
105
110
115
Volumetric Water Content
Hea
t F
lux(
W/m
2 )

47
During the test, a small amount of heat stored in the soil (as the soil lay is very thin). So
the test is in a quasi‐state condition. As a test of the validity of the quasi‐static
assumption, the following calculation was performed to make sure whether the model
could ignore the heat storage term.
6.2 Theoretical analysis of soil layer thermal performance and its comparison with
experimental results
From the test result, the soil water weight equation was
teM 032.033.933.38 (14)
The soil moisture time constant can be gotten from /tCeM . From the equation, is
31 hours.
For the time constant for heat storage is calculated by:
h
Lc pT
(17)
Using ρ is 1220kg/m3(Buccola and Spolek, 2010), L is 0.03m, pC is 1070 J/kg K, and h is
4.22 W/m2 K, T is less than 3 hours, or about 1/10 that for moisture transfer.

48
From this calculation, the time constant of moisture transfer is one magnitude order of
greater than that for heat transfer, meaning that the soil dries out much slower than
heat transfer. The model assumption appears reasonable.
Using Equation 8 and the test data to calculate the convection coefficienth , the average
h value is 4.22 W/m2K
With the heat transfer coefficient of 4.22W/m2K; soil depth was 0.03cm; thermal
conductivity k value used Figure 12; bottom temperature TB was the average actual data
test during the experiment; a hot air temperature TH set at 40 °C, and latent heat hfg
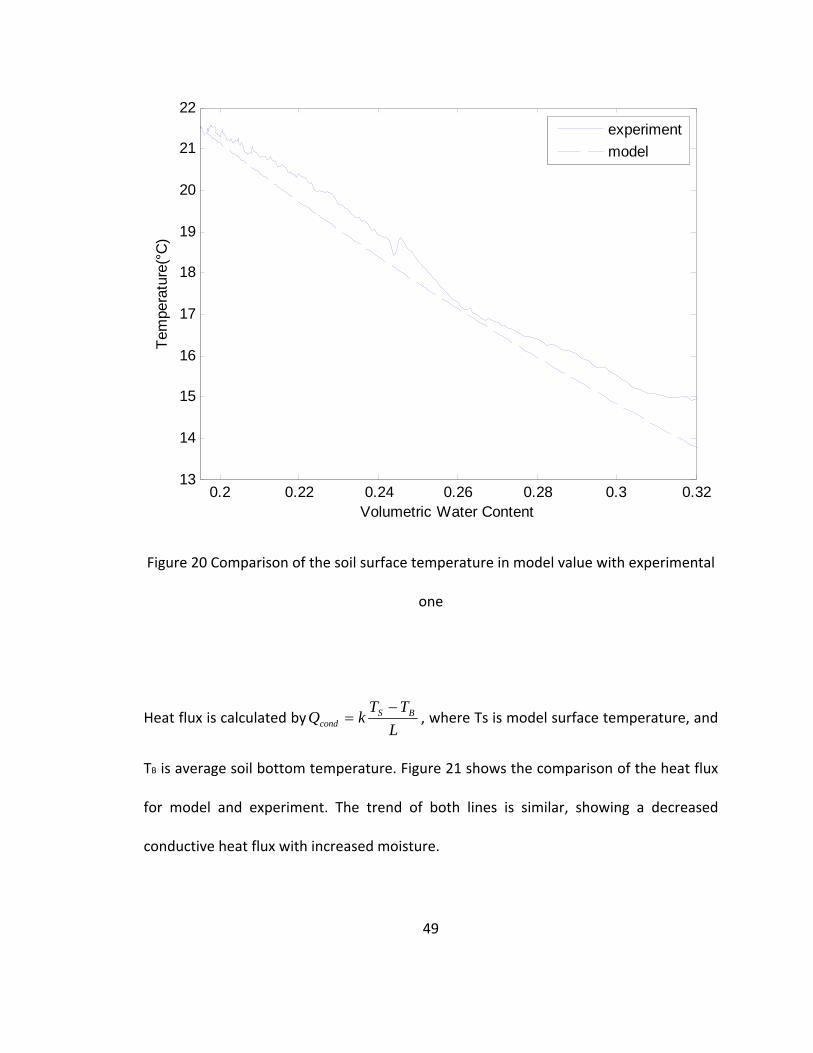
assume 2400 KJ/kg K. The model predicts the soil surface temperature. Figure 20 shows
the model and experimental soil surface temperature as it changed with volumetric
water content. The mathematical model predict TS the surface temperature trend in
reasonable agreement with the experiment. From the figure, the evaporative cooling
clearly affects the soil surface temperature.
49
Figure 20 Comparison of the soil surface temperature in model value with experimental
one
Heat flux is calculated byL
TTkQ BS
cond
, where Ts is model surface temperature, and
TB is average soil bottom temperature. Figure 21 shows the comparison of the heat flux
for model and experiment. The trend of both lines is similar, showing a decreased
conductive heat flux with increased moisture.
0.2 0.22 0.24 0.26 0.28 0.3 0.3213
14
15
16
17
18
19
20
21
22
Volumetric Water Content
Tem
pera
ture
(°C
)
experiment
model

50
Figure 21 Comparison of heat flux in experimental value with model value.
0.2 0.22 0.24 0.26 0.28 0.3 0.3220
30
40
50
60
70
80
90
100
110
120
Volumetric Water Content
Hea
t F
lux(
W/m
2 )
experiment
model

51
Conclusion
This study focus on how green roof thermal performance is affected by the soil moisture
during summer conditions.
A predictive model was developed to include the major heat transfer processes
including evaporative cooling. The soil substrate induces variation of thermal
conductivity due to moisture content.
An experiment was designed and conducted to simulate a green roof soil layer, testing is
thermal performance to validate the model. The experiment and the model show that
the model predicts the model reasonably. Soil moisture is a very important factor in the
green roof thermal performance, primarily due to the evaporative cooling effect that
reduces the soil surface temperature in moist soil.
The basic research question, whether low conductivity for dry soil or high evaporation
for moist soil has a greater impact on green roof performance, has been answered.
Evaporation is more important. This result indicates that green roofs should be kept
moist (irrigated) during hot weather to optimize building energy savings.

52
References
Alcazar ,S., Bass, B.(2005). Energy performance of green roofs in a‐multi storey
residential building in madrid. Greening Rooftops for Sustainable City Conference.
Becker, B. R., Misra, A., Fricke, B. A., (1992). Development of correlations for soil
thermal conductivity. International Communications in Heat and Mass Transfer.19, 59‐
68
Bell, H., Spolek, G. (2009). Measured Energy Performance of Green Roofs. Paper
presented at the Greening Rooftops for Sustainable Cities Conference.
Buccola, N., Spolek, G. (2010). A Pilot‐Scale Evaluation of Green roof Runoff Retention,
Detention, and Quality. Water, Air and Soil Pollution. 1‐10
Curtis, O.F. (1936). Leaf temperatures and the cooling of leaves by radiation, Plant
Physiology. 11 (2), 343–364.

53
Del Barrio, E. P. (1998). Analysis of the green roofs cooling potential in buildings. Energy
and Buildings 27(2). 179‐193
Fang, C‐F( 2008). Evaluating the thermal reduction effect of plant layers on rooftops.
Energy and Building. 40, 1048‐1052
Feng,C., Meng,Q. (2010). Theoretical and experimental analysis of the energy
balance of extensive green roofs.Energy and Buildings. 42 (6), 959–965.
KD2 Pro Specifications.(2006). Decagon Inc.
Kumar, R., Kaushik, R. C. (2005 ). Performance evaluation of green roof and shading for
thermal protection of building. Building and Environment. 40(11), 1505‐1511

54
Lazzarin R. M., Castellotti F., & BusatoF. (2005). Experimental measurements and
numerical modeling of a green roof. Energy and Buildings.37,1260‐1267
Liu, K. (2003). Engineering performance of rooftop gardens through field evaluation
NRCC‐46294
Liu, K & B Baskaran, (2003), Thermal performance of green roofs through field
evaluation, in Proceedings for the First North America Green Roof Infrastructure
Conference: Greening Rooftops for Sustainable Communities, Chicago.
Medjelled A., Benchatti B., & Bouif A. (2008) Experimental model for the study of heat
transfer in unsaturated soil: Case of underground thermal storage. International Journal
of Heat and Technology.26, 97‐104
Mellor, R.S., Salisbury, F.B., & Raschke, K. (1964). Leaf temperatures in controlled
environment. Planta. 61(1), 56–72.

55
Ondimu, S N, Murase, H. (2007). Combining Galerkin methods and neural network
analysis to inversely determine thermal conductivity of living green roof material.
Biosystems Engineering. 96 (4), 541‐550
Onmura, S. Matsumoto, M. Hokoi, S. (2001). Study on evaporative cooling effect of roof
lawn gardens. Energy and Buildings. 33 (7), 653–666.
Perry, M.D. (2003). Green roofs offer environmentally friendly alternative. Plant
Engineering. 57, 54
Philip,J.R.(1957). Evaporation, and moisture and heat fields in the soil. 14, 354‐366
Sailor, D. (2008). A green roof model for building energy simulation programs. Energy
and Buildings. 40, 1466‐1478
Sailor, D., Hutchinson, D., Bokovoy, L. (2008). Thermal property measurements for
ecoroof soils common in the western U.S.. Energy and Buildings. 40(7), 1246‐1251

56
Spolek, G. (2008). Performance monitoring of three ecoroofs in Portland, Oregon. Urban
Ecosystems, 11(4), 349‐359.
Suleiman, A. A., Ritchie, J. T. (2003). Modeling soil water redistribution during second‐
stage evaporation. Soil Science Society of America Journal, 67(2), 377‐386
Tabares‐velasco. (2009). Heat fluxes and water management of a green and brown roof:
laboratory experiments, in: Greening Rooftops for Sustainable Communities
Takakura, T. ,Kitade, S., & Goto, E.(2000 ). Cooling effect of greenery cover over a
building, Energy and Buildings. 31, 1‐6
Theodosiou, T. G. (2003). Summer period analysis of the performance of a planted roof
as a passive cooling technique, Energy and Buildings. 35 (9), 909–917.
Theodore, O. (1999). Roof Gardens: History, Design and Construction. New York: W.W.
Norton & Company Inc.

57
Green Roof Industry Survey Results in 2008,
http://www.greenroofs.org/index.php/mediaresource/industry‐survey‐2008
Wong, N.H., Chen, Y., Ong, C.L., Sia, A. (2003).Investigation of thermal benefits of
rooftop garden in the tropical environment. Building and Environment. 38 (4), 261–270.
Wong, N. H., Cheong, D. K. W., Yan, H., Soh, J., Ong, C. L, Sia, A. (2002). The effects of
rooftop garden on energy consumption of a commercial building in Singapore. Energy
and Buildings. 35, 353‐364


![Soil Moisture Content and Density Prediction Using ...ijetch.org/papers/652-EA1005.pdf · soil properties were moisture content, density ... groundwater resources [4] – [7] and](https://img.pdfslide.net/doc/110x75/5b33fc157f8b9a8b4b8b993a/soil-moisture-content-and-density-prediction-using-soil-properties-were.jpg)