Embed Size (px)
Citation preview
An Assessment o f Future Car ibbean Cl imate Changes us ing the BAU Scenar io by Coupl ing a Global C i rcu la t ion Model
w i th a Regional Model
9.4
Moises E. Angeles* Mechanical Engineering Department
University of Puerto Rico-Mayagüez, Mayagüez, PR Jorge E. Gonzalez
Mechanical Engineering Department Santa Clara University, Santa Clara, CA
David J. Erickson III and José L. Hernández Oak Ridge National Laboratory
Oak Ridge, TN
ABSTRACT1
The General Circulation Models (GCMs) have a major difficulty in taking into account sub-grid scale processes such as cumulus clouds. Often they occur over parts of a 5x5 degree area and the average conditions of GCMs would not satisfy the convection criteria, while the deep convection is less than the GCMs’ vertical resolution. In addition a smooth topography with a hydrostatic atmosphere is approximated in GCMs. The Regional Atmospheric Model System (RAMS) uses a finer topographic resolution and is able to perform a zoom-in of these subgrid-scale phenomena. In this work, RAMS was coupled with the Parallel Climate Model (PCM) to predict climate changes in the year 2048 under the Business as Usual (BAU) Scenario of the Intergovernmental Panel of Climate Change (IPCC). PCM data was used in RAMS as initial and boundary conditions. The PCM results showed that SOI and NAO calculated from PCM drive the 15 years annual Caribbean rainfall variability. The lowest rainfall simulated in the fifth climatology is caused by the superposition of positive SOI and NAO dryness effects in the ERS. In addition the Sea Level (SL) will increase in 0.35 cm with respect to the first climatology. The synoptic scale simulated by RAMS shows a closer behavior to the simulated by PCM during the dry and late rainfall seasons, while the mesoscale rainfall is strongly influenced by the land dry areas computed in the parent grid. The mesoscale rainfall production is driven by the vertical wind shear below 8 m/s and the dry/moisture advection, particularly in the Caribbean late rainfall season. The RAMS finer grid predicts future warmer areas over the Island of Puerto Rico. These areas will have surface air temperatures 2.5°C above
*Moises E. Angeles, University of Puerto Rico, Mechanical Engineering Department-Mayagüez, PR 00681-9045; [email protected].
their 2048 monthly average. Although the dry season will have the more intense and abrupt rainfall increases (above 350%), the early rainfall season shows sudden rainfall increases which could imply unexpected floods.
1. INTRODUCTION
The Intergovernmental Panel on Climate Change attributes the Greenhouse Gases (GHG) concentration increase to human activity, such as fossil-fuel use, land-use changes and intensive agriculture development. As a response to the GHG increase in the atmosphere, the surface temperature of the Earth has increased 0.6 ± 0.20C, while the precipitation in the subtropics (from 100N to 300N) has decreased in average 0.3% decade-1 [IPCC Summary for Policy Makers, 2001]. The IPCC issued in 1992 the IS92 scenarios, where IS92a scenario was called the Business as Usual scenario (BAUS) [IPCC Emissions Scenario, 2000]. On the other hand, small islands, according to the 2001 Report of the IPCC, have a high vulnerability and low adaptive capacity, therefore likely to be the most seriously impacted pieces of land by global climate changes. Changes in the Caribbean climate patterns can cause significant damages to property, the economy, and may result in loss of lives [Caribbean Environmental Health Institute, 2002].
Short time-scale climate changes have been studied in the Caribbean region caused by global scale effects such as El Niño and La Niña and the Southern Oscillation (ENSO) events which were investigated by Taylor (1999) and Giannini et al. (2000). They showed that a strong relationship exists between the rainfall season and the El Niño events. Taylor (2002) and Chen et al. (1997) have established that a strong La Niña event generally leads to a drier than normal conditions. In addition, Enfield and Alfaro (1999) showed that a warm tropical Atlantic combined with a cool tropical Pacific scenario had a tendency to enhance the rainfall amount over the Caribbean basin and Central America.
1
Knaff (1999), using observational data, established the principal factors that enhance Caribbean rainfall and the development of hurricanes including; low surface pressure, low vertical wind shear (VWS), lower convective stability, and warmer North Tropical Atlantic (NTA), being the NTA SSTs the main factor of the ERS precipitation. Giannini et al. (2001), Chen et al. (2002) and Kingtse et al. (2001) defined the VWS as the difference between the wind speed in the upper troposphere, 250 mb, and wind in the lower troposphere, 850 mb. According to Arkin (1998), Bell et al. (1998) and Gerald et al. (1999), a weakening of the VWS (≤ 8 m/s) causes an increase in the rainfall over the Caribbean basin, especially when the NTA and the MDR have SSTs> 26.50C.
Several works coupling GCMs and regional models have been reported. Liston and Pielke (2001) affirm that regional models can be driven with GCMs outputs as lateral boundary condition instead of observed data. However, this coupling is a necessary, but not a sufficient step to obtain realistic regional climate model simulations. Eastman et al. (2001) carried out the coupling of the General Energy and Mass Transfer Model (GEMTM) with RAMS to analyze the contribution of the vegetation change in the seasonal evolution of the 1x and 2x CO2 radiative forcing and 1 x and 2 x CO2 biology. Kao et al. (1992) ingested the National Meteorological Center (NMC) global analysis into RAMS as a first work to study the regional climatology of the western United State (U.S.). The Community Climate Model (CCM) provided the boundary forcings for RAMS. The results showed that RAMS was able to simulate successfully the average precipitation and temperature over western U.S. The Rossby Centre Regional Atmospheric Model (RCA1) coupled with a regional Baltic Sea ocean model was used to perform a dynamic downscaling from GCMS for a 10 year period over northern Europe (Rummuksinen et al., 2001). It was found that this regional model have large seasonal SSTs biases on their Baltic Sea grid affected by the biases in the GCMs. Besides this limitation, the Baltic Sea Model provided a reasonable simulation of the SSTs and ice conditions. It has been documented that dynamic downscaling improves the regional climate system representation, but it is not universal, in some cases the forecasted variables depart from the observed data due to errors in the GCM models and the ability of the regional models of representing the atmospheric phenomena appropriately with its parameterizations schemes (Menéndez et al., 2001). Leung et al. (2002) studied the effects of the climate changes over the water resources in the western U.S, using the Parallel Climate Model (PCM) and the Mesoscale Model (MM5). They downscaled the PCM control run outputs at 40 km spatial resolution. Results showed that the average regional warming of 1 to 2.50C affects the snow pack in
the western U.S (mid twenty-first century). In addition, they indicated that the dynamical downscaling retains the large-scale features of the global simulation, but at mesoscale, the downscaled temperature and precipitation can differ strongly from the GCMs outputs.
The Caribbean region is a very sensitive region, however very little work has been reported to determine the possible impact of the global climate change in the region. The present research will focus on investigating possible future climate changes in the Caribbean region focused in the island of Puerto Rico as the central scenario. The mesoscale model RAMS will be used as the prognostic downscaling tool, coupled with the climate model PCM to determine the impact of the global increase of CO2 concentrations in the Caribbean regional climate.
2. GENERAL CIRCULATION AND REGIONAL ATMOSPHERIC MODEL
The Parallel Climate Model model version 1, used in this research, is a fully coupled, global climate model, comprised of the NCAR Community Climate Model version 3 (CCM3), the Los Alamos National Laboratory Parallel Ocean Program (POP), the Sea ice model from the Naval Postgraduate School, and the land surface biophysics model (Dai et al., 2004; Washington et al., 2000; Weatherly et al., 2000). The ocean model was initialized with assimilated observed data conditions from 1995 instead of performing traditional runs (Dai et al., 2004; Barnett et al., 2003). Von Salzen and McFarlane (2001) suggested that often most of the convective activity in GCMs occurs in an area and penetration height much smaller than the horizontal and vertical GCM resolutions resulting in cumuliform clouds smaller than the horizontal grid size, and stratiform clouds smaller than the grid vertical resolution. The same authors along with Collins et al. (2004) point out that the different clouds in GCMs are represented by a “bulk” cloud in the mass flux approach based on the entraining plume model. In addition a smooth topography with a hydrostatic atmosphere are approximated in GCMs, losing the ability of detecting subgridscale phenomena.
The Regional Atmospheric Model System (RAMS) is a numerical model able to forecast weather and climate events. In order to perform the numerical prediction, RAMS solves simultaneously the primitive non-hydrostatic compressible fluid dynamic equations along with the thermodynamic and continuity equations for the water vapor, liquid and ice hydrometeor mixing ratios (Walko and Tremback). The regional model is able to have a better representation of the topography and microphysics, which are very important factors in the sub-grid scale phenomena. RAMS has a grid nesting scheme which solves simultaneously the
2
prognostic equations and allow developing a zoom-in over any region (Cotton et al., 2003). RAMS usually uses the six-hours National Center for Environmental Prediction (NCEP) reanalysis data as initial, lateral and top boundary conditions through nudging processes (Pielke et al., 1992, ATMET, Terry, 1997). In addition, RAMS computes surface layer fluxes of heat, momentum, and water vapor from the land to the atmosphere (surface layer parameterization). The grid cells of RAMS have three different surfaces, water, bare soil, and vegetated surface.
3. METHODOLOGY
The IPCC has argued a tendency of a future global warming at the global scale. Climate modelers have performed many numerical experiments using GCMs along with IPCC scenarios to observe how the atmosphere and ocean will be affected. Regrettably the GCMs have coarse resolution and they are not able to detect local climates. We perform here a dynamical downscaling to determine how the climatological characteristics of the Caribbean region will be affected as consequence of a future global climate change due to an increase in atmospheric CO2 concentrations.
The Caribbean region is defined from 8.750N-25.250N and 88.750W-58.750W. According to Taylor et al., (2002), Giannini et al. (2001) and Taylor (1999), the rainy season is segmented into two periods, the Early Rainfall Season (ERS) from May to July and the Late Rainfall Season (LRS). From December to April the Caribbean region have the lowest rainfall and it is referred as the dry season (DS).
The PCM output -with T42 resolution- and using the BAUS, is interpolated from the hybrid sigma-pressure 18 vertical levels to the standard 17 levels. The SSTs from the POP model are interpolated from an orthogonal curvilinear coordinate to a regular grid of 1 degree resolution. Both, the atmospheric and oceanic PCM output are averaged into seven periods of 15 years each to observe more clearly the atmospheric and oceanic climatological variability between the years 1996 and 2098. These climatological periods are: 1996-2010, 2011-2025, 2026-2040, 2041-2055, 2056-2069, 2070-2084 and 2085-2098. The Southern Oscillation Index (SOI) and the North Atlantic Oscillation (NAO) were also calculated and analyzed for these same periods.
The regional atmospheric model RAMS is configured to perform a dynamical downscaling using the PCM air temperature, geopotential height, relative humidity and wind velocity as initial and lateral boundary conditions. These parameters were interpolated at 17 standard levels and at 2.5 degree horizontal resolution adapting to the RALPH2 format. The SSTs from PCM are ingested to RAMS as bottom boundary condition in
the V-format at 1 degree resolution. RAMS encloses two areas, the first one from 11.50 N to 25.50 N and from 830 W to 50.50 W at a 20km resolution (grid 1). The second and finer grid has a horizontal resolution of 4km and enclosed an area from 17.610 N to 18.650 N and from 67.630 W to 64.990 W (grid 2). The finer grid correspond a zoom in over the island of Puerto Rico. To increase convection at the regional scale, the predicted initial and boundary conditions from PCM are corrected with observed NCEP data for the year 1998 plus the difference of PCM data between the years 2048 and 1998.
4. LONG TIME HISTORY OF THE CARIBBEAN REGION SIMULATED BY PCM
Several 15-years climatologies are calculated from 1996 to 2098 and averaged over the Caribbean basin to determine the future rainfall variability as a function of synoptic scale parameters. The BAUS is selected to analyze the future Caribbean climate change due to the fact that it represents an intermediate scenario that follows current tendencies for population and economic growth, and for the use of technology and of energy.
The BAUS scenario predicts a continue increase of the anthropogenic CO2 in the atmosphere during the 21st century. This radiative forcing imply an enhancement of the Greenhouse gases effects (GHGE) and a permanent SSTs increase, reaching maximum values (26.70C) in the last decade from 2085 to 2098 (see figure 1a). The radiative forcing generates more intense SSTs, which produces an intense vertical convection and therefore a greater cloudiness. The cloudiness will increase the earth’s albedo and it will cause the decrease of the surface solar radiation such as it is shown in figure 1b. The lowest surface solar radiation is observed in the seventh climatology with 2 W/m2 less intense than the climatology number 1, taken as representative of the current climatology. The climatologies 4 and 5 have very close SSTs values, while the surface solar radiation has the second maximum peak in the climatology number 5. On The other hand, the Sea Level (SL) is usually measured using the steric height. This oceanic parameter is in correlation with the sea density and it is composed by a standard distance between two isobars and a fluctuation of this standard distance. The surface pressure is in relation with the steric height in a proportion of gρo, then the Sea Level Pressure (SLP) spatial variability imply a mapping of the SL with respect to the depth of no motion. A thermal expansion is generated as consequence of a Caribbean warming causing a future SLP increase in the 21st century. The higher SLP will be present in the fifth climatology, where the SLP is 0.35 mb (~0.35 centimeters) higher than the first climatology, thus the Caribbean region will suffer a more intense SL increase in this climatology (see figure 2a).
3
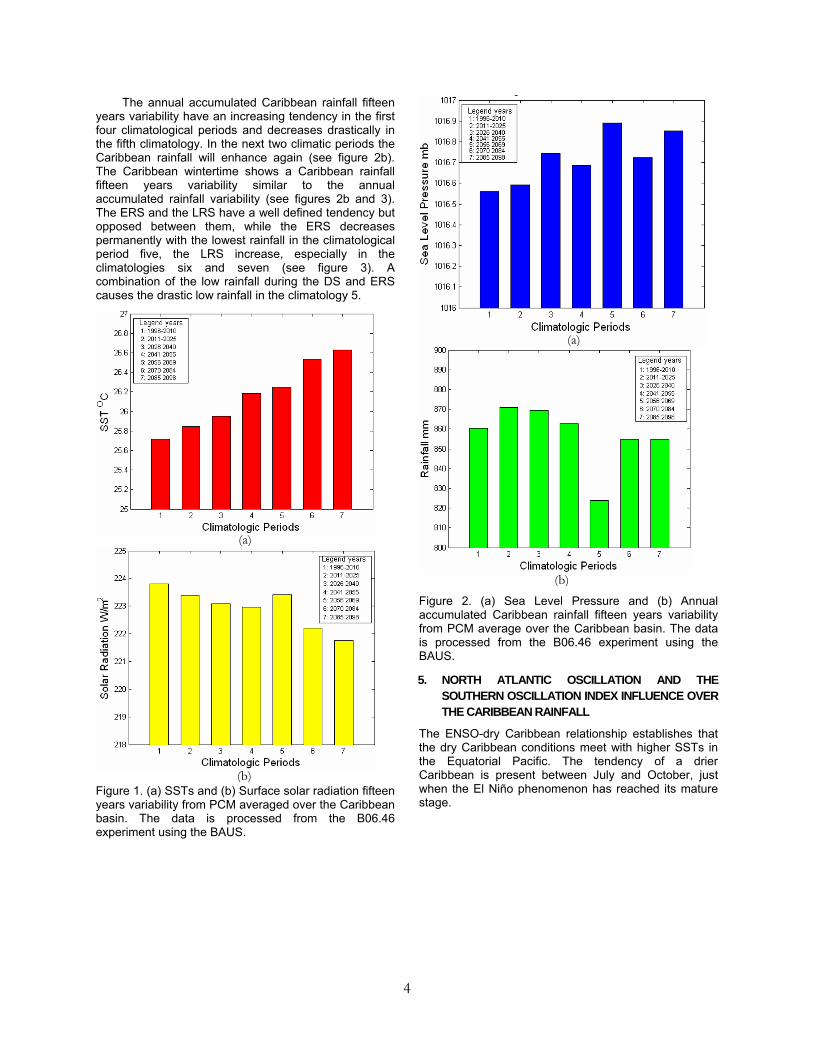
The annual accumulated Caribbean rainfall fifteen years variability have an increasing tendency in the first four climatological periods and decreases drastically in the fifth climatology. In the next two climatic periods the Caribbean rainfall will enhance again (see figure 2b). The Caribbean wintertime shows a Caribbean rainfall fifteen years variability similar to the annual accumulated rainfall variability (see figures 2b and 3). The ERS and the LRS have a well defined tendency but opposed between them, while the ERS decreases permanently with the lowest rainfall in the climatological period five, the LRS increase, especially in the climatologies six and seven (see figure 3). A combination of the low rainfall during the DS and ERS causes the drastic low rainfall in the climatology 5.
Figure 1. (a) SSTs and (b) Surface solar radiation fifteen years variability from PCM averaged over the Caribbean basin. The data is processed from the B06.46 experiment using the BAUS.
Figure 2. (a) Sea Level Pressure and (b) Annual accumulated Caribbean rainfall fifteen years variability from PCM average over the Caribbean basin. The data is processed from the B06.46 experiment using the BAUS.
(a)
(a)
(b)
5. NORTH ATLANTIC OSCILLATION AND THE SOUTHERN OSCILLATION INDEX INFLUENCE OVER THE CARIBBEAN RAINFALL
The ENSO-dry Caribbean relationship establishes that the dry Caribbean conditions meet with higher SSTs in the Equatorial Pacific. The tendency of a drier Caribbean is present between July and October, just when the El Niño phenomenon has reached its mature stage.
(b)
4
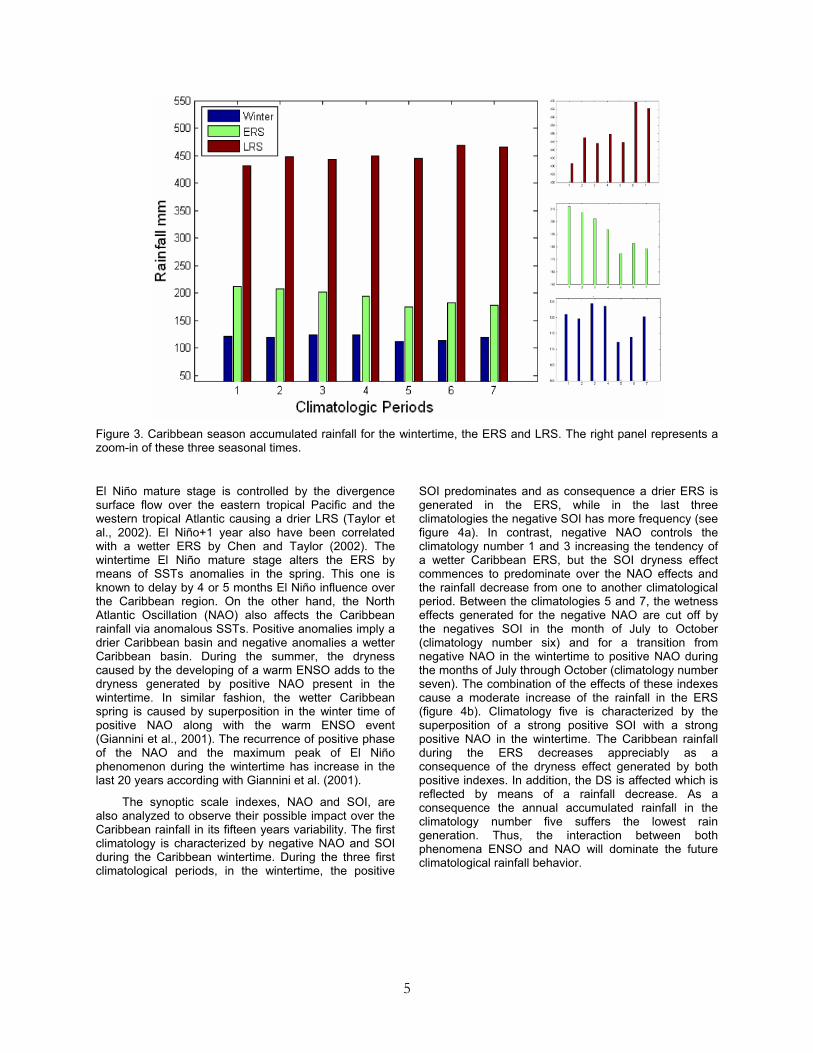
Figure 3. Caribbean season accumulated rainfall for the wintertime, the ERS and LRS. The right panel represents a zoom-in of these three seasonal times.
El Niño mature stage is controlled by the divergence surface flow over the eastern tropical Pacific and the western tropical Atlantic causing a drier LRS (Taylor et al., 2002). El Niño+1 year also have been correlated with a wetter ERS by Chen and Taylor (2002). The wintertime El Niño mature stage alters the ERS by means of SSTs anomalies in the spring. This one is known to delay by 4 or 5 months El Niño influence over the Caribbean region. On the other hand, the North Atlantic Oscillation (NAO) also affects the Caribbean rainfall via anomalous SSTs. Positive anomalies imply a drier Caribbean basin and negative anomalies a wetter Caribbean basin. During the summer, the dryness caused by the developing of a warm ENSO adds to the dryness generated by positive NAO present in the wintertime. In similar fashion, the wetter Caribbean spring is caused by superposition in the winter time of positive NAO along with the warm ENSO event (Giannini et al., 2001). The recurrence of positive phase of the NAO and the maximum peak of El Niño phenomenon during the wintertime has increase in the last 20 years according with Giannini et al. (2001).
The synoptic scale indexes, NAO and SOI, are also analyzed to observe their possible impact over the Caribbean rainfall in its fifteen years variability. The first climatology is characterized by negative NAO and SOI during the Caribbean wintertime. During the three first climatological periods, in the wintertime, the positive
SOI predominates and as consequence a drier ERS is generated in the ERS, while in the last three climatologies the negative SOI has more frequency (see figure 4a). In contrast, negative NAO controls the climatology number 1 and 3 increasing the tendency of a wetter Caribbean ERS, but the SOI dryness effect commences to predominate over the NAO effects and the rainfall decrease from one to another climatological period. Between the climatologies 5 and 7, the wetness effects generated for the negative NAO are cut off by the negatives SOI in the month of July to October (climatology number six) and for a transition from negative NAO in the wintertime to positive NAO during the months of July through October (climatology number seven). The combination of the effects of these indexes cause a moderate increase of the rainfall in the ERS (figure 4b). Climatology five is characterized by the superposition of a strong positive SOI with a strong positive NAO in the wintertime. The Caribbean rainfall during the ERS decreases appreciably as a consequence of the dryness effect generated by both positive indexes. In addition, the DS is affected which is reflected by means of a rainfall decrease. As a consequence the annual accumulated rainfall in the climatology number five suffers the lowest rain generation. Thus, the interaction between both phenomena ENSO and NAO will dominate the future climatological rainfall behavior.
5
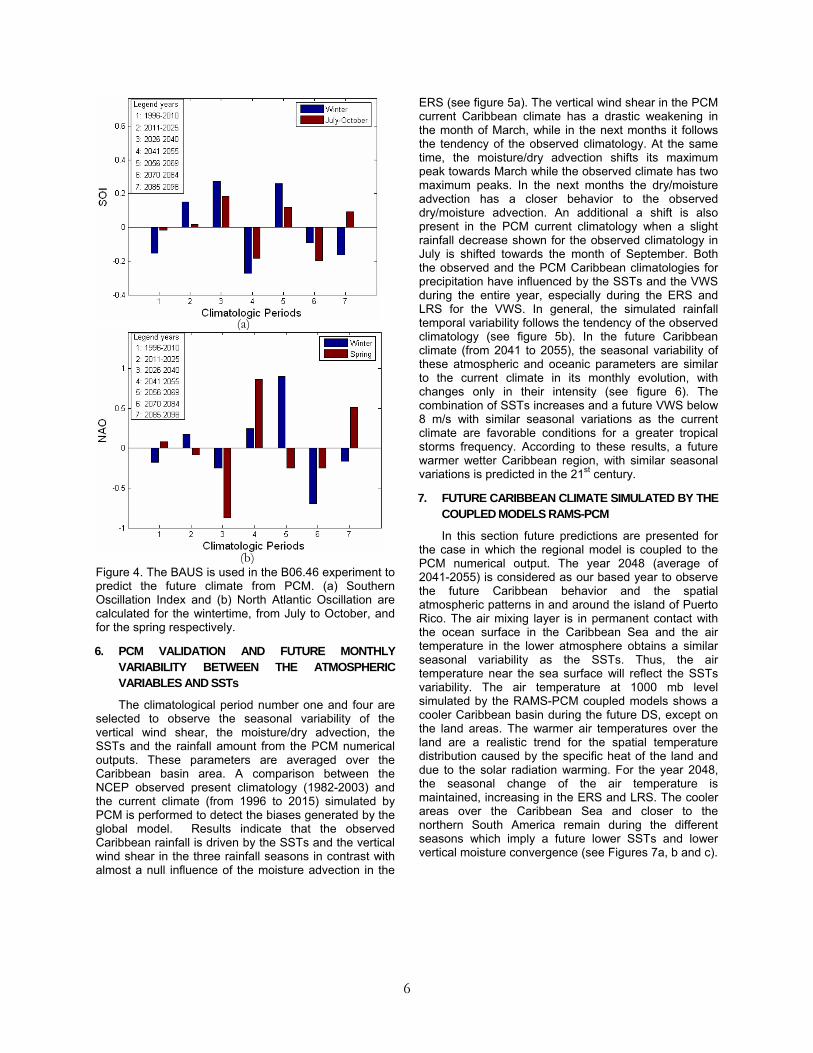
Figure 4. The BAUS is used in the B06.46 experiment to predict the future climate from PCM. (a) Southern Oscillation Index and (b) North Atlantic Oscillation are calculated for the wintertime, from July to October, and for the spring respectively.
6. PCM VALIDATION AND FUTURE MONTHLY VARIABILITY BETWEEN THE ATMOSPHERIC VARIABLES AND SSTs
The climatological period number one and four are selected to observe the seasonal variability of the vertical wind shear, the moisture/dry advection, the SSTs and the rainfall amount from the PCM numerical outputs. These parameters are averaged over the Caribbean basin area. A comparison between the NCEP observed present climatology (1982-2003) and the current climate (from 1996 to 2015) simulated by PCM is performed to detect the biases generated by the global model. Results indicate that the observed Caribbean rainfall is driven by the SSTs and the vertical wind shear in the three rainfall seasons in contrast with almost a null influence of the moisture advection in the
ERS (see figure 5a). The vertical wind shear in the PCM current Caribbean climate has a drastic weakening in the month of March, while in the next months it follows the tendency of the observed climatology. At the same time, the moisture/dry advection shifts its maximum peak towards March while the observed climate has two maximum peaks. In the next months the dry/moisture advection has a closer behavior to the observed dry/moisture advection. An additional a shift is also present in the PCM current climatology when a slight rainfall decrease shown for the observed climatology in July is shifted towards the month of September. Both the observed and the PCM Caribbean climatologies for precipitation have influenced by the SSTs and the VWS during the entire year, especially during the ERS and LRS for the VWS. In general, the simulated rainfall temporal variability follows the tendency of the observed climatology (see figure 5b). In the future Caribbean climate (from 2041 to 2055), the seasonal variability of these atmospheric and oceanic parameters are similar to the current climate in its monthly evolution, with changes only in their intensity (see figure 6). The combination of SSTs increases and a future VWS below 8 m/s with similar seasonal variations as the current climate are favorable conditions for a greater tropical storms frequency. According to these results, a future warmer wetter Caribbean region, with similar seasonal variations is predicted in the 21st century.
(a)
7. FUTURE CARIBBEAN CLIMATE SIMULATED BY THE COUPLED MODELS RAMS-PCM
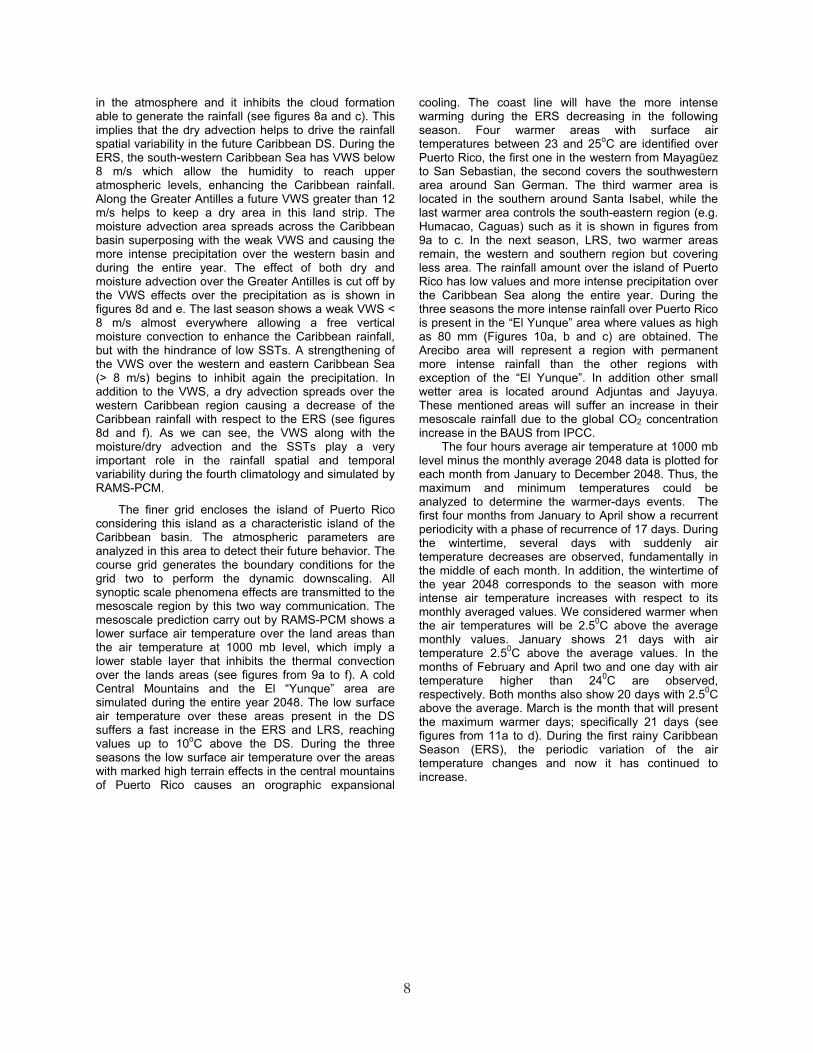
In this section future predictions are presented for the case in which the regional model is coupled to the PCM numerical output. The year 2048 (average of 2041-2055) is considered as our based year to observe the future Caribbean behavior and the spatial atmospheric patterns in and around the island of Puerto Rico. The air mixing layer is in permanent contact with the ocean surface in the Caribbean Sea and the air temperature in the lower atmosphere obtains a similar seasonal variability as the SSTs. Thus, the air temperature near the sea surface will reflect the SSTs variability. The air temperature at 1000 mb level simulated by the RAMS-PCM coupled models shows a cooler Caribbean basin during the future DS, except on the land areas. The warmer air temperatures over the land are a realistic trend for the spatial temperature distribution caused by the specific heat of the land and due to the solar radiation warming. For the year 2048, the seasonal change of the air temperature is maintained, increasing in the ERS and LRS. The cooler areas over the Caribbean Sea and closer to the northern South America remain during the different seasons which imply a future lower SSTs and lower vertical moisture convergence (see Figures 7a, b and c).
(b)
6
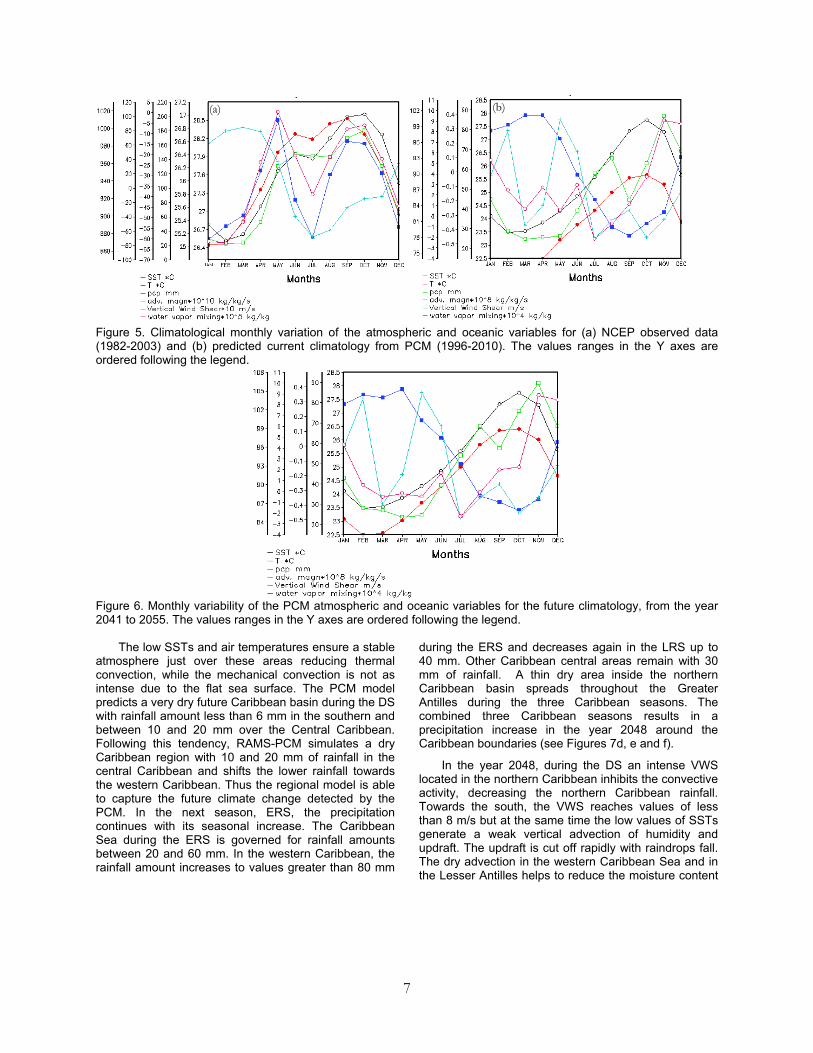
Figure 5. Climatological monthly variation of the atmospheric and oceanic variables for (a) NCEP observed data (1982-2003) and (b) predicted current climatology from PCM (1996-2010). The values ranges in the Y axes are ordered following the legend.
Figure 6. Monthly variability of the PCM atmospheric and oceanic variables for the future climatology, from the year 2041 to 2055. The values ranges in the Y axes are ordered following the legend.
The low SSTs and air temperatures ensure a stable atmosphere just over these areas reducing thermal convection, while the mechanical convection is not as intense due to the flat sea surface. The PCM model predicts a very dry future Caribbean basin during the DS with rainfall amount less than 6 mm in the southern and between 10 and 20 mm over the Central Caribbean. Following this tendency, RAMS-PCM simulates a dry Caribbean region with 10 and 20 mm of rainfall in the central Caribbean and shifts the lower rainfall towards the western Caribbean. Thus the regional model is able to capture the future climate change detected by the PCM. In the next season, ERS, the precipitation continues with its seasonal increase. The Caribbean Sea during the ERS is governed for rainfall amounts between 20 and 60 mm. In the western Caribbean, the rainfall amount increases to values greater than 80 mm
during the ERS and decreases again in the LRS up to 40 mm. Other Caribbean central areas remain with 30 mm of rainfall. A thin dry area inside the northern Caribbean basin spreads throughout the Greater Antilles during the three Caribbean seasons. The combined three Caribbean seasons results in a precipitation increase in the year 2048 around the Caribbean boundaries (see Figures 7d, e and f).
In the year 2048, during the DS an intense VWS located in the northern Caribbean inhibits the convective activity, decreasing the northern Caribbean rainfall. Towards the south, the VWS reaches values of less than 8 m/s but at the same time the low values of SSTs generate a weak vertical advection of humidity and updraft. The updraft is cut off rapidly with raindrops fall. The dry advection in the western Caribbean Sea and in the Lesser Antilles helps to reduce the moisture content
(b) (a)
7
in the atmosphere and it inhibits the cloud formation able to generate the rainfall (see figures 8a and c). This implies that the dry advection helps to drive the rainfall spatial variability in the future Caribbean DS. During the ERS, the south-western Caribbean Sea has VWS below 8 m/s which allow the humidity to reach upper atmospheric levels, enhancing the Caribbean rainfall. Along the Greater Antilles a future VWS greater than 12 m/s helps to keep a dry area in this land strip. The moisture advection area spreads across the Caribbean basin superposing with the weak VWS and causing the more intense precipitation over the western basin and during the entire year. The effect of both dry and moisture advection over the Greater Antilles is cut off by the VWS effects over the precipitation as is shown in figures 8d and e. The last season shows a weak VWS < 8 m/s almost everywhere allowing a free vertical moisture convection to enhance the Caribbean rainfall, but with the hindrance of low SSTs. A strengthening of the VWS over the western and eastern Caribbean Sea (> 8 m/s) begins to inhibit again the precipitation. In addition to the VWS, a dry advection spreads over the western Caribbean region causing a decrease of the Caribbean rainfall with respect to the ERS (see figures 8d and f). As we can see, the VWS along with the moisture/dry advection and the SSTs play a very important role in the rainfall spatial and temporal variability during the fourth climatology and simulated by RAMS-PCM.
The finer grid encloses the island of Puerto Rico considering this island as a characteristic island of the Caribbean basin. The atmospheric parameters are analyzed in this area to detect their future behavior. The course grid generates the boundary conditions for the grid two to perform the dynamic downscaling. All synoptic scale phenomena effects are transmitted to the mesoscale region by this two way communication. The mesoscale prediction carry out by RAMS-PCM shows a lower surface air temperature over the land areas than the air temperature at 1000 mb level, which imply a lower stable layer that inhibits the thermal convection over the lands areas (see figures from 9a to f). A cold Central Mountains and the El “Yunque” area are simulated during the entire year 2048. The low surface air temperature over these areas present in the DS suffers a fast increase in the ERS and LRS, reaching values up to 10oC above the DS. During the three seasons the low surface air temperature over the areas with marked high terrain effects in the central mountains of Puerto Rico causes an orographic expansional
cooling. The coast line will have the more intense warming during the ERS decreasing in the following season. Four warmer areas with surface air temperatures between 23 and 25oC are identified over Puerto Rico, the first one in the western from Mayagüez to San Sebastian, the second covers the southwestern area around San German. The third warmer area is located in the southern around Santa Isabel, while the last warmer area controls the south-eastern region (e.g. Humacao, Caguas) such as it is shown in figures from 9a to c. In the next season, LRS, two warmer areas remain, the western and southern region but covering less area. The rainfall amount over the island of Puerto Rico has low values and more intense precipitation over the Caribbean Sea along the entire year. During the three seasons the more intense rainfall over Puerto Rico is present in the “El Yunque” area where values as high as 80 mm (Figures 10a, b and c) are obtained. The Arecibo area will represent a region with permanent more intense rainfall than the other regions with exception of the “El Yunque”. In addition other small wetter area is located around Adjuntas and Jayuya. These mentioned areas will suffer an increase in their mesoscale rainfall due to the global CO2 concentration increase in the BAUS from IPCC.
The four hours average air temperature at 1000 mb level minus the monthly average 2048 data is plotted for each month from January to December 2048. Thus, the maximum and minimum temperatures could be analyzed to determine the warmer-days events. The first four months from January to April show a recurrent periodicity with a phase of recurrence of 17 days. During the wintertime, several days with suddenly air temperature decreases are observed, fundamentally in the middle of each month. In addition, the wintertime of the year 2048 corresponds to the season with more intense air temperature increases with respect to its monthly averaged values. We considered warmer when the air temperatures will be 2.50C above the average monthly values. January shows 21 days with air temperature 2.50C above the average values. In the months of February and April two and one day with air temperature higher than 240C are observed, respectively. Both months also show 20 days with 2.50C above the average. March is the month that will present the maximum warmer days; specifically 21 days (see figures from 11a to d). During the first rainy Caribbean Season (ERS), the periodic variation of the air temperature changes and now it has continued to increase.
8
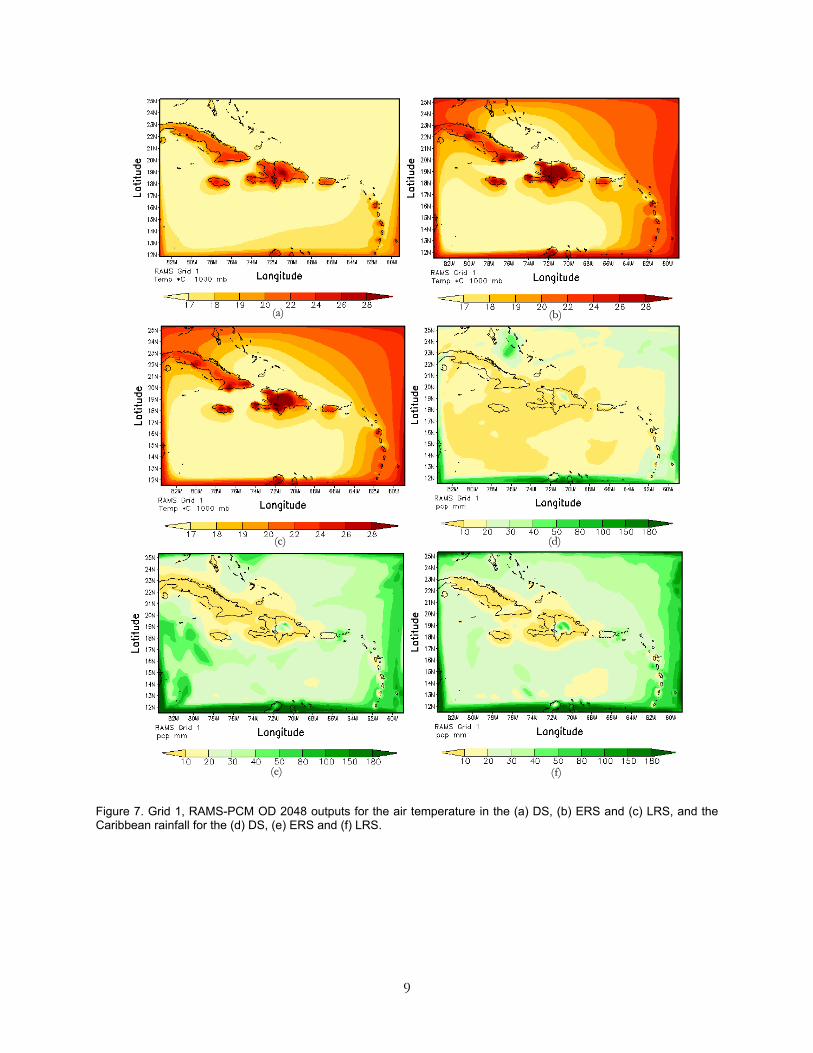
Figure 7. Grid 1, RAMS-PCM OD 2048 outputs for the air temperature in the (a) DS, (b) ERS and (c) LRS, and the Caribbean rainfall for the (d) DS, (e) ERS and (f) LRS.
(a) (b)
(c) (d)
(e) (f)
9
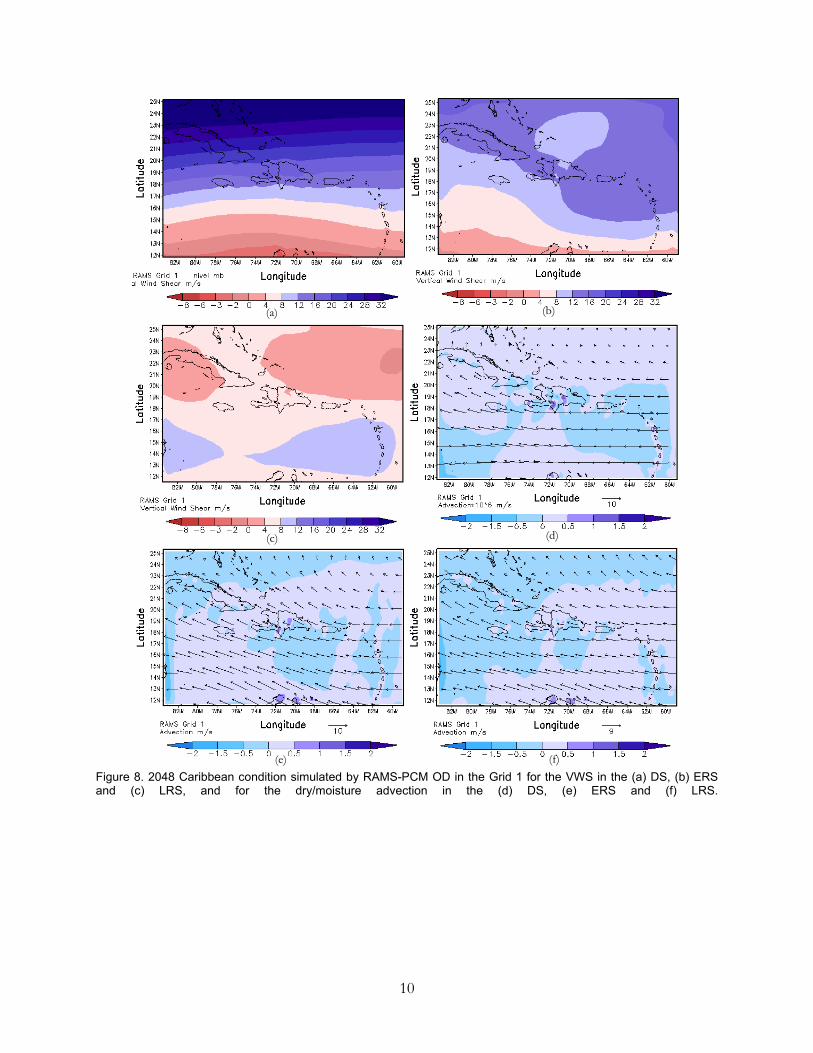
Figure 8. 2048 Caribbean condition simulated by RAMS-PCM OD in the Grid 1 for the VWS in the (a) DS, (b) ERS and (c) LRS, and for the dry/moisture advection in the (d) DS, (e) ERS and (f) LRS.
(b) (a)
(d) (c)
(f) (e)
10
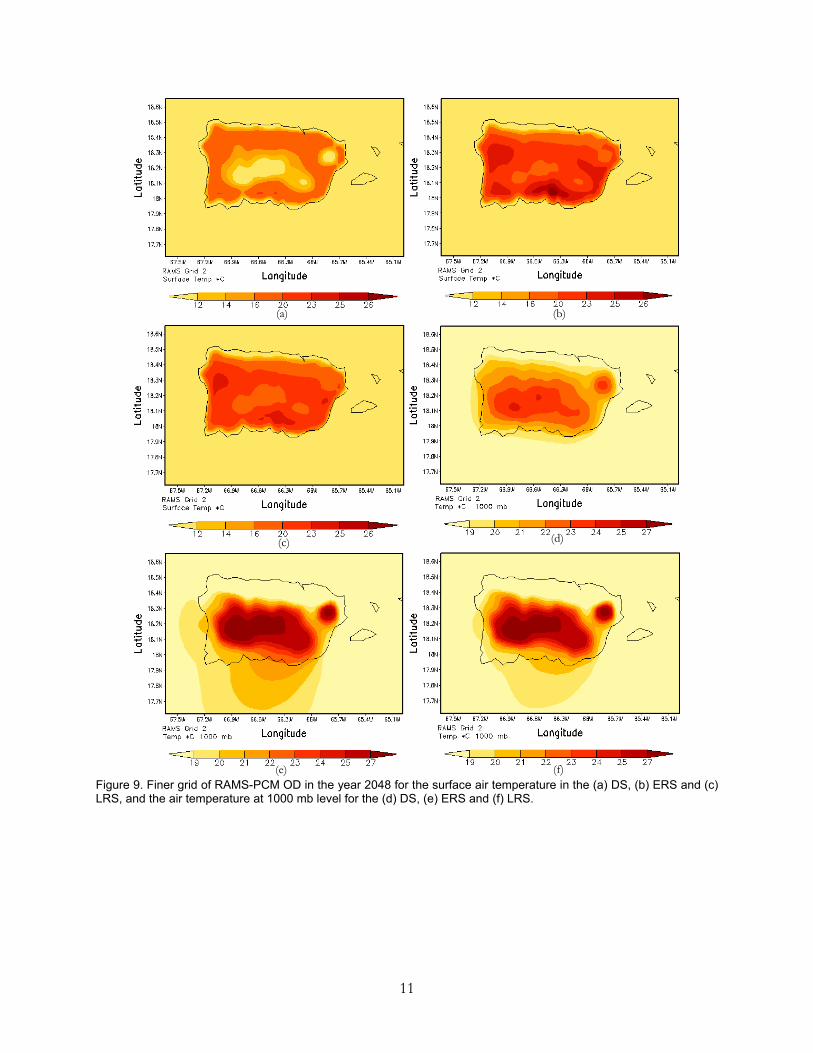
Figure 9. Finer grid of RAMS-PCM OD in the year 2048 for the surface air temperature in the (a) DS, (b) ERS and (c) LRS, and the air temperature at 1000 mb level for the (d) DS, (e) ERS and (f) LRS.
(a) (b)
(d) (c)
(f) (e)
11
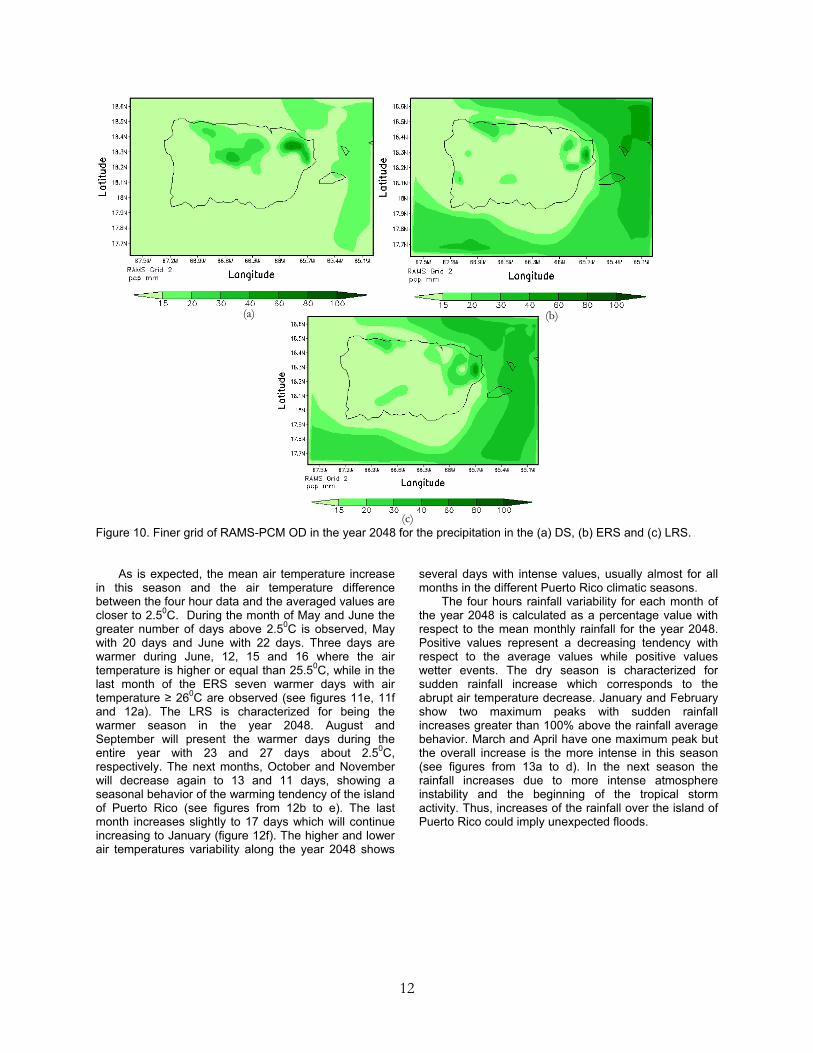
Figure 10. Finer grid of RAMS-PCM OD in the year 2048 for the precipitation in the (a) DS, (b) ERS and (c) LRS.
As is expected, the mean air temperature increase in this season and the air temperature difference between the four hour data and the averaged values are closer to 2.50C. During the month of May and June the greater number of days above 2.50C is observed, May with 20 days and June with 22 days. Three days are warmer during June, 12, 15 and 16 where the air temperature is higher or equal than 25.50C, while in the last month of the ERS seven warmer days with air temperature ≥ 260C are observed (see figures 11e, 11f and 12a). The LRS is characterized for being the warmer season in the year 2048. August and September will present the warmer days during the entire year with 23 and 27 days about 2.50C, respectively. The next months, October and November will decrease again to 13 and 11 days, showing a seasonal behavior of the warming tendency of the island of Puerto Rico (see figures from 12b to e). The last month increases slightly to 17 days which will continue increasing to January (figure 12f). The higher and lower air temperatures variability along the year 2048 shows
several days with intense values, usually almost for all months in the different Puerto Rico climatic seasons.
The four hours rainfall variability for each month of the year 2048 is calculated as a percentage value with respect to the mean monthly rainfall for the year 2048. Positive values represent a decreasing tendency with respect to the average values while positive values wetter events. The dry season is characterized for sudden rainfall increase which corresponds to the abrupt air temperature decrease. January and February show two maximum peaks with sudden rainfall increases greater than 100% above the rainfall average behavior. March and April have one maximum peak but the overall increase is the more intense in this season (see figures from 13a to d). In the next season the rainfall increases due to more intense atmosphere instability and the beginning of the tropical storm activity. Thus, increases of the rainfall over the island of Puerto Rico could imply unexpected floods.
(a) (b)
(c)
12
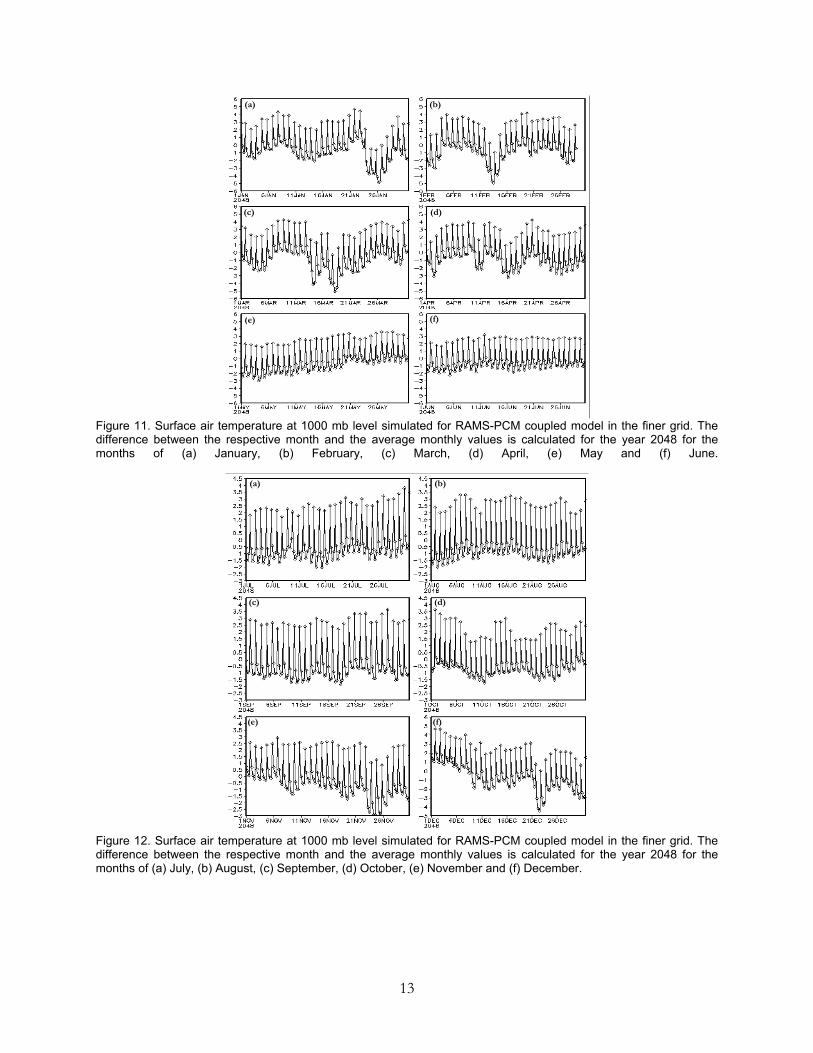
Figure 11. Surface air temperature at 1000 mb level simulated for RAMS-PCM coupled model in the finer grid. The difference between the respective month and the average monthly values is calculated for the year 2048 for the months of (a) January, (b) February, (c) March, (d) April, (e) May and (f) June.
Figure 12. Surface air temperature at 1000 mb level simulated for RAMS-PCM coupled model in the finer grid. The difference between the respective month and the average monthly values is calculated for the year 2048 for the months of (a) July, (b) August, (c) September, (d) October, (e) November and (f) December.
(a) (b)
(c) (d)
(f)(e)
(a) (b)
(c) (d)
(e) (f)
13
The three months of this season show two sudden
rainfall increases above 250%. May in the days 8 and 25, June during the second and fifth, and from June 26 to 28, while July between the days 6 and 11 and around July 25 (figures 13e, 13f and 14a). During the LRS the Puerto Rico rainfall develops around the average rainfall values. August has one peak in the day 27, while October and November have two maximum peaks. These months are controlled by rainfall below the average values (figures 14b to e). The last month have the greater number of intense rainfall events, 9, with values 150% more intense than the average monthly values (see figure 14f). In conclusion, the ERS show a more intense rainfall production along with very intense and suddenly rainfall increase, which could imply unexpected floods.
8. SUMMARY AND CONCLUSIONS
This work presents a future BAU IPCC scenario climatological study for the Caribbean basing using a dynamic downscaling of a GCM (PCM) and a regional atmospheric model (RAMS). The observed Caribbean climatological behavior was analyzed using NCEP reanalysis indicating that is driven principally by the SSTs and the VWS during the entire year. The moisture advection has no relevance influence basically because of the high water vapor content in the Caribbean atmosphere.
The Caribbean rainfall, SSTs, VWS and other parameters simulated by PCM follow the observed climatological monthly variability. Specific deviations are observed in the month of March when the VWS weakens and the dry advection shows one maximum peak. The interaction between the SSTs and the cloud cover generated by the GHGE causes a surface solar radiation decrease in the Caribbean. At the end of the 21st century the insolation decreases, approximately 2 W/m2 less than the first 15-years climatological period. In addition the SLP will increase in the future as response to the radiative forcing of the CO2 increase in the atmosphere. The maximum SL will be present in the fifth climatology with 0.35 cm above the SL in the first climatology. The rainfall 15-years variability simulated by PCM is affected by the synoptic scales SOI and NAO. The appreciable decrease of the precipitation during the 15-years climatology number five is caused by the superposition of the dryness effect of the positive SOI along with the positive NAO. Both positive synoptic
indexes will be present during the wintertime and the progressive cooling that they generate causes a drier ERS. On the other hand, the coupled model RAMS-PCM was run around the year 2048 to perform a dynamical downscaling. At synoptic scales, RAMS-PCM simulates a surface air temperature lower than the air temperature at 1000 mb of level. This generates a more stable atmosphere in the year 2048 and a less intense thermal convection. The Caribbean rainfall shows a drier region over the sea area while along the Caribbean boundaries it enhances. At synoptic scales the VWS and the dry/moisture advection drive the spatial rainfall variability in the future. The finer grid covers the island of Puerto Rico. Four areas with the greater surface air temperature are located, the first one in the western region (Mayagüez, San Sebastian), the second over the southwestern (San German), the third in the south of Puerto Rico (Santa Isabel) and the last one is located over the southeastern region (Humacao, Caguas). The dry/moisture advection along with the VWS drives the rainfall production on the island of Puerto Rico.
The wintertime is the season with more intense air temperature increases. Several days with suddenly air temperature decreases correspond to sudden rainfall increases. In the ERS the periodic variation of the air temperature continues to increase. May and June have the greater number of days above 2.50C and at the same time sudden rainfall increases are present which could imply floods events. The last season, LRS, has a decrease in the warmer events and Puerto Rico rainfall below the average rainfall.
ACKNOWLEDGMENTS
This research was conducted with the support of the NASA-EPSCoR program of the University of Puerto Rico. The atmospheric model simulations were performed at the High Performance Computing Facilities in Rio Piedras. Authors acknowledge the Oak Ridge National Laboratory, Computer Science and Mathematics Division for the assistance and invaluable support provided by the appropriate PCM outputs.
14
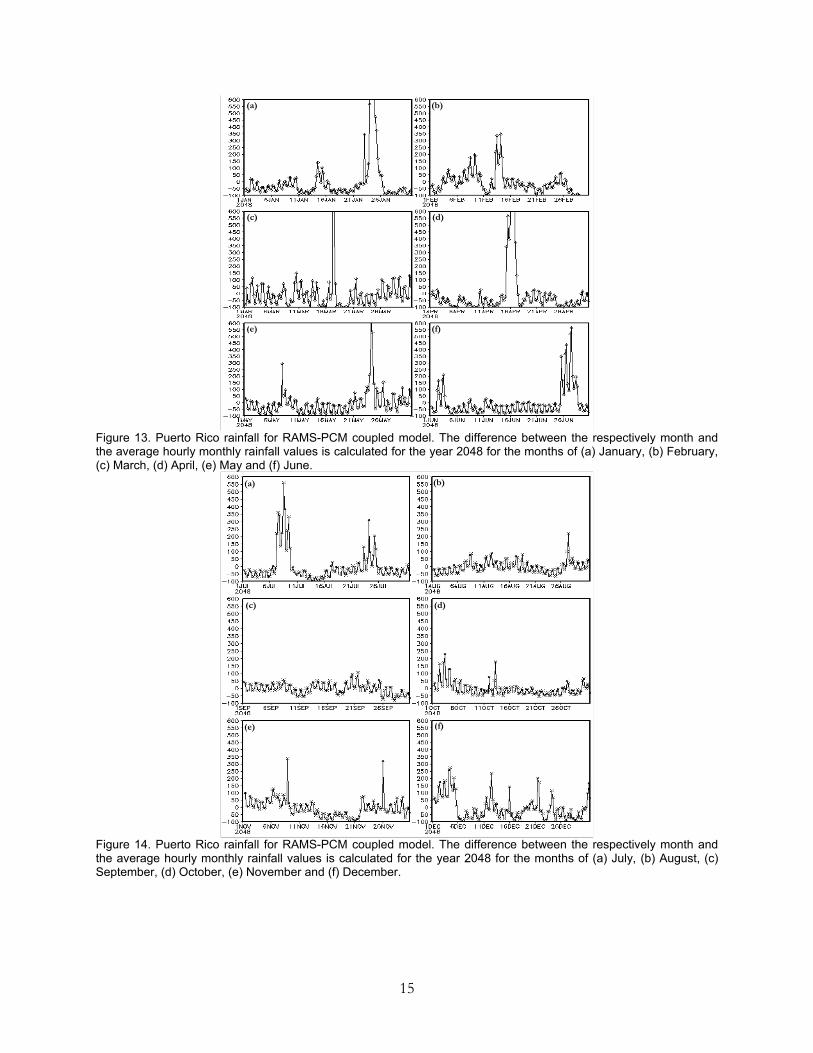
Figure 13. Puerto Rico rainfall for RAMS-PCM coupled model. The difference between the respectively month and the average hourly monthly rainfall values is calculated for the year 2048 for the months of (a) January, (b) February, (c) March, (d) April, (e) May and (f) June.
Figure 14. Puerto Rico rainfall for RAMS-PCM coupled model. The difference between the respectively month and the average hourly monthly rainfall values is calculated for the year 2048 for the months of (a) July, (b) August, (c) September, (d) October, (e) November and (f) December.
(a) (b)
(c) (d)
(e) (f)
(b)(a)
(c) (d)
(f)(e)
15
REFERENCES
Arkin PA. (1998). The relationship between the interannual variability in the 200 mb tropical wind field and the Southern Oscillation. Monthly Weather Review, 110, 1393-1401.
ATMET. The Regional Atmospheric System Modeling, Technical Description. http://www.atmet.com/html/docs/rams/rams_techman.pdf. 1: 1- 50.
Barnett T., Malone R., Pennell W., Stammer D., Semtner A. & Washington W. (2003). The Effects of Climate Change on Water Resources in the West. Climate Change, 1, 1-13.
Bell Gerald D. & Halpert Michael S. (1998). Climate Assessment for 1997. Bulletin of the American Meteorological Society. 79(5): 1-50.
Caribbean Environmental Health Institute (CEHI), Impact Consultancy Service Inc., The Organization of America States. (2002). Water and Climate change in the Caribbean. 1: 1-21. Retrieved February 20, 2003 from http:// www.oas.org/cdwc/Documents/ Water&Climate ReportRevsd.pdf.
Chen A. A., McTavish J., Taylor M. & Marx L. (1997). Using sea surface temperature anomalies to predict flood and drought conditions for the Caribbean. COLA Technical report, 49, 24 pp.
Chen A. Anthony & Taylor Michael A. (2002). Investigating the link between early season Caribbean rainfalls and the El Niño+1 year. International Journal of Climatology, 22, 87-106.
Collins William, Rasch Philip, Boville Byron, Hack James, McCaa James, Williamson David, Kiehl Jeffrey & Briegleb Bruce (2004). Description of the NCAR Community Atmosphere Model (CAM 3.0). Climate and Global Dynamics Division, 1, 1 - 214.
Cotton W. R., Pielke R. A., Walko R. L., Liston G. E., Tremback C. J., Jiang H., McAnelly R. L., Harrington J. Y., Nicholls M. E., Carrio G.G., and McFadden J. P. (2003). RAMS: Current status and future directions. Meteorology and Atmospheric Physics. 82: 5-29.
Dai A., Washington W. M., Meehl G. A., Bettge T. W. & Strand W. G. (2004). The ACPI Climate Change Simulations. Climate Change for the ACPI Special Issue, 62: 29-43.
Eastman J. L., Coughenour M. B. and Pielke R. A. (2001). The regional effects of CO2 and landscape change using a coupled plant and
meteorological model. Global change Biology. 7: 797-815.
Enfield David B. & Alfaro Eric J. (1999). The dependence of Caribbean Rainfall on the Interaction of the Tropical Atlantic and Pacific Oceans. American Meteorological Society, 12, 2093-2097.
Gerald D., Halpert Michael S., Ropelewski Chester F., Kousky Vernon E., Douglas Arthur V., Schnell Russell C., and Gelman Melvyn E. (1999). Climate Assessment for 1998. Bulletin of the American Meteorological Society. 80(5): 1-48.
Gianini A. Kushnir Y. & Cane MA. (2000). Interannual variability of Caribbean rainfall, ENSO and the Atlantic Ocean. Journal of Climate, 13, 297-311.
Giannini Alessandra, Cane Mark A. & Kushnir Yochanan. (2001). Interdecadal changes in the ENSO teleconnection to the Caribbean region and the North Atlantic Oscillation. Journal of Climate, 1, 1-32.
Intergovernmental Panel on Climate Change. (2000). Emissions Scenario - Report of Working Group III of the IPCC. 1: 1-20. Retrieved January 15, 2003 from http://www.grida.no/climate/ipcc/spmpdf/sres-e.pdf.
Intergovernmental Panel on Climate Change. ( 2001). Third Assessment Report of working Group I of the IPCC – Climate Change 2001, Summary for Policy Makers. 1(1): 1-16. Retrieved January 15, 2003 from http://www.grida.no/climate/ipcc_tar/vol4/spanish/pdf/ sum.pdf.
Kao C.Y.J. and Bossert J.E. (1992). Regional climate simulations: A GCM/Mesoscale model interface. Trends in Atmospheric Science. 1: 309-323.
Kingtse Mo, Bell Gerald D. & Thiaw Wassila M. (2001). Impact of the sea surface temperature anomalies on the Atlantic tropical storm activity and West African rainfall. American Meteorological Society, 58, 3477-3496.
Knaff J. A. (1999). Implications of summertime sea level pressure anomalies in the tropical Atlantic region. Journal of climate, 10, 789-804.
Leung Ruby L., Qian Yun and Bian Xindi. (2002). Mid-Century Ensemble Regional Change Scenarios For the Western Unites States. U.S. Department of Energy Accelerated Climate Prediction Initiative. 1:1-70.
Liston G. E. and Pielke R.A. (2001). A climate version of the regional atmospheric modeling system.
16
Theoretical and Applied Climatology. 68: 155-173.
Menéndez C. G., Saulo A. C., and Li Z. X. 2001. Simulation of South American wintertime climate with a nesting system. Climate Dynamics. 17: 219-231.
Pielke R. A., Cotton W. R., Walko R. L., Tremback C. J., Lyons W. A., Grasso L. D., Nicholls M. E., Moran M. D., Wesley D. A., Lee T. J., and Copeland J. H. (1992). A Comprehensive Meteorological Modeling System RAMS. Meteorology and Atmospheric Physics. 49: 69-91.
Rummuksinen M., Räisänen J., Bringfelt B., Ullerstig A., Omstedt A., Willén U., Hansson U., and Jones C. (2001). A regional climate model for northern Europe: model description and results from the downscaling of two GCM control simulations. Climate Dynamics. 17: 339-359.
Taylor M. (1999). The effect of warm tropical Atlantic SSTs on early season Caribbean rainfall. Ph.D. thesis, University of Maryland, College Park.
Taylor Michael A., Enfield David B., & Chen A. Anthony (2002). Influence of the tropical Atlantic versus the tropical pacific on Caribbean rainfall. Journal of Geophysical Research, 107 (C9), 1-14.
Terry L. Clark. (1977). A Small-Scale Dynamic Model Using a Terrain-Following Coordinate Transformation. Journal of Computational Physics. (24) 1: 186-215.
Von Salzen K. and McFarlane N. (2002). Parameterization of the Bulks Effects of Lateral and Cloud-top Entrainment in Transient Shallow Cumulus Clouds. American Meteorological Society, 59, 1405-1430.
Walko R. L. and Tremback C. J. Regional Atmospheric Modeling System, Introduction to RAMS 4.3/4.4. http://www.atmet.com/html/docs/ rams/ug44- rams-intro.pdf. 1: 1-11.
Washington W. M., Weatherly J. W., Meehl G. A., Semtner A. J. Jr., Bettge T. W., Craig A. P., Strand W. G. Jr., Arblaster J., Wayland V. B., James R. & Zhang Y. (2000). Parallel climate model (PCM) control and transient simulations. Climate Dynamics, 16, 755-774.
Weatherly John W. & Arblaster Julie M. (2000). Sea Ice and Climate in 20th and 21st Century Simulations with a Global Atmosphere–Ocean–Ice Model. Annals of Glaciology, 33, 1-7.
17