Embed Size (px)
Citation preview
Predictive Analytics Reporting (PAR) Framework:
Overview, Applications, Results
Ellen WagnerChief Research and Strategy Officer
June 18, 2014@edwsonoma

Are You “Scorecard-Ready”?
http://collegecost.ed.gov/
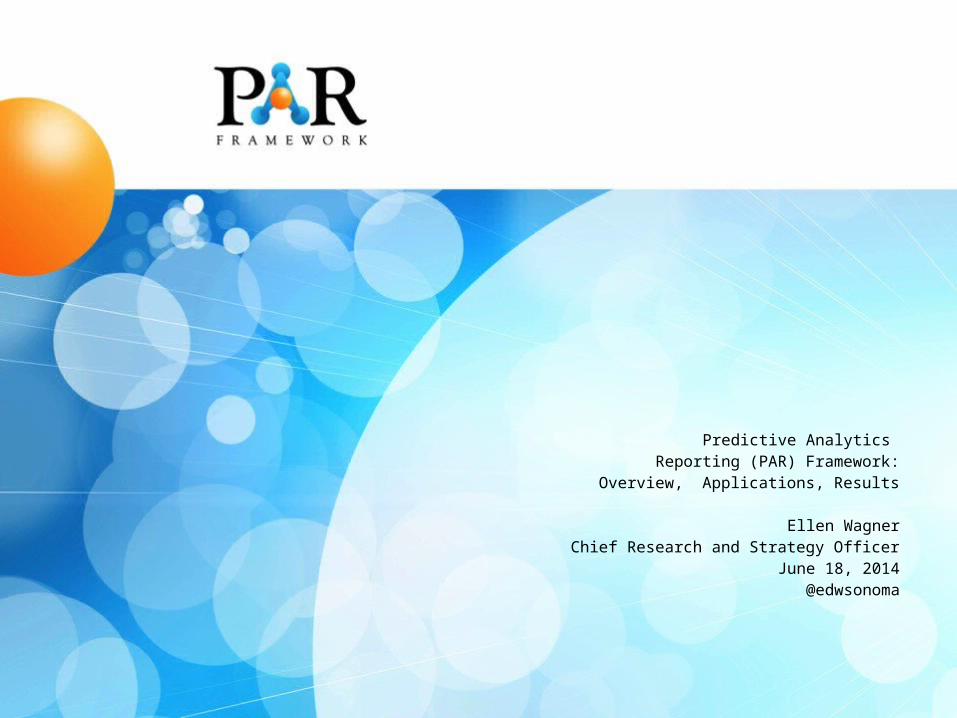
Performance Based Funding andUS Post-Secondary Institutions
http://www.ncsl.org/research/education/performance-funding.aspx
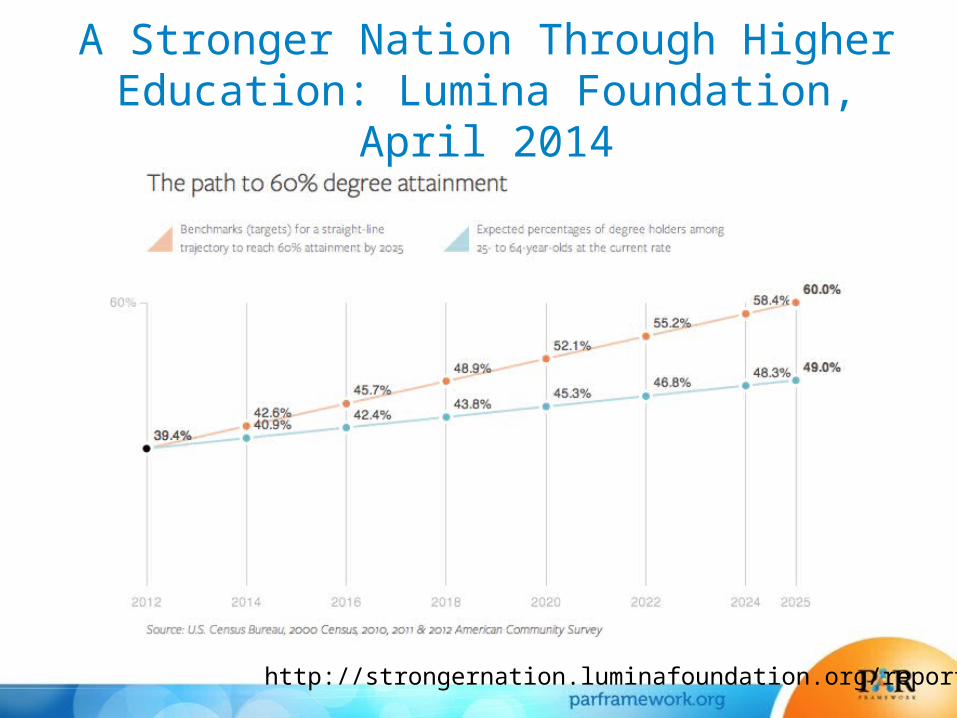
A Stronger Nation Through Higher Education: Lumina Foundation, April
2014
http://strongernation.luminafoundation.org/report/
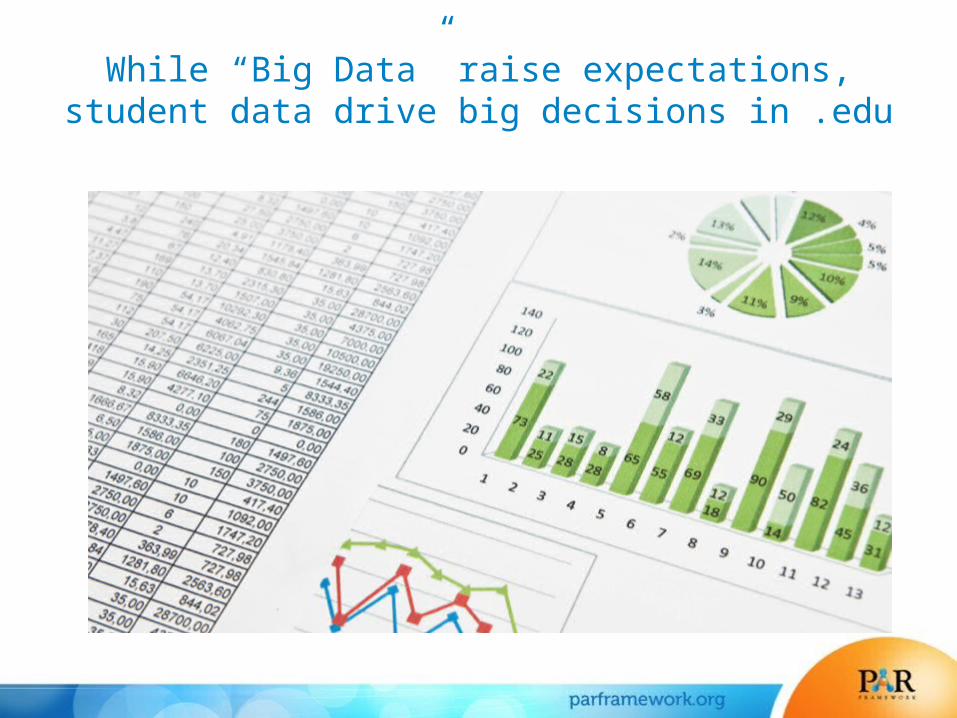
While “Big Data” raise expectations,student data drive big decisions in .edu

How Do Institutions Deal With the “Apples to Zebras” Problem?
Collaborative
National
Multi-institutional Non-profit
Institutional Effectiveness +
Student Success
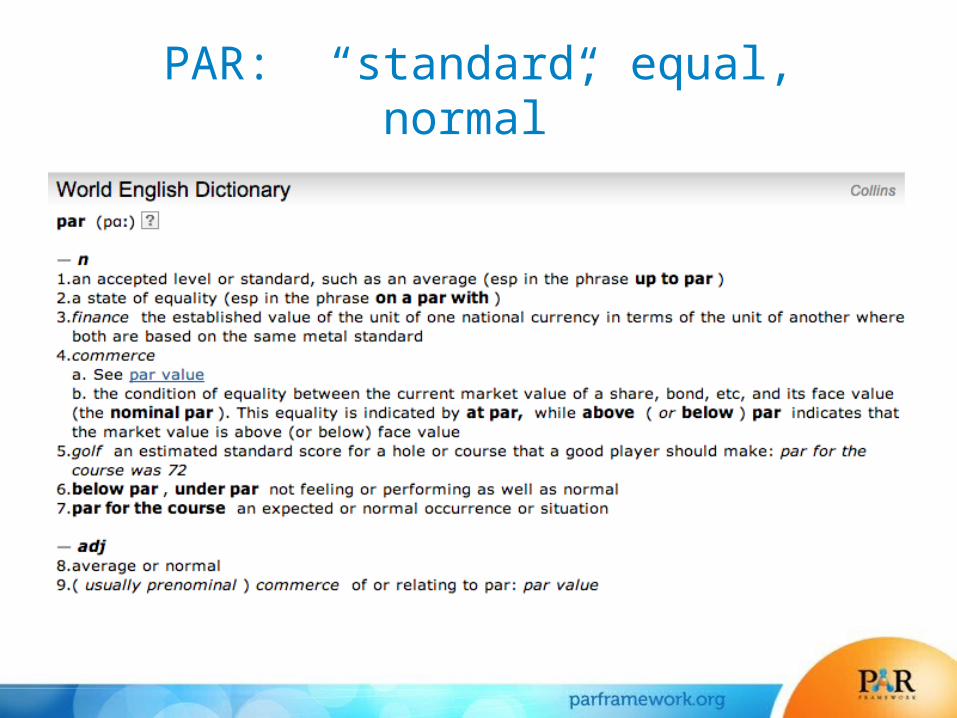
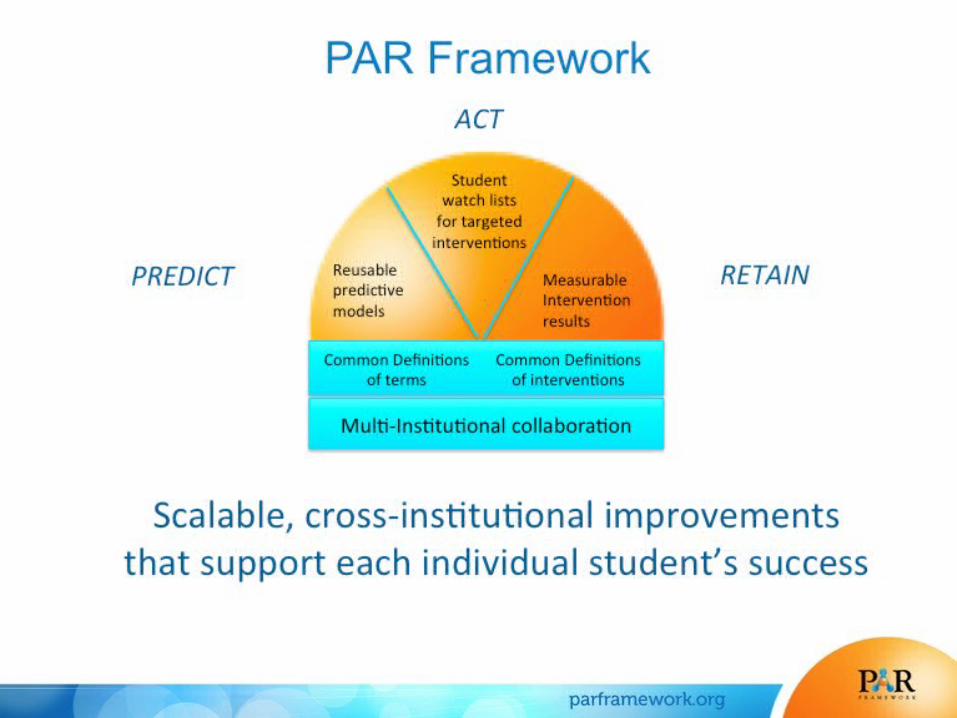
PAR: “standard, equal, normal”

The Predictive Analytics Reporting (PAR) Framework
• PAR is a “massive data” analysis effort using predictive analytics to identify drivers related to loss and momentum and to inform student loss prevention
• PAR member institutions voluntarily contribute de-identified student records to create a single federated database.
• Descriptive, inferential and predictive analyses have been used to create benchmarks, institutional predictive models and to map student success interventions to predictor behaviors
PAR Framework video introduction
https://www.dropbox.com/s/ll6qmo9fru869un/PAR_1080p_storyeyed.mp4
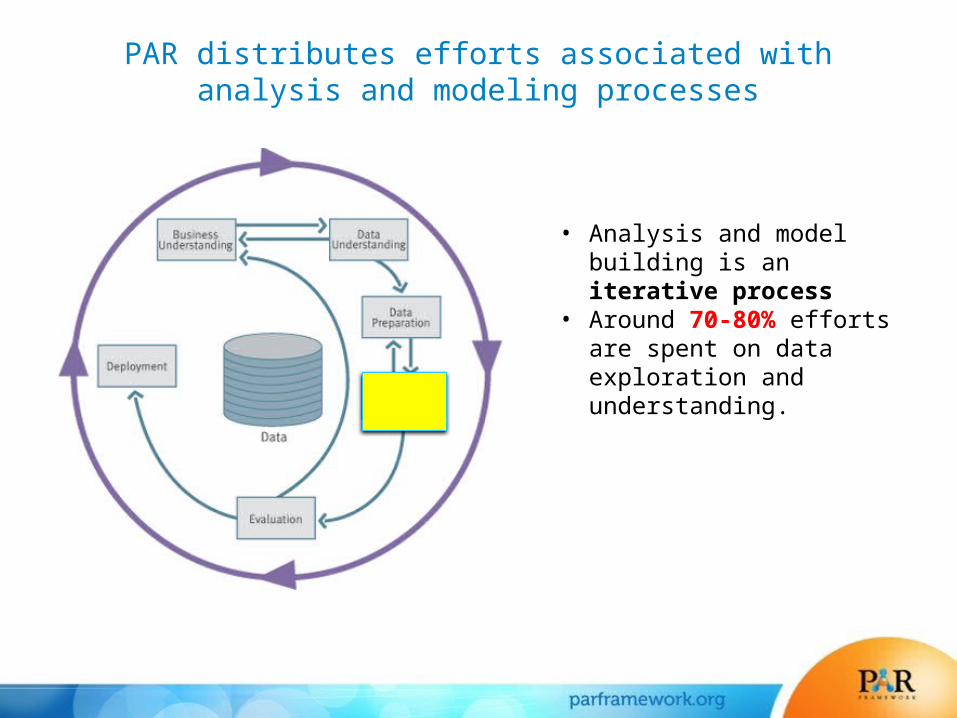
PAR distributes efforts associated with analysis and modeling processes
• Analysis and model building is an iterative process
• Around 70-80% efforts are spent on data exploration and understanding.
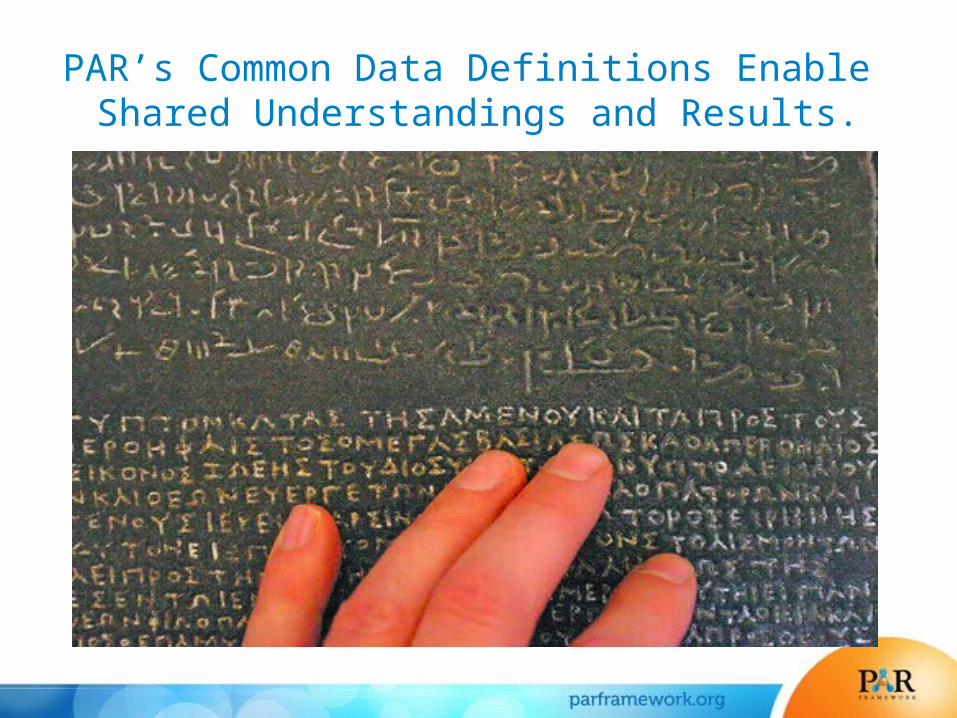
PAR’s Common Data Definitions Enable Shared Understandings and Results.
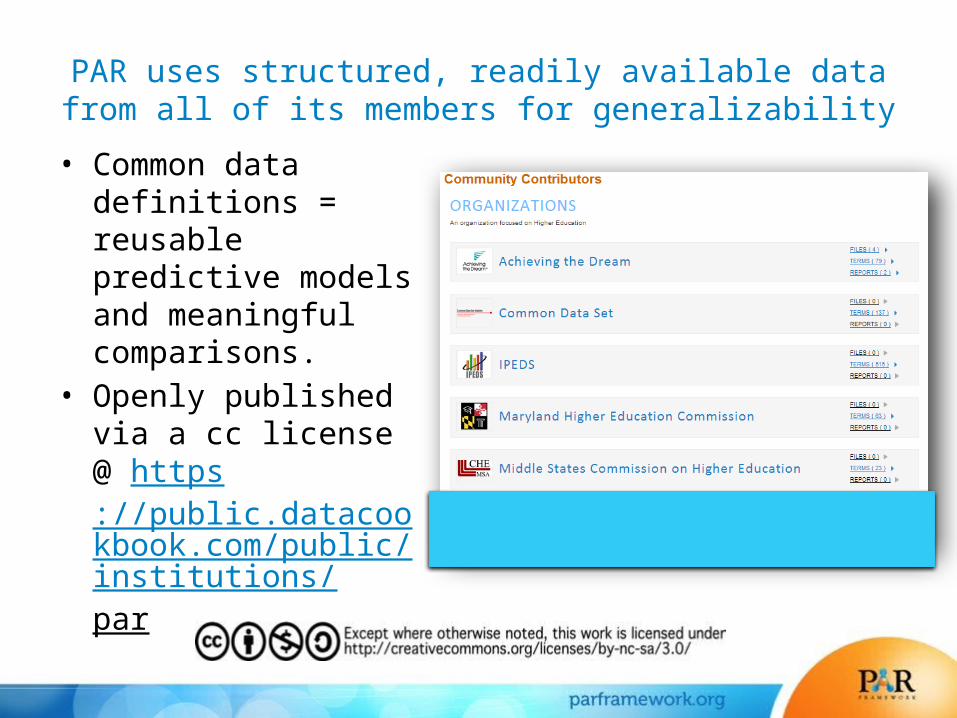
PAR uses structured, readily available data from all of its members for generalizability• Common data
definitions = reusable predictive models and meaningful comparisons.
• Openly published via a cc license @ https://public.datacookbook.com/public/institutions/par

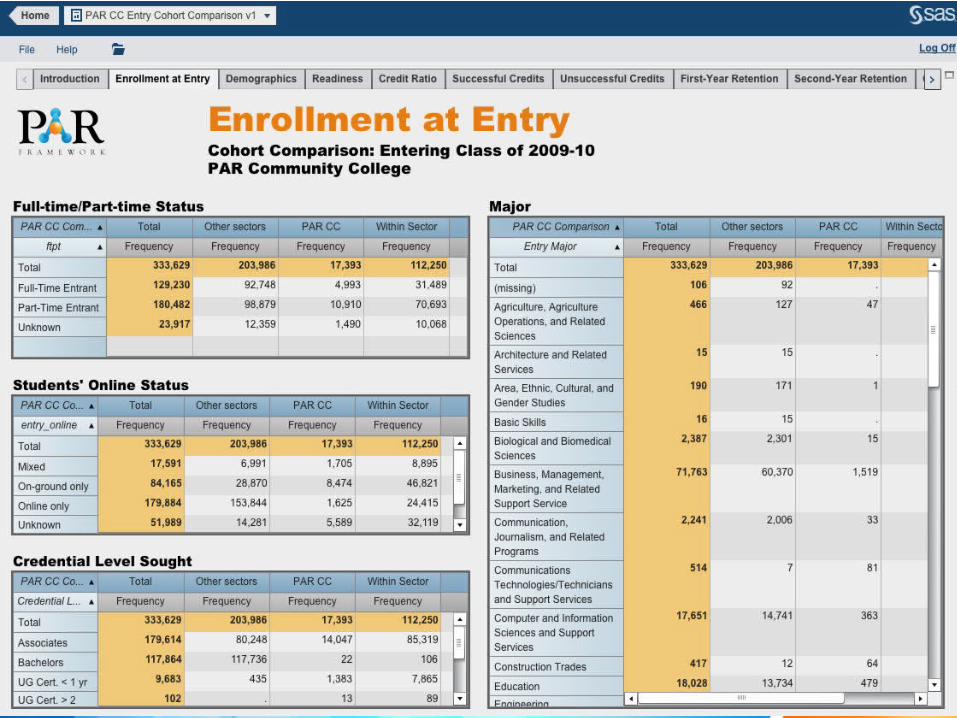
PAR Input data are available for ALL students from ALL US institutions
Student Demographics &
DescriptiveGender
RacePrior Credits
Perm Res Zip CodeHS Information
Transfer GPAStudent Type
Student Course Information
Course LocationSubject
Course NumberSection
Start/End DatesInitial/Final Grade
Delivery ModeInstructor Status
Course Credit
Student Academic Progress
Curent Major/CIPEarned Credential/CIP
Student Financial
InformationFAFSA on File – Date
Pell Received/Awarded – Date
Course CatalogSubject
Course NumberSubject LongCourse Title
Course DescriptionCredit Range
** Future
Lookup TablesCredential Types Offered
Course Enrollment PeriodsStudent Types
Instructor StatusDelivery Modes
Grade CodesInstitution Characteristics
Possible Additional **Placement TestsNSC InformationSES Information
Satisfaction SurveysCollege Readiness Surveys
Intervention Measures
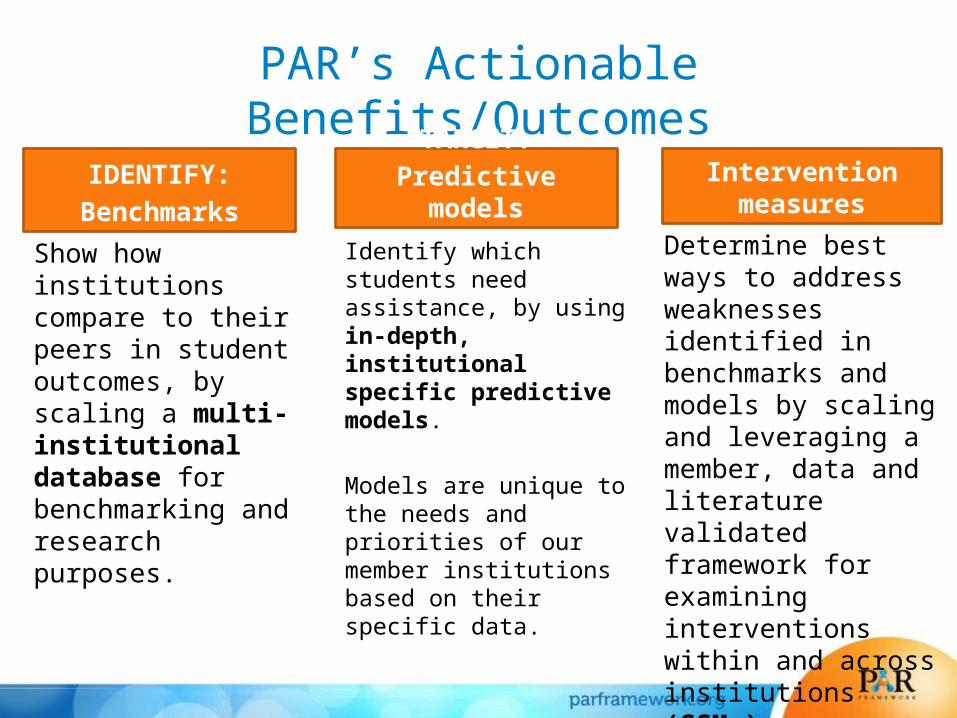
PAR’s Actionable Benefits/Outcomes
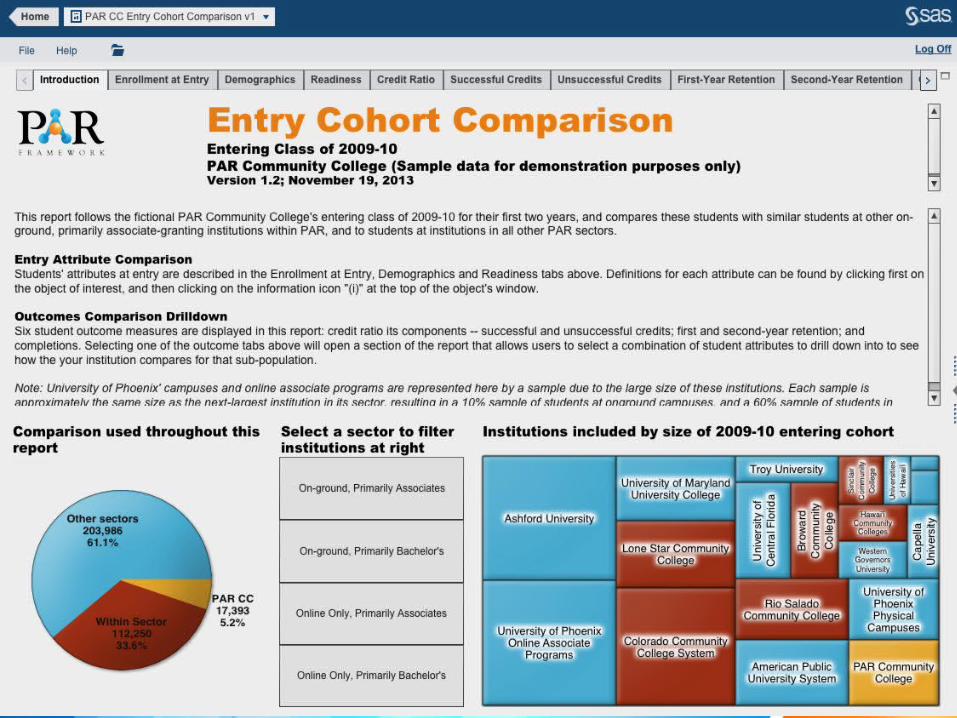
IDENTIFY: Benchmarks
Show how institutions compare to their peers in student outcomes, by scaling a multi-institutional database for benchmarking and research purposes.
TARGET:Predictive models
Identify which students need assistance, by using in-depth, institutional specific predictive models. Models are unique to the needs and priorities of our member institutions based on their specific data.
Determine best ways to address weaknesses identified in benchmarks and models by scaling and leveraging a member, data and literature validated framework for examining interventions within and across institutions (SSMx).
TREAT:Intervention measures
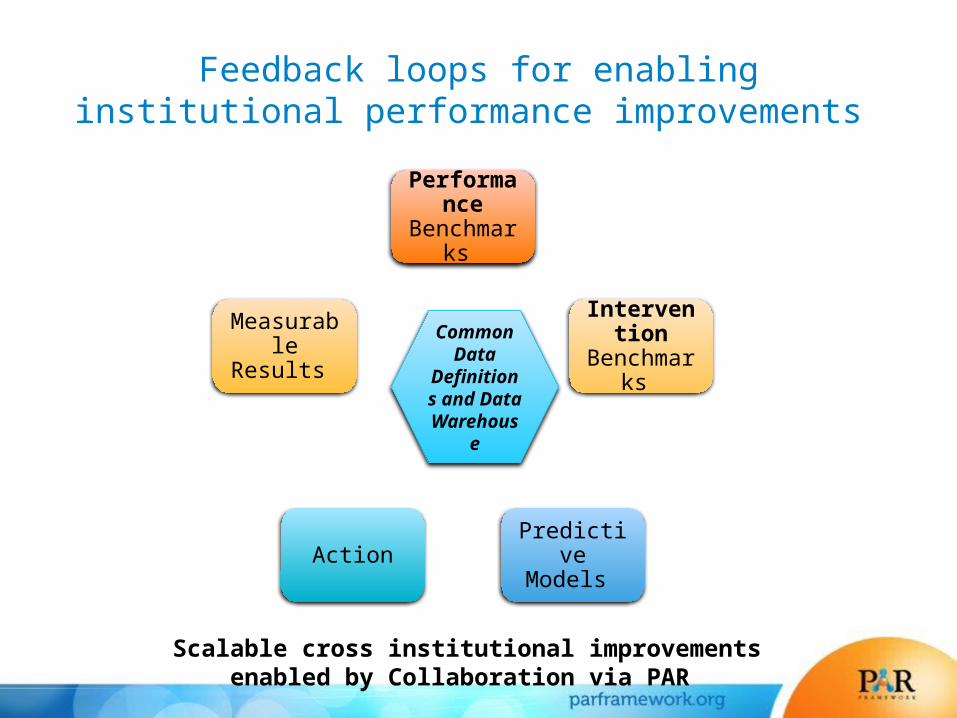
Feedback loops for enabling institutional performance improvements
Performance Benchmarks
Intervention Benchmarks
Predictive Models Action
Measurable Results
Common Data
Definitions and Data
Warehouse
Scalable cross institutional improvements enabled by Collaboration via PAR
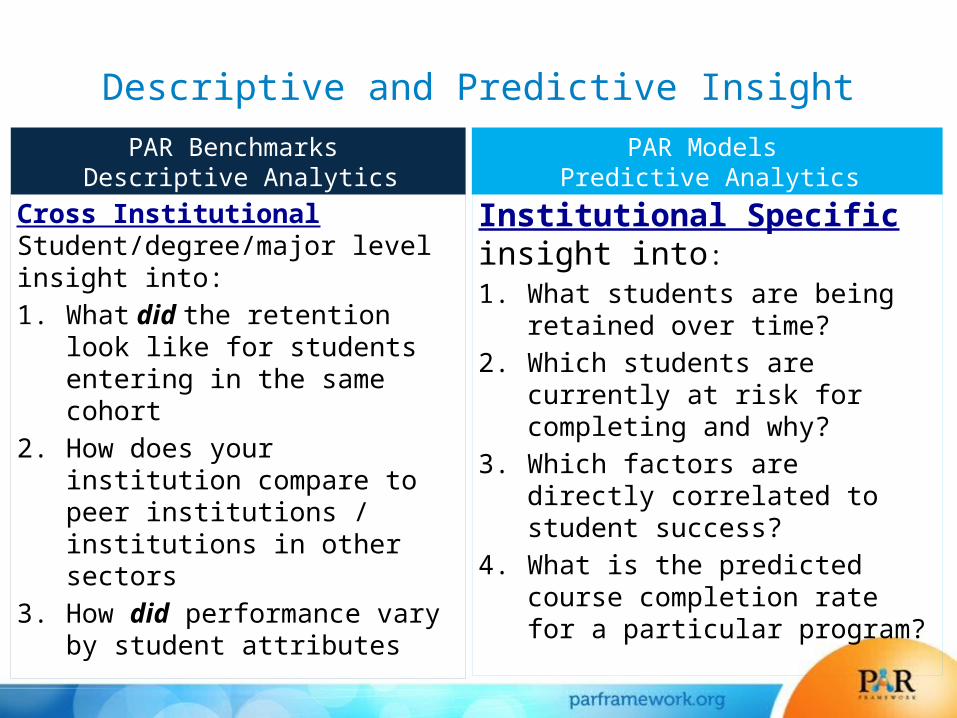
Descriptive and Predictive Insight
Cross Institutional Student/degree/major level insight into: 1. What did the retention look like for
students entering in the same cohort
2. How does your institution compare to peer institutions / institutions in other sectors
3. How did performance vary by student attributes
Institutional Specific insight into: 1. What students are being retained
over time? 2. Which students are currently at risk
for completing and why?3. Which factors are directly correlated
to student success?4. What is the predicted course
completion rate for a particular program?
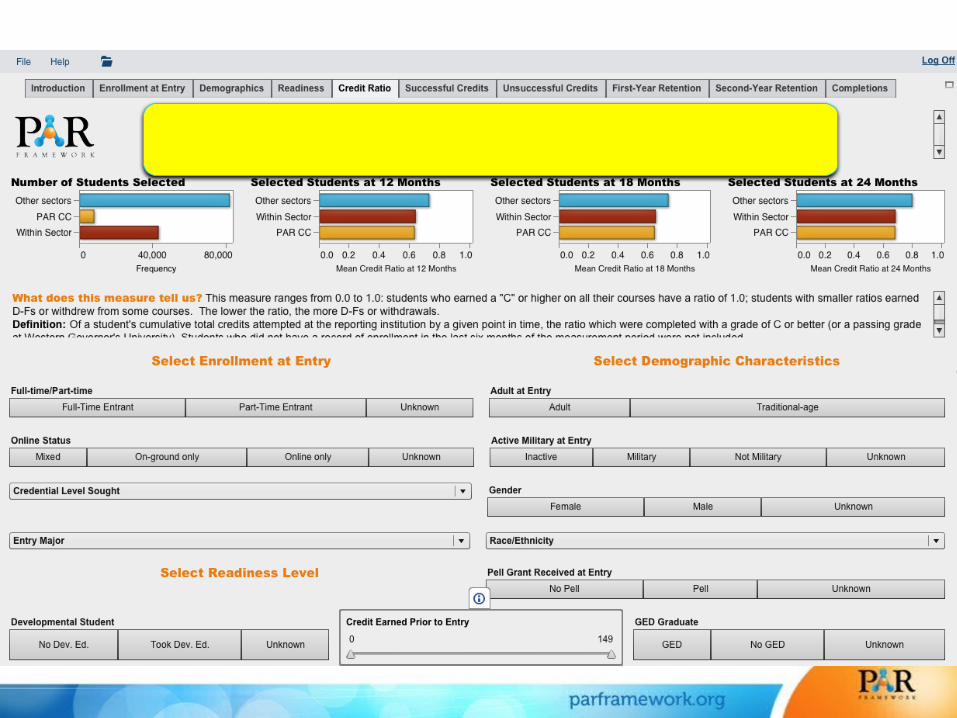
PAR Benchmarks Descriptive Analytics
PAR Models Predictive Analytics
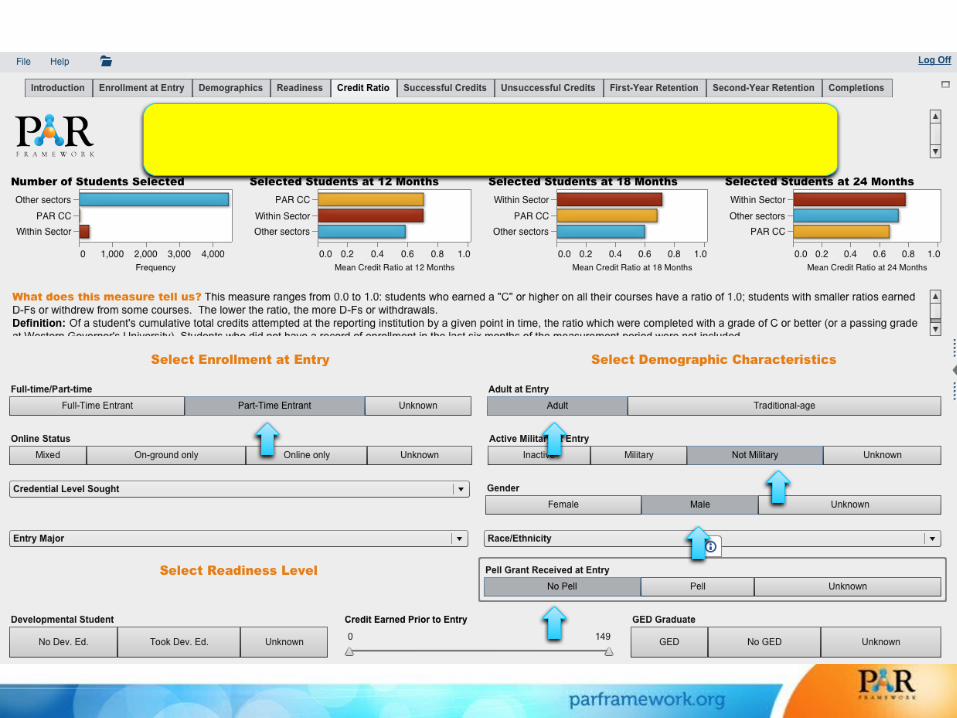
Collaborative Benchmarking
Student-level data +
common data definitions =
deeply drillable comparative reports
Partners determine measures and content

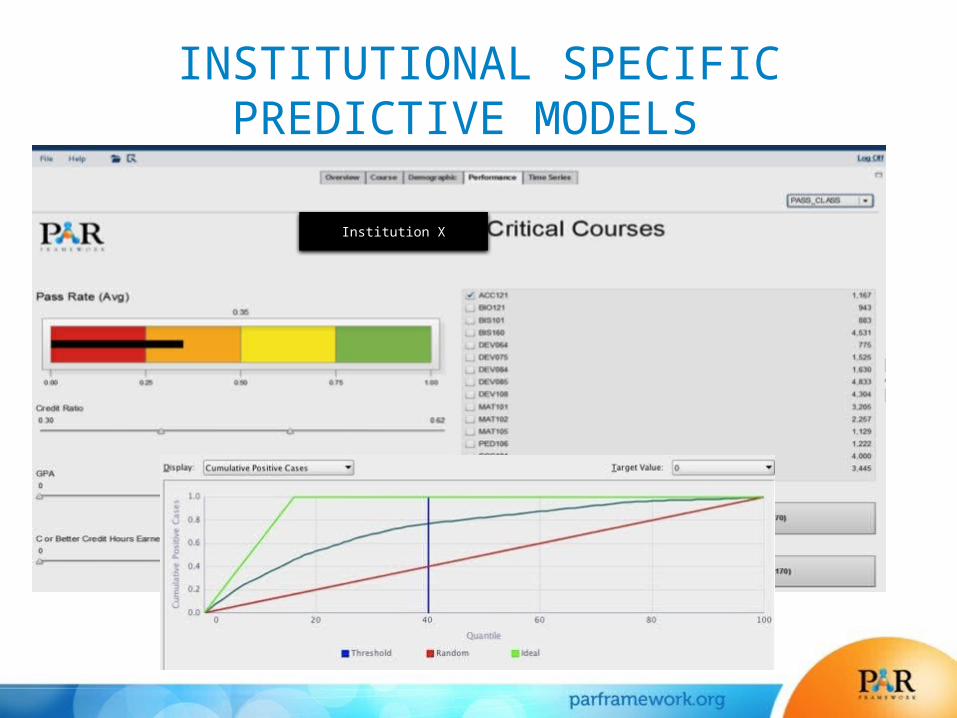
INSTITUTIONAL SPECIFIC PREDICTIVE MODELS
Institution X
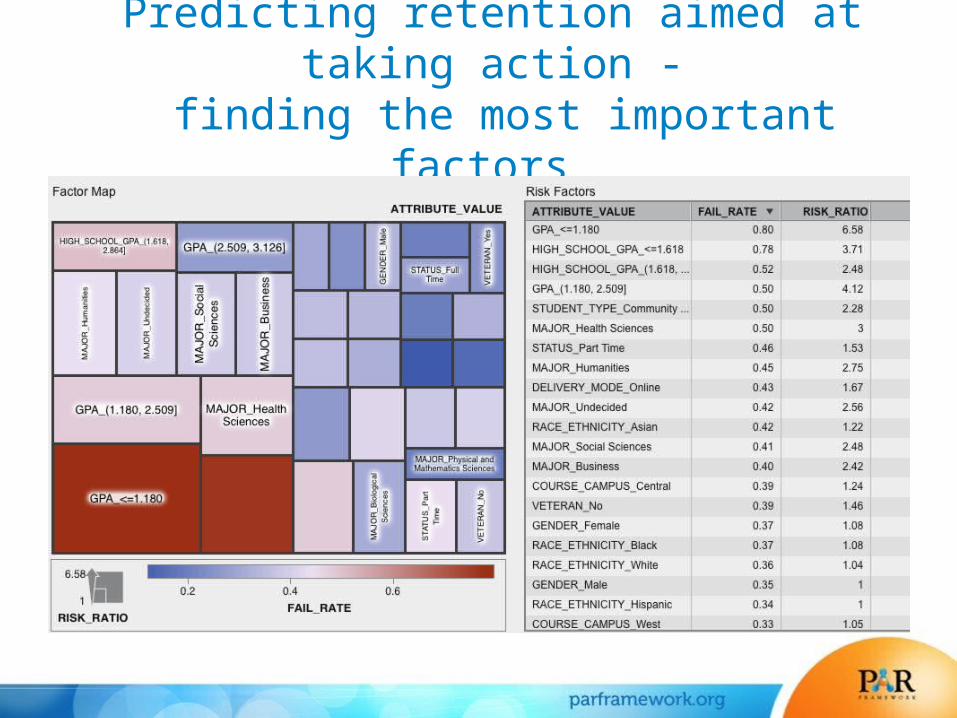
Predicting retention aimed at taking action -
finding the most important factors
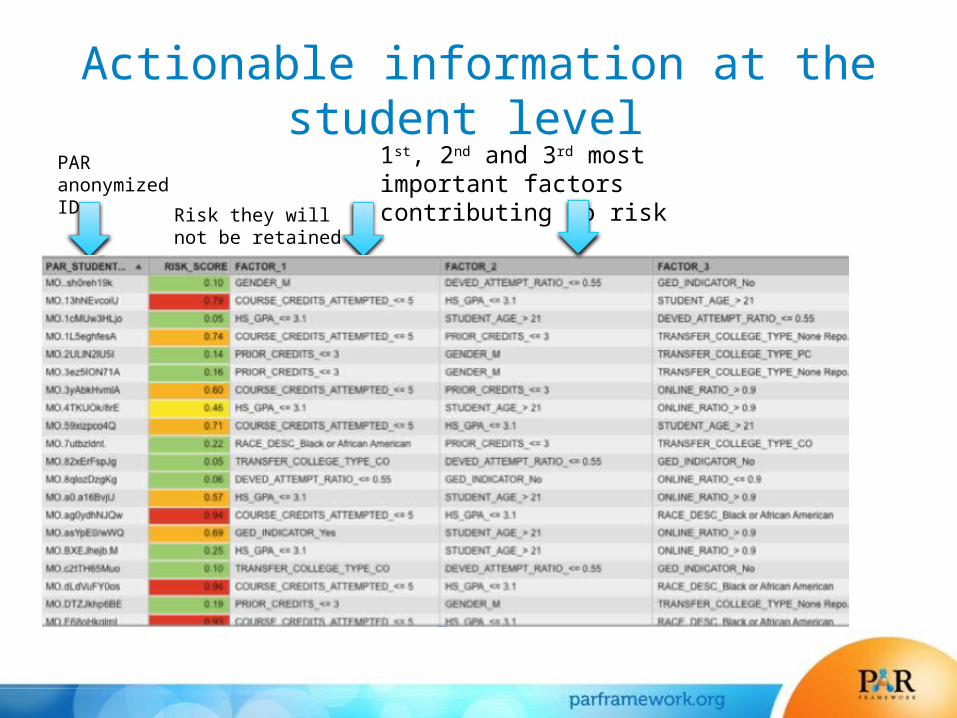
Actionable information at the student level
PAR anonymized ID
1st, 2nd and 3rd most important factors contributing to risk
Risk they will not be retained
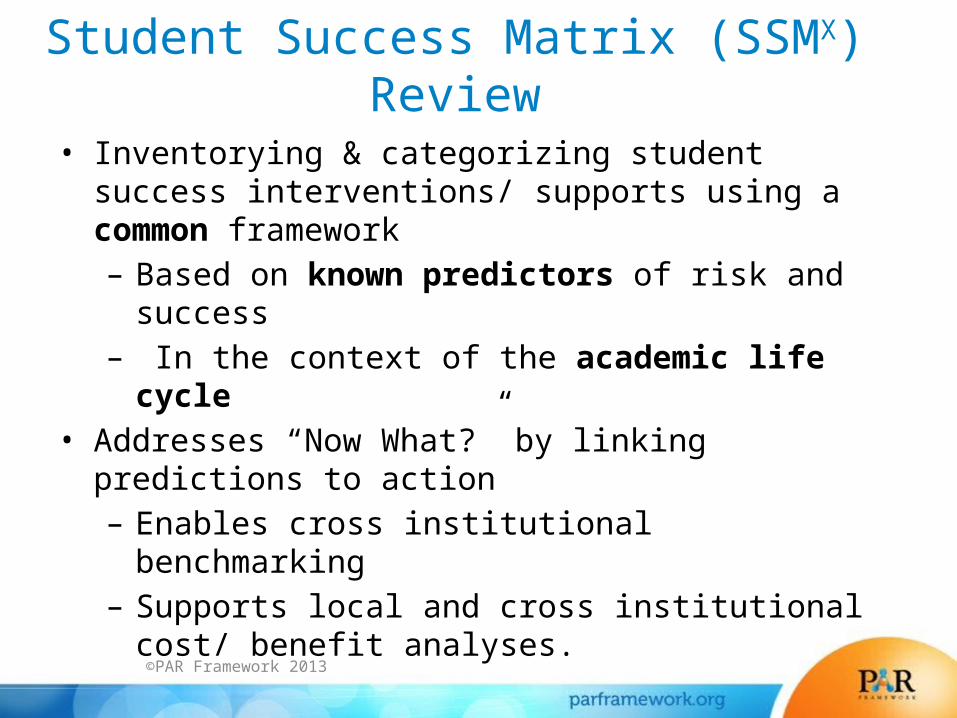
Student Success Matrix (SSMX) Review
• Inventorying & categorizing student success interventions/ supports using a common framework– Based on known predictors of risk and success– In the context of the academic life cycle
• Addresses “Now What?” by linking predictions to action– Enables cross institutional benchmarking – Supports local and cross institutional cost/ benefit
analyses.
©PAR Framework 2013
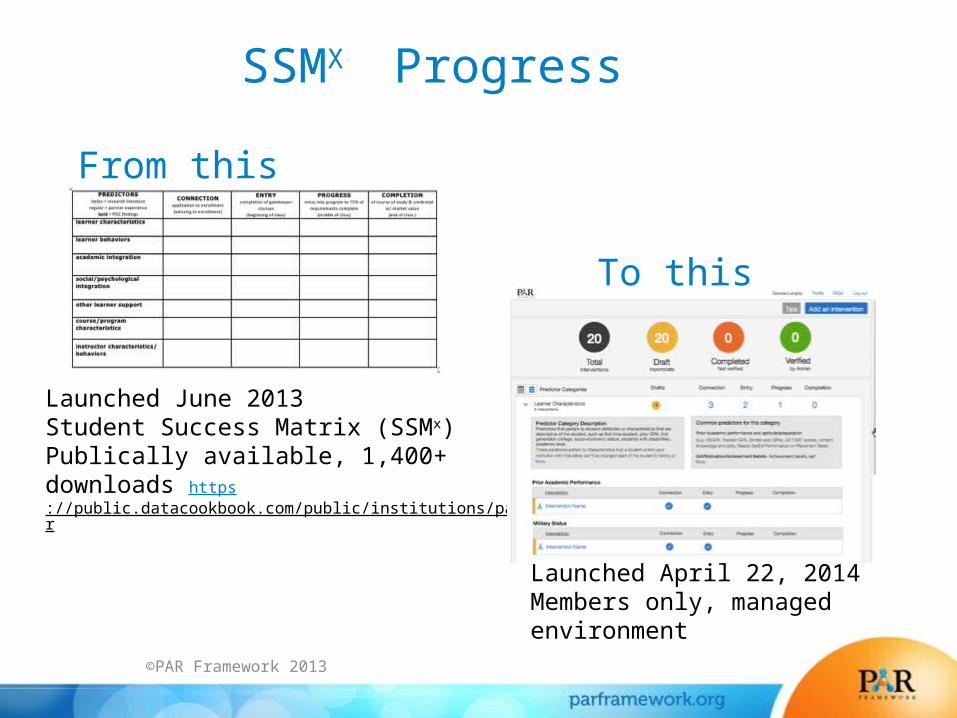
From this
©PAR Framework 2013
Launched June 2013 Student Success Matrix (SSMx) Publically available, 1,400+ downloads https://public.datacookbook.com/public/institutions/par
Launched April 22, 2014Members only, managed environment
To this
SSMX Progress

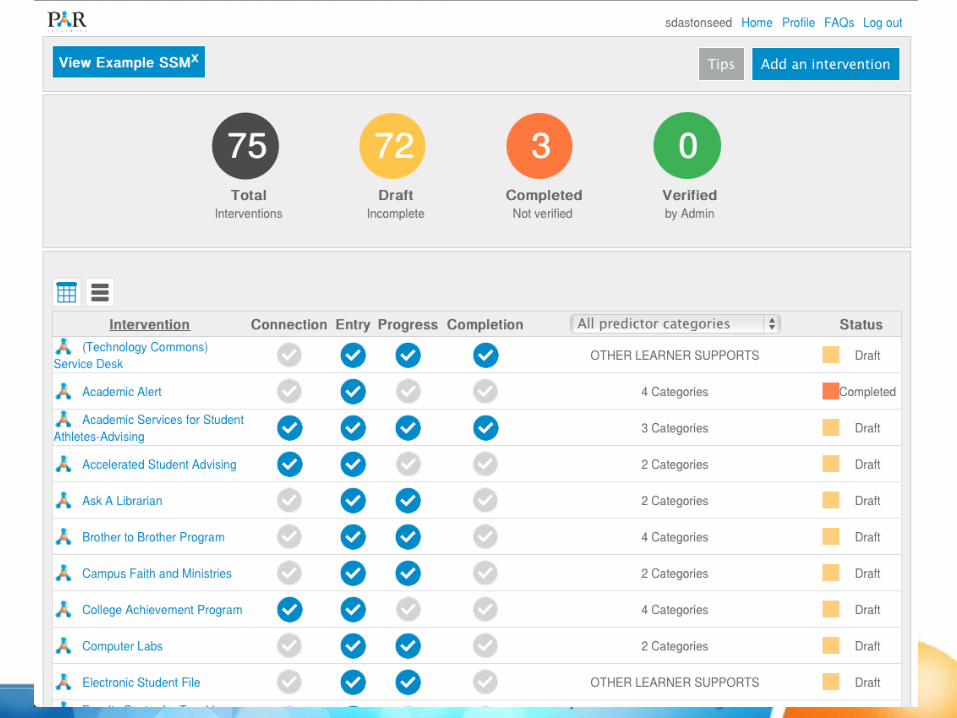
Comprehensive view – completed SSMx
©PAR Framework 2013
©PAR Framework 2013
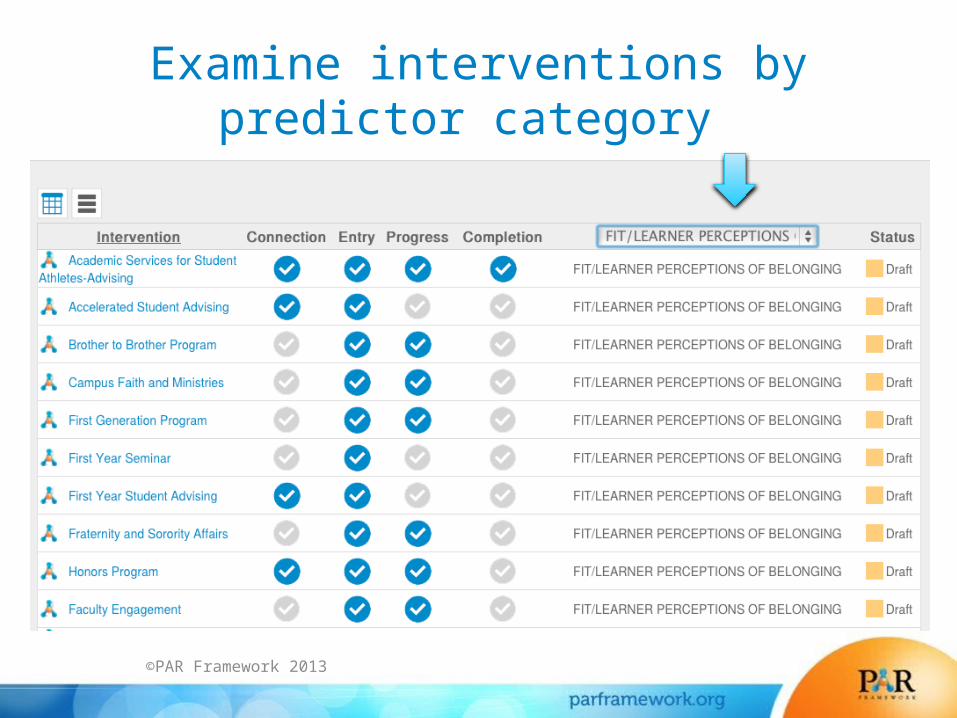
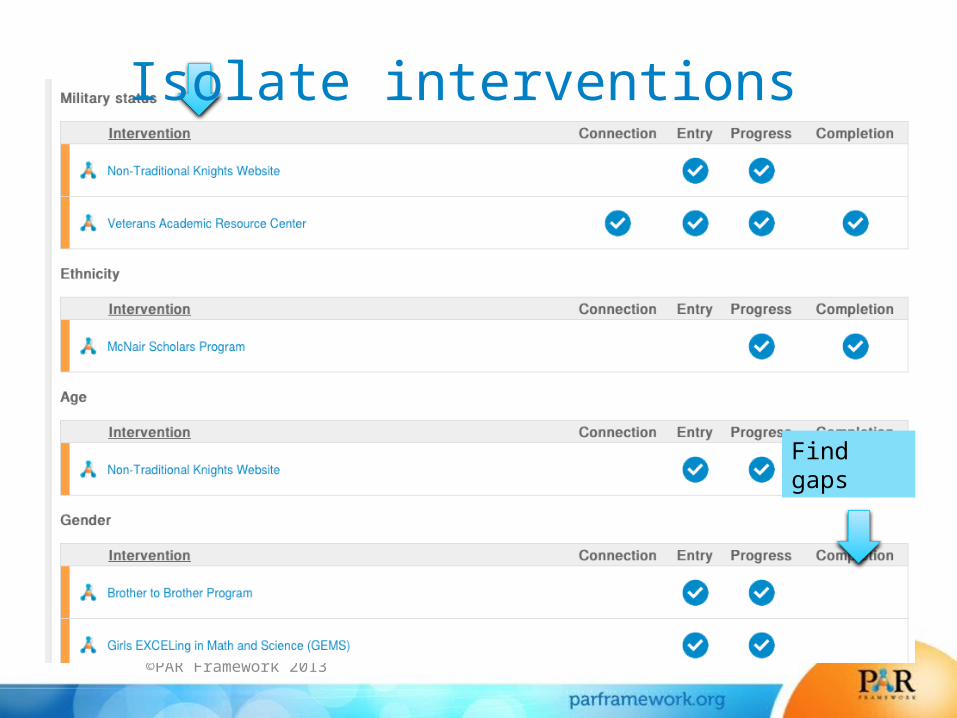
Examine interventions by predictor category
©PAR Framework 2013

©PAR Framework 2013
©PAR Framework 2013
Isolate interventions
Find gaps
Applying Interventions at the Greatest point of Need/Value
• A fundamental objective for developing common language and frameworks for reviewing student interventions is so that the most effective interventions can be applied at the points of greatest need to effectively remediate risk at the student level.
• PAR has paved the way for creating common understanding of student risk and common tools for diagnosing risk, but the road to developing consistent and applied measurement to student impact of intervention will take time and vigilance.
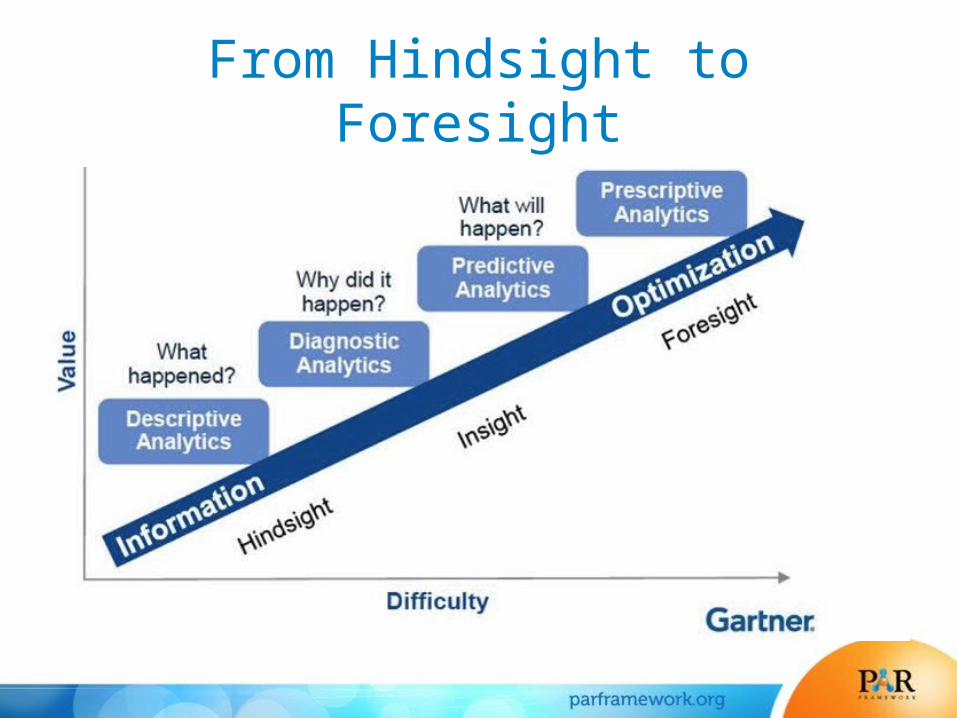
From Hindsight to Foresight
PAR Futures
• PAR, Inc., a 501.c.3 non-profit educational organization launching Dec 9, 2014 as an Analytics-As-A-Service (AAAS) provider.
• PAR will focus on benchmarks, predictive models, the student success intervention mapping and measurement, “Rosetta Stone” cross-walks to other data projects and platform providers.
• New reports that emphasize pathways to achieving outcomes (e.g. Adult learners, PLAs, CBE).
• New reports that consider “big issues” impact on learning outcomes, e.g., online-blended-onground programs; for-profit-public-private institutions.
• Support/resources/services for community of research and practice.