Embed Size (px)
Citation preview
PREDICTORS OF FEAR OF DEATHAND SELF-MORTALITY: AN ATLANTIC
CANADIAN PERSPECTIVE
TRINDA L. POWER, MSC
Addiction Services, Colchester East Hants Health Authority, Truro,Nova Scotia, Canada
STEVEN M. SMITH, PHD
Department of Psychology, Saint Mary’s University, Halifax,Nova Scotia, Canada
This research was undertaken to explore gender, religiosity, perceived time-left-to-live and the interactions between these variables as predictors of fear of death in144 Atlantic Canadian students using the Multidimensional Fear of Death Scale(MFODS). Predictions about cause, age, marital status, and place of deathwere also derived from the Do-It-Yourself-Death-Certificate and compared withactuarial data to determine accuracy. Results showed significant gender effects on2 MFODS subscales, such that women demonstrated greater fear for significantothers and fear of the dead. More religious participants expressed greater fear ofthe dead, fear of being destroyed, and fear of conscious death, whereas parti-cipants with lower religious conviction were more fearful of the unknown. Inaddition, significant interactions between the predictors on various subscales ofthe MFODS were observed. Finally, both men and women made inaccuratedeath-related predictions when compared to actuarial data but predicted differ-ential causes of death.
Although an understanding of the processes of aging and death hasbecome broader (Kastenbaum, 2000) and the ability to ameliorate
Received 16 December 2006; accepted 9 May 2007.Preparation of this article was supported by a Social Sciences and Humanities
Research Council of Canada (SSHRC) Standard Research Grant and a Nova Scotia HealthResearch Foundation Grant to Steven M. Smith. This research formed part of Trinda L.Power’s Master’s thesis. We thank Veronica Stinson and Maryanne Fisher for their helpfulfeedback on the thesis.
Address correspondence to Trinda L. Power, Addiction Services, Colchester East HantsHealth Authority, Victoria Court Suite 205, 14 Court Street, Truro, Nova Scotia, CanadaB2N 3H7 or Steven M. Smith, Department of Psychology, Saint Mary’s University, Halifax,Nova Scotia, Canada B3H 3C3. E-mail: [email protected] or [email protected]
253
Death Studies, 32: 253–272, 2008Copyright # Taylor & Francis Group, LLCISSN: 0748-1187 print/1091-7683 onlineDOI: 10.1080/07481180701880935
the painful effects of dying has grown considerably, Canadiansseem no less concerned about mortality. Becker (1973; see alsoHarmon-Jones et al., 1997) asserts that all human beings experi-ence fear and anxiety at the knowledge that their death is inevi-table. Yet despite universality in death concern and anincreasing amount of psychological literature focusing on death-related attitudes (Neimeyer, Wittkowski, & Moser, 2004), relativelyfew studies have examined death-related attitudes in Canadaor Atlantic Canada (e.g., Littlefield & Fleming, 1984; Lonetto,Fleming, Gorman, & Best, 1975; Robinson & Wood, 1984).
Since the beginnings of psychological explorations onattitudes toward death, researchers have sought to determine whatfactors are most salient. Acknowledgement of concern about deathis now widely recognized in the psychological literature (e.g.,Cicirelli, 1999; Feifel & Nagy, 1981; Kastenbaum & Aisenberg,1972; Kastenbaum & Costa, 1977). Indeed, the last 30 years haveseen a sharp increase in research on death, with over 1,000 death-related articles having been published by the mid-1990s (Neimeyer& Van Brunt, 1995). But what is it about death that makes peoplereact with fear? Early psychological research traditionally vieweddeath as a unitary concept, although more recently it has beenregarded as multidimensional (e.g., Lester, 1994; Neimeyer &Moore, 1994). For instance, Kastenbaum and Aisenberg (1972)identified six specific death-related fears from a self=other orien-tation that include a fear of dying, a fear about what might happenfollowing death, and a fear of extinction.
Gender Differences in Fear of Death
Past studies have revealed several interesting findings with respectto differences in gender on fear of death (e.g., McDonald, 1976;Neimeyer & Moore, 1994), but conclusive findings have remainedelusive. In a recent review, Neimeyer et al. (2004) highlightednumerous inconsistencies. In general, women are reported topossess a greater overall fear of death and think about their owndeaths more frequently than do men. Lester (1972) suggested thatwomen have greater fear of death in certain specific areas ratherthan a general fear of death. Furthermore, using the Multidimen-sional Fear of Death Scale (MFODS), Neimeyer and Moore(1994) found that women had greater fears on most subscales but
254 T. L. Power and S. M. Smith
that they were less fearful of the unknown than were men. Yetother studies have found no gender differences in attitudes towarddeath (e.g., Feifel & Branscomb, 1973), thus a clear relationship hasnot yet been established.
Religiosity and Fear of Death
Given the predictions of Becker (1973) and others, one mightexpect that attitudes toward death might be influenced by religiousideologies. However, definitive findings are again elusive, with bothpositive and negative correlations existing between fear of deathand degree of religious affiliation (e.g., Fortner & Neimeyer,1999; Swenson, 1961). Swenson concluded that individuals with lit-tle religious affiliation have more fearful death attitudes than indivi-duals with stronger religious convictions. In addition, Feifel andNagy (1981) found that people who declared themselves as lessreligious reported a greater fear of death than those with strongerreligious beliefs. Conversely, Feifel (1959) concluded that religiousindividuals are more afraid of death, and offered the explanationthat greater fears arose from a concern about what might happenafter death (e.g., not going to Heaven) as well as a concern aboutthe cessation of current experiences on earth. Kastenbaum andAisenberg (1972) also placed a fear of death in the context of a fearof an afterlife whereby punishment plays a major part.
A non-linear trend has also been supported in the psychologicalliterature in which individuals at both ends of the spectrum (i.e.,non-religious and very religious) indicate less fear of death thanthose expressing ambivalence (Alexander & Alderstein, 1958;Florian & Kravitz, 1983). The strongly religious feel confident thatthey are bound for the afterlife and so they face death with opti-mism, whereas the strongly non-religious face no fear of retributionfollowing their passing. Thus, some have argued that from a Judeo-Christian perspective, religion can be considered as either a bufferagainst death anxiety or as a source of special concern, such as fearof damnation, salvation, or immortality (Kastenbaum, 2000).
How People Predict Their Death
One might expect that the factors described above, although poten-tially influencing fear of death, may also have an influence on
Death Attitudes of Atlantic Canadians 255

people’s predictions of their own death. Perhaps not surprisingly,a significant amount of research has explored the ways in whichindividuals conceive of their own deaths. The most convincingresearch has asked participants about their expectations usingthe Do-It-Yourself-Death-Certificate (DIYDC), an adapted versionof a real death certificate (e.g., Kastenbaum & Aisenberg, 1972;Lonetto et al., 1975; Sabatini & Kastenbaum, 1973). An individual’sestimates of lifespan, time left to live, cause of death, method ofbody disposal, and interval between onset of fatal illness or injuryand death, may be learned from the DIYDC (Sabatini &Kastenbaum, 1973).
Kastenbaum and Aisenberg (1972) administered the DIYDCto participants enrolled in death education courses. They reportedthat heart failure was the most frequently predicted cause of deathby more than half of the participants and was mentioned four timesmore often than the second leading cause of death—old age. Auto-mobile accidents, murders, suicides and other forms of violentdeaths combined were reported as frequently as old age as a pre-dicted cause of death. In a Canadian study, Lonetto et al. (1975)administered the DIYDC to students enrolled in a Psychology ofDeath course. Their participants also projected unrealistic deathestimates in comparison to actuarial data. Other findings indicatedthat the older one is at the time of death, the stronger the feelingthat an accidental death is preferred over a natural one, that thedeath occur in a rural area, and that a spouse will still be surviving.Thus, the DIYDC, through estimates of time left to live (people’sage subtracted from their predicted age at death) may supply datathat provides insight into a person’s fear of death when confrontingone’s own mortality.
Limitations of Past Research and Overview of Study
Although past research has documented an impressive array offindings, a number of questions remain unanswered. Because ofstudies suggesting that detailed examination of specific demo-graphic factors have a bearing on one’s fear of death, much workremains to be done with respect to examining the impact of thesefactors in concert with one another on fear of death. Furthermoreit would be interesting to explore how the findings of previouswork might apply to an Atlantic Canadian sample. Therefore,
256 T. L. Power and S. M. Smith
we conducted a study to assess death attitudes and predictionsregarding death in a Nova Scotia student sample. Based on thenature of this sample, being of a primarily Judeo-Christian back-ground, we expected that participants rating themselves as lessreligious would have a greater fear of death than participants ratingthemselves as very religious. Furthermore we expected thatwomen would have a greater fear of death than men in specificdeath domains; that participants would make inaccurate death-related predictions related to cause, place, age, and marital statusat time of death as compared with actuarial data; and that genderdifferences would exist with respect to death-related predictionssuch that women would underestimate the probability of dyingof cardiovascular disease and would overestimate the likelihoodof being married at the time of death.
Method
Participants
One hundred and forty-four undergraduate students volunteeredto participate. There were 111 women and 33 men, ranging inage from 18 to 57, with a mean age of 23.6 (SD ¼ 7.4 years).Although most participants were from Nova Scotia, all of the otherAtlantic provinces (New Brunswick, Newfoundland, and PrinceEdward Island) were represented in the sample.
Instruments
DEMOGRAPHICS AND RELIGIOSITY
A demographic questionnaire was administered to obtain ageand gender. Religiosity was assessed on a 4-point scale from 1 (notat all religious) to 4 (very religious). Thirty-six percent of menreported to be not religious, 24% reported themselves to be some-what religious, 27% fairly religious, and 12% reported to be veryreligious. For women, 19% reported to be not religious, and 49%reported to be somewhat religious, 24% reported being fairlyreligious, and 6% reported to be very religious. Interestingly, therewas an apparent difference in terms of religiosity reported suchthat more women reported themselves as somewhat religiouswhereas more men fell into the non-religious category. However,
Death Attitudes of Atlantic Canadians 257
despite these percentage differences, the average rating of religiosityacross gender was comparable (M ¼ 2.15, SD ¼ 1.06 for men, andM ¼ 2.16, SD ¼ .80 for women).
RELIGION
Participants were also asked to indicate their faith, if any. Inter-estingly, the disparity seen on ratings of level of religiosity abovewas paralleled in indications of faith. Of the 111 women, 45% wereCatholic, 25% were Protestant, 7% declared no religious affiliation,and 21% declared ‘‘other’’ religious affiliation. Of the 33 men, 31%reported to be of Catholic faith, 15%were Protestant, 38% declaredno religious affiliation, and 15% declared ‘‘other’’. Thus again, agreater percentage of men rated themselves as non-religious. Thisapparent increase in religious affiliation among women is evenlydistributed across the other categories. For both men and women,the most frequently cited ‘‘other’’ religion was another Christianreligion (e.g., United, Anglican) with Muslim also being mentioned.
THE MFODS
Hoelter’s (1979) scale is a reliable and validated 42-itemmeasure of fear of death. Items are rated on a 5-point Likert-typescale ranging from 1 (strongly agree) to 5 (strongly disagree). Five itemsare reverse-scored to control for response bias. Eight subscaleshave been derived from the MFODS: Fear of the Dying Process(M ¼ 2.16, SD ¼ 0.89, a ¼ .80); Fear of the Dead (M ¼ 2.70,SD ¼ .90, a ¼ .74); Fear of Being Destroyed (M ¼ 2.97, SD ¼ 1.10,a ¼ .68); Fear for Significant Others (M ¼ 1.71, SD ¼ .77,a ¼ .82); Fear of the Unknown (M ¼ 2.79, SD ¼ .74, a ¼ .50);Fear of Conscious Death (M ¼ 3.00, SD ¼ .99, a ¼ .77); Fear forthe Body After Death (M ¼ 3.26; SD ¼ .96, a ¼ .78); and Fearof Premature Death (M ¼ 2.52, SD ¼ 1.03, a ¼ .79). Lower scoreson each subscale represent a higher fear of death. Consistent withprevious research (Hoelter, 1979; Neimeyer & Moore, 1994;Walkey, 1982), but with the exception of the Fear of the Unknownsubscale, internal consistency was good.
THE DIYDC
The DIYDC asks respondents to complete a number of itemsincluding the predicted cause, location, marital status, and age attime of death. Although a number of additional items are assessed
258 T. L. Power and S. M. Smith
(e.g., race, date of birth, place of injury) these were not examinedin our analyses. According to Sabatini and Kastenbaum (1973),the DIYDC is an effective measure of attitudes toward personalmortality.
Procedure
Questionnaires were administered to groups of 6 to 10 participants.Participants were given envelopes containing a demographic ques-tionnaire, and the MFODS and the DIYDC in counterbalancedorder. Participants were assured that their responses would remainanonymous. Upon completion of the measures, the participantswere advised to place the questionnaires back inside the envelopes,seal the envelopes, and return them.
Results
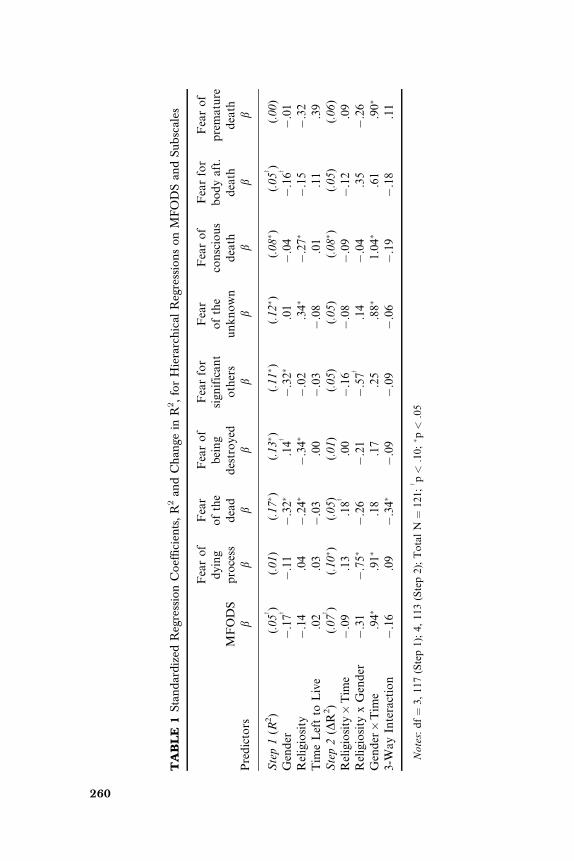
The first goal of this study was to determine whether levels of deathfear vary as a function of a person’s gender, religiosity, and timeleft to live. Eleven cases were excluded from the analyses as itwas evident that these participants did not understand how to indi-cate their age at death on the DIYDC (e.g., a 21-year-old partici-pant reported she would die of old age yet indicated her ageat death to be 21), thus time-left-to live could not be calculatedfor these participants. Regression analyses were conducted withgender, religiosity, time left to live, and all possible interactionsamong the variables as predictors. In accordance with the recom-mendations of Aiken and West (1991), all continuous variableswere centered prior to analyses being conducted.1 Because pre-vious research has found differing effects across different dimen-sions of death fear, we conducted independent analyses on theoverall MFODS as well as the eight subscales. A summary of theseregression analyses is provided in Table 1.
1Additional exploratory curvilinear analyses were conducted for religiosity on theMFODS and its subscales to determine whether a non-linear relationship existed for religi-osity and death fear. For this data, with the exception of a potential curvilinear effect onMFODS subscales 5 and 6, that is, on Fear of the Unknown and on Fear of ConsciousDeath, a curvilinear relationship for religiosity and death fear was not found to exist. There-fore on these data, we conducted linear regression analyses.
Death Attitudes of Atlantic Canadians 259
TA
BL
E1
Stan
dar
diz
edR
egre
ssio
nC
oeff
icie
nts
,R
2an
dC
han
gein
R2,
for
Hie
rarc
hic
alR
egre
ssio
ns
onM
FO
DS
and
Sub
scal
es
MF
OD
S
Fea
ro
fd
yin
gp
roce
ss
Fea
ro
fth
ed
ead
Fea
ro
fb
ein
gd
estr
oy
ed
Fea
rfo
rsi
gn
ific
an
to
ther
s
Fea
ro
fth
eu
nk
no
wn
Fea
ro
fco
nsc
iou
sd
eath
Fea
rfo
rb
od
ya
ft.
dea
th
Fea
ro
fp
rem
atu
red
eath
Pre
dic
tors
bb
bb
bb
bb
b
Ste
p1
(R2)
(.0
5y )
(.0
1)
(.1
7� )
(.1
3� )
(.1
1� )
(.1
2� )
(.0
8� )
(.0
5y )
(.0
0)
Gen
der
�.1
7y
�.1
1�
.32�
.14y
�.3
2�
.01
�.0
4�
.16y
�.0
1R
elig
iosi
ty�
.14
.04
�.2
4�
�.3
4�
�.0
2.3
4�
�.2
7�
�.1
5�
.32
Tim
eL
eft
toL
ive
.02
.03
�.0
3.0
0�
.03
�.0
8.0
1.1
1.3
9S
tep
2(D
R2)
(.0
7y )
(.1
0� )
(.0
5)
(.0
1)
(.0
5)
(.0
5)
(.0
8� )
(.0
5)
(.0
6)
Rel
igio
sity�
Tim
e�
.09
.13
.18y
.00
�.1
6�
.08
�.0
9�
.12
.09
Rel
igio
sity
xG
end
er�
.31
�.7
5�
�.2
6�
.21
�.5
7y
.14
�.0
4.3
5�
.26
Gen
der�
Tim
e.9
4�
.91�
.18
.17
.25
.88�
1.0
4�
.61
.90�
3-W
ay
Inte
ract
ion
�.1
6.0
9�
.34�
�.0
9�
.09
�.0
6�
.19
�.1
8.1
1
No
tes:
df¼
3,
11
7(S
tep
1);
4,
11
3(S
tep
2);
To
tal
N¼
12
1;y p<
.10
;� p<
.05
260

Gender, Religiosity, and Time Left to Live Predicting Fear of Death
For overall MFODS score, there was a significant interactionbetween gender and time left to live (see Table 1). To assess thisinteraction, we examined individual regressions with time-left-to-live predicting fear of death for men and women. These regres-sions showed that for men, more time-left-to-live predicted moredeath fear (b ¼ � .01, SE ¼ .01, t ¼ 2.15, p < .05) whereas thiswas not the case for women (b ¼ .00, SE ¼ .00, t ¼ 1.39,p ¼ .17). Religiosity interacted with gender (see Table 1) for scoreson the Fear of the Dying Process subscale such that more religiousmen were less fearful of death (b ¼ .29, SE ¼ .14, t ¼ 2.15,p < .05), whereas there was no relationship for women(b ¼ � .14, SE ¼ .11, t ¼ 1.29, p ¼ .20). As with the overallMFODS score, there was a significant interaction between genderand time left to live, such that for men more time left to livepredicted more fear of the dying process (b ¼ � .02, SE ¼ .01,t ¼ 1.83, p ¼ .08) than for women (b ¼ .01, SE ¼ .01, t ¼ 1.46,p ¼ .15). However, it is worth noting that although the interactionwas significant, the individual regression coefficients did not reachaccepted levels of significance.
For the Fear of the Dead subscale, as expected, gender was asignificant predictor (see Table 1) such that women were morefearful of the dead than were men. Religiosity was also significantpredictor, indicating that as religiosity increased, so did fear of thedead. Interestingly, there was also a significant three-way interac-tion indicating that men with more time left to live were more fear-ful of death (b ¼ � .66, SE ¼ .23, t ¼ 2.94, p < .05) than those withless time left to live (b ¼ .10, SE ¼ .14, t ¼ .67, p ¼ .51), whereasthe opposite was the case for women (b ¼ .25, SE ¼ .18, t ¼ 1.39,p ¼ .17, for women with more time-left-to-live, and b ¼ � .35,SE ¼ .12, t ¼ 2.86, p < .01, for those with less time-left-to-live).Although an interesting finding, this did not replicate on any ofthe other subscales, thus we are reluctant to draw definitive conclu-sions from this result.
The only significant predictor of fear of being destroyed wasreligiosity (see Table 1) indicating that more religious participantshad greater fears about being destroyed than did participants withless religious conviction. In terms of fear for significant others, onlygender was significant (see Table 1) indicating that women were
Death Attitudes of Atlantic Canadians 261

more fearful for significant others than were men. Religiosity wasalso a significant predictor of fear of the unknown (see Table 1)such that participants with low religious conviction were morelikely to respond with a greater fear of the unknown relative tohighly religious participants. Interestingly, this is the only MFODSsubscale where the relationship was in this direction. In addition,gender interacted with time left to live such that for men, havingmore time-left-to-live predicted a greater fear of the unknown(b ¼ � .02, SE ¼ .01, t ¼ �2.36, p ¼ .03) whereas this was not thecase for women (b ¼ .00, SE ¼ .00, t ¼ 0.49, p ¼ .62).
In terms of fear of conscious death, religiosity was again a sig-nificant predictor (see Table 1) such that participants expressinggreater religious conviction were significantly more fearful of aconscious death than those participants who declared themselvesless religious. Furthermore, gender once again interacted with timeleft to live such that a longer time left to live predicted a greaterfear of conscious death for men (b ¼ � .02, SE ¼ .01, t ¼ �2.65,p ¼ .01), but not for women (b ¼ .01, SE ¼ .01, t ¼ 1.43, p ¼ .16).
Interestingly, none of the predictors were significant for fearfor the body after death (see Table 1). Finally, gender interactedwith time left to live for the prediction of fear of premature death,such that, consistent with other subscales, a longer time left to livepredicted a tendency toward a greater fear of premature death formen (b ¼ � .02, SE ¼ .01, t ¼ �1.78, p ¼ .09), but not for women(b ¼ .01, SE ¼ .01, t ¼ 1.50, p ¼ .14). Having now explored theMFODS and its subscales, we turn to participants’ predictionsregarding their own mortality and death.
Participants’ Predictions of Self-Mortality
The second goal of this study was to explore participants’ predic-tions about their own deaths using the DIYDC. Specifically, thepredicted cause, location, marital status, and age at the time ofdeath were examined. Analyses were conducted using cross-tabulations and a one-way analysis of variance (ANOVA). Further-more, of interest was the exploration of differences between menand women on these death estimates and the comparison ofparticipants’ responses to actuarial data in order to determine theaccuracy of their predictions. Data comparisons were made usingthe 1997 Statistics Canada ‘‘Shelf Tables on Causes of Death’’.
262 T. L. Power and S. M. Smith
AGE AT DEATH
A one-way ANOVA revealed no significant differencesbetween men and women on predicted age at death, F(1, 120) ¼ .05,p ¼ .82. A comparison of the means revealed that men expectedto die at age 71 and women expected death to occur at age 70. Inter-estingly, both men and women underestimated their expected ageat death when compared to actuarial data, which report a lifeexpectancy of 75 years for men and of 81 years for women.
PLACE OF DEATH
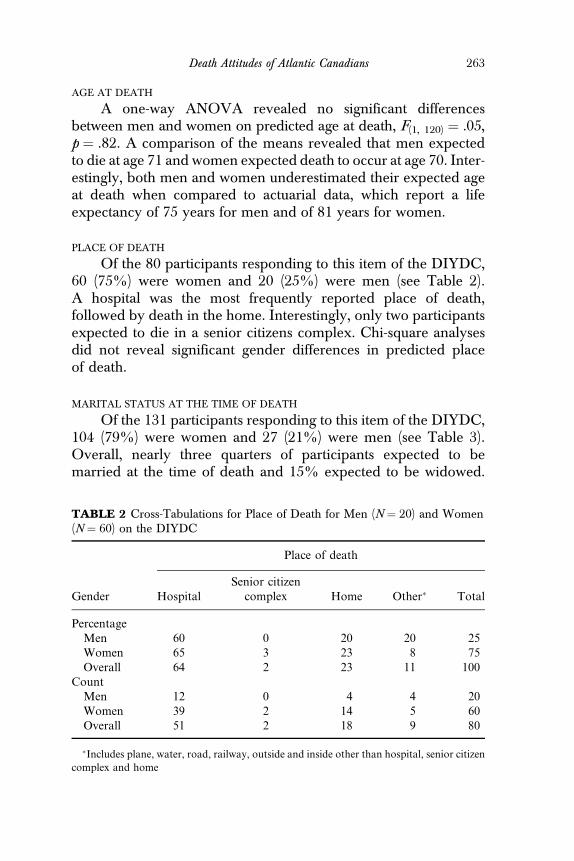
Of the 80 participants responding to this item of the DIYDC,60 (75%) were women and 20 (25%) were men (see Table 2).A hospital was the most frequently reported place of death,followed by death in the home. Interestingly, only two participantsexpected to die in a senior citizens complex. Chi-square analysesdid not reveal significant gender differences in predicted placeof death.
MARITAL STATUS AT THE TIME OF DEATH
Of the 131 participants responding to this item of the DIYDC,104 (79%) were women and 27 (21%) were men (see Table 3).Overall, nearly three quarters of participants expected to bemarried at the time of death and 15% expected to be widowed.
TABLE 2 Cross-Tabulations for Place of Death for Men (N ¼ 20) and Women(N ¼ 60) on the DIYDC
Place of death
Gender HospitalSenior citizen
complex Home Other� Total
PercentageMen 60 0 20 20 25Women 65 3 23 8 75Overall 64 2 23 11 100
CountMen 12 0 4 4 20Women 39 2 14 5 60Overall 51 2 18 9 80
�Includes plane, water, road, railway, outside and inside other than hospital, senior citizen
complex and home
Death Attitudes of Atlantic Canadians 263

TA
BL
E3
Stat
isti
csC
anad
aM
arit
alSt
atus
Dat
aat
the
Tim
eof
Dea
than
dC
ross
-tab
ulat
ion
sat
the
Tim
eof
Dea
thfo
rM
en(N¼
27)a
nd
Wom
en(N¼
104)
Ma
rita
lst
atu
s
Gen
der
Sta
tsC
an
ma
rrie
dM
arr
ied
Sta
tsC
an
nev
erm
arr
ied
Nev
erm
arr
ied
Sta
tsC
an
wid
ow
edW
ido
wed
Sta
tsC
an
div
orc
edD
ivo
rced
Sta
tsC
an
tota
l�T
ota
l
Per
cen
tag
eM
en5
96
31
61
11
82
26
49
71
00
Wo
men
28
75
11
95
41
35
39
81
00
Ov
era
ll4
47
31
49
35
15
63
98
10
0C
ou
nt
Men
64
74
91
71
73
64
31
97
50
67
00
01
10
88
63
27
Wo
men
29
19
37
81
18
52
95
58
79
14
50
02
31
01
92
61
04
Ov
era
ll9
39
42
95
29
21
61
27
56
29
20
12
00
24
21
07
89
13
1
� Do
esn
ot
incl
ud
ed
eath
sin
wh
ich
ma
rita
lst
atu
sis
un
kn
ow
no
ru
nd
ecla
red
264

TA
BL
E4
Stat
isti
csC
anad
aC
ause
ofD
eath
Dat
aan
dC
ross
-tab
ulat
ion
sfo
rC
ause
ofD
eath
for
Men
(N¼
28)a
nd
Wom
en(N¼
89)o
nth
eD
IYD
C
Ca
use
of
dea
th
Gen
der
Sta
tsC
an
hea
rta
tta
ckH
eart
att
ack
Sta
tsC
an
old
ag
e�O
lda
ge
Sta
tsC
an
fata
lil
lnes
sF
ata
lil
lnes
s
Sta
tsC
an
tra
ffic
acc
iden
tT
raff
ica
ccid
ent
Sta
tsC
an
oth
er��
Oth
er���
Sta
tsC
an
tota
lT
ota
l
Per
cen
tag
eM
en2
13
9N=A
29
68
72
14
10
11
52
24
Wo
men
19
16
N=A
40
74
29
11
46
14
87
6O
ver
all
20
38
N=A
38
71
24
11
48
31
00
10
0C
ou
nt
Men
23
82
41
1N=A
87
56
31
21
95
34
10
57
73
11
19
85
28
Wo
men
19
70
21
4N=A
36
76
62
52
69
14
12
64
43
11
03
68
48
9O
ver
all
43
52
62
5N=A
44
15
22
56
26
28
67
16
17
02
04
21
56
69
11
7
� Old
ag
ed
oes
no
ta
pp
ear
as
aS
tati
stic
sC
an
ad
aca
use
of
dea
th.
��C
om
pri
sed
of
dea
thre
sult
ing
fro
ma
llo
ther
cau
ses
no
to
ther
wis
est
ate
d.
��� C
om
pri
sed
of
dea
thre
sult
ing
fro
md
rug
sa
nd
alc
oh
ol,
suic
ide,
po
iso
n,
sta
bb
ing
,g
un
sho
t.
265
As predicted, these estimates were highly inaccurate when com-pared to Statistics Canada (1997) actuarial data (see Table 3). How-ever, chi-square analyses did not reveal significant differencesbetween men and women.
CAUSE OF DEATH
Of the 117 participants responding to this item 89 (76%) werewomen and 28 (24%) were men. Table 4 shows percentageresponses and counts for men, women and an overall total for eachcause of death, as well as Statistics Canada (1997) data. Chi-squareanalyses revealed a significant difference between men and womenon cause of death, v2(4, N ¼ 117) ¼ 16.40, p ¼ .01. As can be seenin Table 4, for men the leading cause of death listed was heartattack (39%) followed by old age (29%). Traffic accidents and fatalillnesses comprised the subsequent causes of death at 14% and7%, respectively. For women, the leading cause of death was byold age (40%) followed by fatal illness (29%). Death by heartattack was mentioned by only 16% of women, a statistic slightlyhigher than the next most mentioned cause of death, which wasby traffic accident at 14%.
General Discussion
Gender and Fear of Death
The hypothesis that women express greater concerns in certainspecific death fear domains was confirmed, and our results supportprevious research findings (e.g., Cicirelli, 2001; Neimeyer &Moore, 1994; Suhail & Akram, 2002). Specifically, our studyrevealed that women expressed greater fears on two MFODSsubscales, Fear for Significant Others and Fear of the Dead, andtherefore supports the general consensus that women tend toexpress greater fears than men do in some death domains.
It is possible that women do not actually have a higher level ofdeath fear than do men but are simply more willing to acknowl-edge negative feelings and report fears in some cases (Fortner &Neimeyer, 1999; Kastenbaum, 2000). Alternatively, Dattel andNeimeyer (1990) concluded that after controlling for self-disclosureand social desirability, women did indeed have more elevated
266 T. L. Power and S. M. Smith
death fears. It could be that women’s elevated fear for significantothers is attributable to instinctive maternal characteristics, whichtend to foster stronger familial bonds. Women in Atlantic Canadado not differ significantly from women globally in that theyexpressed elevated death fears in certain specific death domains.Although Atlantic Canada has historical, religious, and culturalcharacteristics relatively unique to the area, the fact that womenfrom this area tend to show higher death fears in certain specificdomains makes them similar to women studied in numerous otherregions and countries (e.g., Neimeyer & Moore, 1994; Suhail &Akram, 2002; Okafor, 1994; Tang, Wu, & Yan, 2002).
An unexpected gender-related finding in this study was thatmen expecting to have a greater amount of time-left-to-live hadgreater fear of death than women on a number of subscales;a result that lends partial support to findings reported by bothCicirelli (2001) and Neimeyer and Moore (1994). However, inboth the Cicirelli (2001) and Neimeyer and Moore studies, genderwas the primary predictor of the fear of death, whereas in thepresent study—while the interaction was significant—gender didnot independently predict fear of death (see Table 1). Increasedfear of death for men has also been attributed to an indirect linkwith religiosity (Cicirelli, 1999), such that stronger religious beliefstend to result in lower death fears. Thus because women tend tohave stronger religious convictions than men do, men may havea higher fear of death. Interestingly, in this sample, women wereno more religious on average than men (see Method above) butwere less likely to indicate they were ‘‘not religious’’.
Religiosity and Fear of Death
The results of the present study revealed that the more religiousparticipants had higher fear of the dead, fear of being destroyed,and fear of conscious death, whereas participants with lowerreligious conviction were more fearful of the unknown. Perhapsthis is due to the predominantly Christian culture of the AtlanticProvinces (Statistics Canada, 2005). Ideas of salvation and dam-nation are still very much culturally entrenched, thus those withoutreligious convictions may still be aware of both their failure to meetthe expectations for salvation and its implications for damnation.
Death Attitudes of Atlantic Canadians 267
In addition, for those without strong religious beliefs, a life beyondthe present world is uncertain. The devout are more confident inthe better life to follow. Without an opportunity to, for example,see deceased loved ones or to find solace from the suffering ofthe corporeal world in the afterlife, death threatens to be a finiteterminus to the unfinished business of living.
Interestingly, discrepant findings are a hallmark of previousresearch on the relationship between religiosity and death fear.Inconsistent findings in the present study with respect to bothreligious and non-religious participants expressing a fear of deathmay be attributable to the differing domains in which these fearssurfaced (i.e., to the multidimensional nature of death fear). Onepossible explanation for the more strongly religious committedparticipants evidencing greater fears on some subscales is thatmany religions practice very specific postmortem rituals and holdthe body to be sacred. The less religious participants’ greater fearsof the unknown may reflect doubts about their fate after theircorporeal death.
Death-Related Predictions
It is interesting (though not surprising) that both men and womenmade inaccurate predictions related to age, location, marital status,and cause of death compared with actuarial data. It is difficult todetermine whether these inaccuracies are due to ignorance ofactual death statistics or to an overly skewed outlook of one’sown future. Although statistics relating to average life expectancyand cause of death are relatively accessible, Lonetto et al. (1975)and Simpson (1975) noted that by avoiding conscious explorationof death statistics we create an emotional distance between ourlives and our eventual death.
Another explanation may simply be that these inaccuraciesare a consequence of how death is portrayed in the media. Whenthe media report on death, these deaths tend to be of a catastrophicor violent nature, thus we tend to overestimate the likelihood ofour experiencing such an eventuality (the so-called ‘‘availabilityheuristic’’; Tversky & Kahneman, 1973). Seldom is a camera in ahospital room or a senior citizens home as the patient expires, thusthere may be a perception perpetuated by the media that this typeof death is a less common occurrence.
268 T. L. Power and S. M. Smith

Another interesting finding is that participants made inaccur-ate predictions regarding marital status at the time of their death.This seems due in part to the fact that women underestimatedbeing widowed at the time of death. Statistically, it is virtuallyimpossible for women to outlive men by six years and not be morelikely to be widowed at the time of death. The fact that women didnot accurately predict their age and marital status at death mayhave some significant implications for their quality of life in lateryears (as many women may find themselves unexpectedly aswidows living longer than they expected).
It is interesting to note that men and women differed in theirprediction of cause of death. For women, old age was the mostoften predicted cause of death, yet old age is not a cause of deathin either the DIYDC or Statistics Canada data. Perhaps parti-cipants’ understanding of ‘‘old age’’ comes from other less formalagents of socialization such as family, media, or peer groups. Formen, heart disease was the most often predicted cause of death,although it was substantially overestimated when compared toactuarial data. Again, this may be in part due to the availabilityheuristic (Tversky & Kahneman, 1973) as we frequently hear ofand see media depictions of men dying of heart attacks (but rarelysee depictions of women having heart attacks).
Limitations and Future Directions
Possible directions for future research might include a study ofparticipants from broader religious backgrounds and could takeinto account not only strength of religious conviction but the multi-dimensionality of religiosity as well. It is interesting that men andwomen appeared to differ in terms of their religious convictions.However, as noted in the Methods section, this seems primarilydue to women being less likely to report being ‘‘non-religious’’and more likely to report themselves as ‘‘somewhat’’ religious. Thiscould indicate that women might be somewhat more ambivalentconcerning their religious convictions, and this could contributeto how women feel about death. This being the case, continuedresearch on this aspect of the findings would be worthwhile.
Future study might also include some more indirect measuresof fear of death that circumvent social desirability issues. Sabatiniand Kastenbaum (1973) found that discussion with participants
Death Attitudes of Atlantic Canadians 269
after completing the DIYDC revealed that some predictions aboutcause of death were too threatening for participants to identify. Inaddition, it could be that once participants are aware of the differ-ent actuarial categories that are used to designate place and causeof death, they might become more accurate in their predictionsconcerning their own deaths. Thus, it would be worthwhile toexplore this issue in future studies by specifically informing parti-cipants of these categories before they are asked to make theirpredictions.
Overall, the present research not only supports the applica-bility to Atlantic Canadians of the general trends found in priorresearch regarding death attitudes and predictions, it also under-scores the need for the examination of interaction effects amongthe correlates of death fear. Because a number of significant inter-actions were found between these predictors, it would be worth-while to further examine such issues. Given the relative absenceof information regarding death attitudes and fears in AtlanticCanada, and the potential interactive effects of different predictors,the findings of this study represent one departure point for futureresearch in this and other regions.
References
Aiken, L. S. & West, S. G. (1991). Multiple regression: Testing and interpretinginteractions. Newbury Park, CA: Sage.
Alexander, I. E. & Alderstein, A. M. (1958). Affective response to the conceptof death in apopulation of children and early adolescents. Journal of GeneticPsychology, 93, 167–177.
Becker, E. (1973). The denial of death. New York: The Free Press.Cicirelli, V. G. (1999). Personality and demographic factors in older adults’ fear of
death. The Gerontologist, 39, 569–579.Cicirelli, V. G. (2001). Personal meanings of death in older adults and young
adults in relation to their fears of death. Death Studies, 25, 663–683.Dattel, A. R. & Neimeyer, R. A. (1990). Sex differences in death anxiety: Testing
the emotional expressiveness hypothesis. Death Studies, 14, 1–11.Feifel, H. (Ed.). (1959). The meaning of death. New York: McGraw-Hill.Feifel, H. & Branscomb, A. B. (1973). Who’s afraid of death? Journal of Abnormal
Psychology, 81, 282–288.Feifel, H. & Nagy, V. T. (1981). Another look at fear of death. Journal of Consulting
and Clinical Psychology, 49, 278–286.Florian, V. & Kravitz, S. (1983). Fear of personal death: Attribution, structure,
and relation to religious belief. Journal of Personality and Social Psychology, 44,600–607.
270 T. L. Power and S. M. Smith
Fortner, B. V. & Neimeyer, R. A. (1999). Death anxiety in older adults: A quan-titative review. Death Studies, 23, 387–411.
Harmon-Jones, E., Simon, L., Greenberg, J., Pyszczynski, T., Soloman, S., &McGregor, H. (1997). Terror management theory and self-esteem: evidencethat increased self-esteem reduces mortality salience effects. Journal of Person-ality and Social Psychology, 72, 24–36.
Hoelter, J. W. (1979). Multidimensional treatment of fear of death. Journal ofConsulting and Clinical Psychology, 47, 996–999.
Kastenbaum, R. (2000). The psychology of death. (3rd ed.). New York: Springer.Kastenbaum, R. & Aisenberg, R. (1972). The psychology of death. New York:
Springer.Kastenbaum, R. & Costa, P. T. (1977). Psychological perspectives on death.
Annual Review of Psychology, 28, 225–249.Lester, D. (1972). Studies in death attitudes: Part 2. Psychological Reports, 30, 440.Lester, D. (1994). The collett-lester fear of death scale. In R. A. Neimeyer (Ed.),
Death anxiety handbook: Research, instrumentation, and application (pp. 45–59).Washington, DC: Taylor & Francis.
Littlefield, C. & Fleming, S. (1984). Measuring fear of death: A multidimensionalapproach. Omega, 15, 131–138.
Lonetto, R., Fleming, S., Gorman, M., & Best, S. (1975). The psychology of death:A course description and some student perceptions. The Ontario Psychologist,7, 9–14.
McDonald, G. W. (1976). Sex, religion, and risk-taking behavior as correlates ofdeath anxiety. Omega, 7, 35–44.
Neimeyer, R. A. & Moore, M. K. (1994). Validity and reliability of the multidi-mensional fear of death scale. In R. A. Neimeyer (Ed.), Death anxiety hand-book: Research, instrumentation, and application (pp. 103–119). Philadelphia:Taylor & Francis.
Neimeyer, R. A. & Van Brunt, D. (1995). Death anxiety. In H. Wass & R. A.Neimeyer (Eds.), Dying: Facing the facts (3rd ed., pp. 49–88). Philadelphia &London: Taylor & Francis.
Neimeyer, R. A., Wittkowski, J., & Moser, R. P. (2004). Psychological research ondeath attitudes: An overview and evaluation. Death Studies, 28, 309–340.
Okafor, T. R. U. (1994). Death attitudes, gender and death experience: TheNigerian evidence. Omega, 30, 67–78.
Robinson, P. J. & Wood, K. (1984). The threat index: An additive approach.Omega, 15, 139–144.
Sabatini, P. & Kastenbaum, R. (1973). The Do-It-Yourself Death Certificate as aresearch technique. Life-Threatening Behavior, 3, 20–32.
Simpson, M. A. (1975). The Do-It-Yourself-Death-Certificate in evoking andestimating student attitudes toward death. Journal of Medical Education, 50,475–478.
Statistics Canada. (1997). Shelf tables on causes of death. Ottawa, ON: StatisticsCanada.
Statistics Canada. (2005). Population by religion, by provinces and territories. RetrievedJune 18, 2005, from http://www40.statcan.ca/l01/cst01/demo30a.htm.
Death Attitudes of Atlantic Canadians 271

Suhail, K. & Akram, S. (2002). Correlated of death anxiety in Pakistan. DeathStudies, 26, 39–50.
Swenson, W. M. (1961). Attitudes towards death in an aged population. Journalof Gerontology, 16, 49–52.
Tang, C. S., Wu, A. M., & Yan, E. C. (2002). Psychosocial correlates of deathanxiety among Chinese college students. Death Studies, 26, 491–499.
Tversky, A. & Kahneman, D. (1973). Availability: a heuristic for judgingfrequency and probability. Cognitive Psychology, 5, 207–232
Walkey, F. H. (1982). The multidimensional fear of death scale: An independentanalysis. Journal of Consulting and Clinical Psychology, 50, 466–467.
272 T. L. Power and S. M. Smith


![“The Fear of Death” [ lovethecross.com ]. Do you fear death?](https://img.pdfslide.net/doc/110x75/56649d955503460f94a7d043/the-fear-of-death-lovethecrosscom-do-you-fear-death.jpg)