Embed Size (px)
Citation preview

Predictors of Fecundability and Conception WaitsAmong the Dogon of Mali
BEVERLY I. STRASSMANN1* AND JOHN H. WARNER2
1Department of Anthropology, University of Michigan,Ann Arbor, Michigan 481092Department of Statistics and Center for Statistical Consultation andResearch, University of Michigan, Ann Arbor, Michigan 48109
KEY WORDS fertility; menstrual cycle; demography; birthinterval; survival analysis; Sahel
ABSTRACT Surprisingly little is known about the mechanisms thatunderlie variation in female fertility in humans. Data on this topic arenonetheless vital to a number of pragmatic and theoretical enterprises,including population planning, infertility treatment and prevention, andevolutionary ecology. Here we study female fertility by focusing on onecomponent of the interbirth interval: the waiting time to conception duringmenstrual cycling. Our study population is a Dogon village of 460 people inMali, West Africa. This population is pronatalist and noncontracepting. Inaccordance with animist beliefs, the women spend five nights sleeping at amenstrual hut during menses. By censusing the women present at themenstrual huts in the study village on each of 736 consecutive nights, we wereable to monitor women’s conception waits prospectively. Hormonal profilesconfirm the accuracy of the data on conception waits obtained from themenstrual hut census (Strassmann [1996], Behavioral Ecology 7:304–315).Using survival analysis, we identified significant predictors of the waitingtime to conception: wife’s age (years), husband’s age (,35, 35–49, .49 years),marital duration (years), gravidity (number of prior pregnancies), andbreast-feeding status. Additional variables were not significant, includingduration of postpartum amenorrhea, sex of the last child, nutritional status,economic status, polygyny, and marital status (fiancee vs. married). We fitboth continuous and discrete time survival models, but the former appearedto be a better choice for these data. Am J Phys Anthropol 105:167–184,1998. r 1998 Wiley-Liss, Inc.
An improved understanding of humanevolutionary ecology will require clarifica-tion of the causes of differential reproduc-tion during our evolutionary past. In particu-lar, it will require clarification of the evolvedmechanisms that underlie differences in fe-male fertility. Because fossil remains are oflimited value for this purpose, the bestalternative is to study natural fertility popu-lations. In these populations, the effect ofdistal variables such as land ownership andproximal variables such as nutritional sta-tus can be tested for an effect on fecunditywithout the confounding effect of contracep-tion.
Most of the relevant research has beenconducted by demographers, who have madetwo major contributions. First, they haveidentified many variables that have a directeffect on fertility and through which theeffects of distal variables are mediated. Thisis known as the proximate determinantsapproach (Bongaarts and Potter, 1983). Sec-
Contract grant sponsor: LSB Leakey Foundation; Contractgrant sponsor: NSF; contract grant number BNS-8612291; Con-tract grant sponsor: University of Michigan.
*Correspondence to: Beverly I. Strassmann, Department ofAnthropology, 1020 LSA Building, University of Michigan, AnnArbor, MI 48109. E-mail: [email protected]
Received 15 April 1996; accepted 13 November 1997.
AMERICAN JOURNAL OF PHYSICAL ANTHROPOLOGY 105:167–184 (1998)
r 1998 WILEY-LISS, INC.

ond, they have recognized that to under-stand fertility it is useful to disaggregate thebirth interval into separate components:postpartum amenorrhea, the waiting timeto conception among cycling women, preg-nancy, and the time added by fetal loss. Herewe use both discrete and continuous timesurvival analysis (Lawless, 1982) to identifythe independent variables associated withthe waiting time to conception in a Dogonvillage in Mali, West Africa. We also esti-mate the impact of the covariates on effec-tive fecundability, defined as the monthlyprobability (continuous time model) or cycle-wise probability (discrete model) of a concep-tion that results in a live birth (Wood, 1994).
The Dogon are a natural fertility popula-tion (sensu Henry, 1961) with a total fertilityrate of 8.6 live births per woman. This highfertility rate is driven in part by a highmortality rate (20% mortality by age 1 year,46% by age 5 years, N 5 388) (Strassmann,1992). Dogon villages are particularly suit-able for studying variance in conceptionwaits because the confounding effect of con-traception is completely absent. Most previ-ous studies of conception waits were con-ducted in populations that were not uniformwith respect to contraception use. Some ofthese studies omitted the contraceptingwomen from the sample and estimated fe-cundability from the remaining women. Ifthe contracepting women had a higher prob-ability of conception, this procedure underes-timated fecundability (Goldman et al., 1985;Larsen and Vaupel, 1993; Baird et al., 1994).In some populations, fecundability is de-pressed not by contraception but by sterilitycaused by venereal disease. In our studyvillage, however, the prevalence of primarysterility (no pregnancy ever) was only 0.9%(1 out of 113 women). The prevalence ofsecondary sterility (after the birth of onechild) was only 1.8% (2 out of 113 women).Nor was there evidence of AIDS at the timeof the fieldwork reported here. Thus, wewere able to measure fecundability in theabsence of these major confounding vari-ables.
Another advantage of the Dogon as astudy population derives from their men-strual taboos. During menses Dogon womenspend five nights sleeping at a menstrual
hut, which made it possible to monitor fe-male reproductive status prospectively with-out interviews. It was readily apparent whenwomen resumed menses after postpartumamenorrhea because they visited a men-strual hut; they continued to do so periodi-cally until they became pregnant. Thus, thewaiting time to conception could be mea-sured as the time from the first postpartummenstruation to the onset of pregnancy. Theanalysis of urinary steroid hormone profilesover a 10 week period showed that women inSangui went to the menstrual huts during87.5% of all menses and never went to themenstrual huts at other times (Strassmann,1996). Compliance was nearly as good in thevillage of Dini. Interestingly, the Dogonthemselves use knowledge of the timing ofwomen’s visits to the menstrual huts tomonitor female reproductive status with ahigh degree of accuracy (Strassmann, 1992,1996).
John et al. (1987: 437) conducted a particu-larly informative investigation of fecundabil-ity in Matlab Thana, Bangladesh. However,the timing of the first postpartum mensesand the last menses before pregnancy wereidentified through interviews and thereforemay have been subject to errors in recall orreporting. Although women were inter-viewed on a monthly schedule, ‘‘frequentabsences of women on the interview day’’resulted in ‘‘gaps of two to four months.’’
Other studies lacked information on men-strual cycling entirely and calculated fecund-ability as the time from marriage to 9 monthsbefore the first birth (e.g., Goldman et al.,1985). A disadvantage of this approach isthat fecundability tends to be higher in thefirst than in subsequent conception waits onaccount of the relative youth of subjects,high coital frequency in the early years ofmarriage, and the absence of lactation (Gold-man et al., 1985). For an unbiased measureof the waiting time to conception in thepopulation as a whole, higher order concep-tion waits need to included, which was pos-sible in the present study.
METHODSResearch design
We chose a microdemographic approachemphasizing data quality rather than the
168 B.I. STRASSMANN AND J.H. WARNER

more usual demographic survey approach inwhich large sample size is paramount. Inparticular, we focused on a single studyvillage, Sangui, that had a population of 460individuals in January 1988. Sangui is lo-cated on the plateau of the BandiagaraEscarpment at 14° 298 N and 3° 198 W. Thedata on conception waits are derived from acensus of the women present at the twomenstrual huts in the study village on eachof 736 consecutive nights (July 1986 to July1988). From the menstrual hut census wecalculated the waiting times to conceptionfor 50 women aged 16–41 years. Althoughthis sample size is small, it is free of errorsin recall or reporting that may arise fromthe use of retrospective data.
Because we wished to understand varia-tion in conception waits in women actuallyexposed to the risk of conception, our sampleof 50 women excludes the nonsusceptiblewomen who cycled during the study. Thesenonsusceptible women (N 5 12) were ex-cluded for the following specific reasons: thehusband had no children and was sterile(his wives (N 5 2) subsequently divorced);the woman was sterile–younger than age 42but no birth for past 5 years (N 5 4); thehusband was absent (N 5 5); and illness(N 5 1). Including these women in the analy-sis would have confounded the effort todetermine how fecundability covaries withthe independent variables of key interest.Eight women aged 42–53 years menstru-ated during the study but were probablysterile because, over an 8 year period (1986–1994), no woman in the study village had alive birth after age 41. We analyzed the databoth with (N 5 58) and without (N 5 50)these eight women. The nonsusceptiblewomen comprise 27% of the women whomenstruated in Sangui at least once duringthe study, which may seem like a largeproportion. Due to the absence of contracep-tion, however, fecund women spent most (orall) of the 2 year study period pregnant orlactating, leaving subfecund and infertilewomen to be overrepresented among thecycling women (Strassmann, 1997). The sam-ple of 50 women also excluded three womenwho could not be monitored: two were mar-ried to nonanimists and did not use the
menstrual huts, and one was only intermit-tantly resident in the village.
The conception waits of only 15 of the 50women were completely observed. For theremaining observations, the waiting timeswere censored (Fig. 1). Women of low fecund-ability were less likely to have conceived bythe end of the study and therefore werelikely to be overrepresented among the rightcensored observations. Because women oflow fecundability cycle longer before preg-nancy, they were also more likely to becycling at the start of the study. As a conse-quence, they were also more prone to leftcensoring. Omission of either the right cen-sored or the left censored observations wouldhave resulted in an overestimate of fecund-ability. Three women conceived upon theresumption of ovulation postpartum with-out a prior menstruation. Exclusion of thesewomen would have led to an underestimateof fecundability. The use of survival analysismade it possible to estimate fecundabilityfrom both the censored and uncensored wait-ing times (Lawless, 1982).
We used both continuous time and dis-crete time survival analysis. An advantageof the discrete time model is that it permitscalculation of the probability of successfulconception per menstrual cycle, but a disad-vantage is that long and short cycles bothcount as one trial. The continuous timemodel has the advantage of being able todetect variation in conception waits causedby factors that impinge on cycle length,which should make this model more sensi-tive for assessing the effects of covariates.Our continuous time survival model is anexponential waiting time model where thehazard rate li for woman i is given by li 5exp (2Xib), where Xi is a vector of covariates(including a constant term) and b is a vectorof regression coefficients. The exponentialmodel was fit by maximum likelihood meth-ods using Proc LIFEREG in SAS (1988).Proc LIFEREG handles right censored obser-vations by standard methods (Kalbfleischand Prentice, 1980; Lawless, 1982). Wehandled left censoring by truncating thewaiting interval to the beginning of thestudy, which adjusted for length-biased sam-pling (Elandt-Johnson and Johnson, 1980;Wood et al., 1992; Tuma and Hannan, 1984).
169FECUNDABILITY OF DOGON WOMEN

The discrete time survival model is ageometric model where the probability ofconception per cycle, Pi, is given by exp (Xib)/(1 1 exp (Xib)). This model was fit by stan-dard logistic regression techniques (ProcLOGISTIC in SAS). Each menstrual cyclewas considered one trial and was recordedas a success if it resulted in conception and a
failure otherwise. Under the geometricmodel, the likelihood for a conception incycle n is Pi(1 2 Pi)n21. A right censoredobservation at n months will contribute like-lihood (1 2 Pi)n. As with the continuous timemodel, left censoring of the conception riskinterval was handled by left truncation tothe beginning of the study period. The use of
Case Likelihood for continuous time model Likelihood for discrete time model
1 fi(t) t 5 tf 2 to 1 0.5 Pi(1 2 Pi)n 2 1 n 5 no2 fi(t) t 5 0.5 Pi(1 2 Pi)n 2 1 n 5 13 si(t) t 5 sf 2 to (1 2 Pi)n n 5 no 2 14 fi(t) t 5 tf 2 so 1 0.5 Pi(1 2 P)n 2 1 n 5 no5 si(t) t 5 sf 2 so (1 2 Pi)n n 5 no 2 16 fi(t) t 5 tf 2 so 1 0.5 Pi(1 2 Pi)n 2 1 n 5 no7 si(t) t 5 sf 2 so (1 2 Pi)n n 5 no 2 1
Fig. 1. Types of censored and uncensored observations (N 5 50) and corresponding likelihoodfunctions. Continuous time model: t, waiting time (in months) to conception or censoring; to, time of thefirst visit to the menstrual hut during the study; tf, time of the last visit to the menstrual hut during thestudy; so, time at which the study began; sf, time at which the study ended. fi(t) 5 liexp (2lit), si(t) 5exp (2lit), li 5 exp (2Xib) are the density function, the survival function, and the hazard rate of thewaiting time to conception for the ith woman. Discrete time model: n, number of trials; no, number ofobserved visits to the menstrual hut. Pi 5 exp (Xib)/1 1 exp (Xib) is the probability of conception in agiven cycle for the ith woman. Xi is the vector of covariates for the ith woman, and b is a vector ofregression coefficients.
170 B.I. STRASSMANN AND J.H. WARNER

logistic regression in this context is de-scribed by Allison (1995).
In the continuous time model, we mea-sured the waiting time to conception in unitsof 30 day months (rounded to the nearesttenth of a month). In the discrete timemodel, we counted the number of menstrualcycles that each woman experienced. (Thecorrelation coefficient between the waitingtime to conception in months and the num-ber of menstrual cycles was 0.93, P , 0.0001,N 5 50 women). Under the continuous timemodel, left censored observations were mea-sured from the beginning of the study, andright censored observations were measuredup to the end of the study. Under the discretetime model, left censored observations weremeasured from the first menstruation dur-ing the study, and right censored observa-tions were measured up to the last menstrua-tion during the study.
The definition of the end of postpartumamenorrhea required special consideration.In natural fertility populations, whethermenstruation usually precedes the first post-partum ovulation depends on the durationand intensity of breast-feeding (Perez et al.,1972). When amenorrhea lasts a median of20 months and supplemental foods are notintroduced until a child is 1 year of age, as inthe Dogon case, then it is more common formenstruation to precede ovulation (seeUdesky, 1950; Tietze, 1963; Perez et al.,1972). Even when the first ovulation occursprior to the first menstruation, endocrineabnormalities usually preclude the establish-ment of a viable pregnancy before the secondcycle (Diaz et al., 1992). Three women in ourstudy did, however, conceive before theymade a single postpartum visit to the men-strual hut. The Dogon are aware of therarity of such conceptions and assign aspecial name to a child conceived so promptly(Akunyon for a boy and Yakunyon for a girl).We assumed that postpartum amenorrheaended with the first postpartum menstrua-tion, except for the three observations whereconception actually preceded menstruation.It would have been useful to estimate thediminished fecundability of the month previ-ous to the first postpartum menstruation,and we attempted to do so, but our samplesize was inadequate for this task. The cycle
in which conception occurred also requiredspecial attention. In the continuous timemodel, we counted the time from the lastmenstruation to conception as 0.5 months.In the discrete time model, the same periodcorresponds to an additional trial. Figure 1shows how these definitions and decisionrules apply to our data.
A covariate was included in the final con-tinuous time model if it was significantaccording to the likelihood ratio test(a 5 0.05). To permit comparison, the finaldiscrete time model included the same co-variates as the continuous time model. Thesmall sample properties of maximum likeli-hood estimation may be in doubt; therefore,we used a Gibbs sampler to obtain exactsmall sample inferences (Gilks et al., 1996).The posterior means and standard devia-tions obtained through the Gibbs sampleragreed very closely with the maximum like-lihood parameter estimates and their stan-dard errors.
For the continuous time model, we as-sessed the importance of the covariate ef-fects by calculating the relative risk of con-ception, e2b, for a one unit increase in eachcovariate (b is the coefficient of the covariateunder consideration). For the discrete timemodel, we calculated the odds ratio for con-ception, eb. We also calculated fecundability,f, which can be expressed in terms of theexponential hazard rate, li, as f 5 1 2exp (2li). For the discrete time model, fe-cundability is directly available as Pi. Fi-nally, we plotted fecundability against wife’sage using age-adjusted means for each of thesignificant covariates in the continuous timemodel.
Independent variables
The independent variables that weretested for a significant association with thewaiting time to conception fall into fivecategories: 1) life history covariates, 2) lacta-tion, 3) nutrition, 4) economics, and 5) po-lygyny and marital status.
Life history covariates. These includeage of both spouses, marital duration, gravid-ity (number of previous pregnancies), andparity (number of previous births). Gravid-ity was a continuous variable (range 0–10)
171FECUNDABILITY OF DOGON WOMEN

representing the number of pregnancies awoman had experienced prior to the study.Parity was a binary variable (0 5 nullipa-rous, 1 5 parous) that enabled us to com-pare the results for the six nulliparouswomen in the study with those for the 44parous women. The above information wasdetermined from interviews using a ques-tionnaire on marital and reproductive histo-ries. The questionnaires were pretested on asubsample and cross-checked extensively.The age estimates are highly accurate be-cause Dogon males and females belong tonarrow age classes of two and a half or about2.5 years (one birth interval); they even keeptrack of birth order within each age class. Atthe time of the interviews, B.I.S. had livedmore than 2 years in the study population,spoke fluent Dogon, and knew each of therespondents individually. This familiarityenhanced the goodwill of the subjects andtheir willingness to respond accurately. Indi-rect remuneration in the form of first aidand assistance with a ‘‘self-help’’ develop-ment project also promoted subject coopera-tion (for details see Strassmann, 1996).
Lactation. Three covariates provided po-tential measures of breast-feeding: 1) nurs-ing status, 2) duration of postpartum amen-orrhea, and 3) sex of the last child. Nursingstatus is a categorical variable because itwas recorded as present or absent, but itsintensity was not measured. The duration ofpostpartum amenorrhea is a proxy for theintensity of nursing because it equals theage of the nursing child upon the resump-tion of menstruation. Among the Dogon,older children consume more supplementalfood and nurse less. Sex of the last child isexpected to be a significant covariate ofconception waits if there is a sex differencein nursing.
Nutrition. The nutritional covariates in-clude 1) the body mass index (wt/ht2), 2) thesum of the triceps, subscapular, and lateralcalf skinfold thicknesses, and 3) a binaryvariable that distinguished the women whowere undernourished from those who werein the normal range. This variable wasbased on the recommendations of Frisancho(1990), who defined women aged 18–45 years
as undernourished if the sum of the tricepsand subscapular skinfolds was 20.0 mm orless. The women were measured during thehunger season in June 1987 and July 1988when most families had already consumedthe millet and other cereal crops from theirprevious harvests and were living off pur-chased grain. Women supplemented theirdiets with wild berries or collected firewoodto sell at the market in exchange for smallbowls of rice. Thus, at the time of thenutritional status measurements, the popu-lation appeared to be chronically food-stressed. The women were measured at ap-proximately the same time of year, whichcontrolled for seasonal variation in nutri-tional status. All measurements were madeby a single individual, preventing interopera-tor error. To control for reproductive status,we excluded all the women who were notmeasured during cycling.
Economics. In a population of subsistencefarmers subject to food shortages, a woman’snutritional status may depend on her eco-nomic status. We therefore quantified theresources of each of the 59 different eco-nomic units in the village. We call theseeconomic units work-eat groups because theyare composed of the people (men, women,and children) who cultivated the same mil-let fields and who assembled in one com-pound to eat together. The economic statusof a Dogon woman depends on that of herwork-eat group. A married woman alwaysbelongs to the work-eat group of her hus-band, and she does not have a separateavenue to wealth. Work-eat groups are notcomparable to families because people haveclose relatives in other work-eat groups. Norare they comparable to households becausemembers of the same work-eat group oftensleep in different compounds. For example,adolescents often do not sleep in the samecompound as their parents, and cowivesmay have different compounds. Married menwho are close relatives may belong to thesame work-eat group but do not share thesame compound. The significance of a work-eat group lies in the economic interdepen-dence of its members, who share the samestandard of living.
172 B.I. STRASSMANN AND J.H. WARNER

The Dogon are subsistence farmers, soeconomic status depends on ownership offood resources: millet and other cereal cropsand to a lesser degree onions and livestock.We measured the 540 cereal fields (millet,sorghum, rice, fonio) and 422 onion fieldsbelonging to the 59 work-eat groups. Wecalculated field areas from angles and sidesusing a trigonometric calculator program.To calculate yields, we assigned a value of 1to 5 to each grain field to indicate therelative quality of the standing crop justbefore harvest; then we weighed the grain inrepresentative 25 m2 plots. Foot traffic toand from the fields must funnel across abridge. An observer posted at this bridgethroughout the 1987 harvest tallied all bas-kets of grain carried. We weighed basketsrepresentative of each size class. This proce-dure gave a second and independent assess-ment of each work-eat group’s yield in kilo-grams. The primary livestock of the Dogonare sheep and goats, but the wealthiestfamilies can afford cattle. Other animalsinclude donkeys, horses, and pigs. Wecounted each of these animals by sex andage (juvenile vs. adult).
About 5% of the economy of Sangui iscomposed of income from commerce (seebelow). Some men buy onions and resellthem to middlemen who sell them in theWest African cities of Bamako and Abidjan.Two men went to Bamako themselves to sellonions. One man regularly biked the 120 kmto Mopti on the Niger River to buy dried fishto resell at the local market. Another manwas a butcher. A Dogon assistant who isfamiliar with local commerce helped us toestimate the profit for each man.
To calculate the total economic assets ofeach work-eat group, we estimated the mon-etary value of each group’s cereals, onions,livestock, and revenues from commerce.These estimates are based on the prevailinglocal market prices for the various commodi-ties at the time of the fieldwork. Monetaryvalues are expressed in CFA, which is aWest African currency tied to the Frenchfranc. During the study period, 50 CFAequaled 1 FF. We then totaled the assets ofthe 59 work-eat groups to estimate theresource holdings for the entire village.
We computed seven different economicindices for each work-eat group because itwas unclear which would be the most infor-mative. With the exception of the third andseventh index, we divided the resources ofeach group by the estimated daily energyrequirement of its members in megajoules(MJ). These requirements depend on the ageand sex composition of each group and arebased on the recommendations of the FAO/WHO (1973). The economic indices are asfollows:
ECON1 5 cereal hectarage/MJ;ECON2 5 cereal CFA/MJ;ECON3 5 cereal CFA/cereal hectarage;ECON4 5 (cereal 1 onions 1 livestock
1 commerce) CFA/MJ;ECON5 5 [cereal 1 onions
1 0.07(livestock) 1 commerce] CFA/MJ;ECON6 5 [cereal 1 onions
1 0.07(livestock)1 0.07(commerce)] CFA/MJ;
ECON7 5 Economic rank of the work-eatgroup relative to the others.
The first index is the hectarage of cerealcrops planted divided by the energy require-ments. The second is the value of the cerealyield in CFA divided by the energy require-ments. The third index is the CFA value ofthe cereal yield per hectare, which is ameasure of land quality. The fourth indextotals the CFA value of all resources, givingequal weight to each type, and divides thesum by the energy requirements. The fifthindex is the same, except it weights thevalue of livestock by a factor of 0.07 to reflectonly the estimated value of milk and meatconsumed or sold. The sixth index is thesame as the fifth, except it also weights therevenues from commerce by a factor of 0.07since most of the commercial revenues donot enter the family food budget. Finally, theseventh index is the average rank of eachwork-eat group with respect to the othersacross the following five variables: cerealhectarage, onion hectarage, value of cerealyield, value of livestock, and revenues fromcommerce. The wealthiest group had a rank
173FECUNDABILITY OF DOGON WOMEN

of 59, and the poorest group had a rank ofone.
Polygyny and marital status. We ex-pressed the degree of polygyny in each work-eat group as the number of married malesdivided by the number of married females.This index ranged from 0.33 (three wives perman) to 1.0 (one wife per man). Anothervariable categorized a woman’s marital sta-tus as monogamously or polygynously mar-ried. A binary variable distinguished themarried women from the fiancees to permitus to test the assumption that the fianceeswere fully exposed to the risk of conception.A distinct marriage ceremony is absent, andit is normative for regular sexual relationswith a fiance (and preferably the birth of oneto three infants) to precede cohabitation.
Educational status. Only two of theadult men and none of the women in thevillage could read and write. Since very fewindividuals had completed even one year ofprimary school education, we did not includeeducational status as an independent vari-able.
RESULTS AND DISCUSSION
Thirty-three of the 50 women becamerecognizably pregnant during this study,and 25 women cycled without becomingpregnant (Fig. 1). Twenty-five of the womenwho became recognizably pregnant actuallydelivered during the study, and eight deliv-ered after the 736 day period of prospectiveobservation was over. Confirmation of thelatter deliveries (seven were live births, andone was a stillbirth) took place throughinterviews on the next field trip. Short preg-nancies that ended in miscarriage duringthe first trimester were not detected be-cause, in the menstrual hut census, suchpregnancies could not be distinguished fromcycle irregularity. Fecundability as mea-sured in this study is best described aseffective fecundability, although one infantwas stillborn (see Wood 1994).
Table 1 lists the mean, standard devia-tion, and number of women for whom datawere available for a particular variable.Table 2 shows the final continuous anddiscrete time models. The coefficients in the
two models are very similar with respect tomagnitude but are opposite in sign. Thisoccurs because the discrete time model esti-mates the cycle-wise odds of conception (Oi)for the ith woman as exp (Xib), whereas thecontinuous time analysis models the hazardrate (li) for the ith woman as exp (2Xb).When the cycle-wise probability of concep-tion is small, Oi and li are approximatereciprocals.
The continuous time model produced morehighly significant results than the discretetime model for six of the seven covariates(Table 2). This was expected because thecontinuous time model takes variability incycle length into account, whereas the dis-crete time model does not. Instead, eachcycle in the discrete model was counted asone trial, no matter how long or short.Natural variation in cycle length for a givenwoman is associated with anovulation. An-ovulatory episodes were particularly com-mon among the perimenopausal women andthe youngest women. Occult pregnanciesthat went unrecognized were probably an-other major cause of variability in cyclelength, especially among the most fecundwomen. Hormonal data indicated that, inthe village of Sangui, women did not go tothe menstrual hut during 12.5% of all men-ses, though they never were observed tomiss two visits in a row (Strassmann, 1996).Missed visits introduce more noise in thediscrete, cycle-wise analysis than in thecontinuous time analysis. Missed visitsshould not affect the continuous time analy-sis unless they occur at the beginning or endof the conception wait. If missed visits werefrequent at such times, then one wouldexpect that some of the women who wereostensibly in postpartum amenorrhea dur-ing the entire study and not using the hutswere in fact cycling. However, the hormonaldata disclosed no such cases (Strassmann,1996). In sum, natural variation in cyclelength and the difficulty of detecting 100% ofall menses over a 2 year period probablyexplain why the continuous time model gavea better fit—as assessed by smaller P valuesand smaller standard errors for the signifi-cant covariates.
We also fit a discrete time model in whichthe number of trials for each woman was
174 B.I. STRASSMANN AND J.H. WARNER

calculated from her waiting time to concep-tion in days (in the continuous time model)divided by 30 days. The results were moresimilar to those from the continuous timeanalysis than to those from the discrete timeanalysis in Table 2. We now turn to adiscussion of the covariates that were signifi-cant in the continuous time model at a 50.05, including wife’s age, wife’s age squared,husband’s age, marital duration, gravidity,and nursing.
Significant covariatesWife’s age. The negative coefficient for ageand the positive coefficient for age-squaredin the continuous time model (and the re-verse in the discrete time model) indicatethat conception waits had a U-shaped rela-tionship with age. Consistent with previousstudies (Bendel and Hua, 1978; Jain, 1969a;Wood et al., 1994), fecundability had aninverse U-shaped relationship with age. InFigure 2, fecundability is plotted againstwife’s age using age-adjusted means for theother significant covariates. Age-adjustedmeans for gravidity and marital durationwere obtained from linear regressions ofthese variables on age. Age-adjusted meansfor the ordinal variable, husband’s age, were
obtained from an ordinal logistic regression.(Age-squared was not significant in any ofthese regressions.) A logistic regression ofnursing status on age was not significant, sonursing status was estimated by its popula-tion mean. Figure 2 also shows the upperand lower 95% confidence limits for theage-specific values of fecundability. Theselimits were obtained from the estimatedcovariance matrix of the parameter esti-mates produced by the LIFEREG procedurein SAS. The age-specific changes in fecund-ability shown in Figure 2 may reflect changesin coital frequency, fecundity, and fetal loss.
As shown in Table 3, the age-specific val-ues for effective fecundability were similarin the continuous time model whether or notthe eight women older than 41 years wereincluded or excluded from the sample. Theestimated peak fecundability occurred fromage 26–29 and had the following values: 0.18(N 5 58) and 0.19 (N 5 50). In the discretemodel, peak fecundability was 0.13 (N 5 58)and 0.21 (N 5 50). When all covariates wereat their population means, the monthly prob-ability of conception for the 50 women in thecontinuous time model was 0.11, which cor-responds to a waiting time to conception of
TABLE 1. Independent variables tested for an association with the waiting time to conception
VariableN
(women) Mean SD
Wife’s age (years) 50 27.72 6.80Husband’s age (1 5 ,35, 2 5 35–49, 3 5 .49 years) 50 36.061 9.401
Marital duration (years) 50 4.38 5.66Gravidity (number of prior pregnancies) 50 3.3 2.57Parity (0 5 nulliparous, 1 5 parous) 50 0.88 0.33Nursing (0 5 no, 1 5 yes) 50 0.58 0.50Duration of postpartum amenorrhea (months) 20 20.10 7.22Sex of last child (0 5 male, 1 5 female) 44 0.34 0.48Nutritional status
Weight (kg)/height-squared (m) 24 21.18 1.43Sum of triceps, subscapular, and lateral calf skinfolds (mm) 24 24.63 5.89Sum of triceps 1 subscapular skinfolds (0 5 20.00 mm or
less, 1 5 greater than 20.00 mm) 24 0.71 0.46Economic status2
ECON1 50 278.64 81.34ECON2 50 751.46 273.84ECON3 50 0.04 0.02ECON4 50 3,349.66 1,866.67ECON5 50 2,140.46 788.65ECON6 50 1,943.52 600.63ECON7 50 40.42 12.05
Polygyny (number of married males/married females) 50 0.60 0.19Cowives (0 5 one or two, 1 5 none) 44 .16 0.37Marital status (0 5 fiancee, 1 5 married) 50 0.76 0.431 Mean and standard deviation for the continuous variable, the husband’s age in years.2 See text for definition of the seven economic indexes.
175FECUNDABILITY OF DOGON WOMEN

8.3 months. In the discrete time model(N 5 50), the probability of conception permenstrual cycle was 0.14, which corre-sponds to an expected waiting time of 7.3months.
These results can be compared with thosefor Western women who have undergoneartificial insemination. The inseminationstake place near the time of ovulation, whichcontrols for any effect on fecundability thatis due to coital frequency. In the Nether-lands, the cumulative pregnancy rate after12 menstrual cycles of insemination was0.75 (for women aged ,24 years), 0.72 (25–29years), 0.72 (30–34 years), and 0.49 (.34years) (van Noord-Zaadstra et al., 1991).These values correspond to fecundabilitiesof 0.11 (,24 years), 0.10 (25–34 years), and0.06 (.34 years). The lower fecundability ofthe Dutch women may be due to a number offactors, including the use of frozen semenand a tendency for less fecund women to useartificial insemination.
John et al. (1987) found that Bangladeshiwomen who were fully breast-feeding theirinfants upon the resumption of menses hada monthly probability of conception of about0.01. Women who had begun to wean theirinfants 4–6 months prior to the resumptionof menses had a probability of conception of0.06, and women who had ceased breast-feeding just before the resumption of menseshad a monthly probability of conception of
0.19. Other studies report higher fecundabil-ity, ranging from 0.14–0.31 (Wood, 1989).However, they measure the time from mar-riage to 9 months before the first birth andtherefore include only young, nonlactatingwomen with short marital durations, result-ing in a bias toward high fecundability.
Husband’s age. Figure 3A plots fecund-ability against wife’s age for three differentvalues of the husband’s age, with maritalduration and gravidity at their age-specificmeans and nursing at its population mean(nursing status did not vary with age). Ac-cording to the coefficients for husband’s agein the continuous time model (Table 2)(N 5 50), if the husband was younger than35 years, the relative risk of conception was7.3 (P 5 0.005) compared with couples inwhich the husband was 50 years or older,after controlling for the other significantcovariates. When the husband was 35–49years old, the relative risk of conception was4.0 (P 5 0.04) compared with couples inwhich the husband was 50 years or older(Fig. 3A). (The corresponding odds ratios inthe discrete time model, N 5 50, were 7.8and 5.8.) Most investigators disregard theeffect of husband’s age on fecundability onthe assumption that it is small in relation tothe effect of wife’s age and other covariates(see Goldman and Montgomery, 1989). Ourresults demonstrate that husband’s age is
TABLE 2. Independent variables significantly associated with the waiting time to conception
Independentvariables
Continuoustime model(N 5 58)1
Continuoustime model
(N 5 50)
Discretetime model(N 5 58)1
Discretetime model
(N 5 50)
Coefficient P Coefficient P Coefficient P Coefficient P
Wife’s age (years) 20.601 0.006 20.553 0.019 0.485 0.055 0.446 0.101Wife’s age-squared
(years) 0.011 0.003 0.010 0.011 20.009 0.027 20.009 0.056Husband’s age (,35
years)2 22.035 0.005 21.982 0.005 2.087 0.008 2.058 0.008Husband’s age (35–49
years)2 21.477 0.029 21.398 0.037 1.795 0.011 1.753 0.012Marital duration
(years) 0.183 0.002 0.179 0.003 20.182 0.028 20.181 0.032Gravidity (number of
prior pregnancies) 20.550 0.010 20.543 0.011 0.551 0.056 0.551 0.060Nursing (0 5 no,
1 5 yes) 20.741 0.052 20.744 0.051 0.653 0.126 0.655 0.125Intercept 12.652 — 11.984 — 210.809 — 210.268 —22 log likelihood 129.094 — 128.518 — 179.656 — 179.317 —1 This model includes eight women, aged 42–53.2 Compared to the omitted category, husband’s age .49 years.
176 B.I. STRASSMANN AND J.H. WARNER

an important predictor of fecundability, re-gardless of whether the sample includedwomen aged 16–41 years (whose husbandsranged in age from 21–57 years) or womenaged 16–53 years (whose husbands were21–64 years). The relative contributions ofcoital frequency, deteriorating health, andreproductive senescence, all of which areinterrelated, remain a problem for the fu-ture. A selection bias may also exist suchthat less fecund women are more likely tomarry men who are much older. In thisstudy, however, the potential for such a biaswas lessened by the exclusion of women whowere prematurely sterile (younger than age
42 but had not given birth in the past 5years). Although we cannot identify themechanism behind the effect for husband’sage, these results empirically support thesuggestion (Campbell and Leslie, 1995)that human reproductive ecologists need toconsider the male contribution to reproduc-tion.
Marital duration. The waiting time toconception increased with marital duration.This effect is shown in Figure 3B, in whichfecundability is plotted against wife’s agewith marital duration, husband’s age, andgravidity at their age-specific means andnursing at its population mean. Figure 3Balso shows the relationship with fecundabil-ity when marital duration is half a standarddeviation above or below its age-adjustedmean. Based on the coefficient for maritalduration in the continuous time model (Table2) (N 5 50), a 1 year increase in maritalduration was associated with a relative riskof conception of 0.84 after controlling forwife’s age, husband’s age, gravidity, and
Fig. 2. Fecundability by wife’s age, with the other significant covariates at their age-adjusted means(continuous time model, N 5 50 women). The broad confidence intervals at the extremes of the agedistribution are due to small sample size (below age 20, N 5 5; above age 40, N 5 2). When the eightwomen older than 41 years are included, the confidence intervals become tighter between ages 30 and 40years and wider between ages 15 and 25 years.
TABLE 3. Effective fecundability by age
Age
Continuous time model Discrete time model
N 5 58 N 5 50 N 5 58 N 5 50
15 0.03 0.03 0.03 0.0520 0.10 0.10 0.08 0.1325 0.17 0.18 0.12 0.2030 0.17 0.18 0.12 0.2035 0.08 0.11 0.07 0.1340 0.02 0.03 0.02 0.05
177FECUNDABILITY OF DOGON WOMEN
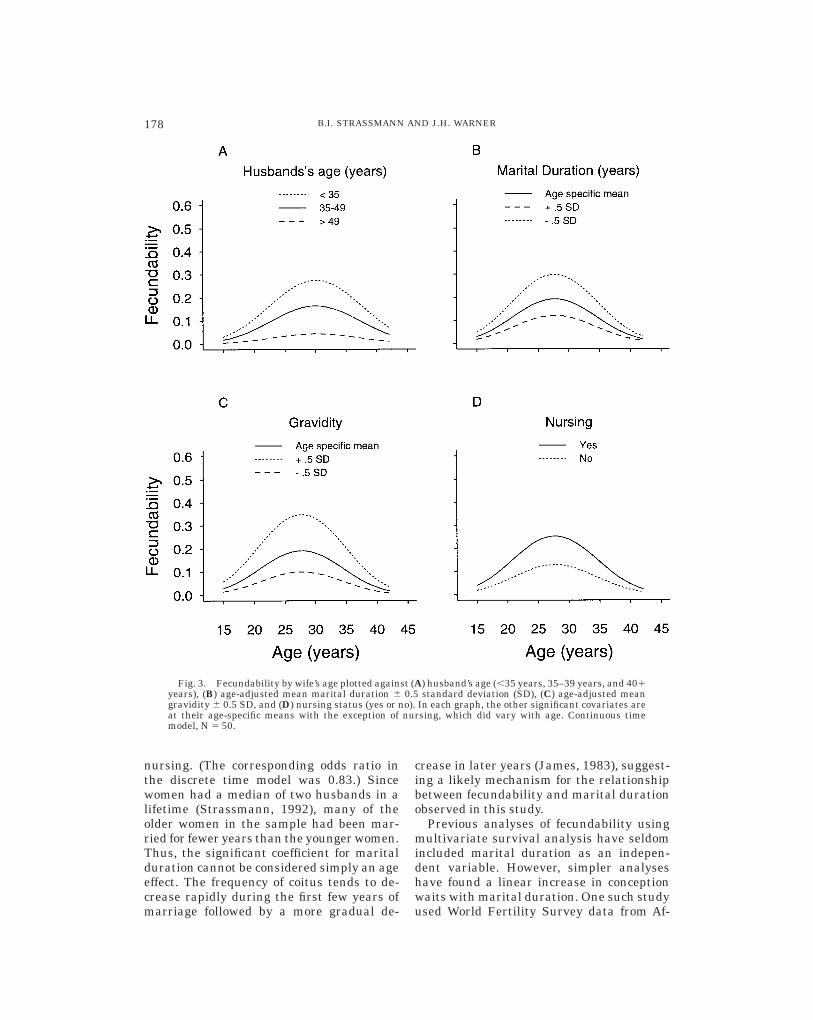
nursing. (The corresponding odds ratio inthe discrete time model was 0.83.) Sincewomen had a median of two husbands in alifetime (Strassmann, 1992), many of theolder women in the sample had been mar-ried for fewer years than the younger women.Thus, the significant coefficient for maritalduration cannot be considered simply an ageeffect. The frequency of coitus tends to de-crease rapidly during the first few years ofmarriage followed by a more gradual de-
crease in later years (James, 1983), suggest-ing a likely mechanism for the relationshipbetween fecundability and marital durationobserved in this study.
Previous analyses of fecundability usingmultivariate survival analysis have seldomincluded marital duration as an indepen-dent variable. However, simpler analyseshave found a linear increase in conceptionwaits with marital duration. One such studyused World Fertility Survey data from Af-
Fig. 3. Fecundability by wife’s age plotted against (A) husband’s age (,35 years, 35–39 years, and 401years), (B) age-adjusted mean marital duration 6 0.5 standard deviation (SD), (C) age-adjusted meangravidity 6 0.5 SD, and (D) nursing status (yes or no). In each graph, the other significant covariates areat their age-specific means with the exception of nursing, which did vary with age. Continuous timemodel, N 5 50.
178 B.I. STRASSMANN AND J.H. WARNER

rica, Latin America, Southern Asia, and theMiddle East (Goldman et al., 1987).
Gravidity. When gravidity was the solecovariate, its coefficient was positive in thecontinuous time model due to confoundingwith other covariates. After controlling forage of the spouses, marital duration, andnursing status, the coefficient for graviditybecame negative, indicating that womenwho had many previous pregnancies hadshorter conception waits. The relationshipbetween fecundability and the wife’s age isshown in Figure 3C for three values ofgravidity: the age-specific mean and half astandard deviation above and below theage-specific mean. Based on the coefficientfor gravidity in the continuous time model(Table 2) (N 5 50), the relative risk of concep-tion for each additional prior pregnancy was1.7. (The corresponding odds ratio in thediscrete time model was also 1.7.) Nonethe-less, it is unlikely that higher graviditycauses shorter conception waits. Instead,gravidity is probably correlated with addi-tional, unmeasured variables that have adirect influence on fecundability. Althoughthe association between gravidity and fe-cundability is unlikely to be causal, it isclear that in the study village a woman’spast fecundability is a good predictor of herfuture fecundability. This association hasbeen widely recognized in preindustrial soci-eties and explains why people judge a wom-an’s fecundity from her past reproductiveperformance.
If maternal somatic reserves become de-pleted over a succession of pregnancies, theso-called maternal depletion syndrome (Jel-liffe and Maddocks, 1964; Tracer, 1991),then a reduction in fecundability might beexpected. The magnitude of the relationshipshould depend on the sensitivity of fecund-ability to nutritional status or other mea-sures of maternal depletion. Our results donot refute the concept of maternal depletionbut suggest that, if this phenomenon isoccurring in the study population, then ei-ther it does not affect the waiting time toconception or the effect is so small it ismasked by other factors. Rather than adecline in fecundability with increasing gra-vidity, we see an increase in fecundability.
Popkin et al. (1993) found that higherparity predicts longer conception waits. How-ever, Popkin et al. may not have entirelycontrolled for the confounding variable, ma-ternal age, because they treated age as adichotomous rather than a continuous vari-able. They also did not control for maritalduration. Adequate controls for both age andmarital duration are essential when testingfor an association between parity (or gravid-ity) and conception waits. When we omittedthese two controls from our models, weobtained the misleading result that womenof higher gravidity had longer conceptionwaits. Perhaps the coefficient for parity inPopkin et al.’s study would also change signif they controlled for marital duration andspecified age as a continuous variable.Larsen and Vaupel (1993) reported thatfecundability in North American Hutteritesdeclined by about 25% from parity zero toparity one and then approximately leveledoff at higher parities. However, marital dura-tion was not controlled, and the standarderrors for the estimates were large.
Nursing. Nursing status was a dichoto-mous variable, with 0 indicating that awoman was not nursing and 1 indicatingthat she was nursing. In the continuoustime model (Table 2) (N 5 50), the relativerisk of conception was higher by a factor of2.1 if a woman was nursing after controllingfor age of both spouses, marital duration,and gravidity. (In the discrete time model,the corresponding odds ratio was 1.9.) Fig-ure 3D plots fecundability by wife’s age andnursing status with the other significantcovariates at their age-specific means. Thefinding that fecundability was higher innursing women is surprising and at firstappears contradictory to the results of previ-ous studies (e.g., John et al., 1987; Goldmanet al., 1987; McNeilly et al., 1982; Singh etal., 1993). However, a closer examination ofthe data offers an explanation. Dogon womennurse throughout the entire waiting time toconception and sometimes even nursethroughout the subsequent pregnancy. Theconsequence is that any woman in our studywho was not nursing was either 1) less atrisk for conception or 2) her previous infanthad died. Thus, when a sample is split into
179FECUNDABILITY OF DOGON WOMEN

the women who are nursing and the womenwho are not nursing, it is also therebydichotomized into a more at risk group and aless at risk group. Lactation was also associ-ated with shorter conception waits amongCebu women of the Philippines (Popkin etal., 1993); we suggest that the same explana-tion may apply.
Nonsignificant covariates
To verify that age was the only covariatewith a significant quadratic effect, we alsotested marital duration–squared and gravid-ity-squared in the final model, but neitherwas significant. Interactions between ageand marital duration, gravidity, and nursingalso were not significant. Other independentvariables that were not significantly associ-ated with conception waits are presented inTable 4. Each of these covariates was indi-vidually adjusted for the significant covari-ates in Table 2. We will discuss each of thenonsignificant variables in turn.
Duration of postpartum amenorrhea.The duration of postpartum amenorrheawas not significantly associated with thewaiting time to conception. However, afterwe excluded cases in which the infant diedor the duration of postpartum amenorrheawas censored, the sample size was reducedto 20 women. The use of techniques for theanalysis of data in which both the dependentand the independent variables are censoredwould have seriously complicated the analy-sis. In previous studies, longer periods ofpostpartum amenorrhea were associatedwith an increased monthly probability ofconception (John et al., 1987). However, thisrelationship was not found among womenwho breast-fed for at least 9 months afterthe resumption of menses (Singh et al.,1993).
Sex of the last child. The coefficient forsex of the last child implies that the birth ofa daughter (instead of a son) is associatedwith a relative risk of conception of 1.7(continuous time model) and 2.1 (discretetime model) after controlling for the signifi-cant covariates. However, the coefficient wasnot significant in either model. Conspicuoussex-biased investment in infants, such as
female infanticide, was absent in the studyvillage. We cannot exclude the possibility ofmore subtle forms of sex bias in some fami-lies. For example, perhaps daughters aresometimes nursed less intensively than sons,or they may of their own accord suckle less.
Nutritional status. After we excluded in-dividuals who were not measured duringcycling, we had cross-sectional anthropomet-ric data on only 24 women, which is a smallsample. Nonetheless, this sample includesalmost half of the fecundable women in thestudy village over a 2 year period. Therefore,it is reasonably large with respect to thepopulation to which we are drawing infer-ences. Seven of the 24 women met thecriterion for undernourishment (combinedthickness of the triceps and subscapularskinfolds ,20 mm). This variable (0 5 nor-mal, 1 5 undernourished), the body massindex (wt/ht2), and the sum of three skin-folds (triceps, subscapular, and lateral calfin millimeters) were not significant in eithermodel.
Similarly, in Bangladesh and Guatemala,no significant correlation was found be-tween the mean waiting time to conceptionand anthropometric measures (Chowdhury,1978; Bongaarts and Delgado, 1979). Caloricintake, measured during a nutritional inter-vention program in Guatemala, also did notaffect mean waiting times to conception(Delgado et al., 1982). In rural Bangladesh,neither height nor body mass index (wt/ht2)was related to fecundability (John et al.,1987). A significant association was foundbetween nutritional status and both the riskof intrauterine mortality and the duration ofpostpartum amenorrhea, but no associationwas found between nutritional status andthe probability of conception during cycling(Ford et al., 1989).
Extreme energy deprivation, such as oc-curs during famines, has a demonstrableeffect on fecundity (Bongaarts, 1980; Steinand Susser, 1978). Moreover, clinical andendocrinological studies demonstrate thatovarian function is constrained by energybalance (Warren, 1983; Ellison et al., 1993).Nonetheless, subtle forms of undernutritiondo not appear to be a major cause of varia-tion in conception waits within populations.
180 B.I. STRASSMANN AND J.H. WARNER

Economic status. The total economic re-sources of the study village are shown inTable 5. Accurate and objective measures ofeconomic status were a priority of the pre-sent study, but among the seven economicindexes only ECON2 (CFA value of thecereal crop/MJ) was significantly associatedwith the waiting time to conception. Accord-ing to ECON2, women in wealthier work-eatgroups had longer conception waits(P 5 0.045) in the continuous time model,but no significant effect was found forECON2 in the discrete time model. Giventhat six of the seven indices were not signifi-cant, economic status does not appear to be agood predictor of fecundability in our studypopulation. The heterogeneity of the samplewas substantial (Table 1), with some womenbelonging to work-eat groups that had sur-plus wealth in the form of cattle, and othersbelonging to work-eat groups in which hun-ger was a significant threat. Women in poorerwork-eat groups tended to work harder(Strassmann, unpublished data), but we de-tected no effect on conception waits. Eco-nomic differences might be expected to influ-ence fecundability through effects onnutritional status, coital frequency, or breast-feeding, but we found no evidence for theseeffects.
Jain (1969b) reported that fecundabilityamong Taiwanese women was positively as-
sociated with socioeconomic status after con-trolling for age and marital duration in amultiple regression. In a hazards analysis,John et al. (1987) found no relationshipbetween economic status, as determinedfrom interviews, and fecundability in ruralBangladesh. Ford et al. (1989) found thattwo indicators of socioeconomic status, reli-gion and husband’s occupation, were notassociated with the waiting time conception.In Uttar Pradesh, India, an index of house-hold social status was not significantly re-lated to conception waits in multivariatesurvival models (Singh et al., 1993; Nath etal., 1994). Upper-caste Hindus, however,had longer conception waits than lower-caste Hindus and Muslims. With the excep-tion of this last result, survival analyseshave found that economic status is not animportant determinant of the variance inconception waits within populations.
Marital status and polygyny. Fianceshad shorter conception waits than marriedwomen (although not significantly so), indi-cating that it was appropriate to include thefiances in the at risk group. The maximumnumber of wives for a given man was three,and the mean 6 standard deviation for theratio of married males to married females ina work-eat group was 0.60 6 0.19. This ratiowas not a significant predictor of the waiting
TABLE 4. Nonsignificant covariates individually adjusted for the significant covariates in Table 2 (N 5 50)1
Independent variables
Continuous time Discrete time
Coefficient(standard error) P
Coefficient(standard error) P
Parity (0 5 nulliparous, 1 5 parous) 0.765 (1.033) 0.459 21.384 (1.153) 0.230Duration of postpartum amenorrhea (months) 0.018 (0.076) 0.815 20.008 (0.077) 0.916Sex of last child (1 5 male, 2 5 female) 20.553 (0.461) 0.231 0.737 (0.521) 0.187Nutritional status
Body mass index (wt/ht2) 0.096 (0.269) 0.722 20.279 (0.300) 0.353Sum of three skinfolds (mm) 0.039 (0.079) 0.618 20.166 (0.109) 0.129Normal 5 0, undernourished 5 1 0.361 (0.914) 0.693 20.849 (0.985) 0.389
Economic statusECON1 0.009 (0.023)2 0.686 20.015 (0.028)2 0.579ECON2 0.152 (0.076)2 0.045 20.081 (0.087)2 0.349ECON3 0.015 (0.030)2 0.616 20.012 (0.036)2 0.746ECON4 0.008 (0.010)2 0.416 20.008 (0.012)2 0.501ECON5 20.003 (0.241)2 0.990 0.140 (0.308)2 0.650ECON6 19.300 (12.416) 0.120 210.403 (13.258) 0.433ECON7 0.015 (0.014) 0.288 20.017 (0.017) 0.320
Polygyny index (number of married males/number of married females) 20.566 (1.058) 0.593 20.052 (1.278) 0.968
Cowives (0 5 one or two, 1 5 none) 0.726 (0.537) 0.176 21.200 (0.662) 0.070Marital status (0 5 fiancee, 1 5 married) 1.083 (0.714) 0.129 20.971 (0.819) 0.2361 Coefficients and standard errors are for an increase of one unit unless otherwise indicated.2 For an increase of 100 units.
181FECUNDABILITY OF DOGON WOMEN

time to conception. Similarly, the number ofcowives (0 5 one or two, 1 5 none) did notpredict a woman’s waiting time, althoughthis variable approached significance in thediscrete model.
Demographic studies have sometimes(Dorjahn, 1958; Bean and Mineau, 1986) butnot always (Chojackna, 1980; BorgerhoffMulder, 1989) found that polygyny is associ-ated with lower female fertility. Before thepossibility that polygyny causes reductionsin female fertility can be resolved for anyparticular population, two confounding is-sues need to be addressed: 1) marriages oflow fertility may be more likely to becomepolygynous, and 2) women of low prior fertil-ity may be more likely to become juniorwives in polygynous unions (Pebley andMbugua, 1989). It is difficult to control forthese possibilities using retrospective dataon fertility. However, the absence of a signifi-cant relationship between polygyny and con-ception waits in our study, in which concep-tion waits were monitored prospectively,implies that such a relationship did not existin our study population.
CONCLUSIONS
This study used survival analysis to iden-tify the significant covariates of the waitingtime to conception in a Dogon village inMali, West Africa. Through microdemo-graphic research on a small but high-qualitysample, we gained five distinct methodologi-cal advantages: 1) the calculation of concep-
tion waits from prospective data on men-strual cycling, 2) the inclusion of conceptionwaits in both nulliparous and parous womenas well as conception waits in women whowent directly from amenorrhea to preg-nancy, 3) unusually accurate data on mari-tal and reproductive histories obtained bythe anthropological approach of living withthe study population for 2.5 years, learningthe language, and gaining subject confi-dence, 4) economic data derived from directmeasurement rather than from interviews,and 5) the opportunity to measure numer-ous covariates seldom simultaneously mea-sured in large surveys and therefore notadequately tested in previous studies. In ourestimation, these advantages more than off-set the benefits of standard demographicsurvey methods: large sample size and thepossibility of drawing inferences to largerpopulations.
If one wishes to identify a woman from thestudy village who is expected to have arelatively short conception wait, then, ac-cording to these results, one should choose ayoung woman in a recent union with a youngman. She should have had many pregnan-cies for her age and been demonstrablyfecund in her recent past, as evidenced bythe fact that she is nursing. One should payless heed to the following: nulliparity vs.multiparity, duration of postpartum amenor-rhea, sex of her last child, nutritional status,economic status, polygyny, and marital sta-tus (fiancee vs. married).
Perhaps the most striking result of thisstudy is that, although we controlled formany different variables, heterogeneity infecundability captured by the proxy vari-ables gravidity and nursing status was sub-stantial. The nature of this heterogeneityshould be the subject of future investiga-tions but might include genetic/ontogeneticinfluences not yet identified by human biolo-gists. Familial patterns of fertility and subtlereproductive health risks over the life spanare two new research directions. Personalitydifferences might influence coital frequencyand also play a role. For nearly two decades,debate has narrowly focused on a smallnumber of parameters, such as nutritionand lactation, while other variables remainto be discovered. To elucidate these vari-
TABLE 5. Economic resources of Sangui in 1987
Resource QuantityCFA1
value
Cereal cropsGrain 42,000 kg 3,150,000Land 127 ha —Yield 330 kg/ha —
OnionsBulbs and stems — 4,160,000Land 4 ha —
LivestockCattle 89 head —Sheep 141 head —Goats 269 head —Other 12 head —
Total 511 head 6,070,000
Commerce — 740,000
Total — 14,120,0001 Approximately 310 CFA/dollar in 1987.
182 B.I. STRASSMANN AND J.H. WARNER
Article ID # 916@xyserv1/disk8/CLS_liss/GRP_phan/JOB_phan105-2/DIV_916z06 swei
ables, comprehensive high quality data setswill be needed.
ACKNOWLEDGMENTS
B.I.S. thanks the Dogon of Sangui fortheir outstanding cooperation and friend-ship and Dr. Klena Sanogo of the Institutdes Sciences Humaines, Bamako, for facili-tating the research. Sally Slocum, ThomasStevenson, the US Peace Corps, Mali, andespecially Sylvie Moulin provided indefati-gable assistance in the field. Brenda Gillespieand James Wood helped guide the statisticalanalyses, and we appreciate their adviceand input. Richard Alexander, Conrad Kot-tak, Richard Wrangham, Peter Smouse, andClaudius Vincenz offered helpful comments.The field work was supported by the LSBLeakey Foundation, NSF BNS-8612291, andthe University of Michigan.
LITERATURE CITED
Allison P (1995) Survival Analysis Using the SAS Sys-tem: A Practical Guide. Cary, NC: SAS Institute, Inc.
Baird DD, Weinberg CR, Schwingl P, and Wilcox AJ(1994) Selection bias associated with contraceptivepractice in time-to-pregnancy studies. In KL Camp-bell and JW Wood (eds.): Human Reproductive Ecol-ogy: Interactions of Environment, Fertility, and Behav-ior. Annals of the New York Academy of Sciences709:156–164.
Bean LL, and Mineau GP (1986) The polygyny-fertilityhypothesis: A re-evaluation. Pop. Stud. 40:67–81.
Bendel JP, and Hua C (1978) An estimate of the naturalfecundability ratio curve. Soc. Biol. 25:210–227.
Bongaarts J (1980) Does malnutrition affect fecundity?A summary of evidence. Science 208:564–569.
Bongaarts J, and Delgado H (1979) Effects of nutritionalstatus on fertility in rural Guatemala. In H Leridonand J Menken (eds.): Natural Fertility. Liege: OrdinaEditions, pp. 107–133.
Bongaarts J, and Potter RG (1983) Fertility, Biology, andBehavior: An Analysis of the Proximate Determi-nants. New York: Academic Press.
Borgerhoff Mulder M (1989) Marital status and repro-ductive performance in Kipsigis women: Reevaluatingthe polygyny-fertility hypothesis. Pop. Stud. 43:285–304.
Campbell BC, and Leslie PW (1995) Reproductive ecol-ogy of human males. Yrbk. Phys. Anthropol. 38:1–26.
Chojackna H (1980) Polygyny and the rate of populationgrowth. Pop. Stud. 34:91–107.
Chowdhury AKMA (1978) Effect of maternal nutritionon fertility in rural Bangladesh. In WH Mosley (ed.):Nutrition and Human Reproduction. New York: Ple-num Press, pp. 401–410.
Delgado HL, Martorell R, and Klein RE (1982) Nutri-tion, lactation, and birth interval components in ruralGuatemala. Am. J. Clin. Nutr. 35:1468–1476.
Diaz S, Cardenas H, Brandeis A, Miranda P, SalvatierraAM, and Croxatto HB (1992) Relative contributions ofanovulation and luteal phase defect to the reducedpregnancy rate of breastfeeding women. Fertil. Steril.58:498–503.
Dorjahn VR (1958) Fertility, polygyny and their inter-relationships in Temne society. Am. Anthro. 60:838–860.
Elandt-Johnson RC, and Johnson NL (1980) SurvivalModels and Data Analysis. New York: John Wiley andSons.
Ellison PT, Panter-Brick C, Lipson SF, and O’RourkeMT (1993) The ecological context of human ovarianfunction. Hum. Reprod. 8:2248–2258.
FAO/WHO (1973) Energy and Protein Requirements.Report of a Joint FAO/WHO Ad Hoc Expert Commit-tee. FAO Nutrition Meetings Report Series, No. 22.WHO Technical Report Series, No. 522. Rome: FAOand WHO.
Ford K, Huffman SL, Chowdhury AKMA, Becker S,Allen H, and Menken J (1989) Birth-interval dynam-ics in rural Bangladesh and maternal weight. Demog-raphy 26:425–437.
Frisancho AR (1990) Anthropometric Standards for theAssessment of Growth and Nutritional Status. AnnArbor: University of Michigan Press.
Gilks WR, Richardson S, and Spiegelhalter DJ (eds.)(1996) Markov Chain Monte Carlo in Practice. Lon-don: Chapman and Hall.
Goldman N, and Montgomery M (1989) Fecundabilityand husband’s age. Soc. Biol. 36:146–166.
Goldman N, Westoff CF, and Paul LE (1985) Estimationof fecundability from survey data. Stud. Fam. Plann.16:252–259.
Goldman N, Westoff CF, and Paul LE (1987) Variationsin natural fertility: The effect of lactation and otherdeterminants. Pop. Stud. 41:127–146.
Henry L (1961) Some data on natural fertility. EugenicsQuarterly 8:81–91.
Jain AK (1969a) Fecundability and its relation to age ina sample of Taiwanese women. Pop. Stud. 23:69–85.
Jain AK (1969b) Socioeconimic correlates of fecundabil-ity in a sample of Taiwanese women. Demography6:75–90.
James WH (1983) Decline in coital rates with spouses’ages and duration of marriage. J. Biosoc. Sci. 15:83–87.
Jelliffe DB, and Maddocks I (1964) Notes on ecologicmalnutrition in the New Guinea Highlands. Clin.Pediatr. 3:432–438.
John AM, Menken JA, and Chowdhury AKMA (1987)The effects of breastfeeding and nutrition on fecund-ability in rural Bangladesh: A hazards-model analy-sis. Pop. Stud. 41:433–446.
Kalbfleisch JD, and Prentice RL (1980) The StatisticalAnalysis of Failure Time Data. New York: John Wileyand Sons.
Larsen U and Vaupel JW (1993) Hutterite fecundabilityby age and parity: Strategies for frailty modeling ofevent histories. Demography 30:81–102.
Lawless JF (1982) Statistical Models and Methods forLifetime Data. New York: John Wiley and Sons.
McNeilly AS, Howie PW, Houston MJ, Cook A, and BoyleH (1982) Fertility after childbirth: Adequacy of post-partum luteal phases. Clin. Endocrinol. 17:609–615.
Nath DC, Land KC, and Singh KK (1994) The role ofbreast-feeding beyond postpartum amenorrhoea onthe return of fertility in India: A life table and hazardsmodel analysis. J. Biosoc. Sci. 26:191–206.
Pebley A and Mbugua W (1989) Polygyny and fertility inSub-Saharan Africa. In R Lesthaege (ed.): Reproduc-tion and Social Organization in Sub-Saharan Africa.Berkeley: University of California Press.
Perez A, Vela P, Masnick GS, and Potter RG (1972) Firstovulation after childbirth: The effect of breast-feeding.Am. J. Obstet. Gynecol. 114:1041–1047.
183FECUNDABILITY OF DOGON WOMEN
Article ID # 916@xyserv1/disk8/CLS_liss/GRP_phan/JOB_phan105-2/DIV_916z06 swei

Popkin BM, Guiley DK, Akin JS, Adair LS, Udry JR, andFlieger W (1993) Nutrition, lactation, and birth spac-ing in Filipino women. Demography 30:333–352.
SAS (1988) SAS/STAT User’s Guide, Release 6.03 ed.Cary, NC: SAS Institute Inc.
Singh KK, Suchindran CM, and Singh K (1993) Effectsof breast feeding after resumption of menstruation onwaiting time to next conception. Hum. Biol. 65:71–86.
Stein Z, and Susser M (1978) Famine and Fertility. InWH Mosley (ed.): Nutrition and Human Reproduc-tion. New York, Plenum Press, pp. 123–145.
Strassmann BI (1992) The function of menstrual taboosamong the Dogon: Defense against cuckoldry? HumanNature 3:89–131.
Strassmann BI (1996) Menstrual hut visits by Dogonwomen: A hormonal test distinguishes deceit fromhonest signaling. Behavioral Ecology 7:304–315.
Strassmann BI (1997) The biology of menstruation inHomo sapiens: Total lifetime menses, fecundity, andnonsynchrony in a natural fertility population. Cur-rent Anthropology 38:123–129.
Tietze C (1963) The effect of breastfeeding on the rate ofconception. In: Proceedings of the International Popu-lation Conference, Vol. 2, New York, 1961. London:The International Union for the Scientific Study ofPopulation, pp. 129–136.
Tracer DP (1991) Fertility related changes in maternalbody composition among the Au of Papua New Guinea.Am. J. Phys. Anthropol. 85:393–405.
Tuma NB, and Hannan MT (1984) Social Dynamics:Models and Methods. New York: Academic Press.
Udesky IC (1950) Ovulation in lactating women. Am. J.Obstet. Gynecol. 59:843–851.
van Noord-Zaadstra BM, Looman CW, Alsbach H,Habbema JD, te Velde ER, and J Karbaat (1991)Delaying childbearing: Effect of age on fecundity andoutcome of pregnancy. BMJ 302:1361–1365.
Warren MP (1983) Effects of undernutrition on reproduc-tive function in the human. Endocr. Rev. 4:363–377.
Wood JW (1989) Fecundity and natural fertility inhumans. In SR Milligan (ed.): Oxford Reviews ofReproductive Biology. Oxford: Oxford University Press,pp. 61–109.
Wood JW (1994) Dynamics of Human Reproduction:Biology, Biometry, Demography. New York: Aldine deGruyter.
Wood JW, Holman DJ, Weiss KM, Buchananan AV, andLeFor B (1992) Hazards models for human biology.Yrbk. Phys. Anthropol. 35:43–87.
Wood JW, Holman DJ, Yashin AI, Peterson RJ, Wein-stein M, and Chang MC (1994) A multistate model offecundability and sterility. Demography 31:403–426.
184 B.I. STRASSMANN AND J.H. WARNER
Article ID # 916@xyserv1/disk8/CLS_liss/GRP_phan/JOB_phan105-2/DIV_916z06 swei


![Julio Arrieta [=] Dogon, un misterio inexistente](https://img.pdfslide.net/doc/110x75/577c7bc81a28abe0549850f5/julio-arrieta-dogon-un-misterio-inexistente.jpg)

