Embed Size (px)
Citation preview
An international comparison
Janine Chapman
Predictors of pro-environmental behaviour in 1993 and 2010
© December 2013
Published by the Centre for Work + Life University of South Australia http://www.unisa.edu.au/hawkeinstitute/cwl/default.asp
Street Address St Bernards Road Magill SA 5072 Adelaide
Postal Address GPO Box 2471 Adelaide, SA 5001 Australia
Author Janine Chapman
Title Predictors of pro-‐environmental behaviour in 1993 and 2010: An international comparison
ISBN: 978-‐0-‐9875120-‐2-‐4
Citation Chapman, J. (2013). Predictors of pro-‐environmental behaviour in 1993 and 2010: An international comparison. Adelaide: Centre for Work + Life, University of South Australia.
Acknowledgements This report is part of a larger project ‘Work life and sustainable living: how work, household and community life interact to affect environmental behaviours and outcomes’, funded by the Australian Research Council (LP100200524) and industry partners Zero Waste SA, Urban Renewal Authority, Community and Public Sector Union and State Public Services Federation. Responsibility for the final text rests with the author.
This report uses data from the International Social Survey Program Environment I (1993) and Environment III (2010) surveys. The findings and views reported in this report, however, are those of the author and should not be attributed to the ISSP.
2
Contents Tables ..................................................................................................................................................... 3
Figures ................................................................................................................................................... 3
Summary of findings .............................................................................................................................. 4
Introduction ........................................................................................................................................... 6
Part 1: International comparison of ISSP Environment I and III ............................................................ 7
Method .............................................................................................................................................. 7
Findings .............................................................................................................................................. 8
General importance of environmental issues ................................................................................ 8
Environmental concern and knowledge ........................................................................................ 9
Willingness to make trade-‐offs in order to protect the environment ........................................... 9
Beliefs about the dangers of specific environmental problems .................................................. 10
Behaviours to protect the environment ...................................................................................... 11
Part 1 Summary ............................................................................................................................... 11
Main areas of change from 1993-‐2010 ....................................................................................... 12
Part 2: Predictors of environmental behaviours 1993 and 2010 ......................................................... 13
Method ............................................................................................................................................ 13
Findings ............................................................................................................................................ 15
Predictors of recycling 1993 and 2010 ........................................................................................ 15
Predictors of cutting back on car use 1993 and 2010 .................................................................. 17
Predictors of energy saving 2010 ................................................................................................ 19
Predictors of water saving 2010 .................................................................................................. 20
Conclusion ........................................................................................................................................... 22
Appendix 1: Variables used in analysis ................................................................................................ 23
3
Tables Table 1: 1993 and 2010 demographic, household and work-‐related variables .................................... 7 Table 2: Level of concern and knowledge in five countries in 2010 ...................................................... 9 Table 3: Willingness to make trade-‐offs in five countries in 1993 and 2010 ......................................... 9 Table 4: Beliefs about dangers of environmental issues in five countries in 1993 and 2010 .............. 10 Table 5: Frequency of pro-‐environmental behaviours in five countries in 1993 and 2010 ................. 11 Table 6: 1993 and 2010 employee variables ....................................................................................... 14
Figures Figure 1: Summary of predictors of recycling behaviour in 1993 and 2010 ........................................ 16 Figure 2: Summary of predictors of car use behaviour in 1993 and 2010 ........................................... 18 Figure 3: Summary of predictors of energy saving behaviour in 2010 ................................................ 20 Figure 4: Summary of predictors of water saving behaviour in 2010 .................................................. 21
4
Summary of findings Part 1: Description and comparison of environmental issues
7316 respondents from Australia, the UK, US, Norway and Japan completed the International Social Survey Program (ISSP) Environment I survey in 1993, and 6993 completed the ISSP Environment III in 2010. The surveys ask a series of questions relating to environmental behaviours and attitudes, alongside demographic, work and household data. The average age of respondents in 1993 was 45 years, and 50 years in 2010.
• When asked to choose the most important issue for their country, 9.4% of Australians selected ‘the environment’ in 2010. This was higher than all other countries except Norway, where 17.7% ranked the environment as the most important issue. Very few respondents were members of an environmental group. Approximately 60% said they were concerned or very concerned about the environment, and reports of environmental knowledge were low.
• Willingness to pay higher prices, higher taxes and accept cuts to standards of living to protect the environment dropped by approximately 10% between 1993 and 2010. Patterns were similar across countries.
• In general, respondents’ beliefs about the dangers of environmental issues decreased between 1993 and 2010 across countries. In Australia, perceived dangers relating to air pollution, river pollution and global warming decreased by approximately 15%.
• Although willingness to make trade-‐offs to protect the environment and perception of dangers had decreased over time in all countries, rates of pro-‐environmental behaviour had increased from 1993 to 2010. In 2010 recycling was most popular (> 80% always or often recycling), followed by energy saving (approx. 50%), water saving (approx. 40%) and cutting back on car use (approx. 20%). On average, Australian respondents reported the highest frequency of pro-‐environmental behaviour at both time points.
Part 2: Predictors of pro-‐environmental behaviour
Predictors of pro-‐environmental behaviour were investigated amongst Australian, UK, US, Norwegian and Japanese employees (recycling and car use in 1993 and recycling, car use, energy saving and water saving in 2010).
• In general, older employees, female employees, those with longer years in education, those with high levels of environmental concern, those willing to make trade-‐offs and those who believed that environmental problems are dangerous had the highest frequencies of recycling. Longer hours of work were predictive of less recycling in the UK and US (1993) but not Australia.
• Environmental attitudes, such as concern, willingness to make trade-‐offs and beliefs about dangers were most predictive of cutting back on car use across countries at both time points. Some other predictive evidence was found for additional variables, such as having children in the household.
• Attitudinal variables were also most predictive of efforts to save energy in 2010. However, in the US and Norway, being female, and living with a partner, were both associated with better outcomes.
5
• Few variables other than environmental attitudes and knowledge predicted water saving behaviour in 2010. However, older employees in Australia, and female employees in the UK reported higher frequencies of water curtailment.
Conclusions
1. In comparison with other OECD countries, Australia is doing well in relation to environmental action, reporting the most frequent engagement in pro-‐environmental behaviours in 1993 and in 2010.
2. Across countries, respondents were less willing to make trade-‐offs for the environment in 2010 than 1993, and fewer believed that environmental problems were dangerous. This attitudinal decline over seventeen years seems to reflect ‘green fatigue’, loss of interest or a collective lethargy in relation to sustainability issues. Concern about environmental problems was also relatively low across countries in 2010, with approximately 60% of respondents saying they were concerned or very concerned.
3. Despite the decrease in willingness to make trade-‐offs and beliefs about dangers, pro-‐environmental behaviours have increased between 1993 and 2010. The behaviour that has seen the biggest increase over this time period is household recycling, with 94% of Australians reporting always or often recycling in 2010.
4. Although environmental concern, willingness to make trade-‐offs and beliefs about the dangers of environmental problems were fairly consistent predictors of pro-‐environmental behaviours across countries, other analyses showed that older employees, women, those with higher educational attainment, those working less hours and those without children in the household also reported better environmental outcomes. This suggests that engagement in pro-‐environmental behaviours is, at least in part, shaped by life stage, household and work factors as well as inter-‐personal motivations.
5. The most popular pro-‐environmental action by far is recycling, which could be a reflection of the way that this behaviour in particular has been embedded into daily household functioning by government incentives such as the ‘three bin’ recycling system. Given the relatively low level of concern afforded to environmental issues across countries – and the decrease in willingness to make trade-‐offs over time – a similar approach may be needed to facilitate energy and water saving tasks and make these behaviours habitual.
6
Introduction This report presents the detailed findings from the International Social Survey Program (ISSP) study, forming part of a larger ARC-‐funded project ‘Work, Life and Sustainable Living’. The report is designed to supplement the final project report Work, Life and Sustainable Living: how work, household and community life interact to affect environmental behaviours and outcomes (Chapman, 2013), which is available for download from the Centre for Work + Life website.
The ISSP, started in 1984, is a continuing annual program of cross-‐national collaborative surveys covering topics of social interest. The environment was the subject of the 1993, 2000 and 2010 ISSP modules, with Australia participating in 1993 and 2010. The ISSP permits analysis of pro-‐environmental behaviours in relation to attitudes, household and work characteristics. The aim of this study is to determine how Australia compares to other countries in relation to environmental issues, and to further investigate antecedents of action from an internationally comparative perspective.
This paper is split into two parts. The first part compares descriptive data from Australian respondents in the Environment I (1993) and Environment III (2010) surveys with respondents from four other OECD countries. This is to provide a general international comparison and indicate longitudinal variations in environmental attitudes and actions. The four countries are: United Kingdom (Europe), United States (North America), Norway (Europe), and Japan (East Asia). The countries were selected to provide a broad representation of geographical regions where data was collected at both the 1993 and 2010 waves of data collection.
The second part of the paper reports findings from a series of multivariate analyses that investigate the predictors of four environmental behaviours (recycling, car use, energy saving and water saving) undertaken by employees in Australia and internationally. The following summaries consider how the predictors compare, and how they have changed over time.
7
Part 1: International comparison of ISSP Environment I and III
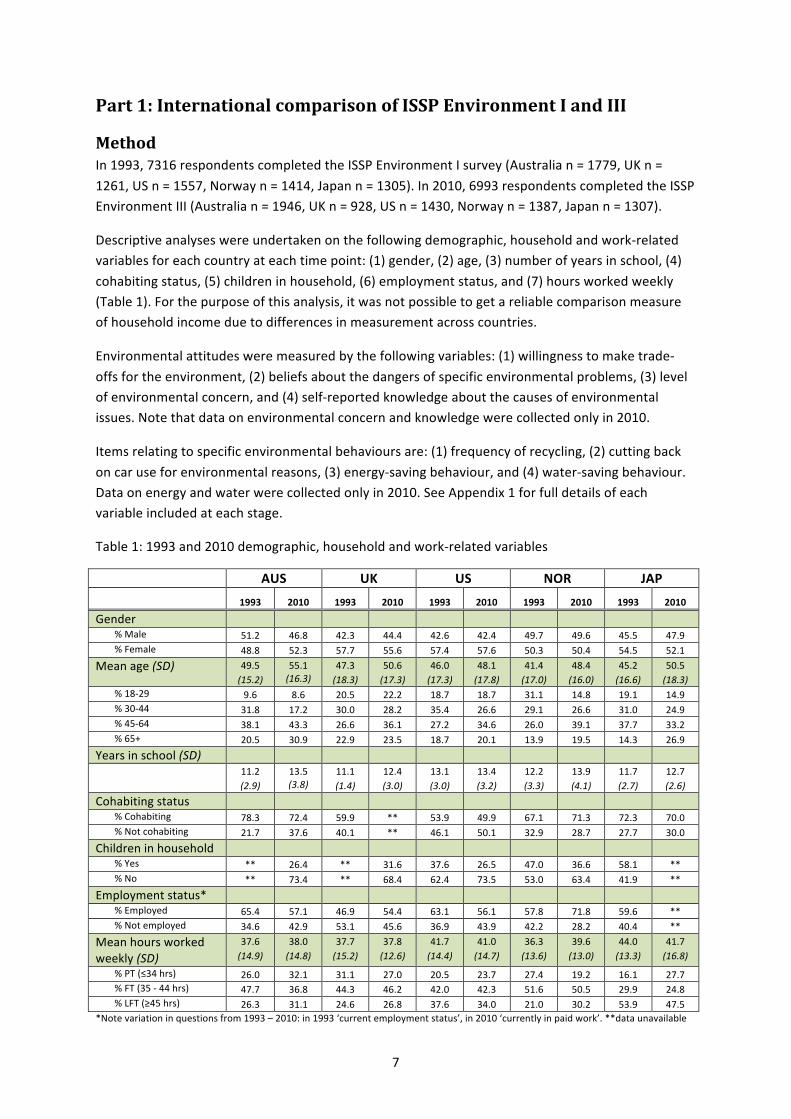
Method In 1993, 7316 respondents completed the ISSP Environment I survey (Australia n = 1779, UK n = 1261, US n = 1557, Norway n = 1414, Japan n = 1305). In 2010, 6993 respondents completed the ISSP Environment III (Australia n = 1946, UK n = 928, US n = 1430, Norway n = 1387, Japan n = 1307).
Descriptive analyses were undertaken on the following demographic, household and work-‐related variables for each country at each time point: (1) gender, (2) age, (3) number of years in school, (4) cohabiting status, (5) children in household, (6) employment status, and (7) hours worked weekly (Table 1). For the purpose of this analysis, it was not possible to get a reliable comparison measure of household income due to differences in measurement across countries.
Environmental attitudes were measured by the following variables: (1) willingness to make trade-‐offs for the environment, (2) beliefs about the dangers of specific environmental problems, (3) level of environmental concern, and (4) self-‐reported knowledge about the causes of environmental issues. Note that data on environmental concern and knowledge were collected only in 2010.
Items relating to specific environmental behaviours are: (1) frequency of recycling, (2) cutting back on car use for environmental reasons, (3) energy-‐saving behaviour, and (4) water-‐saving behaviour. Data on energy and water were collected only in 2010. See Appendix 1 for full details of each variable included at each stage.
Table 1: 1993 and 2010 demographic, household and work-‐related variables
AUS UK US NOR JAP 1993 2010 1993 2010 1993 2010 1993 2010 1993 2010
Gender % Male 51.2 46.8 42.3 44.4 42.6 42.4 49.7 49.6 45.5 47.9 % Female 48.8 52.3 57.7 55.6 57.4 57.6 50.3 50.4 54.5 52.1
Mean age (SD) 49.5 (15.2)
55.1 (16.3)
47.3 (18.3)
50.6 (17.3)
46.0 (17.3)
48.1 (17.8)
41.4 (17.0)
48.4 (16.0)
45.2 (16.6)
50.5 (18.3)
% 18-‐29 9.6 8.6 20.5 22.2 18.7 18.7 31.1 14.8 19.1 14.9 % 30-‐44 31.8 17.2 30.0 28.2 35.4 26.6 29.1 26.6 31.0 24.9 % 45-‐64 38.1 43.3 26.6 36.1 27.2 34.6 26.0 39.1 37.7 33.2 % 65+ 20.5 30.9 22.9 23.5 18.7 20.1 13.9 19.5 14.3 26.9
Years in school (SD)
11.2 (2.9)
13.5 (3.8)
11.1 (1.4)
12.4 (3.0)
13.1 (3.0)
13.4 (3.2)
12.2 (3.3)
13.9 (4.1)
11.7 (2.7)
12.7 (2.6)
Cohabiting status % Cohabiting 78.3 72.4 59.9 ** 53.9 49.9 67.1 71.3 72.3 70.0 % Not cohabiting 21.7 37.6 40.1 ** 46.1 50.1 32.9 28.7 27.7 30.0
Children in household % Yes ** 26.4 ** 31.6 37.6 26.5 47.0 36.6 58.1 ** % No ** 73.4 ** 68.4 62.4 73.5 53.0 63.4 41.9 **
Employment status* % Employed 65.4 57.1 46.9 54.4 63.1 56.1 57.8 71.8 59.6 ** % Not employed 34.6 42.9 53.1 45.6 36.9 43.9 42.2 28.2 40.4 **
Mean hours worked weekly (SD)
37.6 (14.9)
38.0 (14.8)
37.7 (15.2)
37.8 (12.6)
41.7 (14.4)
41.0 (14.7)
36.3 (13.6)
39.6 (13.0)
44.0 (13.3)
41.7 (16.8)
% PT (≤34 hrs) 26.0 32.1 31.1 27.0 20.5 23.7 27.4 19.2 16.1 27.7 % FT (35 -‐ 44 hrs) 47.7 36.8 44.3 46.2 42.0 42.3 51.6 50.5 29.9 24.8 % LFT (≥45 hrs) 26.3 31.1 24.6 26.8 37.6 34.0 21.0 30.2 53.9 47.5
*Note variation in questions from 1993 – 2010: in 1993 ‘current employment status’, in 2010 ‘currently in paid work’. **data unavailable
8
In relation to demographic data, there was a fairly even split between men and women in all countries, with slightly higher representation for females. The average age of the sample was 44.6 years in 1993, and 49.8 years in 2010. The average number of years spent in school was 12.0 in 1993 and slightly higher at 13.2 years in 2010. Roughly two-‐thirds to three quarters of respondents were living with a partner at both time points, except in the US where approximately half of the sample was cohabiting. In most countries, approximately one third had children in the household, except Japan, where children were present in approximately half of households. Two-‐thirds of the sample was in employment in 1993; this figure fell slightly in 2010 everywhere except in Norway, where the per cent of people employed increased from 57.8% in 1993 to 71.8% in 2010. Finally, average hours of work were relatively consistent across countries and time points, averaging 39.6 in 1993 and 39.8 in 2010. Japan has the highest per cent of people working long full-‐time hours (over 45 hours per week) at both time points: 53.9% in 1993 and 47.5% in 2010. In comparison, 26.3% of Australian respondents worked long full-‐time hours in 1993, and 31.1% in 2010 (Table 1).
Findings
General importance of environmental issues Prior to the main questions, respondents were asked to choose the most important issue for their country today (note this question was asked in 2010 only). Nine options were available: health care, education, crime, the environment, immigration, the economy, terrorism, poverty, or none of the above / can’t choose.
In Australia, ‘the environment’ came fourth (selected by 9.4%). The top three were the economy (34.2%), health care (26%), and education (13.2%). In the UK ‘the environment’ came 6th with 3.3% of votes, preceded by the economy (29.2%), health care (27.1%) and immigration (15.4%). In the US ‘the environment’ came 5th with 4.3% of votes; the top three were the economy (36.6%), health care (23.0%) and education (19.2%). Norway was the only country placing ‘the environment’ in the top three of important issues: health care was first (40.6%), education second (17.7%) and the environment third (17.7%). Finally in Japan, ‘the environment’ was ranked 5th gaining 4.1% of votes. Again the top three were the economy (58.1%), health care (16.7%) and education (11.9%).
Respondents were also asked about their involvement in specific environmental groups or activities undertaken to protect the environment in 1993 and 2010. Very few respondents were members of an environmental group (< 10.3%) or had taken part in an environmental protest (< 5.5%) in any country at either time point. Signing an environmental petition and giving money to environmental groups were more popular actions, although these actions decreased from 1993 to 2010 in all countries (average of 25.7% in 1993 to 15.9% in 2010 for signing a petition, and 27.8% in 1993 to 18.4% in 2010 for giving money to groups).
Taken together, this shows that in Australia and internationally, the environment is low on the list of importance for most people in 2010. In addition, public support for the environment through petitions, giving money to groups or joining a group has declined between 1993 and 2010, suggesting a decrease in interest regarding environmental issues. This may be a reflection of ‘green fatigue’, or a more general consequence of slowing economies and other competing priorities. The following sections consider the level of environmental concern and knowledge, willingness to make personal trade-‐offs to protect the environment, beliefs about the dangers of specific environmental issues, and respondents’ pro-‐environmental behaviours at both time points and across countries.
9
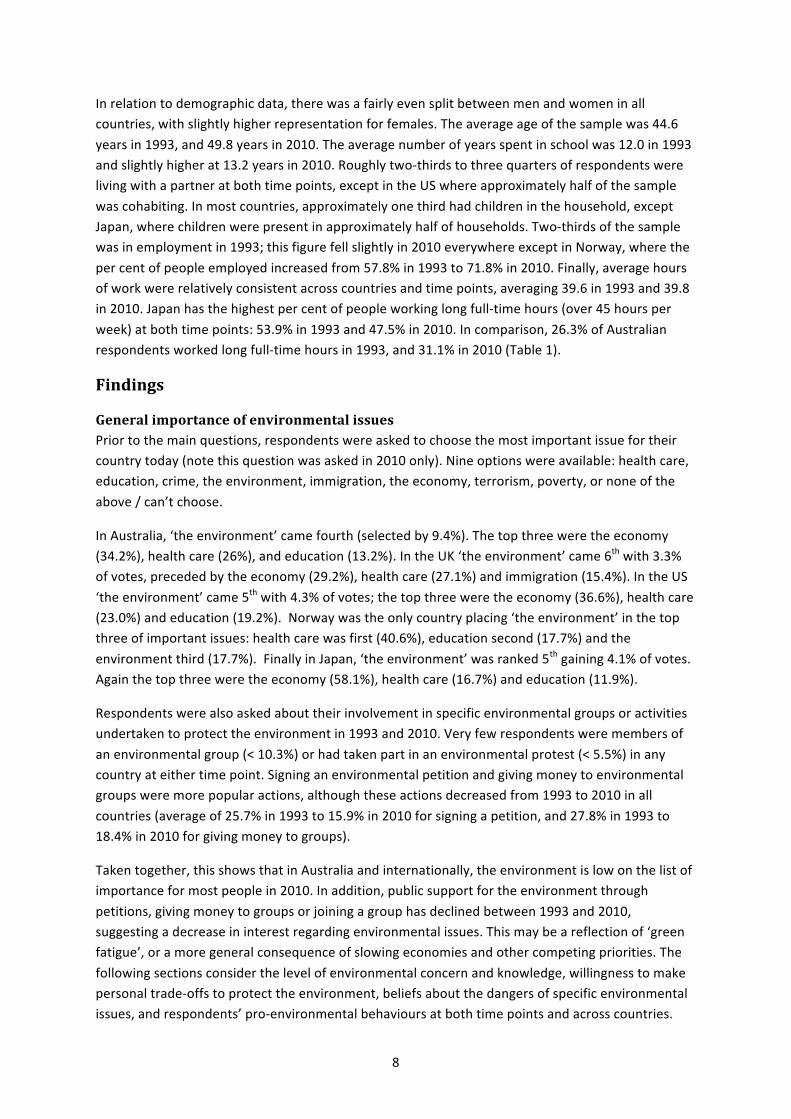
Environmental concern and knowledge Table 2: Level of concern and knowledge in five countries in 2010
AUS UK US NOR JAP Concern about environmental issues
Concerned / very 60.1 55.8 64.7 48.9 67.7 Neutral 26.9 29.5 24.9 35.9 25.3 Unconcerned / very 13.0 14.7 10.4 15.2 7.0
Knowledge about causes of environmental issues
A great deal / lots 39.6 30.7 27.8 51.1 20.6 Neutral 44.1 46.2 43.4 37.5 42.5 Nothing at all / little 16.3 23.1 28.8 11.4 36.9
Knowledge about solutions to environmental issues
A great deal / lots 24.6 21.5 14.4 31.6 13.9 Neutral 43.6 44.9 39.0 42.6 38.6 Nothing at all / little 31.8 33.6 46.6 25.8 47.5
**data unavailable.
On average, half to two-‐thirds of people reported that they were concerned or very concerned about environmental issues in 2010, and this was relatively consistent across countries. Although Norway was least likely to be concerned (48.9%), they were most likely to report knowing a lot or a great deal about the causes of environmental issues (51.1%). Interestingly, Japan was most concerned (67.7%), yet they had the fewest number of people reporting a high level of knowledge of the causes (20.6%). Less was known about the solutions to environmental problems across countries, particularly in Japan and the US. Note that a longitudinal comparison is not possible on these items, as data was not collected in 1993.
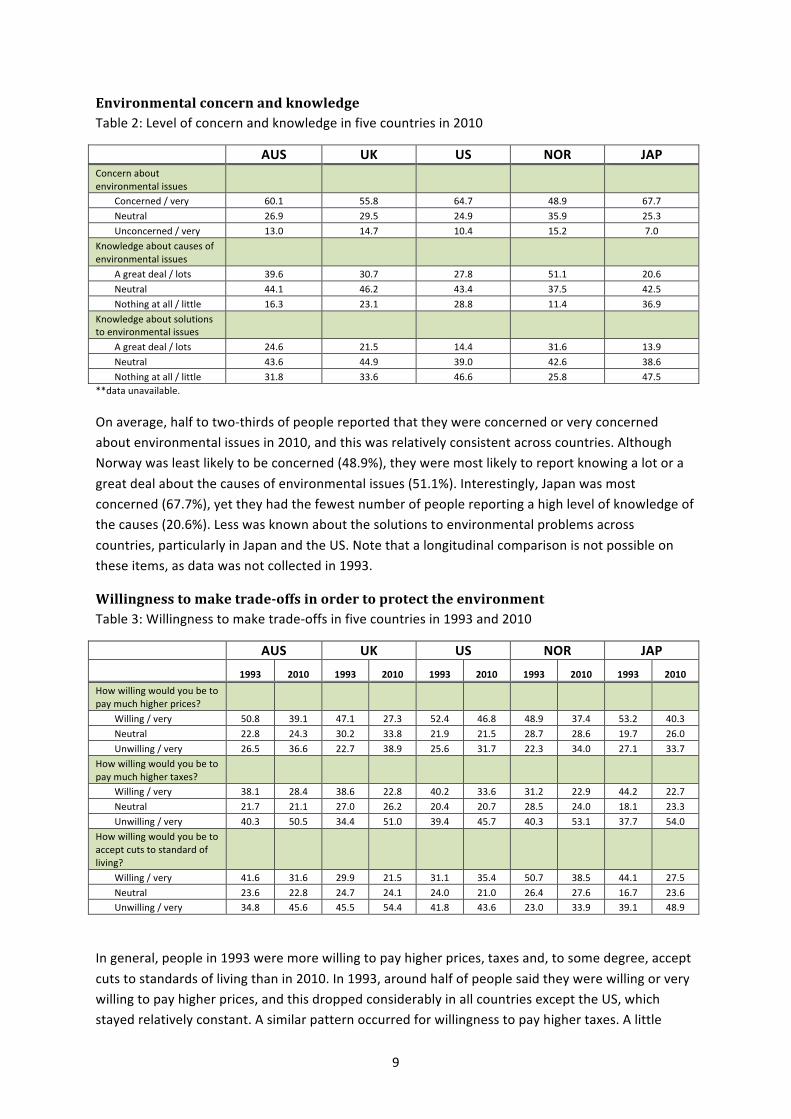
Willingness to make trade-‐offs in order to protect the environment Table 3: Willingness to make trade-‐offs in five countries in 1993 and 2010
AUS UK US NOR JAP 1993 2010 1993 2010 1993 2010 1993 2010 1993 2010 How willing would you be to pay much higher prices?
Willing / very 50.8 39.1 47.1 27.3 52.4 46.8 48.9 37.4 53.2 40.3 Neutral 22.8 24.3 30.2 33.8 21.9 21.5 28.7 28.6 19.7 26.0 Unwilling / very 26.5 36.6 22.7 38.9 25.6 31.7 22.3 34.0 27.1 33.7
How willing would you be to pay much higher taxes?
Willing / very 38.1 28.4 38.6 22.8 40.2 33.6 31.2 22.9 44.2 22.7 Neutral 21.7 21.1 27.0 26.2 20.4 20.7 28.5 24.0 18.1 23.3 Unwilling / very 40.3 50.5 34.4 51.0 39.4 45.7 40.3 53.1 37.7 54.0
How willing would you be to accept cuts to standard of living?
Willing / very 41.6 31.6 29.9 21.5 31.1 35.4 50.7 38.5 44.1 27.5 Neutral 23.6 22.8 24.7 24.1 24.0 21.0 26.4 27.6 16.7 23.6 Unwilling / very 34.8 45.6 45.5 54.4 41.8 43.6 23.0 33.9 39.1 48.9
In general, people in 1993 were more willing to pay higher prices, taxes and, to some degree, accept cuts to standards of living than in 2010. In 1993, around half of people said they were willing or very willing to pay higher prices, and this dropped considerably in all countries except the US, which stayed relatively constant. A similar pattern occurred for willingness to pay higher taxes. A little
10
more variation can be seen between countries for willingness to accept cuts to standards of living; Australia (41.6%) and Norway (50.7%) were the most willing in 1993, although this drops considerably in 2010. The only country to be more willing to accept cuts to standards of living in 2010 was the US, although this difference was slight.
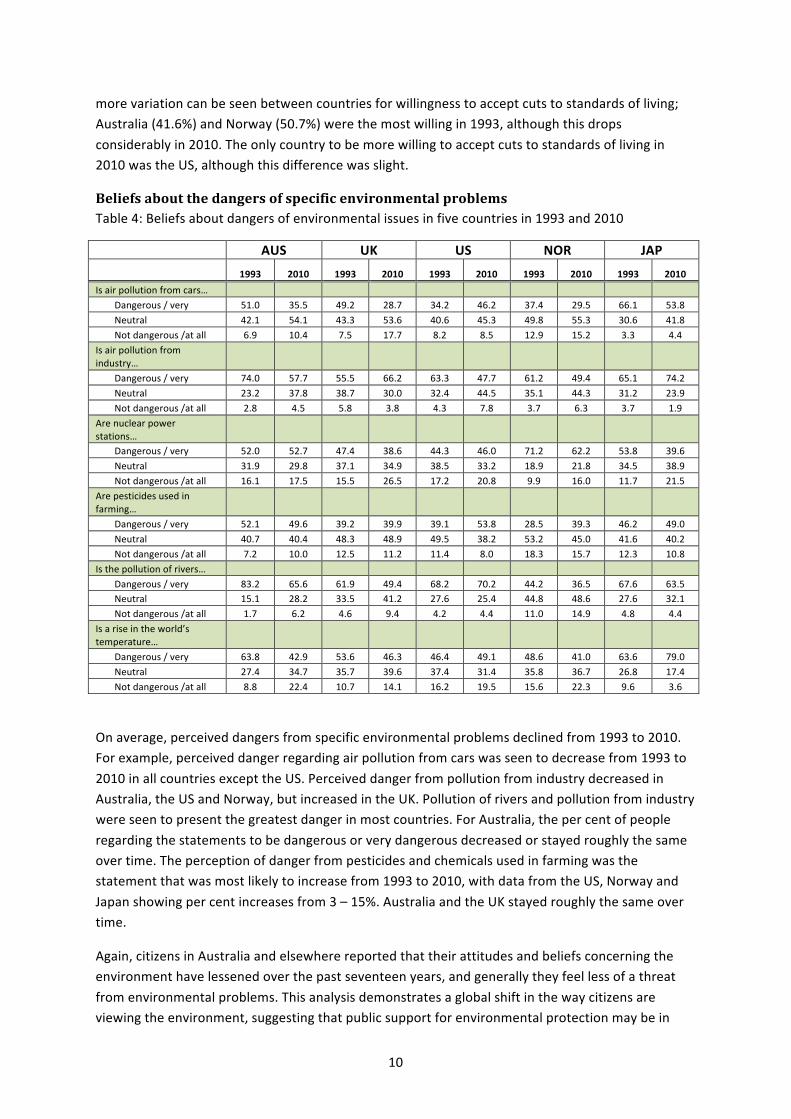
Beliefs about the dangers of specific environmental problems Table 4: Beliefs about dangers of environmental issues in five countries in 1993 and 2010
AUS UK US NOR JAP 1993 2010 1993 2010 1993 2010 1993 2010 1993 2010 Is air pollution from cars…
Dangerous / very 51.0 35.5 49.2 28.7 34.2 46.2 37.4 29.5 66.1 53.8 Neutral 42.1 54.1 43.3 53.6 40.6 45.3 49.8 55.3 30.6 41.8 Not dangerous /at all 6.9 10.4 7.5 17.7 8.2 8.5 12.9 15.2 3.3 4.4
Is air pollution from industry…
Dangerous / very 74.0 57.7 55.5 66.2 63.3 47.7 61.2 49.4 65.1 74.2 Neutral 23.2 37.8 38.7 30.0 32.4 44.5 35.1 44.3 31.2 23.9 Not dangerous /at all 2.8 4.5 5.8 3.8 4.3 7.8 3.7 6.3 3.7 1.9
Are nuclear power stations…
Dangerous / very 52.0 52.7 47.4 38.6 44.3 46.0 71.2 62.2 53.8 39.6 Neutral 31.9 29.8 37.1 34.9 38.5 33.2 18.9 21.8 34.5 38.9 Not dangerous /at all 16.1 17.5 15.5 26.5 17.2 20.8 9.9 16.0 11.7 21.5
Are pesticides used in farming…
Dangerous / very 52.1 49.6 39.2 39.9 39.1 53.8 28.5 39.3 46.2 49.0 Neutral 40.7 40.4 48.3 48.9 49.5 38.2 53.2 45.0 41.6 40.2 Not dangerous /at all 7.2 10.0 12.5 11.2 11.4 8.0 18.3 15.7 12.3 10.8
Is the pollution of rivers… Dangerous / very 83.2 65.6 61.9 49.4 68.2 70.2 44.2 36.5 67.6 63.5 Neutral 15.1 28.2 33.5 41.2 27.6 25.4 44.8 48.6 27.6 32.1 Not dangerous /at all 1.7 6.2 4.6 9.4 4.2 4.4 11.0 14.9 4.8 4.4
Is a rise in the world’s temperature…
Dangerous / very 63.8 42.9 53.6 46.3 46.4 49.1 48.6 41.0 63.6 79.0 Neutral 27.4 34.7 35.7 39.6 37.4 31.4 35.8 36.7 26.8 17.4 Not dangerous /at all 8.8 22.4 10.7 14.1 16.2 19.5 15.6 22.3 9.6 3.6
On average, perceived dangers from specific environmental problems declined from 1993 to 2010. For example, perceived danger regarding air pollution from cars was seen to decrease from 1993 to 2010 in all countries except the US. Perceived danger from pollution from industry decreased in Australia, the US and Norway, but increased in the UK. Pollution of rivers and pollution from industry were seen to present the greatest danger in most countries. For Australia, the per cent of people regarding the statements to be dangerous or very dangerous decreased or stayed roughly the same over time. The perception of danger from pesticides and chemicals used in farming was the statement that was most likely to increase from 1993 to 2010, with data from the US, Norway and Japan showing per cent increases from 3 – 15%. Australia and the UK stayed roughly the same over time.
Again, citizens in Australia and elsewhere reported that their attitudes and beliefs concerning the environment have lessened over the past seventeen years, and generally they feel less of a threat from environmental problems. This analysis demonstrates a global shift in the way citizens are viewing the environment, suggesting that public support for environmental protection may be in
11
decline. As positive environmental attitudes and beliefs are widely held to be important determinants of action, this trend in the data could have serious ramifications for the success of future motivational green initiatives.
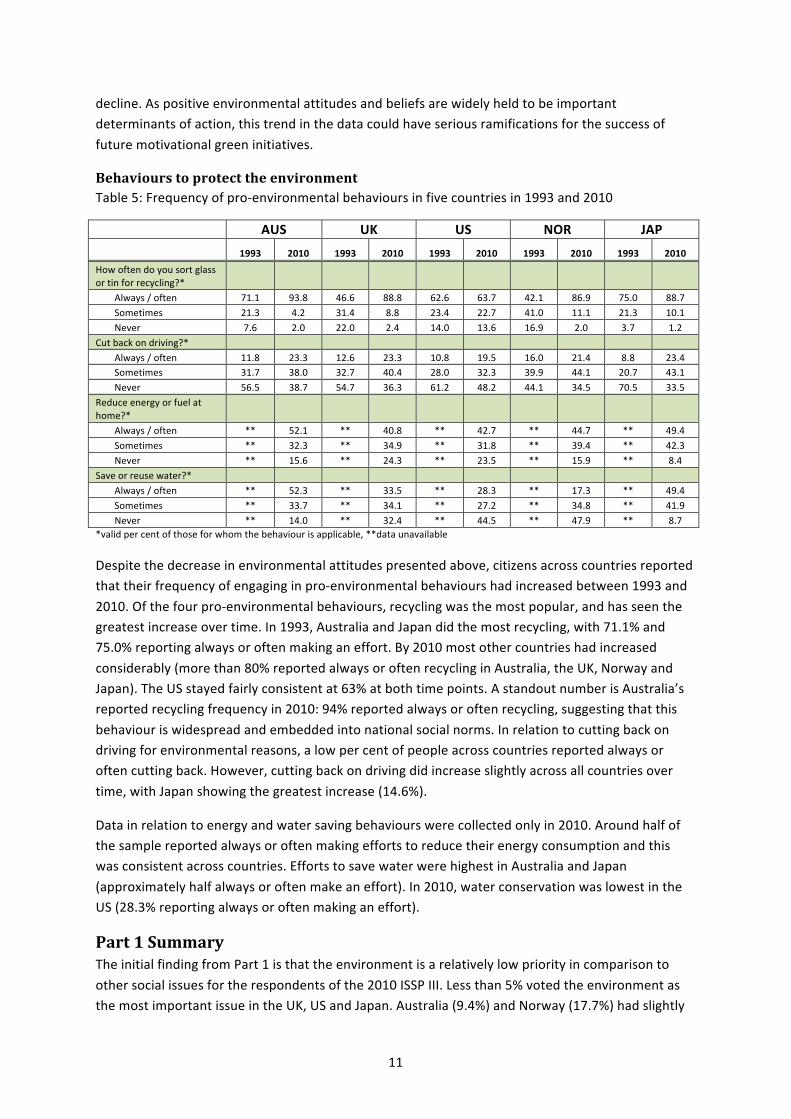
Behaviours to protect the environment Table 5: Frequency of pro-‐environmental behaviours in five countries in 1993 and 2010
AUS UK US NOR JAP 1993 2010 1993 2010 1993 2010 1993 2010 1993 2010 How often do you sort glass or tin for recycling?*
Always / often 71.1 93.8 46.6 88.8 62.6 63.7 42.1 86.9 75.0 88.7 Sometimes 21.3 4.2 31.4 8.8 23.4 22.7 41.0 11.1 21.3 10.1 Never 7.6 2.0 22.0 2.4 14.0 13.6 16.9 2.0 3.7 1.2
Cut back on driving?* Always / often 11.8 23.3 12.6 23.3 10.8 19.5 16.0 21.4 8.8 23.4 Sometimes 31.7 38.0 32.7 40.4 28.0 32.3 39.9 44.1 20.7 43.1 Never 56.5 38.7 54.7 36.3 61.2 48.2 44.1 34.5 70.5 33.5
Reduce energy or fuel at home?*
Always / often ** 52.1 ** 40.8 ** 42.7 ** 44.7 ** 49.4 Sometimes ** 32.3 ** 34.9 ** 31.8 ** 39.4 ** 42.3 Never ** 15.6 ** 24.3 ** 23.5 ** 15.9 ** 8.4
Save or reuse water?* Always / often ** 52.3 ** 33.5 ** 28.3 ** 17.3 ** 49.4 Sometimes ** 33.7 ** 34.1 ** 27.2 ** 34.8 ** 41.9 Never ** 14.0 ** 32.4 ** 44.5 ** 47.9 ** 8.7
*valid per cent of those for whom the behaviour is applicable, **data unavailable
Despite the decrease in environmental attitudes presented above, citizens across countries reported that their frequency of engaging in pro-‐environmental behaviours had increased between 1993 and 2010. Of the four pro-‐environmental behaviours, recycling was the most popular, and has seen the greatest increase over time. In 1993, Australia and Japan did the most recycling, with 71.1% and 75.0% reporting always or often making an effort. By 2010 most other countries had increased considerably (more than 80% reported always or often recycling in Australia, the UK, Norway and Japan). The US stayed fairly consistent at 63% at both time points. A standout number is Australia’s reported recycling frequency in 2010: 94% reported always or often recycling, suggesting that this behaviour is widespread and embedded into national social norms. In relation to cutting back on driving for environmental reasons, a low per cent of people across countries reported always or often cutting back. However, cutting back on driving did increase slightly across all countries over time, with Japan showing the greatest increase (14.6%).
Data in relation to energy and water saving behaviours were collected only in 2010. Around half of the sample reported always or often making efforts to reduce their energy consumption and this was consistent across countries. Efforts to save water were highest in Australia and Japan (approximately half always or often make an effort). In 2010, water conservation was lowest in the US (28.3% reporting always or often making an effort).
Part 1 Summary The initial finding from Part 1 is that the environment is a relatively low priority in comparison to other social issues for the respondents of the 2010 ISSP III. Less than 5% voted the environment as the most important issue in the UK, US and Japan. Australia (9.4%) and Norway (17.7%) had slightly
12
higher votes. In addition, very few respondents were actively engaged in environmental groups or activities, such as donating or petitioning for environmental causes. Furthermore, the number of people involved in environmental groups or activities declined in the time period between 1993 and 2010. In 2010, concern about the environment was also relatively low, indicated by around 60% of respondents across countries. This suggests that in general, environmental issues may be becoming less of a priority. The implication is that people may be tiring of repeated exhortations to do the right thing and of greenwashed sales pitches, meaning that future "be green" messages are likely to have less impact than in previous years.
Main areas of change from 1993-‐2010 Willingness to make trade-‐offs to protect the environment decreased from 1993 to 2010. This was measured by questions regarding willingness to pay higher prices, higher taxes, and accepting cuts to standards of living in order to protect the environment. On average across countries, willingness to make trade offs for the environment dropped by 10%, with the exception of the US, were willingness to accept cuts to standards of living increased slightly over time.
Beliefs about the dangers of environmental problems also decreased as a whole, again with the exception of the US, where perceptions of danger in five of the six environmental areas increased slightly or remained constant. In Australia, the perceived dangers of air pollution from cars and industry, the pollution of rivers and a rise in the world’s temperature decreased by 15% on average. Perceived dangers from nuclear power stations and pesticides in Australia remained constant over time.
With regard to pro-‐environmental behaviour, over 80% of the sample reported always or often recycling, approximately 50% reported always or often saving energy, 40% on average saved water, and 20% reported cutting back on car use in 2010. The general trend was for an increase in the frequency of recycling, particularly in the UK and Norway, who increased by approximately 50% from 1993 to 2010. In comparison to the other countries, Australia had high rates of pro-‐environmental behaviour in 1993, and the highest rate of recycling, energy and water reduction in 2010. Recycling in Australia was particularly high in 2010 at 93.8%, demonstrating that awareness and involvement in recycling is widespread across the country.
Increases in pro-‐environmental behaviours were reported despite lower rates of concern about a variety of environmental problems. It is interesting to note that behavioural change occurred over the seventeen-‐year period alongside a decline in green motivation. These findings suggest that the variation in levels of environmentally friendly behaviour is further driven by factors other than pro-‐environmental attitude and concern. Part two of this report investigates the predictors of recycling, energy, water and car use directly, with a particular focus on life stage, household and work factors.
13
Part 2: Predictors of environmental behaviours 1993 and 2010 Part two considers the degree to which the household pro-‐environmental behaviours of employees can be predicted by demographic, household, work-‐related and attitudinal factors, in addition to the potential differences between findings over time and across countries.
Method A series of multiple regression analyses were undertaken to determine the variables predicting pro-‐environmental behaviour. Recycling behaviour and effort to cut back on car use are the criterion variables in 1993 and 2010. Data on energy-‐saving and water-‐saving behaviours were not available in 1993 so are included in the 2010 analyses only. 1993 analyses were performed on five countries: Australia, UK, US, Norway and Japan. However, Japan was not included in the 2010 analyses because data on current employment status was not available.
The analyses in this section were performed on an employee sample. In line with the broader aims of the Work, Life and Sustainable Living project, employees were selected to determine the factors that predicted pro-‐environmental behaviours specifically amongst the working population. The total number of employees in 1993 was n = 4243 (Australia = 1094, UK = 592, US = 982, Norway = 805, Japan = 770). The total number of employees in 2010 was n = 3385 (Australia = 1096, UK = 504, US = 801, Norway = 984).
Demographic, household and work-‐related predictor variables used in all analyses were: gender, age, years in school, cohabiting status, children in household and number of hours worked weekly.
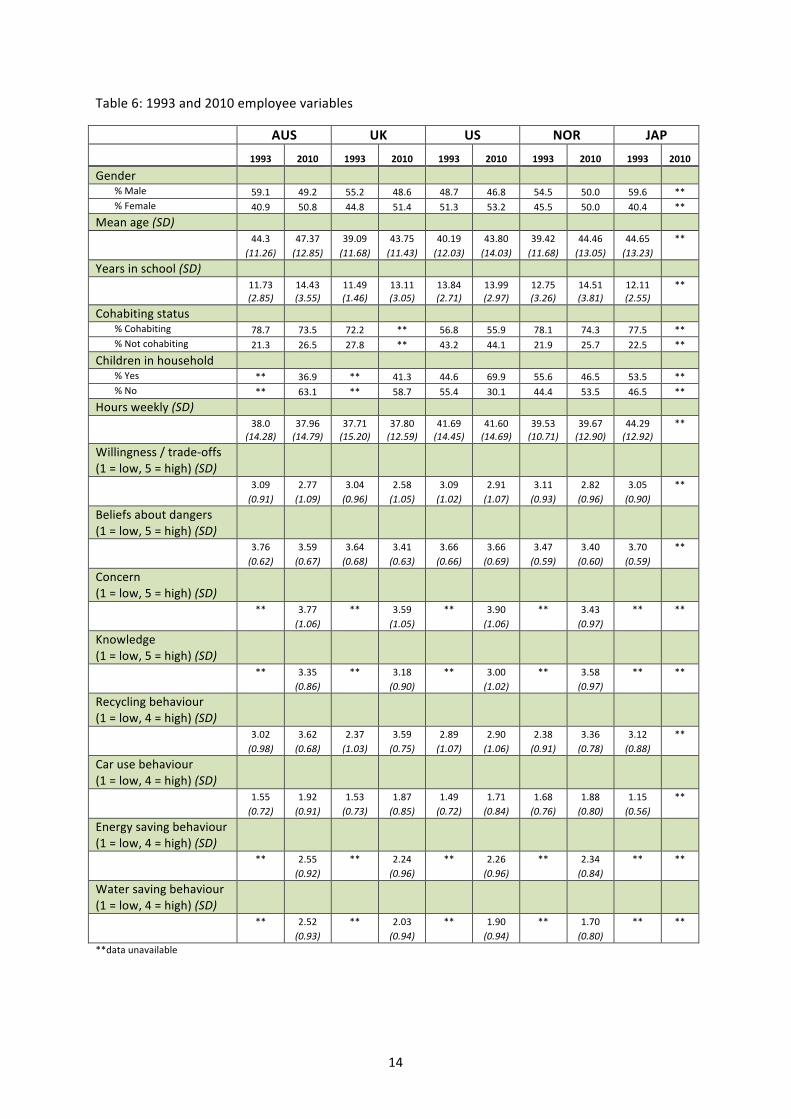
Predictor variables related to environmental attitudes consisted of two measures: ‘willingness to make trade-‐offs for the environment’ and ‘beliefs about the dangers of environmental problems’. The ‘willingness to make trade-‐offs’ measure was formed by merging three items (1993 Chronbach’s α = .81; 2010 α = .85; all individual country α’s >.70) and the ‘beliefs about the dangers’ measure was formed by merging six items (1993 Chronbach’s α = .78; 2010 α = .80; all individual country α’s >.75) (see Appendix 1 for details of individual items in each measure). In 2010 two additional single-‐item measures were available and included in the analysis: ‘concern about the environment’ and ‘knowledge about the causes of environmental problems’. Means and standard deviations of all variables at all time points are presented in Table 6.
14
Table 6: 1993 and 2010 employee variables
AUS UK US NOR JAP 1993 2010 1993 2010 1993 2010 1993 2010 1993 2010
Gender % Male 59.1 49.2 55.2 48.6 48.7 46.8 54.5 50.0 59.6 ** % Female 40.9 50.8 44.8 51.4 51.3 53.2 45.5 50.0 40.4 **
Mean age (SD)
44.3 (11.26)
47.37 (12.85)
39.09 (11.68)
43.75 (11.43)
40.19 (12.03)
43.80 (14.03)
39.42 (11.68)
44.46 (13.05)
44.65 (13.23)
**
Years in school (SD)
11.73 (2.85)
14.43 (3.55)
11.49 (1.46)
13.11 (3.05)
13.84 (2.71)
13.99 (2.97)
12.75 (3.26)
14.51 (3.81)
12.11 (2.55)
**
Cohabiting status % Cohabiting 78.7 73.5 72.2 ** 56.8 55.9 78.1 74.3 77.5 ** % Not cohabiting 21.3 26.5 27.8 ** 43.2 44.1 21.9 25.7 22.5 **
Children in household % Yes ** 36.9 ** 41.3 44.6 69.9 55.6 46.5 53.5 ** % No ** 63.1 ** 58.7 55.4 30.1 44.4 53.5 46.5 **
Hours weekly (SD) 38.0
(14.28) 37.96 (14.79)
37.71 (15.20)
37.80 (12.59)
41.69 (14.45)
41.60 (14.69)
39.53 (10.71)
39.67 (12.90)
44.29 (12.92)
**
Willingness / trade-‐offs (1 = low, 5 = high) (SD)
3.09 (0.91)
2.77 (1.09)
3.04 (0.96)
2.58 (1.05)
3.09 (1.02)
2.91 (1.07)
3.11 (0.93)
2.82 (0.96)
3.05 (0.90)
**
Beliefs about dangers (1 = low, 5 = high) (SD)
3.76 (0.62)
3.59 (0.67)
3.64 (0.68)
3.41 (0.63)
3.66 (0.66)
3.66 (0.69)
3.47 (0.59)
3.40 (0.60)
3.70 (0.59)
**
Concern (1 = low, 5 = high) (SD)
** 3.77 (1.06)
** 3.59 (1.05)
** 3.90 (1.06)
**
3.43 (0.97)
** **
Knowledge (1 = low, 5 = high) (SD)
** 3.35 (0.86)
** 3.18 (0.90)
** 3.00 (1.02)
** 3.58 (0.97)
** **
Recycling behaviour (1 = low, 4 = high) (SD)
3.02 (0.98)
3.62 (0.68)
2.37 (1.03)
3.59 (0.75)
2.89 (1.07)
2.90 (1.06)
2.38 (0.91)
3.36 (0.78)
3.12 (0.88)
**
Car use behaviour (1 = low, 4 = high) (SD)
1.55 (0.72)
1.92 (0.91)
1.53 (0.73)
1.87 (0.85)
1.49 (0.72)
1.71 (0.84)
1.68 (0.76)
1.88 (0.80)
1.15 (0.56)
**
Energy saving behaviour (1 = low, 4 = high) (SD)
** 2.55 (0.92)
** 2.24 (0.96)
** 2.26 (0.96)
** 2.34 (0.84)
** **
Water saving behaviour (1 = low, 4 = high) (SD)
** 2.52 (0.93)
** 2.03 (0.94)
** 1.90 (0.94)
** 1.70 (0.80)
** **
**data unavailable
15
Findings The following sections present the predictors of recycling, car use, energy saving and water saving behaviours at both time points for Australia, the UK, US, Norway and Japan.
For each category of pro-‐environmental behaviour, the statistical results from each country are described, followed by a summary figure of results and commentary on the main findings.
Predictors of recycling 1993 and 2010
Australia When recycling behaviour was predicted in 1993 amongst Australian employees, it was found that gender (female) (b = 0.11, p < .001), age in years (b = 0.13, p < .001), years in education (b = 0.08, p = .02), living with a partner (b = -‐0.08, p = .02), willingness to make trade-‐offs (b = 0.17, p < .001) and beliefs about the dangers of environmental problems (b = 0.11, p < .001) were significant predictors. Hours of work did not significantly predict recycling in 1993. Data for children in the household were not available in this dataset therefore were not included in the analysis. The overall model fit was R2 = 0.09, p < .001.
In 2010, age (b = 0.15, p < .001), beliefs about the dangers of environmental problems (b = 0.11, p < .01) and concern about environmental problems (b = 0.13, p < .001) were significant predictors (overall model fit R2 = 0.06, p < .001).
UK Amongst British employees, it was found that age in years (b = 0.20, p < .001), years in education (b = 0.21, p < .001), hours of work (b = -‐0.08, p = .05), willingness to make trade-‐offs (b = 0.19, p < .001) and beliefs about the dangers of environmental problems (b = 0.14, p < .01) were significant predictors of recycling in 1993. Gender and cohabiting status were not significant predictors. Again, data for children in the household were not available. The overall model fit was R2 = 0.16, p < .001.
In 2010, gender (female) (b = 0.12, p = .01), age in years (b = 0.16, p < .001), having children in the household (b = -‐0.11, p = .01), willingness to make trade-‐offs (b = 0.21, p < .001) and knowledge about the causes of environmental problems (b = 0.12, p = .01) were significant predictors. 2010 UK data for cohabiting status were not available therefore were not included in the analysis. The overall model fit was R2 = 0.12, p < .001.
US Age in years (b = 0.11, p < .01), years in education (b = 0.13, p < .001), hours of work (b = -‐0.09, p = .01) willingness to make trade-‐offs (b = 0.13, p < .01) and beliefs about the dangers of environmental problems (b = 0.09, p = .02) were significant predictors of recycling in the US in 1993. Gender, cohabiting status, children in the household were not significant predictors. The overall model fit was R2 = 0.07, p < .001.
In 2010, age (b = 0.08, p = .03), years in education (b = 0.19, p < .001), living with a partner (b = -‐0.08, p = .04), willingness to make trade-‐offs (b = 0.08, p = .05), beliefs about the dangers of environmental problems (b = 0.10, p = .02) and concern about environmental problems (b = 0.14, p < .01), were significant predictors (overall model fit R2 = 0.11, p < .001).
16
Norway When recycling behaviour was predicted in 1993 amongst Norwegian employees, it was found that gender (female) (b = 0.14, p < .01), age in years (b = 0.09, p = .02), willingness to make trade-‐offs (b = 0.17, p < .001) and beliefs about the dangers of environmental problems (b = 0.98, p = .02) were significant predictors. Years in education, cohabiting status, children in the household and hours of work were non-‐significant. The overall model fit was R2 = 0.09, p < .001.
Gender (female) (b = 0.08, p = .02), age (b = 0.24, p < .001), willingness to make trade-‐offs (b = 0.13, p < .001), concern about environmental problems (b = 0.15, p < .001) and knowledge about the causes of environmental problems (b = 0.07, p = .04) were significant predictors of recycling in Norway in 2010. The overall model fit was R2 = 0.15, p < .001.
Japan Gender (female) (b = 0.22, p < .001), age in years (b = 0.32, p < .001) and beliefs about the dangers of environmental problems (b = 0.11, p < .01) were significant predictors of recycling amongst Japanese employees in 1993. Years in education, cohabiting status, children in the household, hours of work and willingness to make trade-‐offs were non-‐significant. The overall model fit was R2 = 0.14, p < .001. Note 2010 data for Japanese employees was not available.
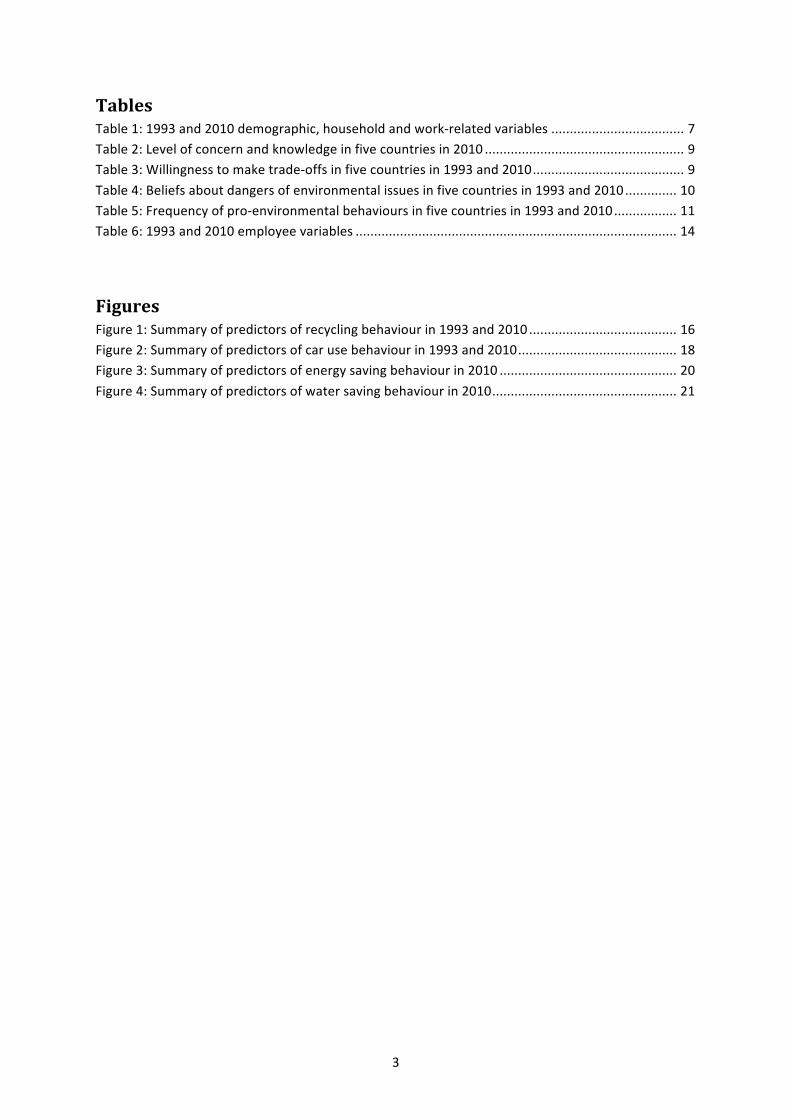
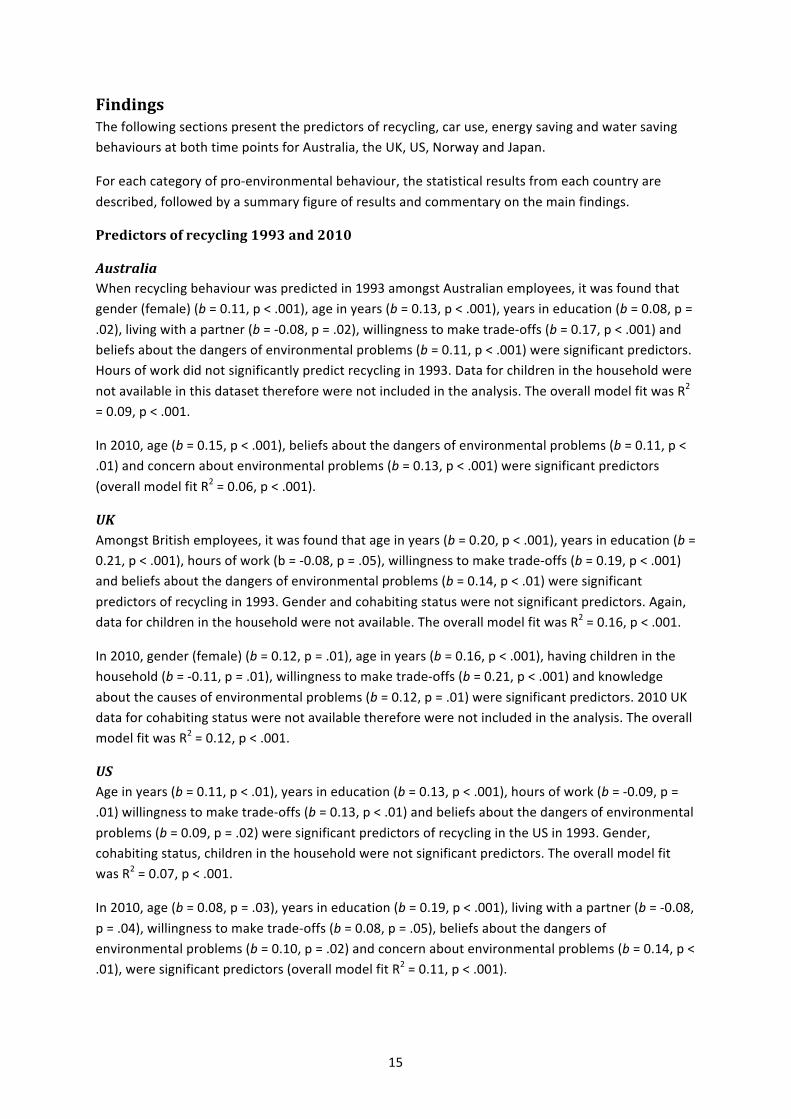
Figure 1: Summary of predictors of recycling behaviour in 1993 and 2010
AUS UK US NOR JAP 1993 2010 1993 2010 1993 2010 1993 2010 1993 2010
Women ↑ ↑ ↑ ↑ ↑ ** Age in years ↑ ↑ ↑ ↑ ↑ ↑ ↑ ↑ ↑ ** Education (years in school) ↑ ↑ ↑ ↑ **
Living with a partner ↓ ** ↓ ** Children in household ** ** ↓ ** Weekly hours of work ↓ ↓ ** Willingness to make trade-‐offs ↑ ↑ ↑ ↑ ↑ ↑ ↑ **
Beliefs about dangers ↑ ↑ ↑ ↑ ↑ ↑ ↑ ** Environmental concern ** ↑ ** ** ↑ ** ↑ ** ** Environmental knowledge ** ** ↑ ** ** ↑ ** ** ** data unavailable
Figure 1 shows which variables significantly (i.e. not likely to be due to chance, p < .05) predicted recycling behaviour in 1993 and 2010. For Figure 1, and the rest of the Figures in this section, the arrows show the direction of the relationship. For example, the first column shows that willingness to make trade-‐offs in Australia in 1993 was associated with higher frequencies (↑) of recycling, but living with a partner (cohabiting) was associated with lower frequencies (↓) of recycling.
Not surprisingly, willingness to make trade-‐offs to protect the environment, beliefs that environmental problems posed a danger, and higher levels of environmental concern were fairly consistent predictors of recycling frequency in all countries. However, this was not the whole story. Age in years was a consistent predictor of recycling in all countries and years, with older employees recycling more frequently than younger employees. In Australia, the UK, Norway and Japan, women
17
were more likely to recycle than men, although in Australian this difference was only found in 1993. Education was associated with higher frequencies of recycling in Australia, the UK and US. Having children in the household and longer hours of work were associated with lower rates of recycling at various times in the UK and US, suggesting that recycling behaviour may be influenced by time pressure in these countries. Living with a partner was also associated with lower rates of recycling in Australia (1993) and the US (2010). These findings show that employees at different stages of life, household structure and time spent at work shape pro-‐environmental outcomes, independently of inter-‐personal attitudes, beliefs and concern.
Predictors of cutting back on car use 1993 and 2010
Australia When cutting back on car use was predicted in 1993 amongst Australian employees, it was found that gender (female) (b = 0.10, p < .01) willingness to make trade-‐offs (b = 0.23, p < .001) and beliefs about the dangers of environmental problems (b = 0.23, p < .001) were significant predictors. Age, years in education, cohabiting status and hours of work were not significant predictors. Data for children in the household were not available in this dataset therefore were not included in the analysis. The overall model fit was R2 = 0.16, p < .001.
In 2010, cohabiting status (b = 0.06, p = .05), willingness to make trade-‐offs (b = 0.10, p = .01), beliefs about the dangers of environmental problems (b = 0.14, p < .001), concern about environmental problems (b = 0.21, p < .001) and knowledge about the causes of environmental problems (b = 0.06, p = .05) were significant predictors (overall model fit R2 = 0.15, p < .001).
UK In the UK, only willingness to make trade-‐offs (b = 0.19, p < .001) and beliefs about the dangers of environmental problems (b = 0.25, p < .001) were significant predictors of reduced car use in 1993. Gender, age, years in education, cohabiting status and hours of work were not significant predictors; data for children in the household were not available. The overall model fit was R2 = 0.13, p < .001.
In 2010, willingness to make trade-‐offs (b = 0.13, p = .03), beliefs about the dangers of environmental problems (b = 0.14, p = .01) and concern about environmental problems (b = 0.31, p < .001) were significant predictors (data for cohabiting status were not available). The overall model fit was R2 = 0.20, p < .001.
US In 1993 amongst US employees, it was found that years in education (b = 0.07, p = .05), cohabiting status (b = 0.08, p = .03), willingness to make trade-‐offs (b = 0.20, p < .001) and beliefs about the dangers of environmental problems (b = 0.14, p < .001) were significant predictors of cutting back on car use. Gender, age, children in the household and hours of work were non-‐significant (overall model fit R2 = 0.09, p < .001).
In 2010, willingness to make trade-‐offs (b = 0.16, p < .001), beliefs about the dangers of environmental problems (b = 0.21, p < .001) and concern about environmental problems (b = 0.11, p = .01) were significant predictors (overall model fit R2 = 0.14, p < .001).
18
Norway For Norwegian employees in 1993, it was found that years in education (b = 0.09, p = .02), hours of work (b = -‐0.09, p = .03), willingness to make trade-‐offs (b = 0.16, p < .001) and beliefs about the dangers of environmental problems (b = 0.18, p < .001) were significant predictors of car use. Non-‐significant predictors were gender, age, cohabiting status and having children in the household (overall model fit R2 = 0.10, p < .001).
Willingness to make trade-‐offs (b = 0.28, p < .001), beliefs about the dangers of environmental problems (b = 0.10, p < .001) and concern about environmental problems (b = 0.10, p = .01) were significant predictors in 2010 (overall model fit was R2 = 0.16, p < .001).
Japan When cutting back on car use was predicted in 1993 amongst Japanese employees, age (b = 0.18, p < .001), having children in the household (b = -‐0.13, p = .04), willingness to make trade-‐offs (b = 0.13, p = .01) and beliefs about the dangers of environmental problems (b = 0.13, p = .01) were significant predictors. There was also a significant interaction between gender (female) and having children in the house (b = -‐0.16, p = .02). However, gender, years in education, cohabiting status, children in the household and hours of work as independent predictors were non-‐significant. The overall model fit was R2 = 0.09, p < .01. Note 2010 data for Japanese employees was not available.
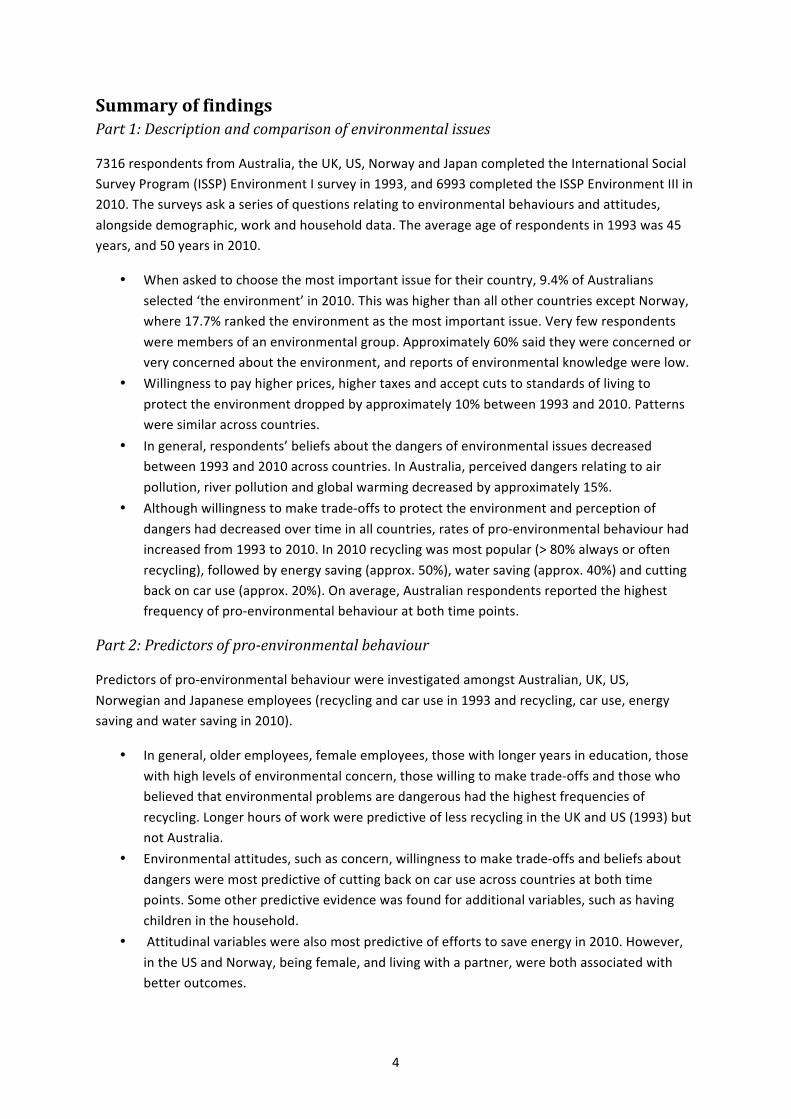
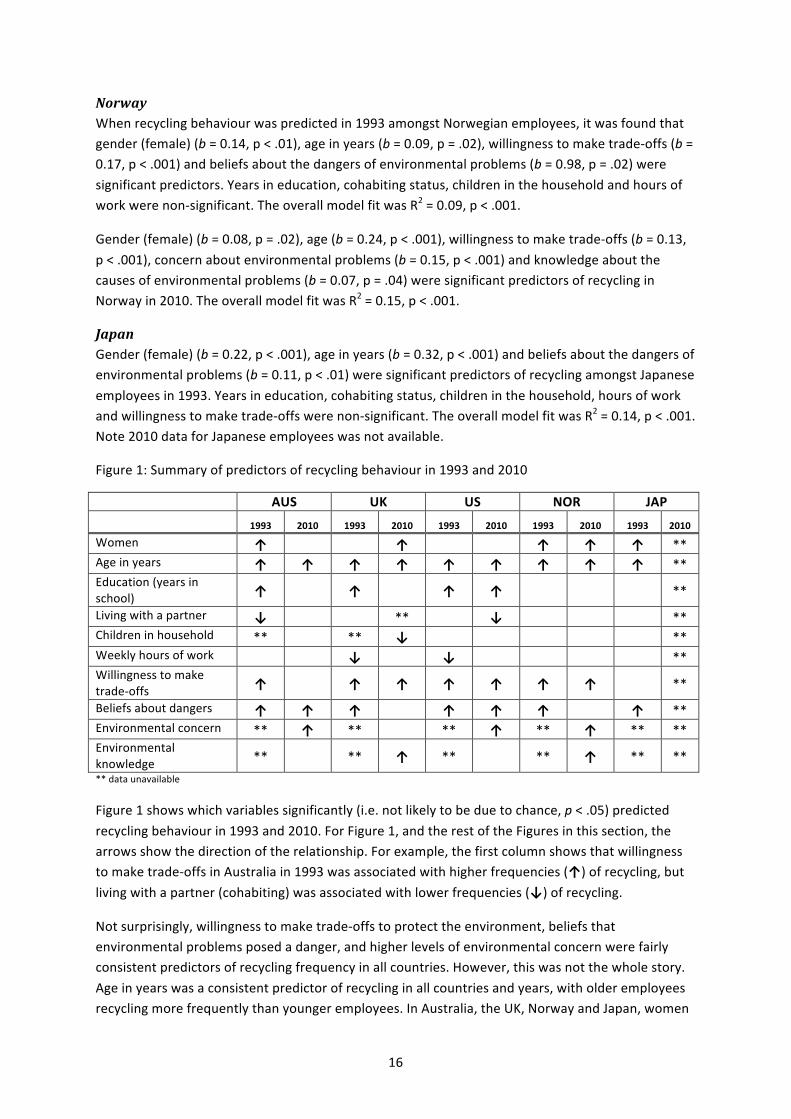
Figure 2: Summary of predictors of car use behaviour in 1993 and 2010
AUS UK US NOR JAP 1993 2010 1993 2010 1993 2010 1993 2010 1993 2010
Women ↑ ** Age in years ↑ ** Education (years in school) ↑ ↑ **
Living with a partner ↑ ↑ ** Children in household ** ** ↓ ** Weekly hours of work ↓ ** Willingness to make trade-‐offs ↑ ↑ ↑ ↑ ↑ ↑ ↑ **
Beliefs about dangers ↑ ↑ ↑ ↑ ↑ ↑ ↑ ↑ ↑ ** Environmental concern ** ↑ ** ↑ ** ↑ ** ↑ ** ** Environmental knowledge ** ↑ ** ** ** ** **
Gender*children ↓ ** ** data unavailable. An asterisk (*) between two variables shows a significant interaction.
Figure 2 shows predictors of cutting back on car use. The most consistent predictors were the attitudinal variables: beliefs about the dangers of environmental problems; environmental concern, and willingness to make trade-‐offs predicted car use in all countries. Unlike recycling behaviour, living with a partner meant that employees were more likely to cut back on driving in Australia and the US, but longer hours of work (Norway 1993) and having children in the household (Japan) were again associated with worse behavioural outcomes. Gender predicted car use only in Australia in 1993, with women reporting less car use than men. However in Japan in 1993 there was a significant interaction between gender and children, meaning that if female employees had children in the
19
household they were less likely to cut back on car use, demonstrating how combining care and work can shape environmental outcomes for women.
Predictors of energy saving 2010
Australia Years in education (b = 0.07, p = .03), beliefs about the dangers of environmental problems (b = 0.19, p < .001), concern about the environment (b = 0.27, p < .001) and knowledge about the causes of environmental problems (b = 0.13, p < .001) were significant predictors of energy saving amongst Australian employees in 2010. Gender, age, cohabiting status, children in the household, hours of work and willingness to make trade-‐offs were not significant predictors. The overall model fit was R2 = 0.20, p < .001.
UK When energy-‐saving behaviour was predicted in 2010 amongst British employees, it was found that willingness to make trade-‐offs (b = 0.16, p < .01), beliefs about the dangers of environmental problems (b = 0.16, p < .01) and concern about environmental problems (b = 0.23, p < .001) were significant predictors. Gender, age, years in education, having children in the household, hours of work and knowledge about the causes of environmental problems were non-‐significant (data for cohabiting status were unavailable). The overall model fit was R2 = 0.19, p < .001.
US For US employees, gender (female) (b = 0.08, p = .02), age in years (b = 0.08, p = .02), cohabiting status (b = 0.06, p = .05), beliefs about the dangers of environmental problems (b = 0.11, p = .01), concern about the environment (b = 0.26, p < .001) and knowledge about the causes of environmental problems (b = 0.10, p = .01) were significant predictors. Years in education, having children in the household, hours of work and willingness to make trade-‐offs were not significant predictors. The overall model fit was R2 = 0.19, p < .001.
Norway For Norwegian employees, gender (female) (b = 0.10, p = .03), cohabiting status (b = 0.07, p = .03), having children in the household (b = -‐0.21, p = .05), willingness to make trade-‐offs (b = 0.18, p < .001), beliefs about the dangers of environmental problems (b = 0.12, p < .01) and concern about environmental problems (b = 0.08, p = .04) were significant predictors. A significant interaction was also found between gender (female) and having children in the household (b = -‐ 0.22, p = .05). Age, years in education, hours of work and knowledge about the causes of environmental problems were not significant predictors (overall model fit R2 = 0.12, p < .001).

20
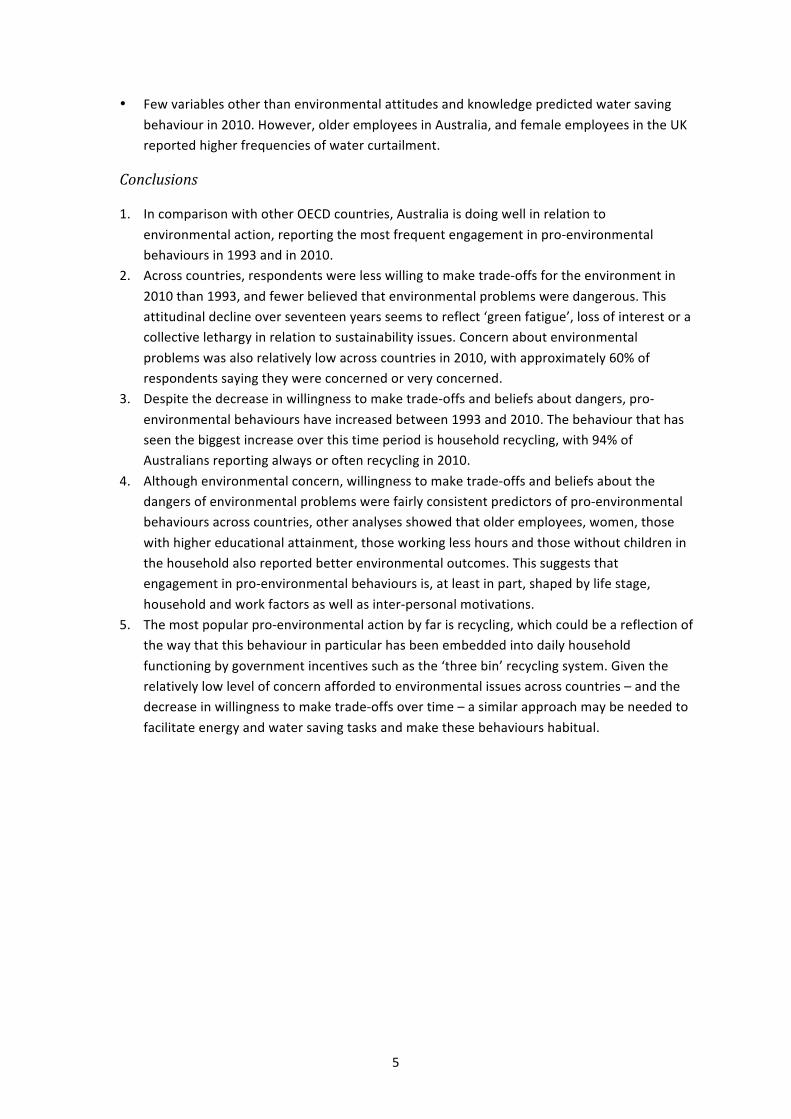
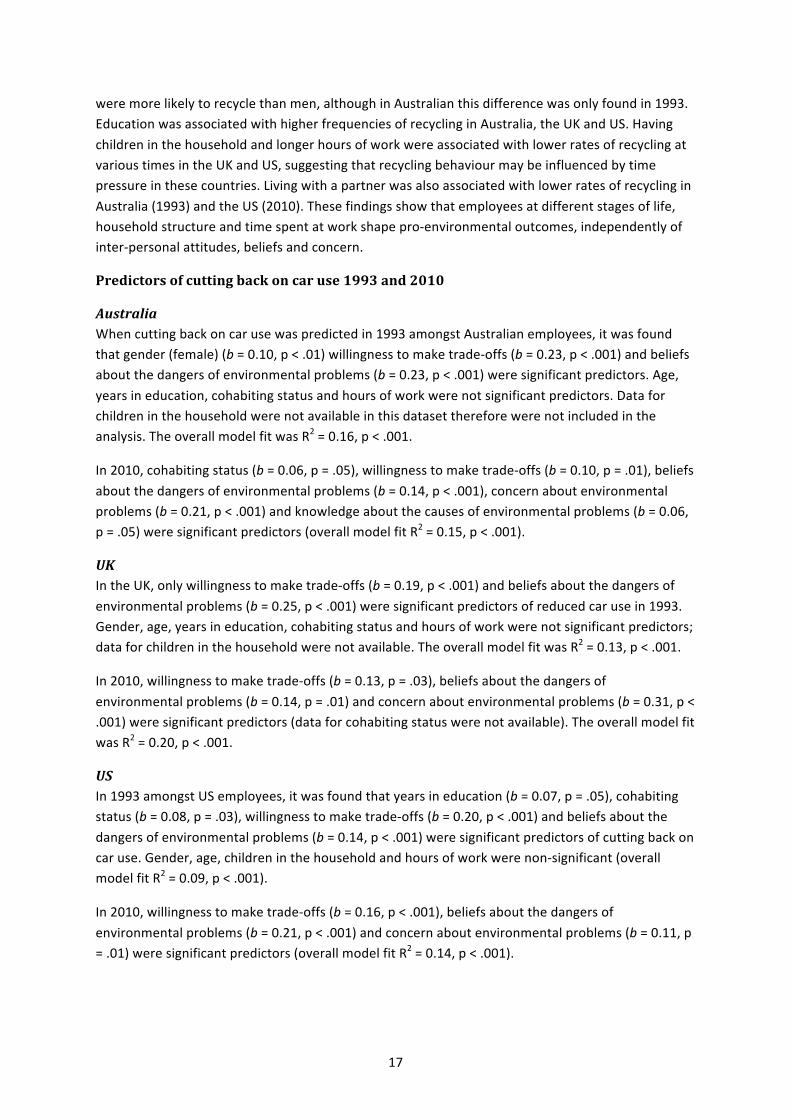
Figure 3: Summary of predictors of energy saving behaviour in 2010
AUS UK US NOR Women ↑ ↑ Age in years ↑ Education (years in school) ↑
Living with a partner ** ↑ ↑ Children in household ↓ Weekly hours of work Willingness to make trade-‐offs ↑ ↑
Beliefs about dangers ↑ ↑ ↑ ↑ Environmental concern ↑ ↑ ↑ ↑ Environmental knowledge ↑ ↑
Gender*children ↓ An asterisk (*) between two variables shows a significant interaction.
Figure 3 shows predictors of energy use in 2010. Beliefs that environmental problems are dangerous, and higher levels of environmental concern predicted energy saving in all countries. Knowledge about environmental problems was also a significant predictor in Australia and the US, and willingness to make trade-‐offs predicted energy saving in the UK and Norway. Living with a partner predicted higher frequencies of energy saving in the US and Norway, as well as being female. However, in Norway having children in the household predicted lower rates of energy saving, and the gender*children interaction show that female employees with children also save energy less frequently, again suggesting that caring responsibilities combined with work reduce the capacity for pro-‐environmental action for women. Age in years (older employees) and education predicted energy saving in Australia and the US (respectively).
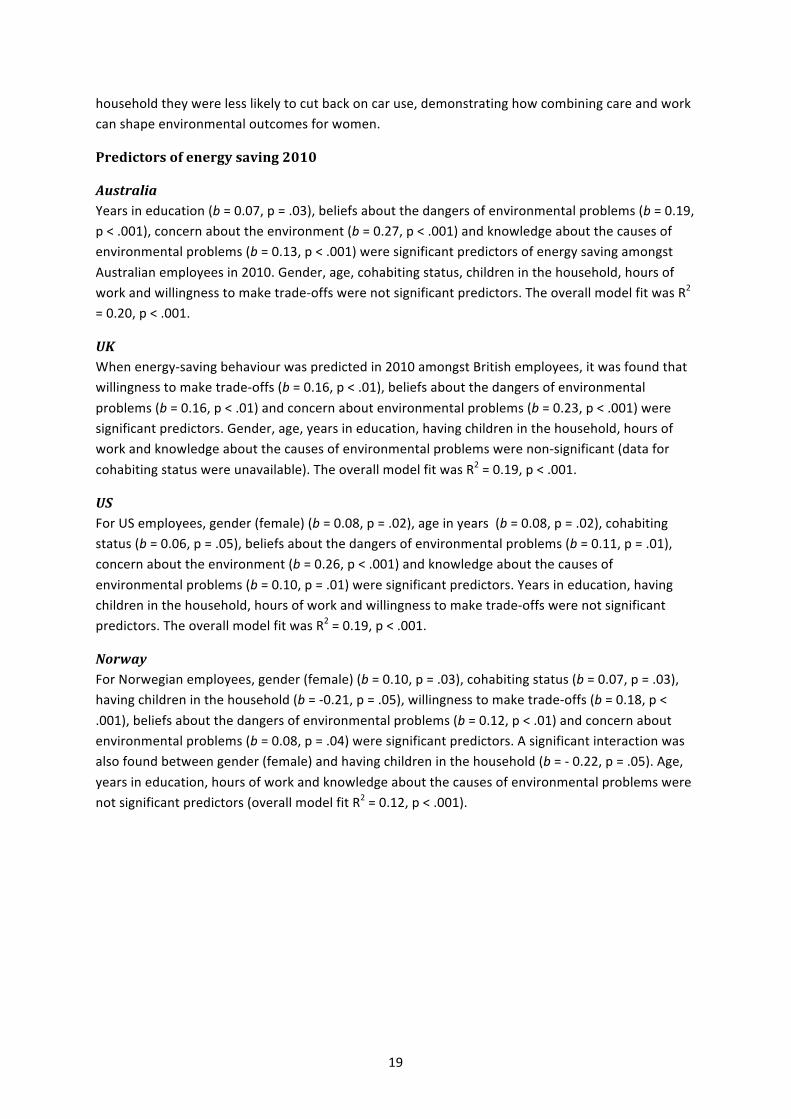
Predictors of water saving 2010
Australia When water-‐saving behaviour was predicted in 2010 amongst Australian employees, significant predictors were age in years (b = 0.10, p = .05), beliefs about the dangers of environmental problems (b = 0.12, p < .01), concern about environmental problems (b = 0.20, p < .001) and knowledge about the causes of environmental problems (b = 0.13, p < .001). Non-‐significant variables were gender, years in education, cohabiting status, children in the household, hours of work and willingness to make trade-‐offs (overall model fit was R2 = 0.12, p < .001).
UK For British employees, gender (female) (b = 0.09, p = .03), willingness to make trade-‐offs (b = 0.16, p < .01) and concern about environmental problems (b = 0.17, p < .01) were significant predictors. Age, years in education, having children in the household, hours of work, beliefs about the dangers of environmental problems and knowledge about the causes were not significant (data for cohabiting status were unavailable). The overall model fit was R2 = 0.09, p < .001.
21
US Significant predictors of water-‐saving behaviour amongst US employees were willingness to make trade-‐offs (b = 0.11, p = .01), beliefs about the dangers of environmental problems (b = 0.12, p < .01), knowledge about the causes of environmental problems (b = 0.09, p = .04) and concern about environmental problems (b = 0.14, p < .001). Gender, age, years in education, cohabiting status, having children in the household and hours of work were non-‐significant (overall model fit R2 = 0.09, p < .001).
Norway For Norwegian employees, willingness to make trade-‐offs (b = 0.08, p = .05), beliefs about the dangers of environmental problems (b = 0.15, p < .001) and concern about environmental problems (b = 0.09, p = .03) were significant predictors of water saving. Non-‐significant variables were gender, age, years in education, cohabiting status, having children in the household, hours of work and knowledge about the causes of environmental problems (overall model fit was R2 = 0.07, p < .001).
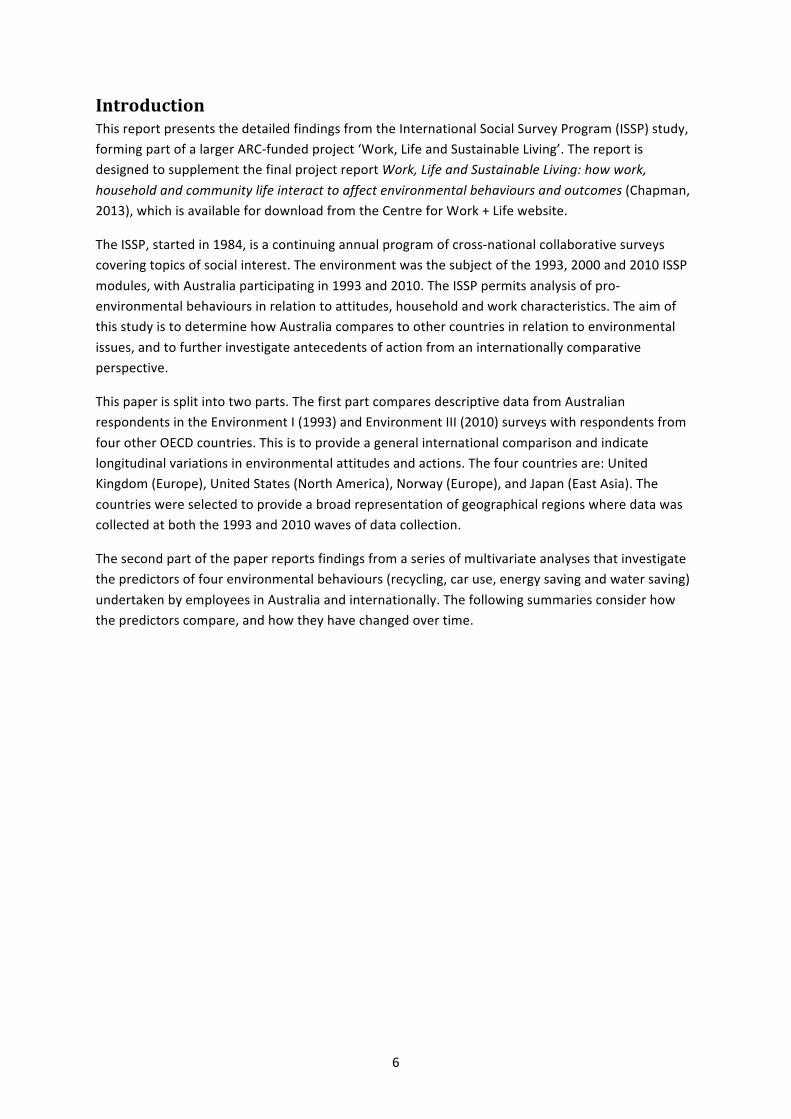
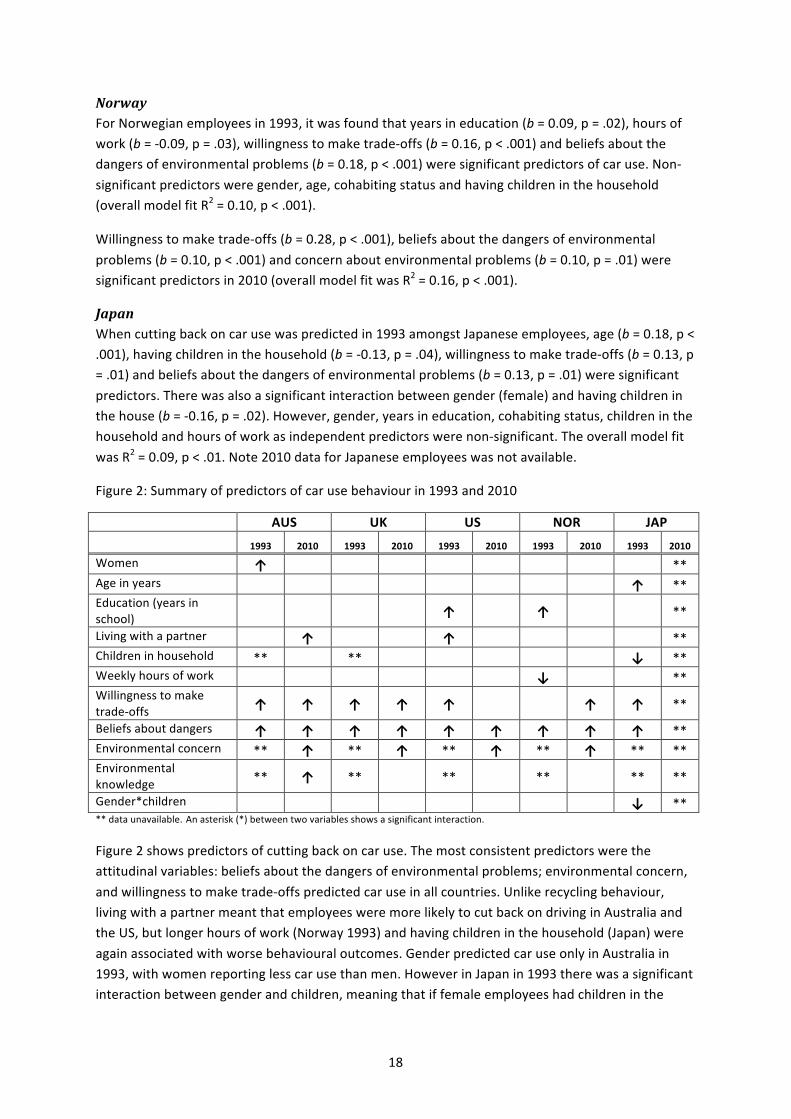
Figure 4: Summary of predictors of water saving behaviour in 2010
AUS UK US NOR Women ↑ Age in years ↑ Education (years in school)
Living with a partner ** Children in household Weekly hours of work Willingness to make trade-‐offs ↑ ↑ ↑
Beliefs about dangers ↑ ↑ ↑ Environmental concern ↑ ↑ ↑ ↑ Environmental knowledge ↑ ↑
Figure 4 shows a summary of predictors for saving water in 2010. Fewer variables were associated with water saving in this sample. Again, higher levels of environmental concern, beliefs about the dangers of environmental problems, and willingness to make trade-‐offs to protect the environment were fairly consistent predictors of water saving across countries in 2010. Knowledge about the causes of environmental problems was also predictive of a positive outcome in Australia and the US. Being an older employee was predictive of water-‐saving behaviour in Australia, and female employees reported better outcomes in the UK.
22
Conclusion In comparison with other OECD countries, Australia is doing well in relation to environmental action, reporting the most frequent engagement in pro-‐environmental behaviours in 1993 and in 2010. However, the broader findings from this report deliver mixed messages for the success of the global sustainability drive of recent years. Over the period from 1993 to 2010, environmental attitudes and concern in general have declined, suggesting an element of ‘green fatigue’. Consumers seem to be losing interest in the environmental impact of daily living, and are preoccupied with competing or more pressing priorities. Despite this, pro-‐environmental behaviour change still occurred over this time, with employees in five OECD countries reporting higher frequencies of pro-‐environmental behaviour in 2010 than in 1993.
In Australia and elsewhere, the most popular environmental behaviour by far is recycling, which in recent years has been embedded into household functioning by local authority recycling schemes. In Australia, where 94% of respondents reported always or often recycling in 2010, a ‘three-‐bin’ system has been adopted nationally, creating a culture of habitual household recycling. Incentives of this kind may be largely responsible for the changes seen in the current analyses. Given the relatively low level of priority afforded to environmental issues across countries, a similar approach may be needed to reframe energy and water saving tasks into everyday household norms.
However, factors such as gender, household structure, life stage and working arrangements were also found to shape outcomes. Longer hours of work and having children at home were associated with lower frequencies of pro-‐environmental behaviour in a number of countries. This was particularly the case for women, suggesting that men and women have difference experiences of combining work and care. Women were found to engage in pro-‐environmental action more frequently in general, which may also reflect womens’ greater involvement in daily household tasks. These findings speak to the idea of increased time pressure and work-‐life interference leading to a reduced capacity for pro-‐environmental action. On a related note, living with a partner was found to both facilitate and impede pro-‐environmental action: in Australia and the US for example, cohabiting was associated with less frequent recycling, but increased frequency of cutting back on driving. It seems that having a partner in the household may generate positive outcomes in some areas, potentially by alleviating some of the time pressure generated by managing busy working lives.
An additional finding, particularly in relation to recycling, is that older employees were more likely to engage in pro-‐environmental action than younger participants. This was also the case for water saving in Australia, car use in Japan and energy use in the US. In line with previous research, these findings suggest that pro-‐environmental action is influenced by life stage, and young people may benefit from targeted communications to encourage participation in environmental issues. In relation to transport, efforts to cut back on car use have increased from 1993 to 2010. However, frequencies remain low and in general, are resistant to change.
Finally, it should be noted that the analyses in this report were limited by the measures available in the ISSP surveys. Although statistically significant, the variables included in the multivariate analyses explained only a small proportion of the variance (between 6 and 20%), suggesting that other, unexplained factors may better predict outcomes. Nonetheless, the current analyses offer a detailed snapshot of environmental issues in Australia and internationally across a 17-‐year period, and provide insight into the household, work and attitudinal variables associated with a range of environmental outcomes.
23
Appendix 1: Variables used in analysis Demographics, household and work-‐related (1993 and 2010) (1) Gender (male / female) (2) Age (mean age) (3) Number of years in school (mean number of years) (4) Cohabiting status (cohabiting / not cohabiting) (5) Children in household (yes / no) (6) Hours worked weekly (mean hours) Environmental attitudes (1993 and 2010) (1) Willingness to make trade-‐offs for the environment ([+1 to +5] scales, very unwilling – very willing).
1. How willing would you be to pay much higher prices in order to protect the environment? 2. How willing would you be to pay much higher taxes in order to protect the environment? 3. How willing would you be to accept cuts in your standard of living in order to protect the
environment? (2) Beliefs about the dangers of specific environmental problems ([+1 to +5] scales, extremely dangerous to the environment – not dangerous at all to the environment).
1. In general, do you think air pollution caused by cars is… 2. In general, do you think that nuclear power stations are… 3. In general, do you think air pollution caused by industry is… 4. In general, do you think that pesticides and chemicals used in farming are… 5. In general, do you think that pollution of [country’s] rivers, lakes and streams is… 6. In general, do you think that a rise in the world’s temperature caused by the ‘greenhouse
effect’ is…
Environmental concern and knowledge (2010 only) (1). Concern about environmental issues ([+1 to +5] scale, not at all concerned – very concerned).
a. Generally speaking, how concerned are you about environmental issues? (2). Self-‐reported knowledge ([+1 to +5] scale, know nothing at all – know a great deal).
a. How much do you feel you know about the causes of environmental problems?
Environmental behaviours (1993 = a,b / 2010 = a,b,c,d) (1). Respondents’ behaviours undertaken to protect the environment ([+1 to +4] scales, never -‐ always).
a. How often do you make a special effort to sort glass or metal or plastic or paper and so on for recycling?
b. How often do you cut back on driving a car for environmental reasons? c. How often do you reduce the energy or fuel you use at home for environmental reasons? d. How often do you choose to save or re-‐use water for environmental reasons?

![Bagging predictors - machine-learning.martinsewell.com · 124 L. BREIMAN and Tibshirani [1993]. A critical factor in whether bagging will improve accuracy is the stability of the](https://img.pdfslide.net/doc/110x75/5dd09068d6be591ccb6199be/bagging-predictors-machine-124-l-breiman-and-tibshirani-1993-a-critical-factor.jpg)