Embed Size (px)
DESCRIPTION
Prédire l'avenir avec les médias sociaux
Citation preview
Predicting the Future With Social MediaSitaram Asur
Social Computing LabHP Labs
Palo Alto, CaliforniaEmail: [email protected]
Bernardo A. HubermanSocial Computing Lab
HP LabsPalo Alto, California
Email: [email protected]
Abstract—In recent years, social media has become ubiquitousand important for social networking and content sharing. Andyet, the content that is generated from these websites remainslargely untapped. In this paper, we demonstrate how social mediacontent can be used to predict real-world outcomes. In particular,we use the chatter from Twitter.com to forecast box-officerevenues for movies. We show that a simple model built fromthe rate at which tweets are created about particular topics canoutperform market-based predictors. We further demonstratehow sentiments extracted from Twitter can be further utilized toimprove the forecasting power of social media.
I. INTRODUCTION
Social media has exploded as a category of online discoursewhere people create content, share it, bookmark it and networkat a prodigious rate. Examples include Facebook, MySpace,Digg, Twitter and JISC listservs on the academic side. Becauseof its ease of use, speed and reach, social media is fastchanging the public discourse in society and setting trendsand agendas in topics that range from the environment andpolitics to technology and the entertainment industry.
Since social media can also be construed as a form ofcollective wisdom, we decided to investigate its power atpredicting real-world outcomes. Surprisingly, we discoveredthat the chatter of a community can indeed be used to makequantitative predictions that outperform those of artificialmarkets. These information markets generally involve thetrading of state-contingent securities, and if large enough andproperly designed, they are usually more accurate than othertechniques for extracting diffuse information, such as surveysand opinions polls. Specifically, the prices in these marketshave been shown to have strong correlations with observedoutcome frequencies, and thus are good indicators of futureoutcomes [4], [5].
In the case of social media, the enormity and high vari-ance of the information that propagates through large usercommunities presents an interesting opportunity for harnessingthat data into a form that allows for specific predictionsabout particular outcomes, without having to institute marketmechanisms. One can also build models to aggregate theopinions of the collective population and gain useful insightsinto their behavior, while predicting future trends. Moreover,gathering information on how people converse regarding par-ticular products can be helpful when designing marketing andadvertising campaigns [1], [3].
This paper reports on such a study. Specifically we considerthe task of predicting box-office revenues for movies usingthe chatter from Twitter, one of the fastest growing socialnetworks in the Internet. Twitter 1, a micro-blogging network,has experienced a burst of popularity in recent months leadingto a huge user-base, consisting of several tens of millions ofusers who actively participate in the creation and propagationof content.
We have focused on movies in this study for two mainreasons.
• The topic of movies is of considerable interest amongthe social media user community, characterized both bylarge number of users discussing movies, as well as asubstantial variance in their opinions.
• The real-world outcomes can be easily observed frombox-office revenue for movies.
Our goals in this paper are as follows. First, we assess howbuzz and attention is created for different movies and how thatchanges over time. Movie producers spend a lot of effort andmoney in publicizing their movies, and have also embracedthe Twitter medium for this purpose. We then focus on themechanism of viral marketing and pre-release hype on Twitter,and the role that attention plays in forecasting real-world box-office performance. Our hypothesis is that movies that are welltalked about will be well-watched.
Next, we study how sentiments are created, how positive andnegative opinions propagate and how they influence people.For a bad movie, the initial reviews might be enough todiscourage others from watching it, while on the other hand, itis possible for interest to be generated by positive reviews andopinions over time. For this purpose, we perform sentimentanalysis on the data, using text classifiers to distinguishpositively oriented tweets from negative.
Our chief conclusions are as follows:• We show that social media feeds can be effective indica-
tors of real-world performance.• We discovered that the rate at which movie tweets
are generated can be used to build a powerful modelfor predicting movie box-office revenue. Moreover ourpredictions are consistently better than those producedby an information market such as the Hollywood StockExchange, the gold standard in the industry [4].
1http://www.twitter.com
• Our analysis of the sentiment content in the tweets showsthat they can improve box-office revenue predictionsbased on tweet rates only after the movies are released.
This paper is organized as follows. Next, we survey recentrelated work. We then provide a short introduction to Twitterand the dataset that we collected. In Section 5, we study howattention and popularity are created and how they evolve.We then discuss our study on using tweets from Twitterfor predicting movie performance. In Section 6, we presentour analysis on sentiments and their effects. We concludein Section 7. We describe our prediction model in a generalcontext in the Appendix.
II. RELATED WORK
Although Twitter has been very popular as a web service,there has not been considerable published research on it.Huberman and others [2] studied the social interactions onTwitter to reveal that the driving process for usage is a sparsehidden network underlying the friends and followers, whilemost of the links represent meaningless interactions. Java etal [7] investigated community structure and isolated differenttypes of user intentions on Twitter. Jansen and others [3]have examined Twitter as a mechanism for word-of-mouthadvertising, and considered particular brands and productswhile examining the structure of the postings and the change insentiments. However the authors do not perform any analysison the predictive aspect of Twitter.
There has been some prior work on analyzing the correlationbetween blog and review mentions and performance. Gruhland others [9] showed how to generate automated queriesfor mining blogs in order to predict spikes in book sales.And while there has been research on predicting moviesales, almost all of them have used meta-data informationon the movies themselves to perform the forecasting, suchas the movies genre, MPAA rating, running time, releasedate, the number of screens on which the movie debuted,and the presence of particular actors or actresses in the cast.Joshi and others [10] use linear regression from text andmetadata features to predict earnings for movies. Mishne andGlance [15] correlate sentiments in blog posts with moviebox-office scores. The correlations they observed for positivesentiments are fairly low and not sufficient to use for predictivepurposes. Sharda and Delen [8] have treated the predictionproblem as a classification problem and used neural networksto classify movies into categories ranging from ’flop’ to’blockbuster’. Apart from the fact that they are predictingranges over actual numbers, the best accuracy that their modelcan achieve is fairly low. Zhang and Skiena [6] have useda news aggregation model along with IMDB data to predictmovie box-office numbers. We have shown how our modelcan generate better results when compared to their method.
III. TWITTER
Launched on July 13, 2006, Twitter 2 is an extremelypopular online microblogging service. It has a very large user
2http://www.twitter.com
base, consisting of several millions of users (23M unique usersin Jan 3). It can be considered a directed social network, whereeach user has a set of subscribers known as followers. Eachuser submits periodic status updates, known as tweets, thatconsist of short messages of maximum size 140 characters.These updates typically consist of personal information aboutthe users, news or links to content such as images, videoand articles. The posts made by a user are displayed on theuser’s profile page, as well as shown to his/her followers. It isalso possible to send a direct message to another user. Suchmessages are preceded by @userid indicating the intendeddestination.
A retweet is a post originally made by one user that isforwarded by another user. These retweets are a popular meansof propagating interesting posts and links through the Twittercommunity.
Twitter has attracted lots of attention from corporationsfor the immense potential it provides for viral marketing.Due to its huge reach, Twitter is increasingly used by newsorganizations to filter news updates through the community.A number of businesses and organizations are using Twitteror similar micro-blogging services to advertise products anddisseminate information to stakeholders.
IV. DATASET CHARACTERISTICS
The dataset that we used was obtained by crawling hourlyfeed data from Twitter.com. To ensure that we obtained alltweets referring to a movie, we used keywords present in themovie title as search arguments. We extracted tweets overfrequent intervals using the Twitter Search Api 4, therebyensuring we had the timestamp, author and tweet text forour analysis. We extracted 2.89 million tweets referring to 24different movies released over a period of three months.
Movies are typically released on Fridays, with the exceptionof a few which are released on Wednesday. Since an average of2 new movies are released each week, we collected data overa time period of 3 months from November to February to havesufficient data to measure predictive behavior. For consistency,we only considered the movies released on a Friday and onlythose in wide release. For movies that were initially in limitedrelease, we began collecting data from the time it becamewide. For each movie, we define the critical period as thetime from the week before it is released, when the promotionalcampaigns are in full swing, to two weeks after release, whenits initial popularity fades and opinions from people have beendisseminated.
Some details on the movies chosen and their release datesare provided in Table 1. Note that, some movies that werereleased during the period considered were not used in thisstudy, simply because it was difficult to correctly identifytweets that were relevant to those movies. For instance,for the movie 2012, it was impractical to segregate tweetstalking about the movie, from those referring to the year. We
3http://blog.compete.com/2010/02/24/compete-ranks-top-sites-for-january-2010/
4http://search.twitter.com/api/
Movie Release DateArmored 2009-12-04Avatar 2009-12-18
The Blind Side 2009-11-20The Book of Eli 2010-01-15
Daybreakers 2010-01-08Dear John 2010-02-05
Did You Hear About The Morgans 2009-12-18Edge Of Darkness 2010-01-29
Extraordinary Measures 2010-01-22From Paris With Love 2010-02-05
The Imaginarium of Dr Parnassus 2010-01-08Invictus 2009-12-11
Leap Year 2010-01-08Legion 2010-01-22
Twilight : New Moon 2009-11-20Pirate Radio 2009-11-13
Princess And The Frog 2009-12-11Sherlock Holmes 2009-12-25Spy Next Door 2010-01-15
The Crazies 2010-02-26Tooth Fairy 2010-01-22
Transylmania 2009-12-04When In Rome 2010-01-29Youth In Revolt 2010-01-08
TABLE INAMES AND RELEASE DATES FOR THE MOVIES WE CONSIDERED IN OUR
ANALYSIS.
have taken care to ensure that the data we have used wasdisambiguated and clean by choosing appropriate keywordsand performing sanity checks.
2 4 6 8 10 12 14 16 18 20
500
1000
1500
2000
2500
3000
3500
4000
4500
release weekend weekend 2
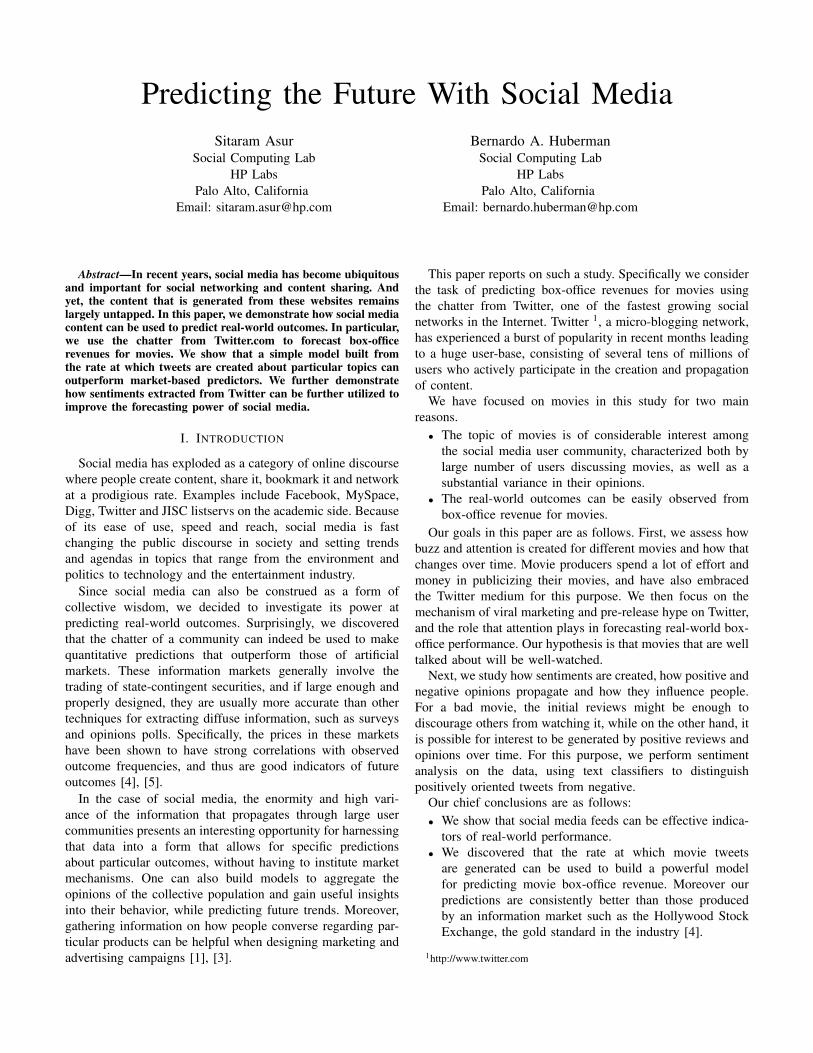
Fig. 1. Time-series of tweets over the critical period for different movies.
The total data over the critical period for the 24 movieswe considered includes 2.89 million tweets from 1.2 millionusers.
Fig 1 shows the timeseries trend in the number of tweetsfor movies over the critical period. We can observe that thebusiest time for a movie is around the time it is released,following which the chatter invariably fades. The box-officerevenue follows a similar trend with the opening weekendgenerally providing the most revenue for a movie.
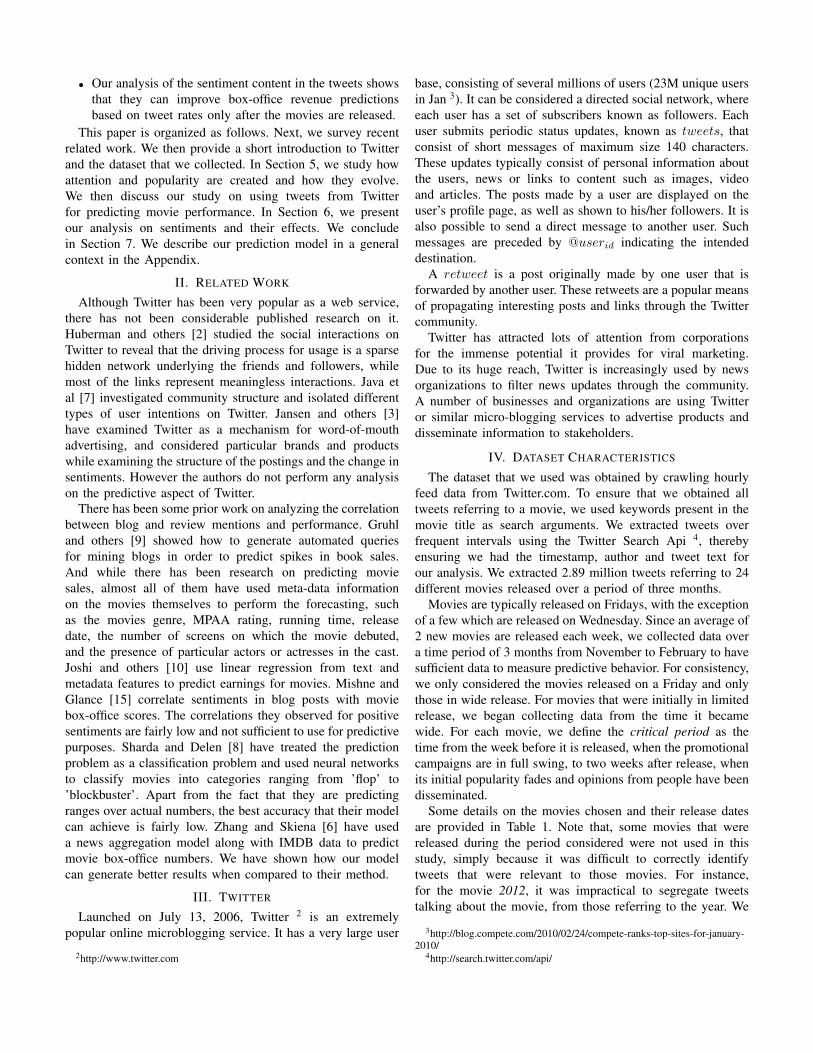
Fig 2 shows how the number of tweets per unique authorchanges over time. We find that this ratio remains fairlyconsistent with a value between 1 and 1.5 across the critical
2 4 6 8 10 12 14 16 18 201
1.1
1.2
1.3
1.4
1.5
1.6
1.7
1.8
1.9
2
Days
Tw
eets
per
auth
ors
Release weekend
Fig. 2. Number of tweets per unique authors for different movies
0 1 2 3 4 5 6 7 80
2
4
6
8
10
12
14
log(tweets)
log(f
requency)
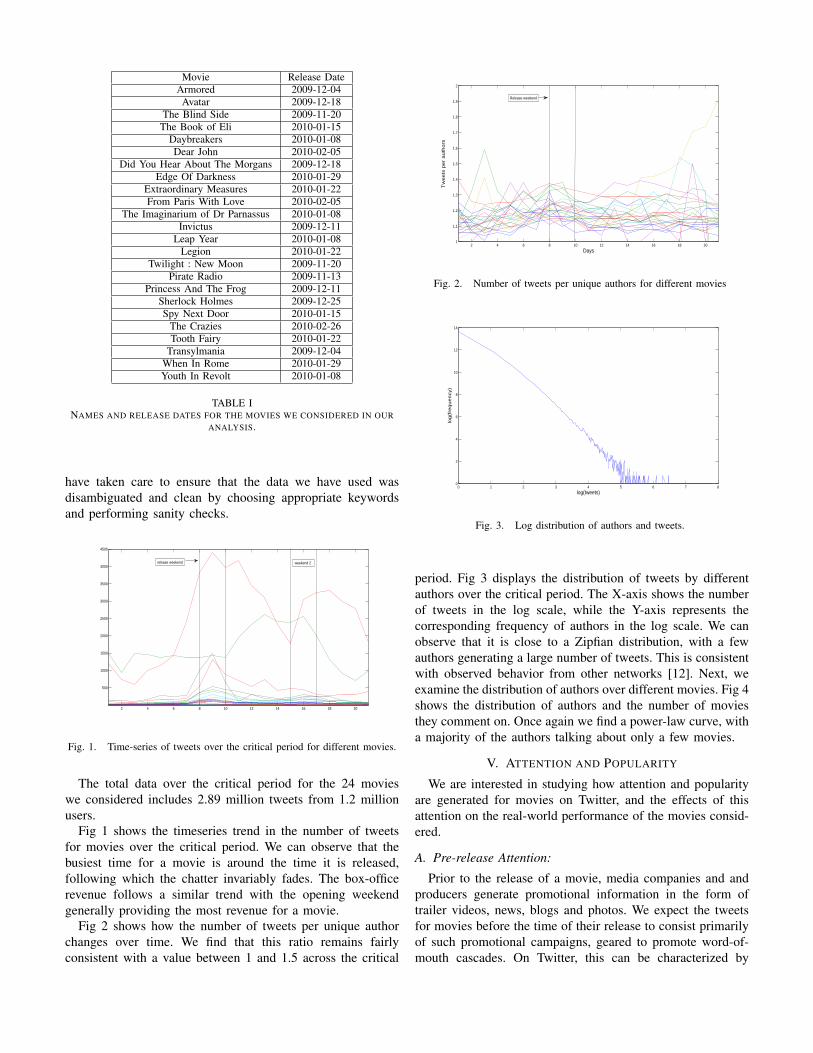
Fig. 3. Log distribution of authors and tweets.
period. Fig 3 displays the distribution of tweets by differentauthors over the critical period. The X-axis shows the numberof tweets in the log scale, while the Y-axis represents thecorresponding frequency of authors in the log scale. We canobserve that it is close to a Zipfian distribution, with a fewauthors generating a large number of tweets. This is consistentwith observed behavior from other networks [12]. Next, weexamine the distribution of authors over different movies. Fig 4shows the distribution of authors and the number of moviesthey comment on. Once again we find a power-law curve, witha majority of the authors talking about only a few movies.
V. ATTENTION AND POPULARITY
We are interested in studying how attention and popularityare generated for movies on Twitter, and the effects of thisattention on the real-world performance of the movies consid-ered.
A. Pre-release Attention:
Prior to the release of a movie, media companies and andproducers generate promotional information in the form oftrailer videos, news, blogs and photos. We expect the tweetsfor movies before the time of their release to consist primarilyof such promotional campaigns, geared to promote word-of-mouth cascades. On Twitter, this can be characterized by
2 4 6 8 10 12 14 16 18 20 22 240
1
2
3
4
5
6
7
8
9
10x 10
5
Number of Movies
Au
tho
rs
Fig. 4. Distribution of total authors and the movies they comment on.
Features Week 0 Week 1 Week 2url 39.5 25.5 22.5
retweet 12.1 12.1 11.66
TABLE IIURL AND RETWEET PERCENTAGES FOR CRITICAL WEEK
tweets referring to particular urls (photos, trailers and otherpromotional material) as well as retweets, which involve usersforwarding tweet posts to everyone in their friend-list. Boththese forms of tweets are important to disseminate informationregarding movies being released.
First, we examine the distribution of such tweets for dif-ferent movies, following which we examine their correlationwith the performance of the movies.
2 4 6 8 10 12 14 16 18 20 22 240
0.1
0.2
0.3
0.4
0.5
0.6
0.7
Movies
Tw
eets
with u
rls (
perc
enta
ge)
Week 0Week 1Week 2
Fig. 5. Percentages of urls in tweets for different movies.
Table 2 shows the percentages of urls and retweets in the
Features Correlation R2
url 0.64 0.39retweet 0.5 0.20
TABLE IIICORRELATION AND R2 VALUES FOR URLS AND RETWEETS BEFORE
RELEASE.
Features Adjusted R2 p-valueAvg Tweet-rate 0.80 3.65e-09
Tweet-rate timeseries 0.93 5.279e-09Tweet-rate timeseries + thcnt 0.973 9.14e-12
HSX timeseries + thcnt 0.965 1.030e-10
TABLE IVCOEFFICIENT OF DETERMINATION (R2) VALUES USING DIFFERENT
PREDICTORS FOR MOVIE BOX-OFFICE REVENUE FOR THE FIRST WEEKEND.
tweets over the critical period for movies. We can observe thatthere is a greater percentage of tweets containing urls in theweek prior to release than afterwards. This is consistent withour expectation. In the case of retweets, we find the values tobe similar across the 3 weeks considered. In all, we found theretweets to be a significant minority of the tweets on movies.One reason for this could be that people tend to describe theirown expectations and experiences, which are not necessarilypropaganda.
We want to determine whether movies that have greaterpublicity, in terms of linked urls on Twitter, perform better inthe box office. When we examined the correlation between theurls and retweets with the box-office performance, we foundthe correlation to be moderately positive, as shown in Table3. However, the adjusted R2 value is quite low in both cases,indicating that these features are not very predictive of therelative performance of movies. This result is quite surprisingsince we would expect promotional material to contributesignificantly to a movie’s box-office income.
B. Prediction of first weekend Box-office revenues
Next, we investigate the power of social media in predictingreal-world outcomes. Our goal is to observe if the knowledgethat can be extracted from the tweets can lead to reasonablyaccurate prediction of future outcomes in the real world.
The problem that we wish to tackle can be framed asfollows. Using the tweets referring to movies prior to theirrelease, can we accurately predict the box-office revenuegenerated by the movie in its opening weekend?
0 2 4 6 8 10 12 14 16
x 107
0
5
10
15x 10
7
Predicted Box−office Revenue
Actu
al re
ve
nu
e
Tweet−rateHSX
Fig. 6. Predicted vs Actual box office scores using tweet-rate and HSXpredictors
To use a quantifiable measure on the tweets, we define thetweet-rate, as the number of tweets referring to a particularmovie per hour.
Tweet− rate(mov) = |tweets(mov)||Time (in hours)|
(1)
Our initial analysis of the correlation of the average tweet-rate with the box-office gross for the 24 movies consideredshowed a strong positive correlation, with a correlation coeffi-cient value of 0.90. This suggests a strong linear relationshipamong the variables considered. Accordingly, we constructeda linear regression model using least squares of the averageof all tweets for the 24 movies considered over the weekprior to their release. We obtained an adjusted R2 valueof 0.80 with a p-value of 3.65e − 09 ∗ ∗∗, where the ’***’shows significance at 0.001, indicating a very strong predictiverelationship. Notice that this performance was achieved usingonly one variable (the average tweet rate). To evaluate ourpredictions, we employed real box-office revenue information,extracted from the Box Office Mojo website 5.
The movie Transylmania that opened on Dec 4th hadeasily the lowest tweet-rates of all movies considered. Forthe week prior to its release, it received on an average 2.75tweets per hour. As a result of this lack of attention, themovie captured the record for the lowest-grossing opening fora movie playing at over 1,000 sites, making only $263,941in its opening weekend, and was subsequently pulled fromtheaters at the end of the second week. On the other endof the spectrum, two movies that made big splashes in theiropening weekends, Twilight:New Moon (making 142M) andAvatar(making 77M) had, for their pre-release week, averagesof 1365.8 and 1212.8 tweets per hour respectively. This onceagain illustrates the importance of attention in social media.
Next, we performed a linear regression of the time seriesvalues of the tweet-rate for the 7 days before the release.We used 7 variables each corresponding to the tweet-ratefor a particular day. An additional variable we used was thenumber of theaters the movies were released in, thcnt. Theresults of the regression experiments are shown in Table 4.Note that, in all cases, we are using only data available priorto the release to predict box-office for the opening weekend.
Comparison with HSX:To compare with our tweet-based model, we used the Hol-lywood Stock Exchange index. The fact that artificial onlinemarkets such as the Foresight Exchange and the HollywoodStock Exchange are good indicators of future outcomes hasbeen shown previously [4], [5]. The prices in these marketshave been shown to have strong correlations with observedoutcome frequencies. In the case of movies, the HollywoodStock Exchange (http://www.hsx.com/), is a popular play-money market, where the prices for movie stocks can ac-curately predict real box office results. Hence, to comparewith our tweet-rate predictor, we considered regression on
5http://boxofficemojo.com
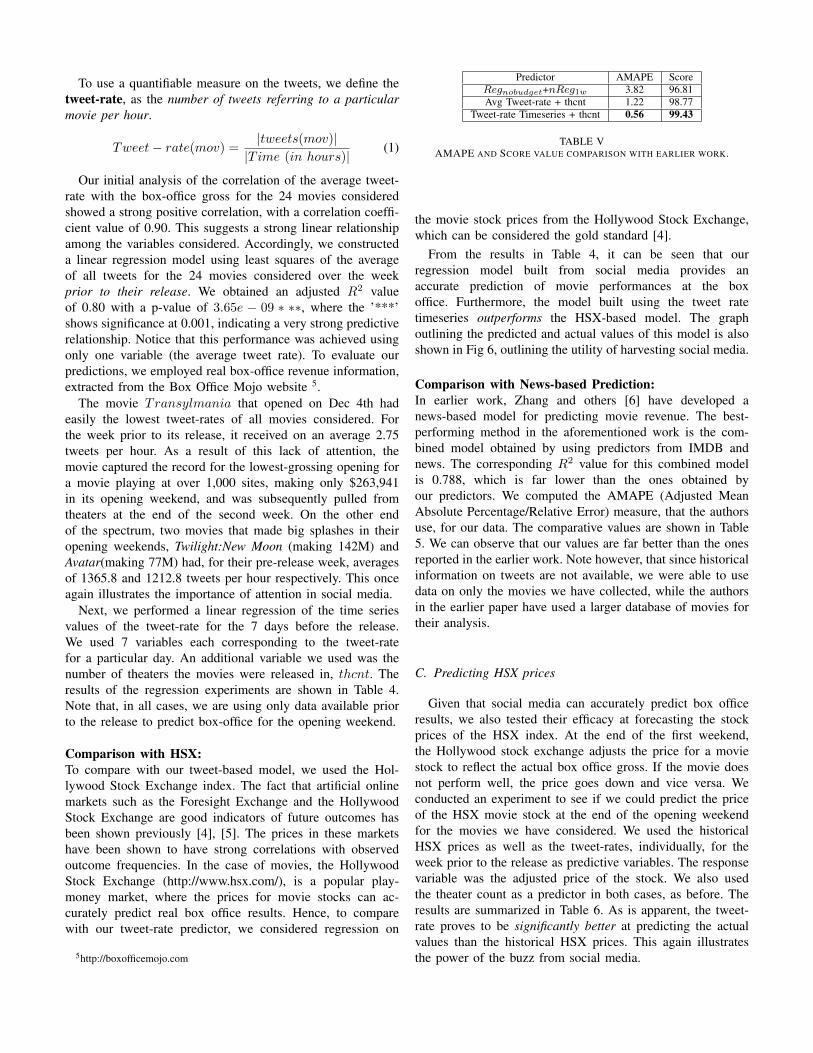
Predictor AMAPE ScoreRegnobudget+nReg1w 3.82 96.81Avg Tweet-rate + thcnt 1.22 98.77
Tweet-rate Timeseries + thcnt 0.56 99.43
TABLE VAMAPE AND SCORE VALUE COMPARISON WITH EARLIER WORK.
the movie stock prices from the Hollywood Stock Exchange,which can be considered the gold standard [4].
From the results in Table 4, it can be seen that ourregression model built from social media provides anaccurate prediction of movie performances at the boxoffice. Furthermore, the model built using the tweet ratetimeseries outperforms the HSX-based model. The graphoutlining the predicted and actual values of this model is alsoshown in Fig 6, outlining the utility of harvesting social media.
Comparison with News-based Prediction:In earlier work, Zhang and others [6] have developed anews-based model for predicting movie revenue. The best-performing method in the aforementioned work is the com-bined model obtained by using predictors from IMDB andnews. The corresponding R2 value for this combined modelis 0.788, which is far lower than the ones obtained byour predictors. We computed the AMAPE (Adjusted MeanAbsolute Percentage/Relative Error) measure, that the authorsuse, for our data. The comparative values are shown in Table5. We can observe that our values are far better than the onesreported in the earlier work. Note however, that since historicalinformation on tweets are not available, we were able to usedata on only the movies we have collected, while the authorsin the earlier paper have used a larger database of movies fortheir analysis.
C. Predicting HSX prices
Given that social media can accurately predict box officeresults, we also tested their efficacy at forecasting the stockprices of the HSX index. At the end of the first weekend,the Hollywood stock exchange adjusts the price for a moviestock to reflect the actual box office gross. If the movie doesnot perform well, the price goes down and vice versa. Weconducted an experiment to see if we could predict the priceof the HSX movie stock at the end of the opening weekendfor the movies we have considered. We used the historicalHSX prices as well as the tweet-rates, individually, for theweek prior to the release as predictive variables. The responsevariable was the adjusted price of the stock. We also usedthe theater count as a predictor in both cases, as before. Theresults are summarized in Table 6. As is apparent, the tweet-rate proves to be significantly better at predicting the actualvalues than the historical HSX prices. This again illustratesthe power of the buzz from social media.
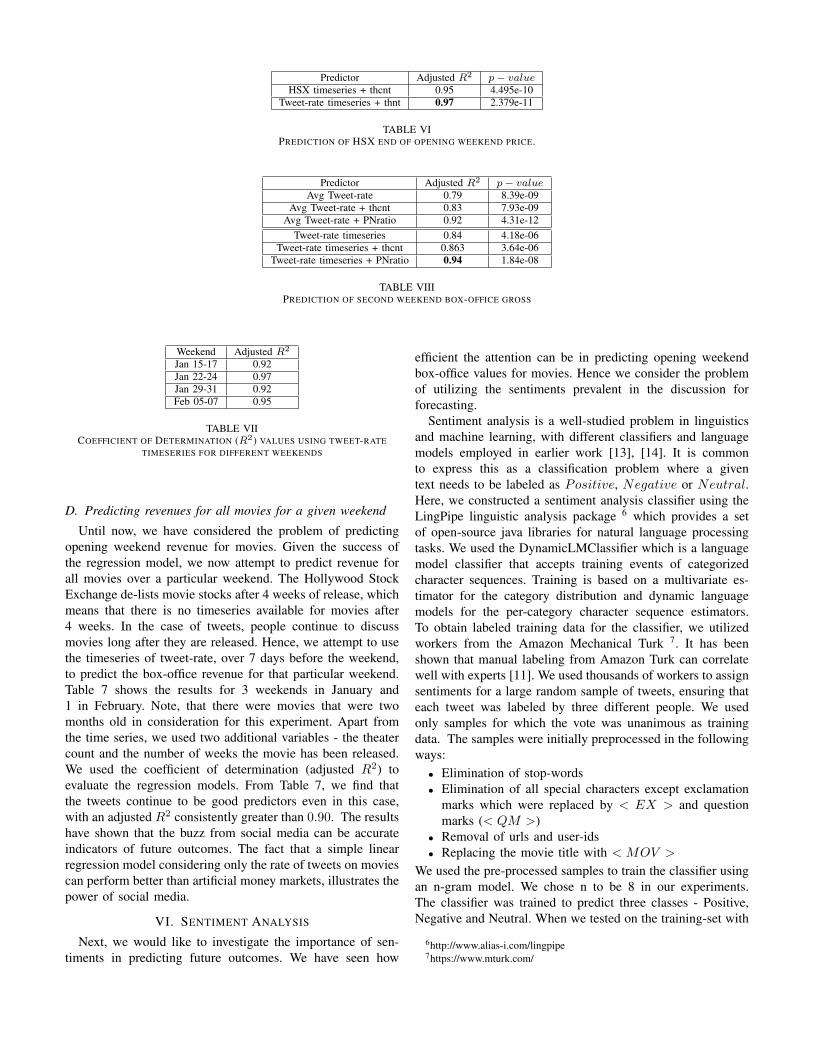
Predictor Adjusted R2 p− valueHSX timeseries + thcnt 0.95 4.495e-10
Tweet-rate timeseries + thnt 0.97 2.379e-11
TABLE VIPREDICTION OF HSX END OF OPENING WEEKEND PRICE.
Predictor Adjusted R2 p− valueAvg Tweet-rate 0.79 8.39e-09
Avg Tweet-rate + thcnt 0.83 7.93e-09Avg Tweet-rate + PNratio 0.92 4.31e-12
Tweet-rate timeseries 0.84 4.18e-06Tweet-rate timeseries + thcnt 0.863 3.64e-06
Tweet-rate timeseries + PNratio 0.94 1.84e-08
TABLE VIIIPREDICTION OF SECOND WEEKEND BOX-OFFICE GROSS
Weekend Adjusted R2
Jan 15-17 0.92Jan 22-24 0.97Jan 29-31 0.92Feb 05-07 0.95
TABLE VIICOEFFICIENT OF DETERMINATION (R2) VALUES USING TWEET-RATE
TIMESERIES FOR DIFFERENT WEEKENDS
D. Predicting revenues for all movies for a given weekend
Until now, we have considered the problem of predictingopening weekend revenue for movies. Given the success ofthe regression model, we now attempt to predict revenue forall movies over a particular weekend. The Hollywood StockExchange de-lists movie stocks after 4 weeks of release, whichmeans that there is no timeseries available for movies after4 weeks. In the case of tweets, people continue to discussmovies long after they are released. Hence, we attempt to usethe timeseries of tweet-rate, over 7 days before the weekend,to predict the box-office revenue for that particular weekend.Table 7 shows the results for 3 weekends in January and1 in February. Note, that there were movies that were twomonths old in consideration for this experiment. Apart fromthe time series, we used two additional variables - the theatercount and the number of weeks the movie has been released.We used the coefficient of determination (adjusted R2) toevaluate the regression models. From Table 7, we find thatthe tweets continue to be good predictors even in this case,with an adjusted R2 consistently greater than 0.90. The resultshave shown that the buzz from social media can be accurateindicators of future outcomes. The fact that a simple linearregression model considering only the rate of tweets on moviescan perform better than artificial money markets, illustrates thepower of social media.
VI. SENTIMENT ANALYSIS
Next, we would like to investigate the importance of sen-timents in predicting future outcomes. We have seen how
efficient the attention can be in predicting opening weekendbox-office values for movies. Hence we consider the problemof utilizing the sentiments prevalent in the discussion forforecasting.
Sentiment analysis is a well-studied problem in linguisticsand machine learning, with different classifiers and languagemodels employed in earlier work [13], [14]. It is commonto express this as a classification problem where a giventext needs to be labeled as Positive, Negative or Neutral.Here, we constructed a sentiment analysis classifier using theLingPipe linguistic analysis package 6 which provides a setof open-source java libraries for natural language processingtasks. We used the DynamicLMClassifier which is a languagemodel classifier that accepts training events of categorizedcharacter sequences. Training is based on a multivariate es-timator for the category distribution and dynamic languagemodels for the per-category character sequence estimators.To obtain labeled training data for the classifier, we utilizedworkers from the Amazon Mechanical Turk 7. It has beenshown that manual labeling from Amazon Turk can correlatewell with experts [11]. We used thousands of workers to assignsentiments for a large random sample of tweets, ensuring thateach tweet was labeled by three different people. We usedonly samples for which the vote was unanimous as trainingdata. The samples were initially preprocessed in the followingways:
• Elimination of stop-words• Elimination of all special characters except exclamation
marks which were replaced by < EX > and questionmarks (< QM >)
• Removal of urls and user-ids• Replacing the movie title with < MOV >
We used the pre-processed samples to train the classifier usingan n-gram model. We chose n to be 8 in our experiments.The classifier was trained to predict three classes - Positive,Negative and Neutral. When we tested on the training-set with
6http://www.alias-i.com/lingpipe7https://www.mturk.com/
0
0.2
0.4
0.6
0.8
1
1.2
1.4
1.6
1 2 3 4 5 6 7 8 9 10 11 12 13 14 15 16 17 18 19 20 21 22 23 24
Movie Subjectivity
Week 0 Week 1 Week 2
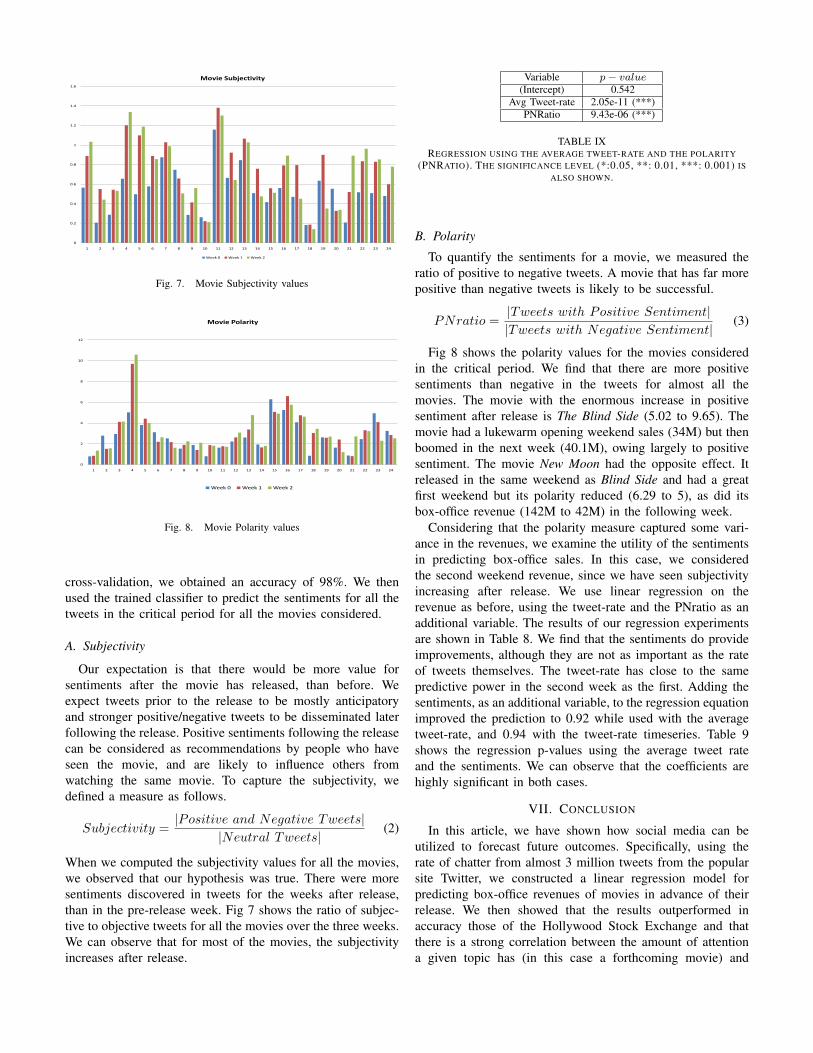
Fig. 7. Movie Subjectivity values
0
2
4
6
8
10
12
1 2 3 4 5 6 7 8 9 10 11 12 13 14 15 16 17 18 19 20 21 22 23 24
Movie Polarity
Week 0 Week 1 Week 2
Fig. 8. Movie Polarity values
cross-validation, we obtained an accuracy of 98%. We thenused the trained classifier to predict the sentiments for all thetweets in the critical period for all the movies considered.
A. Subjectivity
Our expectation is that there would be more value forsentiments after the movie has released, than before. Weexpect tweets prior to the release to be mostly anticipatoryand stronger positive/negative tweets to be disseminated laterfollowing the release. Positive sentiments following the releasecan be considered as recommendations by people who haveseen the movie, and are likely to influence others fromwatching the same movie. To capture the subjectivity, wedefined a measure as follows.
Subjectivity =|Positive and Negative Tweets|
|Neutral Tweets|(2)
When we computed the subjectivity values for all the movies,we observed that our hypothesis was true. There were moresentiments discovered in tweets for the weeks after release,than in the pre-release week. Fig 7 shows the ratio of subjec-tive to objective tweets for all the movies over the three weeks.We can observe that for most of the movies, the subjectivityincreases after release.
Variable p− value(Intercept) 0.542
Avg Tweet-rate 2.05e-11 (***)PNRatio 9.43e-06 (***)
TABLE IXREGRESSION USING THE AVERAGE TWEET-RATE AND THE POLARITY
(PNRATIO). THE SIGNIFICANCE LEVEL (*:0.05, **: 0.01, ***: 0.001) ISALSO SHOWN.
B. Polarity
To quantify the sentiments for a movie, we measured theratio of positive to negative tweets. A movie that has far morepositive than negative tweets is likely to be successful.
PNratio =|Tweets with Positive Sentiment||Tweets with Negative Sentiment|
(3)
Fig 8 shows the polarity values for the movies consideredin the critical period. We find that there are more positivesentiments than negative in the tweets for almost all themovies. The movie with the enormous increase in positivesentiment after release is The Blind Side (5.02 to 9.65). Themovie had a lukewarm opening weekend sales (34M) but thenboomed in the next week (40.1M), owing largely to positivesentiment. The movie New Moon had the opposite effect. Itreleased in the same weekend as Blind Side and had a greatfirst weekend but its polarity reduced (6.29 to 5), as did itsbox-office revenue (142M to 42M) in the following week.
Considering that the polarity measure captured some vari-ance in the revenues, we examine the utility of the sentimentsin predicting box-office sales. In this case, we consideredthe second weekend revenue, since we have seen subjectivityincreasing after release. We use linear regression on therevenue as before, using the tweet-rate and the PNratio as anadditional variable. The results of our regression experimentsare shown in Table 8. We find that the sentiments do provideimprovements, although they are not as important as the rateof tweets themselves. The tweet-rate has close to the samepredictive power in the second week as the first. Adding thesentiments, as an additional variable, to the regression equationimproved the prediction to 0.92 while used with the averagetweet-rate, and 0.94 with the tweet-rate timeseries. Table 9shows the regression p-values using the average tweet rateand the sentiments. We can observe that the coefficients arehighly significant in both cases.
VII. CONCLUSION
In this article, we have shown how social media can beutilized to forecast future outcomes. Specifically, using therate of chatter from almost 3 million tweets from the popularsite Twitter, we constructed a linear regression model forpredicting box-office revenues of movies in advance of theirrelease. We then showed that the results outperformed inaccuracy those of the Hollywood Stock Exchange and thatthere is a strong correlation between the amount of attentiona given topic has (in this case a forthcoming movie) and
its ranking in the future. We also analyzed the sentimentspresent in tweets and demonstrated their efficacy at improvingpredictions after a movie has released.
While in this study we focused on the problem of predictingbox office revenues of movies for the sake of having a clearmetric of comparison with other methods, this method can beextended to a large panoply of topics, ranging from the futurerating of products to agenda setting and election outcomes. Ata deeper level, this work shows how social media expresses acollective wisdom which, when properly tapped, can yield anextremely powerful and accurate indicator of future outcomes.
VIII. APPENDIX: GENERAL PREDICTION MODEL FORSOCIAL MEDIA
Although we focused on movie revenue prediction in thispaper, the method that we advocate can be extended to otherproducts of consumer interest.
We can generalize our model for predicting the revenueof a product using social media as follows. We begin withdata collected regarding the product over time, in the formof reviews, user comments and blogs. Collecting the dataover time is important as it can measure the rate of chattereffectively. The data can then be used to fit a linear regressionmodel using least squares. The parameters of the modelinclude:
• A : rate of attention seeking• P : polarity of sentiments and reviews• D : distribution parameter
Let y denote the revenue to be predicted and ε the error. Thelinear regression model can be expressed as :
y = βa ∗A+ βp ∗ P + βd ∗D + ε (4)
where the β values correspond to the regression coefficients.The attention parameter captures the buzz around the productin social media. In this article, we showed how the rate oftweets on Twitter can capture attention on movies accurately.We found this coefficient to be the most significant in ourexperiments. The polarity parameter relates to the opinionsand views that are disseminated in social media. We observedthat this gains importance after the movie has been releasedand adds to the accuracy of the predictions. In the case ofmovies, the distribution parameter is the number of theaters aparticular movie is released in. In the case of other products,it can reflect their availability in the market.
IX. ACKNOWLEDGEMENT
This material is based upon work supported by the NationalScience Foundation under Grant # 0937060 to the ComputingResearch Association for the CIFellows Project.
REFERENCES
[1] Jure Leskovec, Lada A. Adamic and Bernardo A. Huberman. Thedynamics of viral marketing. In Proceedings of the 7th ACM Conferenceon Electronic Commerce, 2006.
[2] Bernardo A. Huberman, Daniel M. Romero, and Fang Wu. Socialnetworks that matter: Twitter under the microscope. First Monday, 14(1),Jan 2009.
[3] B. Jansen, M. Zhang, K. Sobel, and A. Chowdury. Twitter power:Tweets as electronic word of mouth. Journal of the American Societyfor Information Science and Technology, 2009.
[4] D. M. Pennock, S. Lawrence, C. L. Giles, and F. A. Nielsen. The realpower of artificial markets. Science, 291(5506):987–988, Jan 2001.
[5] Kay-Yut Chen, Leslie R. Fine and Bernardo A. Huberman. Predictingthe Future. Information Systems Frontiers, 5(1):47–61, 2003.
[6] W. Zhang and S. Skiena. Improving movie gross prediction through newsanalysis. In Web Intelligence, pages 301304, 2009.
[7] Akshay Java, Xiaodan Song, Tim Finin and Belle Tseng. Why we twitter:understanding microblogging usage and communities. Proceedings of the9th WebKDD and 1st SNA-KDD 2007 workshop on Web mining and socialnetwork analysis, pages 56–65, 2007.
[8] Ramesh Sharda and Dursun Delen. Predicting box-office success ofmotion pictures with neural networks. Expert Systems with Applications,vol 30, pp 243–254, 2006.
[9] Daniel Gruhl, R. Guha, Ravi Kumar, Jasmine Novak and AndrewTomkins. The predictive power of online chatter. SIGKDD Conferenceon Knowledge Discovery and Data Mining, 2005.
[10] Mahesh Joshi, Dipanjan Das, Kevin Gimpel and Noah A. Smith. MovieReviews and Revenues: An Experiment in Text Regression NAACL-HLT,2010.
[11] Rion Snow, Brendan O’Connor, Daniel Jurafsky and Andrew Y. Ng.Cheap and Fast - But is it Good? Evaluating Non-Expert Annotations forNatural Language Tasks. Proceedings of EMNLP, 2008.
[12] Fang Wu, Dennis Wilkinson and Bernardo A. Huberman. Feeback Loopsof Attention in Peer Production. Proceedings of SocialCom-09: The 2009International Conference on Social Computing, 2009.
[13] Bo Pang and Lillian Lee. Opinion Mining and Sentiment AnalysisFoundations and Trends in Information Retrieval, 2(1-2), pp. 1135, 2008.
[14] Namrata Godbole, Manjunath Srinivasaiah and Steven Skiena. Large-Scale Sentiment Analysis for News and Blogs. Proc. Int. Conf. Weblogsand Social Media (ICWSM), 2007.
[15] G. Mishne and N. Glance. Predicting movie sales from blogger senti-ment. In AAAI 2006 Spring Symposium on Computational Approachesto Analysing Weblogs, 2006.


![[Médias] secteur médias](https://img.pdfslide.net/doc/110x75/54595793af795994188b57a5/medias-secteur-medias.jpg)
