Embed Size (px)
Citation preview
Note to the user:
This Word document provides a structured form template for preparing your responses to the
questions in the annual report project. Simply complete the input required by the form. If you did not purchase the workbook you are not permitted
to use this form template.
INTRODUCTION TO THE CORPORATE ANNUAL REPORT:
A Business Application with IFRS Content
3rd edition
Copyright 2011 by Applied Accounting Analytics. All rights reserved. Reproduction or translation of this book beyond that permitted by the applicable copyright law without Applied Accounting Analytics’ permission is prohibited. Requests for permission to reprint or for further information should be directed to [email protected] or [email protected].
ISBN: 978-0-9841839-2-0

To be completed by the student and submitted with the completed annual report project according to your instructor’s requirements.
Complete the following form before you submit your assignment. This step is required to
validate your compliance with sections 107 or 108 of the 1976 United States Copyright
Act.
1. Remove the front cover of the workbook and identify:
Student Name:Click here to enter text.
Term:Click here to enter text.
Selected Company:Aaple Inc.
Instructor:Click here to enter text.
2. Print your completed electronic template.
3. Attach the following:
This page completed with all required information. Completed Word form template. Form template boxes expand as you input
responses.

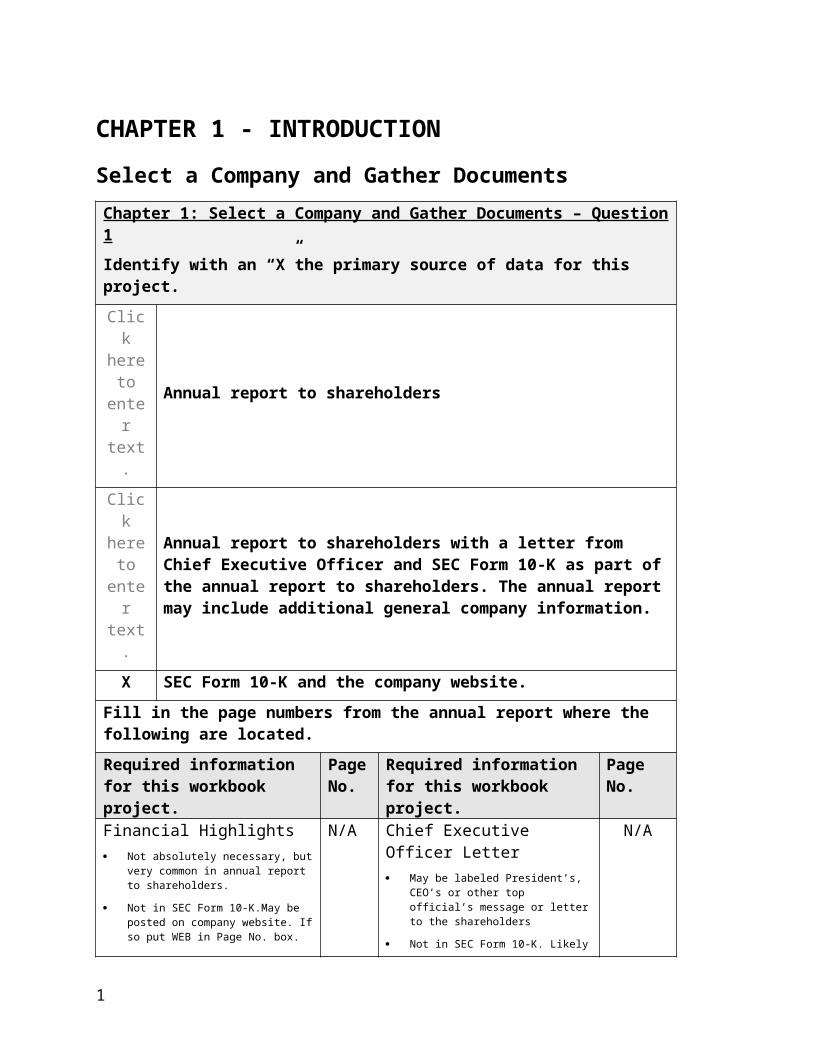
CHAPTER 1 - INTRODUCTIONSelect a Company and Gather DocumentsChapter 1: Select a Company and Gather Documents – Question 1
Identify with an “X”the primary source of data for this project.
Click here to enter text.
Annual report to shareholders
Click here to enter text.
Annual report to shareholders with a letter from Chief Executive Officer and SEC Form 10-K as part of the annual report to shareholders. The annual report may include additional general company information.
X SEC Form 10-K and the company website.
Fill in the page numbers from the annual report where the following are located.
Required information for this workbook project.
Page No.
Required information for this workbook project.
Page No.
Financial Highlights Not absolutely necessary, but very
common in annual report to shareholders.
Not in SEC Form 10-K.May be posted on company website. If so put WEB in Page No. box.
If not available, put N/A in Page No. box.
N/A
Chief Executive Officer Letter May be labeled President’s, CEO’s or
other top official’s message or letter to the shareholders
Not in SEC Form 10-K. Likely posted on company website if SEC Form 10-K used to satisfy the annual report to shareholders reporting requirement. If so put WEB in Page No. box.
N/A
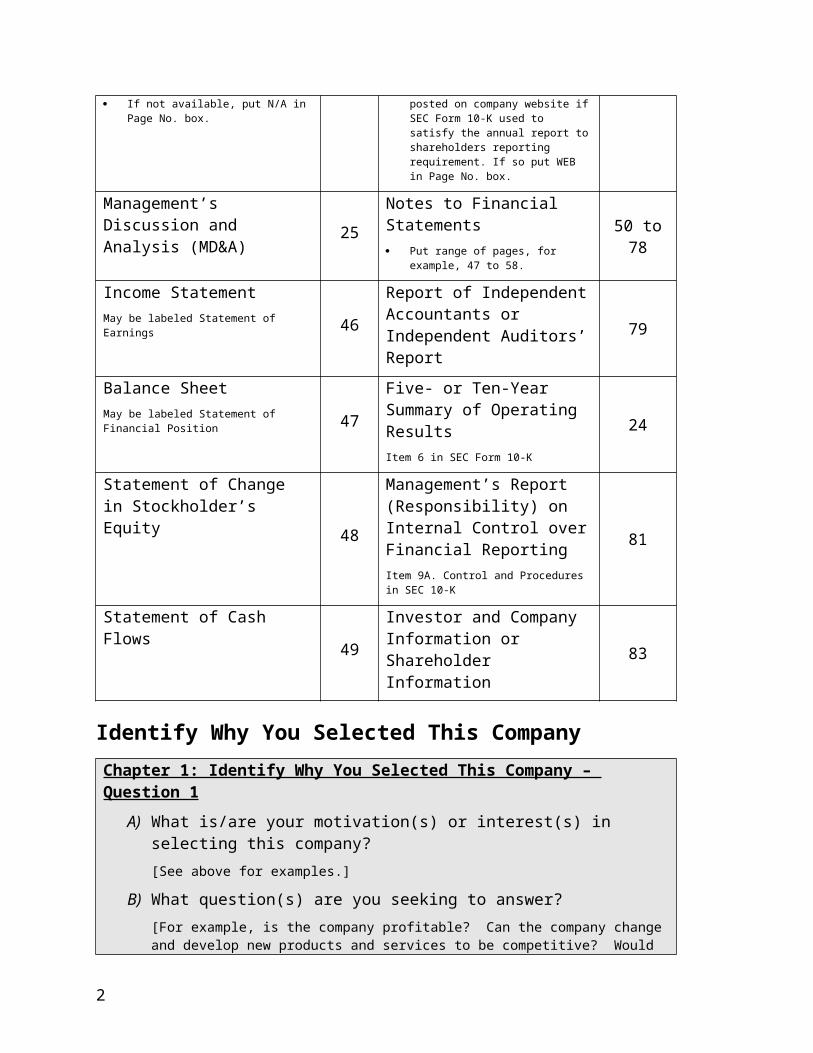
Management’s Discussion and Analysis (MD&A) 25 Notes to Financial Statements
Put range of pages, for example, 47 to 58.50 to 78
Income StatementMay be labeled Statement of Earnings 46
Report of Independent Accountants or Independent Auditors’ Report
79
Balance Sheet May be labeled Statement of Financial Position 47
Five- or Ten-Year Summary of Operating Results Item 6 in SEC Form 10-K
24
Statement of Change in Stockholder’s Equity
48 Management’s Report (Responsibility) on Internal Control over Financial Reporting
81
1

Item 9A. Control and Procedures in SEC 10-K
Statement of Cash Flows 49
Investor and Company Information or Shareholder Information
83
Identify Why You Selected This CompanyChapter 1: Identify Why You Selected This Company – Question 1
A) What is/are your motivation(s) or interest(s) in selecting this company? [See above for examples.]
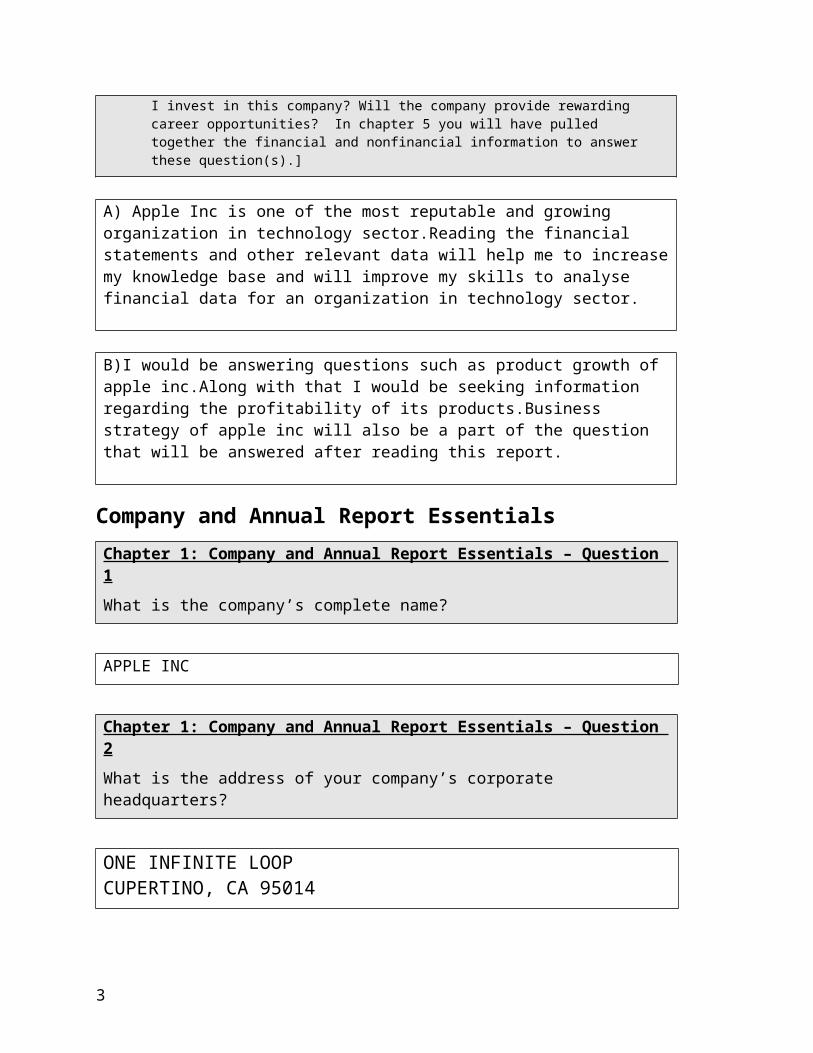
B) What question(s) are you seeking to answer? [For example, is the company profitable? Can the company change and develop new products and services to be competitive? Would I invest in this company? Will the company provide rewarding career opportunities? In chapter 5 you will have pulled together the financial and nonfinancial information to answer these question(s).]
A) Apple Inc is one of the most reputable and growing organization in technology sector.Reading the financial statements and other relevant data will help me to increase my knowledge base and will improve my skills to analyse financial data for an organization in technology sector.
B)I would be answering questions such as product growth of apple inc.Along with that I would be seeking information regarding the profitability of its products.Business strategy of apple inc will also be a part of the question that will be answered after reading this report.
Company and Annual Report EssentialsChapter 1: Company and Annual Report Essentials – Question 1
What is the company’s complete name?
APPLE INC
Chapter 1: Company and Annual Report Essentials – Question 2
What is the address of your company’s corporate headquarters?
ONE INFINITE LOOPCUPERTINO, CA 95014
2
Chapter 1: Company and Annual Report Essentials – Question 3
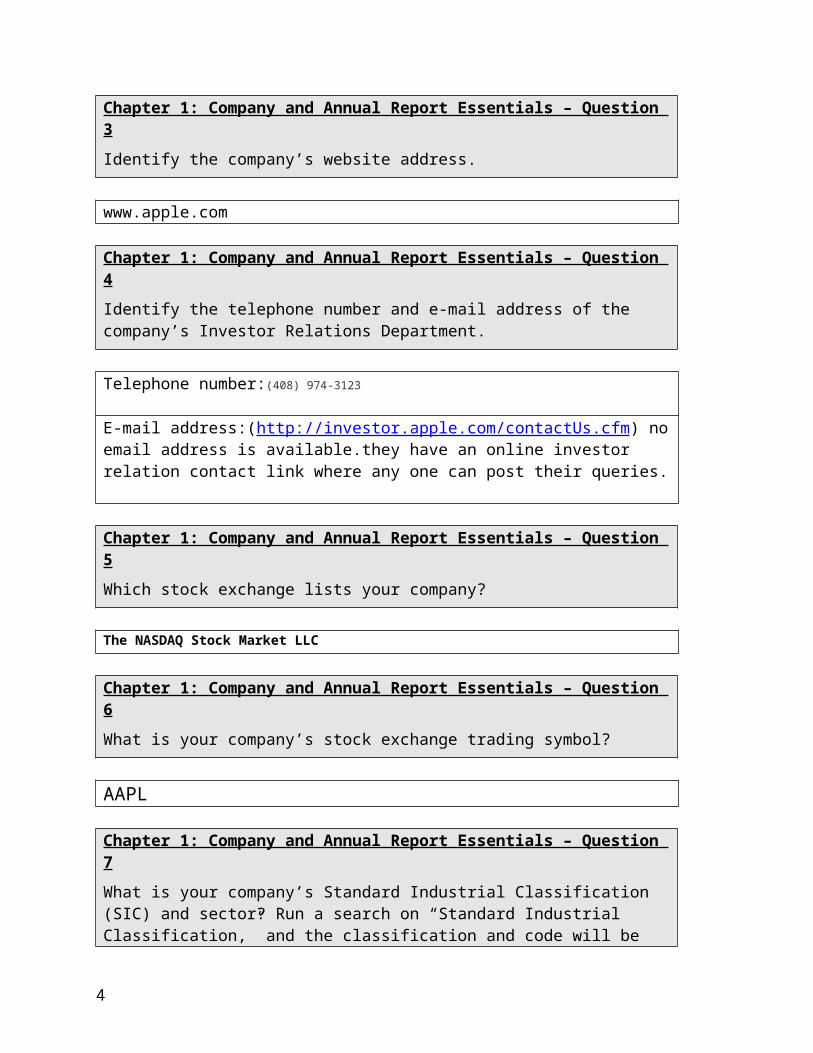
Identify the company’s website address.
www.apple.com
Chapter 1: Company and Annual Report Essentials – Question 4
Identify the telephone number and e-mail address of the company’s Investor Relations Department.
Telephone number:(408) 974-3123
E-mail address:(http://investor.apple.com/contactUs.cfm) no email address is available.they have an online investor relation contact link where any one can post their queries.
Chapter 1: Company and Annual Report Essentials – Question 5
Which stock exchange lists your company?
The NASDAQ Stock Market LLC
Chapter 1: Company and Annual Report Essentials – Question 6
What is your company’s stock exchange trading symbol?
AAPL
Chapter 1: Company and Annual Report Essentials – Question 7
What is your company’s Standard Industrial Classification (SIC) and sector? Run a search on “Standard Industrial Classification,” and the classification and code will be identified. Your company may list more than one SIC code number. The first listed is considered the primary SIC for the company.
For example, search – The Home Depot SIC – brings up a listing of sources. InvestorWords is one website location option - http://www.investorwords.com/cgi-bin/stocksymbol.cgi?ticker=HD. Move down the page and you will find:
SIC Code: 5211Sector: Basic Materials, Construction, Retail
Industry: Lumber and other building materials
3
3571 - Electronic Computers
Chapter 1: Company and Annual Report Essentials – Question 8
Locate the board of directors listing. How many board members does your company have?
Apple have eight board members
Chapter 1: Company and Annual Report Essentials – Question 9
How many of the directors are company employees, labeled inside directors? And how many are non-company directors, labeled outside directors? Why does a company want and need outside directors?(Inside and outside directors are typically identified as such by their title and company.)
Apple has only one inside board member who is the CEO and Director.all the other 7 directors are the outside directors.A company needs outside directors to comply with the Corporate governance requirements which states that Board of every company complying with CCG requirements should comprise of atleast 3 independent (outside) directors.
Chapter 1: Company and Annual Report Essentials – Question 10
Leadership addresses the stockholders, typically, once a year at the annual stockholders meeting. Identify where and when this occurred, as reported in your annual report.
It has been conducted in Building 4 of the Company’s principal executive offices on Friday 27, 2013
Company Strategy and Business EnvironmentChapter 1: Company Strategy and Business Environment – Question 1
Review the chairman’s message of your company’s annual report. Does it appear to be uplifting or somewhat apologetic? Identify phrases that support your position.
In business strategy section management is much confident about their innovative techniques to launch new products .Their enthusiasm and focus on providing best user experience indicates their confidence in apple’s products and its continuous growth
Chapter 1: Company Strategy and Business Environment – Question 2
Check below the one primary company strategy identified in the chairman’s message. Support your answer with phrases found in the chairman’s message that pointed you to
4
the identified corporate strategy.
Growth: VerticalClick here to enter text.
HorizontalClick here to enter text.
ConcentricApple is focusing on concentric growth straegty because they are working in industires with same technological synergies such as manufacturing Iphone and getting it sold via retailers and distributors to gain advantage .
ConglomerateClick here to enter text.
Stability Click here to enter text.
RetrenchmentClick here to enter text.
Phrases to support your above conclusion:
Therefore, the Company’sstrategy also includes enhancing and expanding its own retail and online stores and enhancing its distrubuton network .
Chapter 1: Company Strategy and Business Environment – Question 3
Briefly summarize the company’s discussion found in Item 1 of SEC Form 10-K.
Type of business:
Manufacturing,desiging and marketing of electornic products and development of application softwares and operating system.Major business segments:
Mobile communication,media devises,portable digital music players,software, services,peripherals as well as networking solutions and digital content and application.
Primary customers:
The Company’s customers are primarily in the consumer, SMB, education, enterprise and government markets
Primary products and/or services:
Primary products would include iphone,ipad,mac,ipod,itunes and the itunes stores,mac app stores ,icloud and operating system would include IOs, OS X .Application software would include Iwork, Ilife .
Other:
One of the important factor that needs to consider with apple is its competition because apple is operating technology industry which has a very high competition and
5
only those entities survies that has the ability to beat competition and one can say that apple has that ability to beat all the competition and lead the technology market.Apple has developed this reputation by spending huge amount in its research and development which is evident from the fact that the research and development expense is being increasing from 2011 to 2013.
Chapter 1: Company Strategy and Business Environment – Question 4
Identify broad-based social, political, economic, and technological concerns that may affect your company. Put N/A if one of the categories does not apply.
Social:
N/APolitical:
Political factors are the factors that will effect any industry so will apple has to consider political risk such as government’s policies regarding technological sectors as well as data regulations.Internatioal politics also effects apple’s business because apple operates worldwide which means that changes in laws and regulation of any country would impact apple inc sales.
Economic:
Economic conditions plays a vital role in the sales growth of apple incorporation .In economic crisis the demand for apple’s product will be adversely effected as these are not considered as a basic needs in most of the countries.One important factor is the price increment in countires outside us because apple has to increase prices due to the fluctuations in dollar prices .
Technological:
As mentioned earlier apple inc operates in technological sector which requires rapid innvovations and product enhancements.technological upgradation would highly impact consumer demands as people want to buy the latest technology .Shorter product life cycles and high spending on research and development which if not compensated by higher prices would reduce apple’s profit margins to unacceptable levels.
Other:
One of the facor that apple depends upon is the performance of its distributors ,carriers and other resslers.their success will contribute to apple’s overall success and product growth.If these entites doesnot operate efficenlty it would have a negative impact of apple’s sales because goods are produced by apple but are handed over to final consumer by these entities.
6

Wrap-upChapter 1: Wrap-up – Question 1
After further review of additional information you should now be confident in identifying the one primary company strategy, beyond the insight provided by the chairman’s message?
Check below the one primary company strategy identified in the chairman’s message and all other supporting documents. Support your answer with phrases.
Growth: VerticalClick here to enter text.
Horizontal Click here to enter text.
ConcentricApple is focusing on cocentirc growth because it is taking advantage of others as most of the factors in Part 1 indiactes that apple is placing more reliance on third party digital content stating that apple is enhancing is business by placing reliance onits business partners.It is also evident from the fact that apple has decided to increase its distributor network as mentioned in business strategy sections
ConglomerateClick here to enter text.
Stability Click here to enter text.
Retrenchment Click here to enter text.
Phrases to support your conclusion from information gathered from the chairman’s message, Item 1 of the SEC Form 10-K and other insight gained from completing Chapter 1.
Therefore, the Company’sstrategy also includes enhancing and expanding its own retail and online stores and its third-party distribution network to effectively reach morecustomers and provide them with a high-quality sales and post-sales support experience.
7

CHAPTER 2 - ANNUAL REPORT STRUCTUREFinancial HighlightsChapter 2: Financial Highlights – Question 1
Review the financial highlights of your company’s annual report to the shareholders. Identify net sales or revenues, net income, basic earnings per share (BEPS), and total assets for the current and preceding years. These are the most common values included in financial highlights. If your company reports something different, simply cross out an item here and recap what is reported. SEC Form 10-K does not provide financial highlights. You may find this information on the company website. If not available put N/A in the first row of boxes.
Categories Current Year One Year Prior Two Years Prior
Net sales or revenues 170,910,000 156,508,000 108,249,000
Net income 37,037,000 41,733,000 25,922,000
Basic EPS 40.03 44.64 28.05
Total Assets 207,000,000 176,064,000 116,371,000
Based on your preliminary review, is your company performing better than, equal to, or less favorably than in the prior year? Briefly explain.
Sales has been grown from the prior years however the net income has declined as compared to the comparitve financial year means that cost has increased more than the expectations of management.It is evident that the Basic EPS has also decreased due to reduction in net income.The performance has detoriated slighltiy in terms of cost control .
General Company and Marketing InformationChapter 2: General Company and Marketing Information – Question 1
Look for pictures of product and people that are colorful and send a positive company signal to the reader.
Category
Example: Volunteer Activities
Message
Ongoing and contributing to the success of the community
Website No pictures available in annual report however the website appears to be colorful.It has pictures of different apple products such as iphone,Ipod,etc which are very lucrative for the consumers .These pictures also gives an impression
8

that apple is contributing a lot towards the advancement of technology and bringing in innovative products that will contribute in the well being of society.
Click here to enter text. Click here to enter text.
Click here to enter text. Click here to enter text.
Click here to enter text. Click here to enter text.
Click here to enter text. Click here to enter text.
What is the broader message from this information?
Pictures not available in annual report
Management’s Discussion and AnalysisChapter 2: Management’s Discussion and Analysis – Question 1
Results of Operations:
Identify the primary drivers/issues that explain current and future results of operations discussed in the MD&A. For example, the gross profit percentage increased because of improved buyer/supplier relations resulting in greater overall operating performance. Or an increase in operating expenses because of increased fuel costs reduced profits. List the six major drivers/issues of performance you find in the MD&A section of the annual report.
1.Net sales of the company has been increased by 9% as compared to the previous years the main reason for this growth is the increase in sales of Iphone ,Itunes and other softwares.
2.Iphone serios inclusing Iphone 5 and 5s as well as Iphone 4 and 4s have contributed signifacanlty in the growth of Apple inc’s over all sales .however the Ipod and Imac has not performed as per the expectations and their sales has declined as compared to previous periods.
3.Similar to 2012, growth in total net sales was higher during the first half of 2013, rising $12.6 billion or 14.7% over the same period in 2012. First half growth in 2013 was driven by iPhone and iPad introductions at or near the beginning of 2013.
4.2013 has also been a year of launching several new products as mentioned in MD & A section that company has launched a number of different products include fourth generation IPad and IPad Mini ,Macbook Pro with retina display ,IOS 7 and a lot more has been developed and brought to market in 2013
5.Apple has decided to repurchase its shares from their shareholders which is evident from the fact that they had spend 60 billion to repurchase their shares and have increased their dividends to 3.05 per share.
6.In conjuction with their capital repurchase program company has also issued various
9

notes in may 2013 amounting to Rs 17 billion with varying maturirites upto 2043
Liquidity:
Recap what you find about your company’s liquidity in the MD&A section of the annual report. Look for information about the ability of the company to satisfy short-term cash needs and the ability to generate operating cash flows, for example.
The liquidty position of Apple inc appears to be fine enough because company has spended 60 million in their repurchase program and also increase their dividend to share holders indicating that enough cashflows are generated to meet their requirements.
Capital Resources:
Recap what you find about your company’s capital resources in the MD&A section of the annual report. Look for information about cash reserves and credit availability. For example, your company’s MD&A section may have a disclosure about an established lined of credit to fund future growth.
In conjuction with the capital repurchase program Apple has issued notes of 17 billion with different maturities ending till 2043.However currently apple has enough resources which it is planning to invest in rebuying its shares from their shareholders. It indicates that apple now is deciding to move on debt and reduce their equity portion in overall capital structure.
Reports by ManagementChapter 2: Reports by Management – Question 1
Review the Management’s Report (Responsibility) on Internal Control over Financial Reporting in your company’s annual report. Answer the following questions.
Who is responsible for maintaining the internal controls designed to provide reasonable assurance that the books and records reflect the transactions of the company?
Management of the company is responsible for designing and maintaining adequate internal controls over financial reporting.
Record the statement that identifies management’s conclusion about internal controls.
Based on the Company’s assessment, management has concluded that itsinternal control over financial reporting was effective as of September 28, 2013 to provide reasonable assurance regarding the reliability offinancial reporting and the preparation of financial statements in accordance with GAAP.
10

Who audited management’s assessment of the effectiveness of your company’s internal control over financial reporting?
The Company’s independent registered publicaccounting firm, Ernst & Young LLP, has issued an audit report on the Company’s internal control over financial reporting, which appears inPart II, Item 8 of this Form 10-K.
Independent Auditors’ ReportChapter 2: Independent Auditors’ Report – Question 1
Review the Independent Auditors’ Report of your company’s annual report and answer the following questions.
Who was the company’s auditor and where is it located?
Ernst & Young LLPSan Jose, CaliforniaOctober 29, 2013
What is the responsibility of the auditor?
Auditors are responsible to express an opinion on the company’s internal controls over financial reporting based on their audit
Who is responsible for the preparation of and information within the company’s financial statement?
Management of Apple Inc is responsible for the preparation of information with in the company’s financial statements.
The audit was conducted in accordance with what?
It was conducted in accordance with the standards of the Public Company Accounting Oversight Board (United States).
What was the opinion of the auditor?
Auditors have provided an unqualified opinions
Five- or Ten-Year Summary of Operating ResultsChapter 2: Five- or Ten-Year Summary of Operating Results – Question 1
Identify the major components provided in the five- or ten-year summary. Summarize the insight provided by each. Look for stable, increasing, or decreasing trends. Consistent, slightly improving performance signals management has control of the business. Inconsistent performance signals management does not have control of the business.
Component
Example: The Home Depot Statement of Earnings Data
Summary of Insight
Sales and earnings have grown significantly over time.Operating expenses are growing at an increasing rate.
11

Statement of Earnings Data The sales and earnings have shown significant improvement in 5 years period. The sale sincrease by around 300% and net earnings increased by around 350%, during the tenure of 5 years period starting 2009 to 2013.B
Balance Sheet Data Total assets has also shown significant improvement in 5 years period. It went up by around 336%, it is alos in line with increase in sales, it shows that the increase in assets has increased the total revenues during 5 years period, which shows the efficient usage of total assets. However, the company was free from long term debt till 2013, the company borrowed $17 billion in 2013 as long term debt, but it is not very significant. The increase in shareholders equity is also significant due to higher earnings and it went up by around 290% since 2009.
Statement of Cash Flows The increase in cash and cash equivalent is also significant and it went up by around 359% during 5 years tenue.
Click here to enter text. Click here to enter text.
Click here to enter text. Click here to enter text.
Click here to enter text. Click here to enter text.
12

CHAPTER 3 - FINANCIAL STATEMENTSThe Balance SheetChapter 3: Balance Sheet – Question 1
Identify the date shown at the top of your selected company’s balance sheet.
Current Year Prior Year
9/28/2013 9/29/2012
Does the company’s fiscal year follow the calendar year? Enter Yes or No No
If no, why do you think it is different?
Because it ends on Septermber of each year, while the calendar year ends on Decemeber of each year.
Chapter 3: Balance Sheet – Question 2
Review the current asset section of your selected company’s balance sheet. Explain why the order of individual items begins with cash. In your opinion, would it be more or less appropriate to order these items according to dollar magnitude? Explain.
The current assets have been listed according to its ability to convert into cash. The value in dollar terms is not significant as compared to their ability to convert into cash.
Chapter 3: Balance Sheet – Question 3
Review your company’s balance sheet (or SEC Form 10-K) and compare accumulated depreciation to the historical cost of Plant and Equipment (PE) using the following ratio.
Compute the following:
Accumulated depreciation /
Plant and Equipment
42%
Percentage of Asset Life Remaining
High percentage means older assets
Low percentage means newer assets
Is the investment in fixed assets, on average, relatively recent? If not, can we assume that these assets will be replaced shortly?
13

$6.6 billion of property plant and equipment were added during 2013, and the life of assets remaining percentage also suggests that the fixed assets will not be replaced shortly.
Chapter 3: Balance Sheet – Question 4
Since property, plant, and equipment (PPE) and long-term investments in stock represent a company’s investment, why do we distinguish between them in the balance sheet?
As the property, plant and equipment are the operating fixed assets and they belong to prmiany business of the company, while the investment in stock is subject to availability of surplus fund and it does not belong to prmiany business, therefore they are calssified separately from each other.
Chapter 3: Balance Sheet – Question 5
Review the noncurrent asset section of your company’s balance sheet. Are any intangible assets listed? If so, identify the types of intangible assets and the percent of total assets that the intangible assets represent.
Intangible Asset 1:Goodwill $1.6 billion
Intangible Asset 2:Acquired Intangible assets $4.2 billion
Intangible Asset 3:Click here to enter text.
Total Intangible Assets Total Assets = 5.8/207 = 2.8%
If this company were to be acquired by another company, would the intangible assets influence the purchase price? Explain your answer.
It depends on the nature of intangible assets and its worth in the market. If the intangible assets do have any worth in the market then they are included otherwise they are considered as zero, therefore it will definitely affect the purchase price of the company, if it is sold to some other company.
Chapter 3: Balance Sheet – Question 6
Now review your company’s total assets for the most recent year. What percentage of total assets is current? Noncurrent?
Current Noncurrent
35% 65%
14

Should companies have a greater investment in current assets or noncurrent assets, or does it depend on the nature of their business? Explain your answer.
The investment in current and non current assets depend on the nature of business, if a business belongs to service sector it will have lower percentage of non current assets while for a manufacturing business, the percentage of non current assets would be on higher side due to cost of heavy plant, equipment and factory.
Chapter 3: Balance Sheet – Question 7
Review your company’s balance sheet. Does it report a deferred tax asset? A deferred tax liability? If so, are the deferred tax assets and/or liabilities reported as current or noncurrent?
Deferred tax asset? Enter Yes or No
Yes
Enter Current or Non-current
Current
Deferred tax liability? Enter Yes or NoNo Enter Current or Non-current
NA
Chapter 3: Balance Sheet – Question 8
Identify the information that relates to the stockholders’ equity section of your company’s balance sheet.
Par value per share of common stock? No par value
Number of common shares authorized? 1.8 billion shares
Number of common shares issued? 939.2 million
Number of common shares outstanding? 899.2 million
Number of treasury shares held by the company? 47 million
Chapter 3: Balance Sheet – Question 9
Answer the following questions relative to the stockholders’ equity section of the balance sheet.
By what amount did retained earnings increase or decrease from the prior year?
$3 billion
Was the increase or decrease in retained earnings equal to the company’s current year net income or net loss?
* Enter Yes or No
No, as net income was around $37 billion, the dividend paid
$10.7 billion, the common stock repurchased and stock
option amount to $23.3 billion
15

* If No, then dividends were paid (or declared) by your selected company or certain events took place during the year where the accounting for the events directly affected the retained earnings account.
Chapter 3: Balance Sheet – Question 10
List (write-in) each financial statement element as shown in your company’s balance sheet.
Assets Liabilities Stockholders’ Equity
Current Assets Current Liabilities Common stock with no par value
Cash and cash equivalent, marketable securities, account receivable, inventories, deferred tax assets, other vendor trade receivable and other current assets
Accounts Payable, accrued expesnese and deferred revenue
Retained Earnings
Fixed Assets Long Term Liabilities Accumulated Other comprehensive income/loss
Longer term marketable securities, Property, plant and equipment, goodwill, other intangible assets acquired and other fixed assets
Deferred revenue, long term debt and other non current liabilities
Click here to enter text.
Click here to enter text. Click here to enter text. Click here to enter text.
Click here to enter text. Click here to enter text. Click here to enter text.
Click here to enter text. Click here to enter text. Click here to enter text.
Chapter 3: Balance Sheet – Question 11
Identify the combined carrying values (dollar amounts) of the following selected account groups taken from your company’s balance sheet:
Account Groups Current Year
Prior Year
Increase or Decrease(in dollars)
Current Assets All figures in billions in
$73.3
All figures in billion in $
57.7
15.6
Net Fixed Assets 133.7 118.4 15.3
16

Intangible and Other Noncurrent Assets 11 10.8 0.2
Current Liabilities 43.7 38.5 5.2
Long-term Liabilities 39.8 19.4 20.4
Common Stock 19.8 16.4 3.4
Additional Paid in Capital* 0 0 0
Retained Earnings 104 101 3
Other Equity Components -0.5 0.5 -1
Chapter 3: Balance Sheet – Question 12
Identify the three major balance sheet accounts, for example accounts receivable, accounts payable, inventory, etc. that changed the most from the prior year. What events might explain these changes? Working to explain why these changes occurred contributes to a greater understanding about a company.
Account Explanation
Example:
Account Receivable
Example:
An increase in accounts receivable should coincide with an increase in sales, i.e., a 10% increase in sales would explain a 10% increase in accounts receivable. If accounts receivable are increasing and sales decreasing, the signal is unfavorable.
Short Term Marktable Securities
It increased by around 43% in 2013 from around $8 billion to around $ billion. It shows that company has enough cash surplus to invest in marketable securities, but for short term period. The surplus cash is due to healthy net earnings for the company for 2013.
Long Term Marketable Securities
It shows an increae of around 15% in 2013 as coampred to previous year, it would be due to availability of cash surplus for lnog term period. The company would have made this investment due to healthy earnings and to save money for future replacement of fixed assets and expansion.
Long Term Debt The long term debt was zero till 2012, but in 2013 company acquired around $17 billion, the company would like to get the advantage of debt financing due to tax shield available on this type of financing.
Chapter 3: Balance Sheet – Question 13
Prepare a common-sized balance sheet (expressed in percentages) using the following account groups shown in your selected company’s balance sheet.
17

Account Group Current Year
Prior Year
Increase or Decrease(current year percent minus
prior year percent)
Current Assets 35% 33% 2%
Net Fixed Assets 60% 61% -1%
Intangible and Other Noncurrent Assets 5% 6% -1%
Total Assets 100% 100%
Current Liabilities 21% 27% -6%
Long-term Liabilities 19% 6% 13%
Common Stock 10% 9% 1%
Additional Paid in Capital 0% 0% 0
Retained Earnings 50% 58% -8%
Other Equity Components 0% 0% 0
Total Liabilities and Stockholders’ Equity
100% 100%
Example provided because of common student error in completing this report. All accounts groups divided by total assets, in dollars.
Account Group Current Year
Prior Year Increase or Decrease
Current Assets 40% 35% 5%
Net Fixed Assets 40% 45% -5%
Intangible and Other Noncurrent Assets 20% 20%
Total Assets 100% 100%
Current Liabilities 60% 50% 10%
Long-term Liabilities 10% 15% -5%
Common Stock 20% 20%
Additional Paid in Capital 5% 5%
Retained Earnings 5% 10% -5%
Other Equity Components
Total Liabilities and Stockholders’ Equity
100% 100%
18

Chapter 3: Balance Sheet – Question 14
Identify the three balance sheet groups from question 13 above that changed most significantly. Within each of these groups, identify the primary balance sheet element that drove this change. What events might explain these changes?
Group Name:
Current Assets
Explanation:
(Example – sales increased by 22%, thus accounts receivable increased by approximately 22%)
Long term debt Incresed by around 13%, due to additional borrowing from long term sources to avaial the tax hield on debt financing.
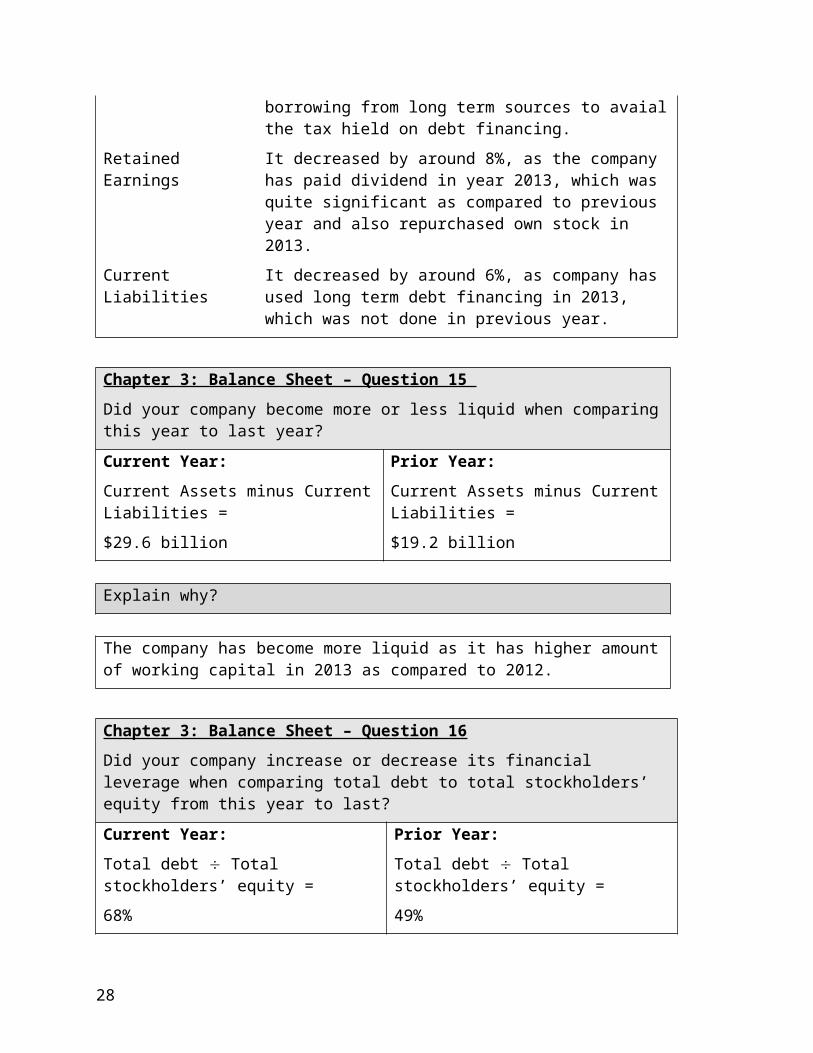
Retained Earnings It decreased by around 8%, as the company has paid dividend in year 2013, which was quite significant as compared to previous year and also repurchased own stock in 2013.
Current Liabilities It decreased by around 6%, as company has used long term debt financing in 2013, which was not done in previous year.
Chapter 3: Balance Sheet – Question 15
Did your company become more or less liquid when comparing this year to last year?
Current Year:
Current Assets minus Current Liabilities =
$29.6 billion
Prior Year:
Current Assets minus Current Liabilities =
$19.2 billion
Explain why?
The company has become more liquid as it has higher amount of working capital in 2013 as compared to 2012.
Chapter 3: Balance Sheet – Question 16
Did your company increase or decrease its financial leverage when comparing total debt to total stockholders’ equity from this year to last?
Current Year:
Total debt Total stockholders’ equity =
68%
Prior Year:
Total debt Total stockholders’ equity =
49%
Explain why:
19

The company financial leverage has increased as the debt equity ratios has increased by around 19% in 2013 as compared to previous year.
20

The Income Statement or Statement of EarningsChapter 3: Income Statement – Question 1
Review the heading of your company’s income statement. Does the company’s income statement provide two or three years of comparative information? (Insert number to the right.)
Click here to enter text.yrs.
Why do you think the SEC requires that balance sheets provide two years of comparative financial information and income statements provide three years of comparative financial information?
The financial information for two years to be provided so the comparison of two years data may be known, while the income statement is for three years to determine the trend of the revenues and sales so the future expectation may be calculated and appropriate decision by the investors may be taken.
Chapter 3: Income Statement – Question 2
Review the middle section of your company’s income statement. Did operating income (loss) increase or decrease from the prior year and by how much? You may have to compute operating income (loss).
Increased by $Click here to enter text. Decreased by $6.2 billion and by 11%
Chapter 3: Income Statement – Question 3
Does the middle section of your company’s income statement show a nonoperating income (loss) increase or decrease from the prior year and by how much? You may have to compute nonoperating income (loss).
Increased by $ 0.7 billion and by around 180%
Decreased by $ Click here to enter text.
Chapter 3: Income Statement – Question 4
In reference to why you are studying this company, is it important to know the different sources of income—operating or nonoperating?
Yes it is very important as the operating income is the primary source of revenue and it of recurring nature, while the non operating income is non recurring.
21

Chapter 3: Income Statement – Question 5
If any of the irregular events are shown on your company’s income statement, describe the nature and the amount. Select the most current year affected by the event if multiple years are affected.
Irregular Event Amount Nature of the Change
Restructuring charge? 0 Click here to enter text.
Discontinued operation? 0 Click here to enter text.
Extraordinary event? 0 Click here to enter text.
Chapter 3: Income Statement – Question 6
Review the lower section of your selected company’s income statement. Did net income (loss) increase or decrease from the prior year and by how much?
Increased by $ Click here to enter text. Decreased by $ 4.7 billion around 11%
Chapter 3: Income Statement – Question 7
Prepare a common-sized income statement for the categories below.
Account/Category Current Year
Prior Year Increase or Decrease
(current year percent minus prior year percent)
Net Sales (revenues) 100% 100%
Cost of Goods/Services (if applicable) 62% 56% 6%
Gross Profit 38% 44% -6%
Operating Expenses 9% 9% 0
Operating Income (Loss) 29% 35% -6%
Nonoperating Income (Loss) 1% 1% 0
Income Tax Expense 8% 9% -1%
Net Income 22% 27% -5%
Example provided because of common student error in completing this report. All account categories divided by net sales (revenue), in dollar.
22

Account/Category Current Year
Prior Year Increase or Decrease
Net Sales (revenues) 100% 100%
Cost of Goods/Services (if applicable) (35%) (36%) (1%)
cost of goods sold decrease
Gross Profit 65% 64% 1%
gross profit increase
Operating Expenses (25%) (23%) 2%
expenses increased
Operating Income (Loss) 40% 41% (1%)
operating income
decreased
Nonoperating Income (Loss) 5% 5%
Income Tax Expense (20 %) (17%) 3%
taxes increased
Net Income 25% 29% (4%)
Chapter 3: Income Statement – Question 8
Identify the three income statement accounts/categories that changed the most in Question 7. What events might explain these changes?
Account or Category:
Explanation:
(Hint – the MD&A section will provide good information to answer this question.)
Cost of goods sold
The cost of goods sold has increased by 6%, it might be due to buying of new fixed assets which would have resulted in higher amount of depreication in 2013.
Income Tax expesnse
It has decreased by around 1% due to lower earnings before taxes in 2013, as compared to 2012.
Revenues It has increased by around 9% due to better marketing efforts and
23

better quality of products.
Chapter 3: Income Statement – Question 9
Identify your company’s Basic and Diluted EPS amounts. Place a N/A in Diluted EPS if not reported.
Basic EPS Diluted EPS
Current year $40.03 $39.75
Preceding year 1 $44.64 $44.15
Preceding year 2 $28.05 $27.68
Why is diluted EPS always equal to or less than basic EPS?
Normally the diluted EPS is lower than basic EPS as the adjustment is to be made for any future oprtions available which might increase the number of shares outstanding.
Statement of Cash Flows (SCF)Chapter 3: SCF – Question 1
Is the SCF dated in the title for a period of time similar to the income statement or for a point in time similar to the balance sheet? Why?
It is line with income statement and it is also given for three years. It will help in knowing the difference in amount of net income and the cash flow generated from operating activities due to timing difference and non cash item.
Chapter 3: SCF – Question 2
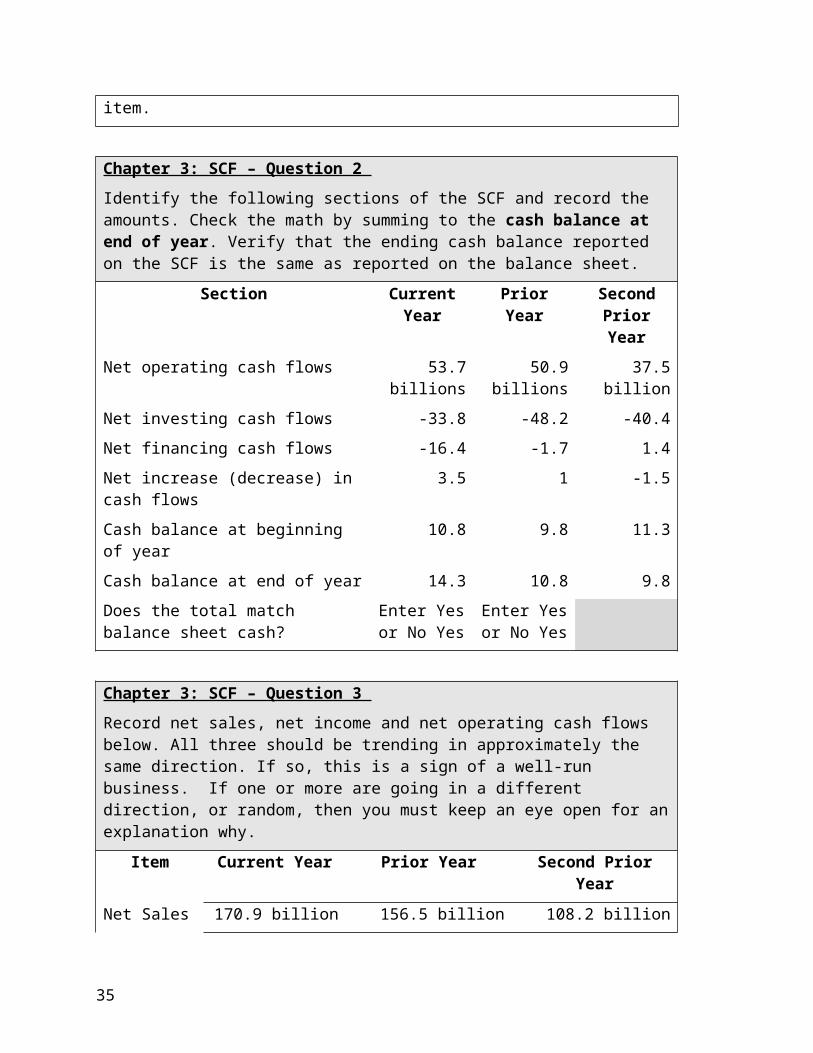
Identify the following sections of the SCF and record the amounts. Check the math by summing to the cash balance at end of year. Verify that the ending cash balance reported on the SCF is the same as reported on the balance sheet.
Section Current Year
Prior Year Second Prior Year
Net operating cash flows 53.7 billions 50.9 billions 37.5 billion
Net investing cash flows -33.8 -48.2 -40.4
Net financing cash flows -16.4 -1.7 1.4
Net increase (decrease) in cash flows 3.5 1 -1.5
Cash balance at beginning of year 10.8 9.8 11.3
24

Cash balance at end of year 14.3 10.8 9.8
Does the total match balance sheet cash? Enter Yes or No Yes
Enter Yes or No Yes
Chapter 3: SCF – Question 3
Record net sales, net income and net operating cash flows below. All three should be trending in approximately the same direction. If so, this is a sign of a well-run business. If one or more are going in a different direction, or random, then you must keep an eye open for an explanation why.
Item Current Year Prior Year Second Prior Year
Net Sales 170.9 billion 156.5 billion 108.2 billion
Net Income 37.04 41.7 25.9
Net Operating Cash Flows
53.7 50.9 37.5
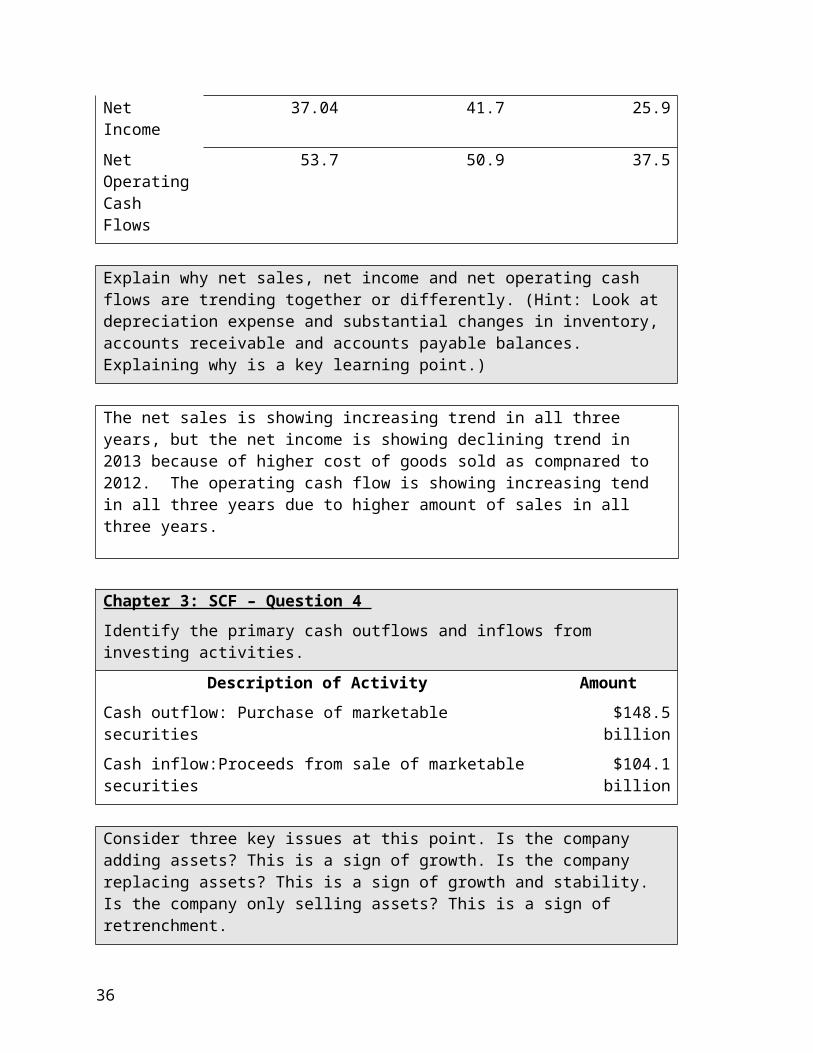
Explain why net sales, net income and net operating cash flows are trending together or differently. (Hint: Look at depreciation expense and substantial changes in inventory, accounts receivable and accounts payable balances. Explaining why is a key learning point.)
The net sales is showing increasing trend in all three years, but the net income is showing declining trend in 2013 because of higher cost of goods sold as compnared to 2012. The operating cash flow is showing increasing tend in all three years due to higher amount of sales in all three years.
Chapter 3: SCF – Question 4
Identify the primary cash outflows and inflows from investing activities.
Description of Activity Amount
Cash outflow: Purchase of marketable securities $148.5 billion
Cash inflow:Proceeds from sale of marketable securities $104.1 billion
Consider three key issues at this point. Is the company adding assets? This is a sign of growth. Is the company replacing assets? This is a sign of growth and stability. Is the company only selling assets? This is a sign of retrenchment.
The company is growing as the new fixed assets have been purchased and the
25

investment hs been made in non operating fixed assets.
Chapter 3: SCF – Question 5
Identify the primary cash inflow and outflow from financing activities.
Description of Activity Amount
Cash inflow: $17 billion
Cash outflow: (Note: cash dividends paid are reported here.) $10.6 billion
Consider two key issues at this point. How is the company being financed, through debt or equity? Can you determine which is growing faster and why? A sound corporate strategy is to finance a company with debt during stable times, because this demands regular payment of principal and interest, and to finance a company with equity during unstable times, because leadership can elect to pay or not pay dividends.
The company has financed through long term debt in 2013, which shows that company is stable and confident to meet the obligation of lenders of money.
The Statement of Stockholders’ Equity (SSE)Chapter 3: SSE – Question 1
Identify the elements that comprise the statement of stockholders’ equity section of your company. Hint: These items are generally illustrated across the top of the page using a columnar format. (Example. Common stock – shares and dollar amount.)
Common stock, retained earnings and accumulated other comprehensive income/loss.
Chapter 3: SSE – Question 2
Identify the cash dividends per share. 11.4
Determine the dividend payout percentage. A company’s dividend payout percentage is computed by dividing dividend per common share by net income or earnings per common share. (Hint: If your company reported a net loss for the year, the answer lacks meaning.)
29%
Compute dividend yield. A company’s dividend yield is computed by dividing dividend per common share by market
2.05%
26

price per common share. (Hint: Use the current per share price for your selected company.)
Is your company’s dividend yield a reasonable return given current market conditions?
The company has paid good amount of dividend in 2013 and it is almost at par of industrial average dividend yield of 2%.
Notes to the Financial StatementsChapter 3: Notes to the Financial Statements – Question 1
How does your company define “cash and cash equivalents”?
Cash and all instrument which may be converted in to cash in 90 days, such as money market fund, certificate of deposit, commercial paper and US Tresury Securities.
Chapter 3: Notes to the Financial Statements – Question 2
How does your company value its “inventories”? Explain the meaning of the inventory valuation method. Are domestic and international inventories valued thesame?Service companies will typically not have inventory.
FIFO cost flow method is used to value inventory, the the lower of cost or market value concept is applied to present in the balance sheet.
Chapter 3: Notes to the Financial Statements – Question 3
Does your company report any investments in marketable securities? Identify the respective amount(s) invested.
Category Current Year Amount
Trading Securities $26.3 billion
Available-for-Sale Securities Click here to enter text.
Held-to-Maturity Debt Securities $106.2 billion
Chapter 3: Notes to the Financial Statements – Question 4
Note 1 and a separate note on income taxes should provide the information to answer this question.
What was your company’s income tax expense for the current year?
$13.1 billion
How much cash was paid for income taxes in the current year? (Hint: Review the SCF. The difference generally relates to
$9.1 billion
27

the accrual basis of accounting.)
Identify the three major elements, such as depreciation or other post employment benefits, that gave rise to deferred tax assets or deferred tax liabilities:
Deferred Tax Assets Deferred Tax Liabilities
Accrued Liabilities and other reserves Unrealized earnings on foreing investment
Deferred Revenue Other
Share based compendation Click here to enter text.
What is this year’s effective tax rate for your company? What is the current year statutory rate?
Effective Tax Rate: %26.2%
Statutory Tax Rate: %35%
Chapter 3: Notes to the Financial Statements – Question 5
Reviewing note #1, any related supporting notes, and/or the 10-K, identify the fixed asset group(s), depreciation methods used, and the estimated useful lives of these fixed assets.
Fixed Asset Group Depreciation Method Estimated Lives (range)
Building Straight line Remainng life- 30 years
Machinery and Equipemnt Straight line 2- 5 years
Leasedhold improvement Straight line Leased term -10 years whichever is minimum
Click here to enter text. Click here to enter text. Click here to enter text.
Click here to enter text. Click here to enter text. Click here to enter text.
Chapter 3: Notes to the Financial Statements – Question 6
Review the balance sheet, note #1, and any related notes and identify the amount of goodwill reported in the current year.
Amount reported in current year. $ 1.6 billion
Identify the amount of any significant write-down of goodwill that occurred during the current year.
$ 0
How does management describe how it accounts for goodwill as disclosed in the note(s) to the financial statements?
28

The company record goodwill at the time of acquisition of any business. And it is shown at its gorss crrying value, no amortization is recorded on goowill.
Chapter 3: Notes to the Financial Statements – Question 7
Given present executive compensation packages, why would the user of financial information prefer a company follow SFAS #123(R) instead of APBO #25? Explain.
Accroding to SFAS 123 R, the stock option is entitled to be shown as expense at its fair value.
Chapter 3: Notes to the Financial Statements – Question 8
Review your company’s lease note (and related balance sheet information), then identify the following amounts:
Minimum lease payments under operating leases $4.7 billion
Minimum lease payments under capital leases 0
Ratio of operating lease payments to capital lease payments
May not be calculated
As a user of reported financial information, would you be concerned about a significant amount of operating leases that are not reported in the balance sheet? Explain.
The amount of minimum lease payment of $4.7 billion which has not been shown as liability, if it has to be paid it will decrease the future earnings of the company.
Chapter 3: Notes to the Financial Statements – Question 9
Review your company’s long-term debt note and identify the following (consider the three most significant liabilities only):
Instrument Maturity Date Rate Amount Due
Fixed Rate Note 2023 2.4% $5.5 billion
Fixed Rate Note 2018 1% $4 billion
Fixed Rate Note 2043 3.85% $3 billion
How much interest expense was recognized in the current year?
$136 million
How much cash was paid for interest in the current year? (Hint: Look in the SCF.*)
0
*The difference between interest expense and cash paid for interest is due to the accrual basis of accounting (and in some cases, the capitalization of interest).
29
Chapter 3: Notes to the Financial Statements – Question 10
Review your company’s pension and OPEB note (if applicable) and answer the following questions.
Pensions OPEB
How much is the Projected Benefit Obligation (PBO) and Accumulated Postretirement Benefit Obligation (APBO) for your company at the end of the current year?
NA 0
What was the amount of pension or OPEB benefits paid to plan participants during the current year?
NA 0
What amount of cash did the company contribute to the respective funds during the current year? This is known as “employer contributions.”
NA 0
What is the value of the plan assets at the end of the current year?
NA 0
Based on your review of the plan assets and the projected benefit obligation (or accumulated postretirement benefit obligation), has your company sufficiently funded its employee benefit plans (this is known as funded status)?
NA
An expected average return on invested plan assets is used to reduce the volatility in the reporting of pension or OPEB expense. Higher expected average returns reduce pension or OPEB expense, and lower expected returns increase pension expense. What rate of return on plan assets does your company use to compute pension or OPEB expense? Does this appear reasonable, given present market conditions?
Rate employed?NA Response:NA
30

Chapter 3: Notes to the Financial Statements – Question 11
Based on your review of the contingencies note, briefly identify specific events that have led to the accrual of contingent liabilities in your selected company’s the balance sheet.
Various legal proceedings and claims to the company during the ordinary course of business. The case against Samsung is pending and it is in the final stage of judgement an dit is expected that company will be awarded $1.05 billion, but company ha not made any provision in this regard. A case against company by Vinert X Inc. regarding the product patents. The company will be able to defend the case therefore no losses have been recorded or liability have been shown.
Chapter 3: Notes to the Financial Statements – Question 12
Based on your review of the segment-reporting note to the financials, identify the reported operating segments, their related revenues, and operating income. Identify the largest three if more than three are disclosed.
Reportable Operating Segments
Net Sales Revenue Net Operating Income
America $62.7 billion $22.8 billion
Europe 37.9 13
Greter China 25.4 8.5
Chapter 3: Notes to the Financial Statements – Question 13
Based on your review of the segment-reporting note to the financials, identify the geographical segments and their related revenues. Identify the largest three if more than three are disclosed.
Country Net Sales Revenue
US $66.2 billionChina 26Other countries 78.8
Chapter 3: Notes to the Financial Statements—Question 14
Based on your review of the notes to the financials or the statement of stockholders’ equity, identify the components (no more than four) that comprise Other Comprehensive Income for your company.
Component Amount
Change in foreign currency translation -$112 million
Change in fair value of derivatives $522 million
31

Change in fair value of marketable securities -$791 million
Adjustment for losses / gain realized and included in net income
-$131 million
32

CHAPTER 4 - FINANCIAL ANALYSISSummary Financial Analysis Report
Note: S&P 500 data is no longer available from the website: investing.money.msn.com. You will see this column in the workbook but not in the Word template form. You are not responsible for S&P 500 data input.
Profit Margin %
Answers how well the business performed.
Company Two Years Prior
Company One Year Prior Company Industry
Gross Margin Gross Profit /
Total Revenue Click here to enter text.
Click here to enter text.
Click here to enter text.
Click here to enter text.
Pre-Tax Margin Operating Income
/ Total RevenueClick here to
enter text.Click here to
enter text.Click here to
enter text.Click here to
enter text.
Net Profit Margin Net Income /
Total RevenueClick here to enter text.*
Click here to enter text.*
Click here to enter text.
Click here to enter text.
Sales Financial Statement
Click here to enter text.
Click here to enter text.
Click here to enter text.
Not required
Operating Income Financial
StatementClick here to
enter text.Click here to
enter text.Click here to
enter text.Not required
Operating Cash Flows
Financial Statement
Click here to enter text.
Click here to enter text.
Click here to enter text.
Not required
Evaluate Profitability (Think about the corporate strategy in providing a response. Following are general guidelines, yet each company situation is unique. For a company with a growth strategic focus you will likely find increasing performance, above or below industry average. For a company with a stability strategic focus you will likely find stable performance, above or below industry average. For a company in a retrenchment strategic focus you will likely find poor performance, below industry average with efforts to improve and approach industry average. Note: Sales, operating income and operating cash flows should trend in approximately the same direction. This signals a stable operating business environment. If the three measures are not trending together, this signals lack of control by management.)
Click here to enter text.
33

Financial Condition Signals ability to take on additional debt and liquidity.
Company Two Years Prior
Company One Year Prior Company Industry
Debt/ Equity Ratio
(Total Liabilities – Current Liabilities)
/ Total equity
Click here to enter text.*
Click here to enter text.*
Click here to enter text.
Click here to enter text.
Current Ratio Current assets /
Current liabilitiesClick here to
enter text.Click here to
enter text.Click here to
enter text.Click here to
enter text.
Quick Ratio
(Cash and Short Term Investments
+ Short Term
Investments + Total Receivables,
Net) / Current Liabilities
Click here to enter text.
Click here to enter text.
Click here to enter text.
Click here to enter text.
Interest Coverage Data not readily
availableClick here to enter text.*
Click here to enter text.*
Click here to enter text.
Click here to enter text.
Evaluate Financial Condition (often labeled liquidity and solvency analysis) (Think about the corporate strategy in providing a response. Following are general guidelines, yet each company situation is unique. For a company with a growth strategic focus you will likely find stable or slightly decreasing liquidity, above or below industry average. Debt to equity often is increasing in a growing company. For a company with a stability strategic focus you will likely find stable liquidity, above or below industry average. Debt to equity often is stable as well. For a company with a retrenchment strategic focus you will likely find poor liquidity, below industry average with efforts to improve and approach industry liquidity. Debt to equity often is decreasing in a company during retrenchment.)
Click here to enter text.
34

Investment Return %
Signals performance for managers and owners.
Company Two Years Prior
Company One Year Prior Company Industry
Return On Equity Net Income /
Total EquityClick here to enter text.*
Click here to enter text.*
Click here to enter text.
Click here to enter text.
Return On Assets Net Income /
Total AssetsClick here to enter text.*
Click here to enter text.*
Click here to enter text.
Click here to enter text.
Return On Equity
(5-Year Avg.)
Not required Not required Click here to enter text.
Click here to enter text.
Return On Assets
(5-Year Avg.)
Not required Not required Click here to enter text.
Click here to enter text.
Evaluate Investment Return (Think about the corporate strategy in providing a response. Following are general guidelines, yet each company situation is unique. For a company with a growth strategic focus you will likely find increasing returns. For a company with a stability strategic focus you will likely find stable investment returns. For a company in a retrenchment strategic focus you will likely find poor and stable investment solvency, below industry average.)
Click here to enter text.
35

Management EfficiencySignals how well the company was run by management.
Company Two Years Prior
Company One Year Prior Company Industry
Income/Employee
Not required Not required Click here to enter text.
Click here to enter text.
Revenue/Employee
Not required Not required Click here to enter text.
Click here to enter text.
Receivable Turnover
Total Revenue /Average Accounts Receivable - Trade, Net
Click here to enter text.
Click here to enter text.
Click here to enter text.
Click here to enter text.
Average is defined: (beginning of the year + end of the year) / 2
Inventory Turnover
Cost of Revenue, Total / Average Total
Inventory
Click here to enter text.
Click here to enter text.
Click here to enter text.
Click here to enter text.
Asset Turnover
Total Revenue / Average Total
Assets
Click here to enter text.
Click here to enter text.
Click here to enter text.
Click here to enter text.
Evaluate Management Efficiency (Think about the corporate strategy in providing a response. Following are general guidelines, yet each company situation is unique. For a company with a growth strategic focus you will likely find improving efficiency, above or below industry average. For a company with a stability strategic focus you will likely find stable efficiency, above or below industry average. For a company in a retrenchment strategic focus you will likely find poor efficiency, below industry average with efforts to improve and approach industry average.)
Click here to enter text.
36
CHAPTER 5 - DECISION-MAKING PROCESSChapter 5: Decision-making Process – Question 1
Based upon your review, do the numbers support the company’s explicit strategic focus: a growth, stability or retrenchment focus? Why or why not?
Click here to enter text.
Chapter 5: Decision-making Process – Question 2
Return to the first question in this project. Chapter 1: Identify Why You Selected This Company—Question 1
A) What is/are your motivation(s) or interest(s) in selecting this company?
B) What question(s) are you seeking to answer?
You were asked to explain why you were investigating this company’s annual report. You have likely uncovered numerous pieces of information, some with conflicting insight. This may involve both financial and nonfinancial information. In addition, you may have found certain information to be incomplete for decision-making purposes. This is real world analysis. Most business decisions are made with as much reliable information as possible, yet common to the decision-maker is a desire for more information.
Prepare a thorough, yet concise answer to your original questions A and B above. For example, would you work for this company, why or why not? Support your response with the information gathered throughout your annual report study.
Click here to enter text.
37
Chapter 5: Validate Your Conclusion – Question 1
The Altman Z-score is a predictive model created by Edward Altman in the 1960’s. The score combines and weights five financial ratios to estimate the likelihood of a company going bankrupt. The lower the Altman Z-score the higher the odds of bankruptcy. Research findings suggest the Z-score predicts 72 - 80% of corporate bankruptcies two years prior to the actual filing.
Z-score > than 3 = considered healthy
Z-score between 1.8 and 3 = considered a warning sign
Z-score < than 1.8 = could be headed for bankruptcy
Computing the Z-score for your company is very simple. Go to one of the Websites listed below and compute the Z-scores for the respective years identified below. Print out your results and turn them in with this workbook.
www.jaxworks.com/calc2a.htm
www.ironwoodadvisory.com/zscore.htm
Two Years Prior One Year Prior Current Year
Z-score Click here to enter text.
Click here to enter text. Click here to enter text.
Z-score interpretation compared to the financial analysis. Does the Z-score agree or disagree with your analysis?
Click here to enter text.
Congratulations.
Now submit to your instructor your completed workbook per the instructions provided at the beginning of this document.
38