Embed Size (px)
Citation preview
DISTRICT URBANISATION REPORT
ERNAKULAM
DEPARTMENT OF TOWN AND COUNTRY PLANNING - GOVERNMENT OF KERALA
January 2011
PREFACE
Planning is a prerequisite for effective development. Development becomes comprehensive when growthcentres are identified considering physical, social and economic variables of an area in an integrated manner.This indicates that planning of villages and towns are to be complementary. Second Administrative ReformsCommission (ARC) while interpreting the article 243 ZD of the Constitution of India states as follows. “This, inother words, means that the development needs of the rural and urban areas should be dealt with in an integratedmanner and, therefore, the district plan, which is a plan for a large area consisting of villages and towns, shouldtake into account such factors as ‘spatial planning’, sharing of ‘physical and natural resources’, integrateddevelopment of infrastructure’ and ‘environmental conservation’. All these are important, because therelationship between villages and towns is complementary. One needs the other. Many functions that the townsperform as seats of industry, trade and business and as providers of various services, including higher education,specialized health care services, communication etc have an impact on the development and welfare of ruralpeople. Similarly, the orderly growth of the urban centre is dependent on the kind of organic linkage it establisheswith its rural hinterland”. Therefore a move of harmonizing urban and rural centres of an area can be said as amove of planned urbanisation of the area.
In this context, it is relevant to mention the 74th Amendment Act of the Constitution of India, whichmandated the District Planning Committee to prepare a draft development plan for the district. As per Article 243ZD of the Constitution, the District Planning Committee (DPC) shall consolidate Panchayat/Municipality Plans inthe district and prepare draft development plan for the district as a whole. The Constitution also specifies thatwhile preparing draft development plan due regard shall be given to matters of common interest betweenpanchayats and municipalities including spatial planning, sharing of water and other physical and natural resources,the integrated development of infrastructure and environmental conservation. In this respect, the district ofKollam has conducted an important experiment of preparation of an Integrated District Development Plan (IDDP)for the district. Through preparation of IDDP, the District Planning Committee of Kollam has become the first everDPC in the country to own a District Development Plan as envisaged by the Constitution. This path-breakingventure has become a model in participatory district planning in a spatial platform. The Plan was released duringthe international conference on district planning held at Kollam in August 2009. The Plan is now sanctioned byGovernment of Kerala. As per G.O (Rt) 354/04/LSGD dated 01.02.07, the State Government have extended theproject to the remaining districts in the state and the districts of Alappuzha, Thrissur, Idukki, Palakkad andWayanad were selected for extending the project in the first phase. However, even in these districts, preparationof IDDP is yet to be completed.
Preparation of such a plan will surely need decisions and commitment at various levels due to themultiplicity of agencies involved and the vast spectrum of aspects to be addressed. However, delay in planningshall not affect development. Hence a step by step approach may be adopted in planning. Therefore, theDepartment of Town and Country Planning evolved a sequence of plan preparation at district level, involvingDistrict Urbanisation Report (DUR), District Spatial Plan (DSP) and Integrated District Development Plan (IDDP).
The District Urbanisation Report defines the future spatial structure of a district, which is formulated byintegrating hierarchy and activity pattern of urban and rural settlements and the connectivity between them.The spatial structure of a district will act as a frame for the orderly development of urban centres and their ruralhinterland subsequently leading to a planned urbanisation.
The District Spatial Plan is a synergistic form of the District Urbanisation Report, since as a plan it iscongruent to a single unified physical design for the district through setting development goals and objectivesand formulating the development concept of the district. DSP will frame the general policies and strategies andstreamline directions of development of the district. The Development Directives of DSP is carved in the spatialplatform through the synthesis of findings of the analysis over the spatial structure based on secondary sourcesof data. But it lacks the resource studies as co-ordination of various agencies remain as an uphill task.
The Integrated District Development Plan can be termed as the highest echelon of this series and manifestall features of the draft district development plan as envisaged in Article 243ZD of the Constitution of India.Democratisation of planning and translation of sectoral policies into spatial plans are the paramount qualities ofIDDP as against DSP. IDDP comprises of two components; a Perspective Plan for 15-20 years and an Execution Planfor 5 years.
As said earlier, IDDP for Kollam District is already prepared under the leadership of the District PlanningCommittee, Kollam with the involvement of all the Local Governments in the district and Special TechnicalAdvisory Committee for IDDP. The Department of Town and Country Planning gave technical support for Planpreparation besides coordinating the entire process in the role of nodal agency.
Now, the Department has prepared District Spatial Plans for the districts of Thrissur and Palakkad andDistrict Urbanisation Reports for the districts of Thiruvananthapuram, Pathanamthitta, Alappuzha, Kottayam,Ernakulam, Idukki, Malappuram, Kozhikkode, Wayanad, Kannur and Kasaragod. The District Urbanisation Reportfor Ernakulam is one among the series.
I take this opportunity to appreciate the officials of the Ernakulam District Office of the Department,headed by Sri.K.Ramanan, Senior Town Planner in the preparation of this document. The State Project Cell forLDP-IDDP-SPP played anchor role in this regard, right from conceptualisation to shaping the end product. Thetoolkits and customised computer applications developed by the State Project Cell has enabled the districtoffices to accomplish the task in a time bound manner. I also appreciate the consistent efforts of Sri. Jacob Easow,Senior Town Planner, Smt.Ushakumari.P.R, Town Planner, Sri. Baiju.K, Deputy Town Planner and other officials ofthe State Project Cell. I also appreciate the officials of the circle headed bySmt.T.M.Sudha, Senior Town Planner for their efforts in vetting and finalising the District Urbanisation Report forErnakulam.
This is a first step on the ladder leading to the draft development plan for the district as laid down in theConstitution. It is hoped that the district of Ernakulam will further extend the District Urbanisation Report intoIntegrated District Development Plan for the district.
Certainly, the District Urbanisation Report for Ernakulam will provide a framework for development aswell as future planning of the district.
Thiruvananthapuram Eapen Varughese
11- 02-2011 Chief Town Planner
ACKNOWLEDGEMENTS
The District Urbanisation Report of Ernakulam District presents the analysis and findings of study onurbanisation in the Ernakulam District so as to evolve State Perspective plan for Kerala-2021.
I would like to express my sincere thanks to Sri. S. M. Vijayanand IAS, Additional Chief Secretary, LocalSelf Government Department for critical review, guidance and monitoring of the work. Sri. Eapen Varughese,Chief Town Planner is specially acknowledged with sincere gratitude for his timely reviews, guidance and allsupports during the preparation of DUR.
The efforts of the IDDP project Cell need special mention here without which the time bound preparationof the plan would not have been possible. Their technical assistance has enhanced the capabilities of theDistrict office team in the study on urbanization and preparation of District urbanization report. Their commitmentthroughout the preparation of the District Urbanisation Report was exemplary. The untiring efforts of Sri. JacobEasow, Senior Town Planner, of the State Project Cell was really an inspiration. Suggestion from Smt. P.R.Ushakumari, Town Planner, IDDP project cell is also thankfully acknowledged. She has been provided vitalsupport by reviewing and commenting on the drafts of the report. Particular thanks to Sri. K. Baiju, Deputy TownPlanner who provided generous assistance, sharing his accumulated experience and knowledge with the Reportteam. The officials of the IDDP-LDP Project Office took consistent efforts for the DUR preparation among whomSmt. Gayathri, Planning Assistant need special mention.
The support given by Smt. T.M.Sudha, Senior Town Planner (C-II), Office of the Chief Town planner,throughout the period was invaluable. Sri. A. Ramachandran, Town Planner and Smt. Asha Ajayaghosh, DeputyTown Planner were always ready to help and advice. Their guidance enhanced the capabilities of the Districtoffice team in the study on urbanization and preparation of District Urbanization Report.
The study on urbanization and DUR was prepared through a systematic process, setting up of aim andobjectives, analysis of existing facilities in the district and determination of settlement pattern and transportationnetwork. This document is a consolidation and analysis of urbanisation trends over recent years and identifiedthat the urban population and physical expansion of urban area will continue to increase in the foreseeablefuture.
I would like to express sincere appreciation to the team headed by Smt. P.R.Jayasree, Deputy TownPlanner, Smt. M.M.Sheeba, Assistant Town Planner who prepared the District Urbanisation report for Ernakulamdistrict in a time bound manner.
Separate mention must be made to the statistical section of the district office headed by the Researchofficer, Smt. Sangeetha in the process of gathering data for this report.
The concerted efforts of officers and Staffs of the district office have a significant role in the success ofthe report. Sri. T.A.Rahim, Ist Gr. Draftsman is hereby acknowledged for his contribution for map preparationand report preparation and Sri. Arun Raj, Planning Assistant is also acknowledged for his contribution in compilingand designing the report.
Sri. K. RemananSenior Town Planner
RTP Office, Ernakulam
District Urbanisation Report - Ernakulam CONTENT
Department of Town & Country Planning, KeralaDepartment of Town & Country Planning, Kerala
iviv
CONTENTS
Chapter 1 Profile of the District1.1 Introduction ...................................................................................................................... 11.2 Location ............................................................................................................................ 11.3 Administrative Division ..................................................................................................... 11.4 Topography and Physical Features .................................................................................... 31.4.1 Physical Features .............................................................................................................. 31.4.2 Land Utilisation................................................................................................................. 41.5 Socio-Economic Aspects .................................................................................................... 41.6 Inference .......................................................................................................................... 5
Chapter 2 History and Regional Linkages2.1 Historical Background ....................................................................................................... 62.2 Regional Linkages ............................................................................................................. 62.3 Connectivity ...................................................................................................................... 62.4 Inference .......................................................................................................................... 7
Chapter 3 Population3.1 Population Size .................................................................................................................. 83.2 Growth Rate of Population ................................................................................................ 83.3 Population Density .......................................................................................................... 113.3.1 Gross Population Density ................................................................................................ 113.3.2 Net Population Density ................................................................................................... 123.4 Sex Ratio ......................................................................................................................... 123.5 Population Concentration Pattern ................................................................................... 143.6 Migration Details ............................................................................................................ 163.7 Population Projection (Trend Based) ............................................................................... 163.8 Inference ........................................................................................................................ 17
Chapter 4 Occupational Structure4.1 Work Force of the District ............................................................................................... 184.2 Occupational Structure ................................................................................................... 194.3 Occupational Structure - Variation in Urban and Rural Areas ........................................... 204.4 Occupational Structure – Estimation of 9 Fold Classification of 2001 .............................. 214.5 Spatial Distribution of the Major Classes of Workers ....................................................... 214.6 Activity Pattern Based on Occupational Structure of Workers .......................................... 234.7 Occupational Structure – Temporal Variation .................................................................. 254.8 Inference ........................................................................................................................ 25
CONTENT District Urbanisation Report - Eranakulam
Department of Town & Country Planning, KeralaDepartment of Town & Country Planning, Kerala
vv
Chapter 5 Land Use5.1 Land Use Pattern of Kerala State ..................................................................................... 265.2 Land Use Break Up of Ernakulam District ........................................................................ 265.3 Regional Land Use Study ................................................................................................. 275.4 Concentration Pattern of Land Use .................................................................................. 315.4.1 Agricultural Land Use ...................................................................................................... 315.4.2 Other Built Up Land Use .................................................................................................. 325.4.3 Forest Land Use .............................................................................................................. 325.4.4 Residential Land Use ...................................................................................................... 335.4.5 Residential/Agriculture Mix Land Use ............................................................................. 335.4.6 Water Bodies .................................................................................................................. 345.4.7 Plantations ...................................................................................................................... 345.4.8 Marshy Land ................................................................................................................... 355.4.9 Other Land Use ............................................................................................................... 355.5 Activity Zones Based Land Use Concentration Pattern .................................................... 355.6 Inference ........................................................................................................................ 37
Chapter 6 Functional Character of Settlements6.1 Character of Settlements ................................................................................................ 386.2 Inference ........................................................................................................................ 40
Chapter 7 Hierarchy of Settlements7.1 Existing Hierarchy of Settlements ................................................................................... 417.2 Suggested Hierarchy of Settlements-Methodology Adopted ............................................ 427.3 Suggested Hierarchy of Settlements-Procedure Adopted ................................................. 437.4 Functions (Proposed) to be Performed by Various
Higher Order Settlements ............................................................................................... 507.5 Inference ........................................................................................................................ 50
Chapter 8 Urban Profile8.1 Trend of Urbanization - Kerala ......................................................................................... 518.2 Census Urban Areas in Ernakulam District ...................................................................... 538.3 Urban Population Content (Existing) ................................................................................ 538.4 Growth Rate of Urban Population .................................................................................... 548.5 Urban Settlements from 1971-2001 ................................................................................. 568.6 Future Urbanization Profile of the District ....................................................................... 578.7 Urban Profile ................................................................................................................... 618.8 Inference ........................................................................................................................ 62
Chapter 9 Nodes9.1 Existing Hierarchy of Nodes ............................................................................................ 639.2 Suggested Hierarchy of Nodes ........................................................................................ 649.2.1 Suggested Ist Order Nodes ............................................................................................... 64
District Urbanisation Report - Eranakulam CONTENT
Department of Town & Country Planning, KeralaDepartment of Town & Country Planning, Kerala
vivi
9.2.2 Suggested IInd Order Nodes ............................................................................................. 649.2.3 Suggested IIIrd Order Nodes ............................................................................................. 669.3 Inference ........................................................................................................................ 68
Chapter 10 Connectivity10.1 Existing Connectivity ....................................................................................................... 6910.2 Description of Hierarchy of Nodes .................................................................................. 7110.3 Description of Hierarchy of Settlements .......................................................................... 7210.4 Suggested Network ......................................................................................................... 7210.5 Future Connectivity ......................................................................................................... 7710.6 Inference ........................................................................................................................ 77
Chapter 11 Activity Pattern11.1 Description of Land Use Concentration Pattern ............................................................... 7811.2 Description of Future Urban Profile ................................................................................. 7811.3 Description of Functional Classification .......................................................................... 7911.4 Determination of Activity Pattern .................................................................................... 7911.4.1 Urban Activity ................................................................................................................. 7911.4.2 Primary Activity ............................................................................................................... 8011.4.3 Secondary Activity ........................................................................................................... 8111.4.4 Agricultural Activity Non Detrimental to Forest ............................................................... 8111.4.5 Agriculture and Allied Activity ......................................................................................... 8111.5 Activity Pattern of Ernakulam District .............................................................................. 8211.6 Inference ........................................................................................................................ 82
Chapter 12 Spatial Structure12.1 Spatial Structure of the District ....................................................................................... 8312.1.1 Hierarchy of Settlements ................................................................................................. 8312.1.2 Activity Pattern ............................................................................................................... 8312.1.3 Connectivity .................................................................................................................... 8412.1.4 Spatial Structure .............................................................................................................. 8412.2 Inference ........................................................................................................................ 84
Chapter 13 Summary of Findings13.1 General ........................................................................................................................... 8513.2 Population ...................................................................................................................... 8613.3 Work Force Participation Rate and Occupational Pattern ............................................... 8613.4 Land Use ......................................................................................................................... 8713.5 Development Directives .................................................................................................. 87
CONTENT District Urbanisation Report - Eranakulam
Department of Town & Country Planning, KeralaDepartment of Town & Country Planning, Kerala
viivii
LIST OF TABLESTable 1.1 Taluks and Taluk Head quarters ........................................................................................ 2Table 1.2 Block Panchayats and their Head quarters ....................................................................... 2Table 1.3 Land Utilisation Pattern by Category 2000-2005 (Area in Ha) ........................................... 5Table 3.1 Growth rate of Districts of Kerala ..................................................................................... 9Table 3.2 Area and Population variation in LSGs showing negative growth .................................... 11Table 3.3 District wise Population density 1991, 2001 ................................................................... 11Table 3.4 Density range of LSGs .................................................................................................... 13Table 3.5 Statistics on Migrants (by place of birth) from other states/UTs in Kerala ...................... 15Table 3.6 Distribution of Migrants from Other States/UTs in the Districts of Kerala ....................... 16Table 3.7 Projected District Population – Decreasing rate method ................................................. 17Table 3.8 Projected District Population – Apportionment method .................................................. 17Table 3.9 Average Population figures ............................................................................................ 17Table 4.1 Fourfold classification of Workers – 2001 ....................................................................... 20Table 4.2 Workers Classification (2001) – Urban and Rural area .................................................... 20Table 4.3 Concentration Pattern of Workers ................................................................................... 23Table 4.4 Fourfold Classification of Workers - 1981 to 2001........................................................... 24Table 4.5 Fourfold Classification of Urban Workers - 1981-2001 .................................................... 25Table 4.6 Fourfold Classification of Rural Workers - 1981-2001 ..................................................... 25Table 5.1 Land Use Breakup – Kerala State .................................................................................... 26Table 5.2 Land Use Breakup – Ernakulam District .......................................................................... 27Table 5.3 Comparison of Land Use Breakup of Ernakulam District and Kerala State ....................... 27Table 5.4 Land Use Breakup - Comparison with Neighbouring Districts .......................................... 28Table 5.5 Grouping of Land Use Classifications ............................................................................. 35Table 5.6 Criteria for Determination of Activity based on Land Use................................................ 37Table 6.1 Functional Character of LSGs .......................................................................................... 38Table 7.1 Second Order Settlements, its Service Area & Service Population ................................... 44Table 7.2 Service Area of 3rd Order Settlements ............................................................................. 47Table 7.3 Suggested Hierarchy of Settlements ............................................................................... 48Table 7.4 Facilities in general to be provided ................................................................................. 50Table 8.1 Population (2001) of Kerala at a glance .......................................................................... 51Table 8.2 Trend of Population growth of Kerala - 1981-2001 .......................................................... 51Table 8.3 Trends in Urbanization of Kerala - 1981-2001 ................................................................. 51Table 8.4 Census Towns & Out growths in Ernakulam District – 2001 ............................................ 52Table 8.5 District wise percentage of Urban Population in Kerala .................................................. 53Table 8.6 Ernakulam District - Variation in urban content 1991-2001 ............................................. 53Table 8.7 Growth rate of Urban Population – Comparison with State ............................................. 55Table 8.8 Population Details Taluk wise Year – 2001 ..................................................................... 56Table 8.9 Urban Settlements in different period of time ................................................................. 56Table 8.10 Future Urban Profile of the District ................................................................................. 61Table 8.11 Urban Profile – Phasing .................................................................................................. 61Table 9.1 List of Nodes in Ernakulam District ................................................................................. 64Table 9.2 Hierarchy of Nodes (Proposed) ....................................................................................... 67
District Urbanisation Report - Eranakulam CONTENT
Department of Town & Country Planning, KeralaDepartment of Town & Country Planning, Kerala
viiiviii
Table 10.1 Modified Conceptual Road Network ............................................................................... 74Table 11.1 Classification of Settlements .......................................................................................... 79Table 11.2 Urban Activity ................................................................................................................. 79Table 11.3 Primary Activity .............................................................................................................. 80Table 11.4 Agricultural Activity Non-detrimental to Forest ............................................................... 81Table 11.5 Agricultural and Allied Activity ....................................................................................... 82
CONTENT District Urbanisation Report - Eranakulam
Department of Town & Country Planning, KeralaDepartment of Town & Country Planning, Kerala
ixix
LIST OF FIGURESFig 1.1 Physical Setting of Ernakulam District ............................................................................... 1Fig 1.2 Taluks in Ernakulam District .............................................................................................. 2Fig 1.3 Block Panchayats in Ernakulam District ............................................................................ 2Fig 1.4 Grama Panchayats in Ernakulam District .......................................................................... 3Fig 1.5 Water Bodies of Ernakulam District .................................................................................. 4Fig 2.1 Regional Setting of Ernakulam District .............................................................................. 7Fig 2.2 District Map showing the Road and Rail Network, important Junctions etc ....................... 7Fig 3.1 Population Size – Comparison with Surrounding Districts .................................................. 8Fig 3.2 Population size – Temporal Variation ................................................................................ 8Fig 3.3 Population Growth rate Comparison with Surrounding Districts ........................................ 9Fig 3.4 Population Growth rate of State and Ernakulam District – Temporal Variation .................. 9Fig 3.5 Population Growth rate 1971-81 LSG Wise ....................................................................... 10Fig 3.6 Population Growth rate 1981-91 LSG Wise ....................................................................... 10Fig 3.7 Population Growth rate 1991-2001 LSG Wise .................................................................... 10Fig 3.8 LSGs with Highest Population Growth rate ........................................................................ 10Fig 3.9 District wise Distribution of Population Density 1991, 2001.............................................. 11Fig 3.10 Gross Population Density - Comparison with Surrounding Districts ................................. 11Fig 3.11 Distribution of Gross Population Density (2001 census) – LSG wise ................................ 12Fig 3.12 Spatial Distribution of the Net Population Density .......................................................... 12Fig 3.13 Sex Ratio-Comparison with State .................................................................................... 14Fig 3.14 Sex Ratio (0-6 Age group) - Comparison with Surrounding Districts - 2001 Census ......... 14Fig 3.15 Population Concentration Pattern of Ernakulam District in 2001 ..................................... 14Fig 4.1 Work Participation Rate of Ernakulam District .................................................................. 18Fig 4.2 Main Workers, Marginal Workers and Non Workers ........................................................... 18Fig 4.3 Variation of Total Workers and Total Main Workers ........................................................... 19Fig 4.4 Nine Fold Classification of Workers – 1991 census ........................................................... 19Fig 4.5 Workers Classification – 1991 Census .............................................................................. 19Fig 4.6 Classification of Workers – 2001 Census .......................................................................... 19Fig 4.7 Occupational Structure of the Surrounding Districts – 2001 .............................................. 20Fig 4.8 Classification of Total Workers in Urban & Rural Areas of Ernakulam District – 2001 ........ 21Fig 4.9 Nine fold Classification of Workers (Estimated) – 2001 Census ........................................ 21Fig 4.10 Workers Classification – 2001 Census (Estimated) .......................................................... 21Fig 4.11 Workers Classification – 1991 & 2001 Census ................................................................ 21Fig 4.12 Concentration Index of HH Industrial Workers in LSGs, Ernakulam District – 2001 .......... 22Fig 4.13 Concentration Index of Agricultural Labourers in LSGs – Ernakulam ................................ 22Fig 4.14 Spatial Distribution of the Concentration Index of Cultivators ......................................... 22Fig 4.15 Spatial Distribution of the Concentration Index of Other Workers ................................... 22Fig. 4.16a Concentration of Workers in Primary Sector - LSG wise Distribution ............................. 23Fig. 4.16b Concentration of Workers in Secondary Sector - LSG wise Distribution ......................... 24Fig. 4.16c Concentration of Workers in Tertiary Sector - LSG wise Distribution ............................. 24Fig 4.17 Activity Pattern of LSGs evolved based on Concentration Pattern of Workers .................. 24Fig 4.18 Variation in the number of different category of Workers in Urban areas ........................ 25
District Urbanisation Report - Eranakulam CONTENT
Department of Town & Country Planning, KeralaDepartment of Town & Country Planning, Kerala
xx
Fig 4.19 Variation in the number of different category of Workers in Rural area ........................... 25Fig 5.1 Land Use Breakup – Kerala State ...................................................................................... 26Fig 5.2 Percentage of Land Use Breakup – Ernakulam District ...................................................... 27Fig 5.3 Land Use Map – Ernakulam District .................................................................................. 28Fig 5.4 Comparison of the Percentage share of Forest Land Use of the state in
Ernakulam and Surrounding Districts ................................................................................ 28Fig 5.5 Forest Land Use Comparison with Surrounding Districts .................................................... 29Fig 5.6 Comparison of the Percentage share of Marshy Land of the State in
Ernakulam and Surrounding Districts ................................................................................ 29Fig 5.7 Marshy Land - Comparison with Surrounding Districts ...................................................... 29Fig 5.8 Comparison of the Percentage share of Residential Land Use in District of Kerala Ernakulam and Surrounding Districts ................................................................................. 29Fig 5.9 Residential Land Use Comparison with Surrounding Districts ............................................ 29Fig 5.10 Comparison of the Percentage share of Agricultural Land use of the State -
Ernakulam & Surrounding Districts .................................................................................. 30Fig 5.11 Agriculture Land Use Comparison with Surrounding Districts .......................................... 30Fig 5.12 Comparison of the Percentage share of Plantation Land use of the State in
Ernakulam & Surrounding Districts .................................................................................. 30Fig 5.13 Plantation Land Use Comparison with Surrounding Districts ........................................... 30Fig 5.14 Comparison of the Percentage share of Res/Agri Mix Land Use of the State in
Ernakulam & Surrounding Districts .................................................................................. 30Fig 5.15 Res/Agri Mix Land Use Comparison with Surrounding Districts ....................................... 31Fig 5.16 The Concentration Pattern of Agricultural Land Use ........................................................ 31Fig 5.17 The Concentration Index of Agricultural Land Use ........................................................... 32Fig 5.18 Concentration Pattern of the Other Built up Land Use ..................................................... 32Fig 5.19 The Concentration Pattern of Other Built up Land Use in LSGs of Ernakulam District ...... 32Fig 5.20 Concentration pattern of Forest Land Use in LSGs of Ernakulam Dist .............................. 33Fig 5.21 Variation of Concentration Pattern of Forest Land Use among LSGs ................................ 33Fig 5.22 Concentration Pattern of Residential Land Use ............................................................... 33Fig 5.23 Variation of Concentration Index of Residential Land Use ............................................... 34Fig 5.24 Concentration Pattern of Res/Agri Mix Land Use ............................................................. 34Fig 5.25 Concentration Pattern of Water Body .............................................................................. 34Fig 5.26 Variation of Concentration Index of Water Body .............................................................. 34Fig 5.27 Distribution of Concentration Index of Plantation Land Use ............................................ 35Fig 5.28 Distribution of Concentration Index of Marshy Land ....................................................... 35Fig 5.29 Concentration Pattern of Other Land Uses ...................................................................... 35Fig 5.30a The Concentration Pattern of Non- Agricultural Land Use.............................................. 36Fig 5.30b The Concentration Pattern of Agricultural Land Use ...................................................... 36Fig 5.30c The Concentration Pattern of Forest Land Use............................................................... 36Fig 5.30d The Concentration Pattern of Plantations ...................................................................... 36Fig 5.31 Activity Pattern of LSGs based on Land Use .................................................................... 36Fig 6.1 Functional Character of Settlements ................................................................................. 40Fig 7.1 CFI Vs No. of Settlements .................................................................................................. 41
CONTENT District Urbanisation Report - Eranakulam
Department of Town & Country Planning, KeralaDepartment of Town & Country Planning, Kerala
xixi
Fig 7.2 Spatial Distribution of Settlements of Different Hierarchies .............................................. 42Fig 7.3 Existing 1st and 2nd Order Settlements of Ernakulam District .......................................... 43Fig 7.4 Projected 2nd Order Settlements ...................................................................................... 44Fig 7.5 Service Area of 2nd Order Settlements.............................................................................. 44Fig 7.6 Service Area (Service Settlements) of 2nd Order Settlements (Adjusted) ........................... 45Fig 7.7 3rd Order Settlements of Kochi Corporation ...................................................................... 45Fig 7.8 3rd Order Settlements of Kochi Corporation – Adjusted .................................................... 46Fig 7.9 3rd order settlements of Kalamassery .............................................................................. 46Fig 7.10 Service Areas of 3rd Order Settlements (Adjusted) .......................................................... 46Fig 7.11 Service Settlements of 3rd Order Settlements ................................................................. 47Fig 7.12 Suggested Hierarchy of Settlements ............................................................................... 49Fig 8.1 Urban Areas of Ernakulam District .................................................................................... 51Fig 8.2 Extent of Urban Area of the District – Temporal Variation ................................................. 54Fig 8.3 Total Urban Population during various decades................................................................. 54Fig 8.4 Population Growth Rate- Comparison with District ........................................................... 55Fig 8.5 Growth rate of Population (1991-2001) - LSG wise variation ............................................. 55Fig 8.6 Urban Centers based on 3 fold Census Criteria ................................................................. 58Fig 8.7 Urban Centers based on Census Criteria & Grade of LSGs ................................................ 58Fig 8.8 Urban Centers based on Census Criteria, Grade of LSGs & Perspectives in Urban Development ......................................................................................................... 59Fig 8.9 Urban Centers based on all Criteria .................................................................................. 60Fig.8.10 Future Urban Profile of the District .................................................................................. 60Fig 9.1 Nodes with Hierarchy ....................................................................................................... 63Fig 9.2 Spatial Distribution of Nodes (Existing) ............................................................................. 64Fig 9.3 Size of Service Area Polygon in different area .................................................................. 65Fig 9.4 Service Area of Existing Second Order Nodes .................................................................... 66Fig 9.5 Proposed Second Order Nodes .......................................................................................... 66Fig 9.6 Suggested Second Order Nodes with Service Area ............................................................ 66Fig 9.7 Service Area of Existing Third Order Nodes ....................................................................... 66Fig 9.8 Service Area of Existing and Suggested 3rd Order Nodes .................................................. 67Fig 9.9 Proposed Hierarchies of Nodes ......................................................................................... 68Fig 10.1 Transportation Network- Ernakulam District .................................................................... 69Fig 10.2 Spatial Distribution of Nodes .......................................................................................... 72Fig 10.3 Suggested Hierarchy of Settlements ............................................................................... 72Fig 10.4 Suggested Hierarchies of Nodes and Settlements along with Existing Road Network ...... 73Fig 10.5 Suggested Conceptual Road Network based on Hierarchy of Settlements ....................... 73Fig 10.6 Future Connectivity Network ........................................................................................... 76Fig 11.1 Derivation of Activity Pattern .......................................................................................... 78Fig 11.2 Land Use Concentration Pattern ...................................................................................... 78Fig 11.3 Future Urban Profile ........................................................................................................ 79Fig 11.4 Functional Classification ................................................................................................. 79Fig 11.5 Urban Activity Areas ....................................................................................................... 80Fig 11.6 Intensive Agricultural Activity Areas or Primary Activity Areas ........................................ 80
District Urbanisation Report - Eranakulam CONTENT
Department of Town & Country Planning, KeralaDepartment of Town & Country Planning, Kerala
xiixii
Fig 11.7 Distribution of Secondary Activity Area ........................................................................... 81Fig 11.8 Primary Activity Areas (Agricultural and Allied Activity) Non-detrimental to Forest ......... 81Fig 11.9 Agricultural and Allied Activity Area ................................................................................ 82Fig 11.10 Activity Pattern of the District ....................................................................................... 82Fig 12.1 Spatial Structure Evolution .............................................................................................. 83Fig 12.2 Suggested Hierarchy of Settlements ............................................................................... 83Fig 12.3 Activity Pattern of the District ......................................................................................... 84Fig 12.4 Suggested Conceptual Road Network ............................................................................. 84Fig 12.5 Suggested Spatial Structure of the District ...................................................................... 84
CONTENT District Urbanisation Report - Eranakulam
Department of Town & Country Planning, KeralaDepartment of Town & Country Planning, Kerala
ANNEXES
ANNEXE 1 LIST OF LOCAL BODIES IN ERNAKULAM DISTRICT .................................................... 89ANNEXE 2 DISTRICT WISE AND SECTOR WISE DISTRIBUTION OF GROSS STATE
DOMESTIC PRODUCT DURING 2008-09 AT CONSTANT (1999-2000)PRICES (QUICK ESTIMATE) ....................................................................................... 90
ANNEXE 3 POPULATION PROJECTION - KERALA ....................................................................... 91ANNEXE 4 CONCENTRATION INDEX OF WORKERS .................................................................... 93ANNEXE 4A ACTIVITY PATTERN OF WORKERS ............................................................................. 96ANNEXE 5 LSG WISE CONCENTRATION INDICES OF VARIOUS LAND USE .................................. 99ANNEXE 6 LSG WISE MAJOR ACTIVITY (AS PER LAND USE ANALYSIS) ........................................ 102ANNEXE 7 LSG WISE LAND USE CONCENTRATION PATTERN ..................................................... 105ANNEXE 8 COMPOSITE FUNCTIONAL INDEX (CFI) OF SETTLEMENTS ........................................ 108ANNEXE 9 HIERARCHY OF SETTLEMENTS (EXISTING) ................................................................ 109ANNEXE 10A CENTRALITY ............................................................................................................. 110ANNEXE 10B CONNECTIVITY ........................................................................................................ 115ANNEXE 11 THIRD ORDER SETTLEMENTS WITH SERVICE
AREA & SERVICE POPULATION ................................................................................. 118ANNEXE 12 HIERARCHY OF NODES - METHODOLOGY................................................................ 121ANNEXE 13 PERCENTAGE OF NON AGRICULTURAL MALE WORKERS .......................................... 124
xiiixiii
District Urbanisation Report - Ernakulam PROFILE OF THE DISTRICT
Department of Town & Country Planning, KeralaDepartment of Town & Country Planning, Kerala
11
Chapter-1PROFILE OF THE DISTRICT
1.1 INTRODUCTION
Ernakulam district is situated almost at the
middle of Kerala State and on the coast of the Arabian
Sea. It has credit of being the economic nerve center of
the State. It is the most industrially advanced and
flourishing District of Kerala compared to the other
districts.
This district was formed in 1958 by carving the
regions from Thrissur and Kottayam district. The district
is named after the erstwhile Ernakulam town, the name
of which in turn is said to have been derived from the
word Rishinagakulam, a tank in the famous Siva Temple
in the town.
The District comprises areas of the erstwhile
Travancore, Cochin and Malabar states. Initially the
district headquarters was at Ernakulam, which gave the
district its name; the headquarters was later shifted to
Kakkanad. When Idukki District was formed on January
26, 1977, Thodupuzha Taluk was joined with Idukki and
Muvattupuzha Taluk separated to form Kothamangalam
Taluk. The present Ernakulam District includes Paravur,
Aluva, Kochi, Kanayannoor, Muvattupuzha,
Kunnathunadu and Kothamangalam Taluks which come
under Fort Kochi and Muvattupuzha revenue divisions.
The district is 47.56% urbanised.
Kochi (the new name for Cochin) is the port
city and the commercial capital of Kerala State in India,
located by the side of Arabian Sea on the southwestern
coast of India. The entire region covering Fort Kochi,
Mattancherry, Wellington Island, mainland Ernakulam
and its suburbia (including Vyttila, Vennala, Edapally)
is generally referred to as Kochi (or Cochin) because all
these areas were part of the erstwhile kingdom of Kochi
in pre-independence India.
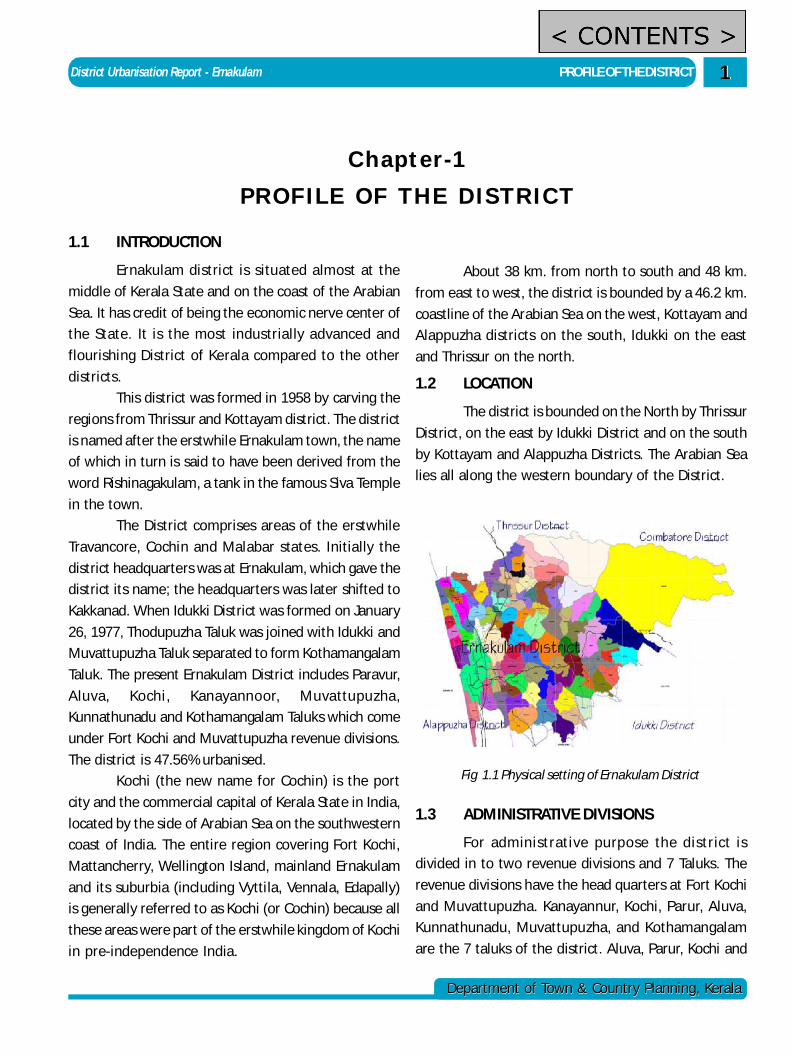
About 38 km. from north to south and 48 km.
from east to west, the district is bounded by a 46.2 km.
coastline of the Arabian Sea on the west, Kottayam and
Alappuzha districts on the south, Idukki on the east
and Thrissur on the north.
1.2 LOCATION
The district is bounded on the North by Thrissur
District, on the east by Idukki District and on the south
by Kottayam and Alappuzha Districts. The Arabian Sea
lies all along the western boundary of the District.
Fig 1.1 Physical setting of Ernakulam District
1.3 ADMINISTRATIVE DIVISIONS
For administrative purpose the district is
divided in to two revenue divisions and 7 Taluks. The
revenue divisions have the head quarters at Fort Kochi
and Muvattupuzha. Kanayannur, Kochi, Parur, Aluva,
Kunnathunadu, Muvattupuzha, and Kothamangalam
are the 7 taluks of the district. Aluva, Parur, Kochi and
PROFILE OF THE DISTRICT District Urbanisation Report - Ernakulam22
Department of Town & Country Planning, KeralaDepartment of Town & Country Planning, Kerala
Kanayannur taluks come under Fort Kochi revenue
division and Kunnathunad, Muvattupuzha and
Kothamangalam taluks come under Muvattupuzha
division. There are 124 revenue villages under seven
taluks.
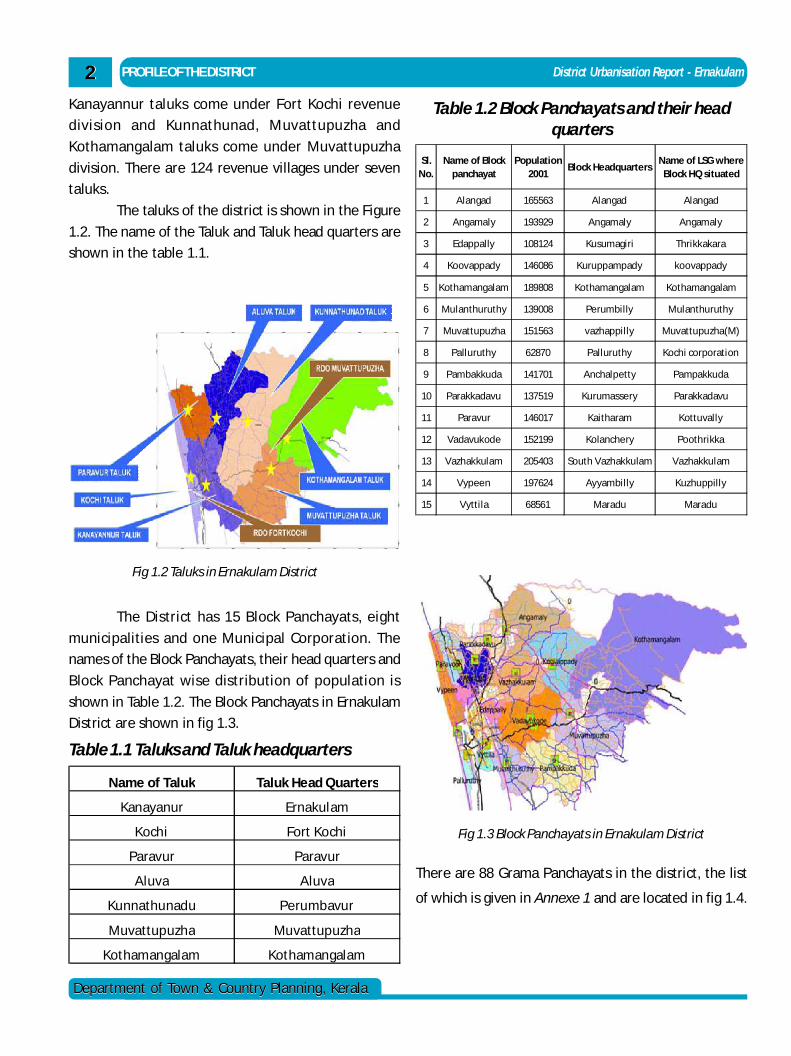
The taluks of the district is shown in the Figure
1.2. The name of the Taluk and Taluk head quarters are
shown in the table 1.1.
Fig 1.2 Taluks in Ernakulam District
Table 1.1 Taluks and Taluk headquarters
Name of Taluk Taluk Head Quarters
Kanayanur Ernakulam
Kochi Fort Kochi
Paravur Paravur
Aluva Aluva
Kunnathunadu Perumbavur
Muvattupuzha Muvattupuzha
Kothamangalam Kothamangalam
Sl. No.
Name of Block panchayat
Population 2001
Block HeadquartersName of LSG where
Block HQ situated
1 Alangad 165563 Alangad Alangad
2 Angamaly 193929 Angamaly Angamaly
3 Edappally 108124 Kusumagiri Thrikkakara
4 Koovappady 146086 Kuruppampady koovappady
5 Kothamangalam 189808 Kothamangalam Kothamangalam
6 Mulanthuruthy 139008 Perumbilly Mulanthuruthy
7 Muvattupuzha 151563 vazhappilly Muvattupuzha(M)
8 Palluruthy 62870 Palluruthy Kochi corporation
9 Pambakkuda 141701 Anchalpetty Pampakkuda
10 Parakkadavu 137519 Kurumassery Parakkadavu
11 Paravur 146017 Kaitharam Kottuvally
12 Vadavukode 152199 Kolanchery Poothrikka
13 Vazhakkulam 205403 South Vazhakkulam Vazhakkulam
14 Vypeen 197624 Ayyambilly Kuzhuppilly
15 Vyttila 68561 Maradu Maradu
Table 1.2 Block Panchayats and their headquarters
Fig 1.3 Block Panchayats in Ernakulam District
The District has 15 Block Panchayats, eight
municipalities and one Municipal Corporation. The
names of the Block Panchayats, their head quarters and
Block Panchayat wise distribution of population is
shown in Table 1.2. The Block Panchayats in Ernakulam
District are shown in fig 1.3.
There are 88 Grama Panchayats in the district, the list
of which is given in Annexe 1 and are located in fig 1.4.
District Urbanisation Report - Ernakulam PROFILE OF THE DISTRICT
Department of Town & Country Planning, KeralaDepartment of Town & Country Planning, Kerala
33
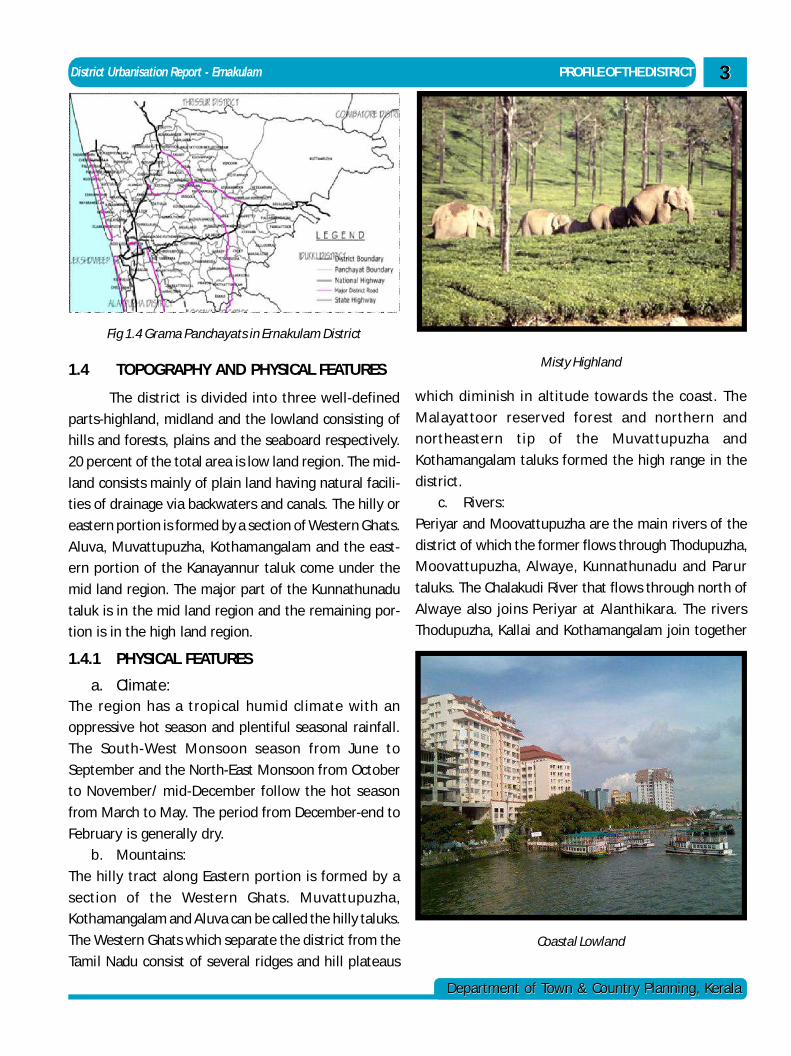
Fig 1.4 Grama Panchayats in Ernakulam District
1.4 TOPOGRAPHY AND PHYSICAL FEATURES
The district is divided into three well-defined
parts-highland, midland and the lowland consisting of
hills and forests, plains and the seaboard respectively.
20 percent of the total area is low land region. The mid-
land consists mainly of plain land having natural facili-
ties of drainage via backwaters and canals. The hilly or
eastern portion is formed by a section of Western Ghats.
Aluva, Muvattupuzha, Kothamangalam and the east-
ern portion of the Kanayannur taluk come under the
mid land region. The major part of the Kunnathunadu
taluk is in the mid land region and the remaining por-
tion is in the high land region.
1.4.1 PHYSICAL FEATURES
a. Climate:The region has a tropical humid climate with an
oppressive hot season and plentiful seasonal rainfall.
The South-West Monsoon season from June to
September and the North-East Monsoon from October
to November/ mid-December follow the hot season
from March to May. The period from December-end to
February is generally dry.
b. Mountains:
The hilly tract along Eastern portion is formed by a
section of the Western Ghats. Muvattupuzha,
Kothamangalam and Aluva can be called the hilly taluks.
The Western Ghats which separate the district from the
Tamil Nadu consist of several ridges and hill plateaus
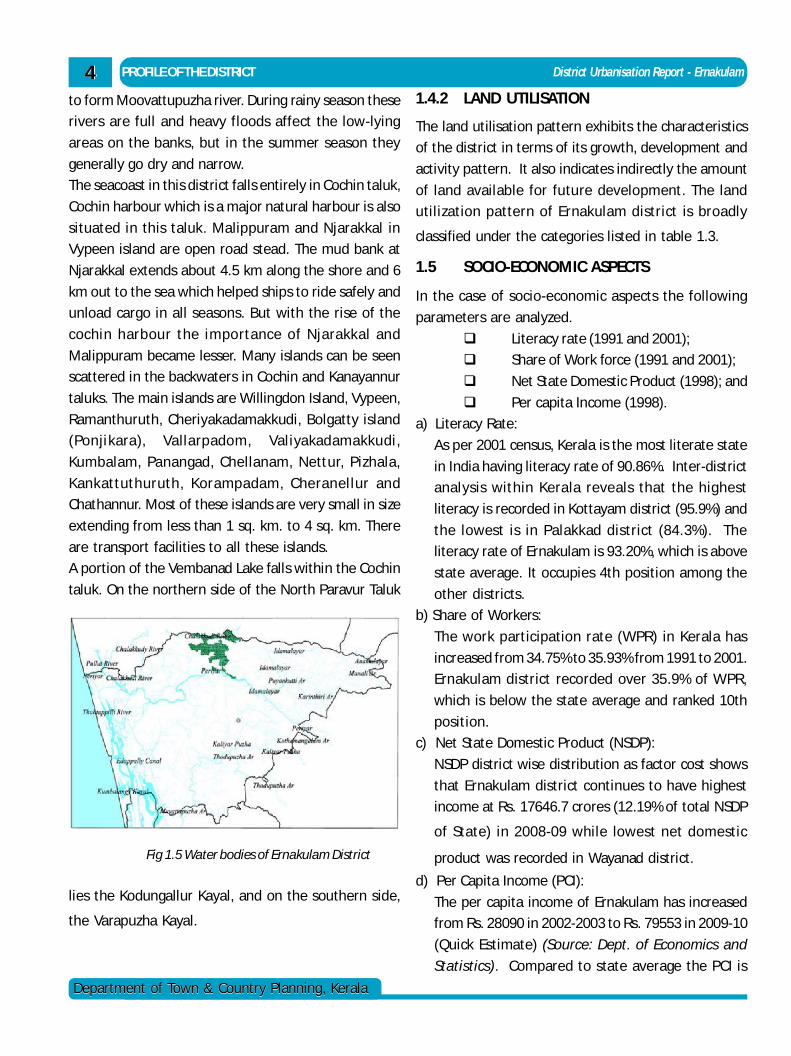
which diminish in altitude towards the coast. The
Malayattoor reserved forest and northern and
northeastern tip of the Muvattupuzha and
Kothamangalam taluks formed the high range in the
district.
c. Rivers:
Periyar and Moovattupuzha are the main rivers of the
district of which the former flows through Thodupuzha,
Moovattupuzha, Alwaye, Kunnathunadu and Parur
taluks. The Chalakudi River that flows through north of
Alwaye also joins Periyar at Alanthikara. The rivers
Thodupuzha, Kallai and Kothamangalam join together
Misty Highland
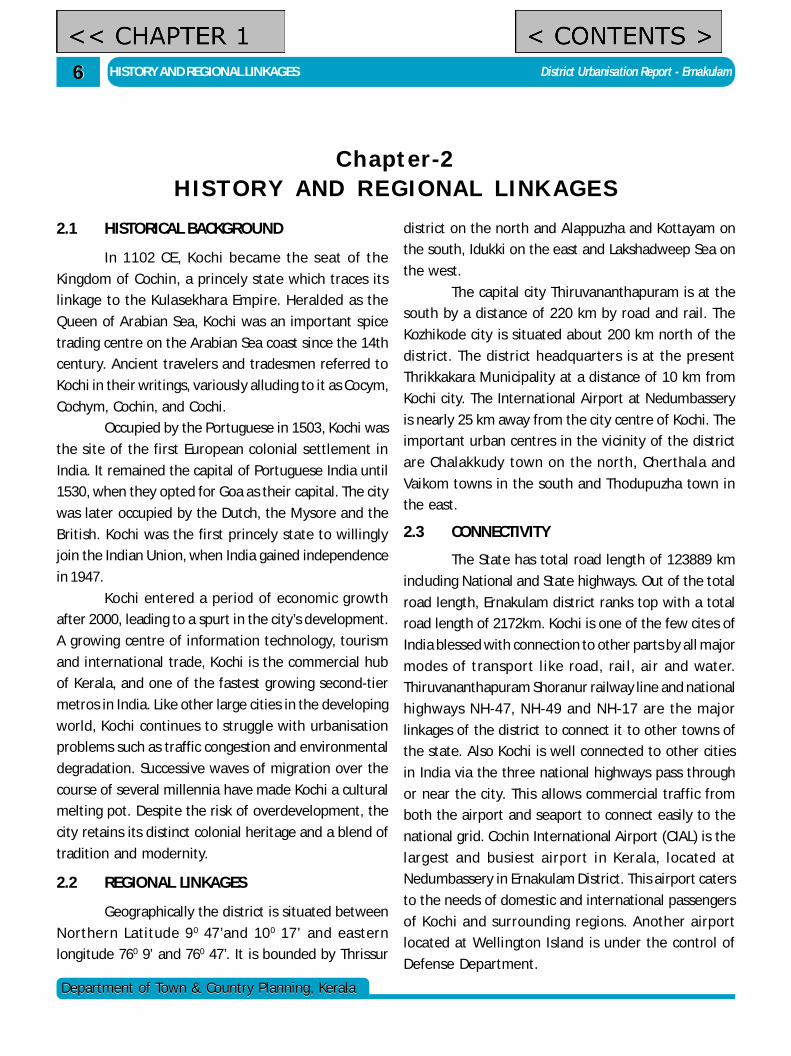
Coastal Lowland
PROFILE OF THE DISTRICT District Urbanisation Report - Ernakulam44
Department of Town & Country Planning, KeralaDepartment of Town & Country Planning, Kerala
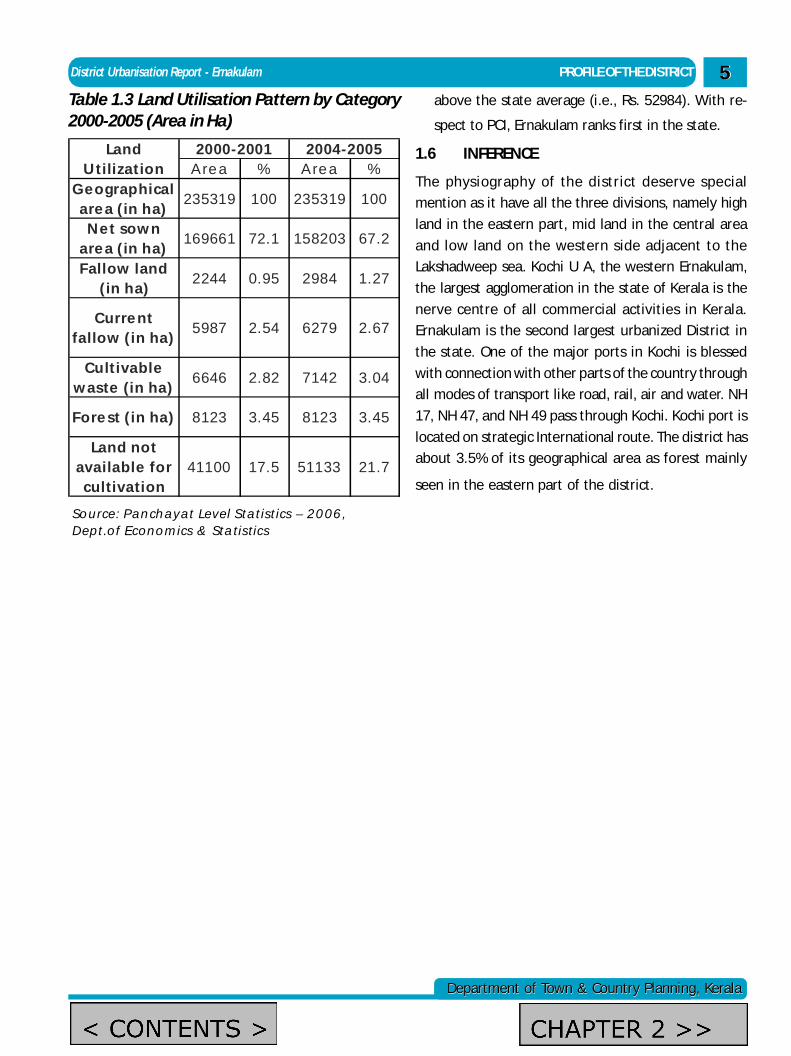
Fig 1.5 Water bodies of Ernakulam District
to form Moovattupuzha river. During rainy season these
rivers are full and heavy floods affect the low-lying
areas on the banks, but in the summer season they
generally go dry and narrow.
The seacoast in this district falls entirely in Cochin taluk,
Cochin harbour which is a major natural harbour is also
situated in this taluk. Malippuram and Njarakkal in
Vypeen island are open road stead. The mud bank at
Njarakkal extends about 4.5 km along the shore and 6
km out to the sea which helped ships to ride safely and
unload cargo in all seasons. But with the rise of the
cochin harbour the importance of Njarakkal and
Malippuram became lesser. Many islands can be seen
scattered in the backwaters in Cochin and Kanayannur
taluks. The main islands are Willingdon Island, Vypeen,
Ramanthuruth, Cheriyakadamakkudi, Bolgatty island
(Ponjikara), Vallarpadom, Valiyakadamakkudi,
Kumbalam, Panangad, Chellanam, Nettur, Pizhala,
Kankattuthuruth, Korampadam, Cheranellur and
Chathannur. Most of these islands are very small in size
extending from less than 1 sq. km. to 4 sq. km. There
are transport facilities to all these islands.
A portion of the Vembanad Lake falls within the Cochin
taluk. On the northern side of the North Paravur Taluk
lies the Kodungallur Kayal, and on the southern side,
the Varapuzha Kayal.
1.4.2 LAND UTILISATION
The land utilisation pattern exhibits the characteristics
of the district in terms of its growth, development and
activity pattern. It also indicates indirectly the amount
of land available for future development. The land
utilization pattern of Ernakulam district is broadly
classified under the categories listed in table 1.3.
1.5 SOCIO-ECONOMIC ASPECTS
In the case of socio-economic aspects the following
parameters are analyzed.
Literacy rate (1991 and 2001);
Share of Work force (1991 and 2001);
Net State Domestic Product (1998); and
Per capita Income (1998).
a) Literacy Rate:
As per 2001 census, Kerala is the most literate state
in India having literacy rate of 90.86%. Inter-district
analysis within Kerala reveals that the highest
literacy is recorded in Kottayam district (95.9%) and
the lowest is in Palakkad district (84.3%). The
literacy rate of Ernakulam is 93.20%, which is above
state average. It occupies 4th position among the
other districts.
b) Share of Workers:
The work participation rate (WPR) in Kerala has
increased from 34.75% to 35.93% from 1991 to 2001.
Ernakulam district recorded over 35.9% of WPR,
which is below the state average and ranked 10th
position.
c) Net State Domestic Product (NSDP):
NSDP district wise distribution as factor cost shows
that Ernakulam district continues to have highest
income at Rs. 17646.7 crores (12.19% of total NSDP
of State) in 2008-09 while lowest net domestic
product was recorded in Wayanad district.
d) Per Capita Income (PCI):
The per capita income of Ernakulam has increased
from Rs. 28090 in 2002-2003 to Rs. 79553 in 2009-10
(Quick Estimate) (Source: Dept. of Economics and
Statistics). Compared to state average the PCI is
District Urbanisation Report - Ernakulam PROFILE OF THE DISTRICT
Department of Town & Country Planning, KeralaDepartment of Town & Country Planning, Kerala
555
Department of Town & Country Planning, Kerala
A re a % A re a %G e o grap h ica l
are a ( in h a)235319 100 235319 100
N e t so w n are a ( in h a)
169661 72.1 158203 67.2
F al lo w lan d ( in h a)
2244 0.95 2984 1.27
C u rre n t fa l lo w ( in h a)
5987 2.54 6279 2.67
C u ltivab le w as te ( in h a)
6646 2.82 7142 3.04
F o re st ( in h a) 8123 3.45 8123 3.45
Lan d n o t avai lab le fo r
cu ltivatio n41100 17.5 51133 21.7
Lan d U ti lizatio n
2000-2001 2004-2005
S o u rce : P a n ch a y a t Le v e l S ta tistics – 2 0 0 6 , D e p t.o f Eco n o m ics & S ta tis tics
Table 1.3 Land Utilisation Pattern by Category2000-2005 (Area in Ha)
above the state average (i.e., Rs. 52984). With re-
spect to PCI, Ernakulam ranks first in the state.
1.6 INFERENCE
The physiography of the district deserve special
mention as it have all the three divisions, namely high
land in the eastern part, mid land in the central area
and low land on the western side adjacent to the
Lakshadweep sea. Kochi U A, the western Ernakulam,
the largest agglomeration in the state of Kerala is the
nerve centre of all commercial activities in Kerala.
Ernakulam is the second largest urbanized District in
the state. One of the major ports in Kochi is blessed
with connection with other parts of the country through
all modes of transport like road, rail, air and water. NH
17, NH 47, and NH 49 pass through Kochi. Kochi port is
located on strategic International route. The district has
about 3.5% of its geographical area as forest mainly
seen in the eastern part of the district.
HISTORY AND REGIONAL LINKAGES District Urbanisation Report - Ernakulam66
Department of Town & Country Planning, KeralaDepartment of Town & Country Planning, Kerala
2.1 HISTORICAL BACKGROUND
In 1102 CE, Kochi became the seat of the
Kingdom of Cochin, a princely state which traces its
linkage to the Kulasekhara Empire. Heralded as the
Queen of Arabian Sea, Kochi was an important spice
trading centre on the Arabian Sea coast since the 14th
century. Ancient travelers and tradesmen referred to
Kochi in their writings, variously alluding to it as Cocym,
Cochym, Cochin, and Cochi.
Occupied by the Portuguese in 1503, Kochi was
the site of the first European colonial settlement in
India. It remained the capital of Portuguese India until
1530, when they opted for Goa as their capital. The city
was later occupied by the Dutch, the Mysore and the
British. Kochi was the first princely state to willingly
join the Indian Union, when India gained independence
in 1947.
Kochi entered a period of economic growth
after 2000, leading to a spurt in the city’s development.
A growing centre of information technology, tourism
and international trade, Kochi is the commercial hub
of Kerala, and one of the fastest growing second-tier
metros in India. Like other large cities in the developing
world, Kochi continues to struggle with urbanisation
problems such as traffic congestion and environmental
degradation. Successive waves of migration over the
course of several millennia have made Kochi a cultural
melting pot. Despite the risk of overdevelopment, the
city retains its distinct colonial heritage and a blend of
tradition and modernity.
2.2 REGIONAL LINKAGES
Geographically the district is situated between
Northern Latitude 90 47’and 100 17’ and eastern
longitude 760 9’ and 760 47’. It is bounded by Thrissur
district on the north and Alappuzha and Kottayam on
the south, Idukki on the east and Lakshadweep Sea on
the west.
The capital city Thiruvananthapuram is at the
south by a distance of 220 km by road and rail. The
Kozhikode city is situated about 200 km north of the
district. The district headquarters is at the present
Thrikkakara Municipality at a distance of 10 km from
Kochi city. The International Airport at Nedumbassery
is nearly 25 km away from the city centre of Kochi. The
important urban centres in the vicinity of the district
are Chalakkudy town on the north, Cherthala and
Vaikom towns in the south and Thodupuzha town in
the east.
2.3 CONNECTIVITY
The State has total road length of 123889 km
including National and State highways. Out of the total
road length, Ernakulam district ranks top with a total
road length of 2172km. Kochi is one of the few cites of
India blessed with connection to other parts by all major
modes of transport l ike road, rai l, air and water.
Thiruvananthapuram Shoranur railway line and national
highways NH-47, NH-49 and NH-17 are the major
linkages of the district to connect it to other towns of
the state. Also Kochi is well connected to other cities
in India via the three national highways pass through
or near the city. This allows commercial traffic from
both the airport and seaport to connect easily to the
national grid. Cochin International Airport (CIAL) is the
largest and busiest airport in Kerala, located at
Nedumbassery in Ernakulam District. This airport caters
to the needs of domestic and international passengers
of Kochi and surrounding regions. Another airport
located at Wellington Island is under the control of
Defense Department.
Chapter-2HISTORY AND REGIONAL LINKAGES
District Urbanisation Report - Ernakulam HISTORY AND REGIONAL LINKAGES
Department of Town & Country Planning, KeralaDepartment of Town & Country Planning, Kerala
77
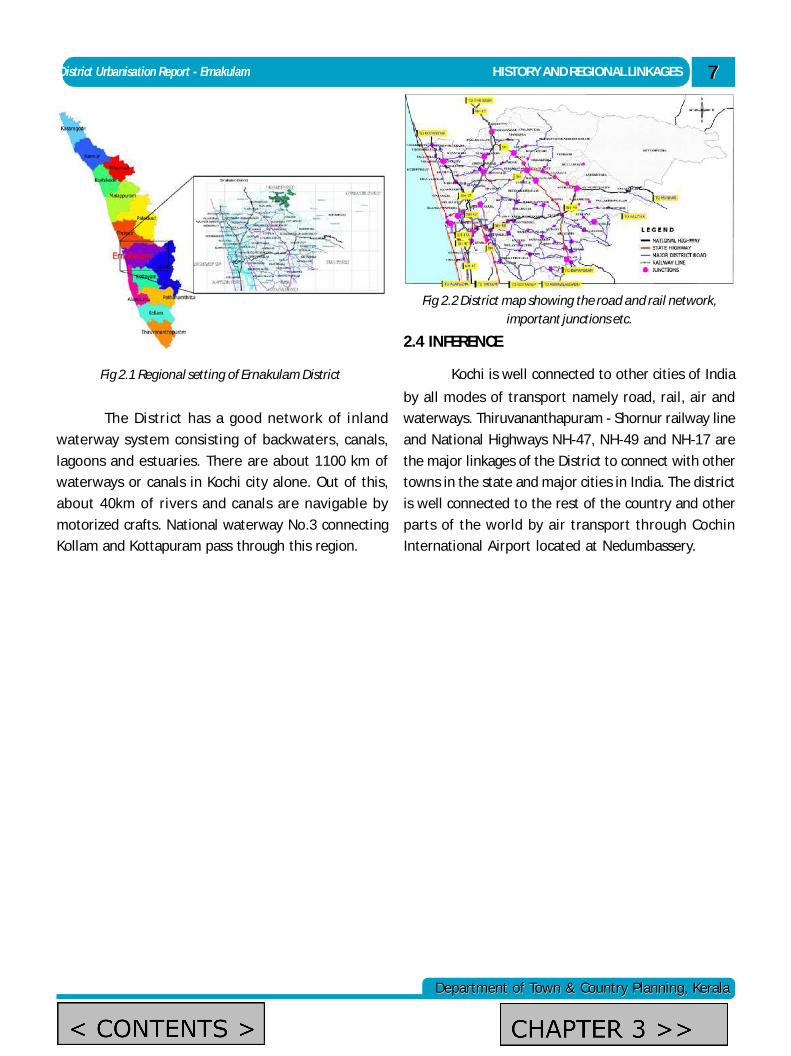
Fig 2.1 Regional setting of Ernakulam District
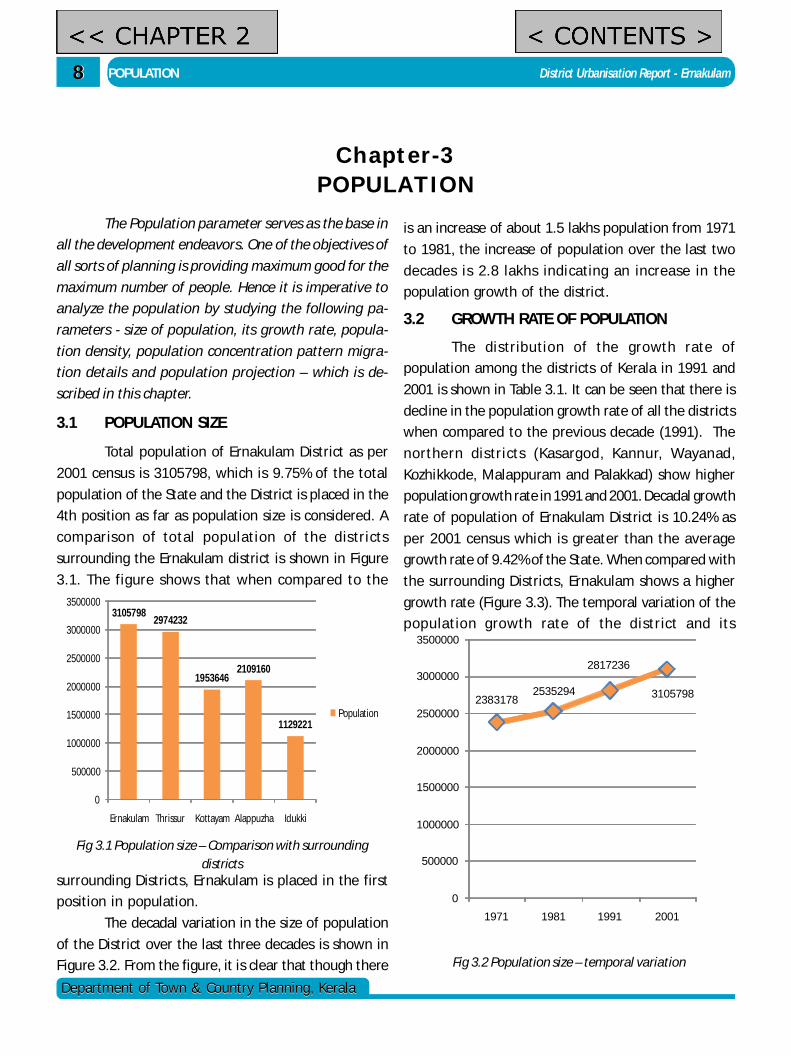
Fig 2.2 District map showing the road and rail network,important junctions etc.
The District has a good network of inland
waterway system consisting of backwaters, canals,
lagoons and estuaries. There are about 1100 km of
waterways or canals in Kochi city alone. Out of this,
about 40km of rivers and canals are navigable by
motorized crafts. National waterway No.3 connecting
Kollam and Kottapuram pass through this region.
2.4 INFERENCE
Kochi is well connected to other cities of India
by all modes of transport namely road, rail, air and
waterways. Thiruvananthapuram - Shornur railway line
and National Highways NH-47, NH-49 and NH-17 are
the major linkages of the District to connect with other
towns in the state and major cities in India. The district
is well connected to the rest of the country and other
parts of the world by air transport through Cochin
International Airport located at Nedumbassery.
88
Department of Town & Country Planning, KeralaDepartment of Town & Country Planning, Kerala
POPULATION District Urbanisation Report - Ernakulam
Chapter-3POPULATION
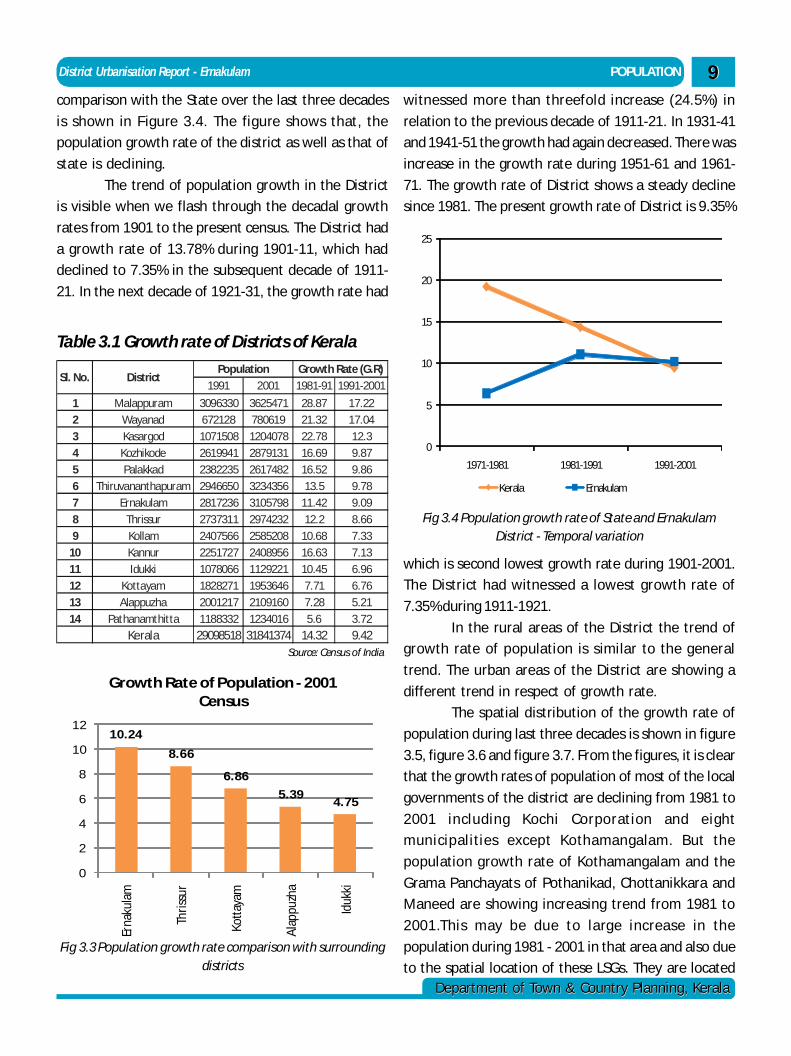
Fig 3.1 Population size – Comparison with surroundingdistricts
The Population parameter serves as the base in
all the development endeavors. One of the objectives of
all sorts of planning is providing maximum good for the
maximum number of people. Hence it is imperative to
analyze the population by studying the following pa-
rameters - size of population, its growth rate, popula-
tion density, population concentration pattern migra-
tion details and population projection – which is de-
scribed in this chapter.
3.1 POPULATION SIZE
Total population of Ernakulam District as per
2001 census is 3105798, which is 9.75% of the total
population of the State and the District is placed in the
4th position as far as population size is considered. A
comparison of total population of the districts
surrounding the Ernakulam district is shown in Figure
3.1. The figure shows that when compared to the
31057982974232
19536462109160
1129221
0
500000
1000000
1500000
2000000
2500000
3000000
3500000
Ernakulam Thrissur Kottayam Alappuzha Idukki
Population
surrounding Districts, Ernakulam is placed in the first
position in population.
The decadal variation in the size of population
of the District over the last three decades is shown in
Figure 3.2. From the figure, it is clear that though there
is an increase of about 1.5 lakhs population from 1971
to 1981, the increase of population over the last two
decades is 2.8 lakhs indicating an increase in the
population growth of the district.
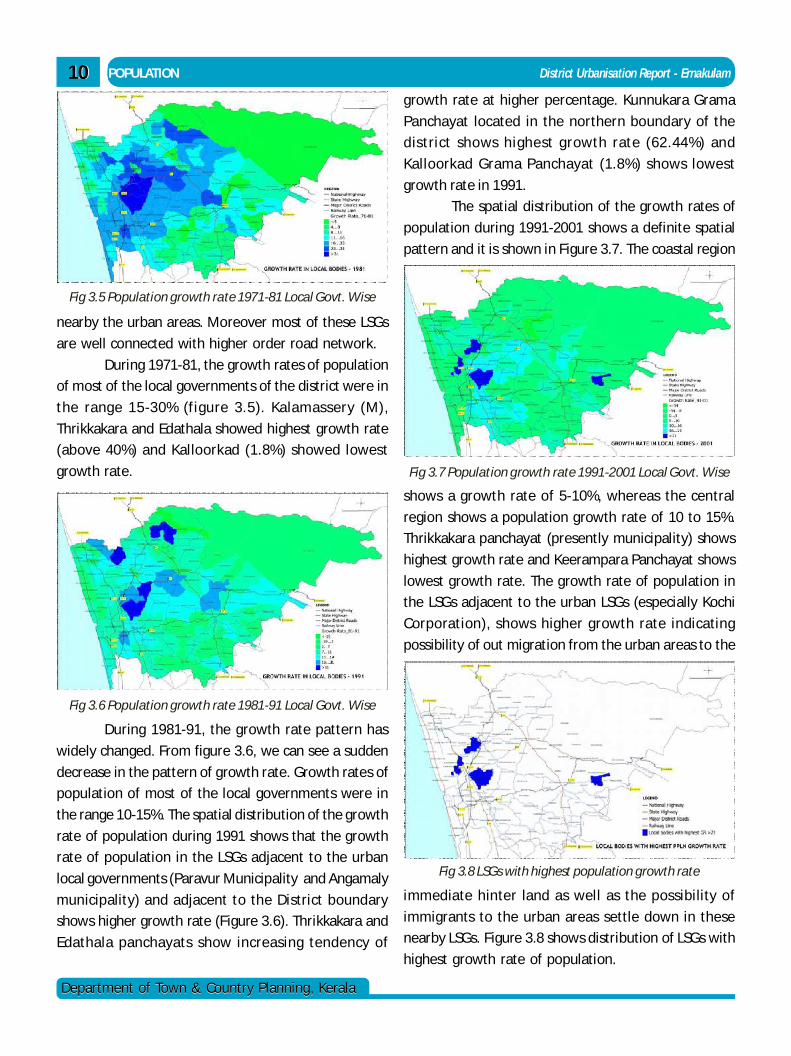
3.2 GROWTH RATE OF POPULATION
The distribution of the growth rate of
population among the districts of Kerala in 1991 and
2001 is shown in Table 3.1. It can be seen that there is
decline in the population growth rate of all the districts
when compared to the previous decade (1991). The
northern districts (Kasargod, Kannur, Wayanad,
Kozhikkode, Malappuram and Palakkad) show higher
population growth rate in 1991 and 2001. Decadal growth
rate of population of Ernakulam District is 10.24% as
per 2001 census which is greater than the average
growth rate of 9.42% of the State. When compared with
the surrounding Districts, Ernakulam shows a higher
growth rate (Figure 3.3). The temporal variation of the
population growth rate of the district and its
Fig 3.2 Population size – temporal variation
23831782535294
2817236
3105798
0
500000
1000000
1500000
2000000
2500000
3000000
3500000
1971 1981 1991 2001
District Urbanisation Report - Ernakulam POPULATION
Department of Town & Country Planning, KeralaDepartment of Town & Country Planning, Kerala
99comparison with the State over the last three decades
is shown in Figure 3.4. The figure shows that, the
population growth rate of the district as well as that of
state is declining.
The trend of population growth in the District
is visible when we flash through the decadal growth
rates from 1901 to the present census. The District had
a growth rate of 13.78% during 1901-11, which had
declined to 7.35% in the subsequent decade of 1911-
21. In the next decade of 1921-31, the growth rate had
1991 2001 1981-91 1991-2001
1 Malappuram 3096330 3625471 28.87 17.222 Wayanad 672128 780619 21.32 17.043 Kasargod 1071508 1204078 22.78 12.34 Kozhikode 2619941 2879131 16.69 9.875 Palakkad 2382235 2617482 16.52 9.866 Thiruvananthapuram 2946650 3234356 13.5 9.787 Ernakulam 2817236 3105798 11.42 9.098 Thrissur 2737311 2974232 12.2 8.669 Kollam 2407566 2585208 10.68 7.33
10 Kannur 2251727 2408956 16.63 7.1311 Idukki 1078066 1129221 10.45 6.9612 Kottayam 1828271 1953646 7.71 6.7613 Alappuzha 2001217 2109160 7.28 5.2114 Pathanamthitta 1188332 1234016 5.6 3.72
Kerala 29098518 31841374 14.32 9.42
Sl. No. DistrictPopulation Growth Rate (G.R)
Source: Census of India
Table 3.1 Growth rate of Districts of Kerala
10.24
8.66
6.86
5.394.75
0
2
4
6
8
10
12
Erna
kula
m
Thris
sur
Kotta
yam
Alap
puzh
a
Iduk
ki
Growth Rate of Population - 2001 Census
Fig 3.3 Population growth rate comparison with surroundingdistricts
witnessed more than threefold increase (24.5%) in
relation to the previous decade of 1911-21. In 1931-41
and 1941-51 the growth had again decreased. There was
increase in the growth rate during 1951-61 and 1961-
71. The growth rate of District shows a steady decline
since 1981. The present growth rate of District is 9.35%
0
5
10
15
20
25
1971-1981 1981-1991 1991-2001
Kerala Ernakulam
Fig 3.4 Population growth rate of State and ErnakulamDistrict - Temporal variation
which is second lowest growth rate during 1901-2001.
The District had witnessed a lowest growth rate of
7.35% during 1911-1921.
In the rural areas of the District the trend of
growth rate of population is similar to the general
trend. The urban areas of the District are showing a
different trend in respect of growth rate.
The spatial distribution of the growth rate of
population during last three decades is shown in figure
3.5, figure 3.6 and figure 3.7. From the figures, it is clear
that the growth rates of population of most of the local
governments of the district are declining from 1981 to
2001 including Kochi Corporation and eight
municipalities except Kothamangalam. But the
population growth rate of Kothamangalam and the
Grama Panchayats of Pothanikad, Chottanikkara and
Maneed are showing increasing trend from 1981 to
2001.This may be due to large increase in the
population during 1981 - 2001 in that area and also due
to the spatial location of these LSGs. They are located
1010
Department of Town & Country Planning, KeralaDepartment of Town & Country Planning, Kerala
POPULATION District Urbanisation Report - Ernakulam
nearby the urban areas. Moreover most of these LSGs
are well connected with higher order road network.
During 1971-81, the growth rates of population
of most of the local governments of the district were in
the range 15-30% (figure 3.5). Kalamassery (M),
Thrikkakara and Edathala showed highest growth rate
(above 40%) and Kalloorkad (1.8%) showed lowest
growth rate.
Fig 3.5 Population growth rate 1971-81 Local Govt. Wise
Fig 3.6 Population growth rate 1981-91 Local Govt. Wise
During 1981-91, the growth rate pattern has
widely changed. From figure 3.6, we can see a sudden
decrease in the pattern of growth rate. Growth rates of
population of most of the local governments were in
the range 10-15%. The spatial distribution of the growth
rate of population during 1991 shows that the growth
rate of population in the LSGs adjacent to the urban
local governments (Paravur Municipality and Angamaly
municipality) and adjacent to the District boundary
shows higher growth rate (Figure 3.6). Thrikkakara and
Edathala panchayats show increasing tendency of
Fig 3.7 Population growth rate 1991-2001 Local Govt. Wise
growth rate at higher percentage. Kunnukara Grama
Panchayat located in the northern boundary of the
district shows highest growth rate (62.44%) and
Kalloorkad Grama Panchayat (1.8%) shows lowest
growth rate in 1991.
The spatial distribution of the growth rates of
population during 1991-2001 shows a definite spatial
pattern and it is shown in Figure 3.7. The coastal region
shows a growth rate of 5-10%, whereas the central
region shows a population growth rate of 10 to 15%.
Thrikkakara panchayat (presently municipality) shows
highest growth rate and Keerampara Panchayat shows
lowest growth rate. The growth rate of population in
the LSGs adjacent to the urban LSGs (especially Kochi
Corporation), shows higher growth rate indicating
possibility of out migration from the urban areas to the
Fig 3.8 LSGs with highest population growth rate
immediate hinter land as well as the possibility of
immigrants to the urban areas settle down in these
nearby LSGs. Figure 3.8 shows distribution of LSGs with
highest growth rate of population.
District Urbanisation Report - Ernakulam POPULATION
Department of Town & Country Planning, KeralaDepartment of Town & Country Planning, Kerala
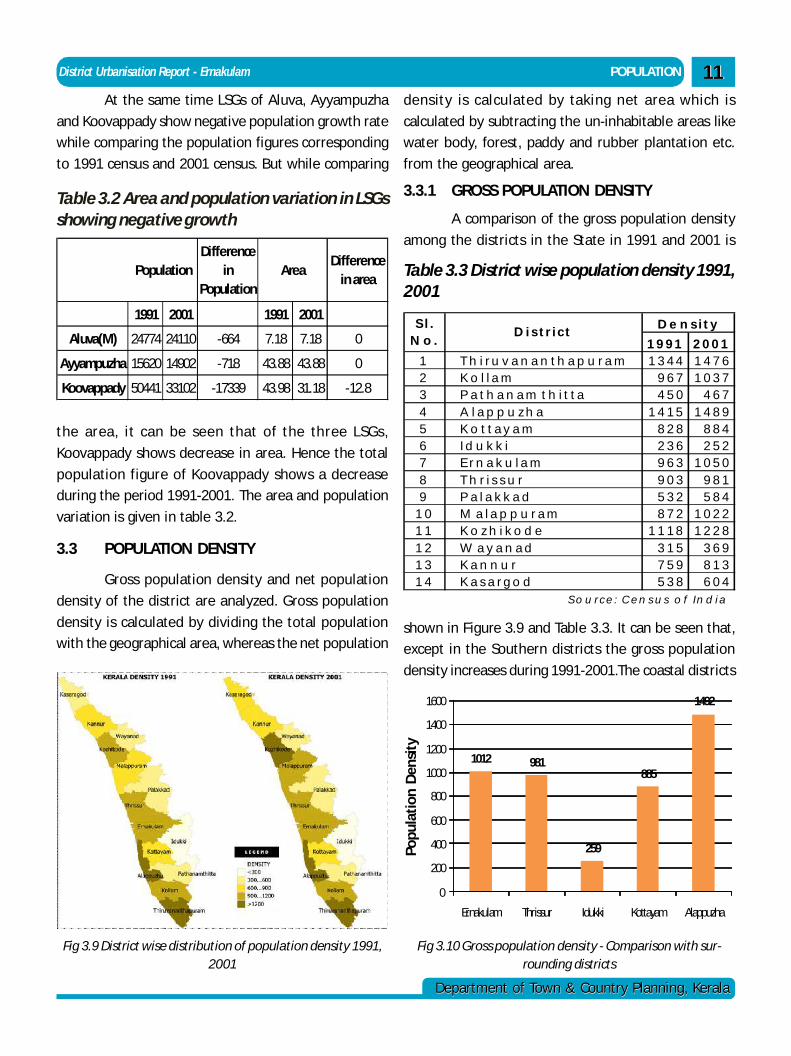
1111At the same time LSGs of Aluva, Ayyampuzha
and Koovappady show negative population growth rate
while comparing the population figures corresponding
to 1991 census and 2001 census. But while comparing
Difference in
Population
Difference in area
1991 2001 1991 2001
Aluva(M) 24774 24110 -664 7.18 7.18 0
Ayyampuzha 15620 14902 -718 43.88 43.88 0
Koovappady 50441 33102 -17339 43.98 31.18 -12.8
Population Area
Table 3.2 Area and population variation in LSGsshowing negative growth
the area, it can be seen that of the three LSGs,
Koovappady shows decrease in area. Hence the total
population figure of Koovappady shows a decrease
during the period 1991-2001. The area and population
variation is given in table 3.2.
3.3 POPULATION DENSITY
Gross population density and net population
density of the district are analyzed. Gross population
density is calculated by dividing the total population
with the geographical area, whereas the net population
Fig 3.9 District wise distribution of population density 1991,2001
density is calculated by taking net area which is
calculated by subtracting the un-inhabitable areas like
water body, forest, paddy and rubber plantation etc.
from the geographical area.
3.3.1 GROSS POPULATION DENSITY
A comparison of the gross population density
among the districts in the State in 1991 and 2001 is
Table 3.3 District wise population density 1991,2001
1 9 9 1 2 0 0 11 T h i r u v a n a n t h a p u r a m 1 3 4 4 1 4 7 62 K o l l a m 9 6 7 1 0 3 73 P a t h a n a m t h i t t a 4 5 0 4 6 74 A l a p p u z h a 1 4 1 5 1 4 8 95 K o t t a y a m 8 2 8 8 8 46 I d u k k i 2 3 6 2 5 27 E r n a k u l a m 9 6 3 1 0 5 08 T h r i s s u r 9 0 3 9 8 19 P a l a k k a d 5 3 2 5 8 4
1 0 M a l a p p u r a m 8 7 2 1 0 2 21 1 K o z h i k o d e 1 1 1 8 1 2 2 81 2 W a y a n a d 3 1 5 3 6 91 3 K a n n u r 7 5 9 8 1 31 4 K a s a r g o d 5 3 8 6 0 4
S o u r c e : C e n s u s o f In d i a
D e n s i t yS l . N o .
D i s t r i c t
1012 981
259
885
1492
0
200
400
600
800
1000
1200
1400
1600
Ernakulam Thrissur Idukki Kottayam Alappuzha
Fig 3.10 Gross population density - Comparison with sur-rounding districts
shown in Figure 3.9 and Table 3.3. It can be seen that,
except in the Southern districts the gross population
density increases during 1991-2001.The coastal districts
Popu
lati
on D
ensi
ty
1212
Department of Town & Country Planning, KeralaDepartment of Town & Country Planning, Kerala
POPULATION District Urbanisation Report - Ernakulam
show higher gross population density in 1991 as well as
in 2001. The gross population density in the three
southern districts, Thiruvananthapuram, Kollam and
Alappuzha are the maximum.
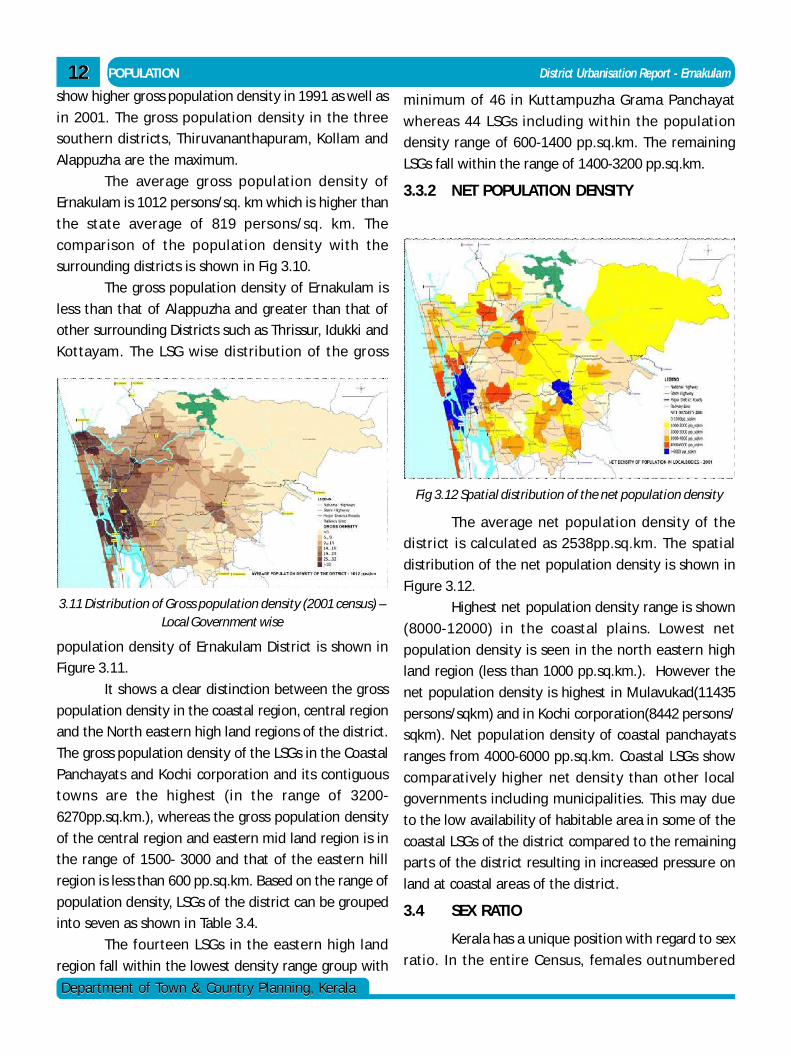
The average gross population density of
Ernakulam is 1012 persons/sq. km which is higher than
the state average of 819 persons/sq. km. The
comparison of the population density with the
surrounding districts is shown in Fig 3.10.
The gross population density of Ernakulam is
less than that of Alappuzha and greater than that of
other surrounding Districts such as Thrissur, Idukki and
Kottayam. The LSG wise distribution of the gross
3.11 Distribution of Gross population density (2001 census) –Local Government wise
population density of Ernakulam District is shown in
Figure 3.11.
It shows a clear distinction between the gross
population density in the coastal region, central region
and the North eastern high land regions of the district.
The gross population density of the LSGs in the Coastal
Panchayats and Kochi corporation and its contiguous
towns are the highest (in the range of 3200-
6270pp.sq.km.), whereas the gross population density
of the central region and eastern mid land region is in
the range of 1500- 3000 and that of the eastern hill
region is less than 600 pp.sq.km. Based on the range of
population density, LSGs of the district can be grouped
into seven as shown in Table 3.4.
The fourteen LSGs in the eastern high land
region fall within the lowest density range group with
Fig 3.12 Spatial distribution of the net population density
minimum of 46 in Kuttampuzha Grama Panchayat
whereas 44 LSGs including within the population
density range of 600-1400 pp.sq.km. The remaining
LSGs fall within the range of 1400-3200 pp.sq.km.
3.3.2 NET POPULATION DENSITY
The average net population density of the
district is calculated as 2538pp.sq.km. The spatial
distribution of the net population density is shown in
Figure 3.12.
Highest net population density range is shown
(8000-12000) in the coastal plains. Lowest net
population density is seen in the north eastern high
land region (less than 1000 pp.sq.km.). However the
net population density is highest in Mulavukad(11435
persons/sqkm) and in Kochi corporation(8442 persons/
sqkm). Net population density of coastal panchayats
ranges from 4000-6000 pp.sq.km. Coastal LSGs show
comparatively higher net density than other local
governments including municipalities. This may due
to the low availability of habitable area in some of the
coastal LSGs of the district compared to the remaining
parts of the district resulting in increased pressure on
land at coastal areas of the district.
3.4 SEX RATIO
Kerala has a unique position with regard to sex
ratio. In the entire Census, females outnumbered
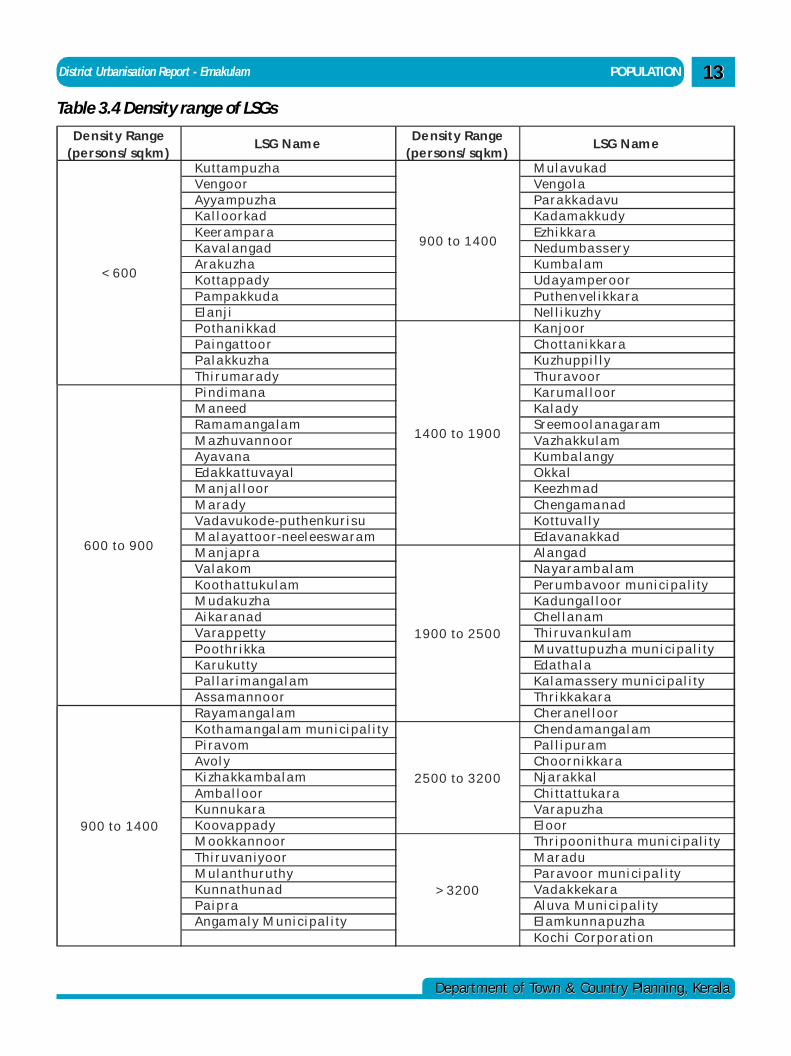
District Urbanisation Report - Ernakulam POPULATION
Department of Town & Country Planning, KeralaDepartment of Town & Country Planning, Kerala
1313
De n sit y Range (pe rson s/ sq km )
L SG N am eDe nsity Ran ge
(pe rso ns/ sq km )L SG N am e
K utta mpuzha M ul a vu ka dVengoor Vengol aAyya mpuzha P a r a kka da vuK a l l oor ka d K a da m a kkudyK eer a m pa r a Ezh i kka raK a va l a n ga d Nedum ba s s er yAra kuzha K umba l a mK otta ppa dy Ud a ya m per oorP a mpa kkud a P uthen vel i kka r aEl a n j i Nel l i kuzhyP otha n i kka d K a nj oorP a i nga ttoo r Chotta n i kka r aP a l a kkuzha K uzhuppi l l yTh i r uma r a dy Thur a voorP i nd i ma na K a r uma l l oorM a need K a l a dyR a ma m a nga l a m Sr eemool a na ga r a mM a zh uva nn oor Va zha kku l a mAya va na K umba l a ngyEda kka ttuva ya l O kka lM a nj a l l oor K eezhm a dM a ra dy Chenga ma na dVa da vukode-puthenkur i s u K ottuva l l yM a l a ya ttoo r-neel ees w a r a m Eda va na kka dM a nj a pr a Al a nga dVa l a kom Na ya r a mb a l a mK ootha ttuku l a m P er umb a voor m uni c i pa l i tyM uda ku zha K a dunga l l oorAi ka r a na d Chel l a n a mVa ra ppetty Th i r uva nku l a mP oothr i kka M uva ttup uzh a mun i c i pa l i tyK a ru kutty Eda tha l aP a l l a r i m a nga l a m K a l a ma s s ery mu ni c i pa l i tyAs s a ma nno or Thr i kka ka r aR a ya m a nga l a m Cher a nel l oorK otha ma nga l a m mun i c i pa l i ty Chend a ma nga l a mP i ra vom P a l l i pur a mAvol y Choor n i kka r aK i zha kka mba l a m Nj a ra kka lAmba l l oor Ch i tta ttuka raK unnuka ra Va r a puzhaK oova ppa dy El oorM ookka nnoor Thr i poon i thu ra muni c i pa l i tyTh i r uva n i yoor M a r a duM ul a nthur uthy P a r a voor m uni c i pa l i tyK unna thun a d Va da kkeka r aP a i pr a Al uva M uni c i p a l i tyAnga m a l y M uni c i pa l i ty El a mkunna puzha
K oc h i Cor por a ti on
< 6 0 0
9 0 0 to 1 4 0 0
1 4 0 0 to 1 9 0 0
6 0 0 to 9 0 0
1 9 0 0 to 2 5 0 0
9 0 0 to 1 4 0 0
2 5 0 0 to 3 2 0 0
> 3 2 0 0
Table 3.4 Density range of LSGs
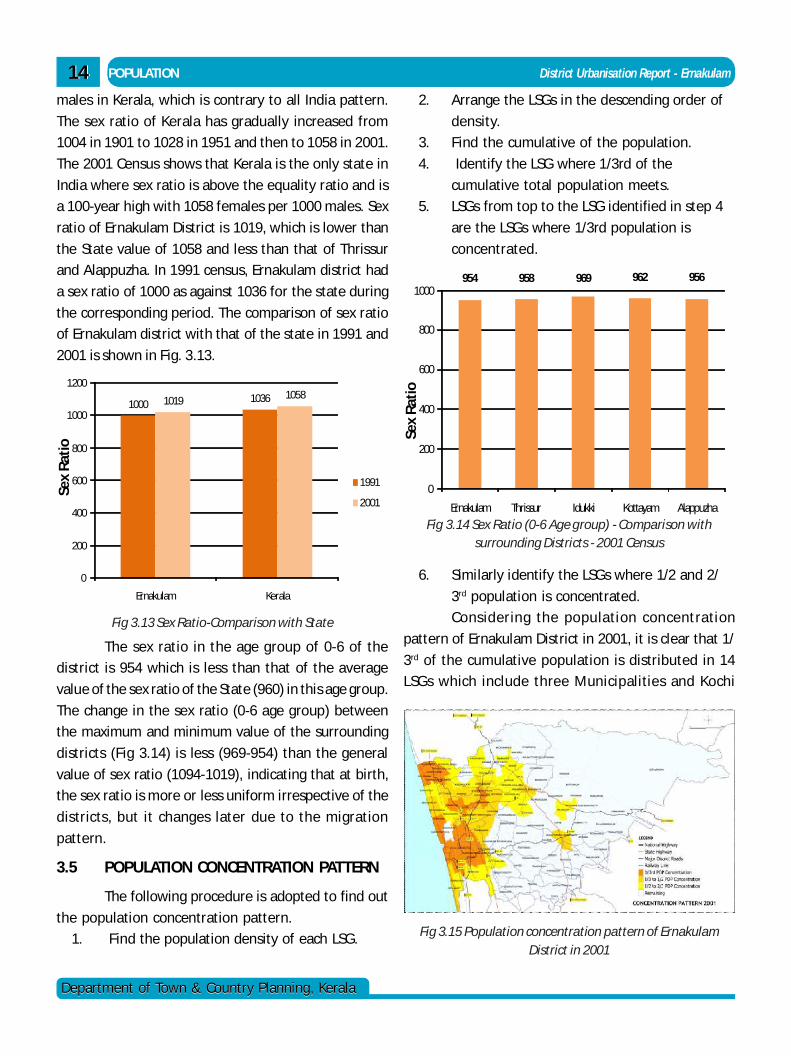
1414
Department of Town & Country Planning, KeralaDepartment of Town & Country Planning, Kerala
POPULATION District Urbanisation Report - Ernakulam
males in Kerala, which is contrary to all India pattern.
The sex ratio of Kerala has gradually increased from
1004 in 1901 to 1028 in 1951 and then to 1058 in 2001.
The 2001 Census shows that Kerala is the only state in
India where sex ratio is above the equality ratio and is
a 100-year high with 1058 females per 1000 males. Sex
ratio of Ernakulam District is 1019, which is lower than
the State value of 1058 and less than that of Thrissur
and Alappuzha. In 1991 census, Ernakulam district had
a sex ratio of 1000 as against 1036 for the state during
the corresponding period. The comparison of sex ratio
of Ernakulam district with that of the state in 1991 and
2001 is shown in Fig. 3.13.
954 958 969 962 956
0
200
400
600
800
1000
Ernakulam Thrissur Idukki Kottayam Alappuzha
Fig 3.14 Sex Ratio (0-6 Age group) - Comparison withsurrounding Districts - 2001 Census
Sex
Rati
o
2. Arrange the LSGs in the descending order of
density.
3. Find the cumulative of the population.
4. Identify the LSG where 1/3rd of the
cumulative total population meets.
5. LSGs from top to the LSG identified in step 4
are the LSGs where 1/3rd population is
concentrated.
1000 10361019 1058
0
200
400
600
800
1000
1200
Ernakulam Kerala
1991
2001
Fig 3.13 Sex Ratio-Comparison with State
Sex
Rati
o
The sex ratio in the age group of 0-6 of the
district is 954 which is less than that of the average
value of the sex ratio of the State (960) in this age group.
The change in the sex ratio (0-6 age group) between
the maximum and minimum value of the surrounding
districts (Fig 3.14) is less (969-954) than the general
value of sex ratio (1094-1019), indicating that at birth,
the sex ratio is more or less uniform irrespective of the
districts, but it changes later due to the migration
pattern.
3.5 POPULATION CONCENTRATION PATTERN
The following procedure is adopted to find out
the population concentration pattern.
1. Find the population density of each LSG.
6. Similarly identify the LSGs where 1/2 and 2/
3rd population is concentrated.
Considering the population concentration
pattern of Ernakulam District in 2001, it is clear that 1/
3rd of the cumulative population is distributed in 14
LSGs which include three Municipalities and Kochi
Fig 3.15 Population concentration pattern of ErnakulamDistrict in 2001
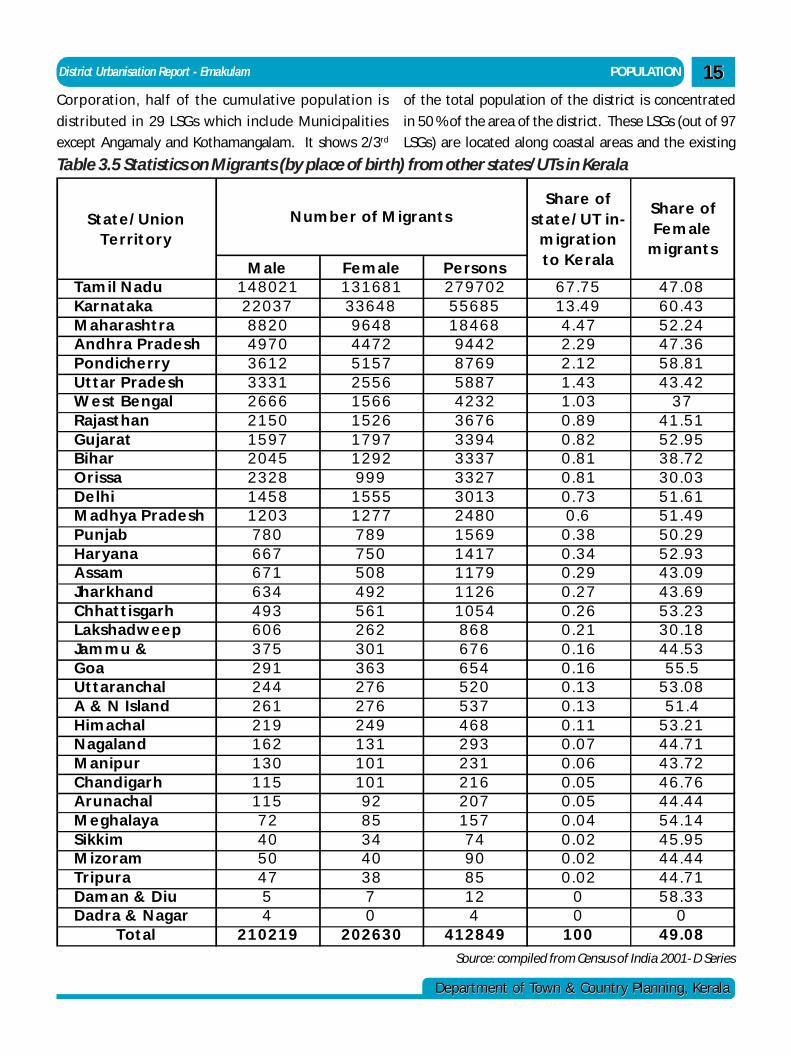
District Urbanisation Report - Ernakulam POPULATION
Department of Town & Country Planning, KeralaDepartment of Town & Country Planning, Kerala
1515Corporation, half of the cumulative population is
distributed in 29 LSGs which include Municipalities
except Angamaly and Kothamangalam. It shows 2/3rd
of the total population of the district is concentrated
in 50 % of the area of the district. These LSGs (out of 97
LSGs) are located along coastal areas and the existing
M ale F e m ale P e rso n sTam il N ad u 1 4 8 0 2 1 1 3 1 6 8 1 2 7 9 7 0 2 6 7 .7 5 4 7 .0 8Kar n ataka 2 2 0 3 7 3 3 6 4 8 5 5 6 8 5 1 3 .4 9 6 0 .4 3M ah ar ash t r a 8 8 2 0 9 6 4 8 1 8 4 6 8 4 .4 7 5 2 .2 4A n d h r a P rad e sh 4 9 7 0 4 4 7 2 9 4 4 2 2 .2 9 4 7 .3 6P o n d ich e rr y 3 6 1 2 5 1 5 7 8 7 6 9 2 .1 2 5 8 .8 1Ut t ar P r ad e sh 3 3 3 1 2 5 5 6 5 8 8 7 1 .4 3 4 3 .4 2W e st Be n gal 2 6 6 6 1 5 6 6 4 2 3 2 1 .0 3 3 7Rajast h an 2 1 5 0 1 5 2 6 3 6 7 6 0 .8 9 4 1 .5 1Gu jarat 1 5 9 7 1 7 9 7 3 3 9 4 0 .8 2 5 2 .9 5Bih ar 2 0 4 5 1 2 9 2 3 3 3 7 0 .8 1 3 8 .7 2O r issa 2 3 2 8 9 9 9 3 3 2 7 0 .8 1 3 0 .0 3De lh i 1 4 5 8 1 5 5 5 3 0 1 3 0 .7 3 5 1 .6 1M ad h ya P r ad e sh 1 2 0 3 1 2 7 7 2 4 8 0 0 .6 5 1 .4 9P u n jab 7 8 0 7 8 9 1 5 6 9 0 .3 8 5 0 .2 9Har yan a 6 6 7 7 5 0 1 4 1 7 0 .3 4 5 2 .9 3A ssam 6 7 1 5 0 8 1 1 7 9 0 .2 9 4 3 .0 9Jh arkh an d 6 3 4 4 9 2 1 1 2 6 0 .2 7 4 3 .6 9C h h at t isgarh 4 9 3 5 6 1 1 0 5 4 0 .2 6 5 3 .2 3L aksh ad w e e p 6 0 6 2 6 2 8 6 8 0 .2 1 3 0 .1 8Jam m u & 3 7 5 3 0 1 6 7 6 0 .1 6 4 4 .5 3Go a 2 9 1 3 6 3 6 5 4 0 .1 6 5 5 .5Ut t aran ch al 2 4 4 2 7 6 5 2 0 0 .1 3 5 3 .0 8A & N Islan d 2 6 1 2 7 6 5 3 7 0 .1 3 5 1 .4Him ach al 2 1 9 2 4 9 4 6 8 0 .1 1 5 3 .2 1N agalan d 1 6 2 1 3 1 2 9 3 0 .0 7 4 4 .7 1M an ip u r 1 3 0 1 0 1 2 3 1 0 .0 6 4 3 .7 2C h an d igar h 1 1 5 1 0 1 2 1 6 0 .0 5 4 6 .7 6A r u n ach al 1 1 5 9 2 2 0 7 0 .0 5 4 4 .4 4M e gh alaya 7 2 8 5 1 5 7 0 .0 4 5 4 .1 4Sikkim 4 0 3 4 7 4 0 .0 2 4 5 .9 5M izo r am 5 0 4 0 9 0 0 .0 2 4 4 .4 4Tr ip u r a 4 7 3 8 8 5 0 .0 2 4 4 .7 1Dam an & D iu 5 7 1 2 0 5 8 .3 3Dad r a & N agar 4 0 4 0 0
To t al 2 1 0 2 1 9 2 0 2 6 3 0 4 1 2 8 4 9 1 0 0 4 9 .0 8
St at e / Un io n Te r r it o r y
N u m b e r o f M igr an t sSh are o f
st at e / UT in -m igr at io n to Ke r ala
Sh ar e o f Fe m ale
m igr an t s
Table 3.5 Statistics on Migrants (by place of birth) from other states/UTs in Kerala
Source: compiled from Census of India 2001- D Series
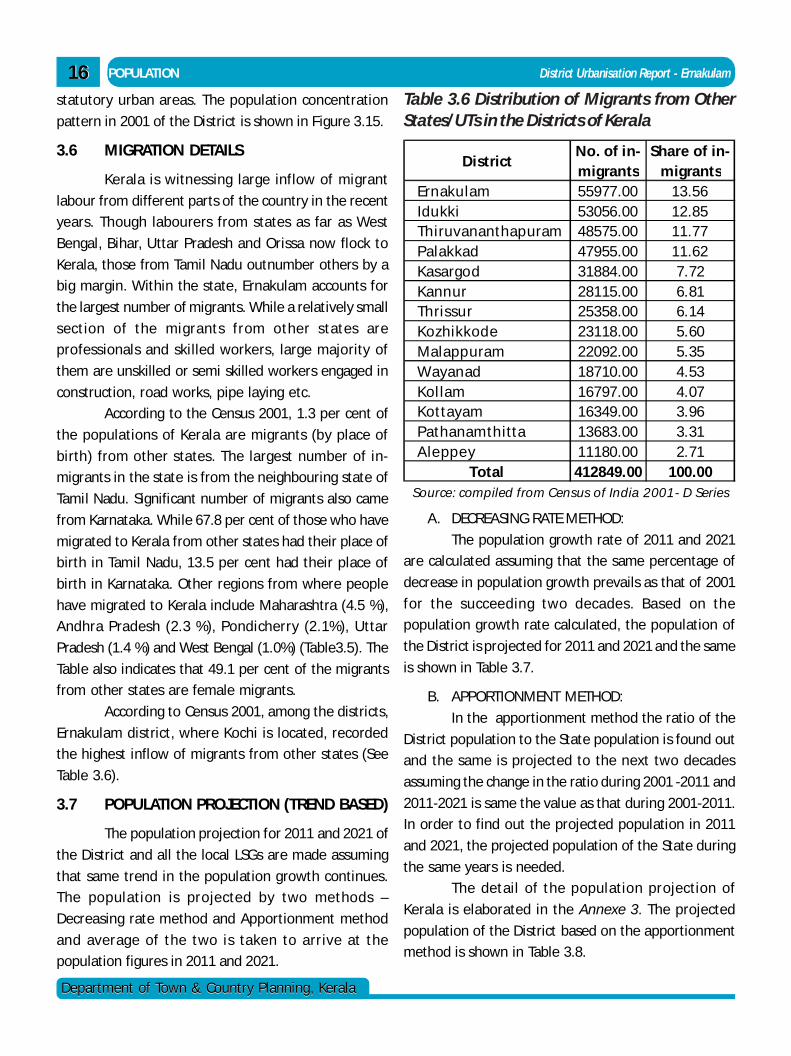
1616
Department of Town & Country Planning, KeralaDepartment of Town & Country Planning, Kerala
POPULATION District Urbanisation Report - Ernakulam
statutory urban areas. The population concentration
pattern in 2001 of the District is shown in Figure 3.15.
3.6 MIGRATION DETAILS
Kerala is witnessing large inflow of migrant
labour from different parts of the country in the recent
years. Though labourers from states as far as West
Bengal, Bihar, Uttar Pradesh and Orissa now flock to
Kerala, those from Tamil Nadu outnumber others by a
big margin. Within the state, Ernakulam accounts for
the largest number of migrants. While a relatively small
section of the migrants from other states are
professionals and skilled workers, large majority of
them are unskilled or semi skilled workers engaged in
construction, road works, pipe laying etc.
According to the Census 2001, 1.3 per cent of
the populations of Kerala are migrants (by place of
birth) from other states. The largest number of in-
migrants in the state is from the neighbouring state of
Tamil Nadu. Significant number of migrants also came
from Karnataka. While 67.8 per cent of those who have
migrated to Kerala from other states had their place of
birth in Tamil Nadu, 13.5 per cent had their place of
birth in Karnataka. Other regions from where people
have migrated to Kerala include Maharashtra (4.5 %),
Andhra Pradesh (2.3 %), Pondicherry (2.1%), Uttar
Pradesh (1.4 %) and West Bengal (1.0%) (Table3.5). The
Table also indicates that 49.1 per cent of the migrants
from other states are female migrants.
According to Census 2001, among the districts,
Ernakulam district, where Kochi is located, recorded
the highest inflow of migrants from other states (See
Table 3.6).
3.7 POPULATION PROJECTION (TREND BASED)
The population projection for 2011 and 2021 of
the District and all the local LSGs are made assuming
that same trend in the population growth continues.
The population is projected by two methods –
Decreasing rate method and Apportionment method
and average of the two is taken to arrive at the
population figures in 2011 and 2021.
DistrictNo. of in-migrants
Share of in-migrants
Ernakulam 55977.00 13.56Idukki 53056.00 12.85Thiruvananthapuram 48575.00 11.77Palakkad 47955.00 11.62Kasargod 31884.00 7.72Kannur 28115.00 6.81Thrissur 25358.00 6.14Kozhikkode 23118.00 5.60Malappuram 22092.00 5.35Wayanad 18710.00 4.53Kollam 16797.00 4.07Kottayam 16349.00 3.96Pathanamthitta 13683.00 3.31Aleppey 11180.00 2.71
Total 412849.00 100.00Source: compiled from Census of India 2001- D Series
Table 3.6 Distribution of Migrants from OtherStates/UTs in the Districts of Kerala
A. DECREASING RATE METHOD:
The population growth rate of 2011 and 2021
are calculated assuming that the same percentage of
decrease in population growth prevails as that of 2001
for the succeeding two decades. Based on the
population growth rate calculated, the population of
the District is projected for 2011 and 2021 and the same
is shown in Table 3.7.
B. APPORTIONMENT METHOD:
In the apportionment method the ratio of the
District population to the State population is found out
and the same is projected to the next two decades
assuming the change in the ratio during 2001 -2011 and
2011-2021 is same the value as that during 2001-2011.
In order to find out the projected population in 2011
and 2021, the projected population of the State during
the same years is needed.
The detail of the population projection of
Kerala is elaborated in the Annexe 3. The projected
population of the District based on the apportionment
method is shown in Table 3.8.
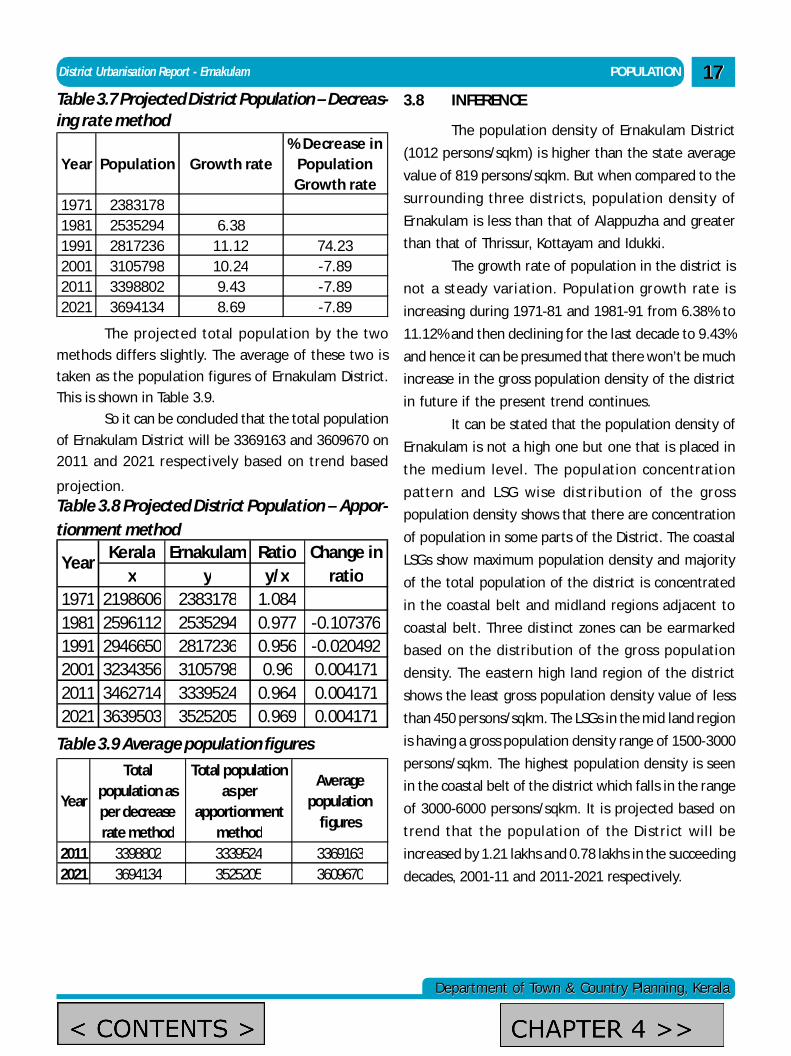
District Urbanisation Report - Ernakulam POPULATION
Department of Town & Country Planning, KeralaDepartment of Town & Country Planning, Kerala
1717
Year Population Growth rate% Decrease in
Population Growth rate
1971 23831781981 2535294 6.381991 2817236 11.12 74.232001 3105798 10.24 -7.892011 3398802 9.43 -7.892021 3694134 8.69 -7.89
Table 3.7 Projected District Population – Decreas-ing rate method
The projected total population by the two
methods differs slightly. The average of these two is
taken as the population figures of Ernakulam District.
This is shown in Table 3.9.
So it can be concluded that the total population
of Ernakulam District will be 3369163 and 3609670 on
2011 and 2021 respectively based on trend based
projection.
Kerala Ernakulam Ratiox y y/x
1971 2198606 2383178 1.0841981 2596112 2535294 0.977 -0.1073761991 2946650 2817236 0.956 -0.0204922001 3234356 3105798 0.96 0.0041712011 3462714 3339524 0.964 0.0041712021 3639503 3525205 0.969 0.004171
YearChange in
ratio
Table 3.8 Projected District Population – Appor-tionment method
Year
Total population as per decrease rate method
Total population as per
apportionment method
Average population
figures
2011 3398802 3339524 33691632021 3694134 3525205 3609670
Table 3.9 Average population figures
3.8 INFERENCE
The population density of Ernakulam District
(1012 persons/sqkm) is higher than the state average
value of 819 persons/sqkm. But when compared to the
surrounding three districts, population density of
Ernakulam is less than that of Alappuzha and greater
than that of Thrissur, Kottayam and Idukki.
The growth rate of population in the district is
not a steady variation. Population growth rate is
increasing during 1971-81 and 1981-91 from 6.38% to
11.12% and then declining for the last decade to 9.43%
and hence it can be presumed that there won’t be much
increase in the gross population density of the district
in future if the present trend continues.
It can be stated that the population density of
Ernakulam is not a high one but one that is placed in
the medium level. The population concentration
pattern and LSG wise distribution of the gross
population density shows that there are concentration
of population in some parts of the District. The coastal
LSGs show maximum population density and majority
of the total population of the district is concentrated
in the coastal belt and midland regions adjacent to
coastal belt. Three distinct zones can be earmarked
based on the distribution of the gross population
density. The eastern high land region of the district
shows the least gross population density value of less
than 450 persons/sqkm. The LSGs in the mid land region
is having a gross population density range of 1500-3000
persons/sqkm. The highest population density is seen
in the coastal belt of the district which falls in the range
of 3000-6000 persons/sqkm. It is projected based on
trend that the population of the District will be
increased by 1.21 lakhs and 0.78 lakhs in the succeeding
decades, 2001-11 and 2011-2021 respectively.
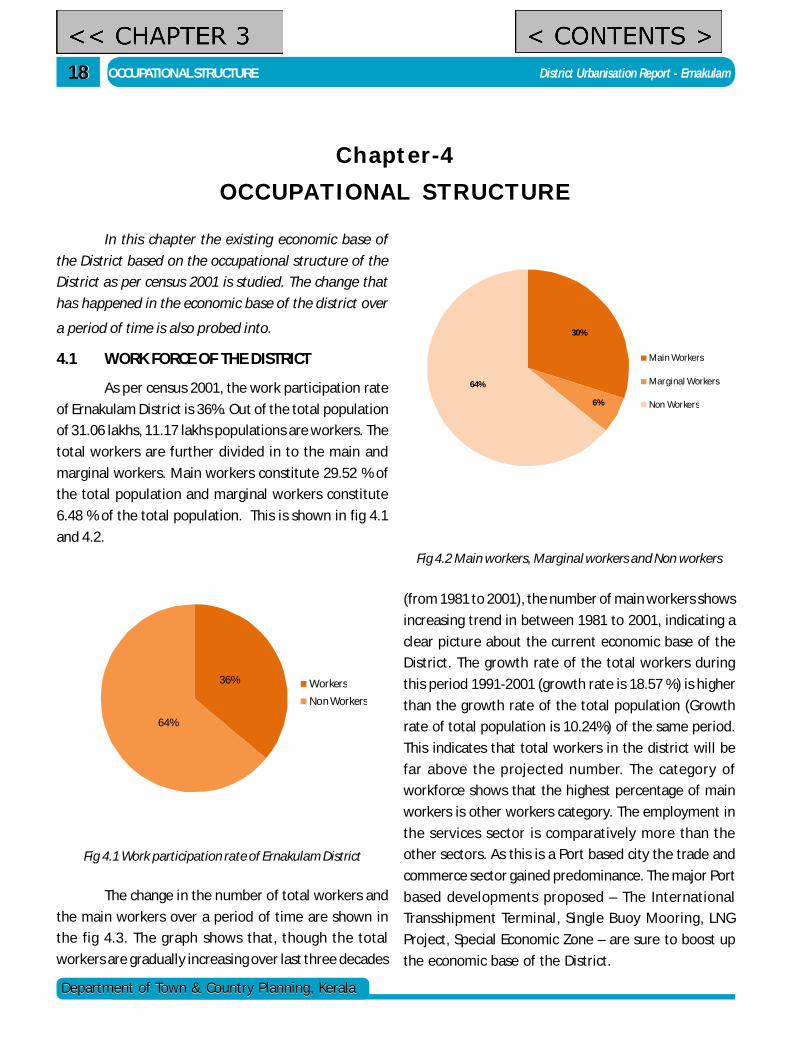
1818
Department of Town & Country Planning, KeralaDepartment of Town & Country Planning, Kerala
OCCUPATIONAL STRUCTURE District Urbanisation Report - Ernakulam
Chapter-4OCCUPATIONAL STRUCTURE
In this chapter the existing economic base of
the District based on the occupational structure of the
District as per census 2001 is studied. The change that
has happened in the economic base of the district over
a period of time is also probed into.
4.1 WORK FORCE OF THE DISTRICT
As per census 2001, the work participation rate
of Ernakulam District is 36%. Out of the total population
of 31.06 lakhs, 11.17 lakhs populations are workers. The
total workers are further divided in to the main and
marginal workers. Main workers constitute 29.52 % of
the total population and marginal workers constitute
6.48 % of the total population. This is shown in fig 4.1
and 4.2.
(from 1981 to 2001), the number of main workers shows
increasing trend in between 1981 to 2001, indicating a
clear picture about the current economic base of the
District. The growth rate of the total workers during
this period 1991-2001 (growth rate is 18.57 %) is higher
than the growth rate of the total population (Growth
rate of total population is 10.24%) of the same period.
This indicates that total workers in the district will be
far above the projected number. The category of
workforce shows that the highest percentage of main
workers is other workers category. The employment in
the services sector is comparatively more than the
other sectors. As this is a Port based city the trade and
commerce sector gained predominance. The major Port
based developments proposed – The International
Transshipment Terminal, Single Buoy Mooring, LNG
Project, Special Economic Zone – are sure to boost up
the economic base of the District.
Fig 4.1 Work participation rate of Ernakulam District
36%
64%
Workers
Non Workers
The change in the number of total workers and
the main workers over a period of time are shown in
the fig 4.3. The graph shows that, though the total
workers are gradually increasing over last three decades
30%
6%
64%
Main Workers
Marginal Workers
Non Workers
Fig 4.2 Main workers, Marginal workers and Non workers
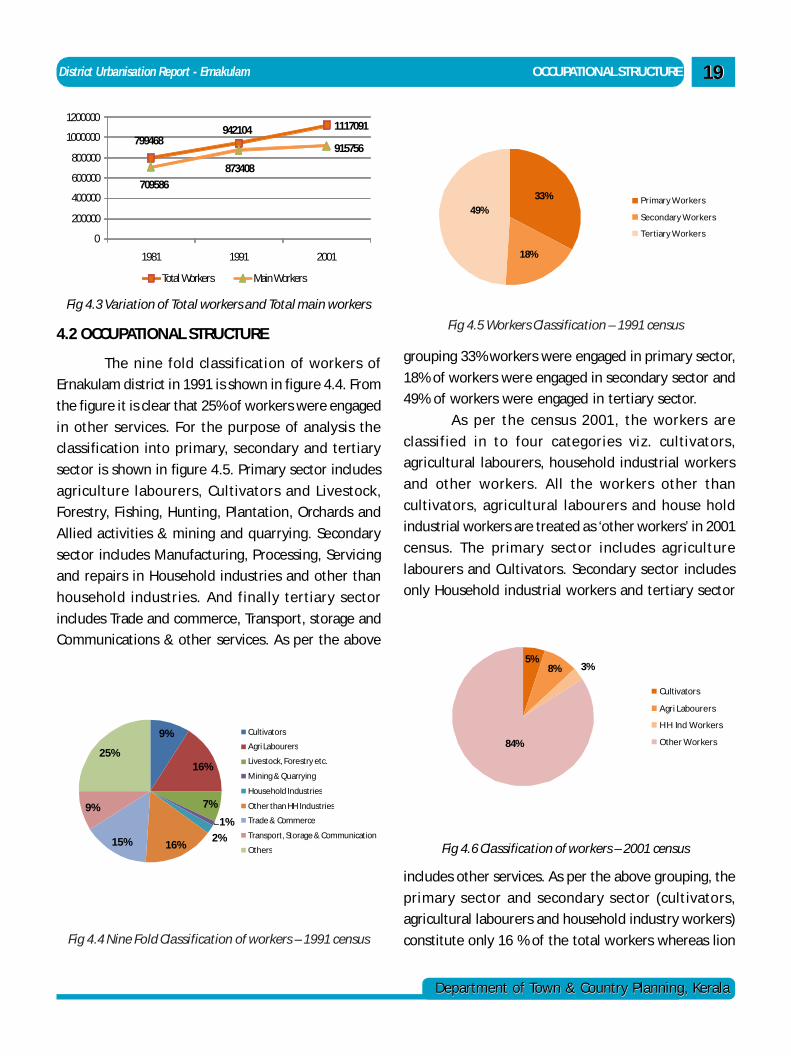
District Urbanisation Report - Ernakulam OCCUPATIONAL STRUCTURE
Department of Town & Country Planning, KeralaDepartment of Town & Country Planning, Kerala
1919
799468942104 1117091
709586
873408
915756
0
200000
400000
600000
800000
1000000
1200000
1981 1991 2001
Total Workers Main Workers
Fig 4.3 Variation of Total workers and Total main workers
4.2 OCCUPATIONAL STRUCTURE
The nine fold classification of workers of
Ernakulam district in 1991 is shown in figure 4.4. From
the figure it is clear that 25% of workers were engaged
in other services. For the purpose of analysis the
classification into primary, secondary and tertiary
sector is shown in figure 4.5. Primary sector includes
agriculture labourers, Cultivators and Livestock,
Forestry, Fishing, Hunting, Plantation, Orchards and
Allied activities & mining and quarrying. Secondary
sector includes Manufacturing, Processing, Servicing
and repairs in Household industries and other than
household industries. And finally tertiary sector
includes Trade and commerce, Transport, storage and
Communications & other services. As per the above
Fig 4.4 Nine Fold Classification of workers – 1991 census
33%
18%
49%Primary Workers
Secondary Workers
Tertiary Workers
Fig 4.5 Workers Classification – 1991 census
grouping 33% workers were engaged in primary sector,
18% of workers were engaged in secondary sector and
49% of workers were engaged in tertiary sector.
As per the census 2001, the workers are
classified in to four categories viz. cultivators,
agricultural labourers, household industrial workers
and other workers. All the workers other than
cultivators, agricultural labourers and house hold
industrial workers are treated as ‘other workers’ in 2001
census. The primary sector includes agriculture
labourers and Cultivators. Secondary sector includes
only Household industrial workers and tertiary sector
5%8% 3%
84%
Cultivators
Agri Labourers
H H Ind Workers
Other Workers
Fig 4.6 Classification of workers – 2001 census
includes other services. As per the above grouping, the
primary sector and secondary sector (cultivators,
agricultural labourers and household industry workers)
constitute only 16 % of the total workers whereas lion
9%
16%
7%
1%
2%16%15%
9%
25%
Cultivators
Agri Labourers
Livestock, Forestry etc.
Mining & Quarrying
Household Industries
Other than HH Industries
Trade & Commerce
Transport, Storage & Communication
Others
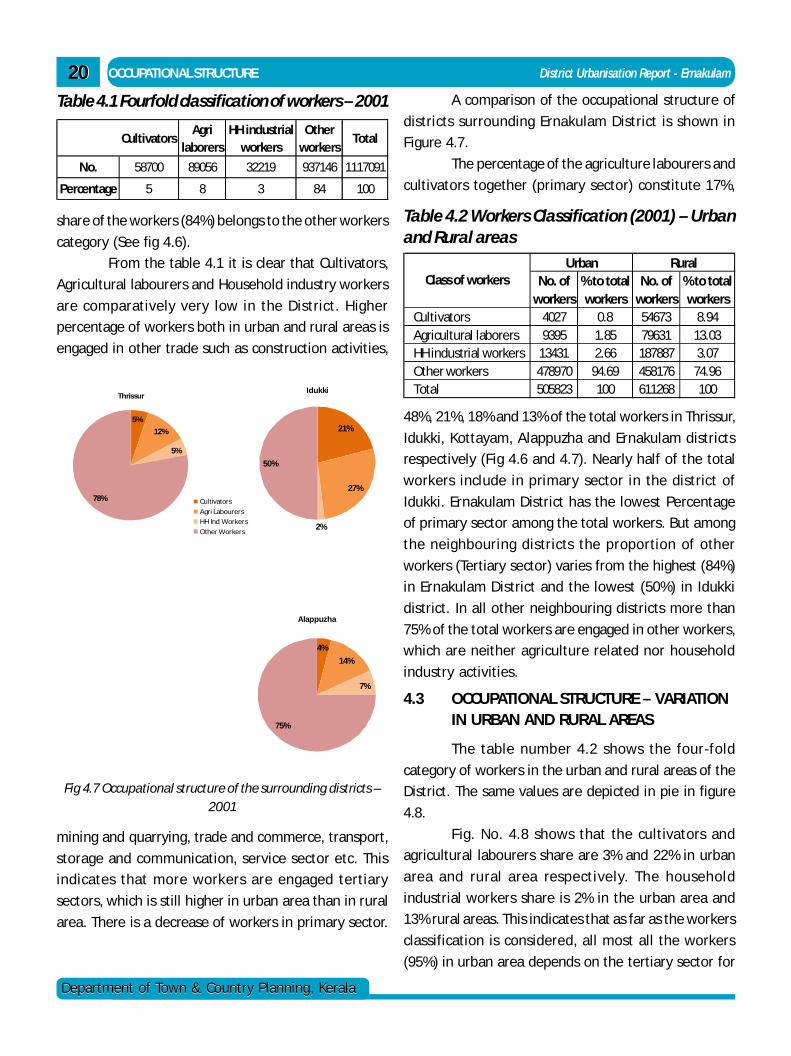
2020
Department of Town & Country Planning, KeralaDepartment of Town & Country Planning, Kerala
OCCUPATIONAL STRUCTURE District Urbanisation Report - Ernakulam
share of the workers (84%) belongs to the other workers
category (See fig 4.6).
From the table 4.1 it is clear that Cultivators,
Agricultural labourers and Household industry workers
are comparatively very low in the District. Higher
percentage of workers both in urban and rural areas is
engaged in other trade such as construction activities,
CultivatorsAgri
laborersHH industrial
workersOther
workersTotal
No. 58700 89056 32219 937146 1117091
Percentage 5 8 3 84 100
Table 4.1 Fourfold classification of workers – 2001
5%
12%
5%
78%
Thrissur
Cultivators
Agri Labourers
HH Ind Workers
Other Workers
21%
27%
2%
50%
Idukki
4%
14%
7%
75%
Alappuzha
mining and quarrying, trade and commerce, transport,
storage and communication, service sector etc. This
indicates that more workers are engaged tertiary
sectors, which is still higher in urban area than in rural
area. There is a decrease of workers in primary sector.
A comparison of the occupational structure of
districts surrounding Ernakulam District is shown in
Figure 4.7.
The percentage of the agriculture labourers and
cultivators together (primary sector) constitute 17%,
No. of workers
% to total workers
No. of workers
% to total workers
Cultivators 4027 0.8 54673 8.94Agricultural laborers 9395 1.85 79631 13.03HH industrial workers 13431 2.66 187887 3.07Other workers 478970 94.69 458176 74.96Total 505823 100 611268 100
Class of workersUrban Rural
Table 4.2 Workers Classification (2001) – Urbanand Rural areas
48%, 21%, 18% and 13% of the total workers in Thrissur,
Idukki, Kottayam, Alappuzha and Ernakulam districts
respectively (Fig 4.6 and 4.7). Nearly half of the total
workers include in primary sector in the district of
Idukki. Ernakulam District has the lowest Percentage
of primary sector among the total workers. But among
the neighbouring districts the proportion of other
workers (Tertiary sector) varies from the highest (84%)
in Ernakulam District and the lowest (50%) in Idukki
district. In all other neighbouring districts more than
75% of the total workers are engaged in other workers,
which are neither agriculture related nor household
industry activities.
4.3 OCCUPATIONAL STRUCTURE – VARIATIONIN URBAN AND RURAL AREAS
The table number 4.2 shows the four-fold
category of workers in the urban and rural areas of the
District. The same values are depicted in pie in figure
4.8.
Fig. No. 4.8 shows that the cultivators and
agricultural labourers share are 3% and 22% in urban
area and rural area respectively. The household
industrial workers share is 2% in the urban area and
13% rural areas. This indicates that as far as the workers
classification is considered, all most all the workers
(95%) in urban area depends on the tertiary sector for
Fig 4.7 Occupational structure of the surrounding districts –2001
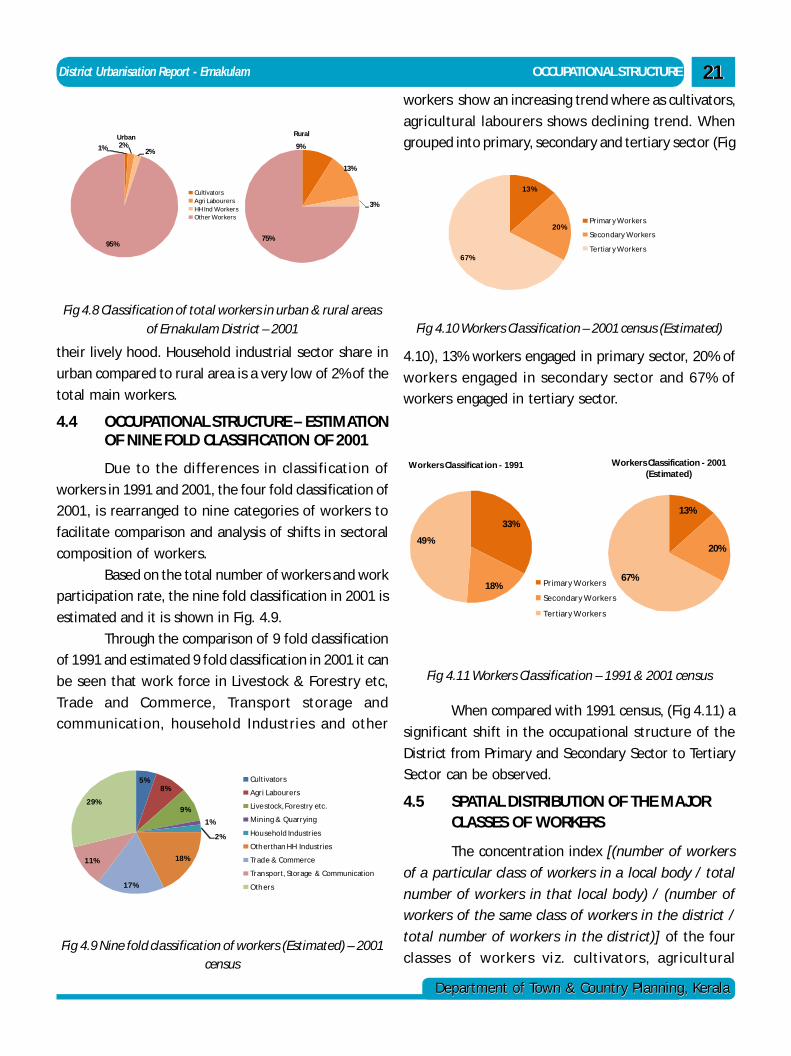
District Urbanisation Report - Ernakulam OCCUPATIONAL STRUCTURE
Department of Town & Country Planning, KeralaDepartment of Town & Country Planning, Kerala
2121
Fig 4.8 Classification of total workers in urban & rural areasof Ernakulam District – 2001
1% 2%2%
95%
Urban
CultivatorsAgri LabourersHH Ind WorkersOther Workers
9%
13%
3%
75%
Rural
their lively hood. Household industrial sector share in
urban compared to rural area is a very low of 2% of the
total main workers.
4.4 OCCUPATIONAL STRUCTURE – ESTIMATIONOF NINE FOLD CLASSIFICATION OF 2001
Due to the differences in classification of
workers in 1991 and 2001, the four fold classification of
2001, is rearranged to nine categories of workers to
facilitate comparison and analysis of shifts in sectoral
composition of workers.
Based on the total number of workers and work
participation rate, the nine fold classification in 2001 is
estimated and it is shown in Fig. 4.9.
Through the comparison of 9 fold classification
of 1991 and estimated 9 fold classification in 2001 it can
be seen that work force in Livestock & Forestry etc,
Trade and Commerce, Transport storage and
communication, household Industries and other
Fig 4.9 Nine fold classification of workers (Estimated) – 2001census
Fig 4.10 Workers Classification – 2001 census (Estimated)
13%
20%
67%
Primar y Workers
Secon dary Workers
Tertiar y Workers
workers show an increasing trend where as cultivators,
agricultural labourers shows declining trend. When
grouped into primary, secondary and tertiary sector (Fig
33%
18%
49%
Workers Classificat ion - 1991
Primary W orkers
Secondary W orkers
Tertiary W orkers
13%
20%
67%
Workers Classification - 2001 (Estimated)
Fig 4.11 Workers Classification – 1991 & 2001 census
4.10), 13% workers engaged in primary sector, 20% of
workers engaged in secondary sector and 67% of
workers engaged in tertiary sector.
When compared with 1991 census, (Fig 4.11) a
significant shift in the occupational structure of the
District from Primary and Secondary Sector to Tertiary
Sector can be observed.
4.5 SPATIAL DISTRIBUTION OF THE MAJORCLASSES OF WORKERS
The concentration index [(number of workers
of a particular class of workers in a local body / total
number of workers in that local body) / (number of
workers of the same class of workers in the district /
total number of workers in the district)] of the four
classes of workers viz. cultivators, agricultural
5%8%
9%
1%
2%
18%
17%
11%
29%
Cultivators
Agri Labourers
Live stock, Forestry etc.
Mining & Quarrying
Household Industries
Oth erthan HH Industries
Trade & Commerce
Transport, Storage & Communication
Oth ers
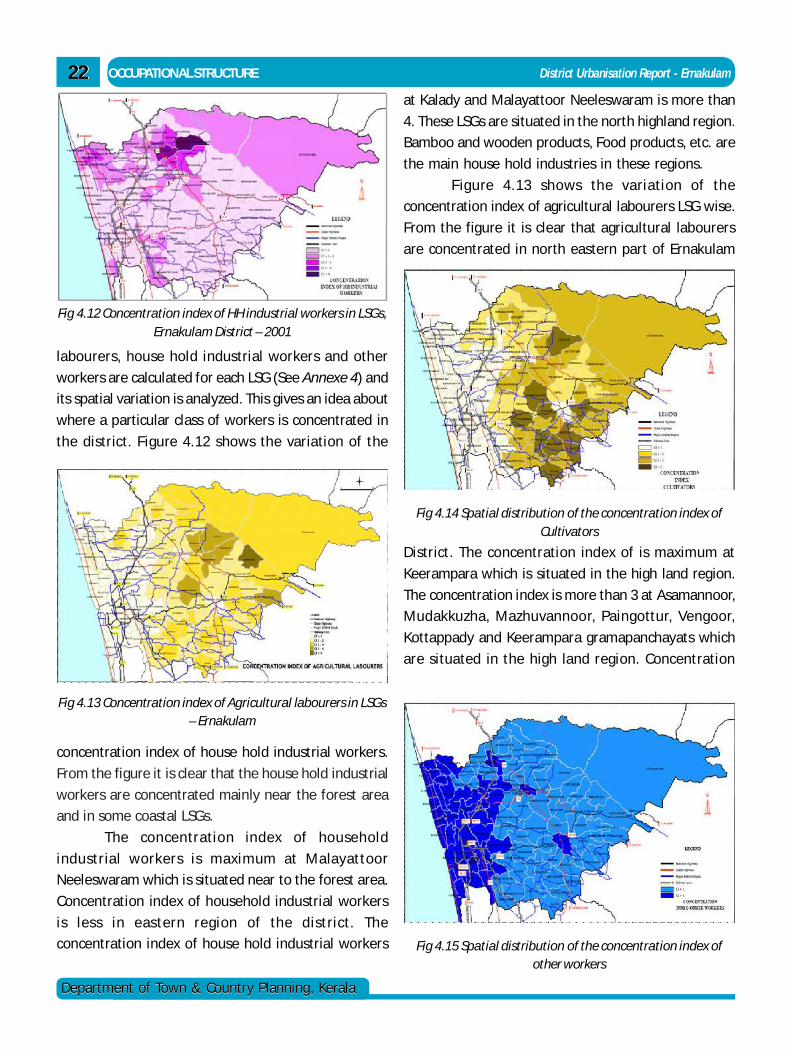
2222
Department of Town & Country Planning, KeralaDepartment of Town & Country Planning, Kerala
OCCUPATIONAL STRUCTURE District Urbanisation Report - Ernakulam
labourers, house hold industrial workers and other
workers are calculated for each LSG (See Annexe 4) and
its spatial variation is analyzed. This gives an idea about
where a particular class of workers is concentrated in
the district. Figure 4.12 shows the variation of the
Fig 4.12 Concentration index of HH industrial workers in LSGs,Ernakulam District – 2001
Fig 4.13 Concentration index of Agricultural labourers in LSGs– Ernakulam
Fig 4.14 Spatial distribution of the concentration index ofCultivators
at Kalady and Malayattoor Neeleswaram is more than
4. These LSGs are situated in the north highland region.
Bamboo and wooden products, Food products, etc. are
the main house hold industries in these regions.
F igure 4.13 shows the variation of the
concentration index of agricultural labourers LSG wise.
From the figure it is clear that agricultural labourers
are concentrated in north eastern part of Ernakulam
Fig 4.15 Spatial distribution of the concentration index ofother workers
District. The concentration index of is maximum at
Keerampara which is situated in the high land region.
The concentration index is more than 3 at Asamannoor,
Mudakkuzha, Mazhuvannoor, Paingottur, Vengoor,
Kottappady and Keerampara gramapanchayats which
are situated in the high land region. Concentration
concentration index of house hold industrial workers.
From the figure it is clear that the house hold industrial
workers are concentrated mainly near the forest area
and in some coastal LSGs.
The concentration index of household
industrial workers is maximum at Malayattoor
Neeleswaram which is situated near to the forest area.
Concentration index of household industrial workers
is less in eastern region of the district. The
concentration index of house hold industrial workers
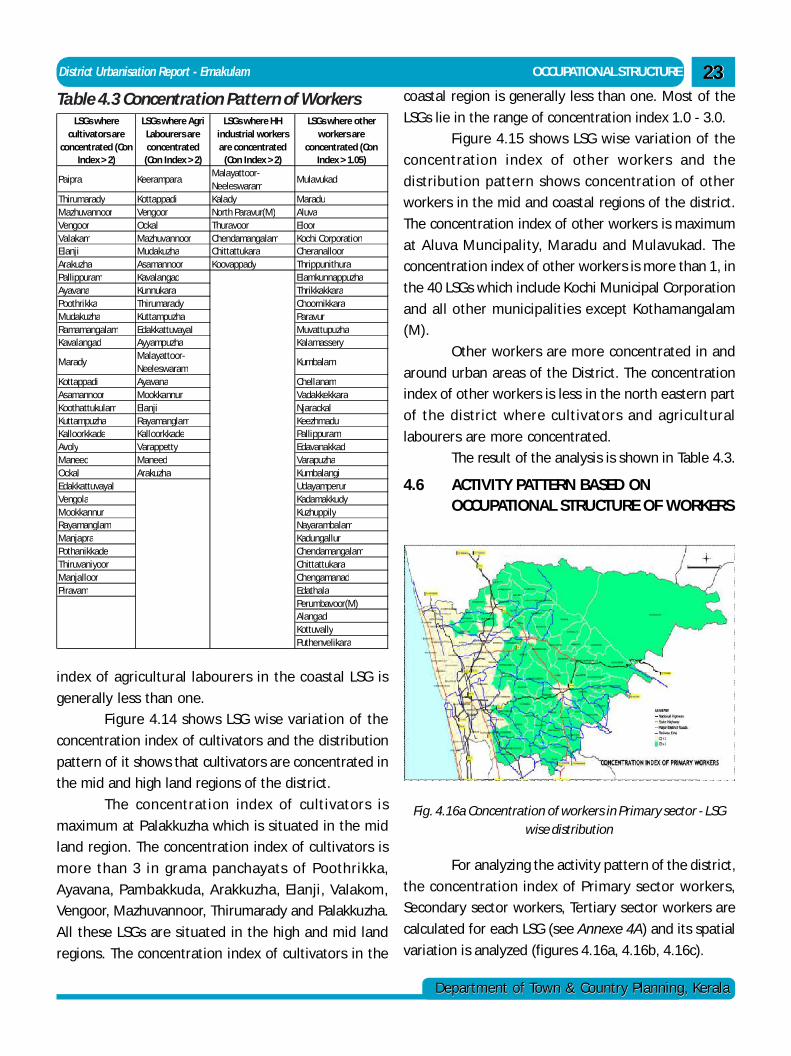
District Urbanisation Report - Ernakulam OCCUPATIONAL STRUCTURE
Department of Town & Country Planning, KeralaDepartment of Town & Country Planning, Kerala
2323coastal region is generally less than one. Most of the
LSGs lie in the range of concentration index 1.0 - 3.0.
Figure 4.15 shows LSG wise variation of the
concentration index of other workers and the
distribution pattern shows concentration of other
workers in the mid and coastal regions of the district.
The concentration index of other workers is maximum
at Aluva Muncipality, Maradu and Mulavukad. The
concentration index of other workers is more than 1, in
the 40 LSGs which include Kochi Municipal Corporation
and all other municipalities except Kothamangalam
(M).
Other workers are more concentrated in and
around urban areas of the District. The concentration
index of other workers is less in the north eastern part
of the district where cultivators and agricultural
labourers are more concentrated.
The result of the analysis is shown in Table 4.3.
4.6 ACTIVITY PATTERN BASED ONOCCUPATIONAL STRUCTURE OF WORKERS
index of agricultural labourers in the coastal LSG is
generally less than one.
Figure 4.14 shows LSG wise variation of the
concentration index of cultivators and the distribution
pattern of it shows that cultivators are concentrated in
the mid and high land regions of the district.
The concentration index of cultivators is
maximum at Palakkuzha which is situated in the mid
land region. The concentration index of cultivators is
more than 3 in grama panchayats of Poothrikka,
Ayavana, Pambakkuda, Arakkuzha, Elanji, Valakom,
Vengoor, Mazhuvannoor, Thirumarady and Palakkuzha.
All these LSGs are situated in the high and mid land
regions. The concentration index of cultivators in the
Table 4.3 Concentration Pattern of WorkersLSGs where
cultivators are concentrated (Con
Index > 2)
LSGs where Agri Labourers are concentrated (Con Index > 2)
LSGs where HH industrial workers are concentrated
(Con Index > 2)
LSGs where other workers are
concentrated (Con Index > 1.05)
Paipra KeeramparaMalayattoor-Neeleswaram
Mulavukad
Thirumarady Kottappadi Kalady MaraduMazhuvannoor Vengoor North Paravur(M) AluvaVengoor Ockal Thuravoor EloorValakam Mazhuvannoor Chendamangalam Kochi CorporationElanji Mudakuzha Chittattukara CheranalloorArakuzha Asamannoor Koovappady ThrippunithuraPallippuram Kavalangad ElamkunnappuzhaAyavana Kunnukara ThrikkakkaraPoothrikka Thirumarady ChoornikkaraMudakuzha Kuttampuzha ParavurRamamangalam Edakkattuvayal MuvattupuzhaKavalangad Ayyampuzha Kalamassery
MaradyMalayattoor-Neeleswaram
Kumbalam
Kottappadi Ayavana ChellanamAsamannoor Mookkannur VadakkekkaraKoothattukulam Elanji NjarackalKuttampuzha Rayamanglam KeezhmaduKalloorkkade Kalloorkkade PallippuramAvoly Varappetty EdavanakkadManeed Maneed VarapuzhaOckal Arakuzha KumbalangiEdakkattuvayal UdayamperurVengola KadamakkudyMookkannur KuzhuppilyRayamanglam NayarambalamManjapra KadungallurPothanikkade ChendamangalamThiruvaniyoor ChittattukaraManjalloor ChengamanadPiravam Edathala
Perumbavoor(M)AlangadKottuvallyPuthenvelikara
Fig. 4.16a Concentration of workers in Primary sector - LSGwise distribution
For analyzing the activity pattern of the district,
the concentration index of Primary sector workers,
Secondary sector workers, Tertiary sector workers are
calculated for each LSG (see Annexe 4A) and its spatial
variation is analyzed (figures 4.16a, 4.16b, 4.16c).
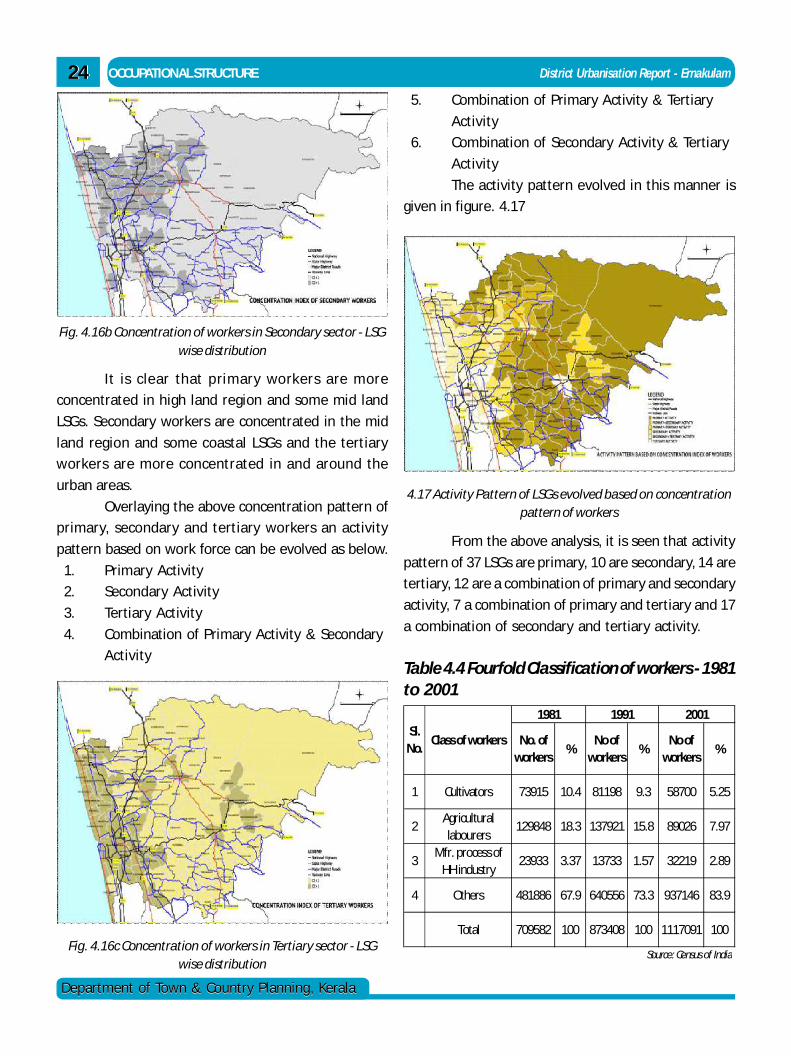
2424
Department of Town & Country Planning, KeralaDepartment of Town & Country Planning, Kerala
OCCUPATIONAL STRUCTURE District Urbanisation Report - Ernakulam
Fig. 4.16b Concentration of workers in Secondary sector - LSGwise distribution
Fig. 4.16c Concentration of workers in Tertiary sector - LSGwise distribution
4.17 Activity Pattern of LSGs evolved based on concentrationpattern of workers
No. of workers
%No of
workers%
No of workers
%
1 Cultivators 73915 10.4 81198 9.3 58700 5.25
2Agricultural labourers
129848 18.3 137921 15.8 89026 7.97
3Mfr. process of
HH industry23933 3.37 13733 1.57 32219 2.89
4 Others 481886 67.9 640556 73.3 937146 83.9
Total 709582 100 873408 100 1117091 100
Sl. No.
Class of workers
1981 1991 2001
Source: Census of India
Table 4.4 Fourfold Classification of workers - 1981to 2001
It is clear that primary workers are more
concentrated in high land region and some mid land
LSGs. Secondary workers are concentrated in the mid
land region and some coastal LSGs and the tertiary
workers are more concentrated in and around the
urban areas.
Overlaying the above concentration pattern of
primary, secondary and tertiary workers an activity
pattern based on work force can be evolved as below.
1. Primary Activity
2. Secondary Activity
3. Tertiary Activity
4. Combination of Primary Activity & Secondary
Activity
5. Combination of Primary Activity & Tertiary
Activity
6. Combination of Secondary Activity & Tertiary
Activity
The activity pattern evolved in this manner is
given in figure. 4.17
From the above analysis, it is seen that activity
pattern of 37 LSGs are primary, 10 are secondary, 14 are
tertiary, 12 are a combination of primary and secondary
activity, 7 a combination of primary and tertiary and 17
a combination of secondary and tertiary activity.
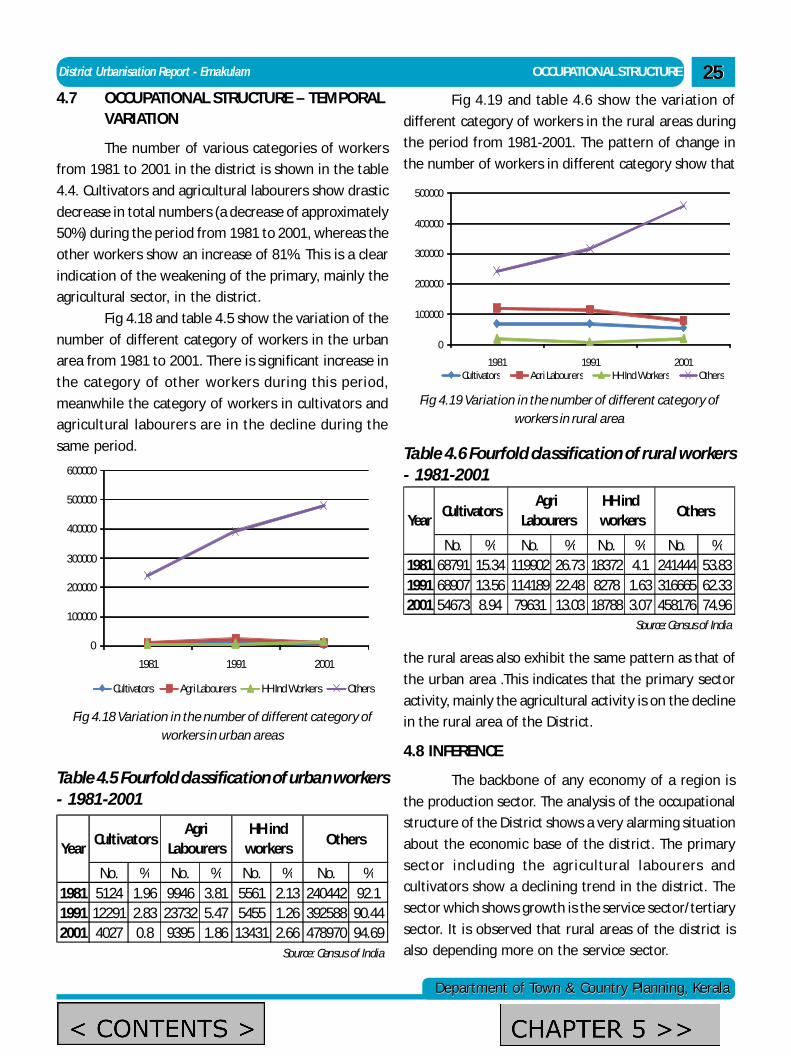
District Urbanisation Report - Ernakulam OCCUPATIONAL STRUCTURE
Department of Town & Country Planning, KeralaDepartment of Town & Country Planning, Kerala
25254.7 OCCUPATIONAL STRUCTURE – TEMPORAL
VARIATION
The number of various categories of workers
from 1981 to 2001 in the district is shown in the table
4.4. Cultivators and agricultural labourers show drastic
decrease in total numbers (a decrease of approximately
50%) during the period from 1981 to 2001, whereas the
other workers show an increase of 81%. This is a clear
indication of the weakening of the primary, mainly the
agricultural sector, in the district.
Fig 4.18 and table 4.5 show the variation of the
number of different category of workers in the urban
area from 1981 to 2001. There is significant increase in
the category of other workers during this period,
meanwhile the category of workers in cultivators and
agricultural labourers are in the decline during the
same period.
0
100000
200000
300000
400000
500000
600000
1981 1991 2001
Cultivators Agri Labourers HH Ind Workers Others
Fig 4.18 Variation in the number of different category ofworkers in urban areas
No. % No. % No. % No. %1981 5124 1.96 9946 3.81 5561 2.13 240442 92.11991 12291 2.83 23732 5.47 5455 1.26 392588 90.442001 4027 0.8 9395 1.86 13431 2.66 478970 94.69
YearCultivators
Agri Labourers
HH ind workers
Others
Source: Census of India
Table 4.5 Fourfold classification of urban workers- 1981-2001
Table 4.6 Fourfold classification of rural workers- 1981-2001
No. % No. % No. % No. %1981 68791 15.34 119902 26.73 18372 4.1 241444 53.831991 68907 13.56 114189 22.48 8278 1.63 316665 62.332001 54673 8.94 79631 13.03 18788 3.07 458176 74.96
YearCultivators
Agri Labourers
HH ind workers
Others
Source: Census of India
Fig 4.19 and table 4.6 show the variation of
different category of workers in the rural areas during
the period from 1981-2001. The pattern of change in
the number of workers in different category show that
0
100000
200000
300000
400000
500000
1981 1991 2001Cultivators Agri Labourers HH Ind Workers Others
Fig 4.19 Variation in the number of different category ofworkers in rural area
the rural areas also exhibit the same pattern as that of
the urban area .This indicates that the primary sector
activity, mainly the agricultural activity is on the decline
in the rural area of the District.
4.8 INFERENCE
The backbone of any economy of a region is
the production sector. The analysis of the occupational
structure of the District shows a very alarming situation
about the economic base of the district. The primary
sector including the agricultural labourers and
cultivators show a declining trend in the district. The
sector which shows growth is the service sector/tertiary
sector. It is observed that rural areas of the district is
also depending more on the service sector.
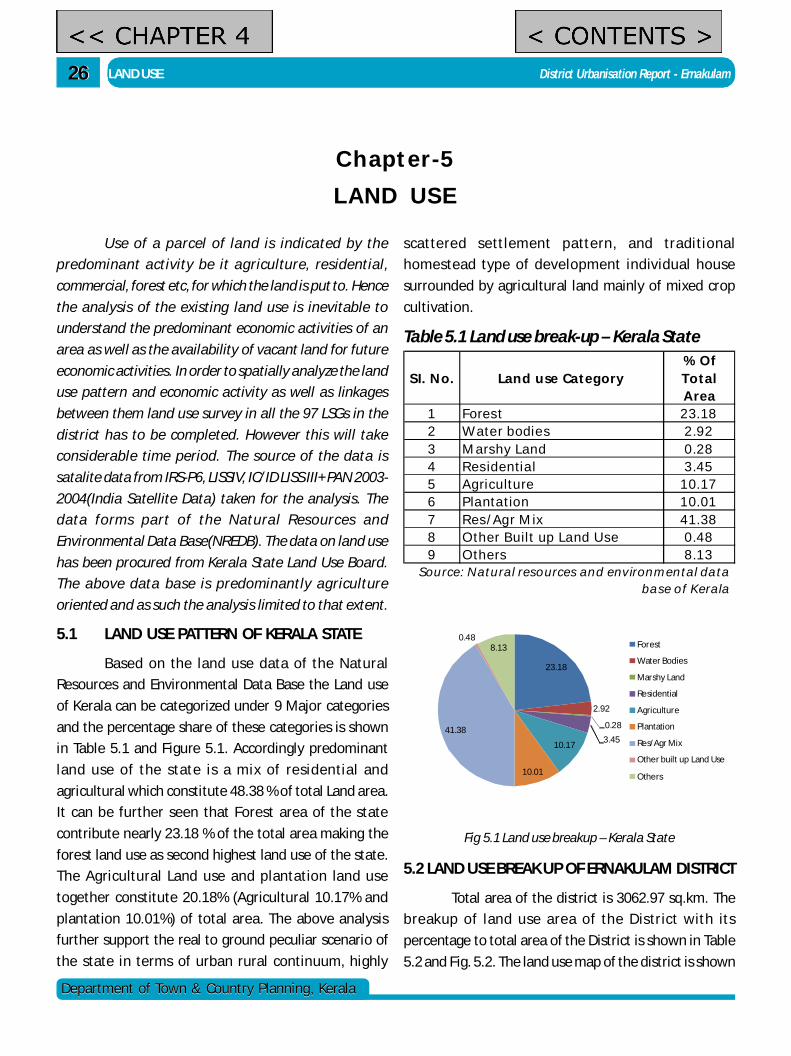
2626
Department of Town & Country Planning, KeralaDepartment of Town & Country Planning, Kerala
LAND USE District Urbanisation Report - Ernakulam
Chapter-5LAND USE
Use of a parcel of land is indicated by the
predominant activity be it agriculture, residential,
commercial, forest etc, for which the land is put to. Hence
the analysis of the existing land use is inevitable to
understand the predominant economic activities of an
area as well as the availability of vacant land for future
economic activities. In order to spatially analyze the land
use pattern and economic activity as well as linkages
between them land use survey in all the 97 LSGs in the
district has to be completed. However this will take
considerable time period. The source of the data is
satalite data from IRS-P6, LISSIV, IC/ID LISS III+ PAN 2003-
2004(India Satellite Data) taken for the analysis. The
data forms part of the Natural Resources and
Environmental Data Base(NREDB). The data on land use
has been procured from Kerala State Land Use Board.
The above data base is predominantly agriculture
oriented and as such the analysis limited to that extent.
5.1 LAND USE PATTERN OF KERALA STATE
Based on the land use data of the Natural
Resources and Environmental Data Base the Land use
of Kerala can be categorized under 9 Major categories
and the percentage share of these categories is shown
in Table 5.1 and Figure 5.1. Accordingly predominant
land use of the state is a mix of residential and
agricultural which constitute 48.38 % of total Land area.
It can be further seen that Forest area of the state
contribute nearly 23.18 % of the total area making the
forest land use as second highest land use of the state.
The Agricultural Land use and plantation land use
together constitute 20.18% (Agricultural 10.17% and
plantation 10.01%) of total area. The above analysis
further support the real to ground peculiar scenario of
the state in terms of urban rural continuum, highly
23.18
2.92
0.28
3.4510.17
10.01
41.38
0.488.13 Forest
Water Bodies
Marshy Land
Residential
Agriculture
Plantation
Res/Agr Mix
Other built up Land Use
Others
Fig 5.1 Land use breakup – Kerala State
S I. N o . Lan d u se Ca teg o ry% O f To tal A rea
1 Fores t 23.182 W a te r bodie s 2 .923 M a rs hy La nd 0.284 R es identia l 3 .455 Ag riculture 10.176 Pla nta tion 10.017 R es /Ag r M ix 41.388 O ther B uilt up La nd U s e 0.489 O thers 8 .13
So u rce: N a tu ra l reso u rces a n d en v iro n m en ta l d a ta b a se o f K era la
Table 5.1 Land use break-up – Kerala State
scattered settlement pattern, and traditional
homestead type of development individual house
surrounded by agricultural land mainly of mixed crop
cultivation.
5.2 LAND USE BREAK UP OF ERNAKULAM DISTRICT
Total area of the district is 3062.97 sq.km. The
breakup of land use area of the District with its
percentage to total area of the District is shown in Table
5.2 and Fig. 5.2. The land use map of the district is shown
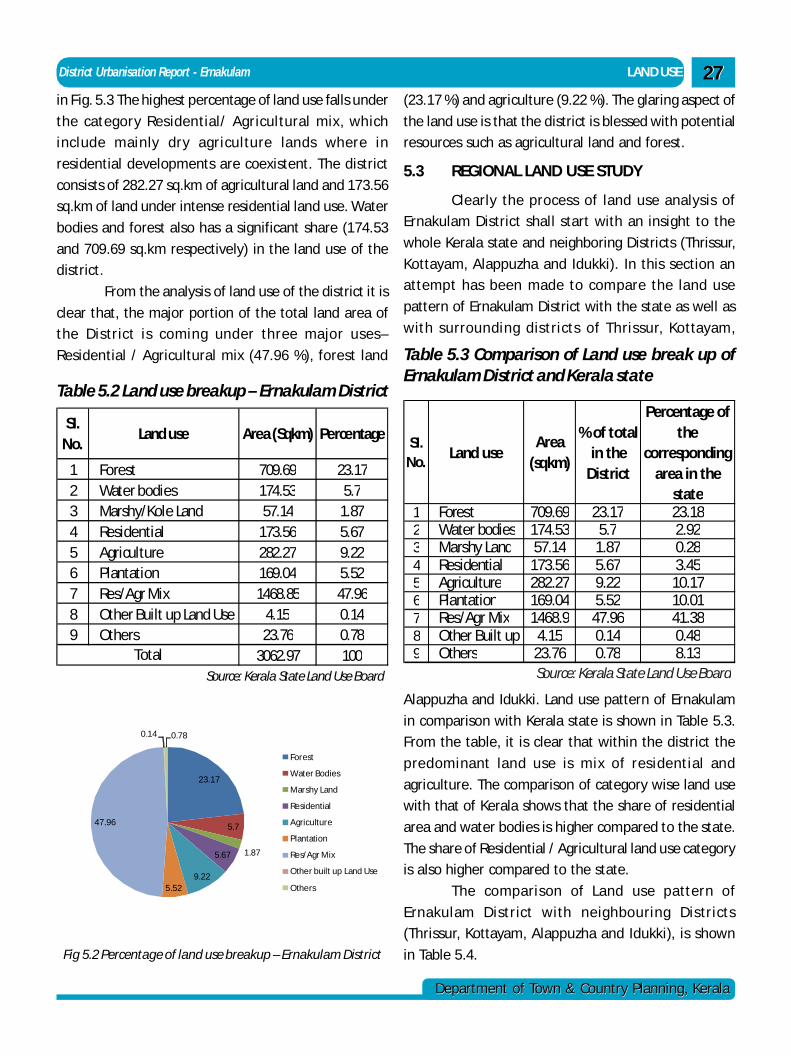
District Urbanisation Report - Ernakulam LAND USE
Department of Town & Country Planning, KeralaDepartment of Town & Country Planning, Kerala
2727in Fig. 5.3 The highest percentage of land use falls under
the category Residential/ Agricultural mix, which
include mainly dry agriculture lands where in
residential developments are coexistent. The district
consists of 282.27 sq.km of agricultural land and 173.56
sq.km of land under intense residential land use. Water
bodies and forest also has a significant share (174.53
and 709.69 sq.km respectively) in the land use of the
district.
From the analysis of land use of the district it is
clear that, the major portion of the total land area of
the District is coming under three major uses–
Residential / Agricultural mix (47.96 %), forest land
SI. No.
Land use Area (Sqkm) Percentage
1 Forest 709.69 23.172 Water bodies 174.53 5.73 Marshy/Kole Land 57.14 1.874 Residential 173.56 5.675 Agriculture 282.27 9.226 Plantation 169.04 5.527 Res/Agr Mix 1468.85 47.968 Other Built up Land Use 4.15 0.149 Others 23.76 0.78
3062.97 100Source: Kerala State Land Use Board
Total
Table 5.2 Land use breakup – Ernakulam District
23.17
5.7
1.875.67
9.225.52
47.96
0.14 0.78
Forest
Water Bodies
Marshy Land
Residential
Agriculture
Plantation
Res/Agr Mix
Other built up Land Use
Others
Fig 5.2 Percentage of land use breakup – Ernakulam District
(23.17 %) and agriculture (9.22 %). The glaring aspect of
the land use is that the district is blessed with potential
resources such as agricultural land and forest.
5.3 REGIONAL LAND USE STUDY
Clearly the process of land use analysis of
Ernakulam District shall start with an insight to the
whole Kerala state and neighboring Districts (Thrissur,
Kottayam, Alappuzha and Idukki). In this section an
attempt has been made to compare the land use
pattern of Ernakulam District with the state as well as
with surrounding districts of Thrissur, Kottayam,
SI. No.
Land useArea
(sqkm)
% of total in the
District
Percentage of the
corresponding area in the
state1 Forest 709.69 23.17 23.182 Water bodies 174.53 5.7 2.923 Marshy Land 57.14 1.87 0.284 Residential 173.56 5.67 3.455 Agriculture 282.27 9.22 10.176 Plantation 169.04 5.52 10.017 Res/Agr Mix 1468.9 47.96 41.388 Other Built up 4.15 0.14 0.489 Others 23.76 0.78 8.13
Source: Kerala State Land Use Board
Table 5.3 Comparison of Land use break up ofErnakulam District and Kerala state
Alappuzha and Idukki. Land use pattern of Ernakulam
in comparison with Kerala state is shown in Table 5.3.
From the table, it is clear that within the district the
predominant land use is mix of residential and
agriculture. The comparison of category wise land use
with that of Kerala shows that the share of residential
area and water bodies is higher compared to the state.
The share of Residential / Agricultural land use category
is also higher compared to the state.
The comparison of Land use pattern of
Ernakulam District with neighbouring Districts
(Thrissur, Kottayam, Alappuzha and Idukki), is shown
in Table 5.4.
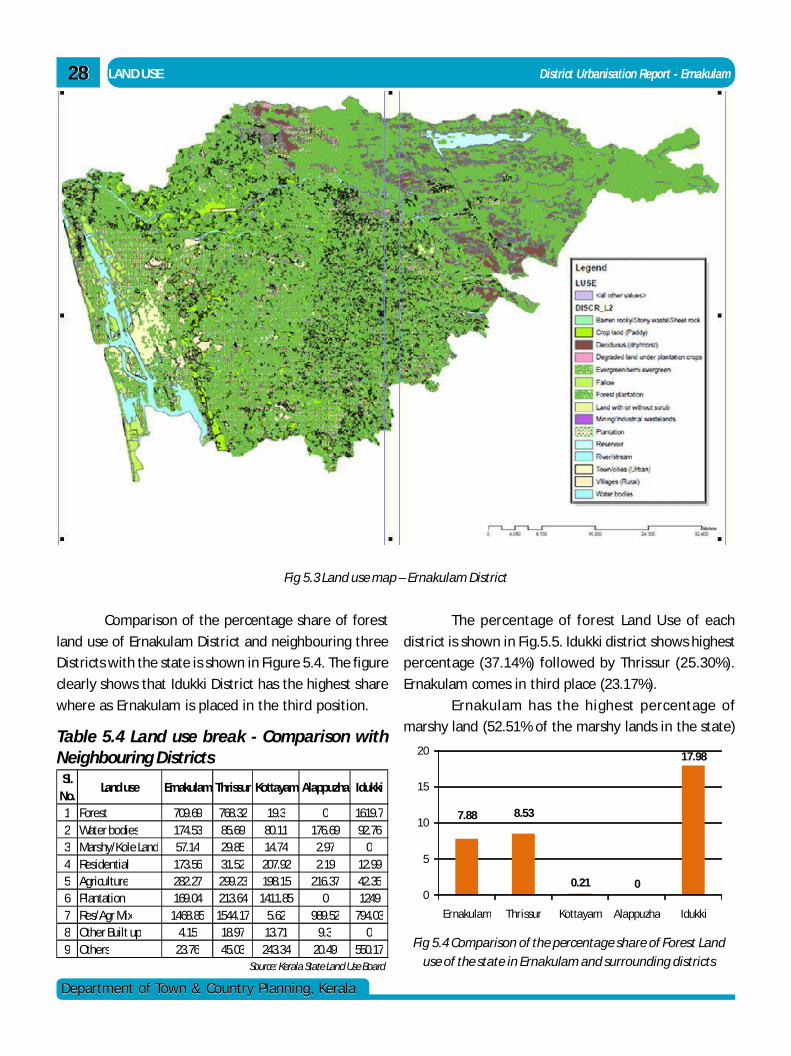
2828
Department of Town & Country Planning, KeralaDepartment of Town & Country Planning, Kerala
LAND USE District Urbanisation Report - Ernakulam
Fig 5.3 Land use map – Ernakulam District
Comparison of the percentage share of forest
land use of Ernakulam District and neighbouring three
Districts with the state is shown in Figure 5.4. The figure
clearly shows that Idukki District has the highest share
where as Ernakulam is placed in the third position.
The percentage of forest Land Use of each
district is shown in Fig.5.5. Idukki district shows highest
percentage (37.14%) followed by Thrissur (25.30%).
Ernakulam comes in third place (23.17%).
Ernakulam has the highest percentage of
marshy land (52.51% of the marshy lands in the state)Table 5.4 Land use break - Comparison withNeighbouring DistrictsSI. No.
Land use Ernakulam Thrissur Kottayam Alappuzha Idukki
1 Forest 709.69 768.32 19.3 0 1619.72 Water bodies 174.53 85.69 80.11 176.69 92.763 Marshy/Kole Land 57.14 29.85 14.74 2.97 04 Residential 173.56 31.52 207.92 2.19 12.995 Agriculture 282.27 299.23 198.15 216.37 42.356 Plantation 169.04 213.64 1411.85 0 12497 Res/Agr Mix 1468.85 1544.17 5.62 989.52 794.038 Other Built up 4.15 18.97 13.71 9.3 09 Others 23.76 45.03 243.34 20.49 550.17
Source: Kerala State Land Use Board
7.88 8.53
0.21 0
17.98
0
5
10
15
20
Ernakulam Thrissur Kottayam Alappuzha Idukki
Fig 5.4 Comparison of the percentage share of Forest Landuse of the state in Ernakulam and surrounding districts
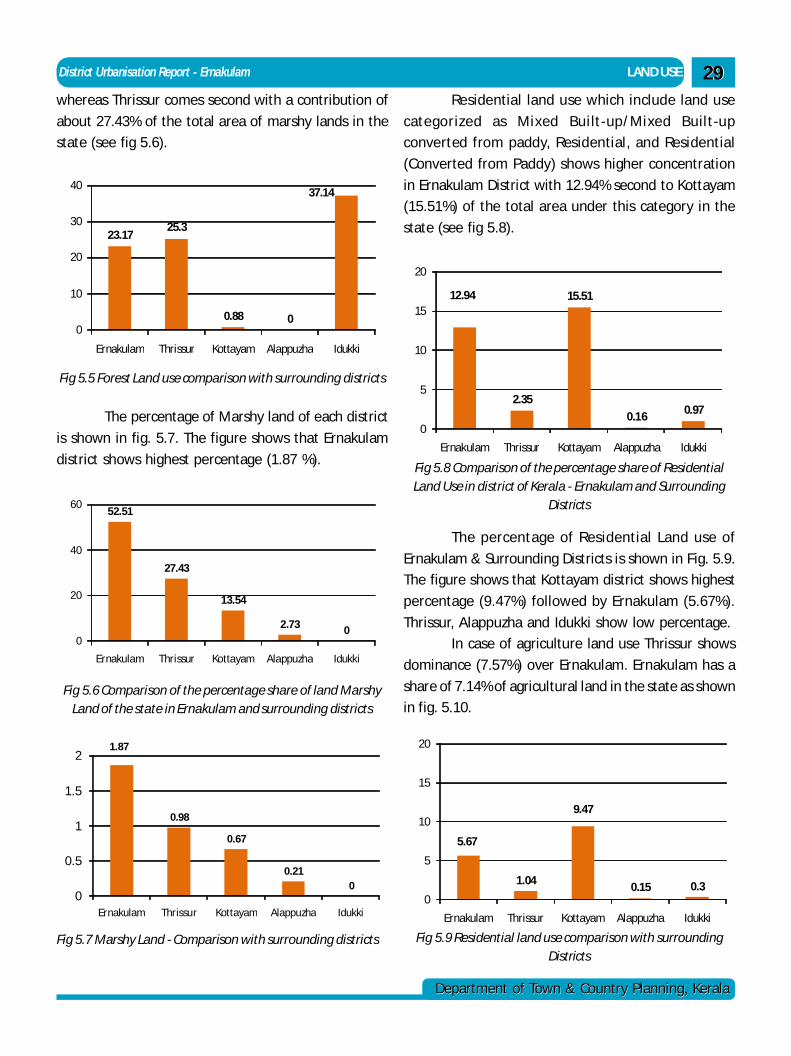
District Urbanisation Report - Ernakulam LAND USE
Department of Town & Country Planning, KeralaDepartment of Town & Country Planning, Kerala
2929whereas Thrissur comes second with a contribution of
about 27.43% of the total area of marshy lands in the
state (see fig 5.6).
23.1725.3
0.88 0
37.14
0
10
20
30
40
Ernakulam Thrissur Kottayam Alappuzha Idukki
Fig 5.5 Forest Land use comparison with surrounding districts
52.51
27.43
13.54
2.73 00
20
40
60
Ernakulam Thrissur Kottayam Alappuzha Idukki
Fig 5.6 Comparison of the percentage share of land MarshyLand of the state in Ernakulam and surrounding districts
1.87
0.98
0.67
0.210
0
0.5
1
1.5
2
Ernakulam Thrissur Kottayam Alappuzha Idukki
Fig 5.7 Marshy Land - Comparison with surrounding districts
The percentage of Marshy land of each district
is shown in fig. 5.7. The figure shows that Ernakulam
district shows highest percentage (1.87 %).
Residential land use which include land use
categorized as Mixed Built-up/Mixed Built-up
converted from paddy, Residential, and Residential
(Converted from Paddy) shows higher concentration
in Ernakulam District with 12.94% second to Kottayam
(15.51%) of the total area under this category in the
state (see fig 5.8).
12.94
2.35
15.51
0.16 0.97
0
5
10
15
20
Ernakulam Thrissur Kottayam Alappuzha Idukki
Fig 5.8 Comparison of the percentage share of ResidentialLand Use in district of Kerala - Ernakulam and Surrounding
Districts
5.67
1.04
9.47
0.15 0.30
5
10
15
20
Ernakulam Thrissur Kottayam Alappuzha Idukki
Fig 5.9 Residential land use comparison with surroundingDistricts
The percentage of Residential Land use of
Ernakulam & Surrounding Districts is shown in Fig. 5.9.
The figure shows that Kottayam district shows highest
percentage (9.47%) followed by Ernakulam (5.67%).
Thrissur, Alappuzha and Idukki show low percentage.
In case of agriculture land use Thrissur shows
dominance (7.57%) over Ernakulam. Ernakulam has a
share of 7.14% of agricultural land in the state as shown
in fig. 5.10.
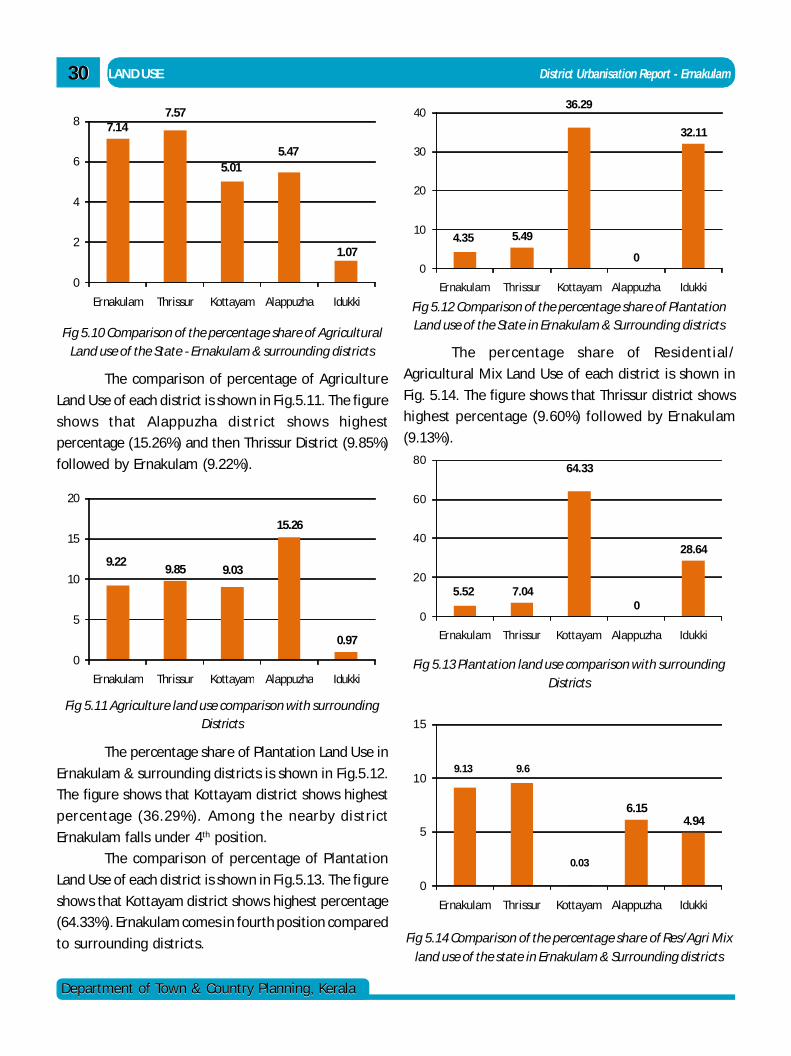
3030
Department of Town & Country Planning, KeralaDepartment of Town & Country Planning, Kerala
LAND USE District Urbanisation Report - Ernakulam
9.229.85 9.03
15.26
0.97
0
5
10
15
20
Ernakulam Thrissur Kottayam Alappuzha Idukki
Fig 5.11 Agriculture land use comparison with surroundingDistricts
The comparison of percentage of Agriculture
Land Use of each district is shown in Fig.5.11. The figure
shows that Alappuzha district shows highest
percentage (15.26%) and then Thrissur District (9.85%)
followed by Ernakulam (9.22%).
The percentage share of Residential/
Agricultural Mix Land Use of each district is shown in
Fig. 5.14. The figure shows that Thrissur district shows
highest percentage (9.60%) followed by Ernakulam
(9.13%).
4.35 5.49
36.29
0
32.11
0
10
20
30
40
Ernakulam Thrissur Kottayam Alappuzha Idukki
Fig 5.12 Comparison of the percentage share of PlantationLand use of the State in Ernakulam & Surrounding districts
9.13 9.6
0.03
6.154.94
0
5
10
15
Ernakulam Thrissur Kottayam Alappuzha Idukki
Fig 5.14 Comparison of the percentage share of Res/Agri Mixland use of the state in Ernakulam & Surrounding districts
5.52 7.04
64.33
0
28.64
0
20
40
60
80
Ernakulam Thrissur Kottayam Alappuzha Idukki
Fig 5.13 Plantation land use comparison with surroundingDistricts
7.147.57
5.015.47
1.07
0
2
4
6
8
Ernakulam Thrissur Kottayam Alappuzha Idukki
Fig 5.10 Comparison of the percentage share of AgriculturalLand use of the State - Ernakulam & surrounding districts
The percentage share of Plantation Land Use in
Ernakulam & surrounding districts is shown in Fig.5.12.
The figure shows that Kottayam district shows highest
percentage (36.29%). Among the nearby district
Ernakulam falls under 4th position.
The comparison of percentage of Plantation
Land Use of each district is shown in Fig.5.13. The figure
shows that Kottayam district shows highest percentage
(64.33%). Ernakulam comes in fourth position compared
to surrounding districts.
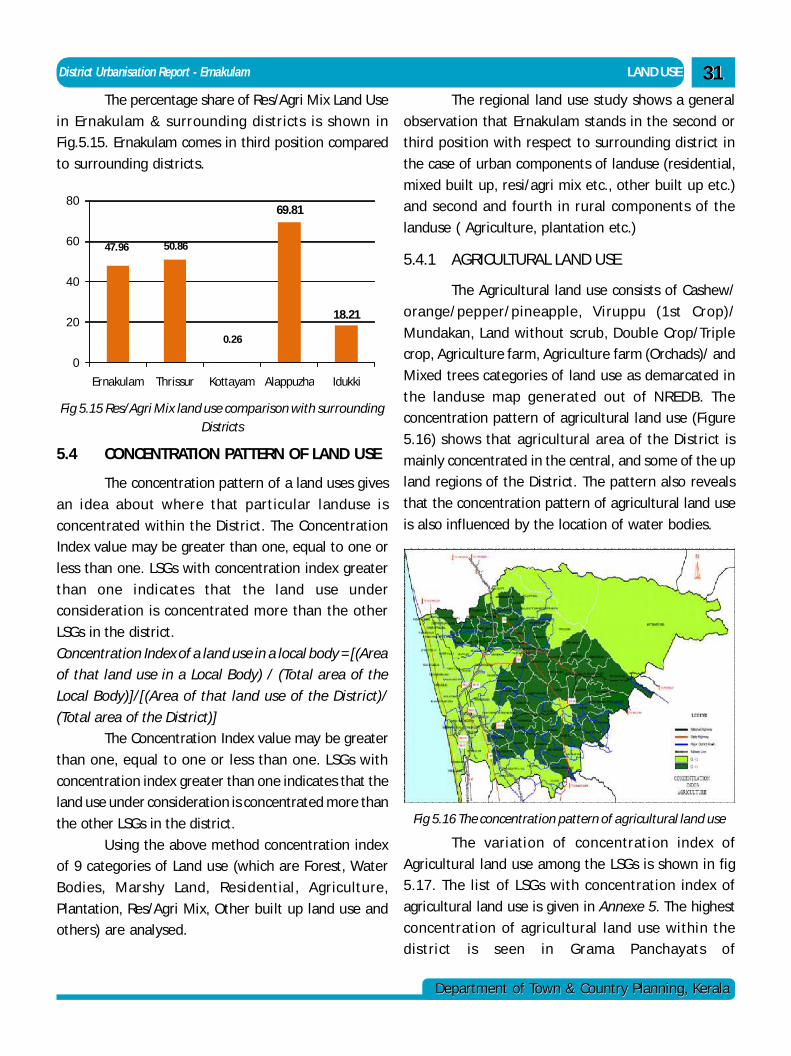
District Urbanisation Report - Ernakulam LAND USE
Department of Town & Country Planning, KeralaDepartment of Town & Country Planning, Kerala
3131The percentage share of Res/Agri Mix Land Use
in Ernakulam & surrounding districts is shown in
Fig.5.15. Ernakulam comes in third position compared
to surrounding districts.
47.96 50.86
0.26
69.81
18.21
0
20
40
60
80
Ernakulam Thrissur Kottayam Alappuzha Idukki
Fig 5.15 Res/Agri Mix land use comparison with surroundingDistricts
5.4 CONCENTRATION PATTERN OF LAND USE
The concentration pattern of a land uses gives
an idea about where that particular landuse is
concentrated within the District. The Concentration
Index value may be greater than one, equal to one or
less than one. LSGs with concentration index greater
than one indicates that the land use under
consideration is concentrated more than the other
LSGs in the district.
Concentration Index of a land use in a local body = [(Area
of that land use in a Local Body) / (Total area of the
Local Body)]/[(Area of that land use of the District)/
(Total area of the District)]
The Concentration Index value may be greater
than one, equal to one or less than one. LSGs with
concentration index greater than one indicates that the
land use under consideration is concentrated more than
the other LSGs in the district.
Using the above method concentration index
of 9 categories of Land use (which are Forest, Water
Bodies, Marshy Land, Residential, Agriculture,
Plantation, Res/Agri Mix, Other built up land use and
others) are analysed.
The regional land use study shows a general
observation that Ernakulam stands in the second or
third position with respect to surrounding district in
the case of urban components of landuse (residential,
mixed built up, resi/agri mix etc., other built up etc.)
and second and fourth in rural components of the
landuse ( Agriculture, plantation etc.)
5.4.1 AGRICULTURAL LAND USE
The Agricultural land use consists of Cashew/
orange/pepper/pineapple, Viruppu (1st Crop)/
Mundakan, Land without scrub, Double Crop/Triple
crop, Agriculture farm, Agriculture farm (Orchads)/ and
Mixed trees categories of land use as demarcated in
the landuse map generated out of NREDB. The
concentration pattern of agricultural land use (Figure
5.16) shows that agricultural area of the District is
mainly concentrated in the central, and some of the up
land regions of the District. The pattern also reveals
that the concentration pattern of agricultural land use
is also influenced by the location of water bodies.
Fig 5.16 The concentration pattern of agricultural land use
The variation of concentration index of
Agricultural land use among the LSGs is shown in fig
5.17. The list of LSGs with concentration index of
agricultural land use is given in Annexe 5. The highest
concentration of agricultural land use within the
district is seen in Grama Panchayats of
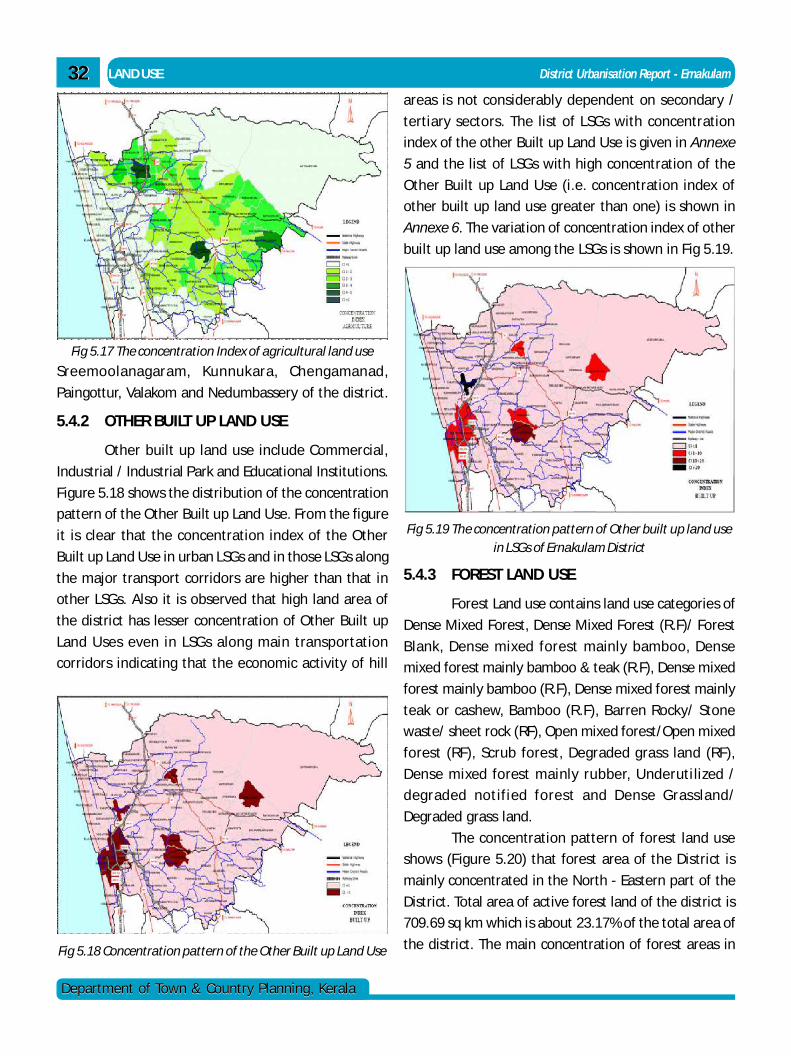
3232
Department of Town & Country Planning, KeralaDepartment of Town & Country Planning, Kerala
LAND USE District Urbanisation Report - Ernakulam
Fig 5.17 The concentration Index of agricultural land use
Sreemoolanagaram, Kunnukara, Chengamanad,
Paingottur, Valakom and Nedumbassery of the district.
5.4.2 OTHER BUILT UP LAND USE
Other built up land use include Commercial,
Industrial / Industrial Park and Educational Institutions.
Figure 5.18 shows the distribution of the concentration
pattern of the Other Built up Land Use. From the figure
it is clear that the concentration index of the Other
Built up Land Use in urban LSGs and in those LSGs along
the major transport corridors are higher than that in
other LSGs. Also it is observed that high land area of
the district has lesser concentration of Other Built up
Land Uses even in LSGs along main transportation
corridors indicating that the economic activity of hill
Fig 5.18 Concentration pattern of the Other Built up Land Use
Fig 5.19 The concentration pattern of Other built up land usein LSGs of Ernakulam District
areas is not considerably dependent on secondary /
tertiary sectors. The list of LSGs with concentration
index of the other Built up Land Use is given in Annexe
5 and the list of LSGs with high concentration of the
Other Built up Land Use (i.e. concentration index of
other built up land use greater than one) is shown in
Annexe 6. The variation of concentration index of other
built up land use among the LSGs is shown in Fig 5.19.
5.4.3 FOREST LAND USE
Forest Land use contains land use categories of
Dense Mixed Forest, Dense Mixed Forest (R.F)/ Forest
Blank, Dense mixed forest mainly bamboo, Dense
mixed forest mainly bamboo & teak (R.F), Dense mixed
forest mainly bamboo (R.F), Dense mixed forest mainly
teak or cashew, Bamboo (R.F), Barren Rocky/ Stone
waste/ sheet rock (RF), Open mixed forest/Open mixed
forest (RF), Scrub forest, Degraded grass land (RF),
Dense mixed forest mainly rubber, Underutilized /
degraded notified forest and Dense Grassland/
Degraded grass land.
The concentration pattern of forest land use
shows (Figure 5.20) that forest area of the District is
mainly concentrated in the North - Eastern part of the
District. Total area of active forest land of the district is
709.69 sq km which is about 23.17% of the total area of
the district. The main concentration of forest areas in
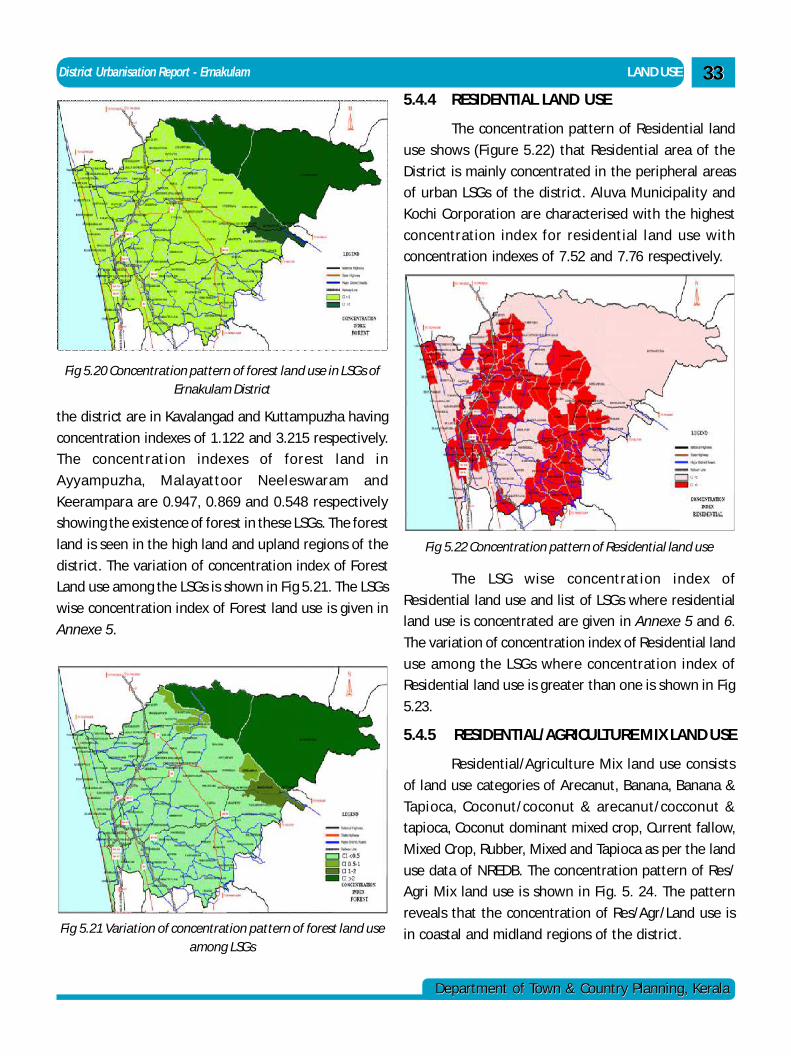
District Urbanisation Report - Ernakulam LAND USE
Department of Town & Country Planning, KeralaDepartment of Town & Country Planning, Kerala
3333
Fig 5.20 Concentration pattern of forest land use in LSGs ofErnakulam District
the district are in Kavalangad and Kuttampuzha having
concentration indexes of 1.122 and 3.215 respectively.
The concentration indexes of forest land in
Ayyampuzha, Malayattoor Neeleswaram and
Keerampara are 0.947, 0.869 and 0.548 respectively
showing the existence of forest in these LSGs. The forest
land is seen in the high land and upland regions of the
district. The variation of concentration index of Forest
Land use among the LSGs is shown in Fig 5.21. The LSGs
wise concentration index of Forest land use is given in
Annexe 5.
Fig 5.21 Variation of concentration pattern of forest land useamong LSGs
5.4.4 RESIDENTIAL LAND USE
The concentration pattern of Residential land
use shows (Figure 5.22) that Residential area of the
District is mainly concentrated in the peripheral areas
of urban LSGs of the district. Aluva Municipality and
Kochi Corporation are characterised with the highest
concentration index for residential land use with
concentration indexes of 7.52 and 7.76 respectively.
Fig 5.22 Concentration pattern of Residential land use
The LSG wise concentration index of
Residential land use and list of LSGs where residential
land use is concentrated are given in Annexe 5 and 6.
The variation of concentration index of Residential land
use among the LSGs where concentration index of
Residential land use is greater than one is shown in Fig
5.23.
5.4.5 RESIDENTIAL/AGRICULTURE MIX LAND USE
Residential/Agriculture Mix land use consists
of land use categories of Arecanut, Banana, Banana &
Tapioca, Coconut/coconut & arecanut/cocconut &
tapioca, Coconut dominant mixed crop, Current fallow,
Mixed Crop, Rubber, Mixed and Tapioca as per the land
use data of NREDB. The concentration pattern of Res/
Agri Mix land use is shown in Fig. 5. 24. The pattern
reveals that the concentration of Res/Agr/Land use is
in coastal and midland regions of the district.
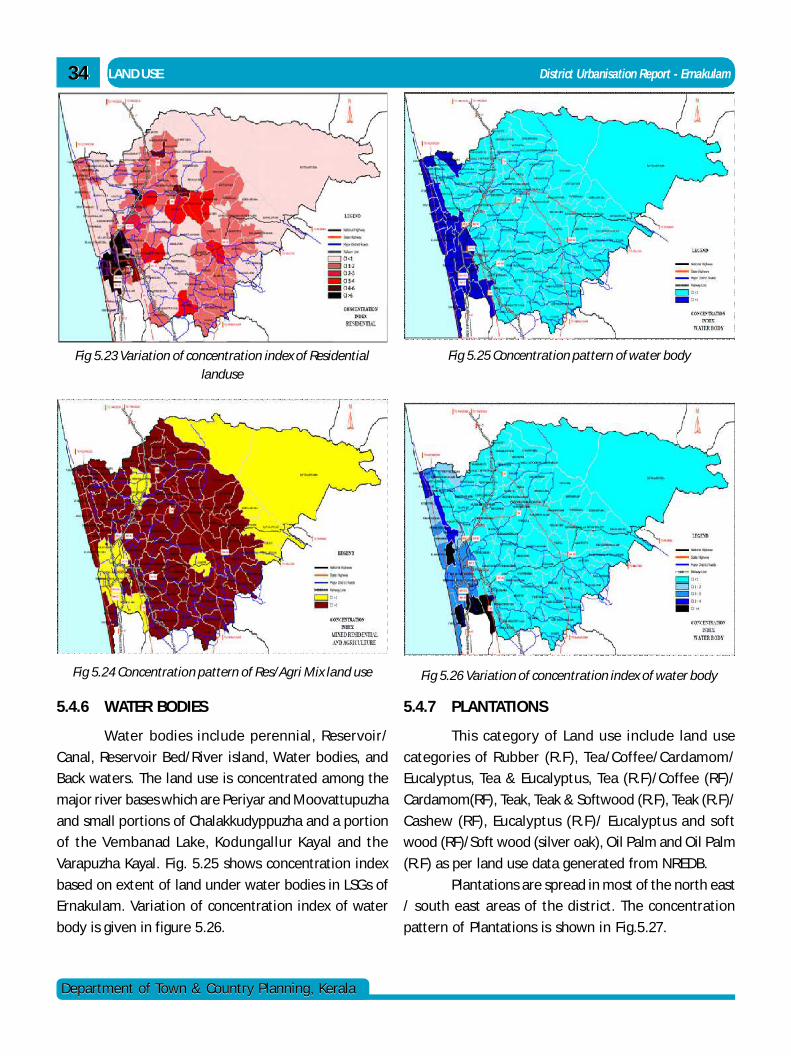
3434
Department of Town & Country Planning, KeralaDepartment of Town & Country Planning, Kerala
LAND USE District Urbanisation Report - Ernakulam
Fig 5.23 Variation of concentration index of Residentiallanduse
Fig 5.24 Concentration pattern of Res/Agri Mix land use
5.4.6 WATER BODIES
Water bodies include perennial, Reservoir/
Canal, Reservoir Bed/River island, Water bodies, and
Back waters. The land use is concentrated among the
major river bases which are Periyar and Moovattupuzha
and small portions of Chalakkudyppuzha and a portion
of the Vembanad Lake, Kodungallur Kayal and the
Varapuzha Kayal. Fig. 5.25 shows concentration index
based on extent of land under water bodies in LSGs of
Ernakulam. Variation of concentration index of water
body is given in figure 5.26.
Fig 5.25 Concentration pattern of water body
Fig 5.26 Variation of concentration index of water body
5.4.7 PLANTATIONS
This category of Land use include land use
categories of Rubber (R.F), Tea/Coffee/Cardamom/
Eucalyptus, Tea & Eucalyptus, Tea (R.F)/Coffee (RF)/
Cardamom(RF), Teak, Teak & Softwood (R.F), Teak (R.F)/
Cashew (RF), Eucalyptus (R.F)/ Eucalyptus and soft
wood (RF)/Soft wood (silver oak), Oil Palm and Oil Palm
(R.F) as per land use data generated from NREDB.
Plantations are spread in most of the north east
/ south east areas of the district. The concentration
pattern of Plantations is shown in Fig.5.27.
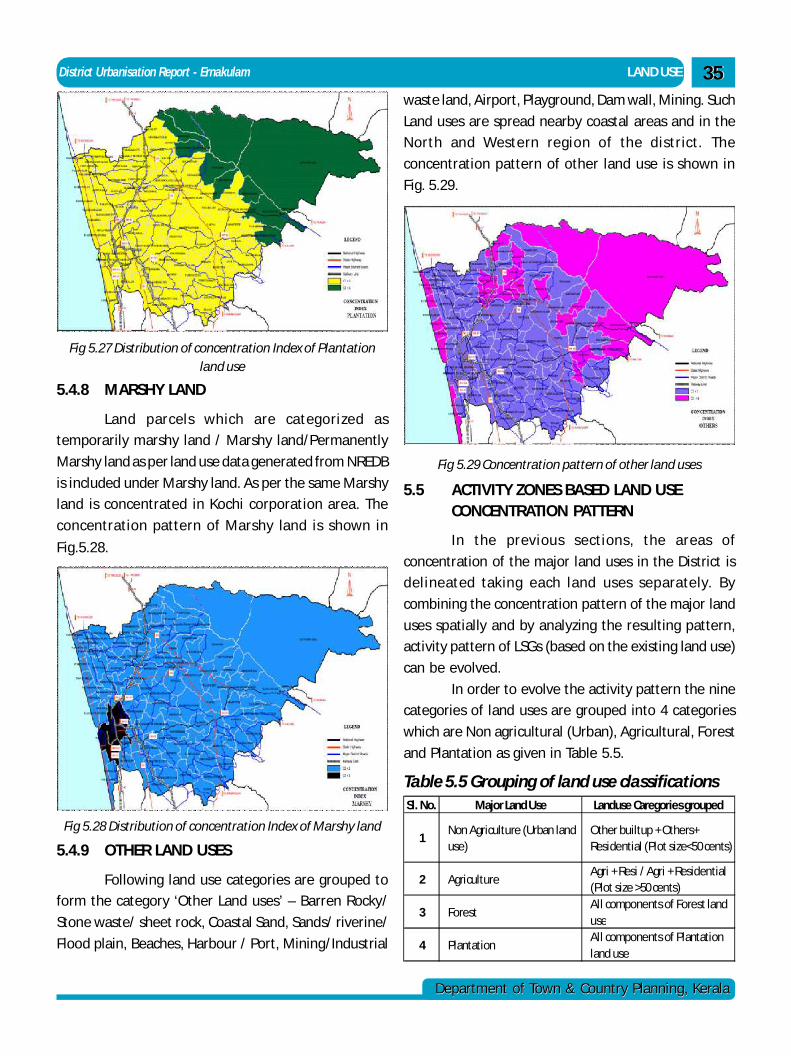
District Urbanisation Report - Ernakulam LAND USE
Department of Town & Country Planning, KeralaDepartment of Town & Country Planning, Kerala
3535
Fig 5.27 Distribution of concentration Index of Plantationland use
5.4.8 MARSHY LAND
Land parcels which are categorized as
temporarily marshy land / Marshy land/Permanently
Marshy land as per land use data generated from NREDB
is included under Marshy land. As per the same Marshy
land is concentrated in Kochi corporation area. The
concentration pattern of Marshy land is shown in
Fig.5.28.
Fig 5.28 Distribution of concentration Index of Marshy land
Fig 5.29 Concentration pattern of other land uses
5.4.9 OTHER LAND USES
Following land use categories are grouped to
form the category ‘Other Land uses’ – Barren Rocky/
Stone waste/ sheet rock, Coastal Sand, Sands/ riverine/
Flood plain, Beaches, Harbour / Port, Mining/Industrial
waste land, Airport, Playground, Dam wall, Mining. Such
Land uses are spread nearby coastal areas and in the
North and Western region of the district. The
concentration pattern of other land use is shown in
Fig. 5.29.
5.5 ACTIVITY ZONES BASED LAND USECONCENTRATION PATTERN
In the previous sections, the areas of
concentration of the major land uses in the District is
delineated taking each land uses separately. By
combining the concentration pattern of the major land
uses spatially and by analyzing the resulting pattern,
activity pattern of LSGs (based on the existing land use)
can be evolved.
In order to evolve the activity pattern the nine
categories of land uses are grouped into 4 categories
which are Non agricultural (Urban), Agricultural, Forest
and Plantation as given in Table 5.5.
Sl. No. Major Land Use Landuse Caregories grouped
1Non Agriculture (Urban land use)
Other builtup + Others+ Residential (Plot size<50 cents)
2 AgricultureAgri + Resi / Agri + Residential (Plot size >50 cents)
3 ForestAll components of Forest land use
4 PlantationAll components of Plantation land use
Table 5.5 Grouping of land use classifications
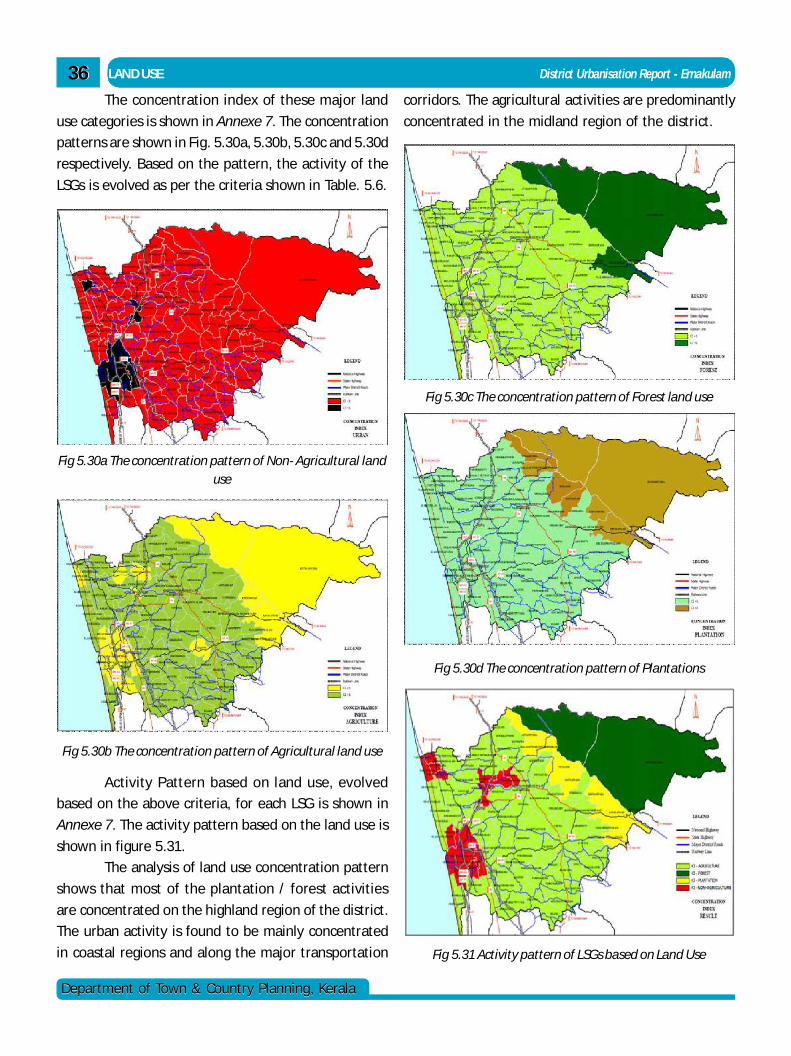
3636
Department of Town & Country Planning, KeralaDepartment of Town & Country Planning, Kerala
LAND USE District Urbanisation Report - Ernakulam
The concentration index of these major land
use categories is shown in Annexe 7. The concentration
patterns are shown in Fig. 5.30a, 5.30b, 5.30c and 5.30d
respectively. Based on the pattern, the activity of the
LSGs is evolved as per the criteria shown in Table. 5.6.
Fig 5.30a The concentration pattern of Non- Agricultural landuse
Fig 5.30b The concentration pattern of Agricultural land use
Fig 5.30c The concentration pattern of Forest land use
Activity Pattern based on land use, evolved
based on the above criteria, for each LSG is shown in
Annexe 7. The activity pattern based on the land use is
shown in figure 5.31.
The analysis of land use concentration pattern
shows that most of the plantation / forest activities
are concentrated on the highland region of the district.
The urban activity is found to be mainly concentrated
in coastal regions and along the major transportation
corridors. The agricultural activities are predominantly
concentrated in the midland region of the district.
Fig 5.30d The concentration pattern of Plantations
Fig 5.31 Activity pattern of LSGs based on Land Use
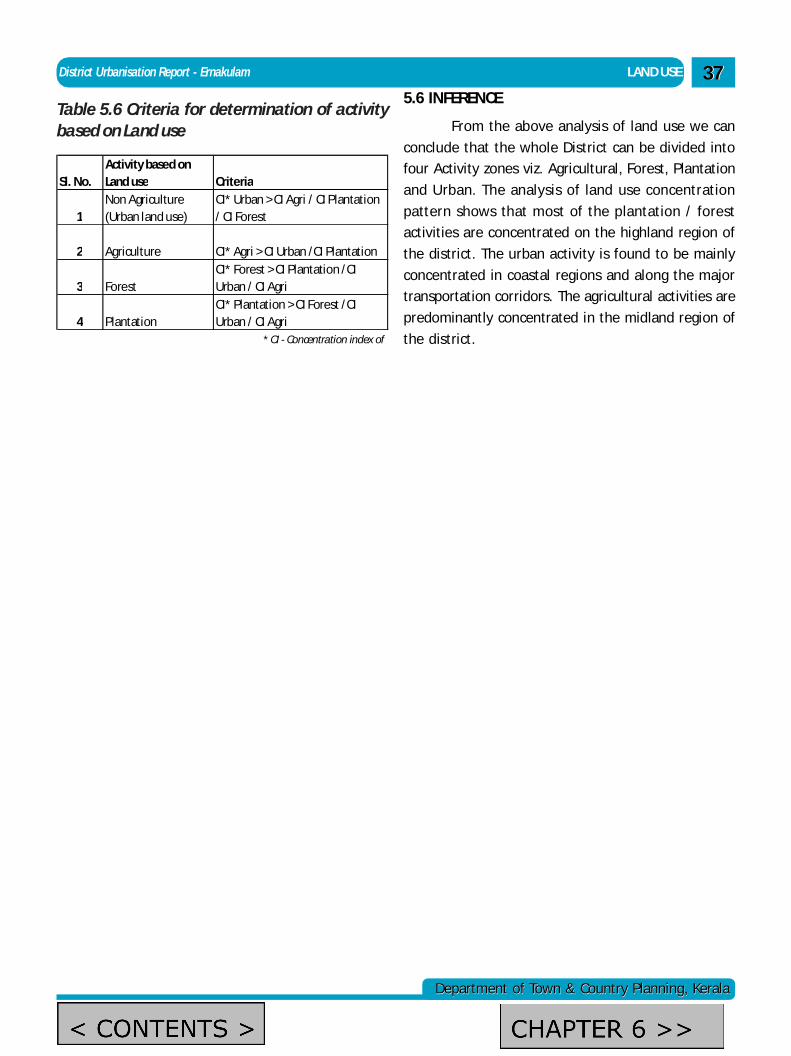
District Urbanisation Report - Ernakulam LAND USE
Department of Town & Country Planning, KeralaDepartment of Town & Country Planning, Kerala
3737
Table 5.6 Criteria for determination of activitybased on Land use
Sl. No.Activity based on Land use Criteria
1Non Agriculture (Urban land use)
CI* Urban > CI Agri / CI Plantation / CI Forest
2 Agriculture CI* Agri > CI Urban /CI Plantation
3 Forest CI* Forest > CI Plantation /CI Urban / CI Agri
4 Plantation CI* Plantation > CI Forest /CI Urban / CI Agri
* CI - Concentration index of
5.6 INFERENCE
From the above analysis of land use we can
conclude that the whole District can be divided into
four Activity zones viz. Agricultural, Forest, Plantation
and Urban. The analysis of land use concentration
pattern shows that most of the plantation / forest
activities are concentrated on the highland region of
the district. The urban activity is found to be mainly
concentrated in coastal regions and along the major
transportation corridors. The agricultural activities are
predominantly concentrated in the midland region of
the district.
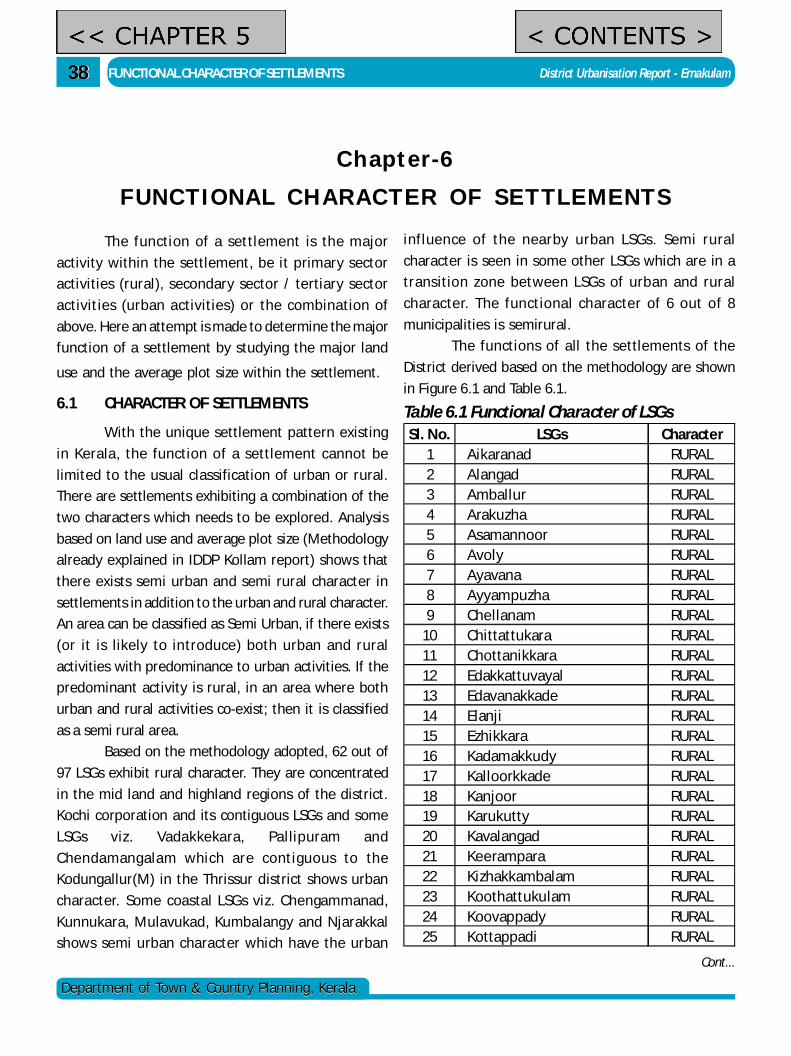
3838
Department of Town & Country Planning, KeralaDepartment of Town & Country Planning, Kerala
FUNCTIONAL CHARACTER OF SETTLEMENTS District Urbanisation Report - Ernakulam
Chapter-6FUNCTIONAL CHARACTER OF SETTLEMENTS
The function of a settlement is the major
activity within the settlement, be it primary sector
activities (rural), secondary sector / tertiary sector
activities (urban activities) or the combination of
above. Here an attempt is made to determine the major
function of a settlement by studying the major land
use and the average plot size within the settlement.
6.1 CHARACTER OF SETTLEMENTS
With the unique settlement pattern existing
in Kerala, the function of a settlement cannot be
limited to the usual classification of urban or rural.
There are settlements exhibiting a combination of the
two characters which needs to be explored. Analysis
based on land use and average plot size (Methodology
already explained in IDDP Kollam report) shows that
there exists semi urban and semi rural character in
settlements in addition to the urban and rural character.
An area can be classified as Semi Urban, if there exists
(or it is likely to introduce) both urban and rural
activities with predominance to urban activities. If the
predominant activity is rural, in an area where both
urban and rural activities co-exist; then it is classified
as a semi rural area.
Based on the methodology adopted, 62 out of
97 LSGs exhibit rural character. They are concentrated
in the mid land and highland regions of the district.
Kochi corporation and its contiguous LSGs and some
LSGs viz. Vadakkekara, Pallipuram and
Chendamangalam which are contiguous to the
Kodungallur(M) in the Thrissur district shows urban
character. Some coastal LSGs viz. Chengammanad,
Kunnukara, Mulavukad, Kumbalangy and Njarakkal
shows semi urban character which have the urban
influence of the nearby urban LSGs. Semi rural
character is seen in some other LSGs which are in a
transition zone between LSGs of urban and rural
character. The functional character of 6 out of 8
municipalities is semirural.
The functions of all the settlements of the
District derived based on the methodology are shown
in Figure 6.1 and Table 6.1.
Table 6.1 Functional Character of LSGs
Cont...
Sl. No. LSGs Character1 Aikaranad RURAL2 Alangad RURAL3 Amballur RURAL4 Arakuzha RURAL5 Asamannoor RURAL6 Avoly RURAL7 Ayavana RURAL8 Ayyampuzha RURAL9 Chellanam RURAL
10 Chittattukara RURAL11 Chottanikkara RURAL12 Edakkattuvayal RURAL13 Edavanakkade RURAL14 Elanji RURAL15 Ezhikkara RURAL16 Kadamakkudy RURAL17 Kalloorkkade RURAL18 Kanjoor RURAL19 Karukutty RURAL20 Kavalangad RURAL21 Keerampara RURAL22 Kizhakkambalam RURAL23 Koothattukulam RURAL24 Koovappady RURAL25 Kottappadi RURAL
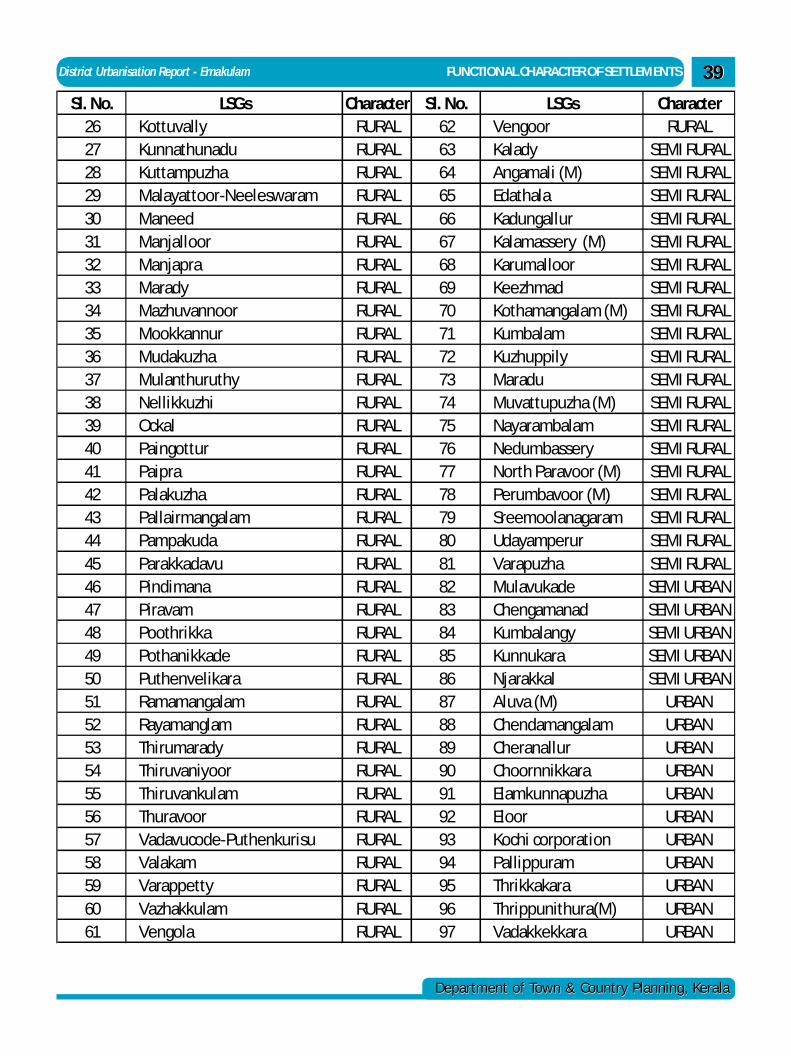
District Urbanisation Report - Ernakulam FUNCTIONAL CHARACTER OF SETTLEMENTS
Department of Town & Country Planning, KeralaDepartment of Town & Country Planning, Kerala
3939
Sl. No. LSGs Character Sl. No. LSGs Character26 Kottuvally RURAL 62 Vengoor RURAL27 Kunnathunadu RURAL 63 Kalady SEMI RURAL28 Kuttampuzha RURAL 64 Angamali (M) SEMI RURAL29 Malayattoor-Neeleswaram RURAL 65 Edathala SEMI RURAL30 Maneed RURAL 66 Kadungallur SEMI RURAL31 Manjalloor RURAL 67 Kalamassery (M) SEMI RURAL32 Manjapra RURAL 68 Karumalloor SEMI RURAL33 Marady RURAL 69 Keezhmad SEMI RURAL34 Mazhuvannoor RURAL 70 Kothamangalam (M) SEMI RURAL35 Mookkannur RURAL 71 Kumbalam SEMI RURAL36 Mudakuzha RURAL 72 Kuzhuppily SEMI RURAL37 Mulanthuruthy RURAL 73 Maradu SEMI RURAL38 Nellikkuzhi RURAL 74 Muvattupuzha (M) SEMI RURAL39 Ockal RURAL 75 Nayarambalam SEMI RURAL40 Paingottur RURAL 76 Nedumbassery SEMI RURAL41 Paipra RURAL 77 North Paravoor (M) SEMI RURAL42 Palakuzha RURAL 78 Perumbavoor (M) SEMI RURAL43 Pallairmangalam RURAL 79 Sreemoolanagaram SEMI RURAL44 Pampakuda RURAL 80 Udayamperur SEMI RURAL45 Parakkadavu RURAL 81 Varapuzha SEMI RURAL46 Pindimana RURAL 82 Mulavukade SEMI URBAN47 Piravam RURAL 83 Chengamanad SEMI URBAN48 Poothrikka RURAL 84 Kumbalangy SEMI URBAN49 Pothanikkade RURAL 85 Kunnukara SEMI URBAN50 Puthenvelikara RURAL 86 Njarakkal SEMI URBAN51 Ramamangalam RURAL 87 Aluva (M) URBAN52 Rayamanglam RURAL 88 Chendamangalam URBAN53 Thirumarady RURAL 89 Cheranallur URBAN54 Thiruvaniyoor RURAL 90 Choornnikkara URBAN55 Thiruvankulam RURAL 91 Elamkunnapuzha URBAN56 Thuravoor RURAL 92 Eloor URBAN57 Vadavucode-Puthenkurisu RURAL 93 Kochi corporation URBAN58 Valakam RURAL 94 Pallippuram URBAN59 Varappetty RURAL 95 Thrikkakara URBAN60 Vazhakkulam RURAL 96 Thrippunithura(M) URBAN61 Vengola RURAL 97 Vadakkekkara URBAN
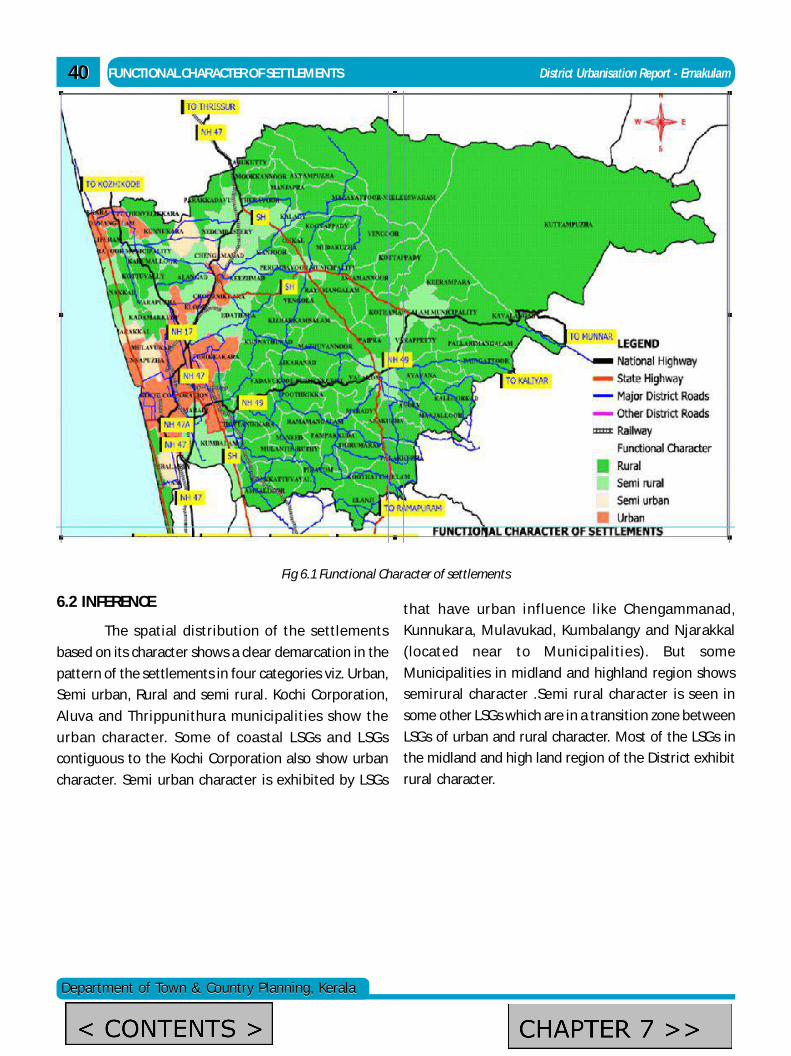
4040
Department of Town & Country Planning, KeralaDepartment of Town & Country Planning, Kerala
FUNCTIONAL CHARACTER OF SETTLEMENTS District Urbanisation Report - Ernakulam
Fig 6.1 Functional Character of settlements
6.2 INFERENCE
The spatial distribution of the settlements
based on its character shows a clear demarcation in the
pattern of the settlements in four categories viz. Urban,
Semi urban, Rural and semi rural. Kochi Corporation,
Aluva and Thrippunithura municipalities show the
urban character. Some of coastal LSGs and LSGs
contiguous to the Kochi Corporation also show urban
character. Semi urban character is exhibited by LSGs
that have urban influence like Chengammanad,
Kunnukara, Mulavukad, Kumbalangy and Njarakkal
(located near to Municipalities). But some
Municipalities in midland and highland region shows
semirural character .Semi rural character is seen in
some other LSGs which are in a transition zone between
LSGs of urban and rural character. Most of the LSGs in
the midland and high land region of the District exhibit
rural character.
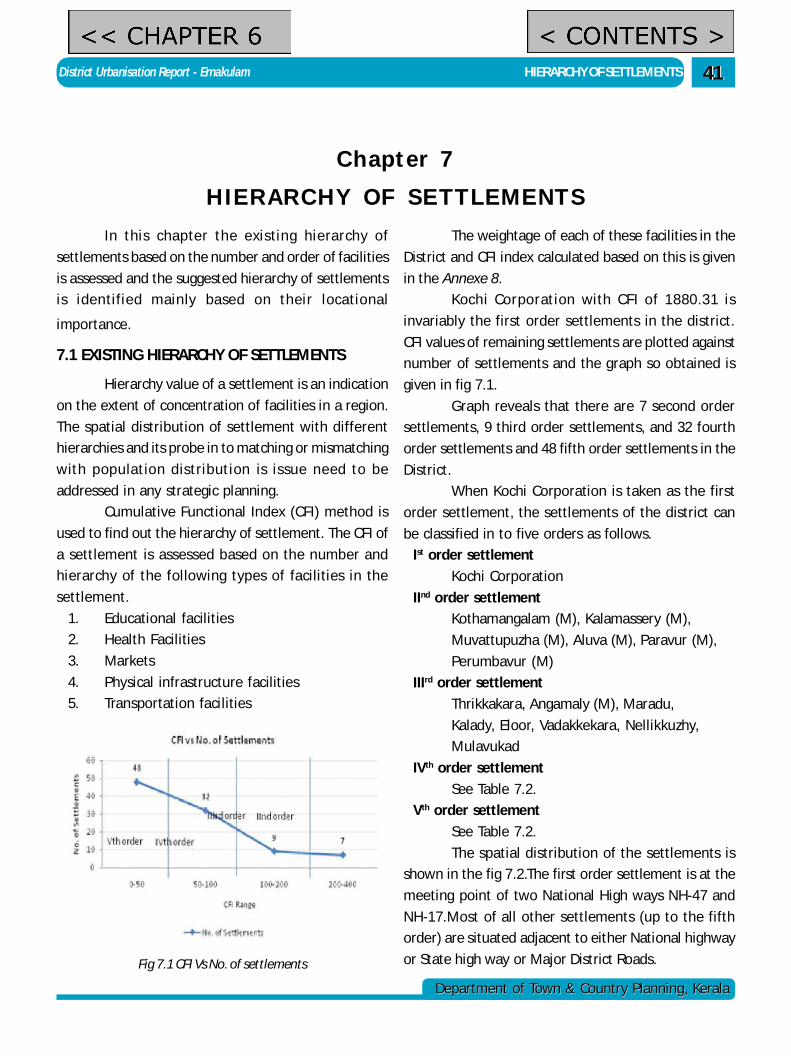
District Urbanisation Report - Ernakulam HIERARCHY OF SETTLEMENTS
Department of Town & Country Planning, KeralaDepartment of Town & Country Planning, Kerala
4141
Fig 7.1 CFI Vs No. of settlements
Chapter 7HIERARCHY OF SETTLEMENTS
In this chapter the existing hierarchy of
settlements based on the number and order of facilities
is assessed and the suggested hierarchy of settlements
is identified mainly based on their locational
importance.
7.1 EXISTING HIERARCHY OF SETTLEMENTS
Hierarchy value of a settlement is an indication
on the extent of concentration of facilities in a region.
The spatial distribution of settlement with different
hierarchies and its probe in to matching or mismatching
with population distribution is issue need to be
addressed in any strategic planning.
Cumulative Functional Index (CFI) method is
used to find out the hierarchy of settlement. The CFI of
a settlement is assessed based on the number and
hierarchy of the following types of facilities in the
settlement.
1. Educational facilities
2. Health Facilities
3. Markets
4. Physical infrastructure facilities
5. Transportation facilities
The weightage of each of these facilities in the
District and CFI index calculated based on this is given
in the Annexe 8.
Kochi Corporation with CFI of 1880.31 is
invariably the first order settlements in the district.
CFI values of remaining settlements are plotted against
number of settlements and the graph so obtained is
given in fig 7.1.
Graph reveals that there are 7 second order
settlements, 9 third order settlements, and 32 fourth
order settlements and 48 fifth order settlements in the
District.
When Kochi Corporation is taken as the first
order settlement, the settlements of the district can
be classified in to five orders as follows.
Ist order settlement
Kochi Corporation
IInd order settlement
Kothamangalam (M), Kalamassery (M),
Muvattupuzha (M), Aluva (M), Paravur (M),
Perumbavur (M)
IIIrd order settlement
Thrikkakara, Angamaly (M), Maradu,
Kalady, Eloor, Vadakkekara, Nellikkuzhy,
Mulavukad
IVth order settlement
See Table 7.2.
Vth order settlement
See Table 7.2.
The spatial distribution of the settlements is
shown in the fig 7.2.The first order settlement is at the
meeting point of two National High ways NH-47 and
NH-17.Most of all other settlements (up to the fifth
order) are situated adjacent to either National highway
or State high way or Major District Roads.
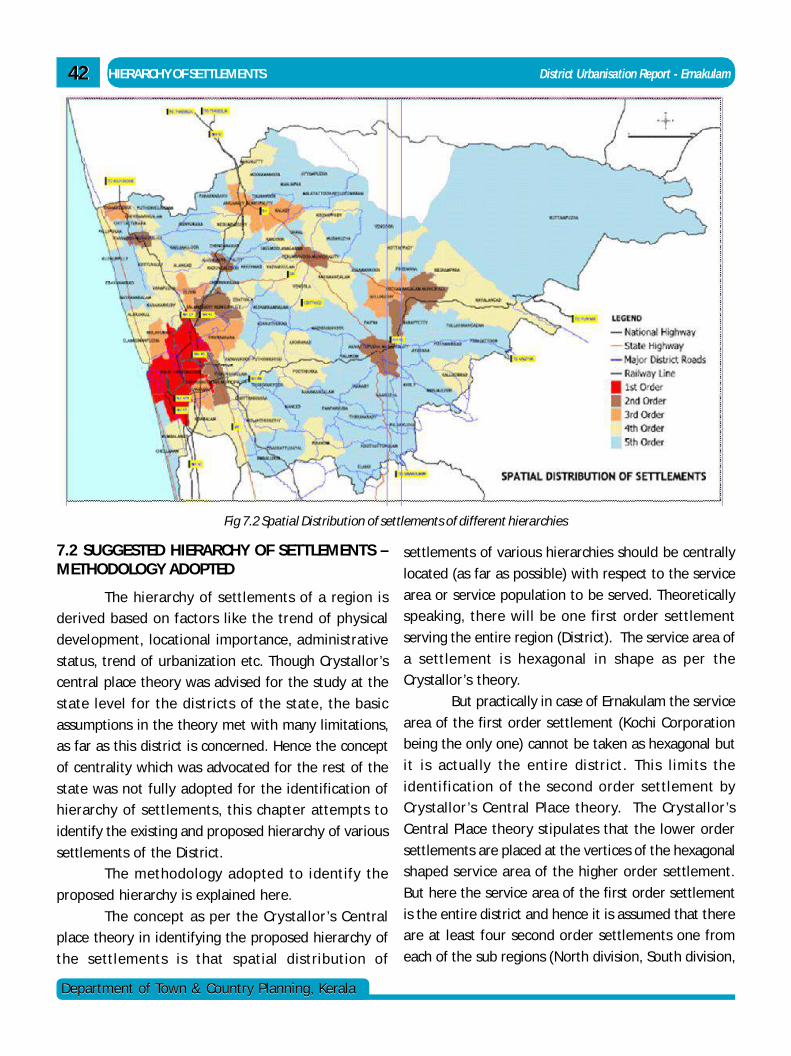
4242
Department of Town & Country Planning, KeralaDepartment of Town & Country Planning, Kerala
HIERARCHY OF SETTLEMENTS District Urbanisation Report - Ernakulam
Fig 7.2 Spatial Distribution of settlements of different hierarchies
7.2 SUGGESTED HIERARCHY OF SETTLEMENTS –METHODOLOGY ADOPTED
The hierarchy of settlements of a region is
derived based on factors like the trend of physical
development, locational importance, administrative
status, trend of urbanization etc. Though Crystallor’s
central place theory was advised for the study at the
state level for the districts of the state, the basic
assumptions in the theory met with many limitations,
as far as this district is concerned. Hence the concept
of centrality which was advocated for the rest of the
state was not fully adopted for the identification of
hierarchy of settlements, this chapter attempts to
identify the existing and proposed hierarchy of various
settlements of the District.
The methodology adopted to identify the
proposed hierarchy is explained here.
The concept as per the Crystallor’s Central
place theory in identifying the proposed hierarchy of
the settlements is that spatial distribution of
settlements of various hierarchies should be centrally
located (as far as possible) with respect to the service
area or service population to be served. Theoretically
speaking, there will be one first order settlement
serving the entire region (District). The service area of
a settlement is hexagonal in shape as per the
Crystallor’s theory.
But practically in case of Ernakulam the service
area of the first order settlement (Kochi Corporation
being the only one) cannot be taken as hexagonal but
it is actually the entire district. This l imits the
identification of the second order settlement by
Crystallor’s Central Place theory. The Crystallor’s
Central Place theory stipulates that the lower order
settlements are placed at the vertices of the hexagonal
shaped service area of the higher order settlement.
But here the service area of the first order settlement
is the entire district and hence it is assumed that there
are at least four second order settlements one from
each of the sub regions (North division, South division,
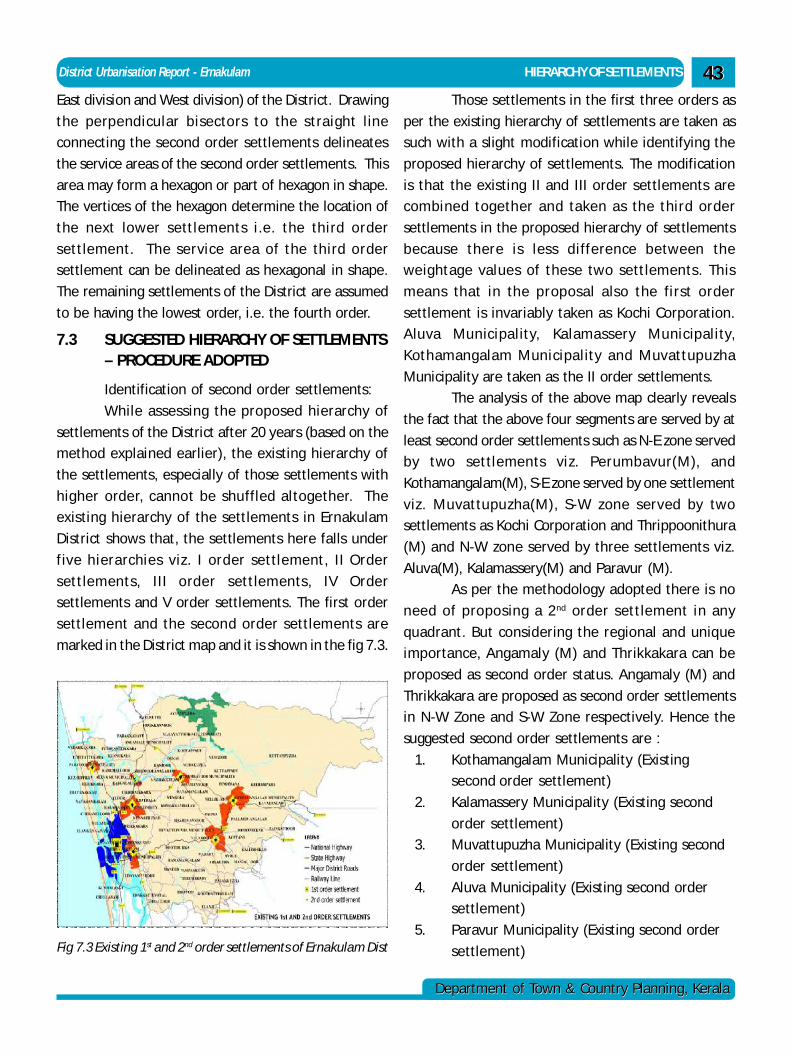
District Urbanisation Report - Ernakulam HIERARCHY OF SETTLEMENTS
Department of Town & Country Planning, KeralaDepartment of Town & Country Planning, Kerala
4343East division and West division) of the District. Drawing
the perpendicular bisectors to the straight l ine
connecting the second order settlements delineates
the service areas of the second order settlements. This
area may form a hexagon or part of hexagon in shape.
The vertices of the hexagon determine the location of
the next lower settlements i.e. the third order
settlement. The service area of the third order
settlement can be delineated as hexagonal in shape.
The remaining settlements of the District are assumed
to be having the lowest order, i.e. the fourth order.
7.3 SUGGESTED HIERARCHY OF SETTLEMENTS– PROCEDURE ADOPTED
Identification of second order settlements:
While assessing the proposed hierarchy of
settlements of the District after 20 years (based on the
method explained earlier), the existing hierarchy of
the settlements, especially of those settlements with
higher order, cannot be shuffled altogether. The
existing hierarchy of the settlements in Ernakulam
District shows that, the settlements here falls under
five hierarchies viz. I order settlement, II Order
settlements, III order settlements, IV Order
settlements and V order settlements. The first order
settlement and the second order settlements are
marked in the District map and it is shown in the fig 7.3.
Those settlements in the first three orders as
per the existing hierarchy of settlements are taken as
such with a slight modification while identifying the
proposed hierarchy of settlements. The modification
is that the existing II and III order settlements are
combined together and taken as the third order
settlements in the proposed hierarchy of settlements
because there is less difference between the
weightage values of these two settlements. This
means that in the proposal also the first order
settlement is invariably taken as Kochi Corporation.
Aluva Municipality, Kalamassery Municipality,
Kothamangalam Municipality and Muvattupuzha
Municipality are taken as the II order settlements.
The analysis of the above map clearly reveals
the fact that the above four segments are served by at
least second order settlements such as N-E zone served
by two settlements viz. Perumbavur(M), and
Kothamangalam(M), S-E zone served by one settlement
viz. Muvattupuzha(M), S-W zone served by two
settlements as Kochi Corporation and Thrippoonithura
(M) and N-W zone served by three settlements viz.
Aluva(M), Kalamassery(M) and Paravur (M).
As per the methodology adopted there is no
need of proposing a 2nd order settlement in any
quadrant. But considering the regional and unique
importance, Angamaly (M) and Thrikkakara can be
proposed as second order status. Angamaly (M) and
Thrikkakara are proposed as second order settlements
in N-W Zone and S-W Zone respectively. Hence the
suggested second order settlements are :
1. Kothamangalam Municipality (Existing
second order settlement)
2. Kalamassery Municipality (Existing second
order settlement)
3. Muvattupuzha Municipality (Existing second
order settlement)
4. Aluva Municipality (Existing second order
settlement)
5. Paravur Municipality (Existing second order
settlement)Fig 7.3 Existing 1st and 2nd order settlements of Ernakulam Dist
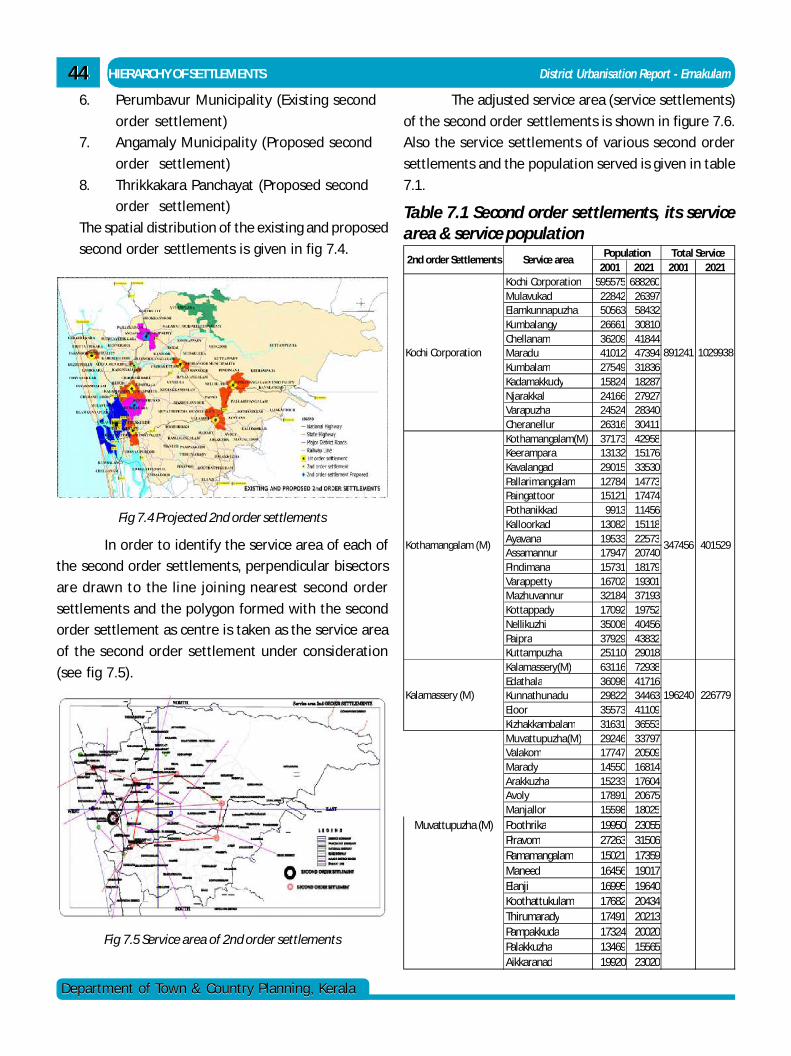
4444
Department of Town & Country Planning, KeralaDepartment of Town & Country Planning, Kerala
HIERARCHY OF SETTLEMENTS District Urbanisation Report - Ernakulam
Fig 7.4 Projected 2nd order settlements
Fig 7.5 Service area of 2nd order settlements
6. Perumbavur Municipality (Existing second
order settlement)
7. Angamaly Municipality (Proposed second
order settlement)
8. Thrikkakara Panchayat (Proposed second
order settlement)
The spatial distribution of the existing and proposed
second order settlements is given in fig 7.4.
In order to identify the service area of each of
the second order settlements, perpendicular bisectors
are drawn to the line joining nearest second order
settlements and the polygon formed with the second
order settlement as centre is taken as the service area
of the second order settlement under consideration
(see fig 7.5).
The adjusted service area (service settlements)
of the second order settlements is shown in figure 7.6.
Also the service settlements of various second order
settlements and the population served is given in table
7.1.
Table 7.1 Second order settlements, its servicearea & service population
2001 2021 2001 2021Kochi Corporation 595575 688260Mulavukad 22842 26397Elamkunnapuzha 50563 58432Kumbalangy 26661 30810Chellanam 36209 41844Maradu 41012 47394Kumbalam 27549 31836Kadamakkudy 15824 18287Njarakkal 24166 27927Varapuzha 24524 28340Cheranellur 26316 30411Kothamangalam(M) 37173 42958Keerampara 13132 15176Kavalangad 29015 33530Pallarimangalam 12784 14773Paingattoor 15121 17474Pothanikkad 9913 11456Kalloorkad 13082 15118Ayavana 19533 22573Assamannur 17947 20740Pindimana 15731 18179Varappetty 16702 19301Mazhuvannur 32184 37193Kottappady 17092 19752Nellikuzhi 35008 40456Paipra 37929 43832Kuttampuzha 25110 29018Kalamassery(M) 63116 72938Edathala 36098 41716Kunnathunadu 29822 34463Eloor 35573 41109Kizhakkambalam 31631 36553Muvattupuzha(M) 29246 33797Valakom 17747 20509Marady 14550 16814Arakkuzha 15233 17604Avoly 17891 20675Manjallor 15598 18025
Kothamangalam (M) 347456 401529
Kalamassery (M) 196240 226779
2nd order Settlements Service areaPopulation Total Service
Kochi Corporation 891241 1029938
Poothrika 19950 23055Piravom 27263 31506Ramamangalam 15021 17359Maneed 16456 19017Elanji 16995 19640Koothattukulam 17682 20434Thirumarady 17491 20213Pampakkuda 17324 20020Palakkuzha 13469 15565Aikkaranad 19920 23020
Muvattupuzha (M)
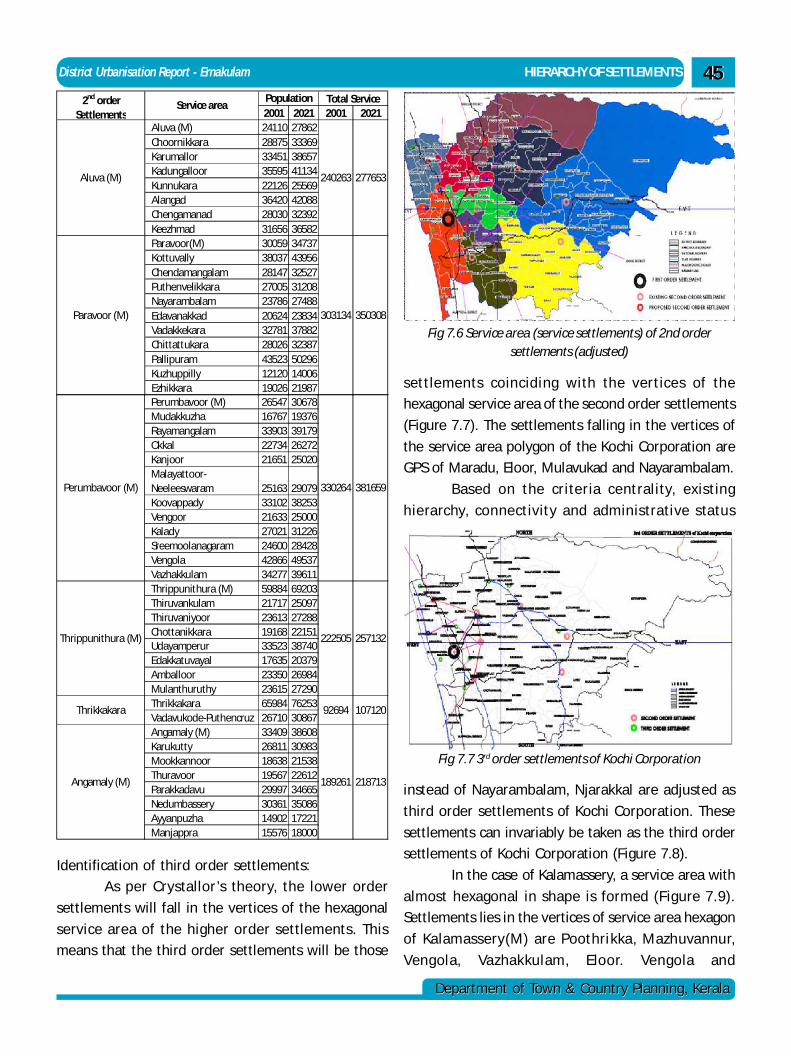
District Urbanisation Report - Ernakulam HIERARCHY OF SETTLEMENTS
Department of Town & Country Planning, KeralaDepartment of Town & Country Planning, Kerala
4545
Perumbavoor (M) 26547 30678Mudakkuzha 16767 19376Rayamangalam 33903 39179Okkal 22734 26272Kanjoor 21651 25020Malayattoor-Neeleeswaram 25163 29079Koovappady 33102 38253Vengoor 21633 25000Kalady 27021 31226Sreemoolanagaram 24600 28428Vengola 42866 49537Vazhakkulam 34277 39611Thrippunithura (M) 59884 69203Thiruvankulam 21717 25097Thiruvaniyoor 23613 27288Chottanikkara 19168 22151Udayamperur 33523 38740Edakkatuvayal 17635 20379Amballoor 23350 26984Mulanthuruthy 23615 27290Thrikkakara 65984 76253Vadavukode-Puthencruz 26710 30867Angamaly (M) 33409 38608Karukutty 26811 30983Mookkannoor 18638 21538Thuravoor 19567 22612Parakkadavu 29997 34665Nedumbassery 30361 35086Ayyanpuzha 14902 17221Manjappra 15576 18000
Perumbavoor (M) 330264 381659
Angamaly (M) 189261 218713
Thrippunithura (M) 222505 257132
Thrikkakara 92694 107120
2001 2021 2001 2021Aluva (M) 24110 27862Choornikkara 28875 33369Karumallor 33451 38657Kadungalloor 35595 41134Kunnukara 22126 25569Alangad 36420 42088Chengamanad 28030 32392Keezhmad 31656 36582Paravoor(M) 30059 34737Kottuvally 38037 43956Chendamangalam 28147 32527Puthenvelikkara 27005 31208Nayarambalam 23786 27488Edavanakkad 20624 23834Vadakkekara 32781 37882Chittattukara 28026 32387Pallipuram 43523 50296Kuzhuppilly 12120 14006Ezhikkara 19026 21987
Paravoor (M) 303134 350308
2nd order Settlements
Service areaPopulation Total Service
Aluva (M) 240263 277653
Identification of third order settlements:
As per Crystallor’s theory, the lower order
settlements will fall in the vertices of the hexagonal
service area of the higher order settlements. This
means that the third order settlements will be those
settlements coinciding with the vertices of the
hexagonal service area of the second order settlements
(Figure 7.7). The settlements falling in the vertices of
the service area polygon of the Kochi Corporation are
GPS of Maradu, Eloor, Mulavukad and Nayarambalam.
Based on the criteria centrality, existing
hierarchy, connectivity and administrative status
Fig 7.6 Service area (service settlements) of 2nd ordersettlements (adjusted)
Fig 7.7 3rd order settlements of Kochi Corporation
instead of Nayarambalam, Njarakkal are adjusted as
third order settlements of Kochi Corporation. These
settlements can invariably be taken as the third order
settlements of Kochi Corporation (Figure 7.8).
In the case of Kalamassery, a service area with
almost hexagonal in shape is formed (Figure 7.9).
Settlements lies in the vertices of service area hexagon
of Kalamassery(M) are Poothrikka, Mazhuvannur,
Vengola, Vazhakkulam, Eloor. Vengola and
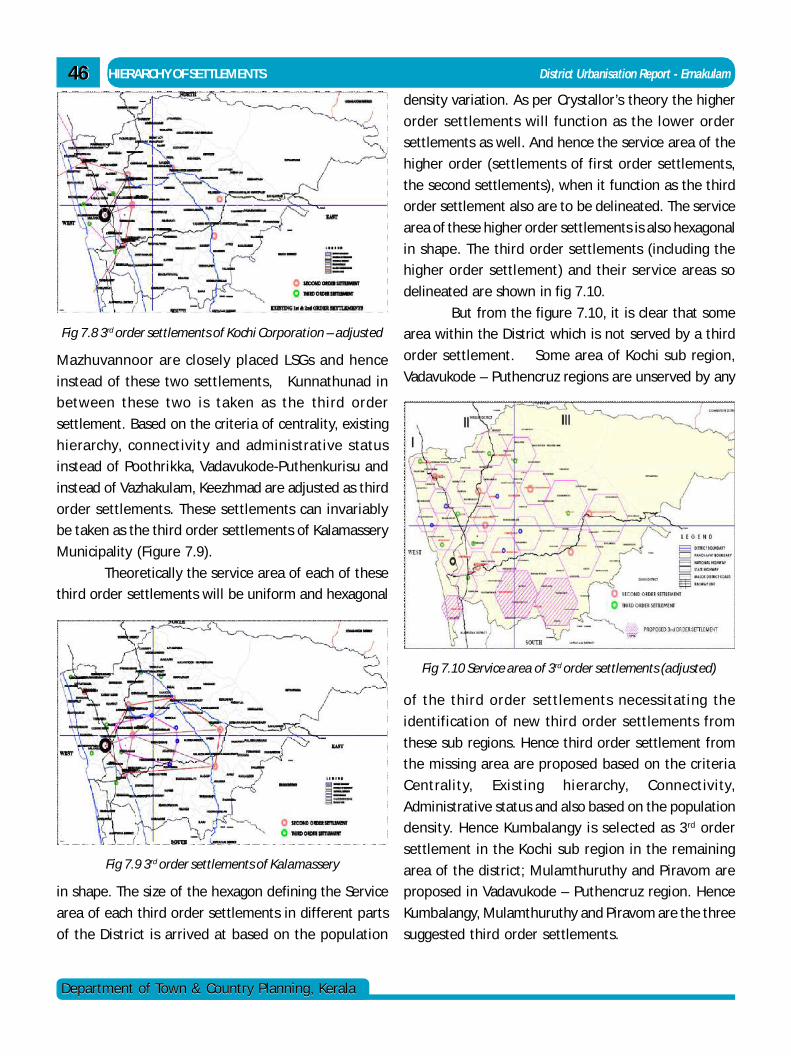
4646
Department of Town & Country Planning, KeralaDepartment of Town & Country Planning, Kerala
HIERARCHY OF SETTLEMENTS District Urbanisation Report - Ernakulam
Mazhuvannoor are closely placed LSGs and hence
instead of these two settlements, Kunnathunad in
between these two is taken as the third order
settlement. Based on the criteria of centrality, existing
hierarchy, connectivity and administrative status
instead of Poothrikka, Vadavukode-Puthenkurisu and
instead of Vazhakulam, Keezhmad are adjusted as third
order settlements. These settlements can invariably
be taken as the third order settlements of Kalamassery
Municipality (Figure 7.9).
Theoretically the service area of each of these
third order settlements will be uniform and hexagonal
density variation. As per Crystallor’s theory the higher
order settlements will function as the lower order
settlements as well. And hence the service area of the
higher order (settlements of first order settlements,
the second settlements), when it function as the third
order settlement also are to be delineated. The service
area of these higher order settlements is also hexagonal
in shape. The third order settlements (including the
higher order settlement) and their service areas so
delineated are shown in fig 7.10.
But from the figure 7.10, it is clear that some
area within the District which is not served by a third
order settlement. Some area of Kochi sub region,
Vadavukode – Puthencruz regions are unserved by any
Fig 7.9 3rd order settlements of Kalamassery
Fig 7.10 Service area of 3rd order settlements (adjusted)
Fig 7.8 3rd order settlements of Kochi Corporation – adjusted
in shape. The size of the hexagon defining the Service
area of each third order settlements in different parts
of the District is arrived at based on the population
of the third order settlements necessitating the
identification of new third order settlements from
these sub regions. Hence third order settlement from
the missing area are proposed based on the criteria
Centrality, Existing hierarchy, Connectivity,
Administrative status and also based on the population
density. Hence Kumbalangy is selected as 3rd order
settlement in the Kochi sub region in the remaining
area of the district; Mulamthuruthy and Piravom are
proposed in Vadavukode – Puthencruz region. Hence
Kumbalangy, Mulamthuruthy and Piravom are the three
suggested third order settlements.
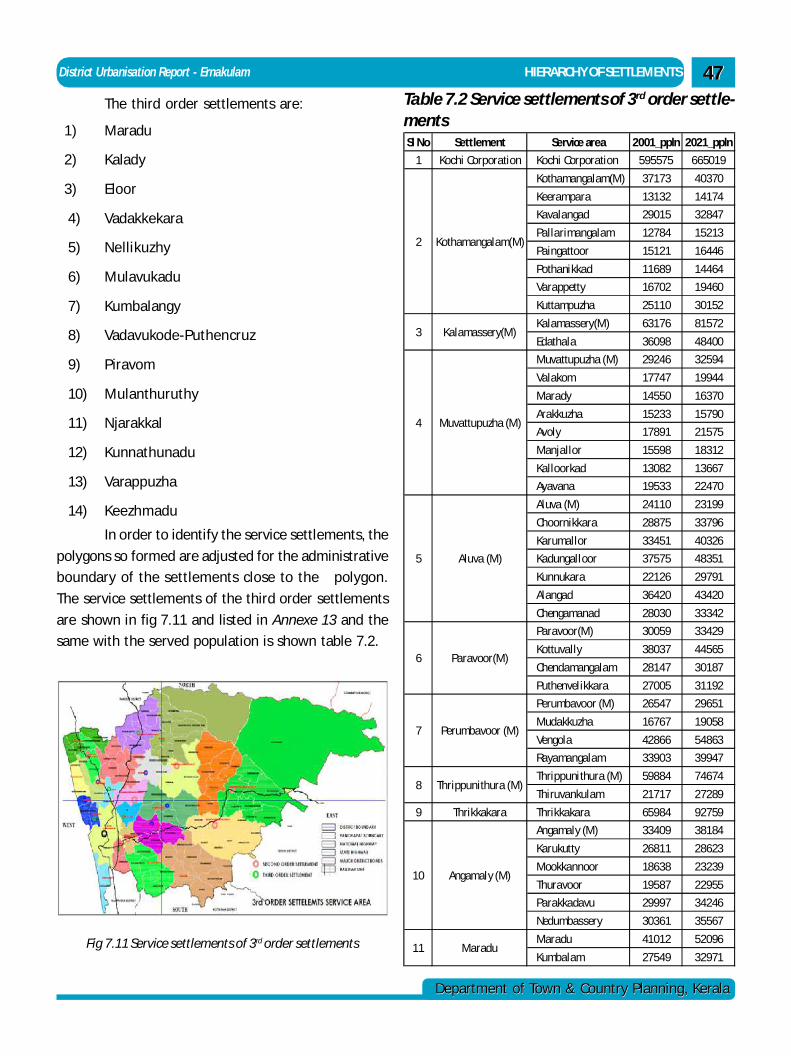
District Urbanisation Report - Ernakulam HIERARCHY OF SETTLEMENTS
Department of Town & Country Planning, KeralaDepartment of Town & Country Planning, Kerala
4747
The third order settlements are:
1) Maradu
2) Kalady
3) Eloor
4) Vadakkekara
5) Nellikuzhy
6) Mulavukadu
7) Kumbalangy
8) Vadavukode-Puthencruz
9) Piravom
10) Mulanthuruthy
11) Njarakkal
12) Kunnathunadu
13) Varappuzha
14) Keezhmadu
In order to identify the service settlements, the
polygons so formed are adjusted for the administrative
boundary of the settlements close to the polygon.
The service settlements of the third order settlements
are shown in fig 7.11 and listed in Annexe 13 and the
same with the served population is shown table 7.2.
Fig 7.11 Service settlements of 3rd order settlements
Table 7.2 Service settlements of 3rd order settle-mentsSl No Settlement Service area 2001_ppln 2021_ppln
1 Kochi Corporation Kochi Corporation 595575 665019
Kothamangalam(M) 37173 40370
Keerampara 13132 14174
Kavalangad 29015 32847
Pallarimangalam 12784 15213
Paingattoor 15121 16446
Pothanikkad 11689 14464
Varappetty 16702 19460
Kuttampuzha 25110 30152
Kalamassery(M) 63176 81572
Edathala 36098 48400
Muvattupuzha (M) 29246 32594
Valakom 17747 19944
Marady 14550 16370
Arakkuzha 15233 15790
Avoly 17891 21575
Manjallor 15598 18312
Kalloorkad 13082 13667
Ayavana 19533 22470
Aluva (M) 24110 23199
Choornikkara 28875 33796
Karumallor 33451 40326
Kadungalloor 37575 48351
Kunnukara 22126 29791
Alangad 36420 43420
Chengamanad 28030 33342
Paravoor(M) 30059 33429
Kottuvally 38037 44565
Chendamangalam 28147 30187
Puthenvelikkara 27005 31192
Perumbavoor (M) 26547 29651
Mudakkuzha 16767 19058
Vengola 42866 54863
Rayamangalam 33903 39947
Thrippunithura (M) 59884 74674
Thiruvankulam 21717 27289
9 Thrikkakara Thrikkakara 65984 92759
Angamaly (M) 33409 38184
Karukutty 26811 28623
Mookkannoor 18638 23239
Thuravoor 19587 22955
Parakkadavu 29997 34246
Nedumbassery 30361 35567
Maradu 41012 52096
Kumbalam 27549 32971
8 Thrippunithura (M)
10 Angamaly (M)
11 Maradu
5 Aluva (M)
6 Paravoor(M)
7 Perumbavoor (M)
Kothamangalam(M)2
3 Kalamassery(M)
4 Muvattupuzha (M)
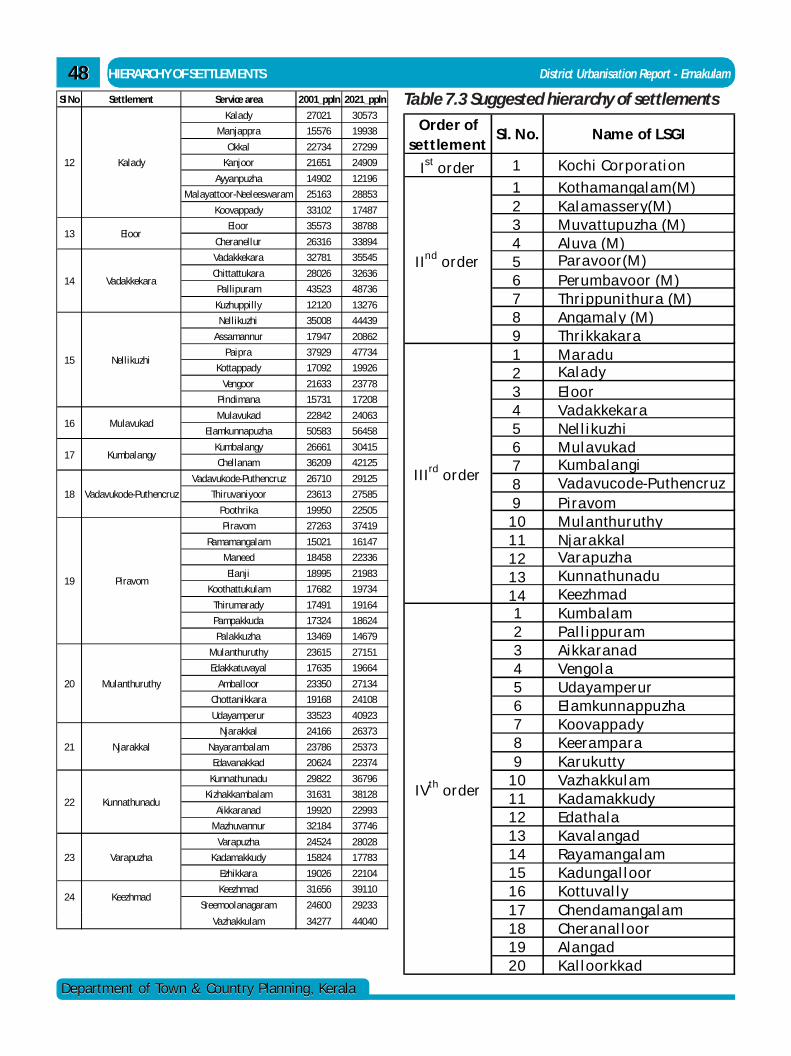
4848
Department of Town & Country Planning, KeralaDepartment of Town & Country Planning, Kerala
HIERARCHY OF SETTLEMENTS District Urbanisation Report - Ernakulam
Sl No Settlement Service area 2001_ppln 2021_ppln
Kalady 27021 30573
Manjappra 15576 19938
Okkal 22734 27299
Kanjoor 21651 24909
Ayyanpuzha 14902 12196
Malayattoor-Neeleeswaram 25163 28853
Koovappady 33102 17487
Eloor 35573 38788
Cheranellur 26316 33894
Vadakkekara 32781 35545
Chittattukara 28026 32636
Pallipuram 43523 48736
Kuzhuppilly 12120 13276
Nellikuzhi 35008 44439
Assamannur 17947 20862
Paipra 37929 47734
Kottappady 17092 19926
Vengoor 21633 23778
Pindimana 15731 17208
Mulavukad 22842 24063
Elamkunnapuzha 50583 56458
Kumbalangy 26661 30415
Chellanam 36209 42125
Vadavukode-Puthencruz 26710 29125
Thiruvaniyoor 23613 27585
Poothrika 19950 22505
Piravom 27263 37419
Ramamangalam 15021 16147
Maneed 18458 22336
Elanji 18995 21983
Koothattukulam 17682 19734
Thirumarady 17491 19164
Pampakkuda 17324 18624
Palakkuzha 13469 14679
Mulanthuruthy 23615 27151
Edakkatuvayal 17635 19664
Amballoor 23350 27134
Chottanikkara 19168 24108
Udayamperur 33523 40923
Njarakkal 24166 26373
Nayarambalam 23786 25373
Edavanakkad 20624 22374
Kunnathunadu 29822 36796
Kizhakkambalam 31631 38128
Aikkaranad 19920 22993
Mazhuvannur 32184 37746
Varapuzha 24524 28028
Kadamakkudy 15824 17783
Ezhikkara 19026 22104
Keezhmad 31656 39110
Sreemoolanagaram 24600 29233
12 Kalady
13 Eloor
14 Vadakkekara
15 Nellikuzhi
16 Mulavukad
17 Kumbalangy
18 Vadavukode-Puthencruz
19 Piravom
20 Mulanthuruthy
24 Keezhmad
21 Njarakkal
22 Kunnathunadu
23 Varapuzha
Vazhakkulam 34277 44040
Order of settlement
Sl. No. Nam e of LSGI
Ist order 1 Kochi Corporation
1 Kothamangalam(M)2 Kalamas s ery(M)3 Muvattupuzha (M)4 Aluva (M)5 Paravoor(M)6 Perumbavoor (M)7 Thrippuni thura (M)8 Angamaly (M)9 Thrikkakara1 Maradu2 Kalady3 Eloor4 Vadakkekara5 Nel l i kuzhi6 Mulavukad7 Kumbalangi8 Vadavucode-Puthencruz9 Piravom
10 Mulanthuruthy11 Njarakka l12 Varapuzha13 Kunnathunadu14 Keezhmad1 Kumbalam2 Pal l ippuram3 Aikkaranad4 Vengola5 Udayamperur6 Elamkunnappuzha7 Koovappady8 Keerampara9 Karukutty
10 Vazhakkulam11 Kadamakkudy12 Edatha la13 Kava langad14 Rayamanga lam15 Kadunga l loor16 Kottuval ly17 Chendamanga lam18 Cheranal loor19 Alangad20 Kal loorkkad
IInd order
II Ird order
IVth order
Table 7.3 Suggested hierarchy of settlements
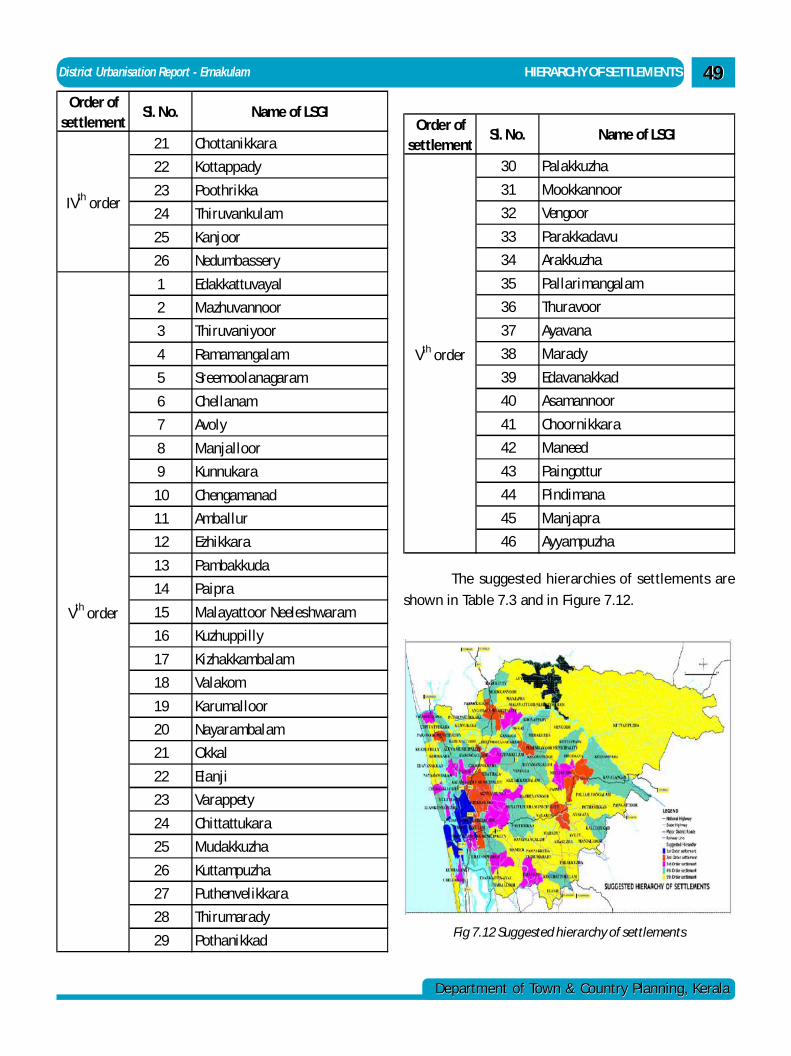
District Urbanisation Report - Ernakulam HIERARCHY OF SETTLEMENTS
Department of Town & Country Planning, KeralaDepartment of Town & Country Planning, Kerala
4949Order of
settlementSl. No. Name of LSGI
21 Chottanikkara
22 Kottappady
23 Poothrikka
24 Thiruvankulam
25 Kanjoor
26 Nedumbassery
1 Edakkattuvayal
2 Mazhuvannoor
3 Thiruvaniyoor
4 Ramamangalam
5 Sreemoolanagaram
6 Chellanam
7 Avoly
8 Manjalloor
9 Kunnukara
10 Chengamanad
11 Amballur
12 Ezhikkara
13 Pambakkuda
14 Paipra
15 Malayattoor Neeleshwaram
16 Kuzhuppilly
17 Kizhakkambalam
18 Valakom
19 Karumalloor
20 Nayarambalam
21 Okkal
22 Elanji
23 Varappety
24 Chittattukara
25 Mudakkuzha
26 Kuttampuzha
27 Puthenvelikkara
28 Thirumarady
29 Pothanikkad
IVth order
Vth order
Order of settlement
Sl. No. Name of LSGI
30 Palakkuzha
31 Mookkannoor
32 Vengoor
33 Parakkadavu
34 Arakkuzha
35 Pallarimangalam
36 Thuravoor
37 Ayavana
38 Marady
39 Edavanakkad
40 Asamannoor
41 Choornikkara
42 Maneed
43 Paingottur
44 Pindimana
45 Manjapra
46 Ayyampuzha
Vth order
The suggested hierarchies of settlements are
shown in Table 7.3 and in Figure 7.12.
Fig 7.12 Suggested hierarchy of settlements
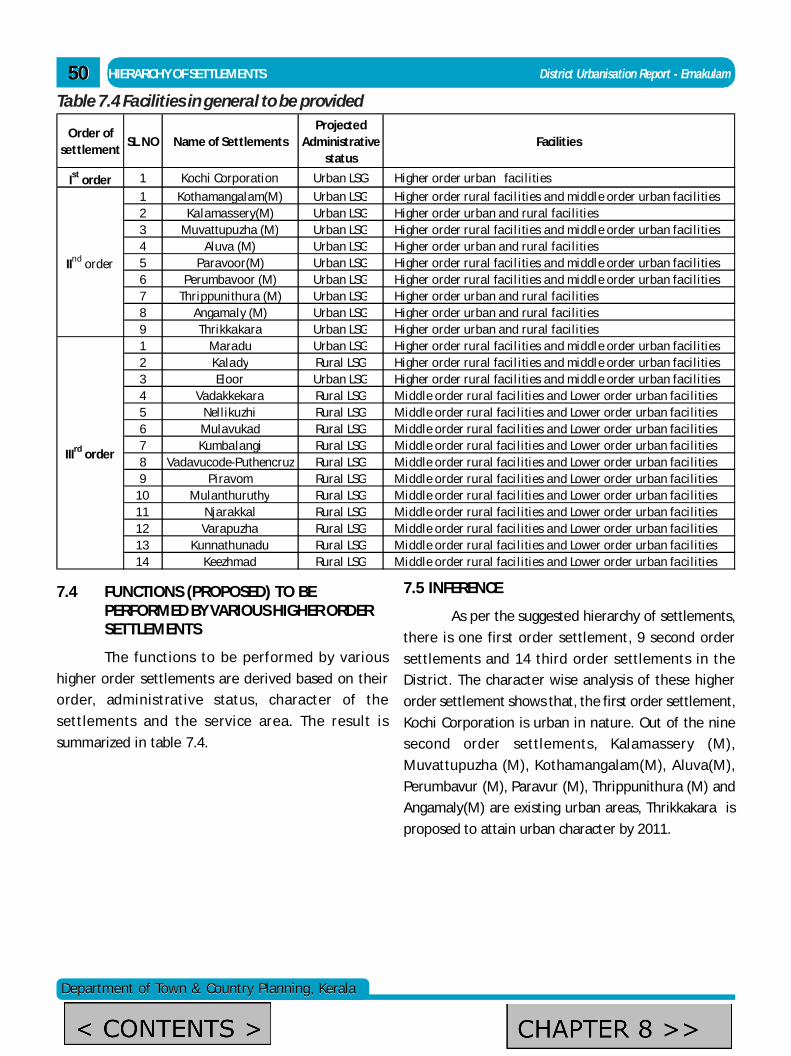
5050
Department of Town & Country Planning, KeralaDepartment of Town & Country Planning, Kerala
HIERARCHY OF SETTLEMENTS District Urbanisation Report - Ernakulam
Order of settlement
SL NO Name of SettlementsProjected
Administrative status
Facilities
Ist order 1 Kochi Corporation Urban LSG Higher order urban facilities
1 Kothamangalam(M) Urban LSG Higher order rural facil ities and middle order urban facilities2 Kalamassery(M) Urban LSG Higher order urban and rural facilities3 Muvattupuzha (M) Urban LSG Higher order rural facil ities and middle order urban facilities4 Aluva (M) Urban LSG Higher order urban and rural facilities5 Paravoor(M) Urban LSG Higher order rural facil ities and middle order urban facilities6 Perumbavoor (M) Urban LSG Higher order rural facil ities and middle order urban facilities7 Thrippunithura (M) Urban LSG Higher order urban and rural facilities8 Angamaly (M) Urban LSG Higher order urban and rural facilities9 Thrikkakara Urban LSG Higher order urban and rural facilities1 Maradu Urban LSG Higher order rural facil ities and middle order urban facilities2 Kalady Rural LSG Higher order rural facil ities and middle order urban facilities3 Eloor Urban LSG Higher order rural facil ities and middle order urban facilities4 Vadakkekara Rural LSG Middle order rural faci lities and Lower order urban facilities5 Nellikuzhi Rural LSG Middle order rural faci lities and Lower order urban facilities6 Mulavukad Rural LSG Middle order rural faci lities and Lower order urban facilities7 Kumbalangi Rural LSG Middle order rural faci lities and Lower order urban facilities8 Vadavucode-Puthencruz Rural LSG Middle order rural faci lities and Lower order urban facilities9 Piravom Rural LSG Middle order rural faci lities and Lower order urban facilities
10 Mulanthuruthy Rural LSG Middle order rural faci lities and Lower order urban facilities11 Njarakkal Rural LSG Middle order rural faci lities and Lower order urban facilities12 Varapuzha Rural LSG Middle order rural faci lities and Lower order urban facilities13 Kunnathunadu Rural LSG Middle order rural faci lities and Lower order urban facilities14 Keezhmad Rural LSG Middle order rural faci lities and Lower order urban facilities
IInd order
IIIrd order
Table 7.4 Facilities in general to be provided
7.4 FUNCTIONS (PROPOSED) TO BEPERFORMED BY VARIOUS HIGHER ORDERSETTLEMENTS
The functions to be performed by various
higher order settlements are derived based on their
order, administrative status, character of the
settlements and the service area. The result is
summarized in table 7.4.
7.5 INFERENCE
As per the suggested hierarchy of settlements,
there is one first order settlement, 9 second order
settlements and 14 third order settlements in the
District. The character wise analysis of these higher
order settlement shows that, the first order settlement,
Kochi Corporation is urban in nature. Out of the nine
second order settlements, Kalamassery (M),
Muvattupuzha (M), Kothamangalam(M), Aluva(M),
Perumbavur (M), Paravur (M), Thrippunithura (M) and
Angamaly(M) are existing urban areas, Thrikkakara is
proposed to attain urban character by 2011.
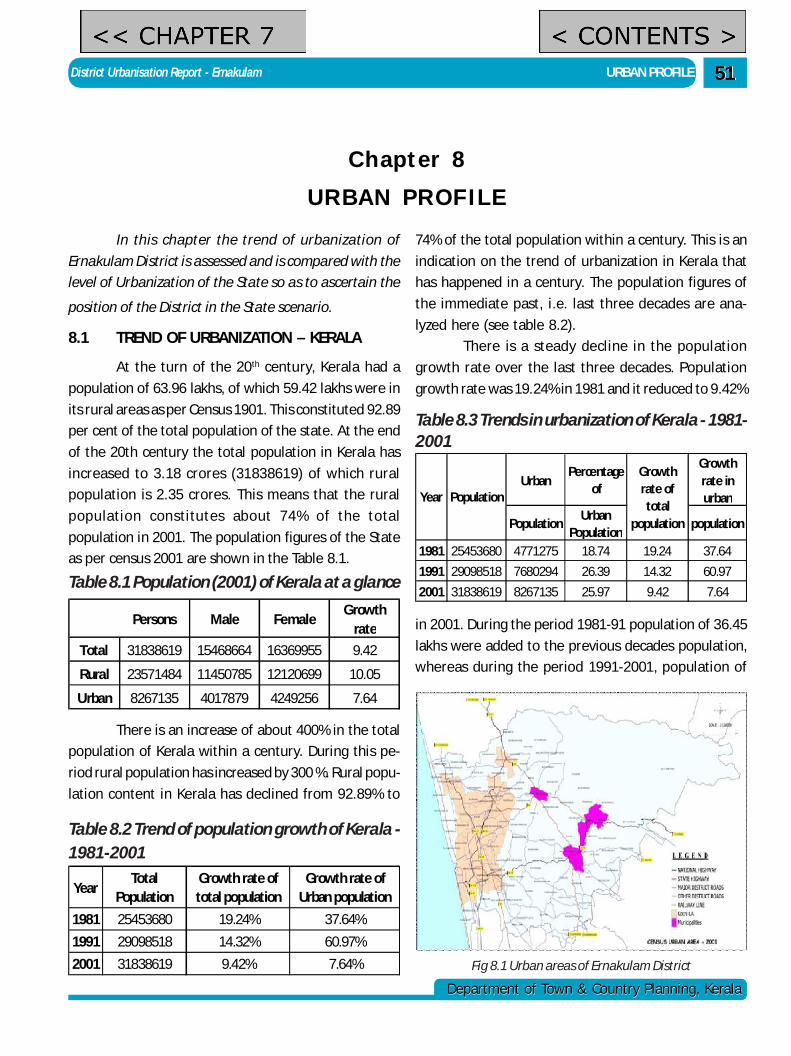
District Urbanisation Report - Ernakulam URBAN PROFILE
Department of Town & Country Planning, KeralaDepartment of Town & Country Planning, Kerala
5151
Chapter 8URBAN PROFILE
In this chapter the trend of urbanization of
Ernakulam District is assessed and is compared with the
level of Urbanization of the State so as to ascertain the
position of the District in the State scenario.
8.1 TREND OF URBANIZATION – KERALA
At the turn of the 20th century, Kerala had a
population of 63.96 lakhs, of which 59.42 lakhs were in
its rural areas as per Census 1901. This constituted 92.89
per cent of the total population of the state. At the end
of the 20th century the total population in Kerala has
increased to 3.18 crores (31838619) of which rural
population is 2.35 crores. This means that the rural
population constitutes about 74% of the total
population in 2001. The population figures of the State
as per census 2001 are shown in the Table 8.1.
74% of the total population within a century. This is an
indication on the trend of urbanization in Kerala that
has happened in a century. The population figures of
the immediate past, i.e. last three decades are ana-
lyzed here (see table 8.2).
There is a steady decline in the population
growth rate over the last three decades. Population
growth rate was 19.24% in 1981 and it reduced to 9.42%
Persons Male FemaleGrowth
rate
Total 31838619 15468664 16369955 9.42
Rural 23571484 11450785 12120699 10.05
Urban 8267135 4017879 4249256 7.64
Table 8.1 Population (2001) of Kerala at a glance
There is an increase of about 400% in the total
population of Kerala within a century. During this pe-
riod rural population has increased by 300 %. Rural popu-
lation content in Kerala has declined from 92.89% to
YearTotal
PopulationGrowth rate of total population
Growth rate of Urban population
1981 25453680 19.24% 37.64%
1991 29098518 14.32% 60.97%
2001 31838619 9.42% 7.64%
Table 8.2 Trend of population growth of Kerala -1981-2001
UrbanPercentage
of
Growth rate in urban
PopulationUrban
Populationpopulation
1981 25453680 4771275 18.74 19.24 37.64
1991 29098518 7680294 26.39 14.32 60.97
2001 31838619 8267135 25.97 9.42 7.64
Year Population
Growth rate of total
population
Table 8.3 Trends in urbanization of Kerala - 1981-2001
in 2001. During the period 1981-91 population of 36.45
lakhs were added to the previous decades population,
whereas during the period 1991-2001, population of
Fig 8.1 Urban areas of Ernakulam District
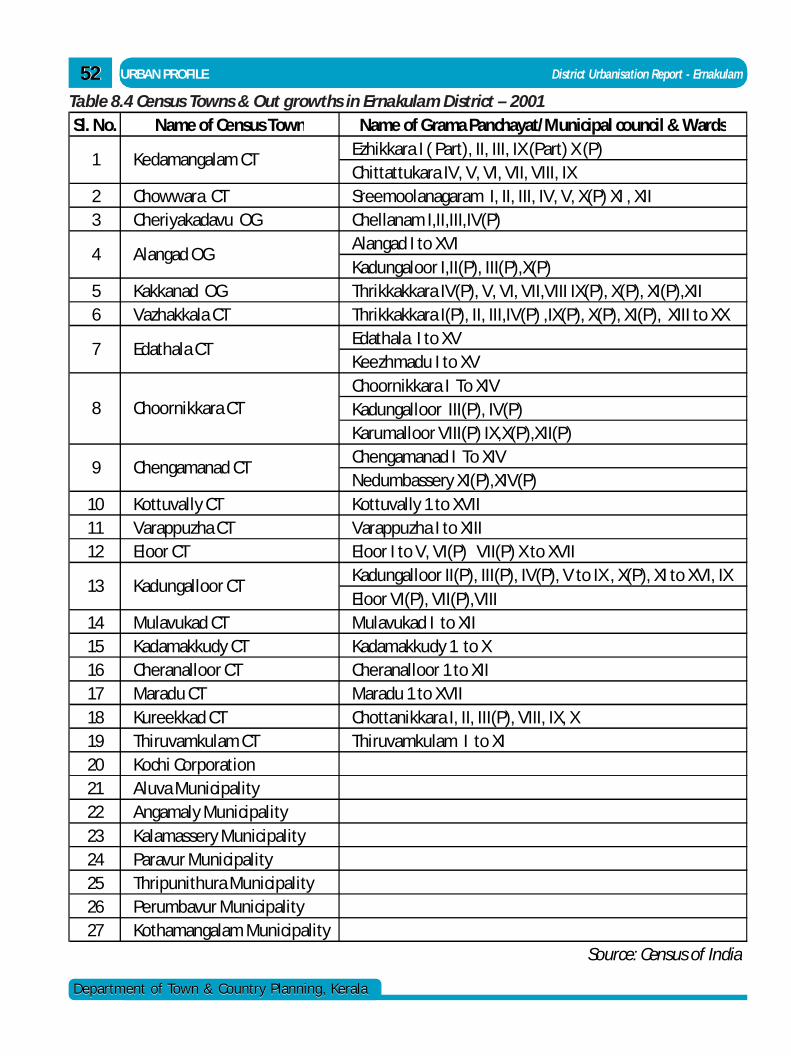
5252
Department of Town & Country Planning, KeralaDepartment of Town & Country Planning, Kerala
URBAN PROFILE District Urbanisation Report - Ernakulam
Table 8.4 Census Towns & Out growths in Ernakulam District – 2001Sl. No. Name of Census Town Name of Grama Panchayat/Municipal council & Wards
Ezhikkara I ( Part), II, III, IX (Part) X (P)Chittattukara IV, V, VI, VII, VIII, IX
2 Chowwara CT Sreemoolanagaram I, II, III, IV, V, X(P) XI , XII3 Cheriyakadavu OG Chellanam I,II,III,IV(P)
Alangad I to XVIKadungaloor I,II(P), III(P),X(P)
5 Kakkanad OG Thrikkakkara IV(P), V, VI, VII,VIII IX(P), X(P), XI(P),XII6 Vazhakkala CT Thrikkakkara I(P), II, III,IV(P) ,IX(P), X(P), XI(P), XIII to XX
Edathala I to XVKeezhmadu I to XVChoornikkara I To XIVKadungalloor III(P), IV(P)Karumalloor VIII(P) IX,X(P),XII(P)Chengamanad I To XIVNedumbassery XI(P),XIV(P)
10 Kottuvally CT Kottuvally 1 to XVII11 Varappuzha CT Varappuzha I to XIII12 Eloor CT Eloor I to V, VI(P) VII(P) X to XVII
Kadungalloor II(P), III(P), IV(P), V to IX , X(P), XI to XVI, IXEloor VI(P), VII(P),VIII
14 Mulavukad CT Mulavukad I to XII15 Kadamakkudy CT Kadamakkudy 1 to X16 Cheranalloor CT Cheranalloor 1 to XII17 Maradu CT Maradu 1 to XVII18 Kureekkad CT Chottanikkara I, II, III(P), VIII, IX, X19 Thiruvamkulam CT Thiruvamkulam I to XI20 Kochi Corporation21 Aluva Municipality22 Angamaly Municipality23 Kalamassery Municipality24 Paravur Municipality25 Thripunithura Municipality26 Perumbavur Municipality27 Kothamangalam Municipality
Source: Census of India
8 Choornikkara CT
9 Chengamanad CT
13 Kadungalloor CT
1 Kedamangalam CT
4 Alangad OG
7 Edathala CT
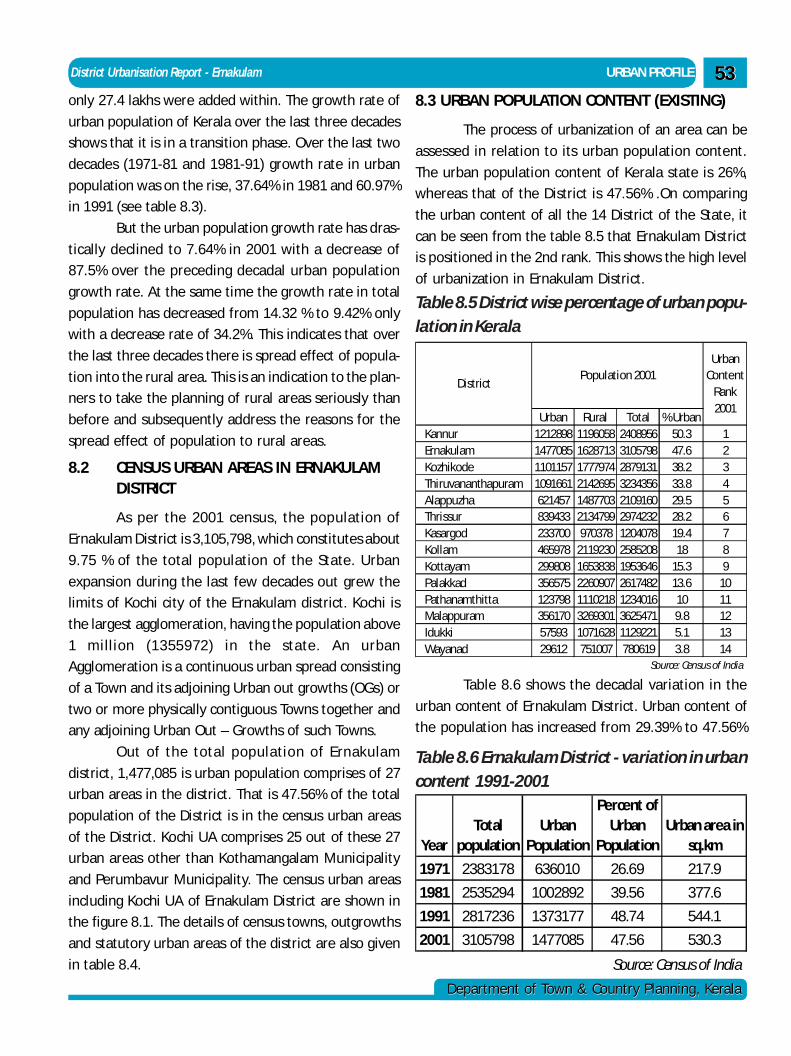
District Urbanisation Report - Ernakulam URBAN PROFILE
Department of Town & Country Planning, KeralaDepartment of Town & Country Planning, Kerala
5353only 27.4 lakhs were added within. The growth rate of
urban population of Kerala over the last three decades
shows that it is in a transition phase. Over the last two
decades (1971-81 and 1981-91) growth rate in urban
population was on the rise, 37.64% in 1981 and 60.97%
in 1991 (see table 8.3).
But the urban population growth rate has dras-
tically declined to 7.64% in 2001 with a decrease of
87.5% over the preceding decadal urban population
growth rate. At the same time the growth rate in total
population has decreased from 14.32 % to 9.42% only
with a decrease rate of 34.2%. This indicates that over
the last three decades there is spread effect of popula-
tion into the rural area. This is an indication to the plan-
ners to take the planning of rural areas seriously than
before and subsequently address the reasons for the
spread effect of population to rural areas.
8.2 CENSUS URBAN AREAS IN ERNAKULAMDISTRICT
As per the 2001 census, the population of
Ernakulam District is 3,105,798, which constitutes about
9.75 % of the total population of the State. Urban
expansion during the last few decades out grew the
limits of Kochi city of the Ernakulam district. Kochi is
the largest agglomeration, having the population above
1 million (1355972) in the state. An urban
Agglomeration is a continuous urban spread consisting
of a Town and its adjoining Urban out growths (OGs) or
two or more physically contiguous Towns together and
any adjoining Urban Out – Growths of such Towns.
Out of the total population of Ernakulam
district, 1,477,085 is urban population comprises of 27
urban areas in the district. That is 47.56% of the total
population of the District is in the census urban areas
of the District. Kochi UA comprises 25 out of these 27
urban areas other than Kothamangalam Municipality
and Perumbavur Municipality. The census urban areas
including Kochi UA of Ernakulam District are shown in
the figure 8.1. The details of census towns, outgrowths
and statutory urban areas of the district are also given
in table 8.4.
8.3 URBAN POPULATION CONTENT (EXISTING)
The process of urbanization of an area can be
assessed in relation to its urban population content.
The urban population content of Kerala state is 26%,
whereas that of the District is 47.56% .On comparing
the urban content of all the 14 District of the State, it
can be seen from the table 8.5 that Ernakulam District
is positioned in the 2nd rank. This shows the high level
of urbanization in Ernakulam District.
Table 8.5 District wise percentage of urban popu-lation in Kerala
YearTotal
populationUrban
Population
Percent of Urban
PopulationUrban area in
sq.km
1971 2383178 636010 26.69 217.9
1981 2535294 1002892 39.56 377.6
1991 2817236 1373177 48.74 544.1
2001 3105798 1477085 47.56 530.3
Source: Census of India
Table 8.6 Ernakulam District - variation in urbancontent 1991-2001
Urban Rural Total % UrbanKannur 1212898 1196058 2408956 50.3 1Ernakulam 1477085 1628713 3105798 47.6 2Kozhikode 1101157 1777974 2879131 38.2 3Thiruvananthapuram 1091661 2142695 3234356 33.8 4Alappuzha 621457 1487703 2109160 29.5 5Thrissur 839433 2134799 2974232 28.2 6Kasargod 233700 970378 1204078 19.4 7Kollam 465978 2119230 2585208 18 8Kottayam 299808 1653838 1953646 15.3 9Palakkad 356575 2260907 2617482 13.6 10Pathanamthitta 123798 1110218 1234016 10 11Malappuram 356170 3269301 3625471 9.8 12Idukki 57593 1071628 1129221 5.1 13Wayanad 29612 751007 780619 3.8 14
Source: Census of India
Urban Content
Rank 2001
Population 2001District
Table 8.6 shows the decadal variation in the
urban content of Ernakulam District. Urban content of
the population has increased from 29.39% to 47.56%
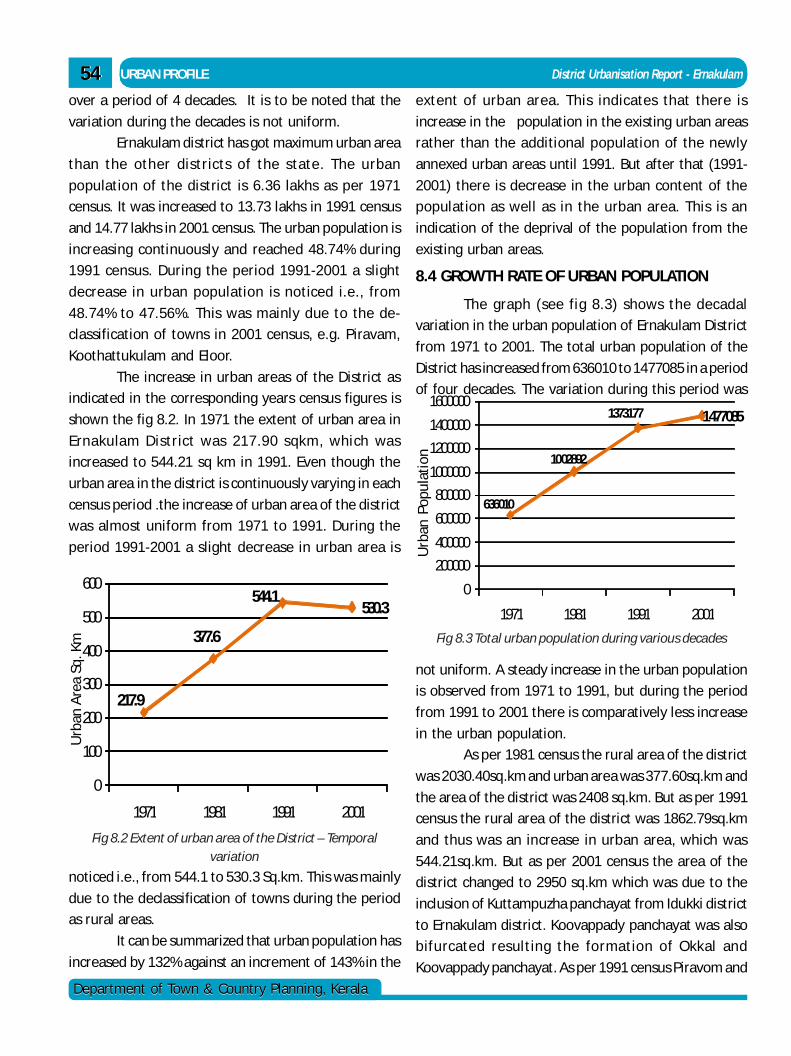
5454
Department of Town & Country Planning, KeralaDepartment of Town & Country Planning, Kerala
URBAN PROFILE District Urbanisation Report - Ernakulam
over a period of 4 decades. It is to be noted that the
variation during the decades is not uniform.
Ernakulam district has got maximum urban area
than the other districts of the state. The urban
population of the district is 6.36 lakhs as per 1971
census. It was increased to 13.73 lakhs in 1991 census
and 14.77 lakhs in 2001 census. The urban population is
increasing continuously and reached 48.74% during
1991 census. During the period 1991-2001 a slight
decrease in urban population is noticed i.e., from
48.74% to 47.56%. This was mainly due to the de-
classification of towns in 2001 census, e.g. Piravam,
Koothattukulam and Eloor.
The increase in urban areas of the District as
indicated in the corresponding years census figures is
shown the fig 8.2. In 1971 the extent of urban area in
Ernakulam District was 217.90 sqkm, which was
increased to 544.21 sq km in 1991. Even though the
urban area in the district is continuously varying in each
census period .the increase of urban area of the district
was almost uniform from 1971 to 1991. During the
period 1991-2001 a slight decrease in urban area is
217.9
377.6
544.1530.3
0
100
200
300
400
500
600
1971 1981 1991 2001
Fig 8.2 Extent of urban area of the District – Temporalvariation
noticed i.e., from 544.1 to 530.3 Sq.km. This was mainly
due to the declassification of towns during the period
as rural areas.
It can be summarized that urban population has
increased by 132% against an increment of 143% in the
extent of urban area. This indicates that there is
increase in the population in the existing urban areas
rather than the additional population of the newly
annexed urban areas until 1991. But after that (1991-
2001) there is decrease in the urban content of the
population as well as in the urban area. This is an
indication of the deprival of the population from the
existing urban areas.
8.4 GROWTH RATE OF URBAN POPULATION
The graph (see fig 8.3) shows the decadal
variation in the urban population of Ernakulam District
from 1971 to 2001. The total urban population of the
District has increased from 636010 to 1477085 in a period
of four decades. The variation during this period was
Urb
an A
rea
Sq. K
m
Urb
an P
opul
atio
n
636010
1002892
1373177 1477085
0
200000
400000
600000
800000
1000000
1200000
1400000
1600000
1971 1981 1991 2001
Fig 8.3 Total urban population during various decades
not uniform. A steady increase in the urban population
is observed from 1971 to 1991, but during the period
from 1991 to 2001 there is comparatively less increase
in the urban population.
As per 1981 census the rural area of the district
was 2030.40sq.km and urban area was 377.60sq.km and
the area of the district was 2408 sq.km. But as per 1991
census the rural area of the district was 1862.79sq.km
and thus was an increase in urban area, which was
544.21sq.km. But as per 2001 census the area of the
district changed to 2950 sq.km which was due to the
inclusion of Kuttampuzha panchayat from Idukki district
to Ernakulam district. Koovappady panchayat was also
bifurcated resulting the formation of Okkal and
Koovappady panchayat. As per 1991 census Piravom and
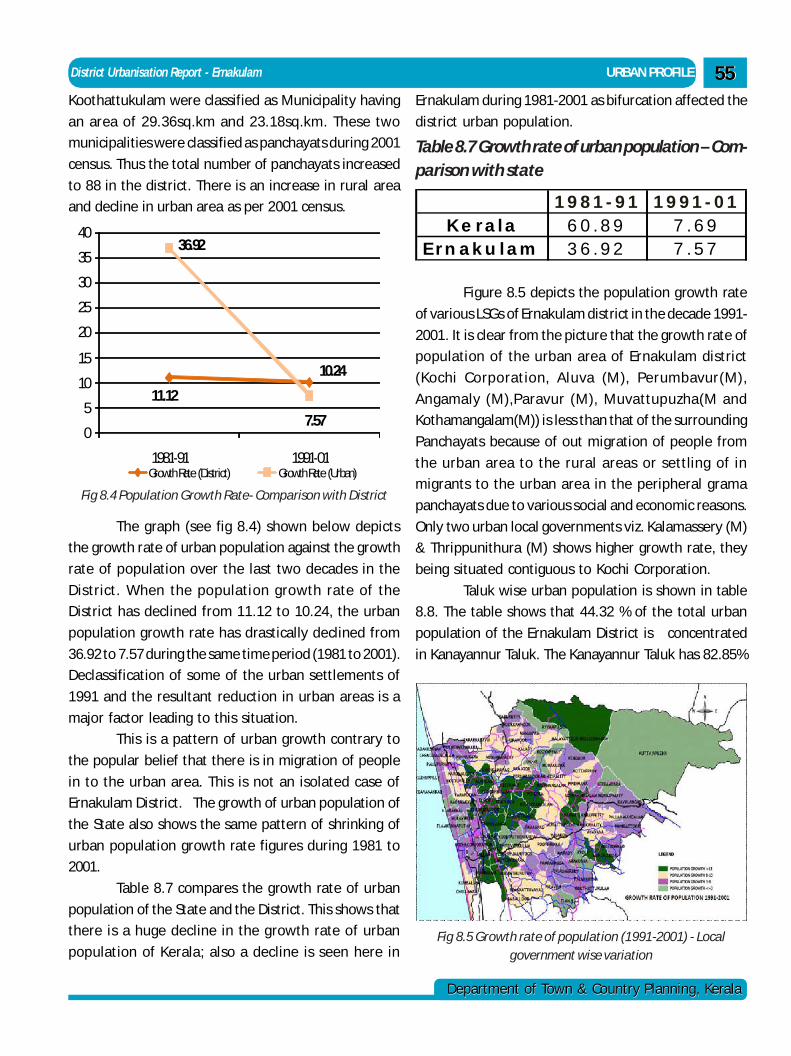
District Urbanisation Report - Ernakulam URBAN PROFILE
Department of Town & Country Planning, KeralaDepartment of Town & Country Planning, Kerala
5555Koothattukulam were classified as Municipality having
an area of 29.36sq.km and 23.18sq.km. These two
municipalities were classified as panchayats during 2001
census. Thus the total number of panchayats increased
to 88 in the district. There is an increase in rural area
and decline in urban area as per 2001 census.
11.12
10.24
36.92
7.570
5
10
15
20
25
30
35
40
1981-91 1991-01Growth Rate (District) Growth Rate (Urban)
Fig 8.4 Population Growth Rate- Comparison with District
The graph (see fig 8.4) shown below depicts
the growth rate of urban population against the growth
rate of population over the last two decades in the
District. When the population growth rate of the
District has declined from 11.12 to 10.24, the urban
population growth rate has drastically declined from
36.92 to 7.57 during the same time period (1981 to 2001).
Declassification of some of the urban settlements of
1991 and the resultant reduction in urban areas is a
major factor leading to this situation.
This is a pattern of urban growth contrary to
the popular belief that there is in migration of people
in to the urban area. This is not an isolated case of
Ernakulam District. The growth of urban population of
the State also shows the same pattern of shrinking of
urban population growth rate figures during 1981 to
2001.
Table 8.7 compares the growth rate of urban
population of the State and the District. This shows that
there is a huge decline in the growth rate of urban
population of Kerala; also a decline is seen here in
1 9 8 1 - 9 1 1 9 9 1 - 0 1K e r a l a 6 0 . 8 9 7 . 6 9
E r n a k u l a m 3 6 . 9 2 7 . 5 7
Table 8.7 Growth rate of urban population – Com-parison with state
Ernakulam during 1981-2001 as bifurcation affected the
district urban population.
Fig 8.5 Growth rate of population (1991-2001) - Localgovernment wise variation
Figure 8.5 depicts the population growth rate
of various LSGs of Ernakulam district in the decade 1991-
2001. It is clear from the picture that the growth rate of
population of the urban area of Ernakulam district
(Kochi Corporation, Aluva (M), Perumbavur(M),
Angamaly (M),Paravur (M), Muvattupuzha(M and
Kothamangalam(M)) is less than that of the surrounding
Panchayats because of out migration of people from
the urban area to the rural areas or settling of in
migrants to the urban area in the peripheral grama
panchayats due to various social and economic reasons.
Only two urban local governments viz. Kalamassery (M)
& Thrippunithura (M) shows higher growth rate, they
being situated contiguous to Kochi Corporation.
Taluk wise urban population is shown in table
8.8. The table shows that 44.32 % of the total urban
population of the Ernakulam District is concentrated
in Kanayannur Taluk. The Kanayannur Taluk has 82.85%
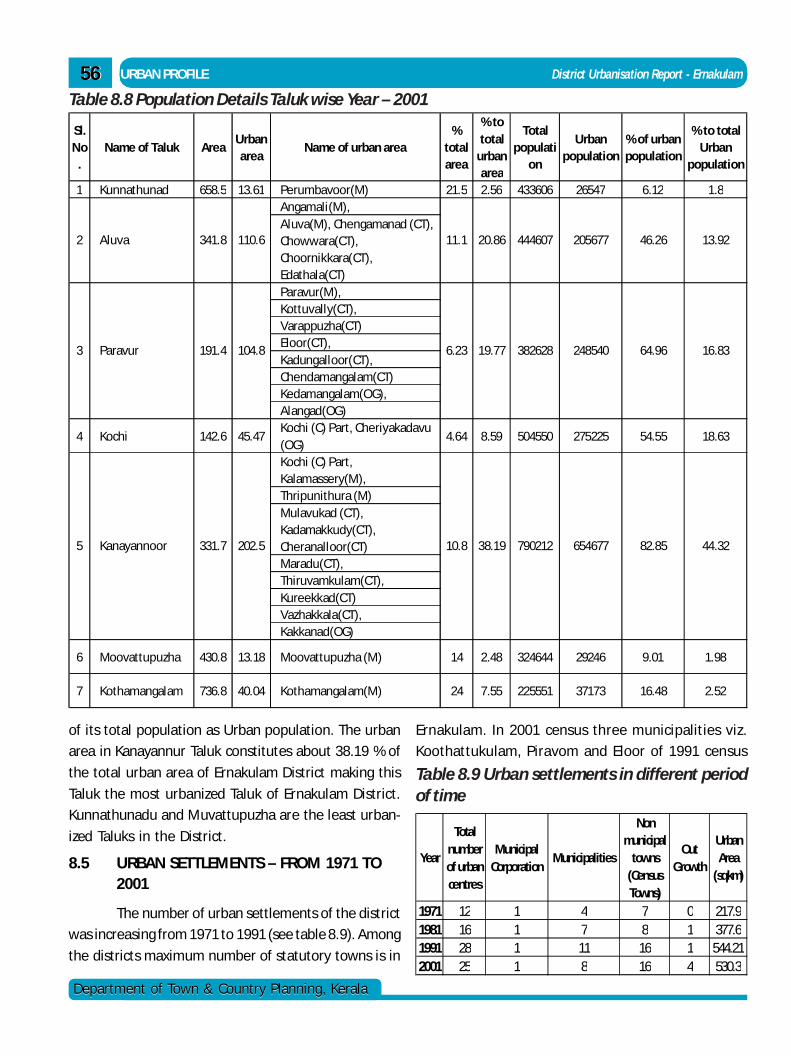
5656
Department of Town & Country Planning, KeralaDepartment of Town & Country Planning, Kerala
URBAN PROFILE District Urbanisation Report - Ernakulam
of its total population as Urban population. The urban
area in Kanayannur Taluk constitutes about 38.19 % of
the total urban area of Ernakulam District making this
Taluk the most urbanized Taluk of Ernakulam District.
Kunnathunadu and Muvattupuzha are the least urban-
ized Taluks in the District.
8.5 URBAN SETTLEMENTS – FROM 1971 TO2001
The number of urban settlements of the district
was increasing from 1971 to 1991 (see table 8.9). Among
the districts maximum number of statutory towns is in
Sl. No
.Name of Taluk Area
Urban area
Name of urban area%
total area
% to total
urban area
Total populati
on
Urban population
% of urban population
% to total Urban
population
1 Kunnathunad 658.5 13.61 Perumbavoor(M) 21.5 2.56 433606 26547 6.12 1.8Angamali(M), Aluva(M), Chengamanad (CT), Chowwara(CT), Choornikkara(CT), Edathala(CT)Paravur(M),Kottuvally(CT),Varappuzha(CT)Eloor(CT),Kadungalloor(CT),Chendamangalam(CT)Kedamangalam(OG),Alangad(OG)
4 Kochi 142.6 45.47Kochi (C) Part, Cheriyakadavu (OG)
4.64 8.59 504550 275225 54.55 18.63
Kochi (C) Part, Kalamassery(M),Thripunithura (M)Mulavukad (CT), Kadamakkudy(CT), Cheranalloor(CT)Maradu(CT),Thiruvamkulam(CT),Kureekkad(CT)Vazhakkala(CT),Kakkanad(OG)
6 Moovattupuzha 430.8 13.18 Moovattupuzha (M) 14 2.48 324644 29246 9.01 1.98
7 Kothamangalam 736.8 40.04 Kothamangalam(M) 24 7.55 225551 37173 16.48 2.52
82.85 44.32
64.96 16.83
5 Kanayannoor 331.7 202.5 10.8 38.19 790212 654677
46.26 13.92
3 Paravur 191.4 104.8 6.23 19.77 382628 248540
2 Aluva 341.8 110.6 11.1 20.86 444607 205677
Table 8.8 Population Details Taluk wise Year – 2001
Ernakulam. In 2001 census three municipalities viz.
Koothattukulam, Piravom and Eloor of 1991 census
Year
Total number of urban centres
Municipal Corporation
Municipalities
Non municipal
towns (Census Towns)
Out Growth
Urban Area
(sqkm)
1971 12 1 4 7 0 217.91981 16 1 7 8 1 377.61991 28 1 11 16 1 544.212001 25 1 8 16 4 530.3
Table 8.9 Urban settlements in different periodof time
District Urbanisation Report - Ernakulam URBAN PROFILE
Department of Town & Country Planning, KeralaDepartment of Town & Country Planning, Kerala
5757were declassified and hence the number of statutory
towns reduced to 9 from 12, thus there is decrease in
the total number of urban settlements as well as urban
area of district compared to the previous decade.
8.6 FUTURE URBANIZATION PROFILE OF THEDISTRICT
The analysis of the occupational structure of
the District shows that the agriculture sector shows a
declining trend in the district. The sector, which shows
growth, is the service sector, industrial sectors and
tertiary sectors. Ernakulam is ranking first in per capita
income due to production specialization in industrial
activities and port induced service sector development.
It is observed that rural area of the district is also slowly
withdrawing from the primary sector and started
depending more on the service sector. Because of this
shift in the occupational structure some of the rural
areas will be having more than 75% of the male workers
in the non-agricultural category in the near future and
hence will fall in the category of census urban. Hence
there may be significant increase in the urban
population well as in the extent of urban areas of the
District in the future, though the urban population
content of the existing urban areas shows a decreasing
trend. Urbanisation with accelerated industrialization
in selected settlement of Kerala needs special
attention in spatio economic planning. In the following
paragraphs, the future urban centres are delineated
based on the three fold census classification as per
census 2001, and the result are further iterated with
the factors like impact of proposed urban development
projects, grade of the LSGs and hierarchy of
settlements.
Criteria-1: Census urban areas
A study on the existing occupational structure
in various settlements of the District will put light on
those settlements likely to become census urban
shortly. The workers of each settlement which are
classified in to four fold classification as per census 2001
are divided in to the following nine categories based
on the workers classification in the 1991 census.
1. Main Cultivators
2. Main Agricultural Labourers
3. Livestock, Forestry, Fishing, Hunting,
Plantation, Orchards, and allied activates
4. Mining and Quarrying
5. Manufacturing, Processing, Servicing and
repairs in Household industries
6. Manufacturing, Processing, servicing and
repairs in other than household industries
7. Trade and commerce
8. Transport storage and Communications
9. Others
The methodology adopted for the
extrapolation to get the nine fold classification of
workers in 2001 based on the workers classification in
census1991 is described briefly here. The only two
types of workers included in both 1991 and 2001 census
are the cultivators and agricultural labourers. The
remaining two types of workers in the 2001 census,
House hold industrial workers and other workers are
totaled together and this total is divided in to 7 classes
of workers in the same proportion as these 7 classes of
workers as there in the 1991 census. Then the number
of male workers in manufacturing, processing, servicing
and repairs in House hold industries, manufacturing,
processing, servicing and repairs in other than house
hold industries, trade & commerce, transport, storage
& communication and others are totaled to calculate
the percentage of male workers in non-agricultural
activities in each of the LSGs of the District. The details
are shown in Annexe 15. By the extrapolation of the
data on classification of workers based on 1991 census,
the local governments with non-agricultural male
workers more than 80% instead of 75% is taken for the
study. Based on this there are 43 LSGs excluding
Corporation and 8 municipalities identifies in this
district which are satisfying the 3 fold criteria to be
termed as urban. The list of which is given below and
the spatial location of these LSGs is shown in fig 8.6.
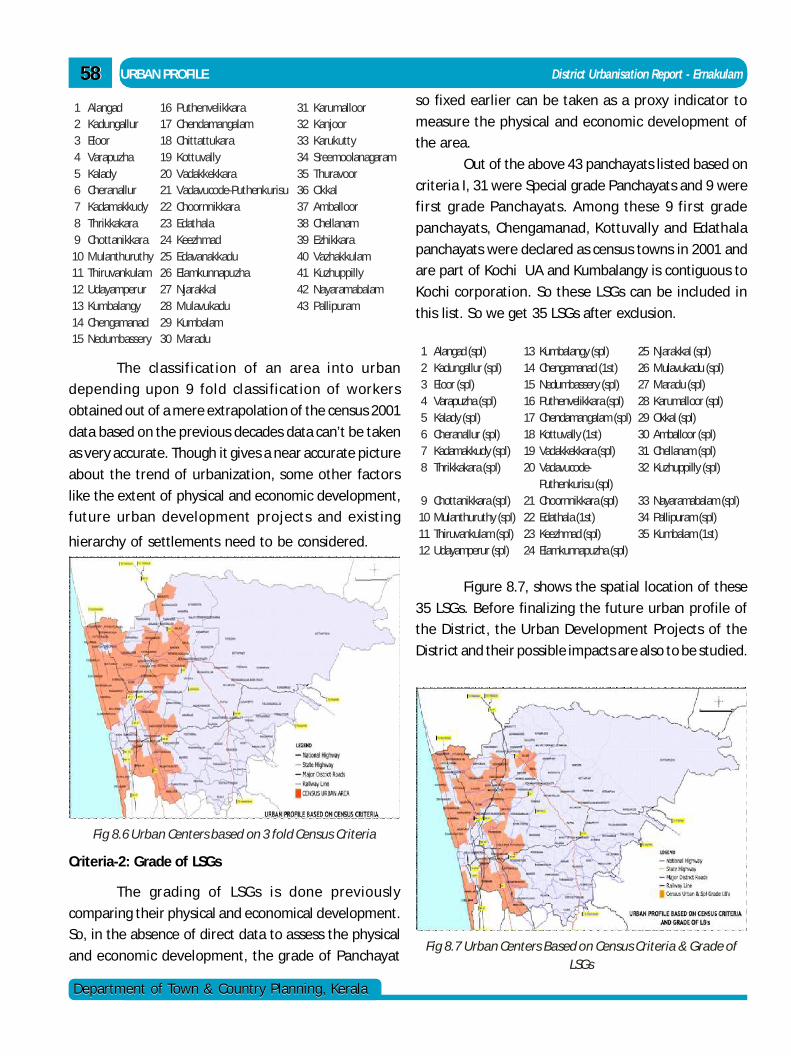
5858
Department of Town & Country Planning, KeralaDepartment of Town & Country Planning, Kerala
URBAN PROFILE District Urbanisation Report - Ernakulam
The classification of an area into urban
depending upon 9 fold classification of workers
obtained out of a mere extrapolation of the census 2001
data based on the previous decades data can’t be taken
as very accurate. Though it gives a near accurate picture
about the trend of urbanization, some other factors
like the extent of physical and economic development,
future urban development projects and existing
hierarchy of settlements need to be considered.
1 Alangad 16 Puthenvelikkara 31 Karumalloor 2 Kadungallur 17 Chendamangalam 32 Kanjoor 3 Eloor 18 Chittattukara 33 Karukutty 4 Varapuzha 19 Kottuvally 34 Sreemoolanagaram 5 Kalady 20 Vadakkekkara 35 Thuravoor6 Cheranallur 21 Vadavucode-Puthenkurisu 36 Okkal 7 Kadamakkudy 22 Choornnikkara 37 Amballoor 8 Thrikkakara 23 Edathala 38 Chellanam 9 Chottanikkara 24 Keezhmad 39 Ezhikkara 10 Mulanthuruthy 25 Edavanakkadu 40 Vazhakkulam 11 Thiruvankulam 26 Elamkunnapuzha 41 Kuzhuppilly 12 Udayamperur 27 Njarakkal 42 Nayaramabalam 13 Kumbalangy 28 Mulavukadu 43 Pallipuram 14 Chengamanad 29 Kumbalam15 Nedumbassery 30 Maradu
Fig 8.6 Urban Centers based on 3 fold Census Criteria
so fixed earlier can be taken as a proxy indicator to
measure the physical and economic development of
the area.
Out of the above 43 panchayats listed based on
criteria I, 31 were Special grade Panchayats and 9 were
first grade Panchayats. Among these 9 first grade
panchayats, Chengamanad, Kottuvally and Edathala
panchayats were declared as census towns in 2001 and
are part of Kochi UA and Kumbalangy is contiguous to
Kochi corporation. So these LSGs can be included in
this list. So we get 35 LSGs after exclusion.
1 Alangad (spl) 13 Kumbalangy (spl) 25 Njarakkal (spl)2 Kadungallur (spl) 14 Chengamanad (1st) 26 Mulavukadu (spl)3 Eloor (spl) 15 Nedumbassery (spl) 27 Maradu (spl)4 Varapuzha (spl) 16 Puthenvelikkara (spl) 28 Karumalloor (spl)5 Kalady (spl) 17 Chendamangalam (spl) 29 Okkal (spl)6 Cheranallur (spl) 18 Kottuvally (1st) 30 Amballoor (spl)7 Kadamakkudy (spl) 19 Vadakkekkara (spl) 31 Chellanam (spl)8 Thrikkakara (spl) 20 Vadavucode-
Puthenkurisu (spl)32 Kuzhuppilly (spl)
9 Chottanikkara (spl) 21 Choornnikkara (spl) 33 Nayaramabalam (spl)10 Mulanthuruthy (spl) 22 Edathala (1st) 34 Pallipuram (spl)11 Thiruvankulam (spl) 23 Keezhmad (spl) 35 Kumbalam (1st)12 Udayamperur (spl) 24 Elamkunnapuzha (spl)
Figure 8.7, shows the spatial location of these
35 LSGs. Before finalizing the future urban profile of
the District, the Urban Development Projects of the
District and their possible impacts are also to be studied.
Criteria-2: Grade of LSGs
The grading of LSGs is done previously
comparing their physical and economical development.
So, in the absence of direct data to assess the physical
and economic development, the grade of PanchayatFig 8.7 Urban Centers Based on Census Criteria & Grade of
LSGs
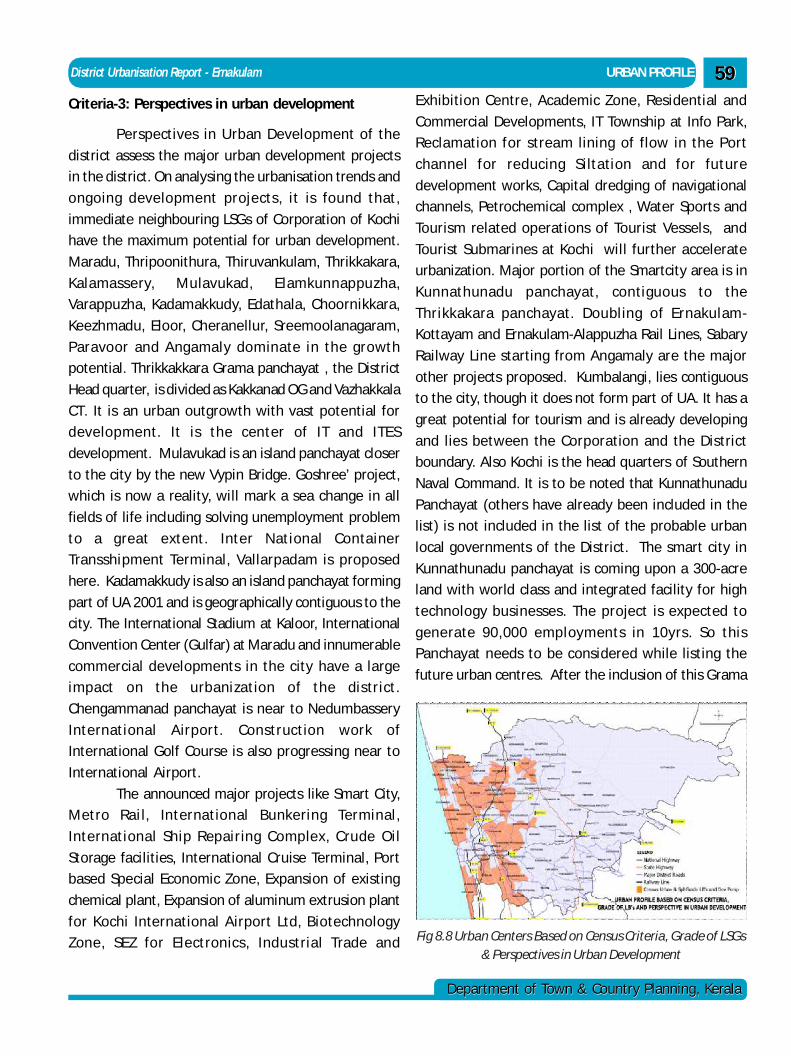
District Urbanisation Report - Ernakulam URBAN PROFILE
Department of Town & Country Planning, KeralaDepartment of Town & Country Planning, Kerala
5959
Criteria-3: Perspectives in urban development
Perspectives in Urban Development of the
district assess the major urban development projects
in the district. On analysing the urbanisation trends and
ongoing development projects, it is found that,
immediate neighbouring LSGs of Corporation of Kochi
have the maximum potential for urban development.
Maradu, Thripoonithura, Thiruvankulam, Thrikkakara,
Kalamassery, Mulavukad, Elamkunnappuzha,
Varappuzha, Kadamakkudy, Edathala, Choornikkara,
Keezhmadu, Eloor, Cheranellur, Sreemoolanagaram,
Paravoor and Angamaly dominate in the growth
potential. Thrikkakkara Grama panchayat , the District
Head quarter, is divided as Kakkanad OG and Vazhakkala
CT. It is an urban outgrowth with vast potential for
development. It is the center of IT and ITES
development. Mulavukad is an island panchayat closer
to the city by the new Vypin Bridge. Goshree’ project,
which is now a reality, will mark a sea change in all
fields of life including solving unemployment problem
to a great extent. Inter National Container
Transshipment Terminal, Vallarpadam is proposed
here. Kadamakkudy is also an island panchayat forming
part of UA 2001 and is geographically contiguous to the
city. The International Stadium at Kaloor, International
Convention Center (Gulfar) at Maradu and innumerable
commercial developments in the city have a large
impact on the urbanization of the district.
Chengammanad panchayat is near to Nedumbassery
International Airport. Construction work of
International Golf Course is also progressing near to
International Airport.
The announced major projects like Smart City,
Metro Rai l, International Bunkering Terminal,
International Ship Repairing Complex, Crude Oil
Storage facilities, International Cruise Terminal, Port
based Special Economic Zone, Expansion of existing
chemical plant, Expansion of aluminum extrusion plant
for Kochi International Airport Ltd, Biotechnology
Zone, SEZ for Electronics, Industrial Trade and
Exhibition Centre, Academic Zone, Residential and
Commercial Developments, IT Township at Info Park,
Reclamation for stream lining of flow in the Port
channel for reducing Siltation and for future
development works, Capital dredging of navigational
channels, Petrochemical complex , Water Sports and
Tourism related operations of Tourist Vessels, and
Tourist Submarines at Kochi will further accelerate
urbanization. Major portion of the Smartcity area is in
Kunnathunadu panchayat, contiguous to the
Thrikkakara panchayat. Doubling of Ernakulam-
Kottayam and Ernakulam-Alappuzha Rail Lines, Sabary
Railway Line starting from Angamaly are the major
other projects proposed. Kumbalangi, lies contiguous
to the city, though it does not form part of UA. It has a
great potential for tourism and is already developing
and lies between the Corporation and the District
boundary. Also Kochi is the head quarters of Southern
Naval Command. It is to be noted that Kunnathunadu
Panchayat (others have already been included in the
list) is not included in the list of the probable urban
local governments of the District. The smart city in
Kunnathunadu panchayat is coming upon a 300-acre
land with world class and integrated facility for high
technology businesses. The project is expected to
generate 90,000 employments in 10yrs. So this
Panchayat needs to be considered while listing the
future urban centres. After the inclusion of this Grama
Fig 8.8 Urban Centers Based on Census Criteria, Grade of LSGs& Perspectives in Urban Development
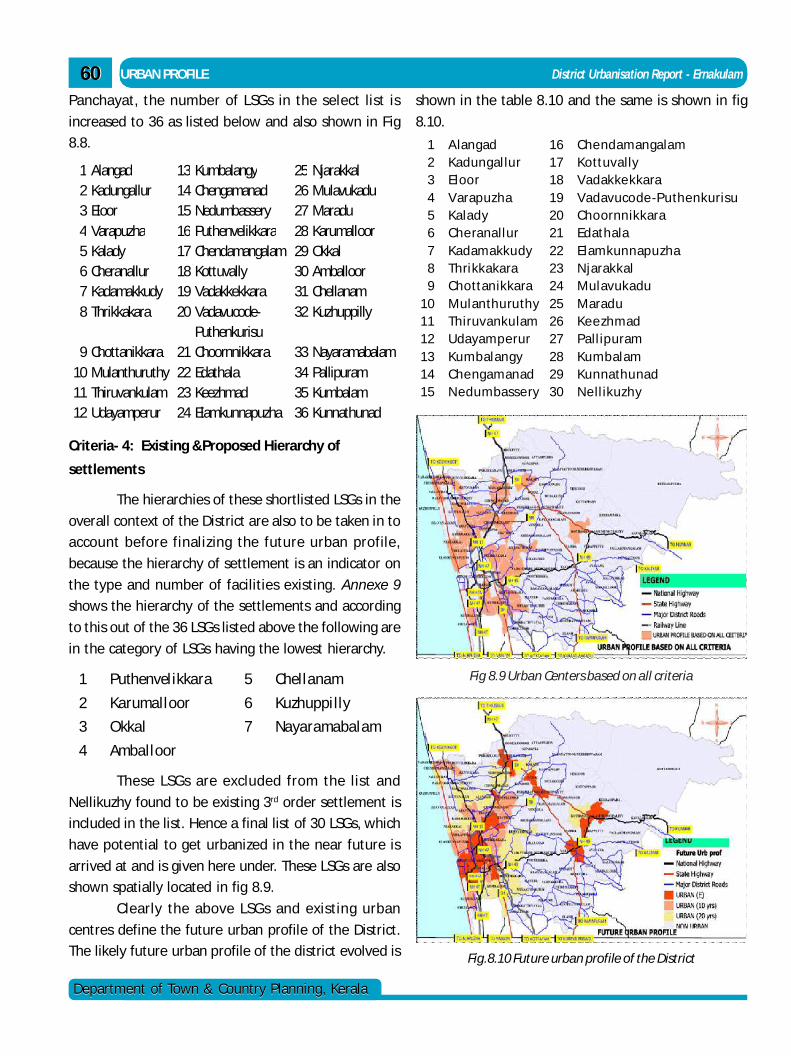
6060
Department of Town & Country Planning, KeralaDepartment of Town & Country Planning, Kerala
URBAN PROFILE District Urbanisation Report - Ernakulam
Panchayat, the number of LSGs in the select list is
increased to 36 as listed below and also shown in Fig
8.8.
1 Alangad 13 Kumbalangy 25 Njarakkal2 Kadungallur 14 Chengamanad 26 Mulavukadu3 Eloor 15 Nedumbassery 27 Maradu4 Varapuzha 16 Puthenvelikkara 28 Karumalloor5 Kalady 17 Chendamangalam 29 Okkal6 Cheranallur 18 Kottuvally 30 Amballoor7 Kadamakkudy 19 Vadakkekkara 31 Chellanam8 Thrikkakara 20 Vadavucode-
Puthenkurisu32 Kuzhuppilly
9 Chottanikkara 21 Choornnikkara 33 Nayaramabalam10 Mulanthuruthy 22 Edathala 34 Pallipuram11 Thiruvankulam 23 Keezhmad 35 Kumbalam12 Udayamperur 24 Elamkunnapuzha 36 Kunnathunad
Criteria- 4: Existing &Proposed Hierarchy of
settlements
The hierarchies of these shortlisted LSGs in the
overall context of the District are also to be taken in to
account before finalizing the future urban profile,
because the hierarchy of settlement is an indicator on
the type and number of facilities existing. Annexe 9
shows the hierarchy of the settlements and according
to this out of the 36 LSGs listed above the following are
in the category of LSGs having the lowest hierarchy.
1 Puthenvelikkara 5 Chellanam
2 Karumalloor 6 Kuzhuppilly
3 Okkal 7 Nayaramabalam
4 Amballoor
1 Alangad 16 Chendamangalam2 Kadungallur 17 Kottuvally3 Eloor 18 Vadakkekkara4 Varapuzha 19 Vadavucode-Puthenkurisu5 Kalady 20 Choornnikkara6 Cheranallur 21 Edathala7 Kadamakkudy 22 Elamkunnapuzha8 Thrikkakara 23 Njarakkal9 Chottanikkara 24 Mulavukadu
10 Mulanthuruthy 25 Maradu11 Thiruvankulam 26 Keezhmad12 Udayamperur 27 Pall ipuram13 Kumbalangy 28 Kumbalam14 Chengamanad 29 Kunnathunad15 Nedumbassery 30 Nell ikuzhy
These LSGs are excluded from the list and
Nellikuzhy found to be existing 3rd order settlement is
included in the list. Hence a final list of 30 LSGs, which
have potential to get urbanized in the near future is
arrived at and is given here under. These LSGs are also
shown spatially located in fig 8.9.
Clearly the above LSGs and existing urban
centres define the future urban profile of the District.
The likely future urban profile of the district evolved is
shown in the table 8.10 and the same is shown in fig
8.10.
Fig 8.9 Urban Centers based on all criteria
Fig.8.10 Future urban profile of the District
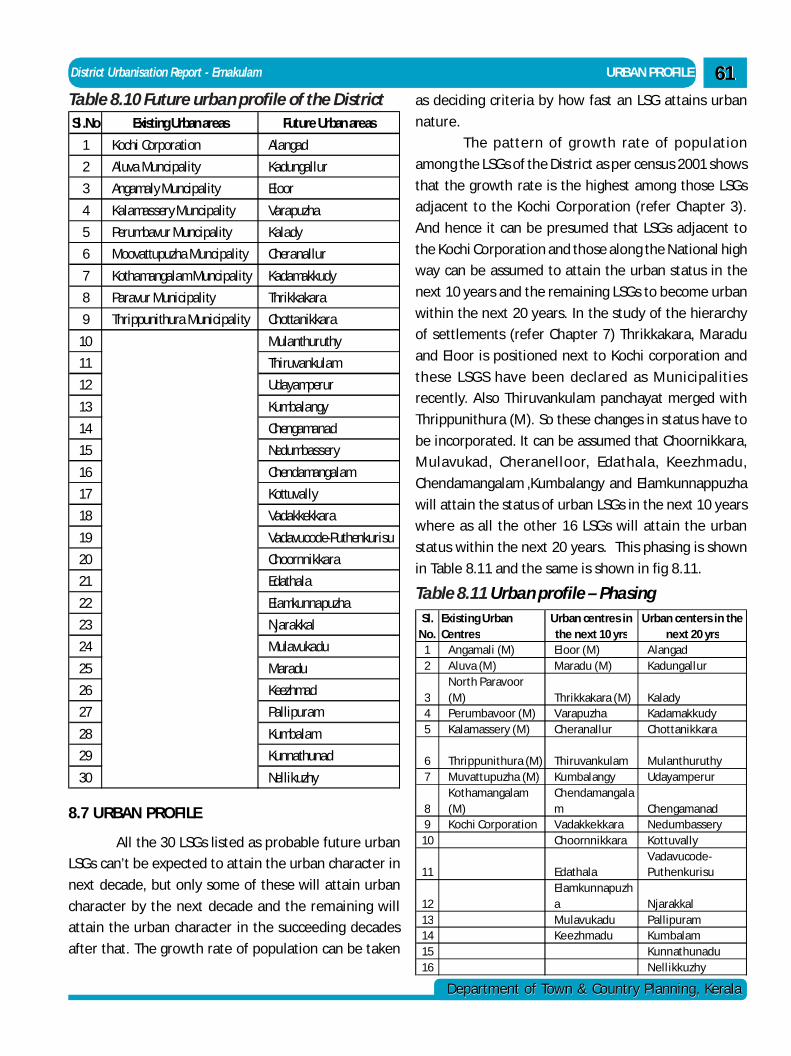
District Urbanisation Report - Ernakulam URBAN PROFILE
Department of Town & Country Planning, KeralaDepartment of Town & Country Planning, Kerala
6161
8.7 URBAN PROFILE
All the 30 LSGs listed as probable future urban
LSGs can’t be expected to attain the urban character in
next decade, but only some of these will attain urban
character by the next decade and the remaining will
attain the urban character in the succeeding decades
after that. The growth rate of population can be taken
Sl .No Existing Urban areas Future Urban areas
1 Kochi Corporation Alangad
2 Aluva Muncipality Kadungallur
3 Angamaly Muncipality Eloor
4 Kalamassery Muncipality Varapuzha
5 Perumbavur Muncipality Kalady
6 Moovattupuzha Muncipality Cheranallur
7 Kothamangalam Muncipality Kadamakkudy
8 Paravur Municipality Thrikkakara
9 Thrippunithura Municipality Chottanikkara
10 Mulanthuruthy
11 Thiruvankulam
12 Udayamperur
13 Kumbalangy
14 Chengamanad
15 Nedumbassery
16 Chendamangalam
17 Kottuvally
18 Vadakkekkara
19 Vadavucode-Puthenkurisu
20 Choornnikkara
21 Edathala
22 Elamkunnapuzha
23 Njarakkal
24 Mulavukadu
25 Maradu
26 Keezhmad
27 Pallipuram
28 Kumbalam
29 Kunnathunad
30 Nellikuzhy
Table 8.10 Future urban profile of the District as deciding criteria by how fast an LSG attains urban
nature.
The pattern of growth rate of population
among the LSGs of the District as per census 2001 shows
that the growth rate is the highest among those LSGs
adjacent to the Kochi Corporation (refer Chapter 3).
And hence it can be presumed that LSGs adjacent to
the Kochi Corporation and those along the National high
way can be assumed to attain the urban status in the
next 10 years and the remaining LSGs to become urban
within the next 20 years. In the study of the hierarchy
of settlements (refer Chapter 7) Thrikkakara, Maradu
and Eloor is positioned next to Kochi corporation and
these LSGS have been declared as Municipalities
recently. Also Thiruvankulam panchayat merged with
Thrippunithura (M). So these changes in status have to
be incorporated. It can be assumed that Choornikkara,
Mulavukad, Cheranelloor, Edathala, Keezhmadu,
Chendamangalam ,Kumbalangy and Elamkunnappuzha
will attain the status of urban LSGs in the next 10 years
where as all the other 16 LSGs will attain the urban
status within the next 20 years. This phasing is shown
in Table 8.11 and the same is shown in fig 8.11.
Sl. No.
Existing Urban Centres
Urban centres in the next 10 yrs
Urban centers in the next 20 yrs
1 Angamali (M) Eloor (M) Alangad2 Aluva (M) Maradu (M) Kadungallur
3North Paravoor (M) Thrikkakara (M) Kalady
4 Perumbavoor (M) Varapuzha Kadamakkudy5 Kalamassery (M) Cheranallur Chottanikkara
6 Thrippunithura (M) Thiruvankulam Mulanthuruthy7 Muvattupuzha (M) Kumbalangy Udayamperur
8Kothamangalam (M)
Chendamangalam Chengamanad
9 Kochi Corporation Vadakkekkara Nedumbassery10 Choornnikkara Kottuvally
11 EdathalaVadavucode-Puthenkurisu
12Elamkunnapuzha Njarakkal
13 Mulavukadu Pallipuram14 Keezhmadu Kumbalam15 Kunnathunadu16 Nellikkuzhy
Table 8.11 Urban profile – Phasing
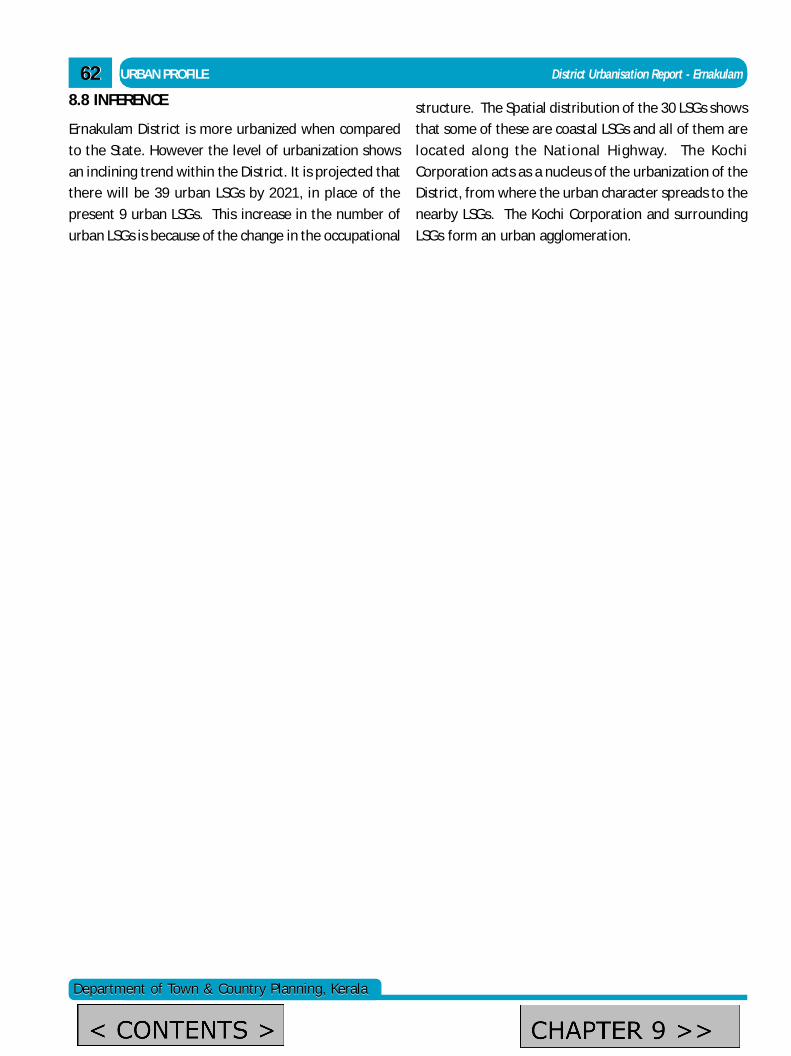
6262
Department of Town & Country Planning, KeralaDepartment of Town & Country Planning, Kerala
URBAN PROFILE District Urbanisation Report - Ernakulam
8.8 INFERENCE
Ernakulam District is more urbanized when compared
to the State. However the level of urbanization shows
an inclining trend within the District. It is projected that
there will be 39 urban LSGs by 2021, in place of the
present 9 urban LSGs. This increase in the number of
urban LSGs is because of the change in the occupational
structure. The Spatial distribution of the 30 LSGs shows
that some of these are coastal LSGs and all of them are
located along the National Highway. The Kochi
Corporation acts as a nucleus of the urbanization of the
District, from where the urban character spreads to the
nearby LSGs. The Kochi Corporation and surrounding
LSGs form an urban agglomeration.
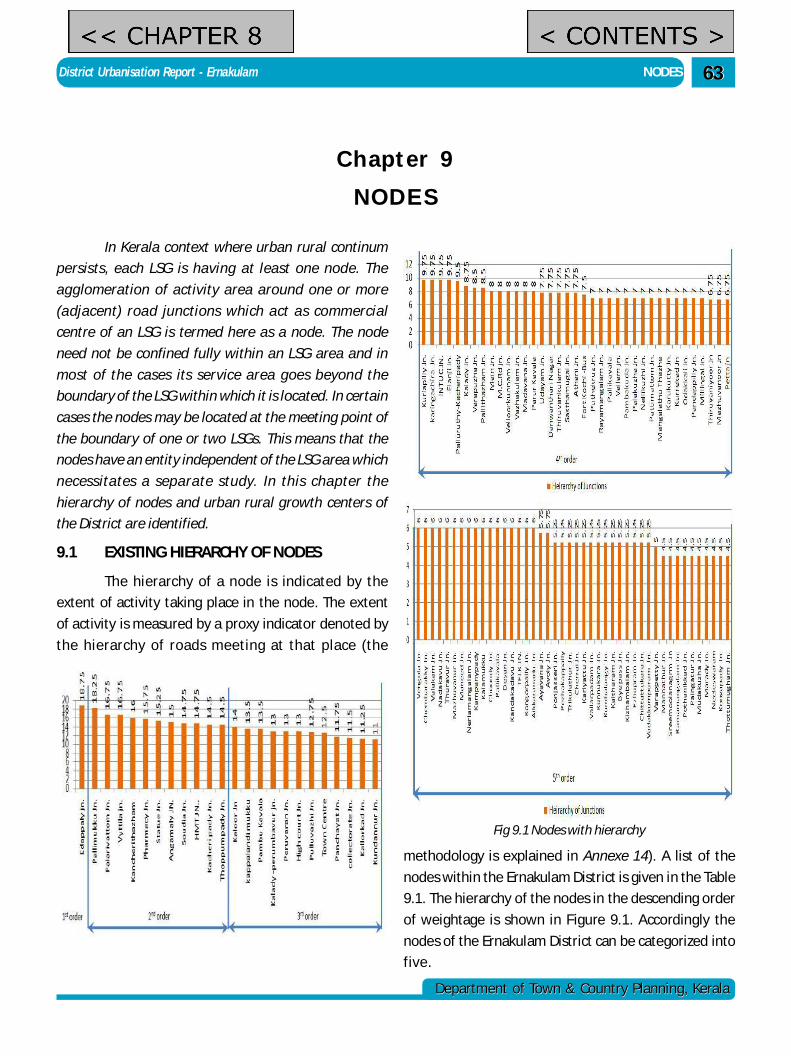
District Urbanisation Report - Ernakulam NODES
Department of Town & Country Planning, KeralaDepartment of Town & Country Planning, Kerala
6363
Chapter 9NODES
In Kerala context where urban rural continum
persists, each LSG is having at least one node. The
agglomeration of activity area around one or more
(adjacent) road junctions which act as commercial
centre of an LSG is termed here as a node. The node
need not be confined fully within an LSG area and in
most of the cases its service area goes beyond the
boundary of the LSG within which it is located. In certain
cases the nodes may be located at the meeting point of
the boundary of one or two LSGs. This means that the
nodes have an entity independent of the LSG area which
necessitates a separate study. In this chapter the
hierarchy of nodes and urban rural growth centers of
the District are identified.
9.1 EXISTING HIERARCHY OF NODES
The hierarchy of a node is indicated by the
extent of activity taking place in the node. The extent
of activity is measured by a proxy indicator denoted by
the hierarchy of roads meeting at that place (the
Fig 9.1 Nodes with hierarchy
methodology is explained in Annexe 14). A list of the
nodes within the Ernakulam District is given in the Table
9.1. The hierarchy of the nodes in the descending order
of weightage is shown in Figure 9.1. Accordingly the
nodes of the Ernakulam District can be categorized into
five.
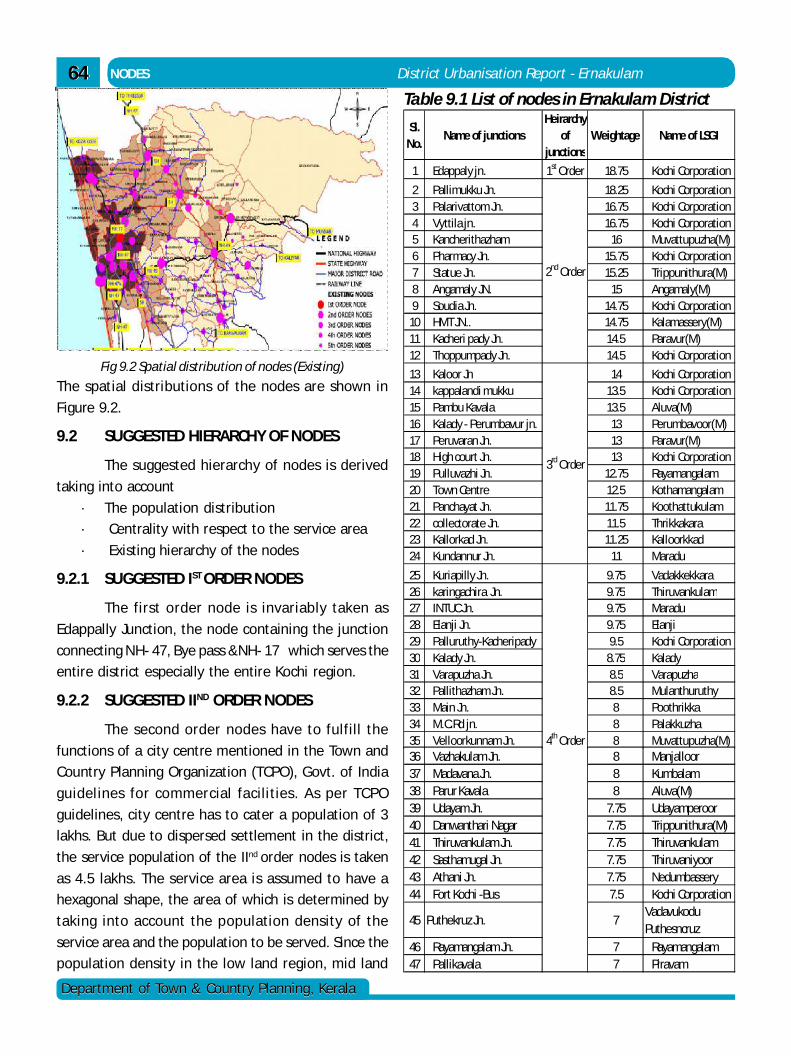
6464
Department of Town & Country Planning, KeralaDepartment of Town & Country Planning, Kerala
NODES District Urbanisation Report - Ernakulam
Table 9.1 List of nodes in Ernakulam District
Sl. No.
Name of junctionsHeirarchy
of junctions
Weightage Name of LSGI
1 Edappaly jn. 1st Order 18.75 Kochi Corporation
2 Pallimukku Jn. 18.25 Kochi Corporation3 Palarivattom Jn. 16.75 Kochi Corporation4 Vyttila jn. 16.75 Kochi Corporation5 Kancherithazham 16 Muvattupuzha(M)6 Pharmacy Jn. 15.75 Kochi Corporation7 Statue Jn. 15.25 Trippunithura(M)8 Angamaly JN. 15 Angamaly(M)9 Soudia Jn. 14.75 Kochi Corporation
10 HMT JN.. 14.75 Kalamassery(M)11 Kacheri pady Jn. 14.5 Paravur(M)12 Thoppumpady Jn. 14.5 Kochi Corporation
13 Kaloor Jn 14 Kochi Corporation14 kappalandi mukku 13.5 Kochi Corporation15 Pambu Kavala 13.5 Aluva(M)16 Kalady - Perumbavur jn. 13 Perumbavoor(M)17 Peruvaran Jn. 13 Paravur(M)18 High court Jn. 13 Kochi Corporation19 Pulluvazhi Jn. 12.75 Rayamangalam20 Town Centre 12.5 Kothamangalam21 Panchayat Jn. 11.75 Koothattukulam22 collectorate Jn. 11.5 Thrikkakara23 Kallorkad Jn. 11.25 Kalloorkkad24 Kundannur Jn. 11 Maradu
25 Kuriapilly Jn. 9.75 Vadakkekkara26 karingachira Jn. 9.75 Thiruvankulam27 INTUC Jn. 9.75 Maradu28 Elanji Jn. 9.75 Elanji29 Palluruthy-Kacheripady 9.5 Kochi Corporation30 Kalady Jn. 8.75 Kalady31 Varapuzha Jn. 8.5 Varapuzha32 Pallithazham Jn. 8.5 Mulanthuruthy33 Main Jn. 8 Poothrikka34 M.C.Rd jn. 8 Palakkuzha35 Velloorkunnam Jn. 8 Muvattupuzha(M)
2nd Order
3rd Order
4th Order36 Vazhakulam Jn. 8 Manjalloor37 Madavana Jn. 8 Kumbalam38 Parur Kavala 8 Aluva(M)39 Udayam Jn. 7.75 Udayamperoor40 Danwanthari Nagar 7.75 Trippunithura(M)41 Thiruvankulam Jn. 7.75 Thiruvankulam42 Sasthamugal Jn. 7.75 Thiruvaniyoor43 Athani Jn. 7.75 Nedumbassery44 Fort Kochi -Bus 7.5 Kochi Corporation
45 Puthekruz Jn. 7Vadavukodu Puthesncruz
46 Rayamangalam Jn. 7 Rayamangalam47 Pallikavala 7 Piravam
Fig 9.2 Spatial distribution of nodes (Existing)
The spatial distributions of the nodes are shown in
Figure 9.2.
9.2 SUGGESTED HIERARCHY OF NODES
The suggested hierarchy of nodes is derived
taking into account
· The population distribution
· Centrality with respect to the service area
· Existing hierarchy of the nodes
9.2.1 SUGGESTED IST ORDER NODES
The first order node is invariably taken as
Edappally Junction, the node containing the junction
connecting NH- 47, Bye pass &NH- 17 which serves the
entire district especially the entire Kochi region.
9.2.2 SUGGESTED IIND ORDER NODES
The second order nodes have to fulfill the
functions of a city centre mentioned in the Town and
Country Planning Organization (TCPO), Govt. of India
guidelines for commercial facilities. As per TCPO
guidelines, city centre has to cater a population of 3
lakhs. But due to dispersed settlement in the district,
the service population of the IInd order nodes is taken
as 4.5 lakhs. The service area is assumed to have a
hexagonal shape, the area of which is determined by
taking into account the population density of the
service area and the population to be served. Since the
population density in the low land region, mid land
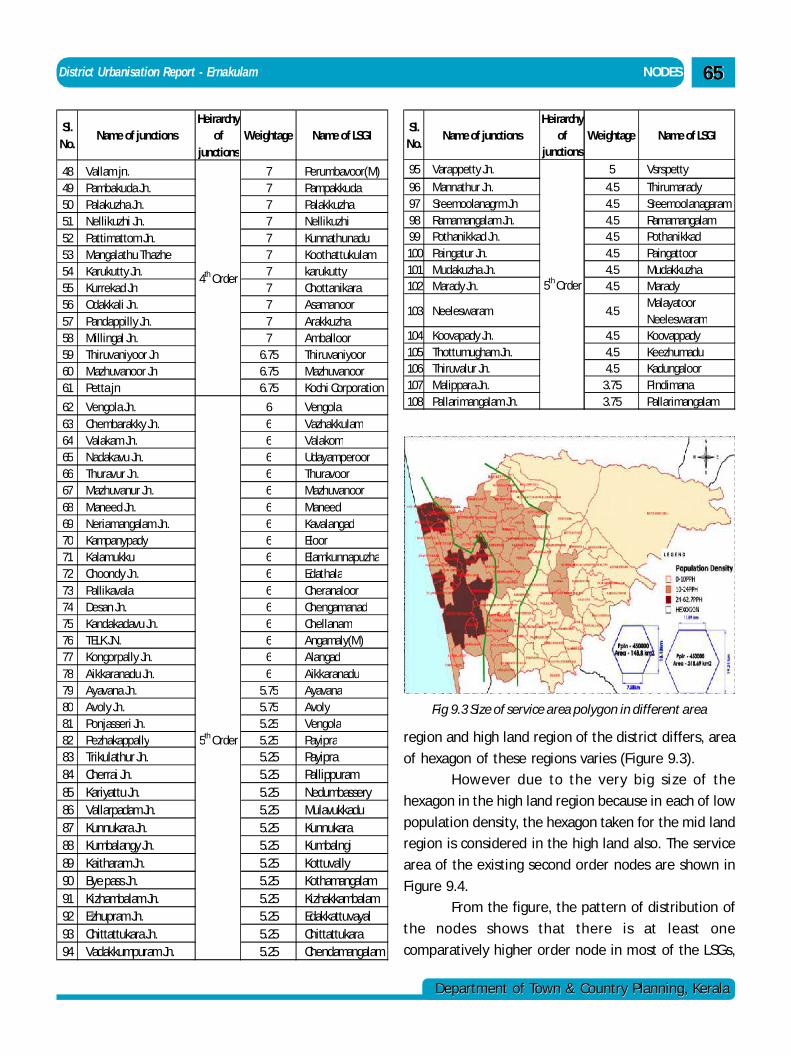
District Urbanisation Report - Ernakulam NODES
Department of Town & Country Planning, KeralaDepartment of Town & Country Planning, Kerala
6565
Sl. No.
Name of junctionsHeirarchy
of junctions
Weightage Name of LSGI
95 Varappetty Jn. 5 Vsrspetty
96 Mannathur Jn. 4.5 Thirumarady97 Sreemoolanagrm Jn 4.5 Sreemoolanagaram98 Ramamangalam Jn. 4.5 Ramamangalam99 Pothanikkad Jn. 4.5 Pothanikkad100 Paingatur Jn. 4.5 Paingattoor101 Mudakuzha Jn. 4.5 Mudakkuzha102 Marady Jn. 4.5 Marady
103 Neeleswaram 4.5Malayatoor Neeleswaram
104 Koovapady Jn. 4.5 Koovappady105 Thottumugham Jn. 4.5 Keezhumadu106 Thiruvalur Jn. 4.5 Kadungaloor107 Malippara Jn. 3.75 Pindimana108 Pallarimangalam Jn. 3.75 Pallarimangalam
5th Order
Sl. No.
Name of junctionsHeirarchy
of junctions
Weightage Name of LSGI
48 Vallam jn. 7 Perumbavoor(M)49 Pambakuda Jn. 7 Pampakkuda50 Palakuzha Jn. 7 Palakkuzha51 Nellikuzhi Jn. 7 Nellikuzhi52 Pattimattom Jn. 7 Kunnathunadu53 Mangalathu Thazhe 7 Koothattukulam54 Karukutty Jn. 7 karukutty55 Kurrekad Jn 7 Chottanikara56 Odakkali Jn. 7 Asamanoor57 Pandappilly Jn. 7 Arakkuzha58 Millingal Jn. 7 Amballoor59 Thiruvaniyoor Jn 6.75 Thiruvaniyoor 60 Mazhuvanoor Jn 6.75 Mazhuvanoor 61 Petta jn 6.75 Kochi Corporation
62 Vengola Jn. 6 Vengola63 Chembarakky Jn. 6 Vazhakkulam64 Valakam Jn. 6 Valakom65 Nadakavu Jn. 6 Udayamperoor66 Thuravur Jn. 6 Thuravoor67 Mazhuvanur Jn. 6 Mazhuvanoor68 Maneed Jn. 6 Maneed69 Neriamangalam Jn. 6 Kavalangad70 Kampanypady 6 Eloor71 Kalamukku 6 Elamkunnapuzha72 Choondy Jn. 6 Edathala73 Pallikavala 6 Cheranaloor74 Desan Jn. 6 Chengamanad75 Kandakadavu Jn. 6 Chellanam76 TELK JN. 6 Angamaly(M)77 Kongorpally Jn. 6 Alangad78 Aikkaranadu Jn. 6 Aikkaranadu79 Ayavana Jn. 5.75 Ayavana80 Avoly Jn. 5.75 Avoly81 Ponjasseri Jn. 5.25 Vengola82 Pezhakappally 5.25 Payipra
4th Order
5th Order83 Trikulathur Jn. 5.25 Payipra84 Cherrai Jn. 5.25 Pallippuram85 Kariyattu Jn. 5.25 Nedumbassery86 Vallarpadam Jn. 5.25 Mulavukkadu87 Kunnukara Jn. 5.25 Kunnukara88 Kumbalangy Jn. 5.25 Kumbalngi89 Kaitharam Jn. 5.25 Kottuvally90 Bye pass Jn. 5.25 Kothamangalam91 Kizhambalam Jn. 5.25 Kizhakkambalam92 Ezhupram Jn. 5.25 Edakkattuvayal93 Chittattukara Jn. 5.25 Chittattukara94 Vadakkumpuram Jn. 5.25 Chendamangalam
Fig 9.3 Size of service area polygon in different area
region and high land region of the district differs, area
of hexagon of these regions varies (Figure 9.3).
However due to the very big size of the
hexagon in the high land region because in each of low
population density, the hexagon taken for the mid land
region is considered in the high land also. The service
area of the existing second order nodes are shown in
Figure 9.4.
From the figure, the pattern of distribution of
the nodes shows that there is at least one
comparatively higher order node in most of the LSGs,
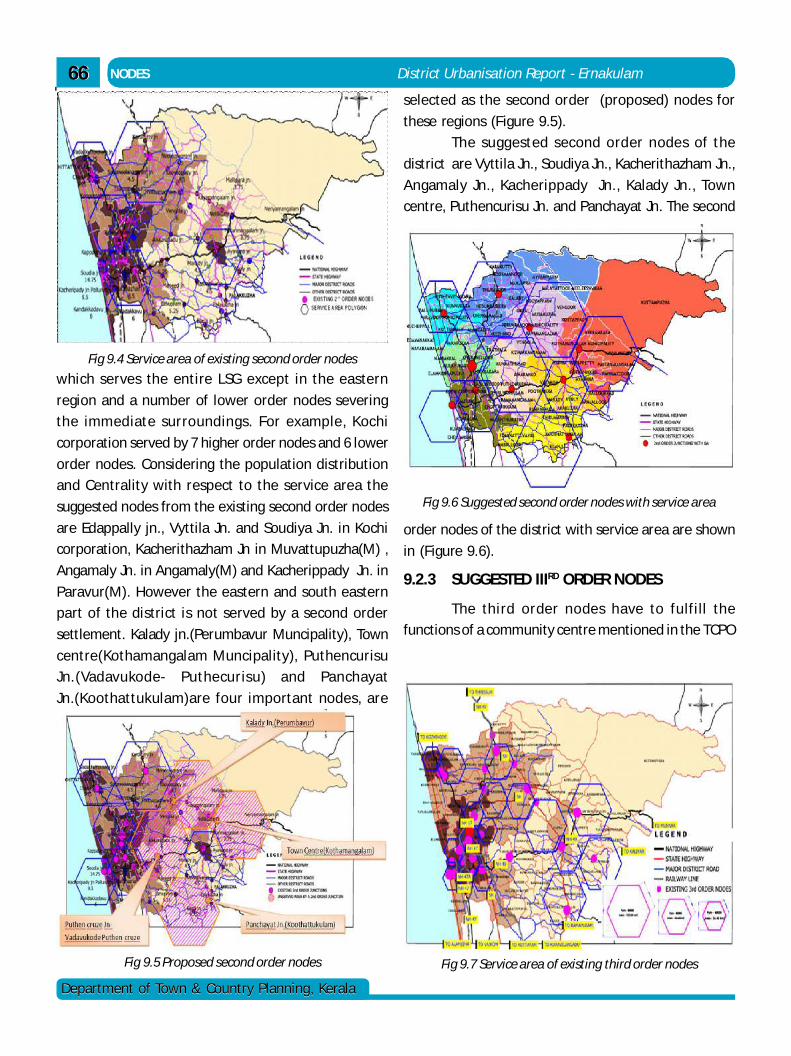
6666
Department of Town & Country Planning, KeralaDepartment of Town & Country Planning, Kerala
NODES District Urbanisation Report - Ernakulam
which serves the entire LSG except in the eastern
region and a number of lower order nodes severing
the immediate surroundings. For example, Kochi
corporation served by 7 higher order nodes and 6 lower
order nodes. Considering the population distribution
and Centrality with respect to the service area the
suggested nodes from the existing second order nodes
are Edappally jn., Vyttila Jn. and Soudiya Jn. in Kochi
corporation, Kacherithazham Jn in Muvattupuzha(M) ,
Angamaly Jn. in Angamaly(M) and Kacherippady Jn. in
Paravur(M). However the eastern and south eastern
part of the district is not served by a second order
settlement. Kalady jn.(Perumbavur Muncipality), Town
centre(Kothamangalam Muncipality), Puthencurisu
Jn.(Vadavukode- Puthecurisu) and Panchayat
Jn.(Koothattukulam)are four important nodes, are
Fig 9.4 Service area of existing second order nodes
Fig 9.5 Proposed second order nodes
selected as the second order (proposed) nodes for
these regions (Figure 9.5).
The suggested second order nodes of the
district are Vyttila Jn., Soudiya Jn., Kacherithazham Jn.,
Angamaly Jn., Kacherippady Jn., Kalady Jn., Town
centre, Puthencurisu Jn. and Panchayat Jn. The second
Fig 9.6 Suggested second order nodes with service area
order nodes of the district with service area are shown
in (Figure 9.6).
9.2.3 SUGGESTED IIIRD ORDER NODES
The third order nodes have to fulfill the
functions of a community centre mentioned in the TCPO
Fig 9.7 Service area of existing third order nodes
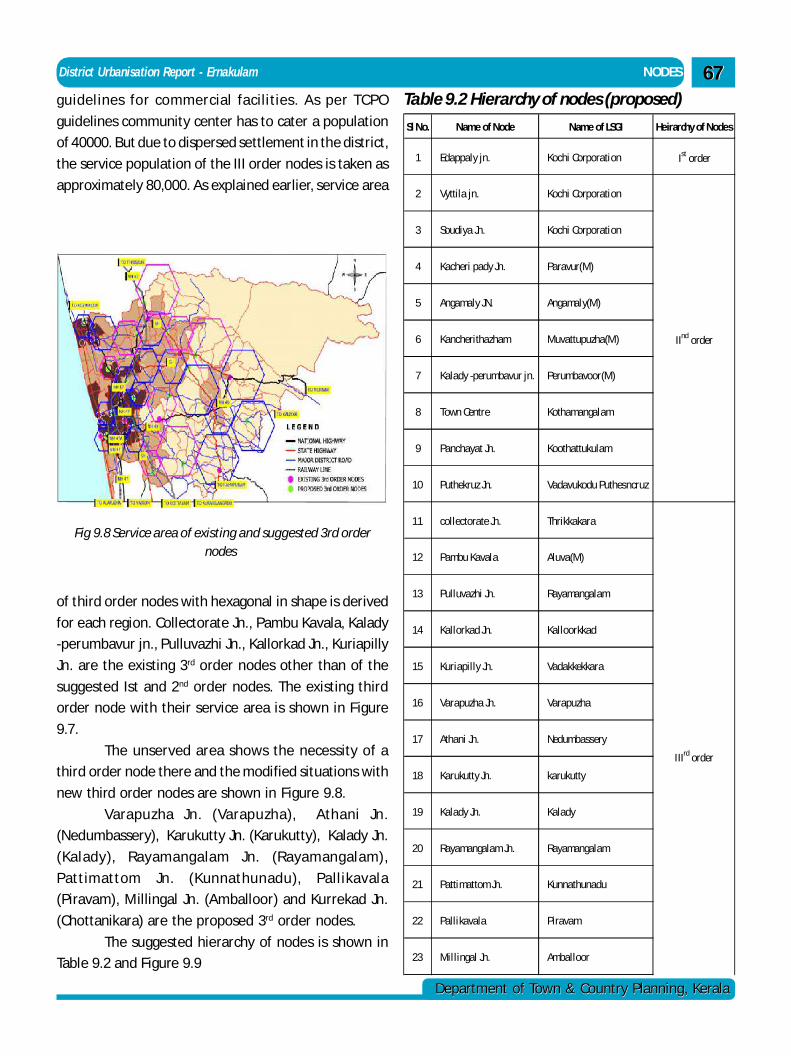
District Urbanisation Report - Ernakulam NODES
Department of Town & Country Planning, KeralaDepartment of Town & Country Planning, Kerala
6767guidelines for commercial facilities. As per TCPO
guidelines community center has to cater a population
of 40000. But due to dispersed settlement in the district,
the service population of the III order nodes is taken as
approximately 80,000. As explained earlier, service area
Fig 9.8 Service area of existing and suggested 3rd ordernodes
Sl No. Name of Node Name of LSGI Heirarchy of Nodes
1 Edappaly jn. Kochi Corporation Ist order
2 Vyttila jn. Kochi Corporation
3 Soudiya Jn. Kochi Corporation
4 Kacheri pady Jn. Paravur(M)
5 Angamaly JN. Angamaly(M)
6 Kancherithazham Muvattupuzha(M)
7 Kalady -perumbavur jn. Perumbavoor(M)
8 Town Centre Kothamangalam
9 Panchayat Jn. Koothattukulam
10 Puthekruz Jn. Vadavukodu Puthesncruz
11 collectorate Jn. Thrikkakara
12 Pambu Kavala Aluva(M)
13 Pulluvazhi Jn. Rayamangalam
14 Kallorkad Jn. Kalloorkkad
15 Kuriapilly Jn. Vadakkekkara
16 Varapuzha Jn. Varapuzha
17 Athani Jn. Nedumbassery
18 Karukutty Jn. karukutty
19 Kalady Jn. Kalady
20 Rayamangalam Jn. Rayamangalam
21 Pattimattom Jn. Kunnathunadu
22 Pallikavala Piravam
23 Millingal Jn. Amballoor
IInd order
IIIrd order
Table 9.2 Hierarchy of nodes (proposed)
of third order nodes with hexagonal in shape is derived
for each region. Collectorate Jn., Pambu Kavala, Kalady
-perumbavur jn., Pulluvazhi Jn., Kallorkad Jn., Kuriapilly
Jn. are the existing 3rd order nodes other than of the
suggested Ist and 2nd order nodes. The existing third
order node with their service area is shown in Figure
9.7.
The unserved area shows the necessity of a
third order node there and the modified situations with
new third order nodes are shown in Figure 9.8.
Varapuzha Jn. (Varapuzha), Athani Jn.
(Nedumbassery), Karukutty Jn. (Karukutty), Kalady Jn.
(Kalady), Rayamangalam Jn. (Rayamangalam),
Pattimattom Jn. (Kunnathunadu), Pallikavala
(Piravam), Millingal Jn. (Amballoor) and Kurrekad Jn.
(Chottanikara) are the proposed 3rd order nodes.
The suggested hierarchy of nodes is shown in
Table 9.2 and Figure 9.9
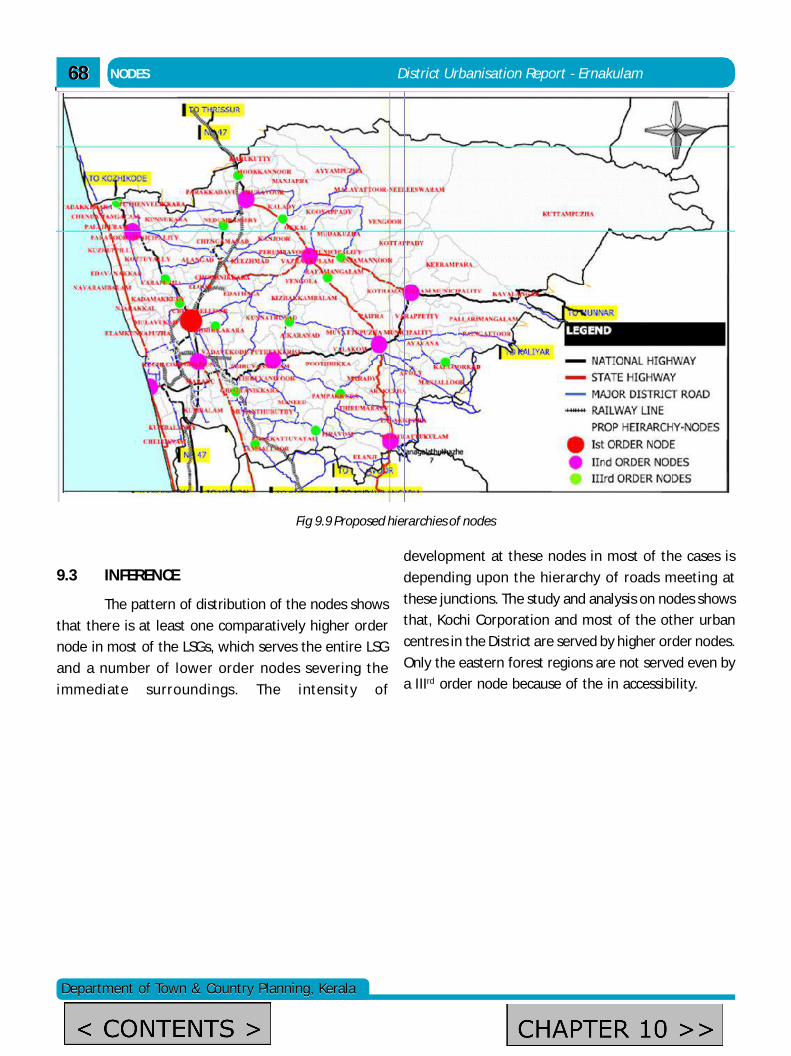
6868
Department of Town & Country Planning, KeralaDepartment of Town & Country Planning, Kerala
NODES District Urbanisation Report - Ernakulam
Fig 9.9 Proposed hierarchies of nodes
9.3 INFERENCE
The pattern of distribution of the nodes shows
that there is at least one comparatively higher order
node in most of the LSGs, which serves the entire LSG
and a number of lower order nodes severing the
immediate surroundings. The intensity of
development at these nodes in most of the cases is
depending upon the hierarchy of roads meeting at
these junctions. The study and analysis on nodes shows
that, Kochi Corporation and most of the other urban
centres in the District are served by higher order nodes.
Only the eastern forest regions are not served even by
a IIIrd order node because of the in accessibility.
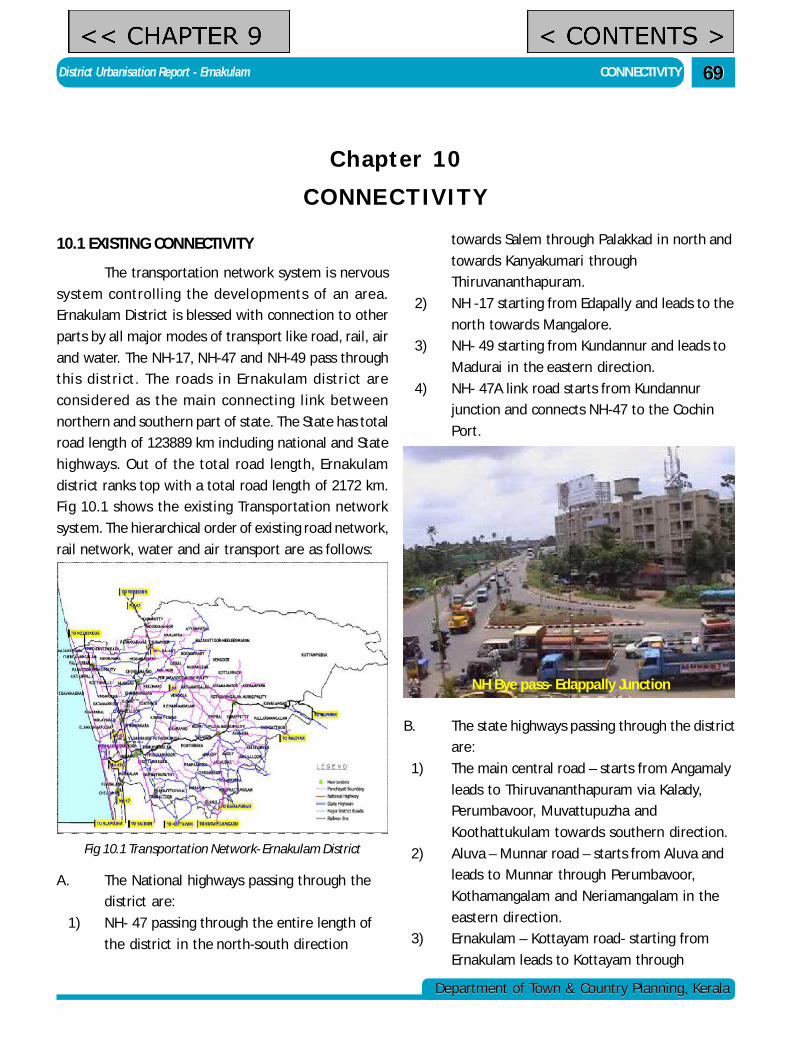
District Urbanisation Report - Ernakulam CONNECTIVITY
Department of Town & Country Planning, KeralaDepartment of Town & Country Planning, Kerala
6969
Chapter 10CONNECTIVITY
10.1 EXISTING CONNECTIVITY
The transportation network system is nervous
system controlling the developments of an area.
Ernakulam District is blessed with connection to other
parts by all major modes of transport like road, rail, air
and water. The NH-17, NH-47 and NH-49 pass through
this district. The roads in Ernakulam district are
considered as the main connecting link between
northern and southern part of state. The State has total
road length of 123889 km including national and State
highways. Out of the total road length, Ernakulam
district ranks top with a total road length of 2172 km.
Fig 10.1 shows the existing Transportation network
system. The hierarchical order of existing road network,
rail network, water and air transport are as follows:
towards Salem through Palakkad in north and
towards Kanyakumari through
Thiruvananthapuram.
2) NH -17 starting from Edapally and leads to the
north towards Mangalore.
3) NH- 49 starting from Kundannur and leads to
Madurai in the eastern direction.
4) NH- 47A link road starts from Kundannur
junction and connects NH-47 to the Cochin
Port.
Fig 10.1 Transportation Network- Ernakulam District
A. The National highways passing through the
district are:
1) NH- 47 passing through the entire length of
the district in the north-south direction
NH Bye pass- Edappally Junction
B. The state highways passing through the district
are:
1) The main central road – starts from Angamaly
leads to Thiruvananthapuram via Kalady,
Perumbavoor, Muvattupuzha and
Koothattukulam towards southern direction.
2) Aluva – Munnar road – starts from Aluva and
leads to Munnar through Perumbavoor,
Kothamangalam and Neriamangalam in the
eastern direction.
3) Ernakulam – Kottayam road- starting from
Ernakulam leads to Kottayam through
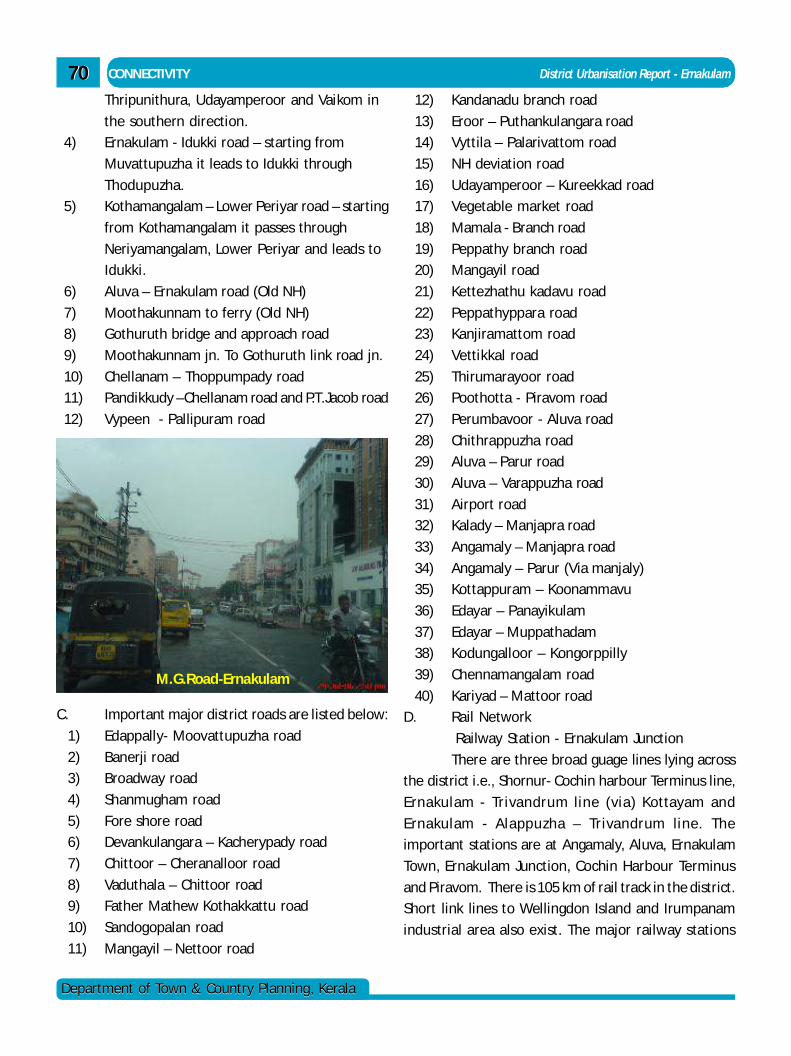
7070
Department of Town & Country Planning, KeralaDepartment of Town & Country Planning, Kerala
CONNECTIVITY District Urbanisation Report - Ernakulam
Thripunithura, Udayamperoor and Vaikom in
the southern direction.
4) Ernakulam - Idukki road – starting from
Muvattupuzha it leads to Idukki through
Thodupuzha.
5) Kothamangalam – Lower Periyar road – starting
from Kothamangalam it passes through
Neriyamangalam, Lower Periyar and leads to
Idukki.
6) Aluva – Ernakulam road (Old NH)
7) Moothakunnam to ferry (Old NH)
8) Gothuruth bridge and approach road
9) Moothakunnam jn. To Gothuruth link road jn.
10) Chellanam – Thoppumpady road
11) Pandikkudy –Chellanam road and P.T.Jacob road
12) Vypeen - Pallipuram road
12) Kandanadu branch road
13) Eroor – Puthankulangara road
14) Vyttila – Palarivattom road
15) NH deviation road
16) Udayamperoor – Kureekkad road
17) Vegetable market road
18) Mamala - Branch road
19) Peppathy branch road
20) Mangayil road
21) Kettezhathu kadavu road
22) Peppathyppara road
23) Kanjiramattom road
24) Vettikkal road
25) Thirumarayoor road
26) Poothotta - Piravom road
27) Perumbavoor - Aluva road
28) Chithrappuzha road
29) Aluva – Parur road
30) Aluva – Varappuzha road
31) Airport road
32) Kalady – Manjapra road
33) Angamaly – Manjapra road
34) Angamaly – Parur (Via manjaly)
35) Kottappuram – Koonammavu
36) Edayar – Panayikulam
37) Edayar – Muppathadam
38) Kodungalloor – Kongorppilly
39) Chennamangalam road
40) Kariyad – Mattoor road
D. Rail Network
Railway Station - Ernakulam Junction
There are three broad guage lines lying across
the district i.e., Shornur- Cochin harbour Terminus line,
Ernakulam - Trivandrum line (via) Kottayam and
Ernakulam - Alappuzha – Trivandrum line. The
important stations are at Angamaly, Aluva, Ernakulam
Town, Ernakulam Junction, Cochin Harbour Terminus
and Piravom. There is 105 km of rail track in the district.
Short link lines to Wellingdon Island and Irumpanam
industrial area also exist. The major railway stations
M.G.Road-Ernakulam
C. Important major district roads are listed below:
1) Edappally- Moovattupuzha road
2) Banerji road
3) Broadway road
4) Shanmugham road
5) Fore shore road
6) Devankulangara – Kacherypady road
7) Chittoor – Cheranalloor road
8) Vaduthala – Chittoor road
9) Father Mathew Kothakkattu road
10) Sandogopalan road
11) Mangayil – Nettoor road
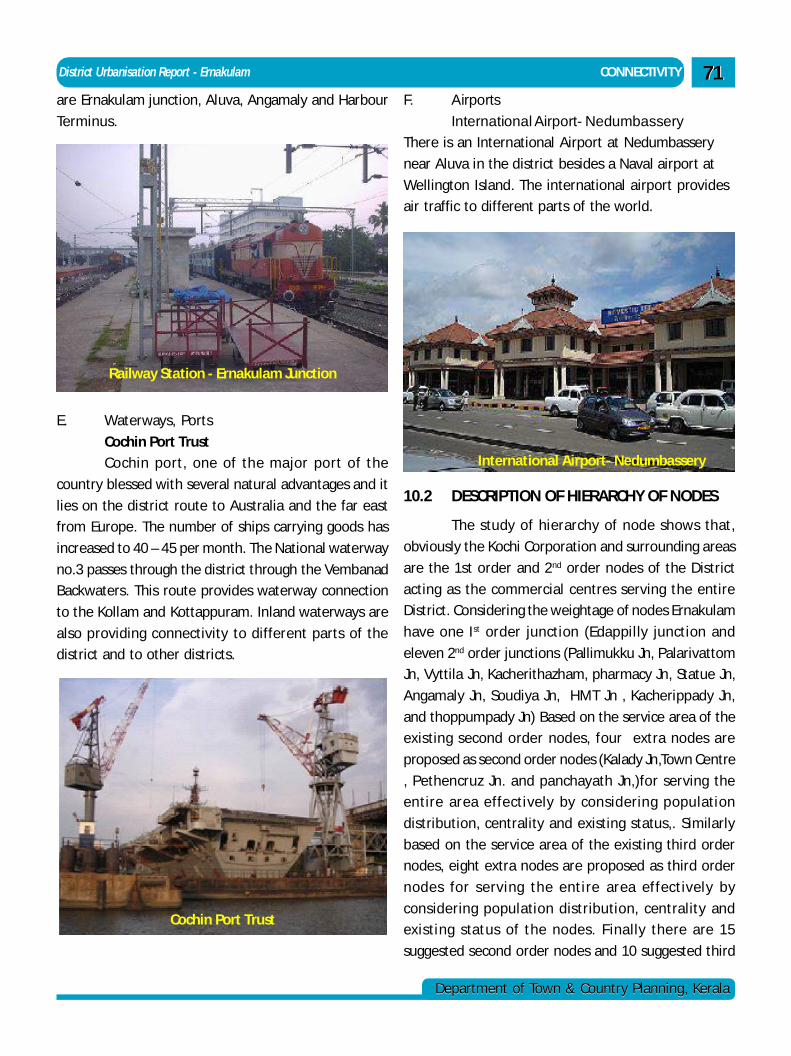
District Urbanisation Report - Ernakulam CONNECTIVITY
Department of Town & Country Planning, KeralaDepartment of Town & Country Planning, Kerala
7171are Ernakulam junction, Aluva, Angamaly and Harbour
Terminus.
F. AirportsInternational Airport- Nedumbassery
There is an International Airport at Nedumbassery
near Aluva in the district besides a Naval airport at
Wellington Island. The international airport provides
air traffic to different parts of the world.
Railway Station - Ernakulam Junction
Cochin Port Trust
E. Waterways, Ports
Cochin Port Trust
Cochin port, one of the major port of the
country blessed with several natural advantages and it
lies on the district route to Australia and the far east
from Europe. The number of ships carrying goods has
increased to 40 – 45 per month. The National waterway
no.3 passes through the district through the Vembanad
Backwaters. This route provides waterway connection
to the Kollam and Kottappuram. Inland waterways are
also providing connectivity to different parts of the
district and to other districts.
International Airport- Nedumbassery
10.2 DESCRIPTION OF HIERARCHY OF NODES
The study of hierarchy of node shows that,
obviously the Kochi Corporation and surrounding areas
are the 1st order and 2nd order nodes of the District
acting as the commercial centres serving the entire
District. Considering the weightage of nodes Ernakulam
have one Ist order junction (Edappilly junction and
eleven 2nd order junctions (Pallimukku Jn, Palarivattom
Jn, Vyttila Jn, Kacherithazham, pharmacy Jn, Statue Jn,
Angamaly Jn, Soudiya Jn, HMT Jn , Kacherippady Jn,
and thoppumpady Jn) Based on the service area of the
existing second order nodes, four extra nodes are
proposed as second order nodes (Kalady Jn,Town Centre
, Pethencruz Jn. and panchayath Jn,)for serving the
entire area effectively by considering population
distribution, centrality and existing status,. Similarly
based on the service area of the existing third order
nodes, eight extra nodes are proposed as third order
nodes for serving the entire area effectively by
considering population distribution, centrality and
existing status of the nodes. Finally there are 15
suggested second order nodes and 10 suggested third
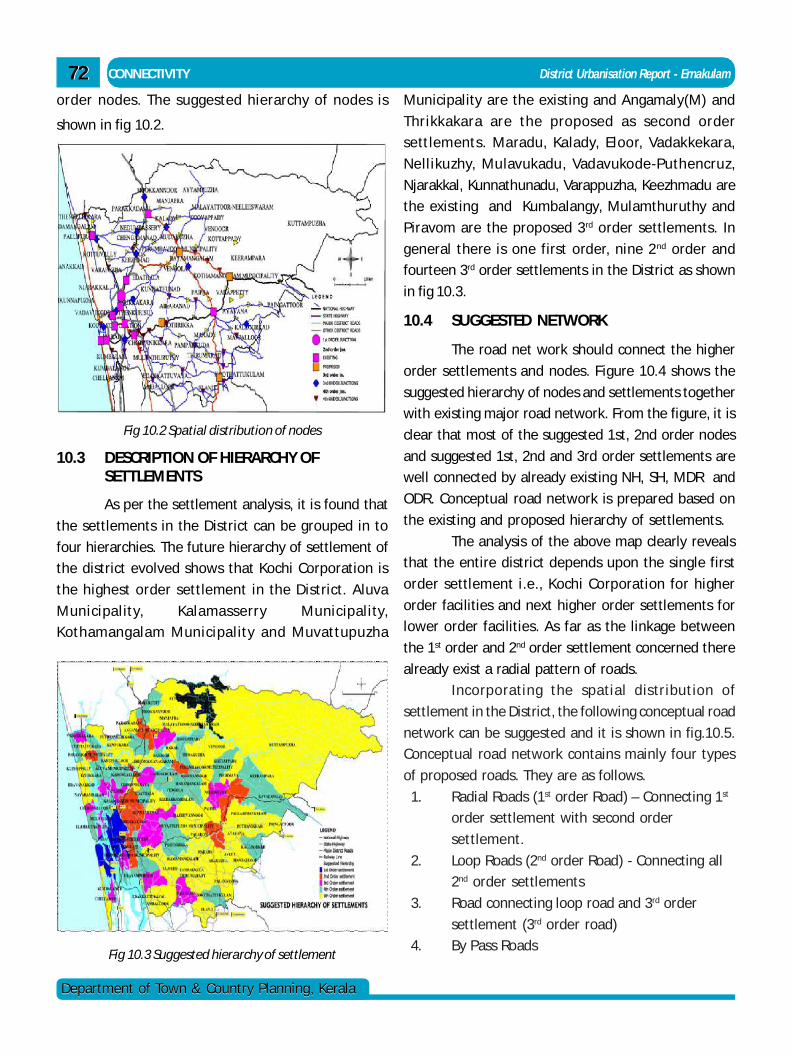
7272
Department of Town & Country Planning, KeralaDepartment of Town & Country Planning, Kerala
CONNECTIVITY District Urbanisation Report - Ernakulam
order nodes. The suggested hierarchy of nodes is
shown in fig 10.2.
Fig 10.2 Spatial distribution of nodes
10.3 DESCRIPTION OF HIERARCHY OFSETTLEMENTS
As per the settlement analysis, it is found that
the settlements in the District can be grouped in to
four hierarchies. The future hierarchy of settlement of
the district evolved shows that Kochi Corporation is
the highest order settlement in the District. Aluva
Municipality, Kalamasserry Municipality,
Kothamangalam Municipality and Muvattupuzha
Municipality are the existing and Angamaly(M) and
Thrikkakara are the proposed as second order
settlements. Maradu, Kalady, Eloor, Vadakkekara,
Nellikuzhy, Mulavukadu, Vadavukode-Puthencruz,
Njarakkal, Kunnathunadu, Varappuzha, Keezhmadu are
the existing and Kumbalangy, Mulamthuruthy and
Piravom are the proposed 3rd order settlements. In
general there is one first order, nine 2nd order and
fourteen 3rd order settlements in the District as shown
in fig 10.3.
10.4 SUGGESTED NETWORK
The road net work should connect the higher
order settlements and nodes. Figure 10.4 shows the
suggested hierarchy of nodes and settlements together
with existing major road network. From the figure, it is
clear that most of the suggested 1st, 2nd order nodes
and suggested 1st, 2nd and 3rd order settlements are
well connected by already existing NH, SH, MDR and
ODR. Conceptual road network is prepared based on
the existing and proposed hierarchy of settlements.
The analysis of the above map clearly reveals
that the entire district depends upon the single first
order settlement i.e., Kochi Corporation for higher
order facilities and next higher order settlements for
lower order facilities. As far as the linkage between
the 1st order and 2nd order settlement concerned there
already exist a radial pattern of roads.
Incorporating the spatial distribution of
settlement in the District, the following conceptual road
network can be suggested and it is shown in fig.10.5.
Conceptual road network contains mainly four types
of proposed roads. They are as follows.
1. Radial Roads (1st order Road) – Connecting 1st
order settlement with second order
settlement.
2. Loop Roads (2nd order Road) - Connecting all
2nd order settlements
3. Road connecting loop road and 3rd order
settlement (3rd order road)
4. By Pass RoadsFig 10.3 Suggested hierarchy of settlement
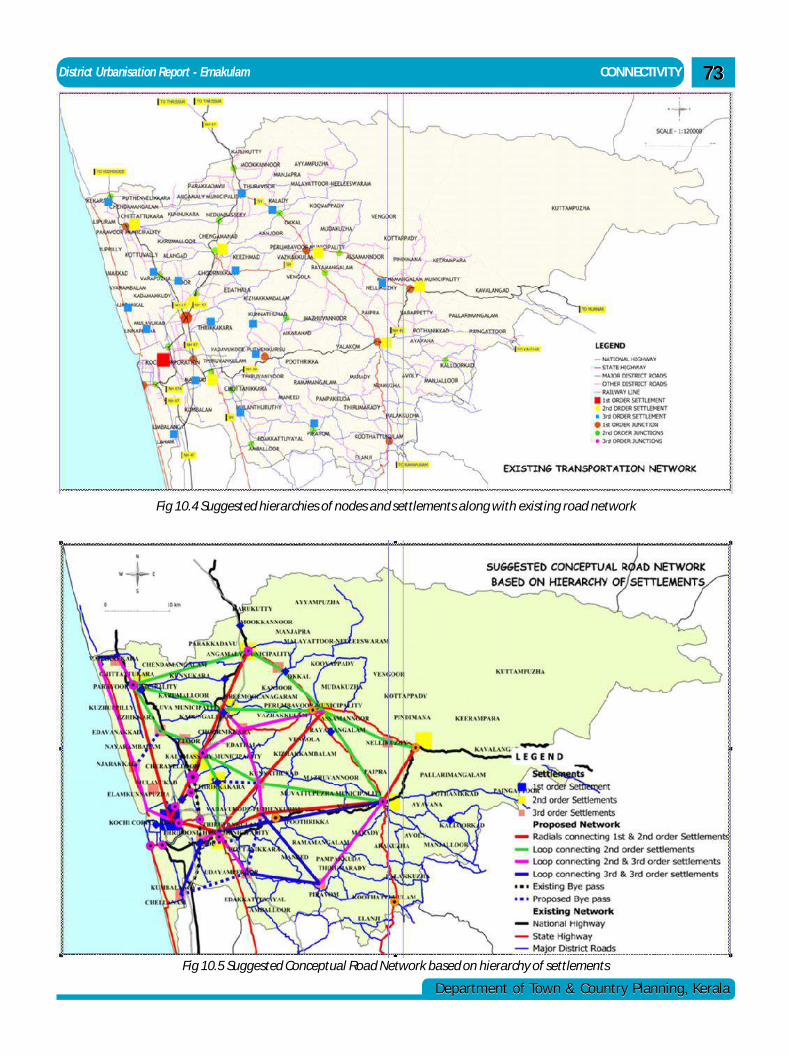
District Urbanisation Report - Ernakulam CONNECTIVITY
Department of Town & Country Planning, KeralaDepartment of Town & Country Planning, Kerala
7373
Fig 10.4 Suggested hierarchies of nodes and settlements along with existing road network
Fig 10.5 Suggested Conceptual Road Network based on hierarchy of settlements
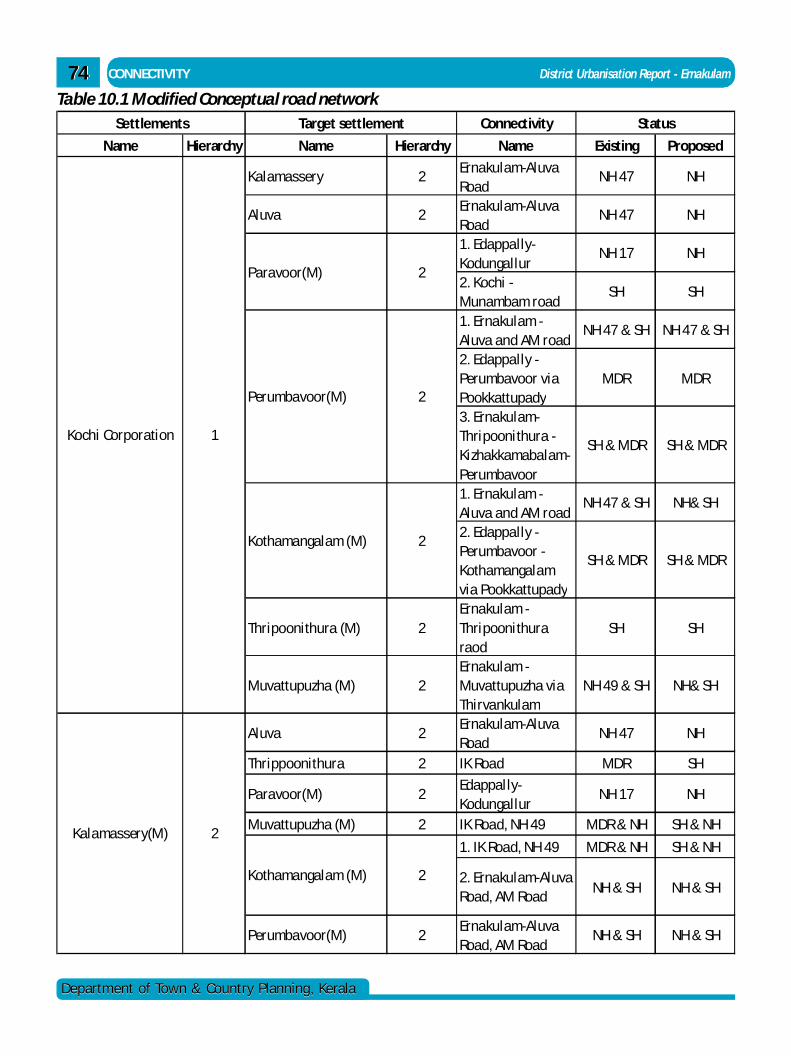
7474
Department of Town & Country Planning, KeralaDepartment of Town & Country Planning, Kerala
CONNECTIVITY District Urbanisation Report - Ernakulam
Connectivity
Name Hierarchy Name Hierarchy Name Existing Proposed
Kalamassery 2Ernakulam-Aluva Road
NH 47 NH
Aluva 2Ernakulam-Aluva Road
NH 47 NH
1. Edappally-Kodungallur
NH 17 NH
2. Kochi -Munambam road
SH SH
1. Ernakulam - Aluva and AM road
NH 47 & SH NH 47 & SH
2. Edappally - Perumbavoor via Pookkattupady
MDR MDR
3. Ernakulam-Thripoonithura - Kizhakkamabalam-Perumbavoor
SH & MDR SH & MDR
1. Ernakulam - Aluva and AM road
NH 47 & SH NH& SH
2. Edappally - Perumbavoor - Kothamangalam via Pookkattupady
SH & MDR SH & MDR
Thripoonithura (M) 2Ernakulam - Thripoonithura raod
SH SH
Muvattupuzha (M) 2Ernakulam - Muvattupuzha via Thirvankulam
NH 49 & SH NH& SH
Aluva 2Ernakulam-Aluva Road
NH 47 NH
Thrippoonithura 2 IK Road MDR SH
Paravoor(M) 2Edappally-Kodungallur
NH 17 NH
Muvattupuzha (M) 2 IK Road, NH 49 MDR & NH SH & NH
1. IK Road, NH 49 MDR & NH SH & NH
2. Ernakulam-Aluva Road, AM Road
NH & SH NH & SH
Perumbavoor(M) 2Ernakulam-Aluva Road, AM Road
NH & SH NH & SH
Status
Kochi Corporation 1
Paravoor(M) 2
Perumbavoor(M) 2
Kothamangalam (M) 2
Kalamassery(M) 2
Kothamangalam (M) 2
Settlements Target settlement
Table 10.1 Modified Conceptual road network
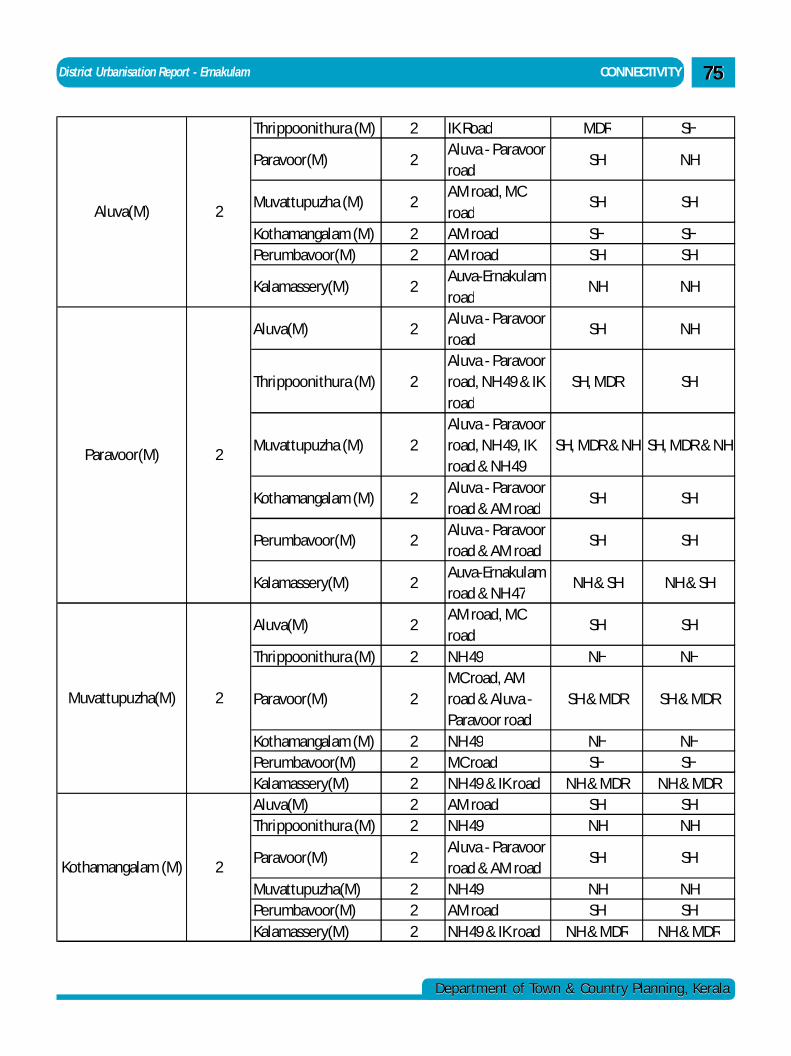
District Urbanisation Report - Ernakulam CONNECTIVITY
Department of Town & Country Planning, KeralaDepartment of Town & Country Planning, Kerala
7575
Thrippoonithura (M) 2 IK Road MDR SH
Paravoor(M) 2Aluva - Paravoor road
SH NH
Muvattupuzha (M) 2AM road, MC road
SH SH
Kothamangalam (M) 2 AM road SH SHPerumbavoor(M) 2 AM road SH SH
Kalamassery(M) 2Auva-Ernakulam road
NH NH
Aluva(M) 2Aluva - Paravoor road
SH NH
Thrippoonithura (M) 2Aluva - Paravoor road, NH 49 & IK road
SH, MDR SH
Muvattupuzha (M) 2Aluva - Paravoor road, NH 49, IK road & NH 49
SH, MDR & NH SH, MDR & NH
Kothamangalam (M) 2Aluva - Paravoor road & AM road
SH SH
Perumbavoor(M) 2Aluva - Paravoor road & AM road
SH SH
Kalamassery(M) 2Auva-Ernakulam road & NH 47
NH & SH NH & SH
Aluva(M) 2AM road, MC road
SH SH
Thrippoonithura (M) 2 NH 49 NH NH
Paravoor(M) 2MC road, AM road & Aluva - Paravoor road
SH & MDR SH & MDR
Kothamangalam (M) 2 NH 49 NH NHPerumbavoor(M) 2 MC road SH SHKalamassery(M) 2 NH 49 & IK road NH & MDR NH & MDRAluva(M) 2 AM road SH SHThrippoonithura (M) 2 NH 49 NH NH
Paravoor(M) 2Aluva - Paravoor road & AM road
SH SH
Muvattupuzha(M) 2 NH 49 NH NHPerumbavoor(M) 2 AM road SH SHKalamassery(M) 2 NH 49 & IK road NH & MDR NH & MDR
Kothamangalam (M) 2
Aluva(M) 2
Paravoor(M) 2
Muvattupuzha(M) 2
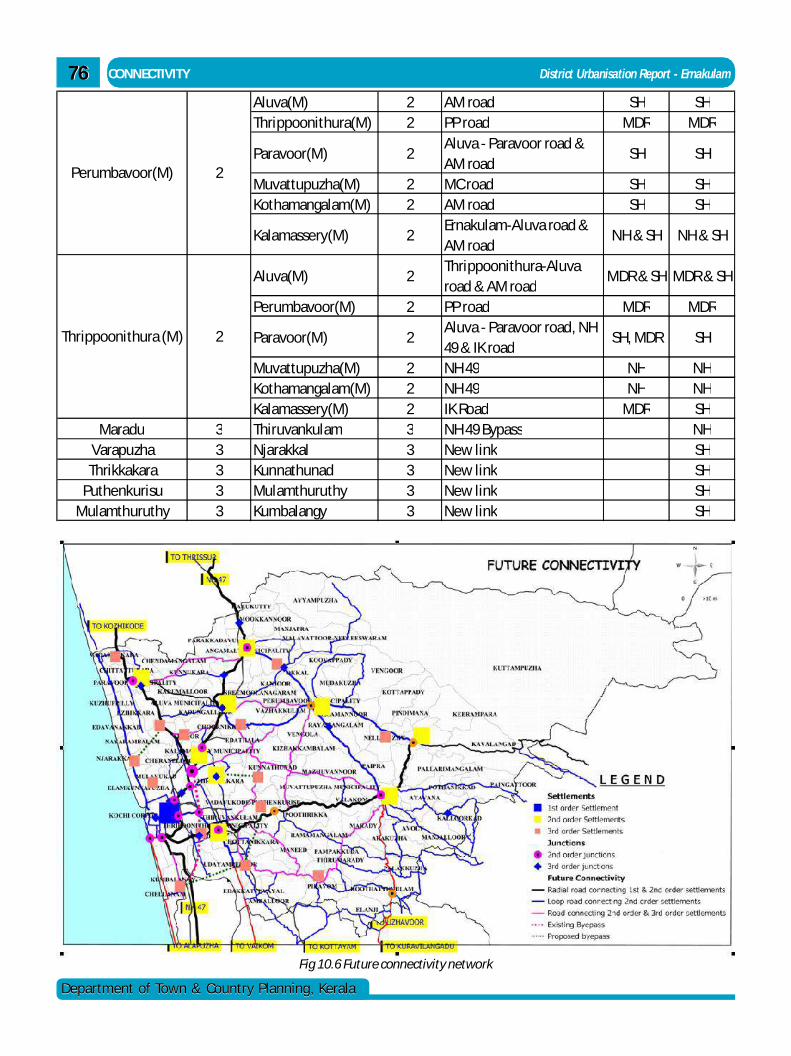
7676
Department of Town & Country Planning, KeralaDepartment of Town & Country Planning, Kerala
CONNECTIVITY District Urbanisation Report - Ernakulam
Aluva(M) 2 AM road SH SHThrippoonithura(M) 2 PP road MDR MDR
Paravoor(M) 2Aluva - Paravoor road & AM road
SH SH
Muvattupuzha(M) 2 MC road SH SHKothamangalam(M) 2 AM road SH SH
Kalamassery(M) 2Ernakulam-Aluva road & AM road
NH & SH NH & SH
Aluva(M) 2Thrippoonithura-Aluva road & AM road
MDR & SH MDR & SH
Perumbavoor(M) 2 PP road MDR MDR
Paravoor(M) 2Aluva - Paravoor road, NH 49 & IK road
SH, MDR SH
Muvattupuzha(M) 2 NH 49 NH NHKothamangalam(M) 2 NH 49 NH NHKalamassery(M) 2 IK Road MDR SH
Maradu 3 Thiruvankulam 3 NH 49 Bypass NHVarapuzha 3 Njarakkal 3 New link SHThrikkakara 3 Kunnathunad 3 New link SH
Puthenkurisu 3 Mulamthuruthy 3 New link SHMulamthuruthy 3 Kumbalangy 3 New link SH
Perumbavoor(M) 2
Thrippoonithura (M) 2
Fig 10.6 Future connectivity network
District Urbanisation Report - Ernakulam CONNECTIVITY
Department of Town & Country Planning, KeralaDepartment of Town & Country Planning, Kerala
7777
10.5 FUTURE CONNECTIVITY
Transportation always depends upon the
position of nodes and the rank of the nodes. In Kerala
scenario where perfect urban – rural continuum exist,
nodes play a crucial role in the transportation network.
Hence it is highly essential to modify the proposed road
network based on proposed hierarchy of nodes. So
modification of proposed road network based on the
hierarchy of nodes is necessary.
Based on the hierarchy of nodes, Edappally
Junction in Kochi Corporation becomes the first order
node. And based on the servicing area of the existing
eleven second order nodes, four extra nodes are
proposed as second order for serving the entire area
effectively by considering population distribution,
centrality and existing status of the nodes which is
described above. Similarly based on the servicing area
of the existing third order nodes, eight extra nodes are
proposed as third order nodes for serving the entire
area effectively by considering population distribution,
centrality and existing status of the nodes which is
described above.
By superimposing the proposed conceptual
road network with the proposed hierarchy of nodes, it
is found that most of the proposed and existing 1st,
2nd, 3rd order nodes are already incorporated in the
proposed road network and all other proposed and
existing 1st , 2nd and 3rd order nodes are well
connected by already existing NH, SH, MDR and ODR.
Future connectivity network contains mainly
four types of roads. They are shown in table 10.1 and
fig 10.6.
10.6 INFERENCE
As road transportation always depends upon
the position of nodes and rank of nodes, it is necessary
to modify the proposed road network based on the
proposed hierarchy of nodes. A future connectivity
network is prepared by superimposing the proposed
conceptual road network with the proposed hierarchy
of nodes.
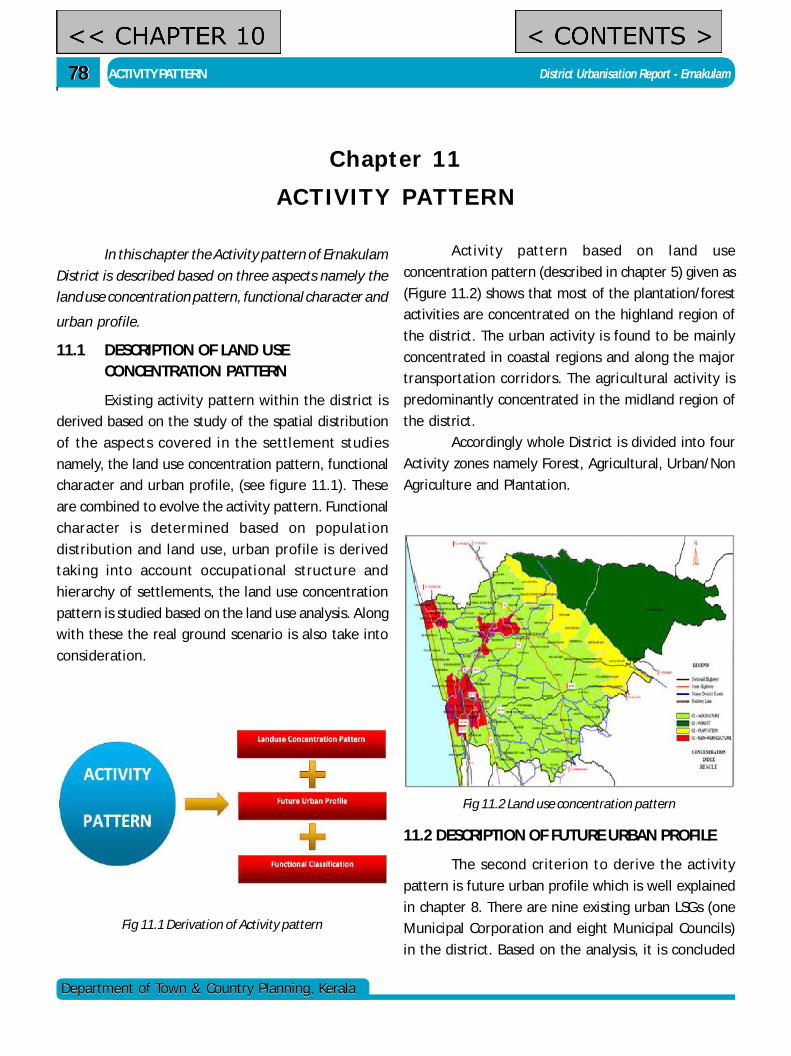
7878
Department of Town & Country Planning, KeralaDepartment of Town & Country Planning, Kerala
ACTIVITY PATTERN District Urbanisation Report - Ernakulam
Chapter 11ACTIVITY PATTERN
Fig 11.1 Derivation of Activity pattern
Fig 11.2 Land use concentration pattern
In this chapter the Activity pattern of Ernakulam
District is described based on three aspects namely the
land use concentration pattern, functional character and
urban profile.
11.1 DESCRIPTION OF LAND USECONCENTRATION PATTERN
Existing activity pattern within the district is
derived based on the study of the spatial distribution
of the aspects covered in the settlement studies
namely, the land use concentration pattern, functional
character and urban profile, (see figure 11.1). These
are combined to evolve the activity pattern. Functional
character is determined based on population
distribution and land use, urban profile is derived
taking into account occupational structure and
hierarchy of settlements, the land use concentration
pattern is studied based on the land use analysis. Along
with these the real ground scenario is also take into
consideration.
Activity pattern based on land use
concentration pattern (described in chapter 5) given as
(Figure 11.2) shows that most of the plantation/forest
activities are concentrated on the highland region of
the district. The urban activity is found to be mainly
concentrated in coastal regions and along the major
transportation corridors. The agricultural activity is
predominantly concentrated in the midland region of
the district.
Accordingly whole District is divided into four
Activity zones namely Forest, Agricultural, Urban/Non
Agriculture and Plantation.
11.2 DESCRIPTION OF FUTURE URBAN PROFILE
The second criterion to derive the activity
pattern is future urban profile which is well explained
in chapter 8. There are nine existing urban LSGs (one
Municipal Corporation and eight Municipal Councils)
in the district. Based on the analysis, it is concluded
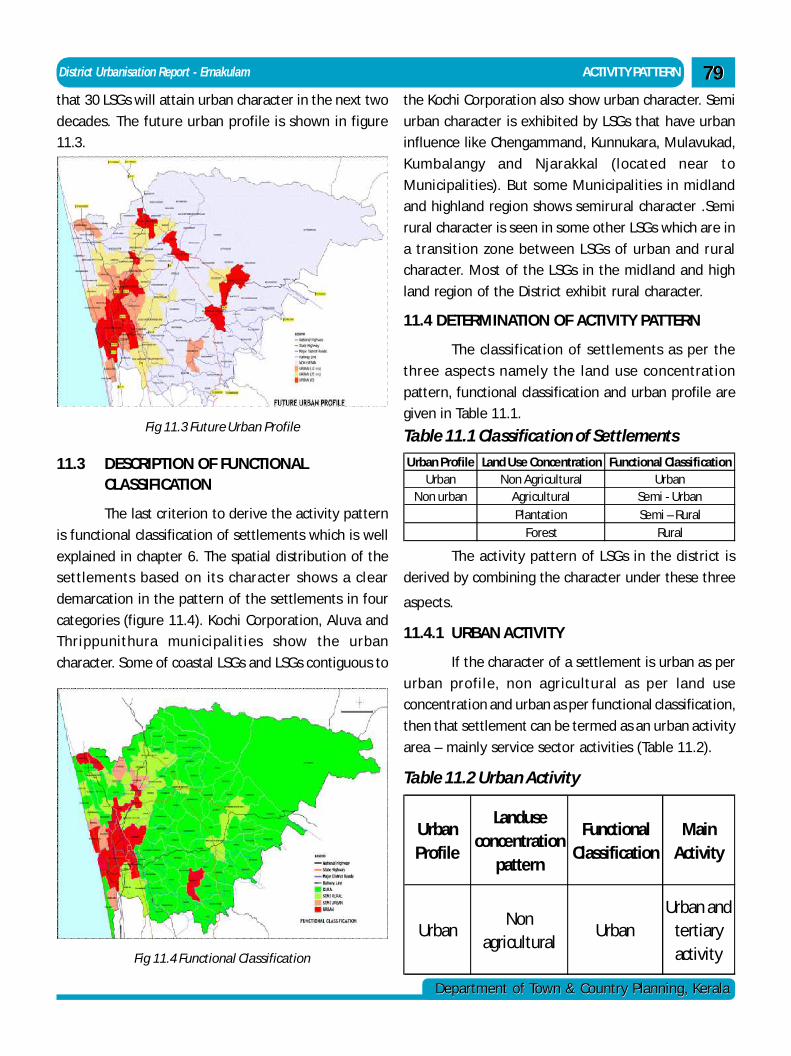
District Urbanisation Report - Ernakulam ACTIVITY PATTERN
Department of Town & Country Planning, KeralaDepartment of Town & Country Planning, Kerala
7979the Kochi Corporation also show urban character. Semi
urban character is exhibited by LSGs that have urban
influence like Chengammand, Kunnukara, Mulavukad,
Kumbalangy and Njarakkal (located near to
Municipalities). But some Municipalities in midland
and highland region shows semirural character .Semi
rural character is seen in some other LSGs which are in
a transition zone between LSGs of urban and rural
character. Most of the LSGs in the midland and high
land region of the District exhibit rural character.
11.4 DETERMINATION OF ACTIVITY PATTERN
The classification of settlements as per the
three aspects namely the land use concentration
pattern, functional classification and urban profile are
given in Table 11.1.Fig 11.3 Future Urban Profile
that 30 LSGs will attain urban character in the next two
decades. The future urban profile is shown in figure
11.3.
11.3 DESCRIPTION OF FUNCTIONALCLASSIFICATION
The last criterion to derive the activity pattern
is functional classification of settlements which is well
explained in chapter 6. The spatial distribution of the
settlements based on its character shows a clear
demarcation in the pattern of the settlements in four
categories (figure 11.4). Kochi Corporation, Aluva and
Thrippunithura municipalities show the urban
character. Some of coastal LSGs and LSGs contiguous to
Fig 11.4 Functional Classification
Urban Profile Land Use Concentration Functional ClassificationUrban Non Agricultural Urban
Non urban Agricultural Semi - UrbanPlantation Semi – Rural
Forest Rural
Table 11.1 Classification of Settlements
The activity pattern of LSGs in the district is
derived by combining the character under these three
aspects.
11.4.1 URBAN ACTIVITY
If the character of a settlement is urban as per
urban profile, non agricultural as per land use
concentration and urban as per functional classification,
then that settlement can be termed as an urban activity
area – mainly service sector activities (Table 11.2).
Urban Profile
Landuse concentration
pattern
Functional Classification
Main Activity
UrbanNon
agriculturalUrban
Urban and tertiary activity
Table 11.2 Urban Activity
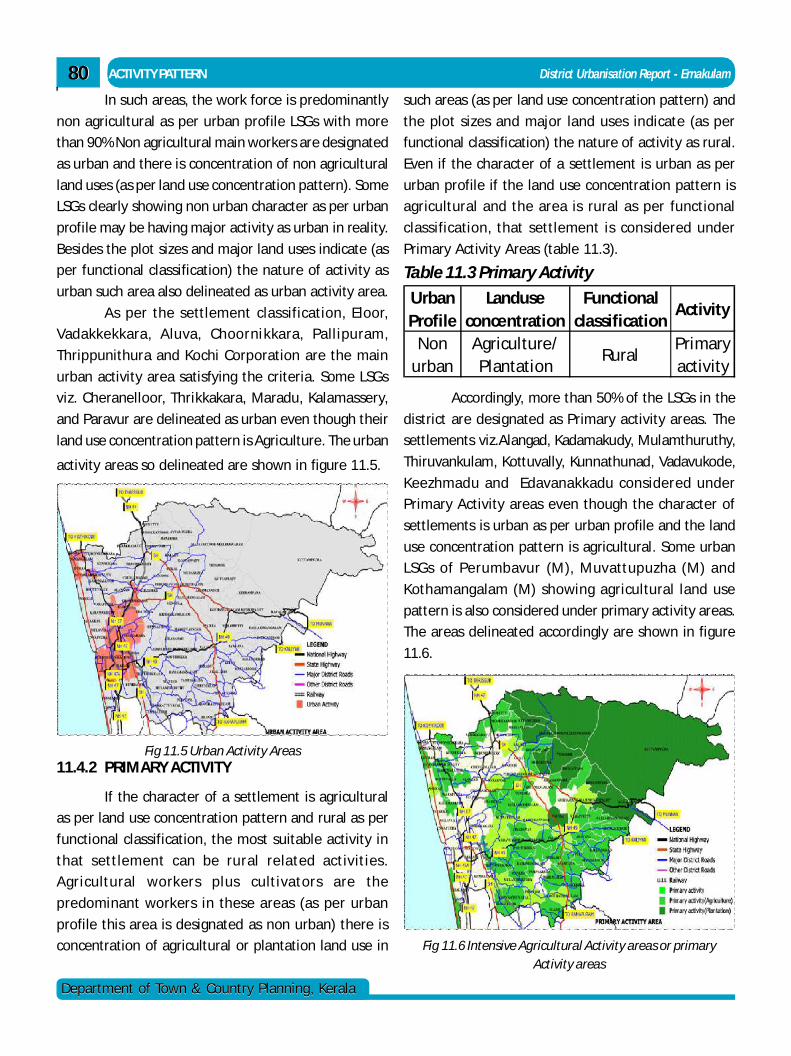
8080
Department of Town & Country Planning, KeralaDepartment of Town & Country Planning, Kerala
ACTIVITY PATTERN District Urbanisation Report - Ernakulam
In such areas, the work force is predominantly
non agricultural as per urban profile LSGs with more
than 90% Non agricultural main workers are designated
as urban and there is concentration of non agricultural
land uses (as per land use concentration pattern). Some
LSGs clearly showing non urban character as per urban
profile may be having major activity as urban in reality.
Besides the plot sizes and major land uses indicate (as
per functional classification) the nature of activity as
urban such area also delineated as urban activity area.
As per the settlement classification, Eloor,
Vadakkekkara, Aluva, Choornikkara, Pallipuram,
Thrippunithura and Kochi Corporation are the main
urban activity area satisfying the criteria. Some LSGs
viz. Cheranelloor, Thrikkakara, Maradu, Kalamassery,
and Paravur are delineated as urban even though their
land use concentration pattern is Agriculture. The urban
activity areas so delineated are shown in figure 11.5.
Fig 11.5 Urban Activity Areas11.4.2 PRIMARY ACTIVITY
If the character of a settlement is agricultural
as per land use concentration pattern and rural as per
functional classification, the most suitable activity in
that settlement can be rural related activities.
Agricultural workers plus cultivators are the
predominant workers in these areas (as per urban
profile this area is designated as non urban) there is
concentration of agricultural or plantation land use in
such areas (as per land use concentration pattern) and
the plot sizes and major land uses indicate (as per
functional classification) the nature of activity as rural.
Even if the character of a settlement is urban as per
urban profile if the land use concentration pattern is
agricultural and the area is rural as per functional
classification, that settlement is considered under
Primary Activity Areas (table 11.3).
Fig 11.6 Intensive Agricultural Activity areas or primaryActivity areas
Urban Profile
Landuse concentration
Functional classification
Activity
Non urban
Agriculture/ Plantation
RuralPrimary activity
Table 11.3 Primary Activity
Accordingly, more than 50% of the LSGs in the
district are designated as Primary activity areas. The
settlements viz.Alangad, Kadamakudy, Mulamthuruthy,
Thiruvankulam, Kottuvally, Kunnathunad, Vadavukode,
Keezhmadu and Edavanakkadu considered under
Primary Activity areas even though the character of
settlements is urban as per urban profile and the land
use concentration pattern is agricultural. Some urban
LSGs of Perumbavur (M), Muvattupuzha (M) and
Kothamangalam (M) showing agricultural land use
pattern is also considered under primary activity areas.
The areas delineated accordingly are shown in figure
11.6.
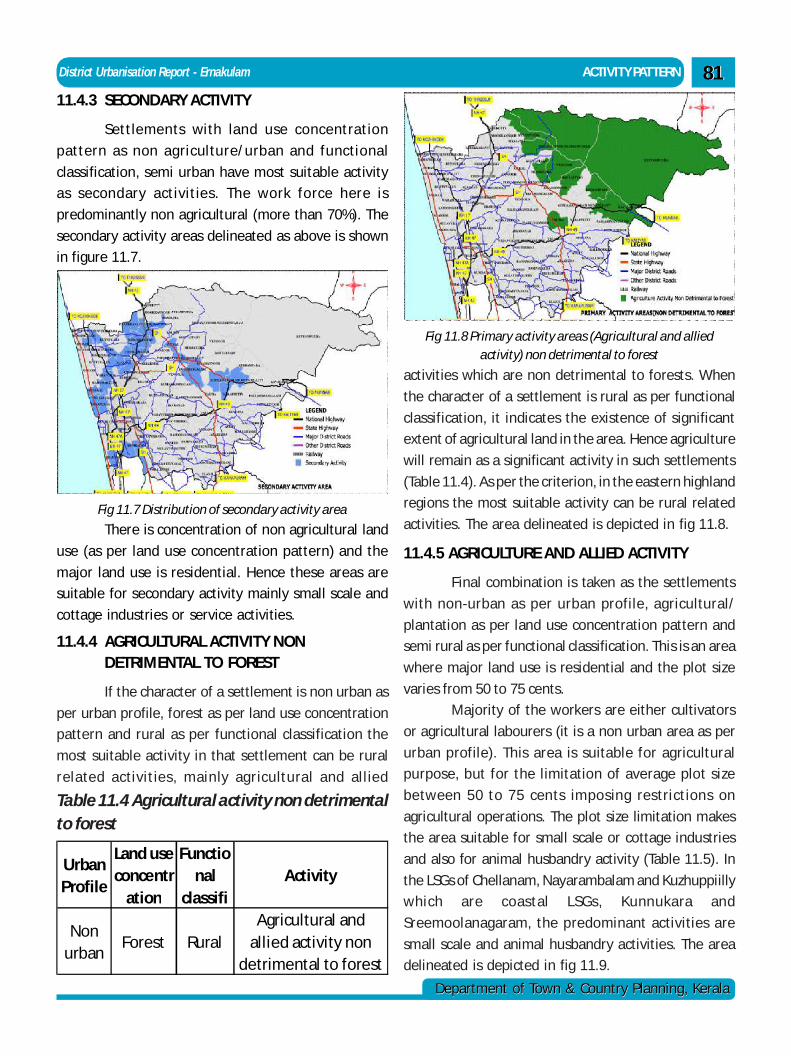
District Urbanisation Report - Ernakulam ACTIVITY PATTERN
Department of Town & Country Planning, KeralaDepartment of Town & Country Planning, Kerala
818111.4.3 SECONDARY ACTIVITY
Settlements with land use concentration
pattern as non agriculture/urban and functional
classification, semi urban have most suitable activity
as secondary activities. The work force here is
predominantly non agricultural (more than 70%). The
secondary activity areas delineated as above is shown
in figure 11.7.
Fig 11.7 Distribution of secondary activity area
There is concentration of non agricultural land
use (as per land use concentration pattern) and the
major land use is residential. Hence these areas are
suitable for secondary activity mainly small scale and
cottage industries or service activities.
11.4.4 AGRICULTURAL ACTIVITY NONDETRIMENTAL TO FOREST
If the character of a settlement is non urban as
per urban profile, forest as per land use concentration
pattern and rural as per functional classification the
most suitable activity in that settlement can be rural
related activities, mainly agricultural and allied
Fig 11.8 Primary activity areas (Agricultural and alliedactivity) non detrimental to forest
activities which are non detrimental to forests. When
the character of a settlement is rural as per functional
classification, it indicates the existence of significant
extent of agricultural land in the area. Hence agriculture
will remain as a significant activity in such settlements
(Table 11.4). As per the criterion, in the eastern highland
regions the most suitable activity can be rural related
activities. The area delineated is depicted in fig 11.8.
11.4.5 AGRICULTURE AND ALLIED ACTIVITY
Final combination is taken as the settlements
with non-urban as per urban profile, agricultural/
plantation as per land use concentration pattern and
semi rural as per functional classification. This is an area
where major land use is residential and the plot size
varies from 50 to 75 cents.
Majority of the workers are either cultivators
or agricultural labourers (it is a non urban area as per
urban profile). This area is suitable for agricultural
purpose, but for the limitation of average plot size
between 50 to 75 cents imposing restrictions on
agricultural operations. The plot size limitation makes
the area suitable for small scale or cottage industries
and also for animal husbandry activity (Table 11.5). In
the LSGs of Chellanam, Nayarambalam and Kuzhuppiilly
which are coastal LSGs, Kunnukara and
Sreemoolanagaram, the predominant activities are
small scale and animal husbandry activities. The area
delineated is depicted in fig 11.9.
Urban Profile
Land use concentr
ation
Functional
classifiActivity
Non urban
Forest RuralAgricultural and
allied activity non detrimental to forest
Table 11.4 Agricultural activity non detrimentalto forest
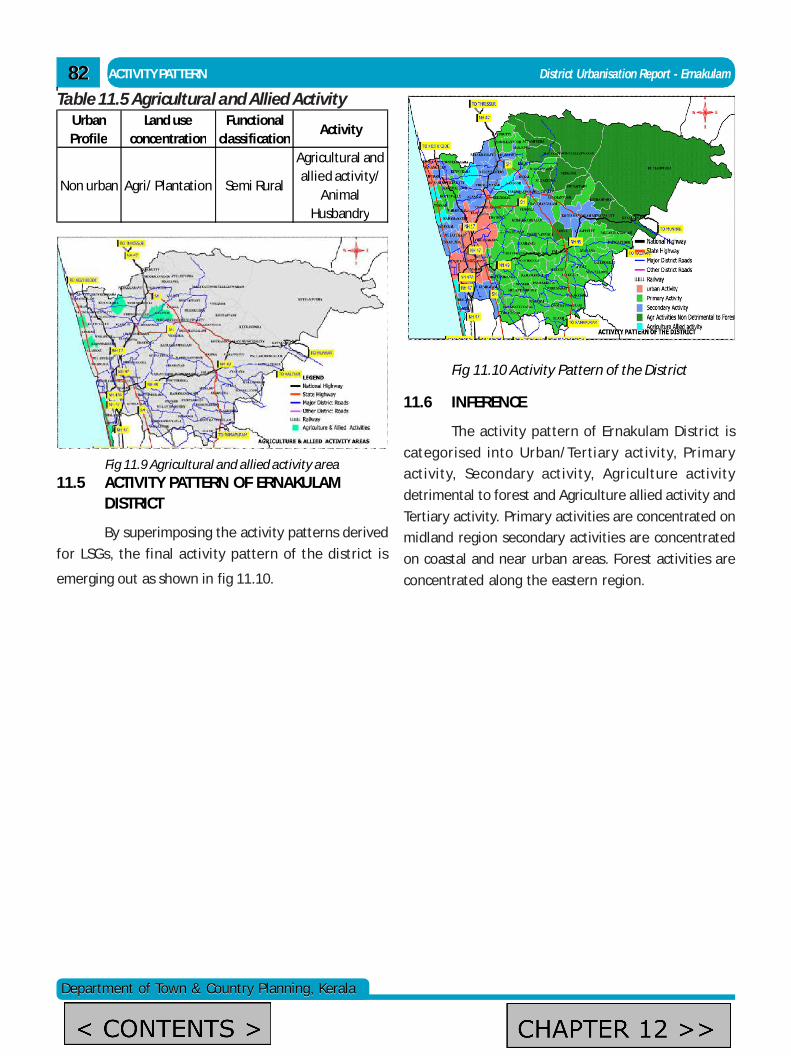
8282
Department of Town & Country Planning, KeralaDepartment of Town & Country Planning, Kerala
ACTIVITY PATTERN District Urbanisation Report - Ernakulam
Urban Profile
Land use concentration
Functional classification
Activity
Non urban Agri/ Plantation Semi Rural
Agricultural and allied activity/
Animal Husbandry
Table 11.5 Agricultural and Allied Activity
Fig 11.9 Agricultural and allied activity area11.5 ACTIVITY PATTERN OF ERNAKULAM
DISTRICT
By superimposing the activity patterns derived
for LSGs, the final activity pattern of the district is
emerging out as shown in fig 11.10.
Fig 11.10 Activity Pattern of the District
11.6 INFERENCE
The activity pattern of Ernakulam District is
categorised into Urban/Tertiary activity, Primary
activity, Secondary activity, Agriculture activity
detrimental to forest and Agriculture allied activity and
Tertiary activity. Primary activities are concentrated on
midland region secondary activities are concentrated
on coastal and near urban areas. Forest activities are
concentrated along the eastern region.
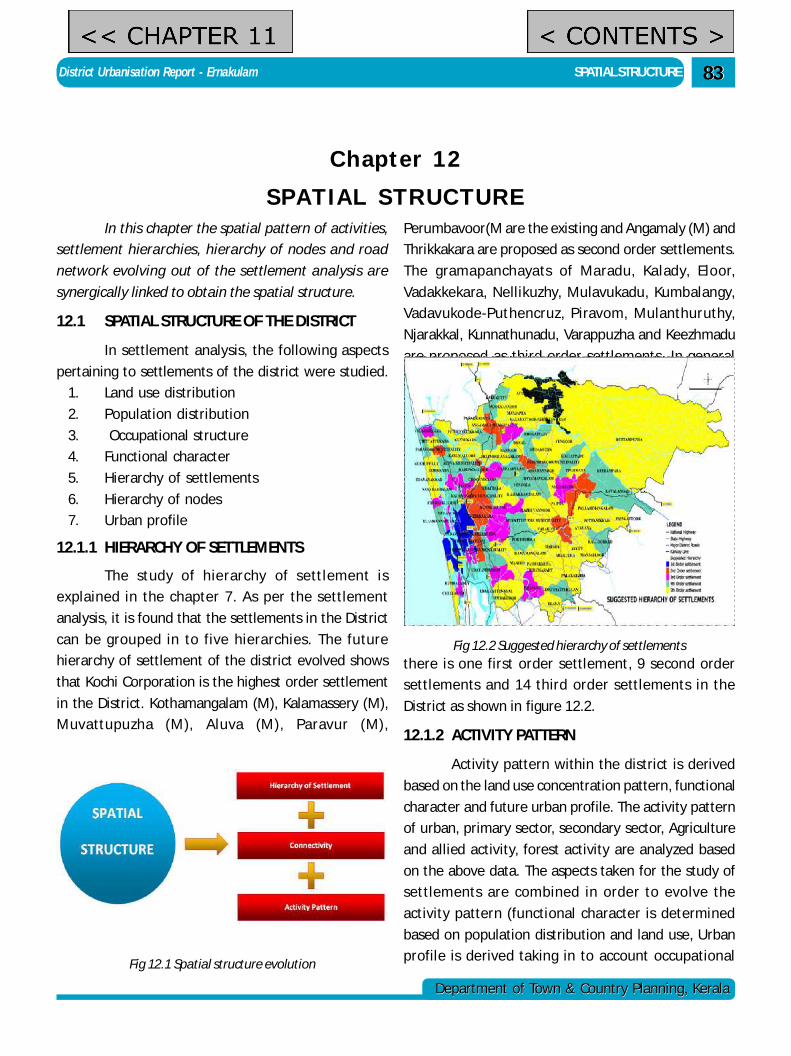
District Urbanisation Report - Ernakulam SPATIAL STRUCTURE
Department of Town & Country Planning, KeralaDepartment of Town & Country Planning, Kerala
8383
Chapter 12SPATIAL STRUCTURE
In this chapter the spatial pattern of activities,
settlement hierarchies, hierarchy of nodes and road
network evolving out of the settlement analysis are
synergically linked to obtain the spatial structure.
12.1 SPATIAL STRUCTURE OF THE DISTRICT
In settlement analysis, the following aspects
pertaining to settlements of the district were studied.
1. Land use distribution
2. Population distribution
3. Occupational structure
4. Functional character
5. Hierarchy of settlements
6. Hierarchy of nodes
7. Urban profile
12.1.1 HIERARCHY OF SETTLEMENTS
The study of hierarchy of settlement is
explained in the chapter 7. As per the settlement
analysis, it is found that the settlements in the District
can be grouped in to five hierarchies. The future
hierarchy of settlement of the district evolved shows
that Kochi Corporation is the highest order settlement
in the District. Kothamangalam (M), Kalamassery (M),
Muvattupuzha (M), Aluva (M), Paravur (M),
Perumbavoor(M are the existing and Angamaly (M) and
Thrikkakara are proposed as second order settlements.
The gramapanchayats of Maradu, Kalady, Eloor,
Vadakkekara, Nellikuzhy, Mulavukadu, Kumbalangy,
Vadavukode-Puthencruz, Piravom, Mulanthuruthy,
Njarakkal, Kunnathunadu, Varappuzha and Keezhmadu
are proposed as third order settlements. In general
Fig 12.2 Suggested hierarchy of settlements
Fig 12.1 Spatial structure evolution
there is one first order settlement, 9 second order
settlements and 14 third order settlements in the
District as shown in figure 12.2.
12.1.2 ACTIVITY PATTERN
Activity pattern within the district is derived
based on the land use concentration pattern, functional
character and future urban profile. The activity pattern
of urban, primary sector, secondary sector, Agriculture
and allied activity, forest activity are analyzed based
on the above data. The aspects taken for the study of
settlements are combined in order to evolve the
activity pattern (functional character is determined
based on population distribution and land use, Urban
profile is derived taking in to account occupational
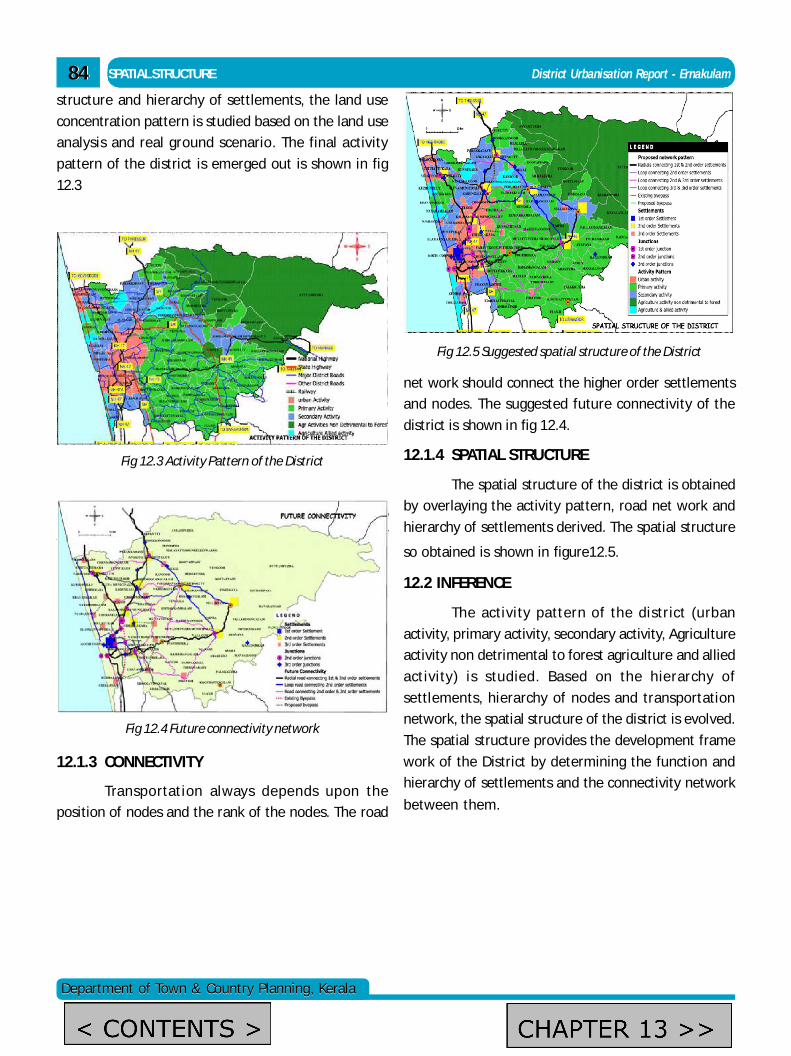
8484
Department of Town & Country Planning, KeralaDepartment of Town & Country Planning, Kerala
SPATIAL STRUCTURE District Urbanisation Report - Ernakulam
Fig 12.3 Activity Pattern of the District
structure and hierarchy of settlements, the land use
concentration pattern is studied based on the land use
analysis and real ground scenario. The final activity
pattern of the district is emerged out is shown in fig
12.3
Fig 12.4 Future connectivity network
Findings emerged out of settlement studies are
summarised to provide certain directives of
development for the district.
13.1 GENERAL
Fig 12.5 Suggested spatial structure of the District
net work should connect the higher order settlements
and nodes. The suggested future connectivity of the
district is shown in fig 12.4.
12.1.4 SPATIAL STRUCTURE
The spatial structure of the district is obtained
by overlaying the activity pattern, road net work and
hierarchy of settlements derived. The spatial structure
so obtained is shown in figure12.5.
12.2 INFERENCE
The activity pattern of the district (urban
activity, primary activity, secondary activity, Agriculture
activity non detrimental to forest agriculture and allied
activity) is studied. Based on the hierarchy of
settlements, hierarchy of nodes and transportation
network, the spatial structure of the district is evolved.
The spatial structure provides the development frame
work of the District by determining the function and
hierarchy of settlements and the connectivity network
between them.
12.1.3 CONNECTIVITY
Transportation always depends upon the
position of nodes and the rank of the nodes. The road
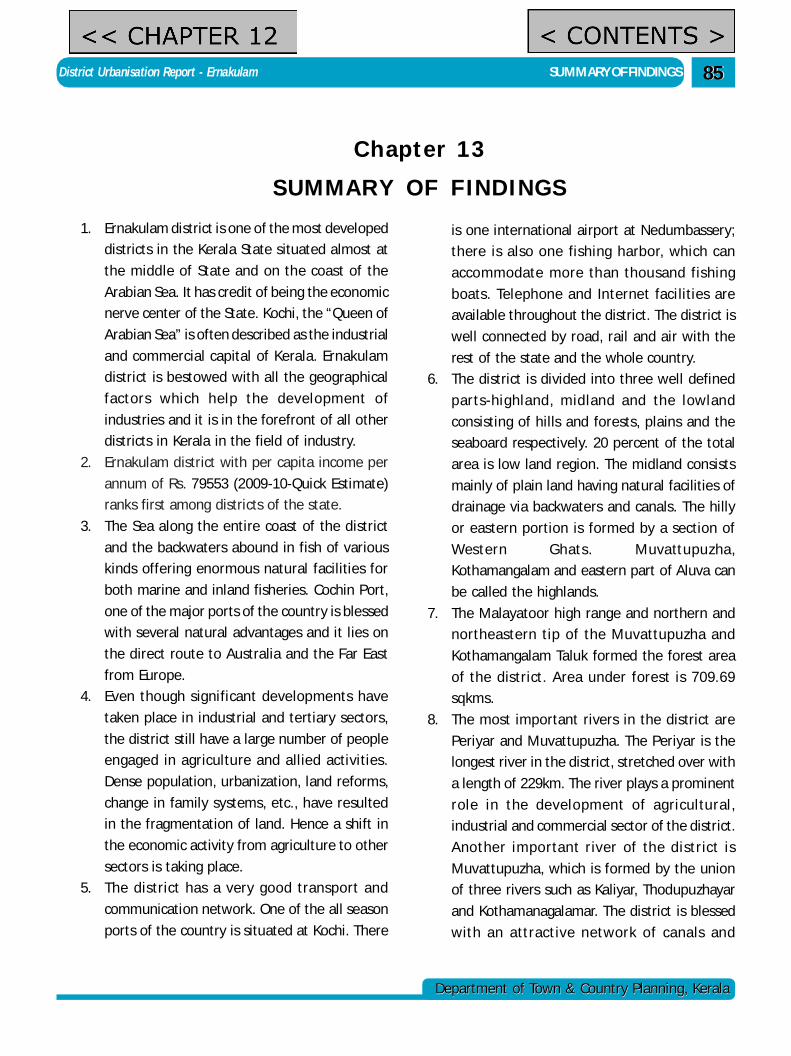
District Urbanisation Report - Ernakulam SUMMARY OF FINDINGS
Department of Town & Country Planning, KeralaDepartment of Town & Country Planning, Kerala
8585
1. Ernakulam district is one of the most developed
districts in the Kerala State situated almost at
the middle of State and on the coast of the
Arabian Sea. It has credit of being the economic
nerve center of the State. Kochi, the “Queen of
Arabian Sea” is often described as the industrial
and commercial capital of Kerala. Ernakulam
district is bestowed with all the geographical
factors which help the development of
industries and it is in the forefront of all other
districts in Kerala in the field of industry.
2. Ernakulam district with per capita income per
annum of Rs. 79553 (2009-10-Quick Estimate)
ranks first among districts of the state.
3. The Sea along the entire coast of the district
and the backwaters abound in fish of various
kinds offering enormous natural facilities for
both marine and inland fisheries. Cochin Port,
one of the major ports of the country is blessed
with several natural advantages and it lies on
the direct route to Australia and the Far East
from Europe.
4. Even though significant developments have
taken place in industrial and tertiary sectors,
the district still have a large number of people
engaged in agriculture and allied activities.
Dense population, urbanization, land reforms,
change in family systems, etc., have resulted
in the fragmentation of land. Hence a shift in
the economic activity from agriculture to other
sectors is taking place.
5. The district has a very good transport and
communication network. One of the all season
ports of the country is situated at Kochi. There
is one international airport at Nedumbassery;
there is also one fishing harbor, which can
accommodate more than thousand fishing
boats. Telephone and Internet facilities are
available throughout the district. The district is
well connected by road, rail and air with the
rest of the state and the whole country.
6. The district is divided into three well defined
parts-highland, midland and the lowland
consisting of hills and forests, plains and the
seaboard respectively. 20 percent of the total
area is low land region. The midland consists
mainly of plain land having natural facilities of
drainage via backwaters and canals. The hilly
or eastern portion is formed by a section of
Western Ghats. Muvattupuzha,
Kothamangalam and eastern part of Aluva can
be called the highlands.
7. The Malayatoor high range and northern and
northeastern tip of the Muvattupuzha and
Kothamangalam Taluk formed the forest area
of the district. Area under forest is 709.69
sqkms.
8. The most important rivers in the district are
Periyar and Muvattupuzha. The Periyar is the
longest river in the district, stretched over with
a length of 229km. The river plays a prominent
role in the development of agricultural,
industrial and commercial sector of the district.
Another important river of the district is
Muvattupuzha, which is formed by the union
of three rivers such as Kaliyar, Thodupuzhayar
and Kothamanagalamar. The district is blessed
with an attractive network of canals and
Chapter 13SUMMARY OF FINDINGS
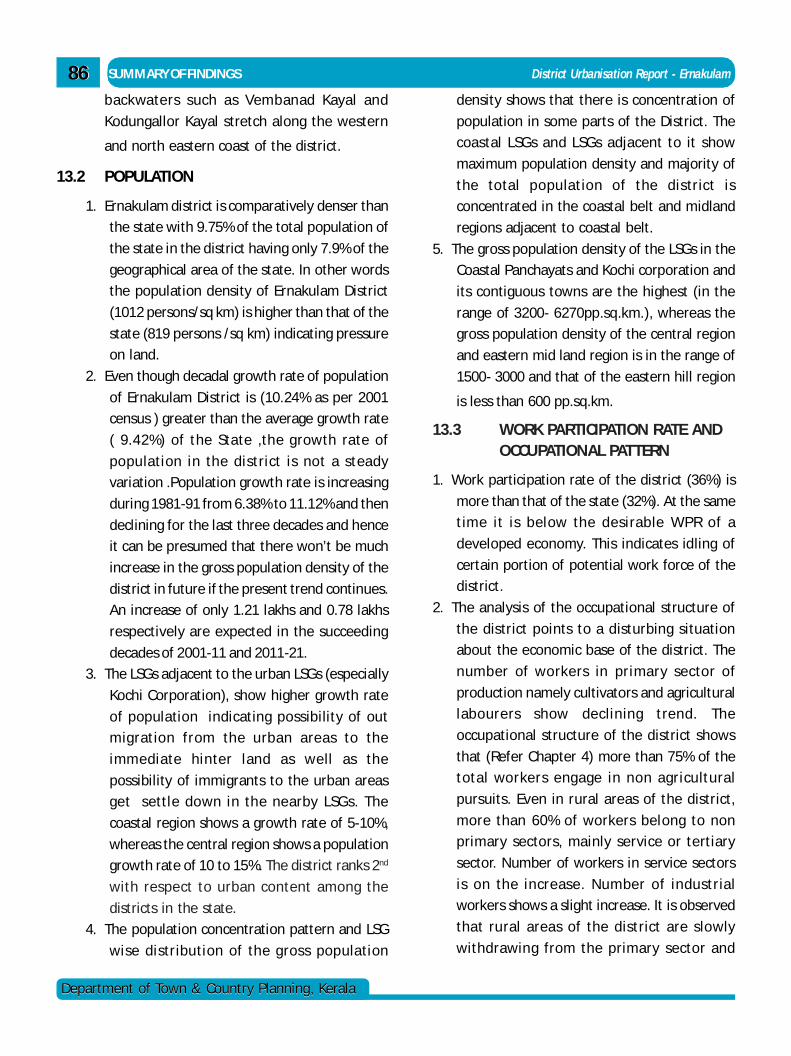
8686
Department of Town & Country Planning, KeralaDepartment of Town & Country Planning, Kerala
SUMMARY OF FINDINGS District Urbanisation Report - Ernakulam
backwaters such as Vembanad Kayal and
Kodungallor Kayal stretch along the western
and north eastern coast of the district.
13.2 POPULATION
1. Ernakulam district is comparatively denser than
the state with 9.75% of the total population of
the state in the district having only 7.9% of the
geographical area of the state. In other words
the population density of Ernakulam District
(1012 persons/sq km) is higher than that of the
state (819 persons /sq km) indicating pressure
on land.
2. Even though decadal growth rate of population
of Ernakulam District is (10.24% as per 2001
census ) greater than the average growth rate
( 9.42%) of the State ,the growth rate of
population in the district is not a steady
variation .Population growth rate is increasing
during 1981-91 from 6.38% to 11.12% and then
declining for the last three decades and hence
it can be presumed that there won’t be much
increase in the gross population density of the
district in future if the present trend continues.
An increase of only 1.21 lakhs and 0.78 lakhs
respectively are expected in the succeeding
decades of 2001-11 and 2011-21.
3. The LSGs adjacent to the urban LSGs (especially
Kochi Corporation), show higher growth rate
of population indicating possibility of out
migration from the urban areas to the
immediate hinter land as well as the
possibility of immigrants to the urban areas
get settle down in the nearby LSGs. The
coastal region shows a growth rate of 5-10%,
whereas the central region shows a population
growth rate of 10 to 15%. The district ranks 2nd
with respect to urban content among the
districts in the state.
4. The population concentration pattern and LSG
wise distribution of the gross population
density shows that there is concentration of
population in some parts of the District. The
coastal LSGs and LSGs adjacent to it show
maximum population density and majority of
the total population of the district is
concentrated in the coastal belt and midland
regions adjacent to coastal belt.
5. The gross population density of the LSGs in the
Coastal Panchayats and Kochi corporation and
its contiguous towns are the highest (in the
range of 3200- 6270pp.sq.km.), whereas the
gross population density of the central region
and eastern mid land region is in the range of
1500- 3000 and that of the eastern hill region
is less than 600 pp.sq.km.
13.3 WORK PARTICIPATION RATE ANDOCCUPATIONAL PATTERN
1. Work participation rate of the district (36%) is
more than that of the state (32%). At the same
time it is below the desirable WPR of a
developed economy. This indicates idling of
certain portion of potential work force of the
district.
2. The analysis of the occupational structure of
the district points to a disturbing situation
about the economic base of the district. The
number of workers in primary sector of
production namely cultivators and agricultural
labourers show declining trend. The
occupational structure of the district shows
that (Refer Chapter 4) more than 75% of the
total workers engage in non agricultural
pursuits. Even in rural areas of the district,
more than 60% of workers belong to non
primary sectors, mainly service or tertiary
sector. Number of workers in service sectors
is on the increase. Number of industrial
workers shows a slight increase. It is observed
that rural areas of the district are slowly
withdrawing from the primary sector and
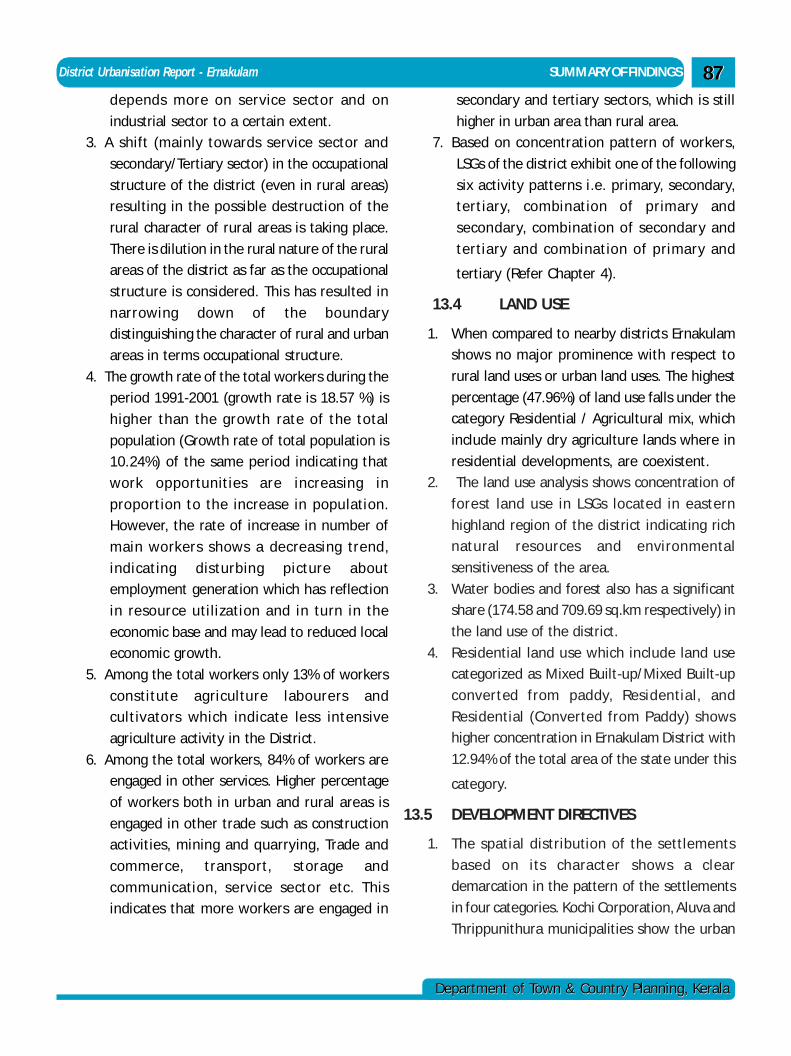
District Urbanisation Report - Ernakulam SUMMARY OF FINDINGS
Department of Town & Country Planning, KeralaDepartment of Town & Country Planning, Kerala
8787depends more on service sector and on
industrial sector to a certain extent.
3. A shift (mainly towards service sector and
secondary/Tertiary sector) in the occupational
structure of the district (even in rural areas)
resulting in the possible destruction of the
rural character of rural areas is taking place.
There is dilution in the rural nature of the rural
areas of the district as far as the occupational
structure is considered. This has resulted in
narrowing down of the boundary
distinguishing the character of rural and urban
areas in terms occupational structure.
4. The growth rate of the total workers during the
period 1991-2001 (growth rate is 18.57 %) is
higher than the growth rate of the total
population (Growth rate of total population is
10.24%) of the same period indicating that
work opportunities are increasing in
proportion to the increase in population.
However, the rate of increase in number of
main workers shows a decreasing trend,
indicating disturbing picture about
employment generation which has reflection
in resource utilization and in turn in the
economic base and may lead to reduced local
economic growth.
5. Among the total workers only 13% of workers
constitute agriculture labourers and
cultivators which indicate less intensive
agriculture activity in the District.
6. Among the total workers, 84% of workers are
engaged in other services. Higher percentage
of workers both in urban and rural areas is
engaged in other trade such as construction
activities, mining and quarrying, Trade and
commerce, transport, storage and
communication, service sector etc. This
indicates that more workers are engaged in
secondary and tertiary sectors, which is still
higher in urban area than rural area.
7. Based on concentration pattern of workers,
LSGs of the district exhibit one of the following
six activity patterns i.e. primary, secondary,
tertiary, combination of primary and
secondary, combination of secondary and
tertiary and combination of primary and
tertiary (Refer Chapter 4).
13.4 LAND USE
1. When compared to nearby districts Ernakulam
shows no major prominence with respect to
rural land uses or urban land uses. The highest
percentage (47.96%) of land use falls under the
category Residential / Agricultural mix, which
include mainly dry agriculture lands where in
residential developments, are coexistent.
2. The land use analysis shows concentration of
forest land use in LSGs located in eastern
highland region of the district indicating rich
natural resources and environmental
sensitiveness of the area.
3. Water bodies and forest also has a significant
share (174.58 and 709.69 sq.km respectively) in
the land use of the district.
4. Residential land use which include land use
categorized as Mixed Built-up/Mixed Built-up
converted from paddy, Residential, and
Residential (Converted from Paddy) shows
higher concentration in Ernakulam District with
12.94% of the total area of the state under this
category.
13.5 DEVELOPMENT DIRECTIVES
1. The spatial distribution of the settlements
based on its character shows a clear
demarcation in the pattern of the settlements
in four categories. Kochi Corporation, Aluva and
Thrippunithura municipalities show the urban
8888
Department of Town & Country Planning, KeralaDepartment of Town & Country Planning, Kerala
SUMMARY OF FINDINGS District Urbanisation Report - Ernakulam
character. Some of coastal LSGs and LSGs
contiguous to the Kochi Corporation also show
urban character. Semi urban character is
exhibited by LSGs that have urban influence
like Chengammanad, Kunnukara, Mulavukad,
Kumbalangy and Njarakkal (located near to
Municipalities). But some Municipalities in
midland and highland region shows semirural
character .Semi rural character is seen in some
other LSGs which are in a transition zone
between LSGs of urban and rural character. Most
of the LSGs in the midland and high land region
of the District exhibit rural character.
2. Existing hierarchy of settlements based on
facilities and the proposed hierarchy of
settlements evolved from the analysis show
that Kochi Corporation is the single first order
settlement. Besides, there are 9 second order
settlements and 14third order settlements in
the District to have equitable distribution of
facilities that each settlement in a specific
hierarchy should cater.
3. The study and analysis of nodes shows that,
Kochi Corporation and most of other urban
centres in the district are served by higher order
nodes. The unserved areas shows the necessity
of third order nodes and modified situations
with new third order nodes are proposed.
4. Even though Ernakulam district is blessed with
all modes of transportation, road
transportation always depends upon the
position of nodes and the rank of the nodes. So
as part of modification of road network based
on the hierarchy of nodes, a conceptual road
network is prepared based on the suggested
hierarchy of nodes and settlements together
with existing major road network. A future
connectivity network is prepared by
superimposing the proposed conceptual road
network with the proposed hierarchy of nodes.
5. Ernakulam district is most urbanised when
compared to the state. The level of
urbanization shows an inclining trend within
the district. The Kochi Corporation acts as the
nucleus of urbanisation of the District, from
where the urban character spreads to the
nearby LSGs.
6. Even though there exists Urban-Rural
continuum, the activity pattern evolved based
on the land use concentration pattern, future
urban profile and functional classification
shows that there is a clear demarcation of areas
of concentration of urban activity, agricultural
activity, agriculture and allied activity and
agriculture activity non detrimental to forests
in the district, making it possible to assign
definite development character to each region.
7. The spatial structure provides the development
frame work of the District by determining the
function and hierarchy of settlements and the
connectivity network between them. Based on
the hierarchy of settlements, hierarchy of
nodes, transportation network, the spatial
structure of the district is evolved.
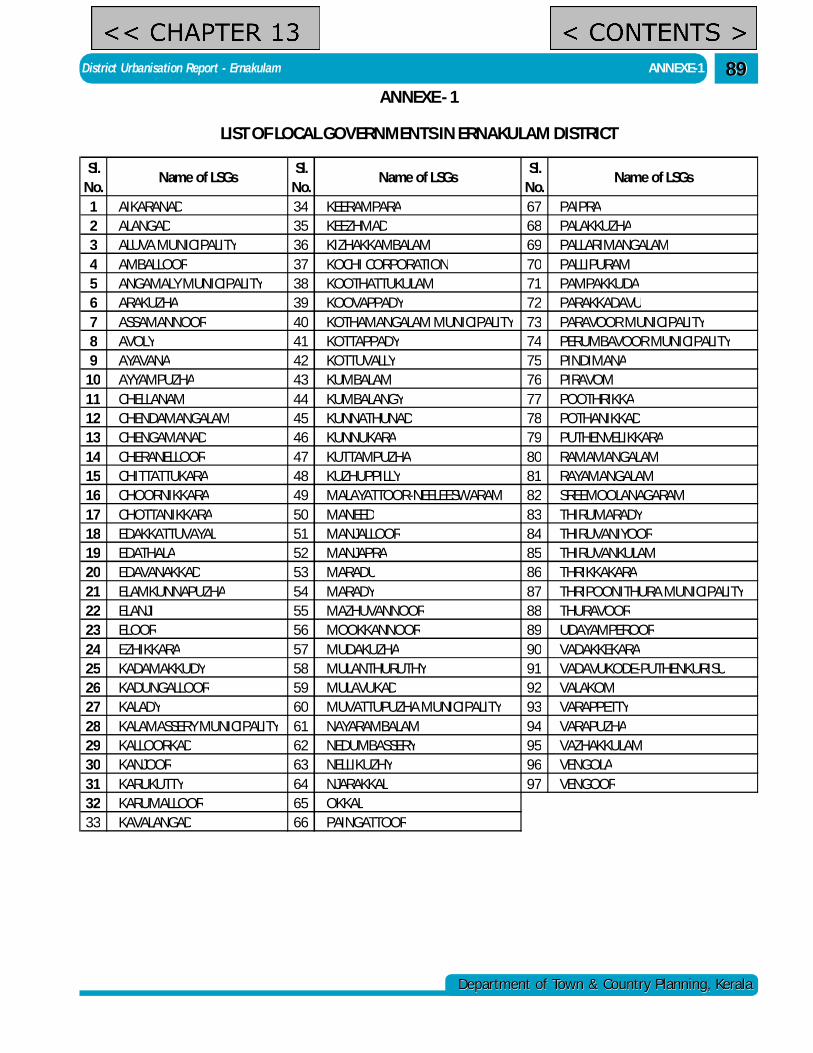
District Urbanisation Report - Ernakulam ANNEXE-1
Department of Town & Country Planning, KeralaDepartment of Town & Country Planning, Kerala
8989
Sl. No.
Name of LSGsSl.
No.Name of LSGs
Sl. No.
Name of LSGs
1 AIKARANAD 34 KEERAMPARA 67 PAIPRA2 ALANGAD 35 KEEZHMAD 68 PALAKKUZHA3 ALUVA MUNICIPALITY 36 KIZHAKKAMBALAM 69 PALLARIMANGALAM4 AMBALLOOR 37 KOCHI CORPORATION 70 PALLIPURAM5 ANGAMALY MUNICIPALITY 38 KOOTHATTUKULAM 71 PAMPAKKUDA6 ARAKUZHA 39 KOOVAPPADY 72 PARAKKADAVU7 ASSAMANNOOR 40 KOTHAMANGALAM MUNICIPALITY 73 PARAVOOR MUNICIPALITY8 AVOLY 41 KOTTAPPADY 74 PERUMBAVOOR MUNICIPALITY9 AYAVANA 42 KOTTUVALLY 75 PINDIMANA
10 AYYAMPUZHA 43 KUMBALAM 76 PIRAVOM11 CHELLANAM 44 KUMBALANGY 77 POOTHRIKKA12 CHENDAMANGALAM 45 KUNNATHUNAD 78 POTHANIKKAD13 CHENGAMANAD 46 KUNNUKARA 79 PUTHENVELIKKARA14 CHERANELLOOR 47 KUTTAMPUZHA 80 RAMAMANGALAM15 CHITTATTUKARA 48 KUZHUPPILLY 81 RAYAMANGALAM16 CHOORNIKKARA 49 MALAYATTOOR-NEELEESWARAM 82 SREEMOOLANAGARAM17 CHOTTANIKKARA 50 MANEED 83 THIRUMARADY18 EDAKKATTUVAYAL 51 MANJALLOOR 84 THIRUVANIYOOR19 EDATHALA 52 MANJAPRA 85 THIRUVANKULAM20 EDAVANAKKAD 53 MARADU 86 THRIKKAKARA21 ELAMKUNNAPUZHA 54 MARADY 87 THRIPOONITHURA MUNICIPALITY22 ELANJI 55 MAZHUVANNOOR 88 THURAVOOR23 ELOOR 56 MOOKKANNOOR 89 UDAYAMPEROOR24 EZHIKKARA 57 MUDAKUZHA 90 VADAKKEKARA25 KADAMAKKUDY 58 MULANTHURUTHY 91 VADAVUKODE-PUTHENKURISU26 KADUNGALLOOR 59 MULAVUKAD 92 VALAKOM27 KALADY 60 MUVATTUPUZHA MUNICIPALITY 93 VARAPPETTY28 KALAMASSERY MUNICIPALITY 61 NAYARAMBALAM 94 VARAPUZHA29 KALLOORKAD 62 NEDUMBASSERY 95 VAZHAKKULAM30 KANJOOR 63 NELLIKUZHY 96 VENGOLA31 KARUKUTTY 64 NJARAKKAL 97 VENGOOR32 KARUMALLOOR 65 OKKAL33 KAVALANGAD 66 PAINGATTOOR
ANNEXE - 1
LIST OF LOCAL GOVERNMENTS IN ERNAKULAM DISTRICT
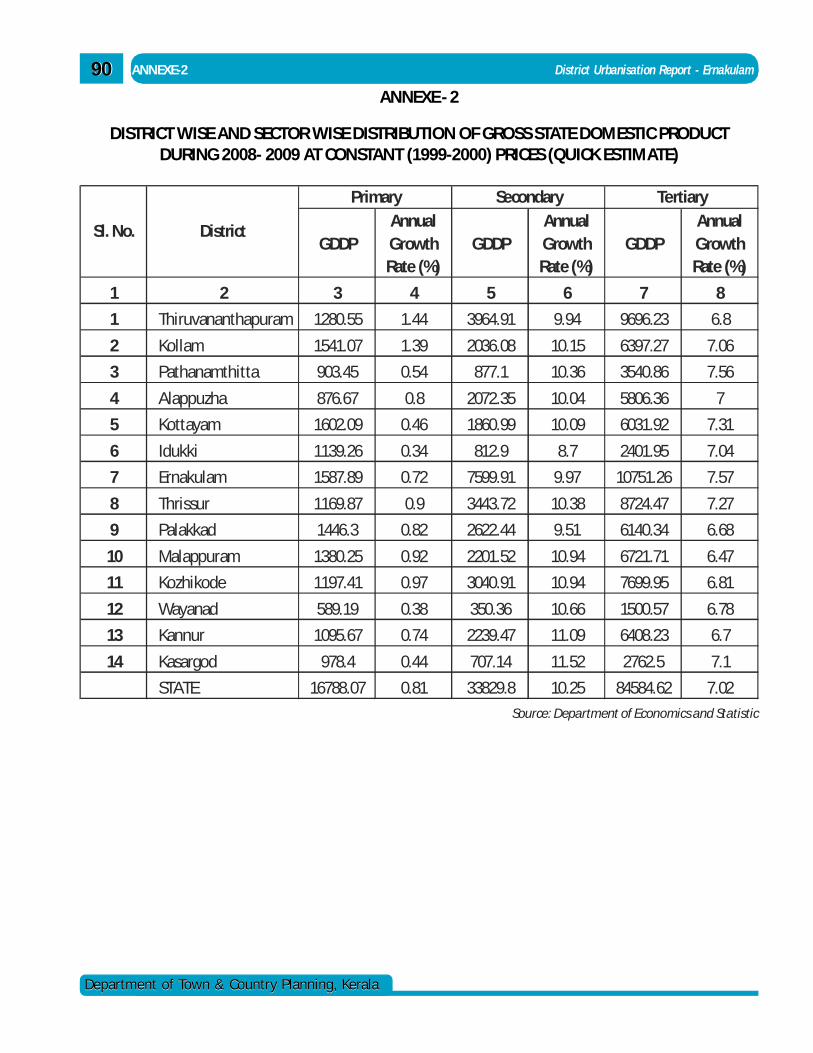
9090
Department of Town & Country Planning, KeralaDepartment of Town & Country Planning, Kerala
ANNEXE-2 District Urbanisation Report - Ernakulam
GDDPAnnual Growth Rate (%)
GDDPAnnual Growth Rate (%)
GDDPAnnual Growth Rate (%)
1 2 3 4 5 6 7 8
1 Thiruvananthapuram 1280.55 1.44 3964.91 9.94 9696.23 6.8
2 Kollam 1541.07 1.39 2036.08 10.15 6397.27 7.06
3 Pathanamthitta 903.45 0.54 877.1 10.36 3540.86 7.56
4 Alappuzha 876.67 0.8 2072.35 10.04 5806.36 7
5 Kottayam 1602.09 0.46 1860.99 10.09 6031.92 7.31
6 Idukki 1139.26 0.34 812.9 8.7 2401.95 7.04
7 Ernakulam 1587.89 0.72 7599.91 9.97 10751.26 7.57
8 Thrissur 1169.87 0.9 3443.72 10.38 8724.47 7.27
9 Palakkad 1446.3 0.82 2622.44 9.51 6140.34 6.68
10 Malappuram 1380.25 0.92 2201.52 10.94 6721.71 6.47
11 Kozhikode 1197.41 0.97 3040.91 10.94 7699.95 6.81
12 Wayanad 589.19 0.38 350.36 10.66 1500.57 6.78
13 Kannur 1095.67 0.74 2239.47 11.09 6408.23 6.7
14 Kasargod 978.4 0.44 707.14 11.52 2762.5 7.1
STATE 16788.07 0.81 33829.8 10.25 84584.62 7.02
Sl. No. District
Primary Secondary Tertiary
Source: Department of Economics and Statistic
ANNEXE - 2
DISTRICT WISE AND SECTOR WISE DISTRIBUTION OF GROSS STATE DOMESTIC PRODUCTDURING 2008- 2009 AT CONSTANT (1999-2000) PRICES (QUICK ESTIMATE)
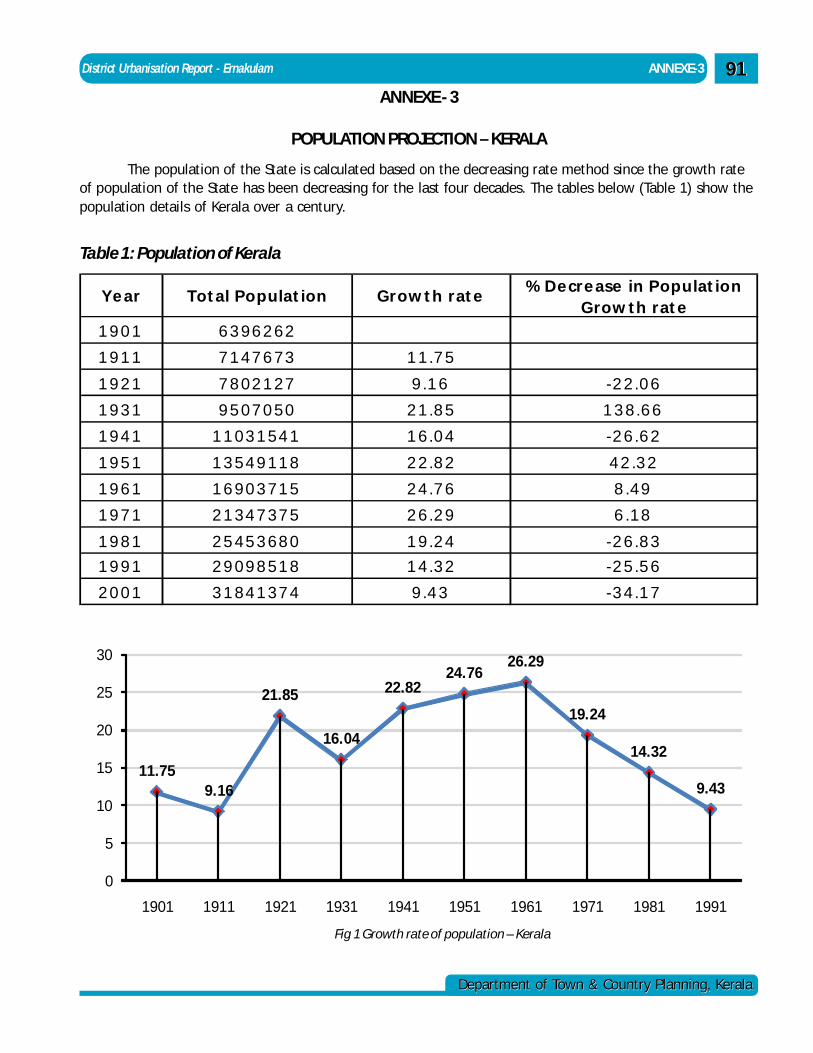
District Urbanisation Report - Ernakulam ANNEXE-3
Department of Town & Country Planning, KeralaDepartment of Town & Country Planning, Kerala
9191
Y e ar To t al P o p u lat io n G r o w t h r at e% D e cr e ase in P o p u lat io n
G r o w t h r at e
1 9 0 1 6 3 9 6 2 6 2
1 9 1 1 7 1 4 7 6 7 3 1 1 .7 5
1 9 2 1 7 8 0 2 1 2 7 9 .1 6 -2 2 .0 6
1 9 3 1 9 5 0 7 0 5 0 2 1 .8 5 1 3 8 .6 6
1 9 4 1 1 1 0 3 1 5 4 1 1 6 .0 4 -2 6 .6 2
1 9 5 1 1 3 5 4 9 1 1 8 2 2 .8 2 4 2 .3 2
1 9 6 1 1 6 9 0 3 7 1 5 2 4 .7 6 8 .4 9
1 9 7 1 2 1 3 4 7 3 7 5 2 6 .2 9 6 .1 8
1 9 8 1 2 5 4 5 3 6 8 0 1 9 .2 4 -2 6 .8 3
1 9 9 1 2 9 0 9 8 5 1 8 1 4 .3 2 -2 5 .5 6
2 0 0 1 3 1 8 4 1 3 7 4 9 .4 3 -3 4 .1 7
11.759.16
21.85
16.04
22.8224.76
26.29
19.24
14.32
9.43
0
5
10
15
20
25
30
1901 1911 1921 1931 1941 1951 1961 1971 1981 1991
Fig 1 Growth rate of population – Kerala
Table 1: Population of Kerala
ANNEXE - 3
POPULATION PROJECTION – KERALA
The population of the State is calculated based on the decreasing rate method since the growth rateof population of the State has been decreasing for the last four decades. The tables below (Table 1) show thepopulation details of Kerala over a century.
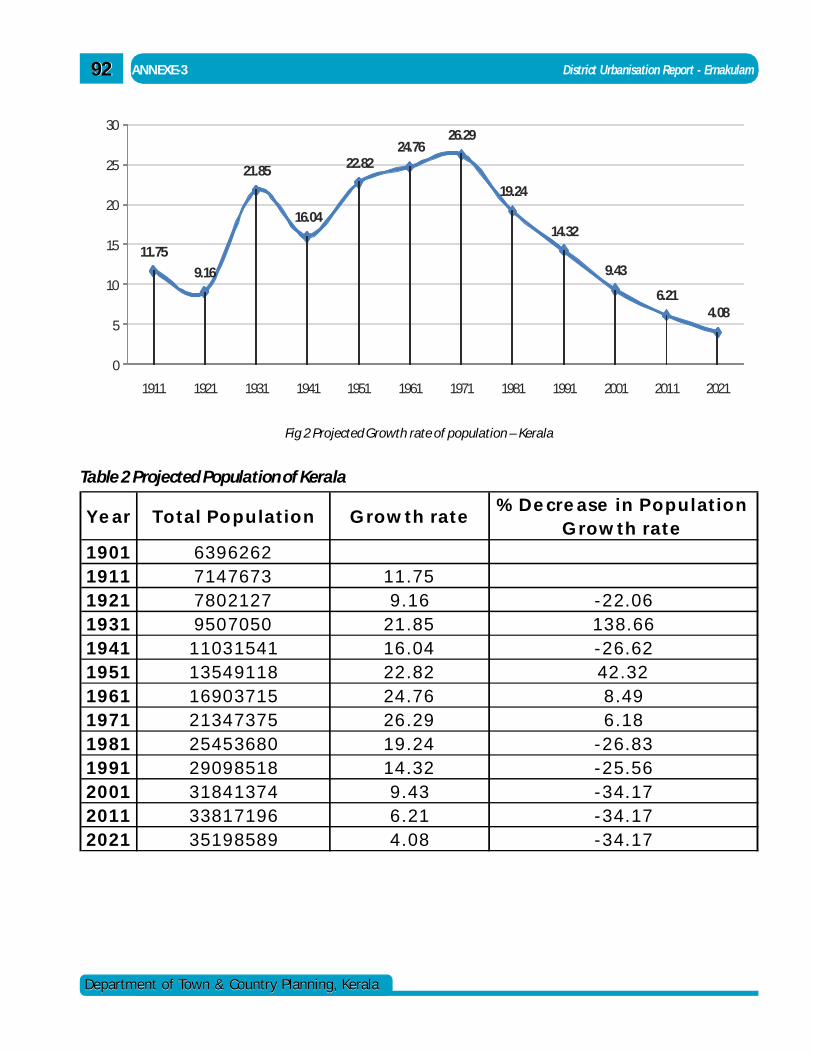
9292
Department of Town & Country Planning, KeralaDepartment of Town & Country Planning, Kerala
ANNEXE-3 District Urbanisation Report - Ernakulam
11.75
9.16
21.85
16.04
22.8224.76
26.29
19.24
14.32
9.43
6.214.08
0
5
10
15
20
25
30
1911 1921 1931 1941 1951 1961 1971 1981 1991 2001 2011 2021
Fig 2 Projected Growth rate of population – Kerala
Y e a r T o ta l P o p u la t io n G ro w th ra te% D e c re a s e in P o p u l a t io n
G ro w th ra te1 9 0 1 6 3 9 6 2 6 21 9 1 1 7 1 4 7 6 7 3 1 1 .7 51 9 2 1 7 8 0 2 1 2 7 9 .1 6 - 2 2 .0 61 9 3 1 9 5 0 7 0 5 0 2 1 .8 5 1 3 8 .6 61 9 4 1 1 1 0 3 1 5 4 1 1 6 .0 4 - 2 6 .6 21 9 5 1 1 3 5 4 9 1 1 8 2 2 .8 2 4 2 .3 21 9 6 1 1 6 9 0 3 7 1 5 2 4 .7 6 8 .4 91 9 7 1 2 1 3 4 7 3 7 5 2 6 .2 9 6 .1 81 9 8 1 2 5 4 5 3 6 8 0 1 9 .2 4 - 2 6 .8 31 9 9 1 2 9 0 9 8 5 1 8 1 4 .3 2 - 2 5 .5 62 0 0 1 3 1 8 4 1 3 7 4 9 .4 3 - 3 4 .1 72 0 1 1 3 3 8 1 7 1 9 6 6 .2 1 - 3 4 .1 72 0 2 1 3 5 1 9 8 5 8 9 4 .0 8 - 3 4 .1 7
Table 2 Projected Population of Kerala
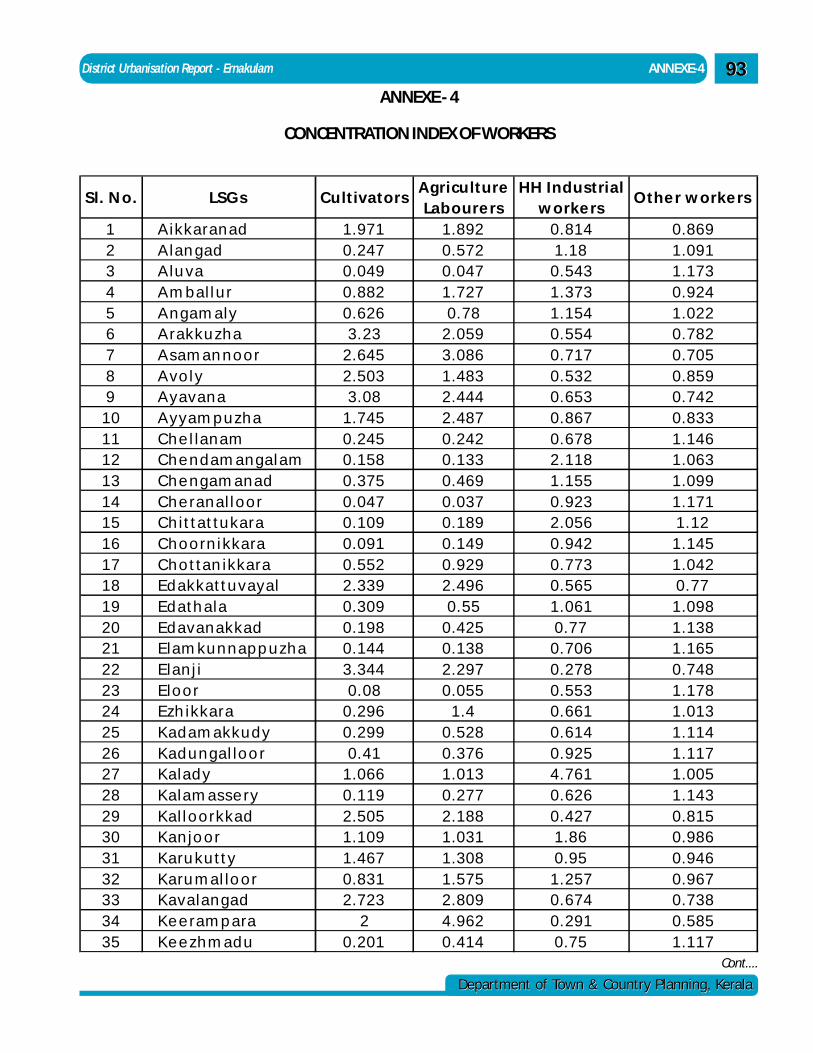
District Urbanisation Report - Ernakulam ANNEXE-4
Department of Town & Country Planning, KeralaDepartment of Town & Country Planning, Kerala
9393
S l. N o . LS G s C u ltiv ato rsA g ricu ltu re Lab o u re rs
H H In d u strial w o rke rs
O th e r w o rke rs
1 A ik k aran ad 1.971 1.892 0.814 0.8692 A lan g ad 0.247 0.572 1.18 1.0913 A lu v a 0.049 0.047 0.543 1.1734 A m b al l u r 0.882 1.727 1.373 0.9245 A n g am aly 0.626 0.78 1.154 1.0226 A rak k u zh a 3.23 2.059 0.554 0.7827 A s am an n o o r 2.645 3.086 0.717 0.7058 A v o l y 2.503 1.483 0.532 0.8599 A y av an a 3.08 2.444 0.653 0.742
10 A y y am p u zh a 1.745 2.487 0.867 0.83311 C h e l lan am 0.245 0.242 0.678 1.14612 C h e n d am an g a l am 0.158 0.133 2.118 1.06313 C h e n g am an ad 0.375 0.469 1.155 1.09914 C h e ran a l l o o r 0.047 0.037 0.923 1.17115 C h ittattu k ara 0.109 0.189 2.056 1.1216 C h o o rn i k k ara 0.091 0.149 0.942 1.14517 C h o ttan ik k ara 0.552 0.929 0.773 1.04218 Ed ak k attu v ay a l 2.339 2.496 0.565 0.7719 Ed ath a la 0.309 0.55 1.061 1.09820 Ed av an ak k ad 0.198 0.425 0.77 1.13821 Elam k u n n ap p u zh a 0.144 0.138 0.706 1.16522 Elan j i 3.344 2.297 0.278 0.74823 Elo o r 0.08 0.055 0.553 1.17824 Ezh ik k ara 0.296 1.4 0.661 1.01325 K ad am ak k u d y 0.299 0.528 0.614 1.11426 K ad u n g a l lo o r 0.41 0.376 0.925 1.11727 K a lad y 1.066 1.013 4.761 1.00528 K a lam as s e ry 0.119 0.277 0.626 1.14329 K a l l o o rk k ad 2.505 2.188 0.427 0.81530 K an jo o r 1.109 1.031 1.86 0.98631 K aru k u tty 1.467 1.308 0.95 0.94632 K aru m al lo o r 0.831 1.575 1.257 0.96733 K av a lan g ad 2.723 2.809 0.674 0.73834 K e e ram p ara 2 4.962 0.291 0.58535 K e e zh m ad u 0.201 0.414 0.75 1.117
Cont....
ANNEXE - 4
CONCENTRATION INDEX OF WORKERS
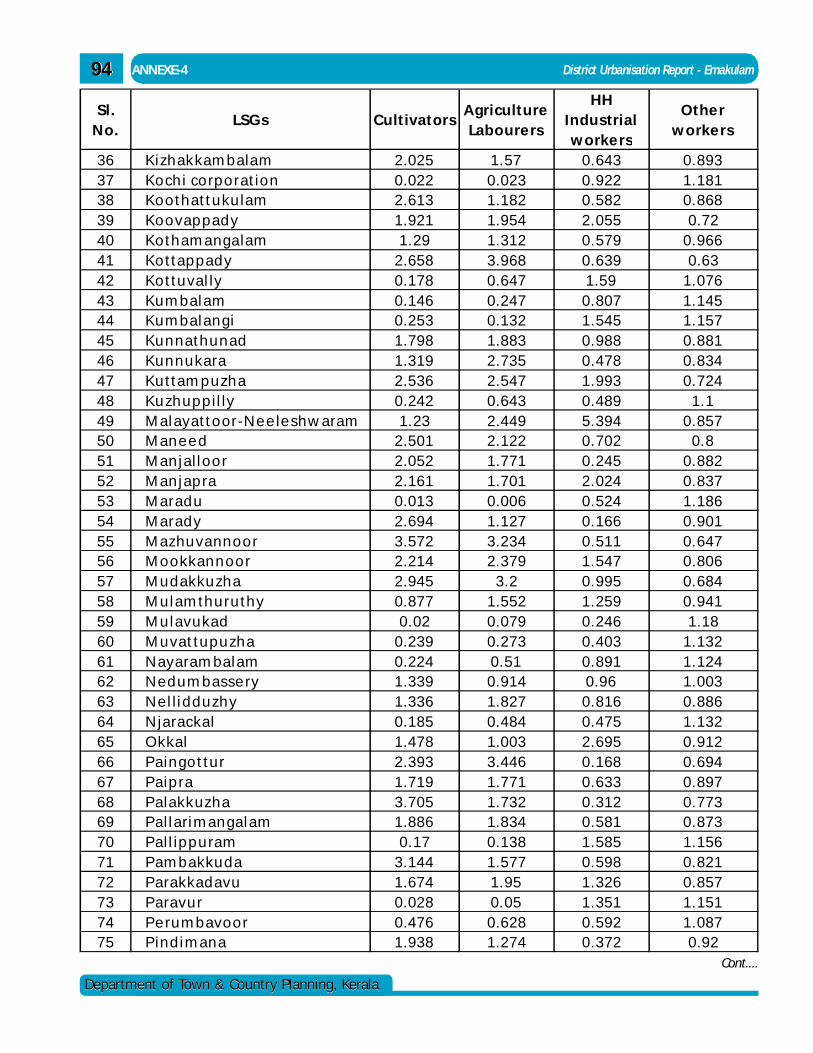
9494
Department of Town & Country Planning, KeralaDepartment of Town & Country Planning, Kerala
ANNEXE-4 District Urbanisation Report - Ernakulam
Cont....
Sl . N o .
LSG s C u ltivatorsA gricu ltu re Lab o u re rs
HH In du strial w o rke rs
O the r w o rke rs
36 K izh ak k am b ala m 2.025 1.57 0.643 0.89337 K o ch i co rp o ratio n 0.022 0.023 0.922 1.18138 K o o th attu k u lam 2.613 1.182 0.582 0.86839 K o o v ap p ad y 1.921 1.954 2.055 0.7240 K o th am a nga lam 1.29 1.312 0.579 0.96641 K o ttap p ad y 2.658 3.968 0.639 0.6342 K o ttu v al ly 0.178 0.647 1.59 1.07643 K u m b alam 0.146 0.247 0.807 1.14544 K u m b alan gi 0.253 0.132 1.545 1.15745 K u n n ath u n ad 1.798 1.883 0.988 0.88146 K u n n u k ara 1.319 2.735 0.478 0.83447 K u ttam p u zh a 2.536 2.547 1.993 0.72448 K u zh u p p il ly 0.242 0.643 0.489 1.149 M alay atto or-N e e le sh w aram 1.23 2.449 5.394 0.85750 M an e e d 2.501 2.122 0.702 0.851 M an jal lo o r 2.052 1.771 0.245 0.88252 M an jap ra 2.161 1.701 2.024 0.83753 M arad u 0.013 0.006 0.524 1.18654 M arad y 2.694 1.127 0.166 0.90155 M az hu v a nn o o r 3.572 3.234 0.511 0.64756 M o o k k an n o o r 2.214 2.379 1.547 0.80657 M u d ak k u zh a 2.945 3.2 0.995 0.68458 M u lam th u ru th y 0.877 1.552 1.259 0.94159 M u lav u k ad 0.02 0.079 0.246 1.1860 M u v attu p u zh a 0.239 0.273 0.403 1.13261 N ay aram balam 0.224 0.51 0.891 1.12462 N e d u m b asse ry 1.339 0.914 0.96 1.00363 N e l l id d u zh y 1.336 1.827 0.816 0.88664 N jarack al 0.185 0.484 0.475 1.13265 O k k al 1.478 1.003 2.695 0.91266 P ain go ttu r 2.393 3.446 0.168 0.69467 P aip ra 1.719 1.771 0.633 0.89768 P alak k uz h a 3.705 1.732 0.312 0.77369 P al larim an galam 1.886 1.834 0.581 0.87370 P al l ip p u ram 0.17 0.138 1.585 1.15671 P am b ak k u d a 3.144 1.577 0.598 0.82172 P arak k ad av u 1.674 1.95 1.326 0.85773 P arav u r 0.028 0.05 1.351 1.15174 P e ru m b av o o r 0.476 0.628 0.592 1.08775 P in d im an a 1.938 1.274 0.372 0.92
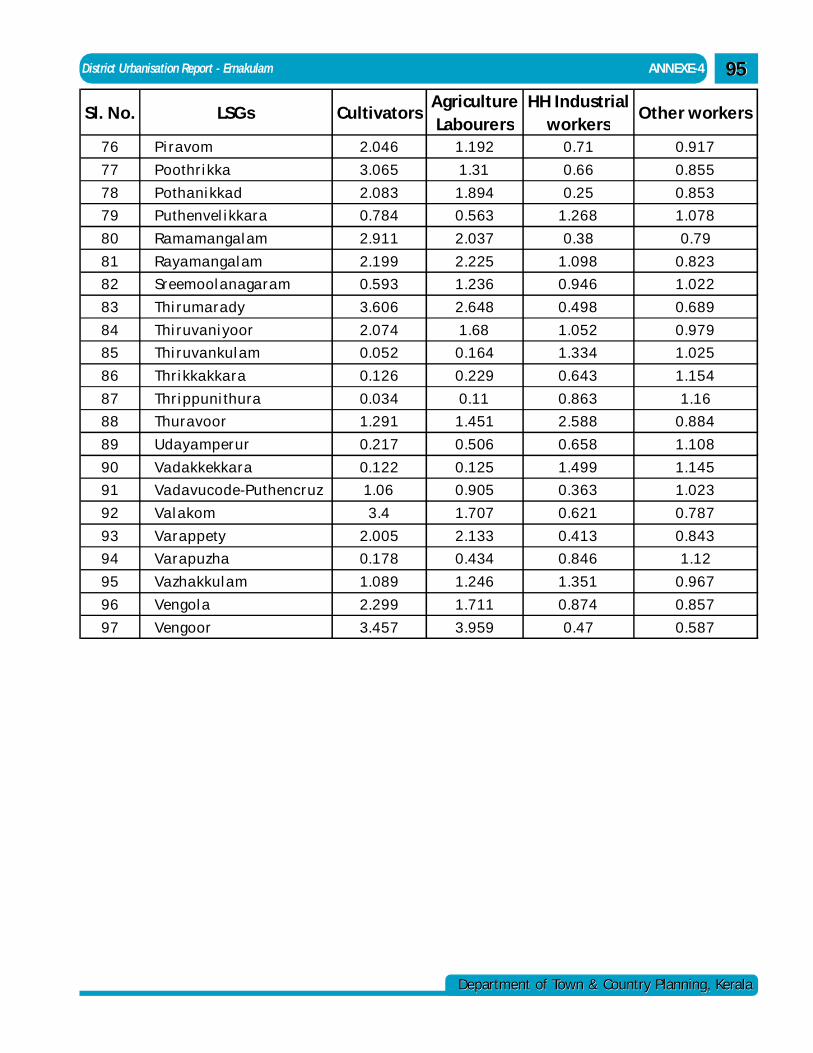
District Urbanisation Report - Ernakulam ANNEXE-4
Department of Town & Country Planning, KeralaDepartment of Town & Country Planning, Kerala
9595
Sl. No. LSGs CultivatorsAgriculture Labourers
HH Industrial workers
Other workers
76 Pi ra vom 2.046 1.192 0.71 0.917
77 Poothri kka 3.065 1.31 0.66 0.855
78 Potha ni kka d 2.083 1.894 0.25 0.853
79 Puthenvel i kkara 0.784 0.563 1.268 1.078
80 Ra ma ma nga l am 2.911 2.037 0.38 0.79
81 Ra ya ma nga l am 2.199 2.225 1.098 0.823
82 Sreemool a na ga ra m 0.593 1.236 0.946 1.022
83 Thi ruma ra dy 3.606 2.648 0.498 0.689
84 Thi ruva ni yoor 2.074 1.68 1.052 0.979
85 Thi ruva nkul a m 0.052 0.164 1.334 1.025
86 Thri kka kka ra 0.126 0.229 0.643 1.154
87 Thri ppuni thura 0.034 0.11 0.863 1.16
88 Thura voor 1.291 1.451 2.588 0.884
89 Uda ya mperur 0.217 0.506 0.658 1.108
90 Va da kkekka ra 0.122 0.125 1.499 1.145
91 Va da vucode-Puthencruz 1.06 0.905 0.363 1.023
92 Va l a kom 3.4 1.707 0.621 0.787
93 Va ra ppety 2.005 2.133 0.413 0.843
94 Va ra puzha 0.178 0.434 0.846 1.12
95 Va zha kkul a m 1.089 1.246 1.351 0.967
96 Vengol a 2.299 1.711 0.874 0.857
97 Vengoor 3.457 3.959 0.47 0.587
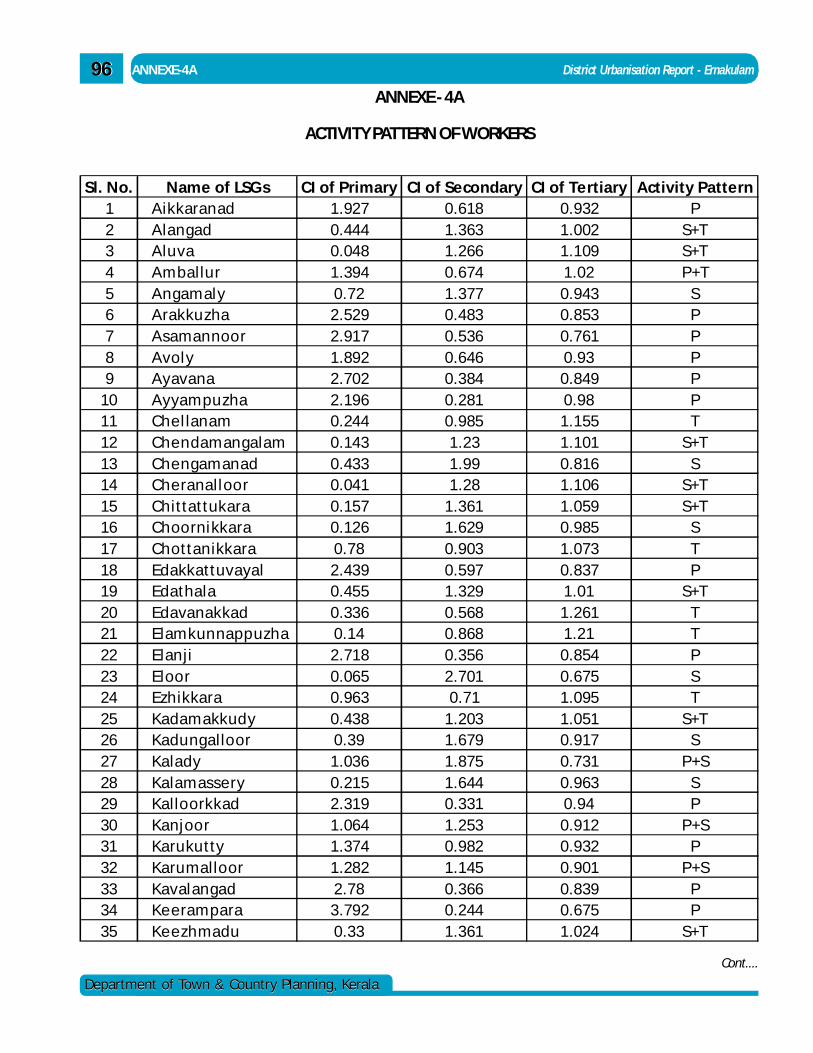
9696
Department of Town & Country Planning, KeralaDepartment of Town & Country Planning, Kerala
ANNEXE-4A District Urbanisation Report - Ernakulam
Sl. No. Name of LSG s CI of Primary CI of Secondary CI of Te rtiary Activity Pattern1 Aikkaranad 1.927 0.618 0.932 P2 Alangad 0.444 1.363 1.002 S+T3 Aluva 0.048 1.266 1.109 S+T4 Am ballur 1.394 0.674 1.02 P+T5 Angam aly 0.72 1.377 0.943 S6 Arakkuzha 2.529 0.483 0.853 P7 Asamannoor 2.917 0.536 0.761 P8 Avoly 1.892 0.646 0.93 P9 Ayavana 2.702 0.384 0.849 P
10 Ayyam puzha 2.196 0.281 0.98 P11 Chel lanam 0.244 0.985 1.155 T12 Chendam angalam 0.143 1.23 1.101 S+T13 Chengam anad 0.433 1.99 0.816 S14 Cheranalloor 0.041 1.28 1.106 S+T15 Chittattukara 0.157 1.361 1.059 S+T16 Choornikkara 0.126 1.629 0.985 S17 Chottanikkara 0.78 0.903 1.073 T18 Edakkattuvayal 2.439 0.597 0.837 P19 Edathala 0.455 1.329 1.01 S+T20 Edavanakkad 0.336 0.568 1.261 T21 Elam kunnappuzha 0.14 0.868 1.21 T22 Elanji 2.718 0.356 0.854 P23 Eloor 0.065 2.701 0.675 S24 Ezhikkara 0.963 0.71 1.095 T25 Kadam akkudy 0.438 1.203 1.051 S+T26 Kadungalloor 0.39 1.679 0.917 S27 Kalady 1.036 1.875 0.731 P+S28 Kalam assery 0.215 1.644 0.963 S29 Kalloorkkad 2.319 0.331 0.94 P30 Kanjoor 1.064 1.253 0.912 P+S31 Karukutty 1.374 0.982 0.932 P32 Karumalloor 1.282 1.145 0.901 P+S33 Kavalangad 2.78 0.366 0.839 P34 Ke eram para 3.792 0.244 0.675 P35 Ke ezhmadu 0.33 1.361 1.024 S+T
Cont....
ANNEXE - 4A
ACTIVITY PATTERN OF WORKERS
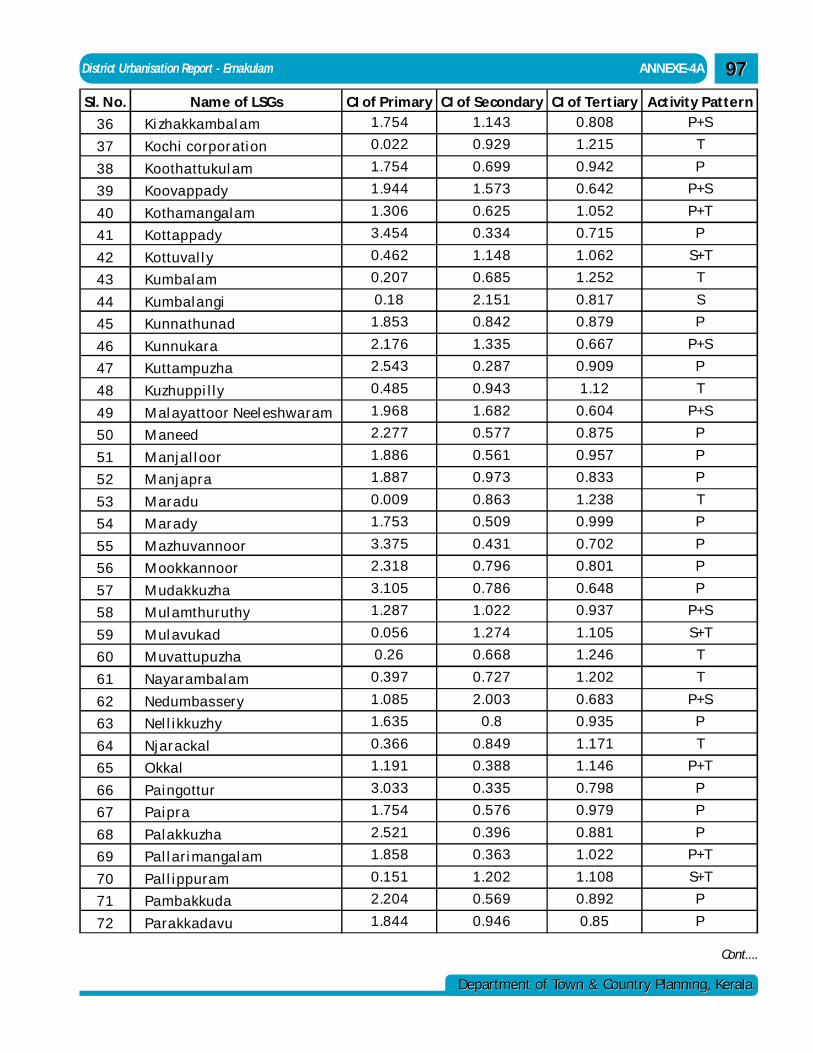
District Urbanisation Report - Ernakulam ANNEXE-4A
Department of Town & Country Planning, KeralaDepartment of Town & Country Planning, Kerala
9797
Sl. N o. Nam e of LSGs CI of Prim ary CI of Secondary CI of Tert iary Activity Pattern
36 Ki zha kka mba l a m 1.754 1.143 0.808 P+S
37 Kochi corpora tion 0.022 0.929 1.215 T
38 Kootha ttukul a m 1.754 0.699 0.942 P
39 Koova ppa dy 1.944 1.573 0.642 P+S
40 Kotha ma nga la m 1.306 0.625 1.052 P+T
41 Kotta ppa dy 3.454 0.334 0.715 P
42 Kottuva l l y 0.462 1.148 1.062 S+T
43 Kumba la m 0.207 0.685 1.252 T
44 Kumba la ngi 0.18 2.151 0.817 S
45 Kunna thuna d 1.853 0.842 0.879 P
46 Kunnuka ra 2.176 1.335 0.667 P+S
47 Kutta mpuzha 2.543 0.287 0.909 P
48 Kuzhuppi l ly 0.485 0.943 1.12 T
49 Mal a ya ttoor Neel es hwa ra m 1.968 1.682 0.604 P+S
50 Maneed 2.277 0.577 0.875 P
51 Manj a l l oor 1.886 0.561 0.957 P
52 Manj a pra 1.887 0.973 0.833 P
53 Mara du 0.009 0.863 1.238 T
54 Mara dy 1.753 0.509 0.999 P
55 Mazhuva nnoor 3.375 0.431 0.702 P
56 Mookka nnoor 2.318 0.796 0.801 P
57 Muda kkuzha 3.105 0.786 0.648 P
58 Mul a mthuruthy 1.287 1.022 0.937 P+S
59 Mul a vuka d 0.056 1.274 1.105 S+T
60 Muva ttupuzha 0.26 0.668 1.246 T
61 Na ya ra mba la m 0.397 0.727 1.202 T
62 Nedumba s s ery 1.085 2.003 0.683 P+S
63 Nel l ikkuzhy 1.635 0.8 0.935 P
64 Nja ra cka l 0.366 0.849 1.171 T
65 Okka l 1.191 0.388 1.146 P+T
66 Pa ingottur 3.033 0.335 0.798 P
67 Pa ipra 1.754 0.576 0.979 P
68 Pa la kkuzha 2.521 0.396 0.881 P
69 Pa l l a ri ma nga la m 1.858 0.363 1.022 P+T
70 Pa l l ippura m 0.151 1.202 1.108 S+T
71 Pa mba kkuda 2.204 0.569 0.892 P
72 Pa ra kkada vu 1.844 0.946 0.85 P
Cont....
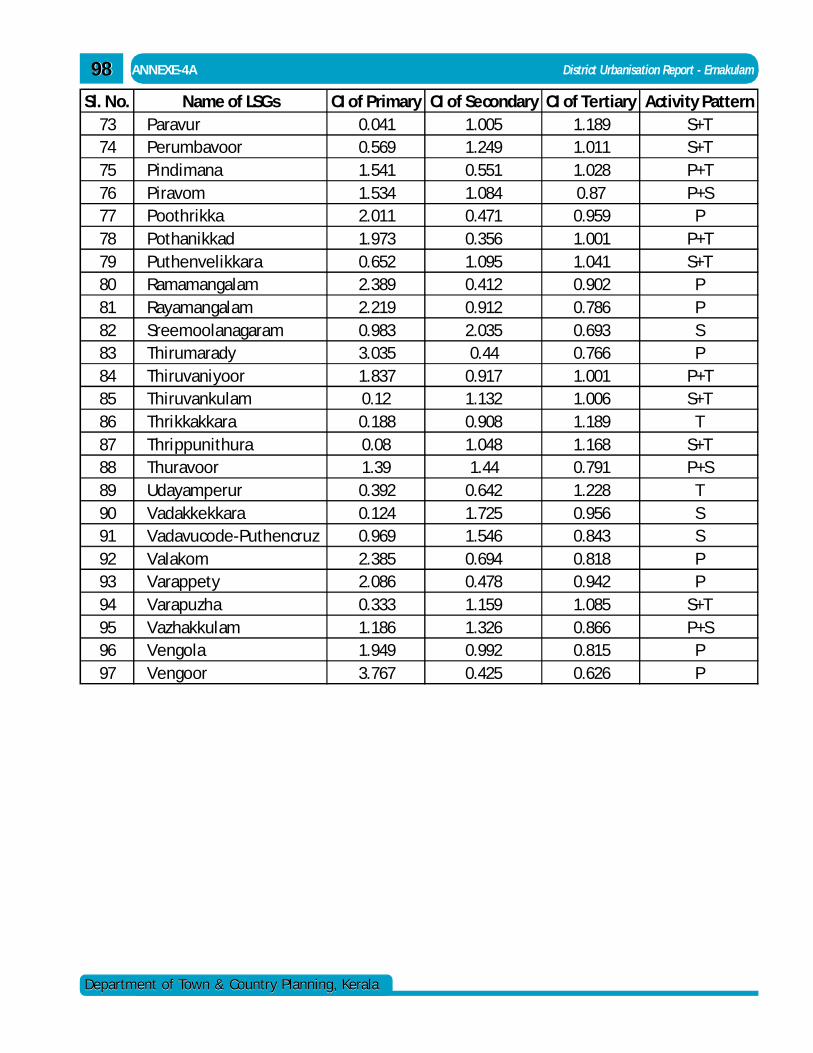
9898
Department of Town & Country Planning, KeralaDepartment of Town & Country Planning, Kerala
ANNEXE-4A District Urbanisation Report - Ernakulam
Sl. No. Name of LSGs CI of Primary CI of Secondary CI of Tertiary Activity Pattern73 Paravur 0.041 1.005 1.189 S+T74 Perumbavoor 0.569 1.249 1.011 S+T75 Pindimana 1.541 0.551 1.028 P+T76 Piravom 1.534 1.084 0.87 P+S77 Poothrikka 2.011 0.471 0.959 P78 Pothanikkad 1.973 0.356 1.001 P+T79 Puthenvelikkara 0.652 1.095 1.041 S+T80 Ramamangalam 2.389 0.412 0.902 P81 Rayamangalam 2.219 0.912 0.786 P82 Sreemoolanagaram 0.983 2.035 0.693 S83 Thirumarady 3.035 0.44 0.766 P84 Thiruvaniyoor 1.837 0.917 1.001 P+T85 Thiruvankulam 0.12 1.132 1.006 S+T86 Thrikkakkara 0.188 0.908 1.189 T87 Thrippunithura 0.08 1.048 1.168 S+T88 Thuravoor 1.39 1.44 0.791 P+S89 Udayamperur 0.392 0.642 1.228 T90 Vadakkekkara 0.124 1.725 0.956 S91 Vadavucode-Puthencruz 0.969 1.546 0.843 S92 Valakom 2.385 0.694 0.818 P93 Varappety 2.086 0.478 0.942 P94 Varapuzha 0.333 1.159 1.085 S+T95 Vazhakkulam 1.186 1.326 0.866 P+S96 Vengola 1.949 0.992 0.815 P97 Vengoor 3.767 0.425 0.626 P
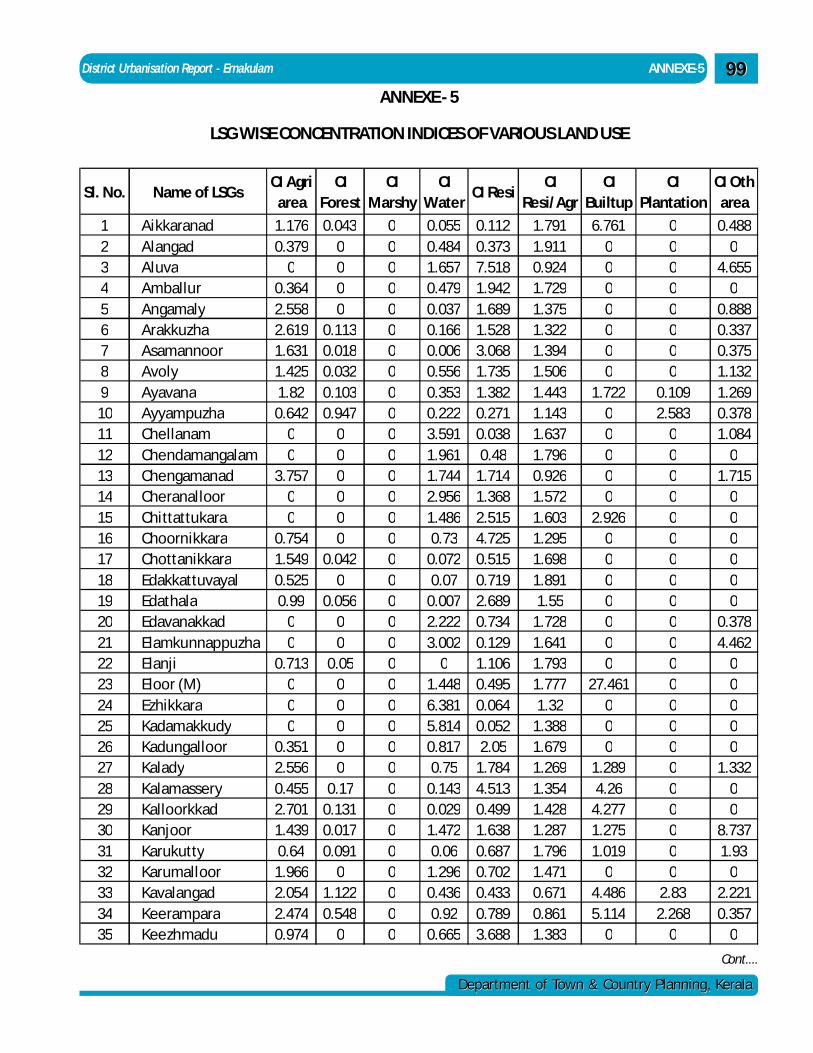
District Urbanisation Report - Ernakulam ANNEXE-5
Department of Town & Country Planning, KeralaDepartment of Town & Country Planning, Kerala
9999
Sl. No. Name of LSGsCI Agri
areaCI
ForestCI
MarshyCI
WaterCI Resi
CI Resi/Agr
CI Builtup
CI Plantation
CI Oth area
1 Aikkaranad 1.176 0.043 0 0.055 0.112 1.791 6.761 0 0.4882 Alangad 0.379 0 0 0.484 0.373 1.911 0 0 03 Aluva 0 0 0 1.657 7.518 0.924 0 0 4.6554 Amballur 0.364 0 0 0.479 1.942 1.729 0 0 05 Angamaly 2.558 0 0 0.037 1.689 1.375 0 0 0.8886 Arakkuzha 2.619 0.113 0 0.166 1.528 1.322 0 0 0.3377 Asamannoor 1.631 0.018 0 0.006 3.068 1.394 0 0 0.3758 Avoly 1.425 0.032 0 0.556 1.735 1.506 0 0 1.1329 Ayavana 1.82 0.103 0 0.353 1.382 1.443 1.722 0.109 1.26910 Ayyampuzha 0.642 0.947 0 0.222 0.271 1.143 0 2.583 0.37811 Chellanam 0 0 0 3.591 0.038 1.637 0 0 1.08412 Chendamangalam 0 0 0 1.961 0.48 1.796 0 0 013 Chengamanad 3.757 0 0 1.744 1.714 0.926 0 0 1.71514 Cheranalloor 0 0 0 2.956 1.368 1.572 0 0 015 Chittattukara 0 0 0 1.486 2.515 1.603 2.926 0 016 Choornikkara 0.754 0 0 0.73 4.725 1.295 0 0 017 Chottanikkara 1.549 0.042 0 0.072 0.515 1.698 0 0 018 Edakkattuvayal 0.525 0 0 0.07 0.719 1.891 0 0 019 Edathala 0.99 0.056 0 0.007 2.689 1.55 0 0 020 Edavanakkad 0 0 0 2.222 0.734 1.728 0 0 0.37821 Elamkunnappuzha 0 0 0 3.002 0.129 1.641 0 0 4.46222 Elanji 0.713 0.05 0 0 1.106 1.793 0 0 023 Eloor (M) 0 0 0 1.448 0.495 1.777 27.461 0 024 Ezhikkara 0 0 0 6.381 0.064 1.32 0 0 025 Kadamakkudy 0 0 0 5.814 0.052 1.388 0 0 026 Kadungalloor 0.351 0 0 0.817 2.05 1.679 0 0 027 Kalady 2.556 0 0 0.75 1.784 1.269 1.289 0 1.33228 Kalamassery 0.455 0.17 0 0.143 4.513 1.354 4.26 0 029 Kalloorkkad 2.701 0.131 0 0.029 0.499 1.428 4.277 0 030 Kanjoor 1.439 0.017 0 1.472 1.638 1.287 1.275 0 8.73731 Karukutty 0.64 0.091 0 0.06 0.687 1.796 1.019 0 1.9332 Karumalloor 1.966 0 0 1.296 0.702 1.471 0 0 033 Kavalangad 2.054 1.122 0 0.436 0.433 0.671 4.486 2.83 2.22134 Keerampara 2.474 0.548 0 0.92 0.789 0.861 5.114 2.268 0.35735 Keezhmadu 0.974 0 0 0.665 3.688 1.383 0 0 0
Cont....
ANNEXE - 5
LSG WISE CONCENTRATION INDICES OF VARIOUS LAND USE
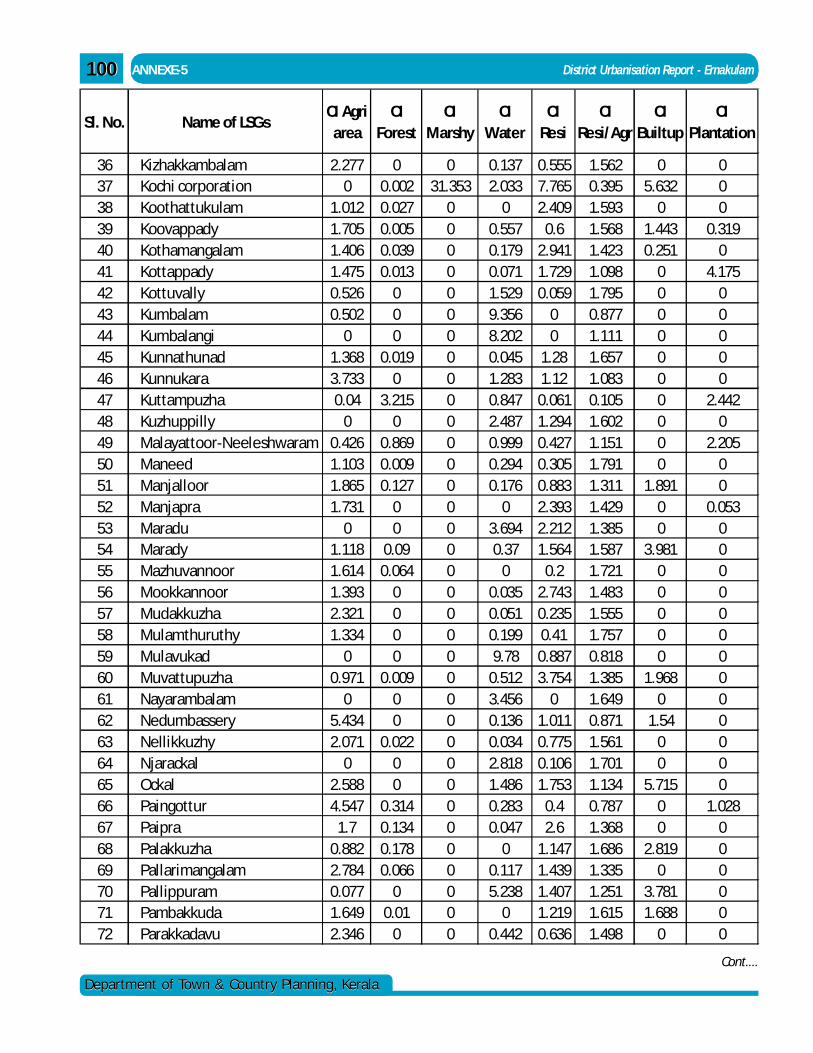
100100
Department of Town & Country Planning, KeralaDepartment of Town & Country Planning, Kerala
ANNEXE-5 District Urbanisation Report - Ernakulam
Sl. No. Name of LSGsCI Agri area
CI Forest
CI Marshy
CI Water
CI Resi
CI Resi/Agr
CI Builtup
CI Plantation
36 Kizhakkambalam 2.277 0 0 0.137 0.555 1.562 0 037 Kochi corporation 0 0.002 31.353 2.033 7.765 0.395 5.632 038 Koothattukulam 1.012 0.027 0 0 2.409 1.593 0 039 Koovappady 1.705 0.005 0 0.557 0.6 1.568 1.443 0.31940 Kothamangalam 1.406 0.039 0 0.179 2.941 1.423 0.251 041 Kottappady 1.475 0.013 0 0.071 1.729 1.098 0 4.17542 Kottuvally 0.526 0 0 1.529 0.059 1.795 0 043 Kumbalam 0.502 0 0 9.356 0 0.877 0 044 Kumbalangi 0 0 0 8.202 0 1.111 0 045 Kunnathunad 1.368 0.019 0 0.045 1.28 1.657 0 046 Kunnukara 3.733 0 0 1.283 1.12 1.083 0 047 Kuttampuzha 0.04 3.215 0 0.847 0.061 0.105 0 2.44248 Kuzhuppilly 0 0 0 2.487 1.294 1.602 0 049 Malayattoor-Neeleshwaram 0.426 0.869 0 0.999 0.427 1.151 0 2.20550 Maneed 1.103 0.009 0 0.294 0.305 1.791 0 051 Manjalloor 1.865 0.127 0 0.176 0.883 1.311 1.891 052 Manjapra 1.731 0 0 0 2.393 1.429 0 0.05353 Maradu 0 0 0 3.694 2.212 1.385 0 054 Marady 1.118 0.09 0 0.37 1.564 1.587 3.981 055 Mazhuvannoor 1.614 0.064 0 0 0.2 1.721 0 056 Mookkannoor 1.393 0 0 0.035 2.743 1.483 0 057 Mudakkuzha 2.321 0 0 0.051 0.235 1.555 0 058 Mulamthuruthy 1.334 0 0 0.199 0.41 1.757 0 059 Mulavukad 0 0 0 9.78 0.887 0.818 0 060 Muvattupuzha 0.971 0.009 0 0.512 3.754 1.385 1.968 061 Nayarambalam 0 0 0 3.456 0 1.649 0 062 Nedumbassery 5.434 0 0 0.136 1.011 0.871 1.54 063 Nellikkuzhy 2.071 0.022 0 0.034 0.775 1.561 0 064 Njarackal 0 0 0 2.818 0.106 1.701 0 065 Ockal 2.588 0 0 1.486 1.753 1.134 5.715 066 Paingottur 4.547 0.314 0 0.283 0.4 0.787 0 1.02867 Paipra 1.7 0.134 0 0.047 2.6 1.368 0 068 Palakkuzha 0.882 0.178 0 0 1.147 1.686 2.819 069 Pallarimangalam 2.784 0.066 0 0.117 1.439 1.335 0 070 Pallippuram 0.077 0 0 5.238 1.407 1.251 3.781 071 Pambakkuda 1.649 0.01 0 0 1.219 1.615 1.688 072 Parakkadavu 2.346 0 0 0.442 0.636 1.498 0 0
Cont....
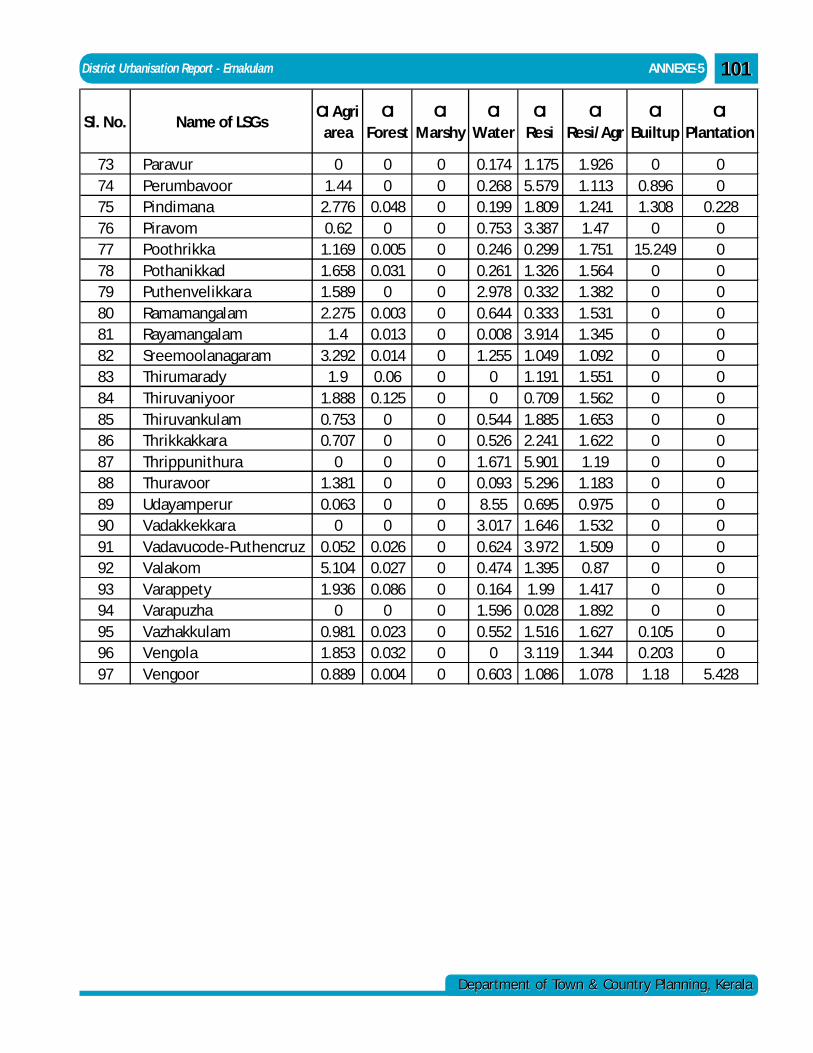
District Urbanisation Report - Ernakulam ANNEXE-5
Department of Town & Country Planning, KeralaDepartment of Town & Country Planning, Kerala
101101
Sl. No. Name of LSGsCI Agri
areaCI
ForestCI
MarshyCI
WaterCI
ResiCI
Resi/AgrCI
BuiltupCI
Plantation
73 Paravur 0 0 0 0.174 1.175 1.926 0 074 Perumbavoor 1.44 0 0 0.268 5.579 1.113 0.896 075 Pindimana 2.776 0.048 0 0.199 1.809 1.241 1.308 0.22876 Piravom 0.62 0 0 0.753 3.387 1.47 0 077 Poothrikka 1.169 0.005 0 0.246 0.299 1.751 15.249 078 Pothanikkad 1.658 0.031 0 0.261 1.326 1.564 0 079 Puthenvelikkara 1.589 0 0 2.978 0.332 1.382 0 080 Ramamangalam 2.275 0.003 0 0.644 0.333 1.531 0 081 Rayamangalam 1.4 0.013 0 0.008 3.914 1.345 0 082 Sreemoolanagaram 3.292 0.014 0 1.255 1.049 1.092 0 083 Thirumarady 1.9 0.06 0 0 1.191 1.551 0 084 Thiruvaniyoor 1.888 0.125 0 0 0.709 1.562 0 085 Thiruvankulam 0.753 0 0 0.544 1.885 1.653 0 086 Thrikkakkara 0.707 0 0 0.526 2.241 1.622 0 087 Thrippunithura 0 0 0 1.671 5.901 1.19 0 088 Thuravoor 1.381 0 0 0.093 5.296 1.183 0 089 Udayamperur 0.063 0 0 8.55 0.695 0.975 0 090 Vadakkekkara 0 0 0 3.017 1.646 1.532 0 091 Vadavucode-Puthencruz 0.052 0.026 0 0.624 3.972 1.509 0 092 Valakom 5.104 0.027 0 0.474 1.395 0.87 0 093 Varappety 1.936 0.086 0 0.164 1.99 1.417 0 094 Varapuzha 0 0 0 1.596 0.028 1.892 0 095 Vazhakkulam 0.981 0.023 0 0.552 1.516 1.627 0.105 096 Vengola 1.853 0.032 0 0 3.119 1.344 0.203 097 Vengoor 0.889 0.004 0 0.603 1.086 1.078 1.18 5.428
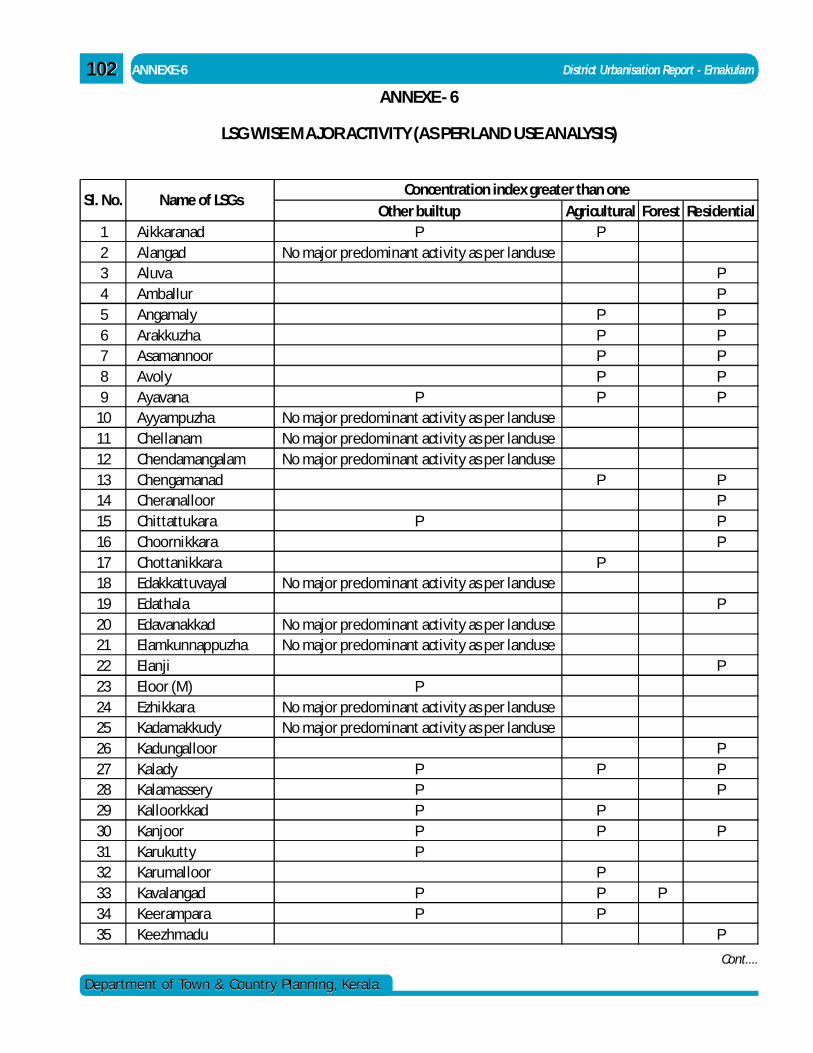
102102
Department of Town & Country Planning, KeralaDepartment of Town & Country Planning, Kerala
ANNEXE-6 District Urbanisation Report - Ernakulam
Other builtup Agricultural Forest Residential1 Aikkaranad P P2 Alangad No major predominant activity as per landuse3 Aluva P4 Amballur P5 Angamaly P P6 Arakkuzha P P7 Asamannoor P P8 Avoly P P9 Ayavana P P P
10 Ayyampuzha No major predominant activity as per landuse11 Chellanam No major predominant activity as per landuse12 Chendamangalam No major predominant activity as per landuse13 Chengamanad P P14 Cheranalloor P15 Chittattukara P P16 Choornikkara P17 Chottanikkara P18 Edakkattuvayal No major predominant activity as per landuse19 Edathala P20 Edavanakkad No major predominant activity as per landuse21 Elamkunnappuzha No major predominant activity as per landuse22 Elanji P23 Eloor (M) P24 Ezhikkara No major predominant activity as per landuse25 Kadamakkudy No major predominant activity as per landuse26 Kadungalloor P27 Kalady P P P28 Kalamassery P P29 Kalloorkkad P P30 Kanjoor P P P31 Karukutty P32 Karumalloor P33 Kavalangad P P P34 Keerampara P P35 Keezhmadu P
Concentration index greater than oneSl. No. Name of LSGs
Cont....
ANNEXE - 6
LSG WISE MAJOR ACTIVITY (AS PER LAND USE ANALYSIS)
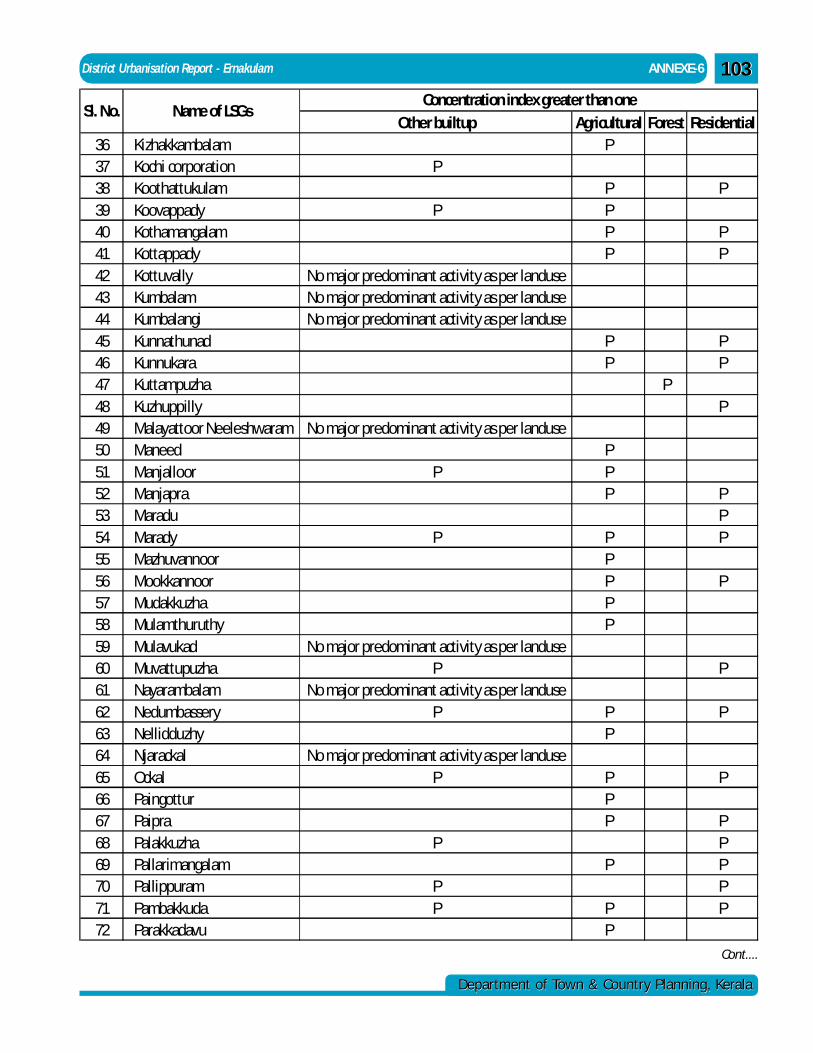
District Urbanisation Report - Ernakulam ANNEXE-6
Department of Town & Country Planning, KeralaDepartment of Town & Country Planning, Kerala
103103
Other builtup Agricultural Forest Residential36 Kizhakkambalam P37 Kochi corporation P38 Koothattukulam P P39 Koovappady P P40 Kothamangalam P P41 Kottappady P P42 Kottuvally No major predominant activity as per landuse43 Kumbalam No major predominant activity as per landuse44 Kumbalangi No major predominant activity as per landuse45 Kunnathunad P P46 Kunnukara P P47 Kuttampuzha P48 Kuzhuppilly P49 Malayattoor Neeleshwaram No major predominant activity as per landuse50 Maneed P51 Manjalloor P P52 Manjapra P P53 Maradu P54 Marady P P P55 Mazhuvannoor P56 Mookkannoor P P57 Mudakkuzha P58 Mulamthuruthy P59 Mulavukad No major predominant activity as per landuse60 Muvattupuzha P P61 Nayarambalam No major predominant activity as per landuse62 Nedumbassery P P P63 Nellidduzhy P64 Njarackal No major predominant activity as per landuse65 Ockal P P P66 Paingottur P67 Paipra P P68 Palakkuzha P P69 Pallarimangalam P P70 Pallippuram P P71 Pambakkuda P P P72 Parakkadavu P
Sl. No. Name of LSGsConcentration index greater than one
Cont....
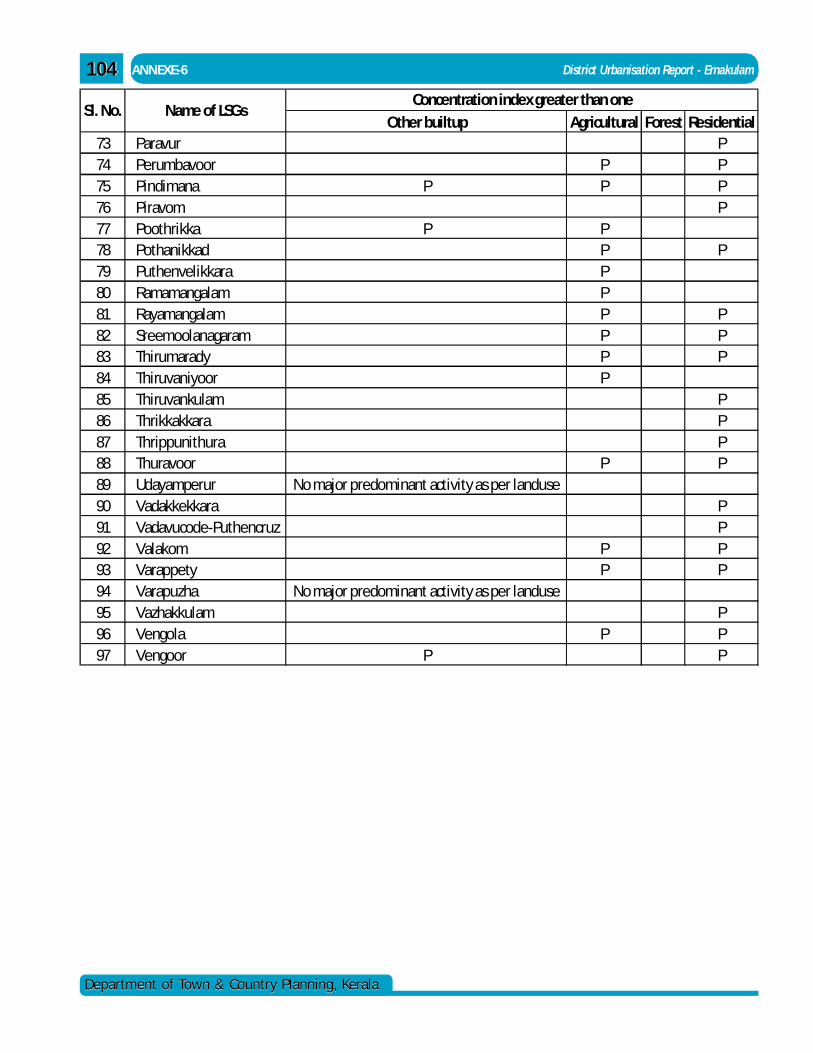
104104
Department of Town & Country Planning, KeralaDepartment of Town & Country Planning, Kerala
ANNEXE-6 District Urbanisation Report - Ernakulam
Other builtup Agricultural Forest Residential73 Paravur P74 Perumbavoor P P75 Pindimana P P P76 Piravom P77 Poothrikka P P78 Pothanikkad P P79 Puthenvelikkara P80 Ramamangalam P81 Rayamangalam P P82 Sreemoolanagaram P P83 Thirumarady P P84 Thiruvaniyoor P85 Thiruvankulam P86 Thrikkakkara P87 Thrippunithura P88 Thuravoor P P89 Udayamperur No major predominant activity as per landuse90 Vadakkekkara P91 Vadavucode-Puthencruz P92 Valakom P P93 Varappety P P94 Varapuzha No major predominant activity as per landuse95 Vazhakkulam P96 Vengola P P97 Vengoor P P
Sl. No. Name of LSGsConcentration index greater than one
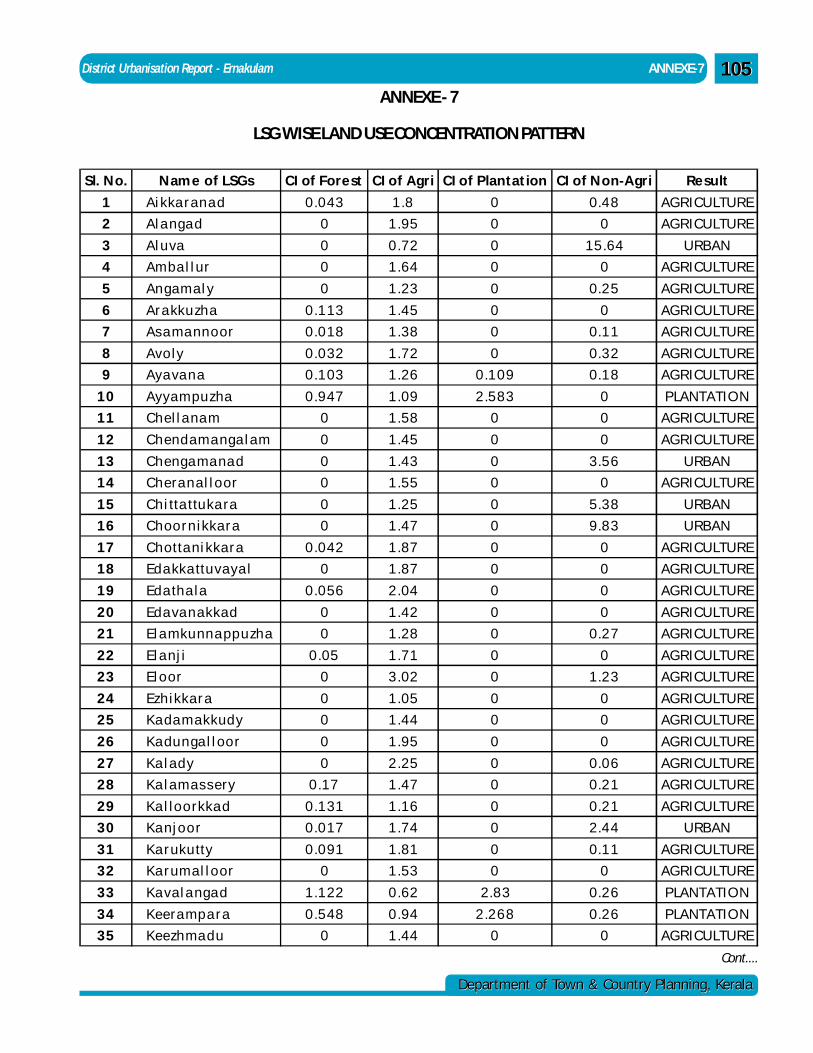
District Urbanisation Report - Ernakulam ANNEXE-7
Department of Town & Country Planning, KeralaDepartment of Town & Country Planning, Kerala
105105
Sl. N o. N am e of LSGs CI of Fore st C I of Agr i C I of Plantat ion CI of N on-A gr i Re sult
1 Ai kka ra na d 0 .0 43 1 .8 0 0.4 8 AGRICULTURE
2 Al a nga d 0 1 .95 0 0 AGRICULTURE
3 Al uva 0 0 .72 0 15 .64 URBAN
4 Amba l l ur 0 1 .64 0 0 AGRICULTURE
5 Anga ma l y 0 1 .23 0 0.2 5 AGRICULTURE
6 Ara kkuzha 0 .1 13 1 .45 0 0 AGRICULTURE
7 As a ma nnoor 0 .0 18 1 .38 0 0.1 1 AGRICULTURE
8 Avoly 0 .0 32 1 .72 0 0.3 2 AGRICULTURE
9 Aya va na 0 .1 03 1 .26 0 .1 0 9 0.1 8 AGRICULTURE
1 0 Ayya mpuzha 0 .9 47 1 .09 2 .5 8 3 0 PLANTATIO N
1 1 Chel l a na m 0 1 .58 0 0 AGRICULTURE
1 2 Chenda ma nga l a m 0 1 .45 0 0 AGRICULTURE
1 3 Chenga ma na d 0 1 .43 0 3.5 6 URBAN
1 4 Chera na l l oor 0 1 .55 0 0 AGRICULTURE
1 5 Chi tta ttuka ra 0 1 .25 0 5.3 8 URBAN
1 6 Choorn ikka ra 0 1 .47 0 9.8 3 URBAN
1 7 Chotta ni kka ra 0 .0 42 1 .87 0 0 AGRICULTURE
1 8 Eda kka ttuva ya l 0 1 .87 0 0 AGRICULTURE
1 9 Eda tha la 0 .0 56 2 .04 0 0 AGRICULTURE
2 0 Eda va na kka d 0 1 .42 0 0 AGRICULTURE
2 1 El a mkunna ppuzha 0 1 .28 0 0.2 7 AGRICULTURE
2 2 El a nj i 0 .05 1 .71 0 0 AGRICULTURE
2 3 El oor 0 3 .02 0 1.2 3 AGRICULTURE
2 4 Ezh ikka ra 0 1 .05 0 0 AGRICULTURE
2 5 K a da ma kkudy 0 1 .44 0 0 AGRICULTURE
2 6 K a dunga l l oor 0 1 .95 0 0 AGRICULTURE
2 7 K a l a dy 0 2 .25 0 0.0 6 AGRICULTURE
2 8 K a l a ma s s ery 0 .17 1 .47 0 0.2 1 AGRICULTURE
2 9 K a l loorkka d 0 .1 31 1 .16 0 0.2 1 AGRICULTURE
3 0 K a nj oor 0 .0 17 1 .74 0 2.4 4 URBAN
3 1 K a rukutty 0 .0 91 1 .81 0 0.1 1 AGRICULTURE
3 2 K a ruma l l oor 0 1 .53 0 0 AGRICULTURE
3 3 K a va l a nga d 1 .1 22 0 .62 2.8 3 0.2 6 PLANTATIO N
3 4 K eera mpa ra 0 .5 48 0 .94 2 .2 6 8 0.2 6 PLANTATIO N
3 5 K eezhma du 0 1 .44 0 0 AGRICULTURE
Cont....
ANNEXE - 7
LSG WISE LAND USE CONCENTRATION PATTERN
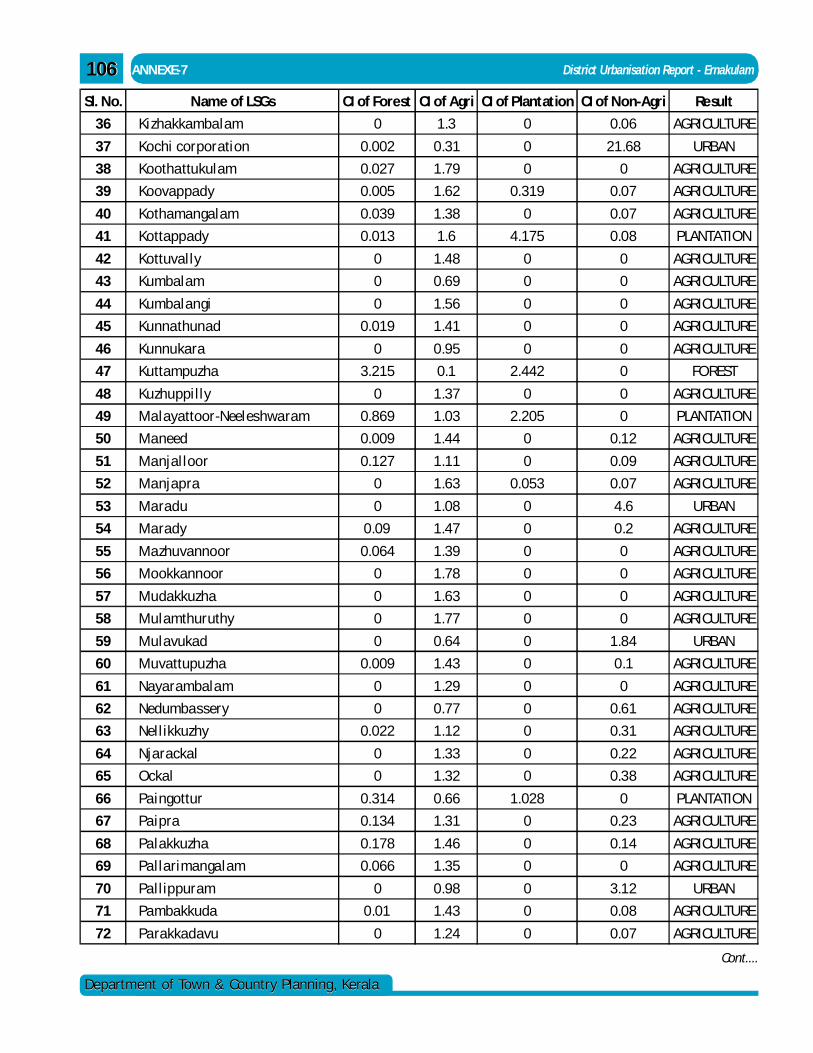
106106
Department of Town & Country Planning, KeralaDepartment of Town & Country Planning, Kerala
ANNEXE-7 District Urbanisation Report - Ernakulam
Sl. No. Name of LSGs CI of Forest CI of Agri CI of Plantation CI of Non-Agri Result
36 Kizhakkambalam 0 1.3 0 0.06 AGRICULTURE
37 Kochi corporation 0.002 0.31 0 21.68 URBAN
38 Koothattukulam 0.027 1.79 0 0 AGRICULTURE
39 Koovappady 0.005 1.62 0.319 0.07 AGRICULTURE
40 Kothamangalam 0.039 1.38 0 0.07 AGRICULTURE
41 Kottappady 0.013 1.6 4.175 0.08 PLANTATION
42 Kottuvally 0 1.48 0 0 AGRICULTURE
43 Kumbalam 0 0.69 0 0 AGRICULTURE
44 Kumbalangi 0 1.56 0 0 AGRICULTURE
45 Kunnathunad 0.019 1.41 0 0 AGRICULTURE
46 Kunnukara 0 0.95 0 0 AGRICULTURE
47 Kuttampuzha 3.215 0.1 2.442 0 FOREST
48 Kuzhuppilly 0 1.37 0 0 AGRICULTURE
49 Malayattoor-Neeleshwaram 0.869 1.03 2.205 0 PLANTATION
50 Maneed 0.009 1.44 0 0.12 AGRICULTURE
51 Manjalloor 0.127 1.11 0 0.09 AGRICULTURE
52 Manjapra 0 1.63 0.053 0.07 AGRICULTURE
53 Maradu 0 1.08 0 4.6 URBAN
54 Marady 0.09 1.47 0 0.2 AGRICULTURE
55 Mazhuvannoor 0.064 1.39 0 0 AGRICULTURE
56 Mookkannoor 0 1.78 0 0 AGRICULTURE
57 Mudakkuzha 0 1.63 0 0 AGRICULTURE
58 Mulamthuruthy 0 1.77 0 0 AGRICULTURE
59 Mulavukad 0 0.64 0 1.84 URBAN
60 Muvattupuzha 0.009 1.43 0 0.1 AGRICULTURE
61 Nayarambalam 0 1.29 0 0 AGRICULTURE
62 Nedumbassery 0 0.77 0 0.61 AGRICULTURE
63 Nellikkuzhy 0.022 1.12 0 0.31 AGRICULTURE
64 Njarackal 0 1.33 0 0.22 AGRICULTURE
65 Ockal 0 1.32 0 0.38 AGRICULTURE
66 Paingottur 0.314 0.66 1.028 0 PLANTATION
67 Paipra 0.134 1.31 0 0.23 AGRICULTURE
68 Palakkuzha 0.178 1.46 0 0.14 AGRICULTURE
69 Pallarimangalam 0.066 1.35 0 0 AGRICULTURE
70 Pallippuram 0 0.98 0 3.12 URBAN
71 Pambakkuda 0.01 1.43 0 0.08 AGRICULTURE
72 Parakkadavu 0 1.24 0 0.07 AGRICULTURE
Cont....
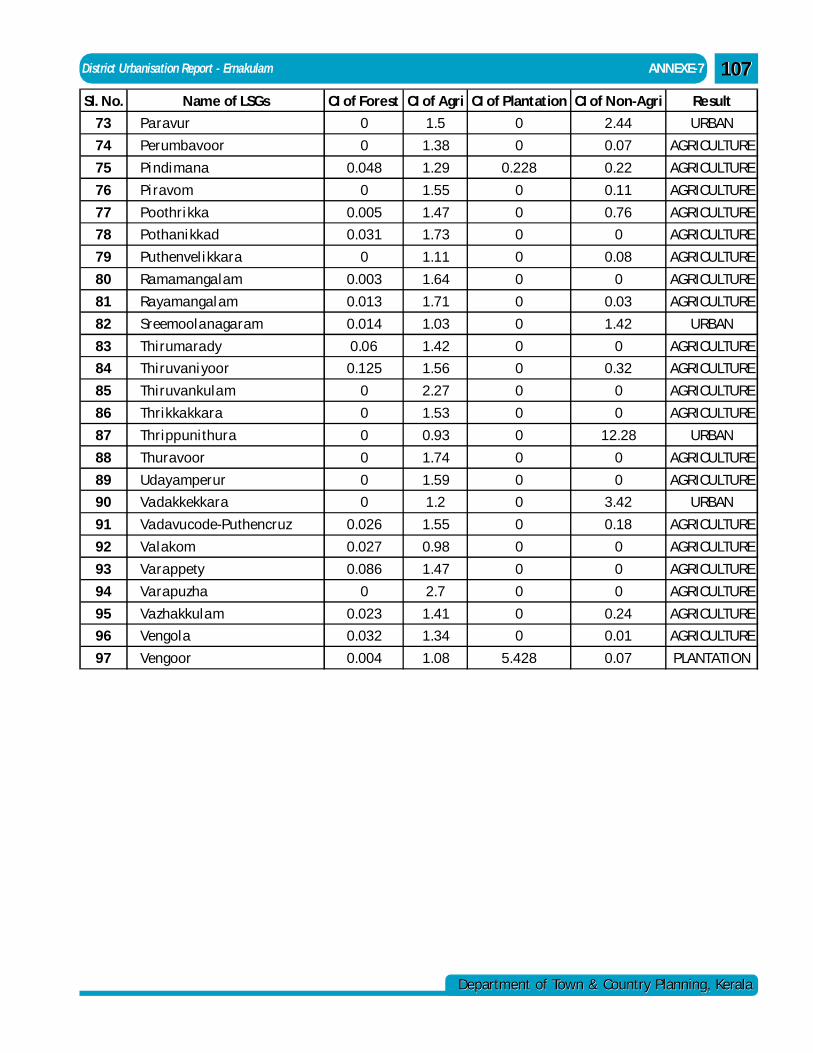
District Urbanisation Report - Ernakulam ANNEXE-7
Department of Town & Country Planning, KeralaDepartment of Town & Country Planning, Kerala
107107
Sl. No. Name of LSGs CI of Forest CI of Agri CI of Plantation CI of Non-Agri Result
73 Paravur 0 1.5 0 2.44 URBAN
74 Perumbavoor 0 1.38 0 0.07 AGRICULTURE
75 Pindimana 0.048 1.29 0.228 0.22 AGRICULTURE
76 Piravom 0 1.55 0 0.11 AGRICULTURE
77 Poothrikka 0.005 1.47 0 0.76 AGRICULTURE
78 Pothanikkad 0.031 1.73 0 0 AGRICULTURE
79 Puthenvelikkara 0 1.11 0 0.08 AGRICULTURE
80 Ramamangalam 0.003 1.64 0 0 AGRICULTURE
81 Rayamangalam 0.013 1.71 0 0.03 AGRICULTURE
82 Sreemoolanagaram 0.014 1.03 0 1.42 URBAN
83 Thirumarady 0.06 1.42 0 0 AGRICULTURE
84 Thiruvaniyoor 0.125 1.56 0 0.32 AGRICULTURE
85 Thiruvankulam 0 2.27 0 0 AGRICULTURE
86 Thrikkakkara 0 1.53 0 0 AGRICULTURE
87 Thrippunithura 0 0.93 0 12.28 URBAN
88 Thuravoor 0 1.74 0 0 AGRICULTURE
89 Udayamperur 0 1.59 0 0 AGRICULTURE
90 Vadakkekkara 0 1.2 0 3.42 URBAN
91 Vadavucode-Puthencruz 0.026 1.55 0 0.18 AGRICULTURE
92 Valakom 0.027 0.98 0 0 AGRICULTURE
93 Varappety 0.086 1.47 0 0 AGRICULTURE
94 Varapuzha 0 2.7 0 0 AGRICULTURE
95 Vazhakkulam 0.023 1.41 0 0.24 AGRICULTURE
96 Vengola 0.032 1.34 0 0.01 AGRICULTURE
97 Vengoor 0.004 1.08 5.428 0.07 PLANTATION
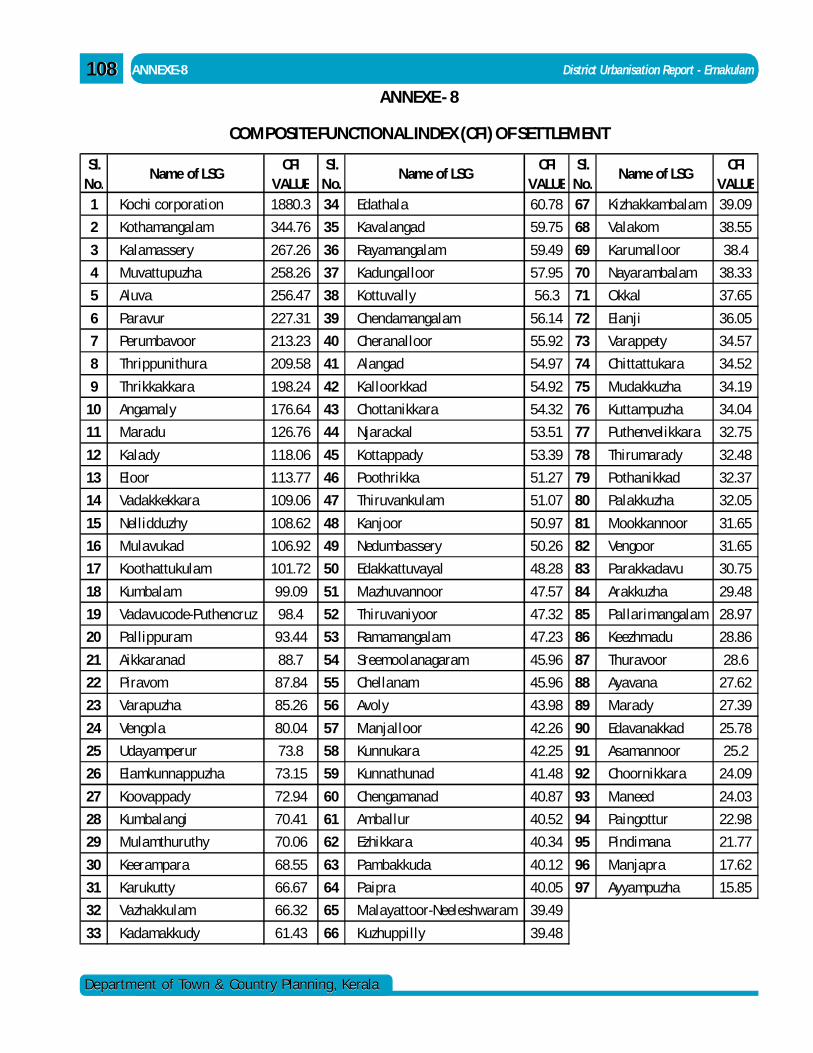
108108
Department of Town & Country Planning, KeralaDepartment of Town & Country Planning, Kerala
ANNEXE-8 District Urbanisation Report - Ernakulam
Sl. No.
Name of LSGCFI
VALUESl.
No.Name of LSG
CFI VALUE
Sl. No.
Name of LSGCFI
VALUE1 Kochi corporation 1880.3 34 Edathala 60.78 67 Kizhakkambalam 39.09
2 Kothamangalam 344.76 35 Kavalangad 59.75 68 Valakom 38.55
3 Kalamassery 267.26 36 Rayamangalam 59.49 69 Karumalloor 38.4
4 Muvattupuzha 258.26 37 Kadungalloor 57.95 70 Nayarambalam 38.33
5 Aluva 256.47 38 Kottuvally 56.3 71 Okkal 37.65
6 Paravur 227.31 39 Chendamangalam 56.14 72 Elanji 36.05
7 Perumbavoor 213.23 40 Cheranalloor 55.92 73 Varappety 34.57
8 Thrippunithura 209.58 41 Alangad 54.97 74 Chittattukara 34.52
9 Thrikkakkara 198.24 42 Kalloorkkad 54.92 75 Mudakkuzha 34.19
10 Angamaly 176.64 43 Chottanikkara 54.32 76 Kuttampuzha 34.04
11 Maradu 126.76 44 Njarackal 53.51 77 Puthenvelikkara 32.75
12 Kalady 118.06 45 Kottappady 53.39 78 Thirumarady 32.48
13 Eloor 113.77 46 Poothrikka 51.27 79 Pothanikkad 32.37
14 Vadakkekkara 109.06 47 Thiruvankulam 51.07 80 Palakkuzha 32.05
15 Nellidduzhy 108.62 48 Kanjoor 50.97 81 Mookkannoor 31.65
16 Mulavukad 106.92 49 Nedumbassery 50.26 82 Vengoor 31.65
17 Koothattukulam 101.72 50 Edakkattuvayal 48.28 83 Parakkadavu 30.75
18 Kumbalam 99.09 51 Mazhuvannoor 47.57 84 Arakkuzha 29.48
19 Vadavucode-Puthencruz 98.4 52 Thiruvaniyoor 47.32 85 Pallarimangalam 28.97
20 Pallippuram 93.44 53 Ramamangalam 47.23 86 Keezhmadu 28.86
21 Aikkaranad 88.7 54 Sreemoolanagaram 45.96 87 Thuravoor 28.6
22 Piravom 87.84 55 Chellanam 45.96 88 Ayavana 27.62
23 Varapuzha 85.26 56 Avoly 43.98 89 Marady 27.39
24 Vengola 80.04 57 Manjalloor 42.26 90 Edavanakkad 25.78
25 Udayamperur 73.8 58 Kunnukara 42.25 91 Asamannoor 25.2
26 Elamkunnappuzha 73.15 59 Kunnathunad 41.48 92 Choornikkara 24.09
27 Koovappady 72.94 60 Chengamanad 40.87 93 Maneed 24.03
28 Kumbalangi 70.41 61 Amballur 40.52 94 Paingottur 22.98
29 Mulamthuruthy 70.06 62 Ezhikkara 40.34 95 Pindimana 21.77
30 Keerampara 68.55 63 Pambakkuda 40.12 96 Manjapra 17.62
31 Karukutty 66.67 64 Paipra 40.05 97 Ayyampuzha 15.85
32 Vazhakkulam 66.32 65 Malayattoor-Neeleshwaram 39.49
33 Kadamakkudy 61.43 66 Kuzhuppilly 39.48
ANNEXE - 8
COMPOSITE FUNCTIONAL INDEX (CFI) OF SETTLEMENT
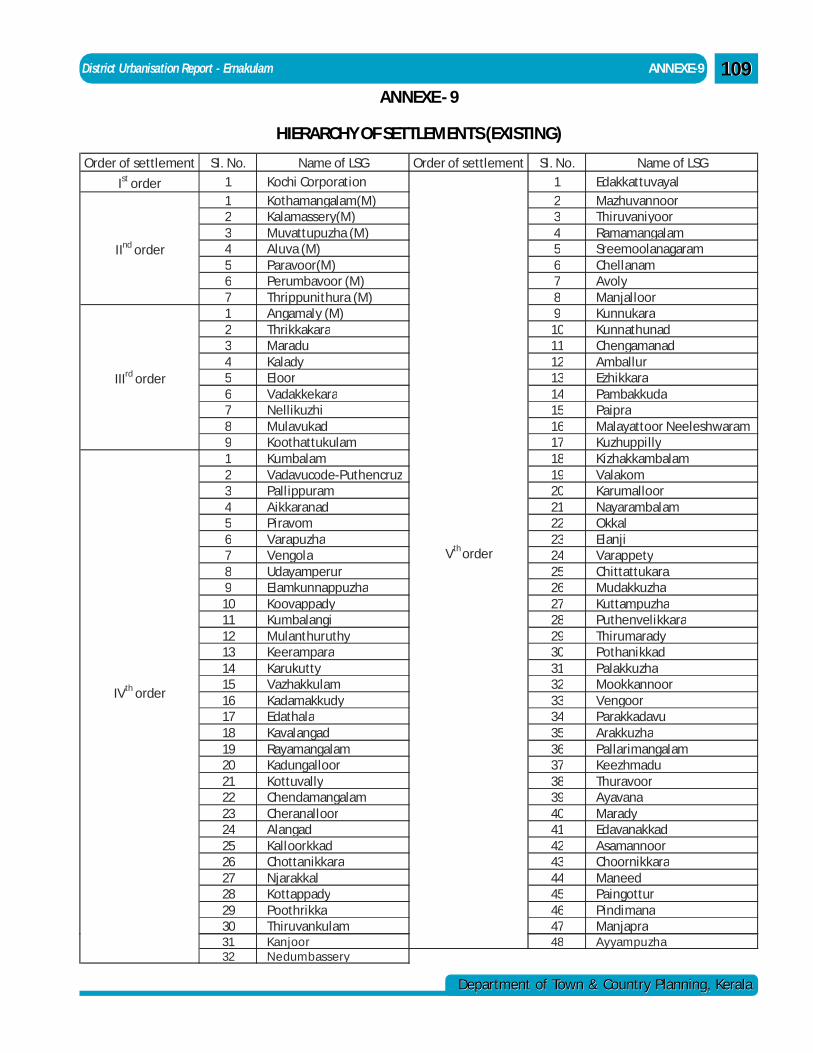
District Urbanisation Report - Ernakulam ANNEXE-9
Department of Town & Country Planning, KeralaDepartment of Town & Country Planning, Kerala
109109ANNEXE - 9
HIERARCHY OF SETTLEMENTS (EXISTING)
Order of settlement Sl. No. Name of LSG Order of settlement Sl. No. Name of LSG
Ist order 1 Kochi Corporation 1 Edakkattuvayal1 Kothamangalam(M) 2 Mazhuvannoor2 Kalamassery(M) 3 Thiruvaniyoor3 Muvattupuzha (M) 4 Ramamangalam4 Aluva (M) 5 Sreemoolanagaram5 Paravoor(M) 6 Chellanam6 Perumbavoor (M) 7 Avoly7 Thrippunithura (M) 8 Manjalloor1 Angamaly (M) 9 Kunnukara2 Thrikkakara 10 Kunnathunad3 Maradu 11 Chengamanad4 Kalady 12 Amballur5 Eloor 13 Ezhikkara6 Vadakkekara 14 Pambakkuda7 Nellikuzhi 15 Paipra8 Mulavukad 16 Malayattoor Neeleshwaram9 Koothattukulam 17 Kuzhuppilly1 Kumbalam 18 Kizhakkambalam2 Vadavucode-Puthencruz 19 Valakom3 Pallippuram 20 Karumalloor4 Aikkaranad 21 Nayarambalam5 Piravom 22 Okkal6 Varapuzha 23 Elanji7 Vengola 24 Varappety8 Udayamperur 25 Chittattukara 9 Elamkunnappuzha 26 Mudakkuzha10 Koovappady 27 Kuttampuzha11 Kumbalangi 28 Puthenvelikkara12 Mulanthuruthy 29 Thirumarady13 Keerampara 30 Pothanikkad14 Karukutty 31 Palakkuzha15 Vazhakkulam 32 Mookkannoor16 Kadamakkudy 33 Vengoor17 Edathala 34 Parakkadavu18 Kavalangad 35 Arakkuzha19 Rayamangalam 36 Pallarimangalam20 Kadungalloor 37 Keezhmadu21 Kottuvally 38 Thuravoor22 Chendamangalam 39 Ayavana23 Cheranalloor 40 Marady24 Alangad 41 Edavanakkad25 Kalloorkkad 42 Asamannoor26 Chottanikkara 43 Choornikkara27 Njarakkal 44 Maneed28 Kottappady 45 Paingottur29 Poothrikka 46 Pindimana30 Thiruvankulam 47 Manjapra
IInd order
IVth order
IIIrd order
Vth order
31 Kanjoor 48 Ayyampuzha32 Nedumbassery
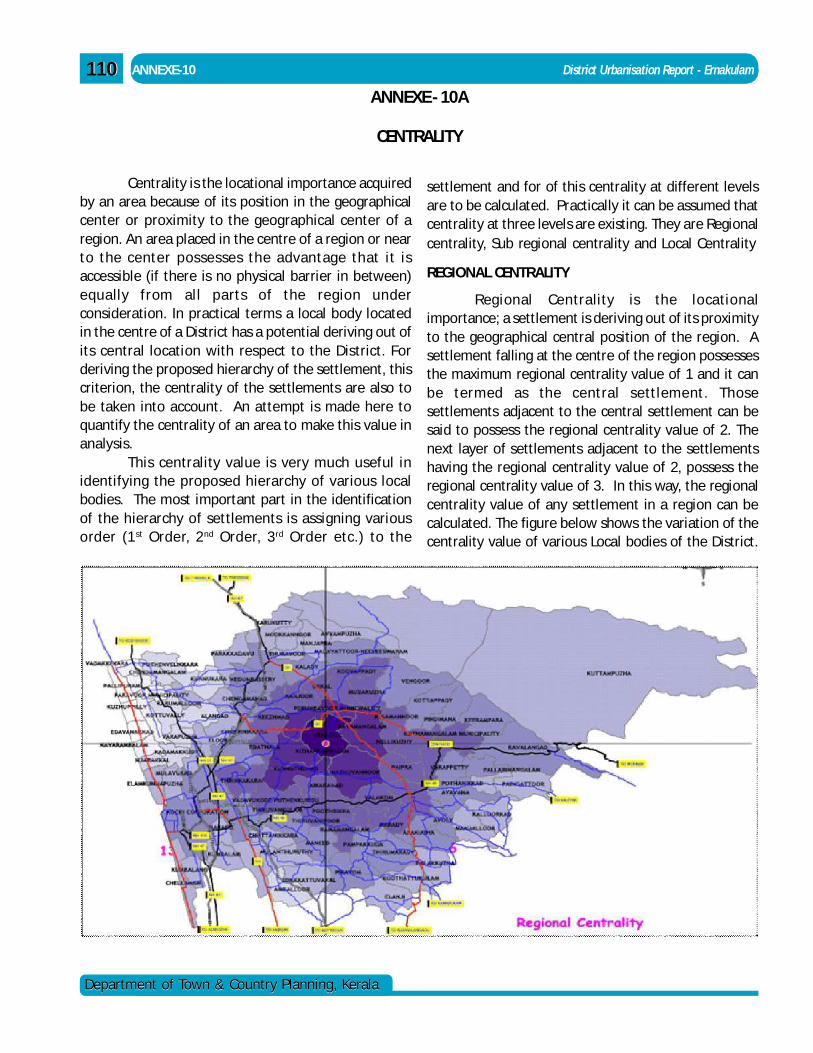
110110
Department of Town & Country Planning, KeralaDepartment of Town & Country Planning, Kerala
ANNEXE-10 District Urbanisation Report - Ernakulam
ANNEXE - 10A
CENTRALITY
Centrality is the locational importance acquiredby an area because of its position in the geographicalcenter or proximity to the geographical center of aregion. An area placed in the centre of a region or nearto the center possesses the advantage that it isaccessible (if there is no physical barrier in between)equally from all parts of the region underconsideration. In practical terms a local body locatedin the centre of a District has a potential deriving out ofits central location with respect to the District. Forderiving the proposed hierarchy of the settlement, thiscriterion, the centrality of the settlements are also tobe taken into account. An attempt is made here toquantify the centrality of an area to make this value inanalysis.
This centrality value is very much useful inidentifying the proposed hierarchy of various localbodies. The most important part in the identificationof the hierarchy of settlements is assigning variousorder (1st Order, 2nd Order, 3 rd Order etc.) to the
settlement and for of this centrality at different levelsare to be calculated. Practically it can be assumed thatcentrality at three levels are existing. They are Regionalcentrality, Sub regional centrality and Local Centrality
REGIONAL CENTRALITY
Regional Centrality is the locationalimportance; a settlement is deriving out of its proximityto the geographical central position of the region. Asettlement falling at the centre of the region possessesthe maximum regional centrality value of 1 and it canbe termed as the central settlement. Thosesettlements adjacent to the central settlement can besaid to possess the regional centrality value of 2. Thenext layer of settlements adjacent to the settlementshaving the regional centrality value of 2, possess theregional centrality value of 3. In this way, the regionalcentrality value of any settlement in a region can becalculated. The figure below shows the variation of thecentrality value of various Local bodies of the District.
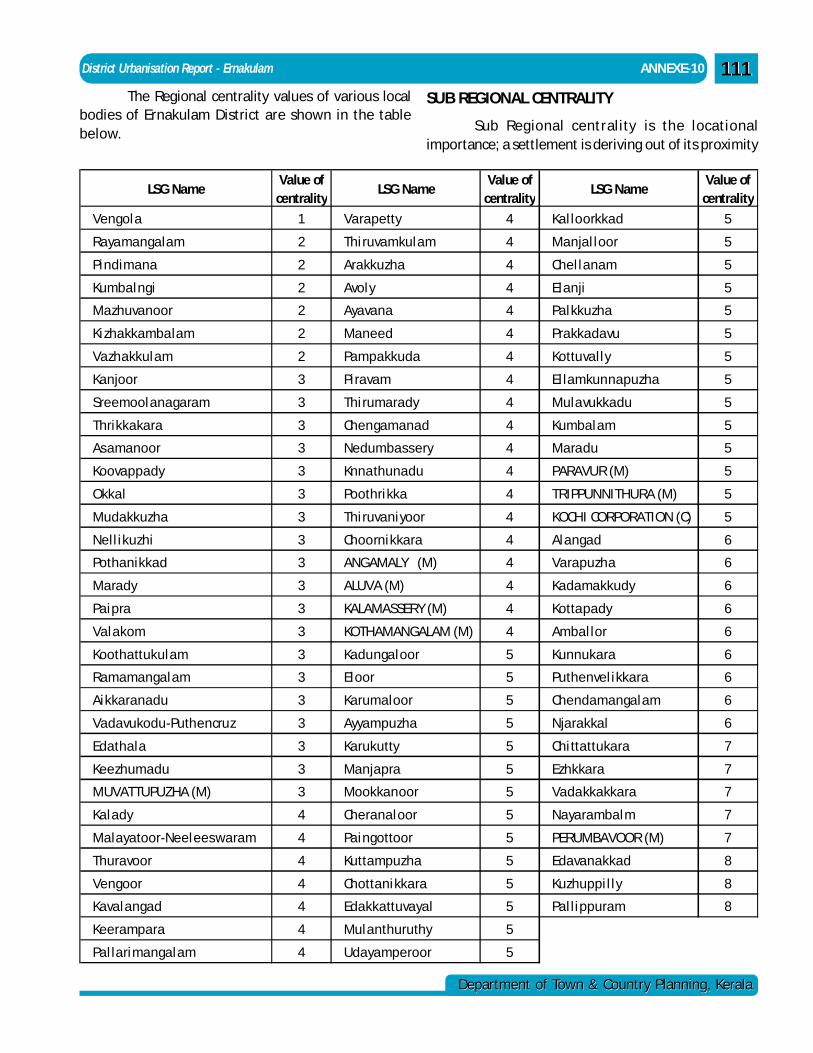
District Urbanisation Report - Ernakulam ANNEXE-10
Department of Town & Country Planning, KeralaDepartment of Town & Country Planning, Kerala
111111The Regional centrality values of various local
bodies of Ernakulam District are shown in the tablebelow.
LSG NameValue of
centralityLSG Name
Value of centrality
LSG NameValue of
centrality
Vengola 1 Varapetty 4 Kal loorkkad 5
Rayamangalam 2 Thiruvamkulam 4 Manjal loor 5
Pindimana 2 Arakkuzha 4 Chel lanam 5
Kumbalngi 2 Avoly 4 Elanji 5
Mazhuvanoor 2 Ayavana 4 Palkkuzha 5
Kizhakkambalam 2 Maneed 4 Prakkadavu 5
Vazhakkulam 2 Pampakkuda 4 Kottuvally 5
Kanjoor 3 Piravam 4 El lamkunnapuzha 5
Sreemoolanagaram 3 Thirumarady 4 Mulavukkadu 5
Thrikkakara 3 Chengamanad 4 Kumbalam 5
Asamanoor 3 Nedumbassery 4 Maradu 5
Koovappady 3 Knnathunadu 4 PARAVUR (M) 5
Okkal 3 Poothrikka 4 TRIPPUNNITHURA (M) 5
Mudakkuzha 3 Thiruvaniyoor 4 KOCHI CORPORATION (C) 5
Nell ikuzhi 3 Choornikkara 4 Alangad 6
Pothanikkad 3 ANGAMALY (M) 4 Varapuzha 6
Marady 3 ALUVA (M) 4 Kadamakkudy 6
Paipra 3 KALAMASSERY (M) 4 Kottapady 6
Valakom 3 KOTHAMANGALAM (M) 4 Ambal lor 6
Koothattukulam 3 Kadungaloor 5 Kunnukara 6
Ramamangalam 3 Eloor 5 Puthenvel ikkara 6
Aikkaranadu 3 Karumaloor 5 Chendamangalam 6
Vadavukodu-Puthencruz 3 Ayyampuzha 5 Njarakkal 6
Edathala 3 Karukutty 5 Chittattukara 7
Keezhumadu 3 Manjapra 5 Ezhkkara 7
MUVATTUPUZHA (M) 3 Mookkanoor 5 Vadakkakkara 7
Kalady 4 Cheranaloor 5 Nayarambalm 7
Malayatoor-Neeleeswaram 4 Paingottoor 5 PERUMBAVOOR (M) 7
Thuravoor 4 Kuttampuzha 5 Edavanakkad 8
Vengoor 4 Chottanikkara 5 Kuzhuppi l ly 8
Kavalangad 4 Edakkattuvayal 5 Pal lippuram 8
Keerampara 4 Mulanthuruthy 5
Pal larimangalam 4 Udayamperoor 5
SUB REGIONAL CENTRALITY
Sub Regional centrality is the locationalimportance; a settlement is deriving out of its proximity
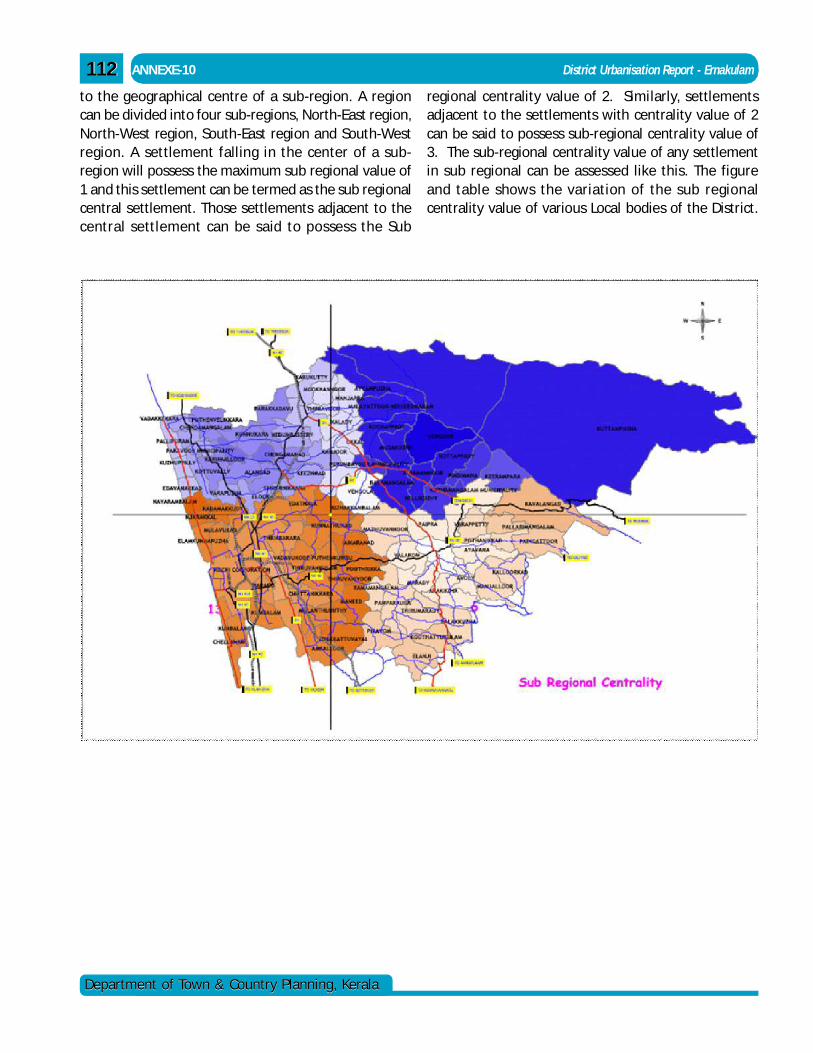
112112
Department of Town & Country Planning, KeralaDepartment of Town & Country Planning, Kerala
ANNEXE-10 District Urbanisation Report - Ernakulam
to the geographical centre of a sub-region. A regioncan be divided into four sub-regions, North-East region,North-West region, South-East region and South-Westregion. A settlement falling in the center of a sub-region will possess the maximum sub regional value of1 and this settlement can be termed as the sub regionalcentral settlement. Those settlements adjacent to thecentral settlement can be said to possess the Sub
regional centrality value of 2. Similarly, settlementsadjacent to the settlements with centrality value of 2can be said to possess sub-regional centrality value of3. The sub-regional centrality value of any settlementin sub regional can be assessed like this. The figureand table shows the variation of the sub regionalcentrality value of various Local bodies of the District.
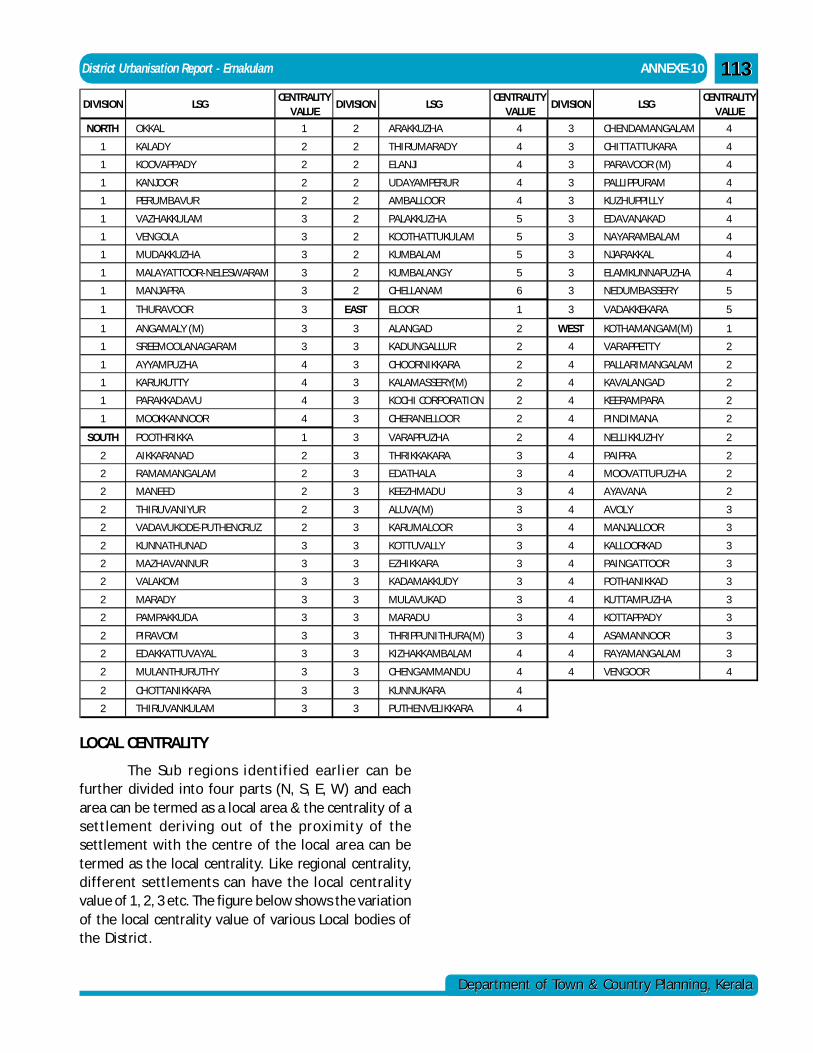
District Urbanisation Report - Ernakulam ANNEXE-10
Department of Town & Country Planning, KeralaDepartment of Town & Country Planning, Kerala
113113
DIVISION LSGCENTRALITY
VALUEDIVISION LSG
CENTRALITY VALUE
DIVISION LSGCENTRALITY
VALUE
NORTH OKKAL 1 2 ARAKKUZHA 4 3 CHENDAMANGALAM 4
1 KALADY 2 2 THIRUMARADY 4 3 CHITTATTUKARA 4
1 KOOVAPPADY 2 2 ELANJI 4 3 PARAVOOR (M) 4
1 KANJOOR 2 2 UDAYAMPERUR 4 3 PALLIPPURAM 4
1 PERUMBAVUR 2 2 AMBALLOOR 4 3 KUZHUPPILLY 4
1 VAZHAKKULAM 3 2 PALAKKUZHA 5 3 EDAVANAKAD 4
1 VENGOLA 3 2 KOOTHATTUKULAM 5 3 NAYARAMBALAM 4
1 MUDAKKUZHA 3 2 KUMBALAM 5 3 NJARAKKAL 4
1 MALAYATTOOR-NELESWARAM 3 2 KUMBALANGY 5 3 ELAMKUNNAPUZHA 4
1 MANJAPRA 3 2 CHELLANAM 6 3 NEDUMBASSERY 5
1 THURAVOOR 3 EAST ELOOR 1 3 VADAKKEKARA 5
1 ANGAMALY (M) 3 3 ALANGAD 2 WEST KOTHAMANGAM(M) 1
1 SREEMOOLANAGARAM 3 3 KADUNGALLUR 2 4 VARAPPETTY 2
1 AYYAMPUZHA 4 3 CHOORNIKKARA 2 4 PALLARIMANGALAM 2
1 KARUKUTTY 4 3 KALAMASSERY(M) 2 4 KAVALANGAD 2
1 PARAKKADAVU 4 3 KOCHI CORPORATION 2 4 KEERAMPARA 2
1 MOOKKANNOOR 4 3 CHERANELLOOR 2 4 PINDIMANA 2
SOUTH POOTHRIKKA 1 3 VARAPPUZHA 2 4 NELLIKKUZHY 2
2 AIKKARANAD 2 3 THRIKKAKARA 3 4 PAIPRA 2
2 RAMAMANGALAM 2 3 EDATHALA 3 4 MOOVATTUPUZHA 2
2 MANEED 2 3 KEEZHMADU 3 4 AYAVANA 2
2 THIRUVANIYUR 2 3 ALUVA(M) 3 4 AVOLY 3
2 VADAVUKODE-PUTHENCRUZ 2 3 KARUMALOOR 3 4 MANJALLOOR 3
2 KUNNATHUNAD 3 3 KOTTUVALLY 3 4 KALLOORKAD 3
2 MAZHAVANNUR 3 3 EZHIKKARA 3 4 PAINGATTOOR 3
2 VALAKOM 3 3 KADAMAKKUDY 3 4 POTHANIKKAD 3
2 MARADY 3 3 MULAVUKAD 3 4 KUTTAMPUZHA 3
2 PAMPAKKUDA 3 3 MARADU 3 4 KOTTAPPADY 3
2 PIRAVOM 3 3 THRIPPUNITHURA(M) 3 4 ASAMANNOOR 3
2 EDAKKATTUVAYAL 3 3 KIZHAKKAMBALAM 4 4 RAYAMANGALAM 3
2 MULANTHURUTHY 3 3 CHENGAMMANDU 4 4 VENGOOR 4
2 CHOTTANIKKARA 3 3 KUNNUKARA 4
2 THIRUVANKULAM 3 3 PUTHENVELIKKARA 4
LOCAL CENTRALITY
The Sub regions identified earlier can befurther divided into four parts (N, S, E, W) and eacharea can be termed as a local area & the centrality of asettlement deriving out of the proximity of thesettlement with the centre of the local area can betermed as the local centrality. Like regional centrality,different settlements can have the local centralityvalue of 1, 2, 3 etc. The figure below shows the variationof the local centrality value of various Local bodies ofthe District.
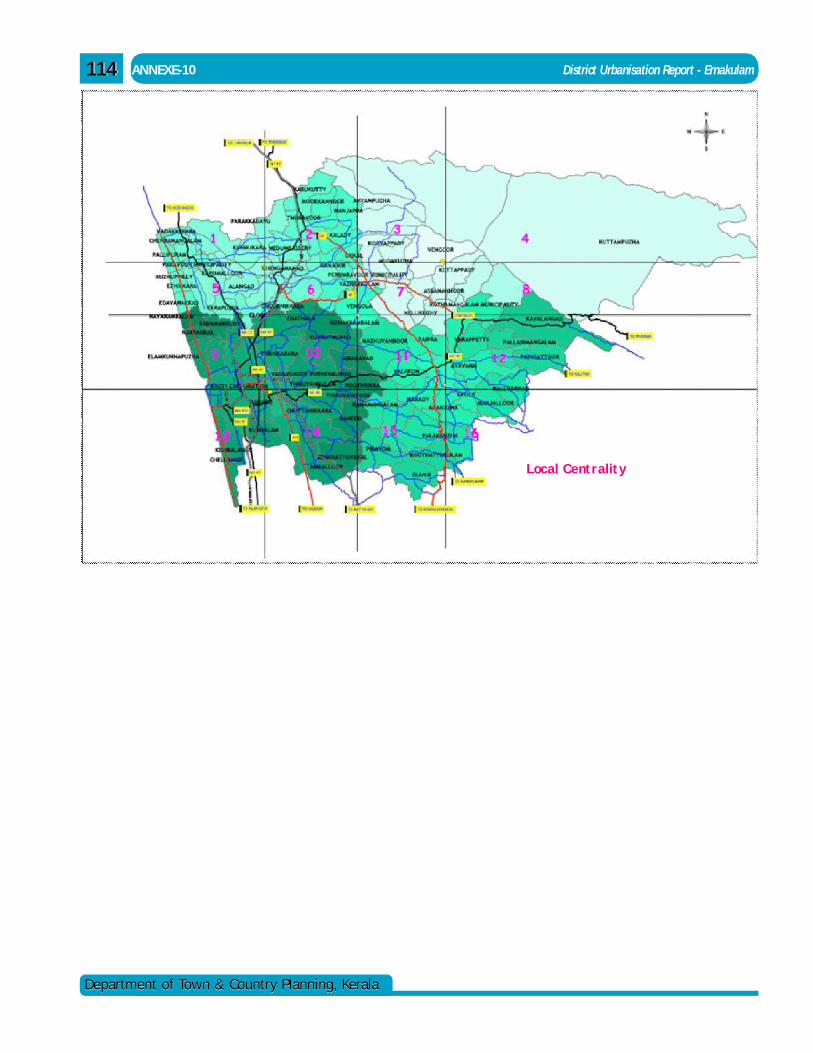
114114
Department of Town & Country Planning, KeralaDepartment of Town & Country Planning, Kerala
ANNEXE-10 District Urbanisation Report - Ernakulam
Local Centrality
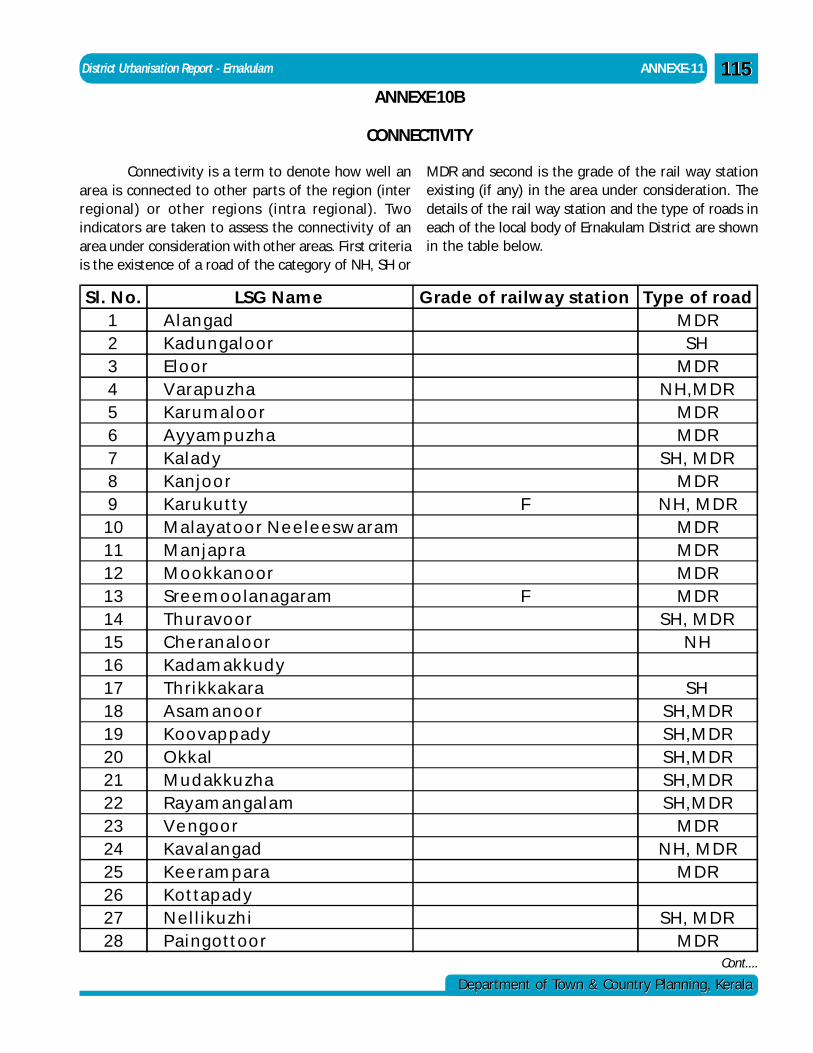
District Urbanisation Report - Ernakulam ANNEXE-11
Department of Town & Country Planning, KeralaDepartment of Town & Country Planning, Kerala
115115ANNEXE 10B
CONNECTIVITY
Connectivity is a term to denote how well anarea is connected to other parts of the region (interregional) or other regions (intra regional). Twoindicators are taken to assess the connectivity of anarea under consideration with other areas. First criteriais the existence of a road of the category of NH, SH or
MDR and second is the grade of the rail way stationexisting (if any) in the area under consideration. Thedetails of the rail way station and the type of roads ineach of the local body of Ernakulam District are shownin the table below.
Sl. N o. LSG N am e G rad e o f rai lw ay station Typ e o f road1 A lan gad M D R2 K ad u n galo o r S H3 Elo o r M D R4 V arap u zh a N H ,M D R5 K aru m alo o r M D R6 A y y a m p u zh a M D R7 K alad y S H , M D R8 K an jo o r M D R9 K aru k u tty F N H , M D R
10 M a la y ato o r N e e le e sw aram M D R11 M a n jap ra M D R12 M o o k k an o o r M D R13 S re e m o o la n ag aram F M D R14 Th u rav o o r S H , M D R15 C h e ran alo o r N H16 K ad a m ak k u d y17 Th rik k a k ara S H18 A sam an o o r S H ,M D R19 K o o v ap p ad y S H ,M D R20 O k k al S H ,M D R21 M u d ak k u zh a S H ,M D R22 R ay am an galam S H ,M D R23 V e n g o o r M D R24 K av alan gad N H , M D R25 K e e ram p ara M D R26 K o ttap ad y27 N e l l ik u zh i S H , M D R28 P ain g o tto o r M D R
Cont....
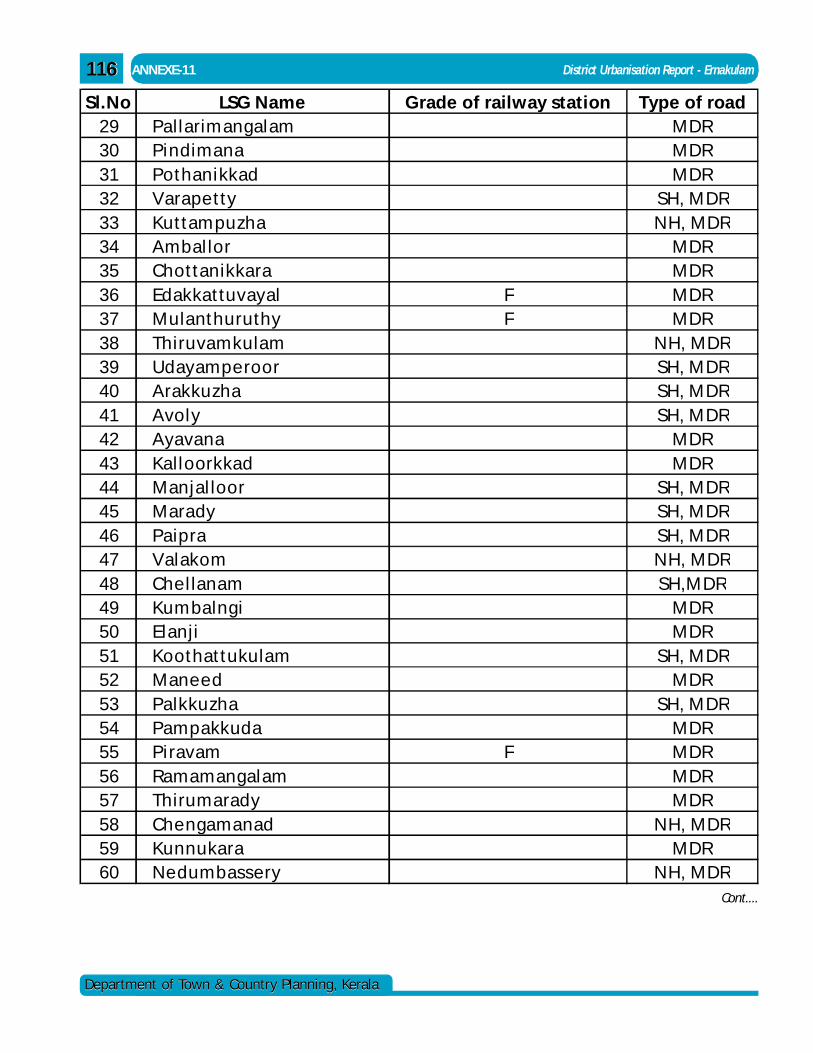
116116
Department of Town & Country Planning, KeralaDepartment of Town & Country Planning, Kerala
ANNEXE-11 District Urbanisation Report - Ernakulam
Sl.No LSG Name G rade of railway station Type of road29 Pallarim angalam MDR30 Pindim ana MDR31 Pothanikkad MDR32 V arape tty SH, MDR33 Kuttam puzha N H, MDR34 Am ballor MDR35 Chottanikkara MDR36 Edakkattuvayal F MDR37 Mulanthuruthy F MDR38 Thiruvam kulam N H, MDR39 Udayam pe roor SH, MDR40 Arakkuzha SH, MDR41 Avoly SH, MDR42 Ayavana MDR43 Kalloorkkad MDR44 Manjal loor SH, MDR45 Marady SH, MDR46 Paipra SH, MDR47 V alakom N H, MDR48 Che llanam SH,MDR49 Kum balngi MDR50 Elanji MDR51 Koothattukulam SH, MDR52 Mane e d MDR53 Palkkuzha SH, MDR54 Pam pakkuda MDR55 Piravam F MDR56 Ram am angalam MDR57 Thirum arady MDR58 Che ngam anad N H, MDR59 Kunnukara MDR60 N e dum bassery N H, MDR
Cont....
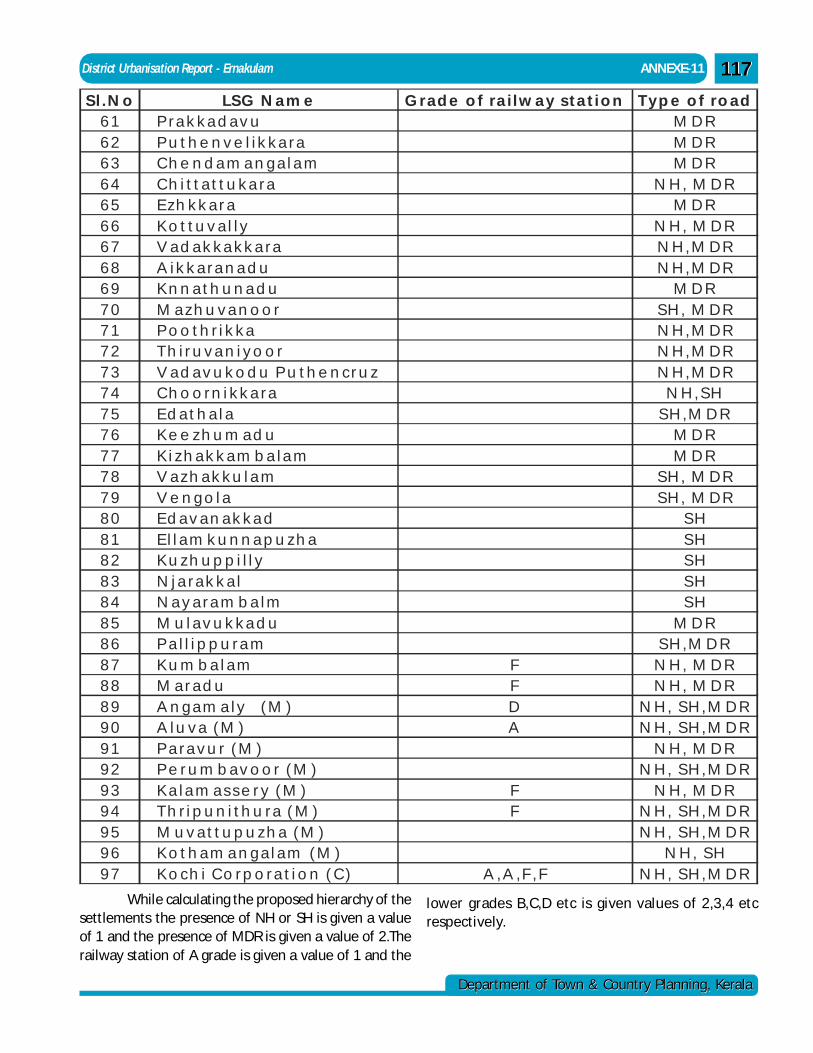
District Urbanisation Report - Ernakulam ANNEXE-11
Department of Town & Country Planning, KeralaDepartment of Town & Country Planning, Kerala
117117
S l .N o L S G N a m e G r a d e o f r a i l w a y s t a t i o n T y p e o f r o a d6 1 P r a k k a d a v u M D R6 2 P u t h e n v e l i k k a r a M D R6 3 C h e n d a m a n g a l a m M D R6 4 C h i t t a t t u k a r a N H , M D R6 5 E z h k k a r a M D R6 6 K o t t u v a l l y N H , M D R6 7 V a d a k k a k k a r a N H , M D R6 8 A i k k a r a n a d u N H , M D R6 9 K n n a t h u n a d u M D R7 0 M a z h u v a n o o r S H , M D R7 1 P o o t h r i k k a N H , M D R7 2 T h i r u v a n i y o o r N H , M D R7 3 V a d a v u k o d u P u t h e n c r u z N H , M D R7 4 C h o o r n i k k a r a N H , S H7 5 E d a t h a l a S H , M D R7 6 K e e z h u m a d u M D R7 7 K i z h a k k a m b a l a m M D R7 8 V a z h a k k u l a m S H , M D R7 9 V e n g o l a S H , M D R8 0 E d a v a n a k k a d S H8 1 E l l a m k u n n a p u z h a S H8 2 K u z h u p p i l l y S H8 3 N j a r a k k a l S H8 4 N a y a r a m b a l m S H8 5 M u l a v u k k a d u M D R8 6 P a l l i p p u r a m S H , M D R8 7 K u m b a l a m F N H , M D R8 8 M a r a d u F N H , M D R8 9 A n g a m a l y ( M ) D N H , S H , M D R9 0 A l u v a ( M ) A N H , S H , M D R9 1 P a r a v u r ( M ) N H , M D R9 2 P e r u m b a v o o r ( M ) N H , S H , M D R9 3 K a l a m a s s e r y ( M ) F N H , M D R9 4 T h r i p u n i t h u r a ( M ) F N H , S H , M D R9 5 M u v a t t u p u z h a ( M ) N H , S H , M D R9 6 K o t h a m a n g a l a m ( M ) N H , S H9 7 K o c h i C o r p o r a t i o n ( C ) A , A , F , F N H , S H , M D R
While calculating the proposed hierarchy of thesettlements the presence of NH or SH is given a valueof 1 and the presence of MDR is given a value of 2.Therailway station of A grade is given a value of 1 and the
lower grades B,C,D etc is given values of 2,3,4 etcrespectively.
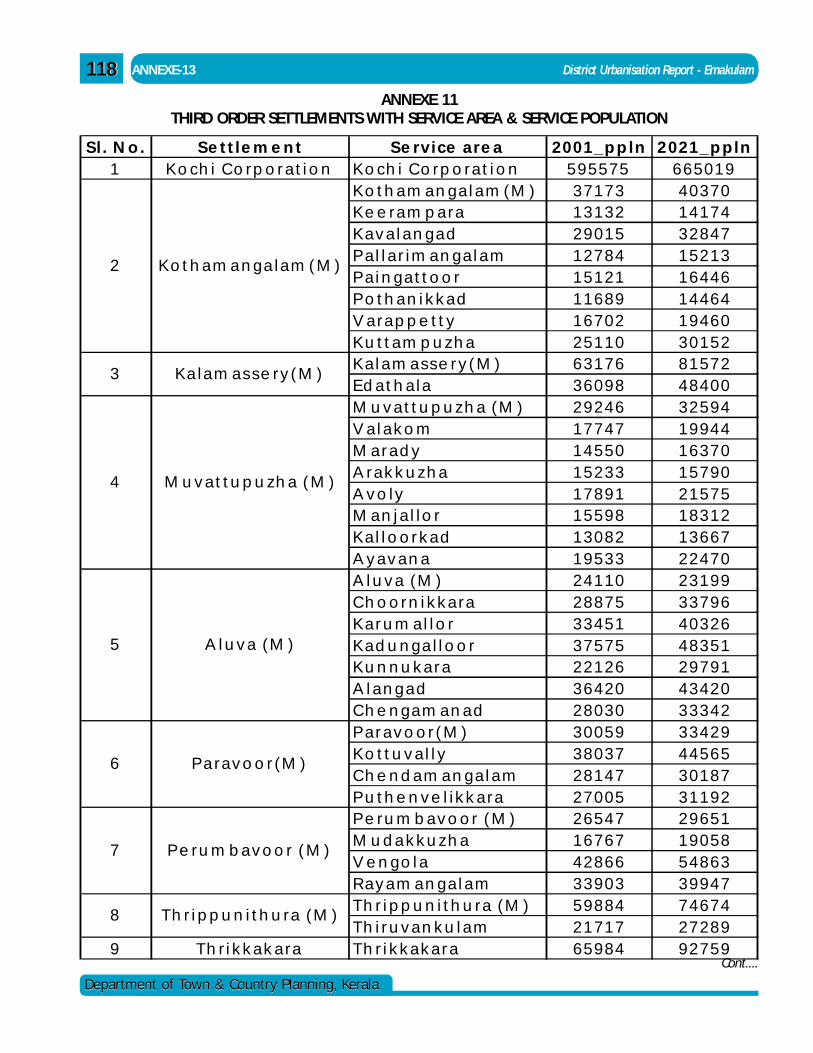
118118
Department of Town & Country Planning, KeralaDepartment of Town & Country Planning, Kerala
ANNEXE-13 District Urbanisation Report - Ernakulam
ANNEXE 11THIRD ORDER SETTLEMENTS WITH SERVICE AREA & SERVICE POPULATION
Cont....
S l . N o . S e t t l e m e n t S e r v i c e a r e a 2 0 0 1 _ p p l n 2 0 2 1 _ p p l n1 K o c h i C o rp o r a t i o n K o c h i C o rp o ra t i o n 5 9 5 5 7 5 6 6 5 0 1 9
K o t h a m a n g a l a m ( M ) 3 7 1 7 3 4 0 3 7 0K e e ra m p a ra 1 3 1 3 2 1 4 1 7 4K a v a l a n g a d 2 9 0 1 5 3 2 8 4 7P a l l a r i m a n g a l a m 1 2 7 8 4 1 5 2 1 3P a i n g a t t o o r 1 5 1 2 1 1 6 4 4 6P o t h a n i k k a d 1 1 6 8 9 1 4 4 6 4V a ra p p e t t y 1 6 7 0 2 1 9 4 6 0K u t t a m p u z h a 2 5 1 1 0 3 0 1 5 2K a l a m a s s e r y ( M ) 6 3 1 7 6 8 1 5 7 2E d a t h a l a 3 6 0 9 8 4 8 4 0 0M u v a t t u p u z h a ( M ) 2 9 2 4 6 3 2 5 9 4V a l a k o m 1 7 7 4 7 1 9 9 4 4M a r a d y 1 4 5 5 0 1 6 3 7 0A ra k k u z h a 1 5 2 3 3 1 5 7 9 0A v o l y 1 7 8 9 1 2 1 5 7 5M a n j a l l o r 1 5 5 9 8 1 8 3 1 2K a l l o o r k a d 1 3 0 8 2 1 3 6 6 7A y a v a n a 1 9 5 3 3 2 2 4 7 0A l u v a ( M ) 2 4 1 1 0 2 3 1 9 9C h o o r n i k k a ra 2 8 8 7 5 3 3 7 9 6K a r u m a l l o r 3 3 4 5 1 4 0 3 2 6K a d u n g a l l o o r 3 7 5 7 5 4 8 3 5 1K u n n u k a r a 2 2 1 2 6 2 9 7 9 1A l a n g a d 3 6 4 2 0 4 3 4 2 0C h e n g a m a n a d 2 8 0 3 0 3 3 3 4 2P a r a v o o r ( M ) 3 0 0 5 9 3 3 4 2 9K o t t u v a l l y 3 8 0 3 7 4 4 5 6 5C h e n d a m a n g a l a m 2 8 1 4 7 3 0 1 8 7P u t h e n v e l i k k a ra 2 7 0 0 5 3 1 1 9 2P e ru m b a v o o r ( M ) 2 6 5 4 7 2 9 6 5 1M u d a k k u z h a 1 6 7 6 7 1 9 0 5 8V e n g o l a 4 2 8 6 6 5 4 8 6 3R a y a m a n g a l a m 3 3 9 0 3 3 9 9 4 7T h r i p p u n i t h u ra ( M ) 5 9 8 8 4 7 4 6 7 4T h i r u v a n k u l a m 2 1 7 1 7 2 7 2 8 9
9 T h r i k k a k a ra T h r i k k a k a r a 6 5 9 8 4 9 2 7 5 9
2 K o t h a m a n g a l a m ( M )
3 K a l a m a s s e ry ( M )
4 M u v a t t u p u z h a ( M )
8 T h r i p p u n i t h u ra ( M )
5 A l u v a ( M )
6 P a ra v o o r ( M )
7 P e ru m b a v o o r ( M )
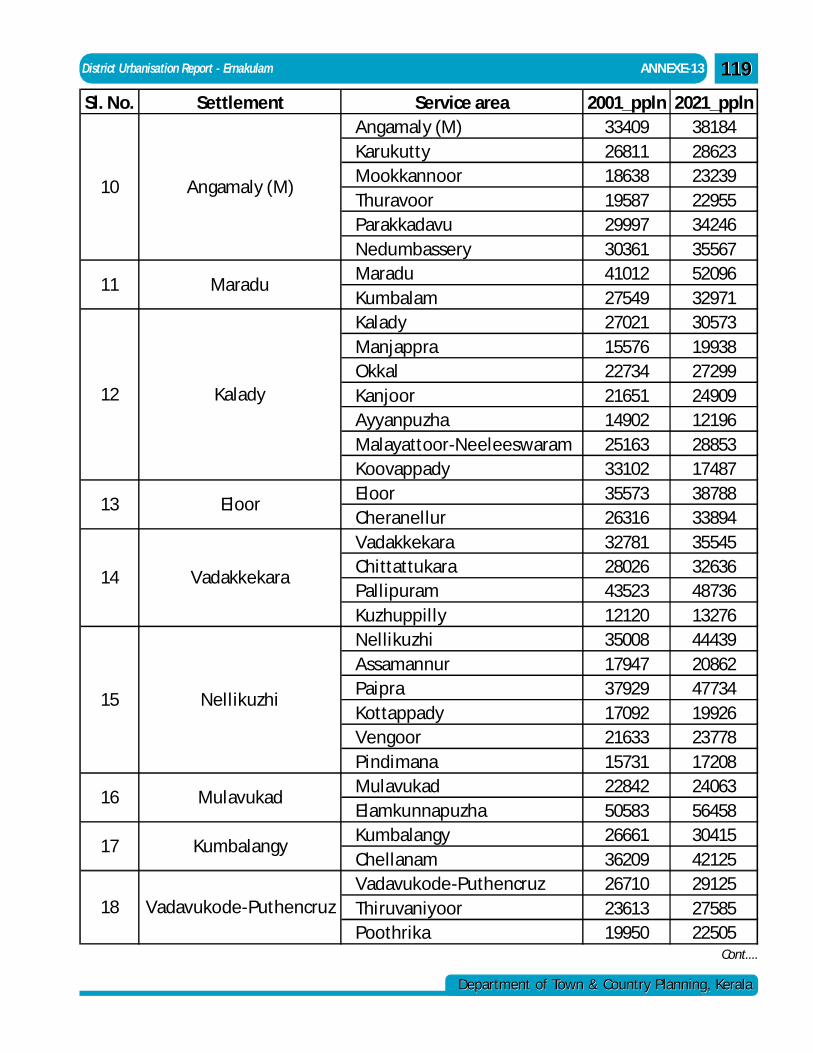
District Urbanisation Report - Ernakulam ANNEXE-13
Department of Town & Country Planning, KeralaDepartment of Town & Country Planning, Kerala
119119
Sl. No. Settlement Service area 2001_ppln 2021_pplnAngamaly (M) 33409 38184Karukutty 26811 28623Mookkannoor 18638 23239Thuravoor 19587 22955Parakkadavu 29997 34246Nedumbassery 30361 35567Maradu 41012 52096Kumbalam 27549 32971Kalady 27021 30573Manjappra 15576 19938Okkal 22734 27299Kanjoor 21651 24909Ayyanpuzha 14902 12196Malayattoor-Neeleeswaram 25163 28853Koovappady 33102 17487Eloor 35573 38788Cheranellur 26316 33894Vadakkekara 32781 35545Chittattukara 28026 32636Pallipuram 43523 48736Kuzhuppilly 12120 13276Nellikuzhi 35008 44439Assamannur 17947 20862Paipra 37929 47734Kottappady 17092 19926Vengoor 21633 23778Pindimana 15731 17208Mulavukad 22842 24063Elamkunnapuzha 50583 56458Kumbalangy 26661 30415Chellanam 36209 42125Vadavukode-Puthencruz 26710 29125Thiruvaniyoor 23613 27585Poothrika 19950 22505
10 Angamaly (M)
11 Maradu
12 Kalady
13 Eloor
14 Vadakkekara
15 Nellikuzhi
16 Mulavukad
17 Kumbalangy
18 Vadavukode-Puthencruz
Cont....
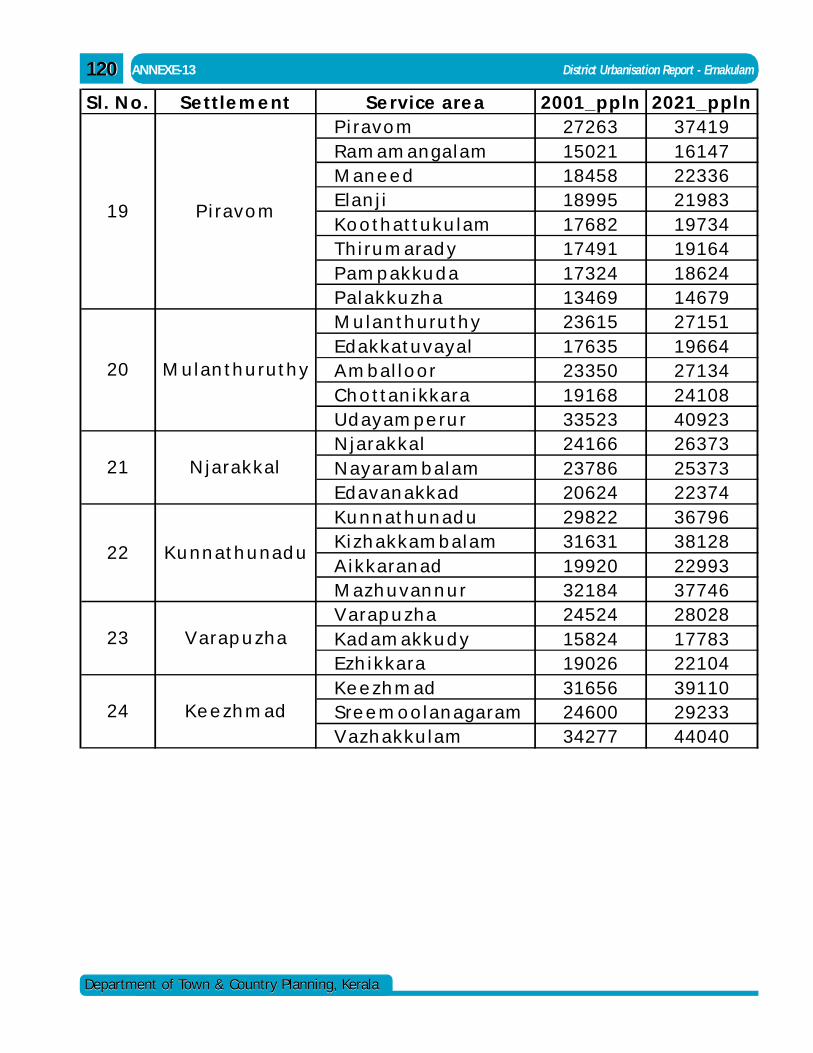
120120
Department of Town & Country Planning, KeralaDepartment of Town & Country Planning, Kerala
ANNEXE-13 District Urbanisation Report - Ernakulam
S l . N o . S e ttle m e n t S e rv ice a re a 2001_p p ln 2021_p p lnP i ra v o m 27263 37419R a m a m a n g a l a m 15021 16147M a n e e d 18458 22336E la n j i 18995 21983K o o th a ttu k u l a m 17682 19734T h i ru m a ra d y 17491 19164P a m p a k k u d a 17324 18624P a l a k k u z h a 13469 14679M u l a n th u ru th y 23615 27151E d a k k a tu v a y a l 17635 19664A m b a l l o o r 23350 27134C h o tta n i k k a ra 19168 24108U d a y a m p e ru r 33523 40923N ja ra k k a l 24166 26373N a y a ra m b a l a m 23786 25373E d a v a n a k k a d 20624 22374K u n n a th u n a d u 29822 36796K i z h a k k a m b a l a m 31631 38128A i k k a ra n a d 19920 22993M a z h u v a n n u r 32184 37746V a ra p u z h a 24524 28028K a d a m a k k u d y 15824 17783E zh i k k a ra 19026 22104K e e z h m a d 31656 39110S re e m o o l a n a g a ra m 24600 29233V a z h a k k u l a m 34277 44040
19 P i ra v o m
20 M u l a n th u ru th y
21 N ja ra k k a l
22 K u n n a th u n a d u
23 V a ra p u z h a
24 K e e z h m a d
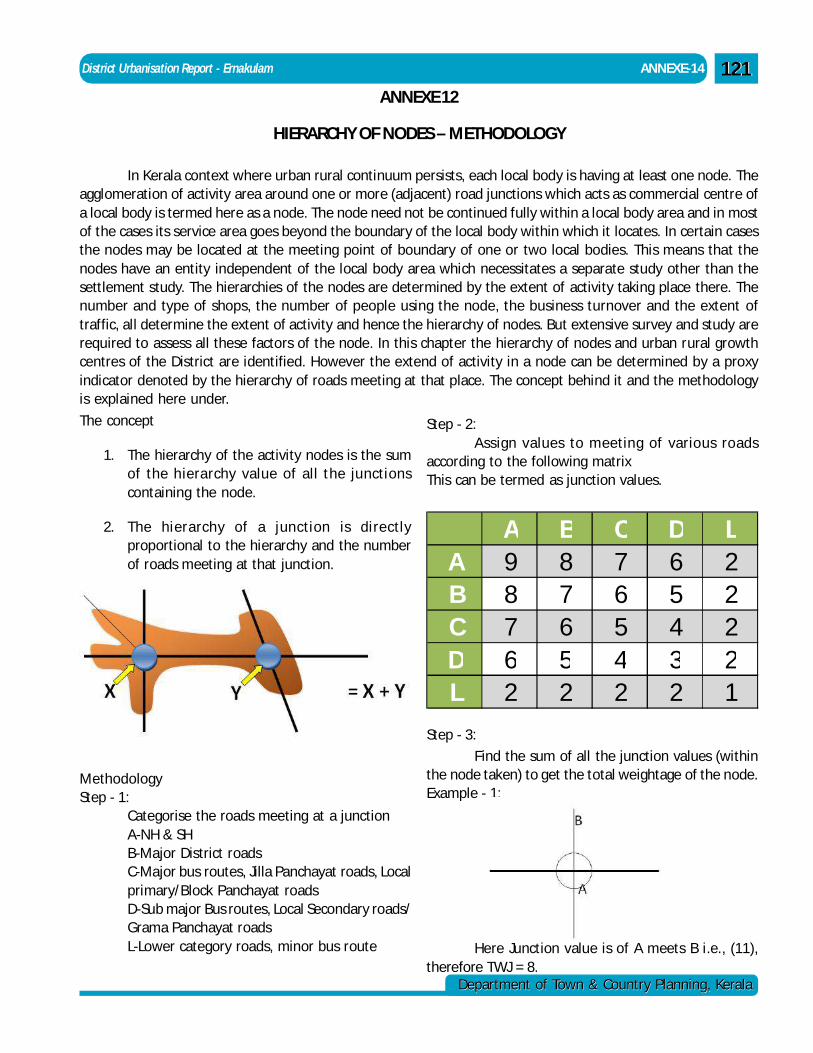
District Urbanisation Report - Ernakulam ANNEXE-14
Department of Town & Country Planning, KeralaDepartment of Town & Country Planning, Kerala
121121ANNEXE 12
HIERARCHY OF NODES – METHODOLOGY
In Kerala context where urban rural continuum persists, each local body is having at least one node. Theagglomeration of activity area around one or more (adjacent) road junctions which acts as commercial centre ofa local body is termed here as a node. The node need not be continued fully within a local body area and in mostof the cases its service area goes beyond the boundary of the local body within which it locates. In certain casesthe nodes may be located at the meeting point of boundary of one or two local bodies. This means that thenodes have an entity independent of the local body area which necessitates a separate study other than thesettlement study. The hierarchies of the nodes are determined by the extent of activity taking place there. Thenumber and type of shops, the number of people using the node, the business turnover and the extent oftraffic, all determine the extent of activity and hence the hierarchy of nodes. But extensive survey and study arerequired to assess all these factors of the node. In this chapter the hierarchy of nodes and urban rural growthcentres of the District are identified. However the extend of activity in a node can be determined by a proxyindicator denoted by the hierarchy of roads meeting at that place. The concept behind it and the methodologyis explained here under.
The concept
1. The hierarchy of the activity nodes is the sumof the hierarchy value of all the junctionscontaining the node.
2. The hierarchy of a junction is directlyproportional to the hierarchy and the numberof roads meeting at that junction.
MethodologyStep - 1:
Categorise the roads meeting at a junctionA-NH & SHB-Major District roadsC-Major bus routes, Jilla Panchayat roads, Localprimary/Block Panchayat roadsD-Sub major Bus routes, Local Secondary roads/Grama Panchayat roadsL-Lower category roads, minor bus route
Step - 2:Assign values to meeting of various roads
according to the following matrixThis can be termed as junction values.
A B C D LA 9 8 7 6 2B 8 7 6 5 2C 7 6 5 4 2D 6 5 4 3 2L 2 2 2 2 1
Step - 3:
Find the sum of all the junction values (withinthe node taken) to get the total weightage of the node.Example - 1:
Here Junction value is of A meets B i.e., (11),therefore TWJ = 8.
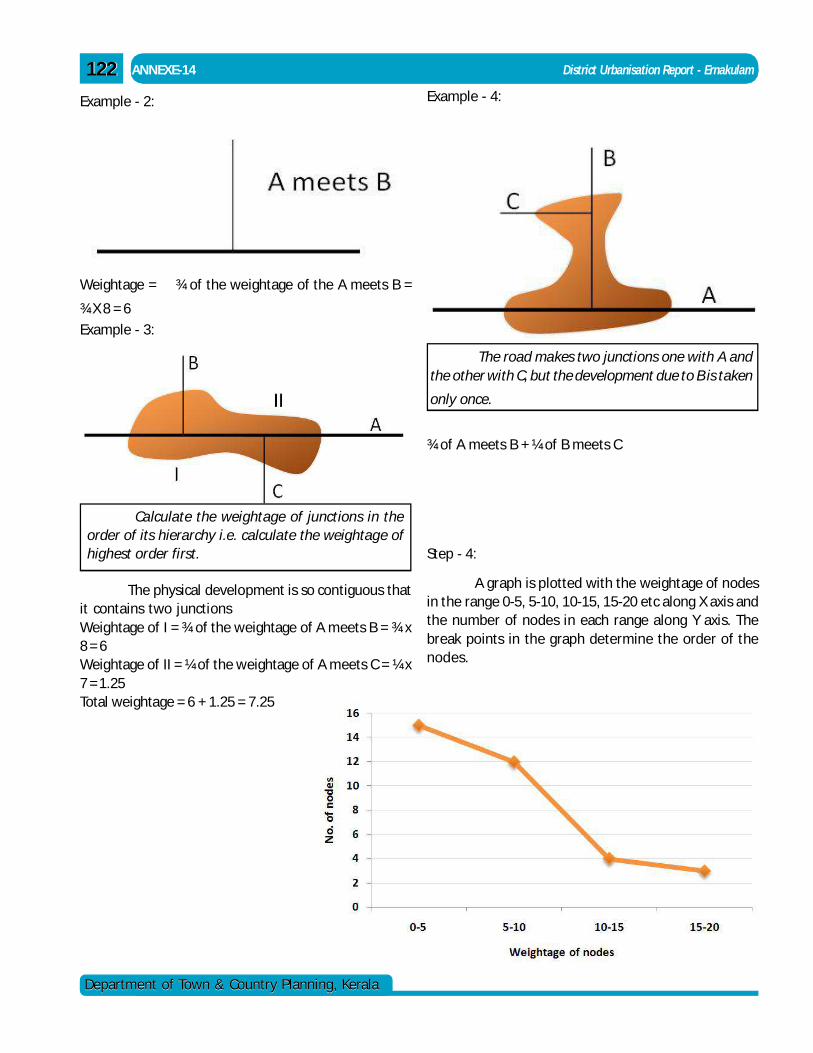
122122
Department of Town & Country Planning, KeralaDepartment of Town & Country Planning, Kerala
ANNEXE-14 District Urbanisation Report - Ernakulam
Example - 2:
Weightage = ¾ of the weightage of the A meets B =
¾ X 8 = 6
Example - 3:
Calculate the weightage of junctions in theorder of its hierarchy i.e. calculate the weightage ofhighest order first.
The physical development is so contiguous thatit contains two junctionsWeightage of I = ¾ of the weightage of A meets B = ¾ x8 = 6Weightage of II = ¼ of the weightage of A meets C = ¼ x7 = 1.25Total weightage = 6 + 1.25 = 7.25
The road makes two junctions one with A andthe other with C, but the development due to B is taken
only once.
Example - 4:
¾ of A meets B + ¼ of B meets C
Step - 4:
A graph is plotted with the weightage of nodesin the range 0-5, 5-10, 10-15, 15-20 etc along X axis andthe number of nodes in each range along Y axis. Thebreak points in the graph determine the order of thenodes.
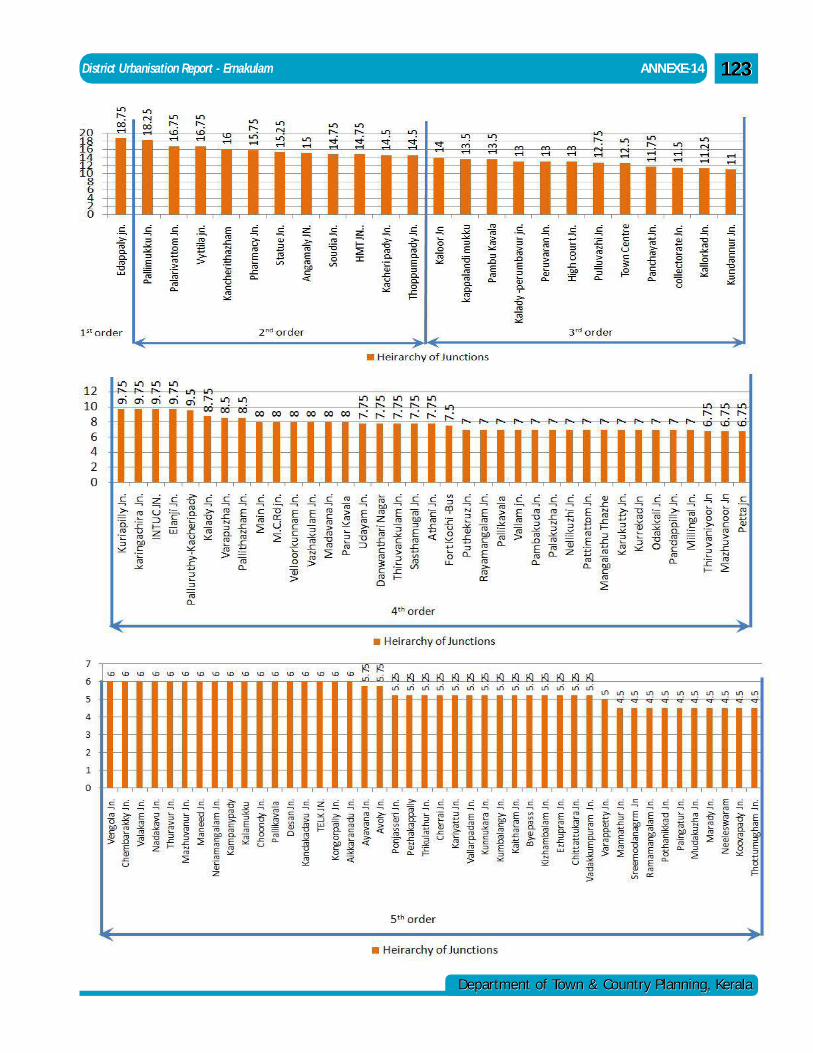
District Urbanisation Report - Ernakulam ANNEXE-14
Department of Town & Country Planning, KeralaDepartment of Town & Country Planning, Kerala
123123
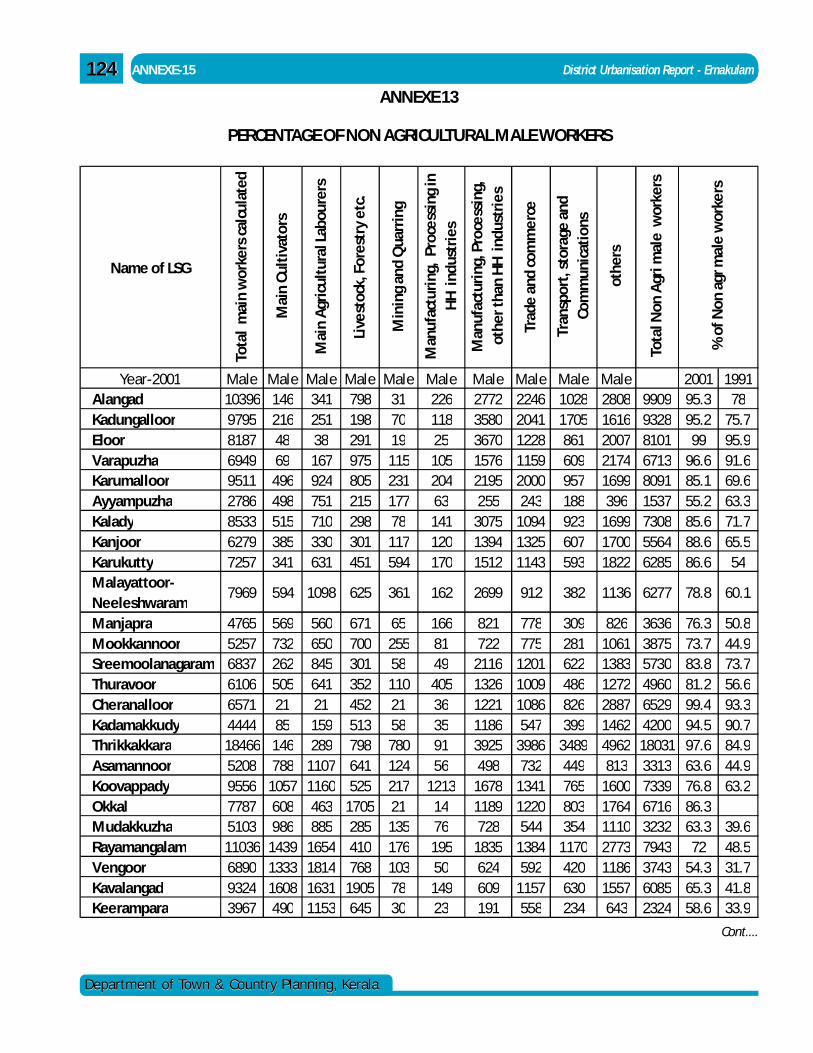
124124
Department of Town & Country Planning, KeralaDepartment of Town & Country Planning, Kerala
ANNEXE-15 District Urbanisation Report - Ernakulam
ANNEXE 13
PERCENTAGE OF NON AGRICULTURAL MALE WORKERS
Name of LSG
Tota
l m
ain
wor
kers
cal
cula
ted
Mai
n Cu
ltiv
ator
s
Mai
n A
gric
ultu
ral L
abou
rers
Live
stoc
k, F
ores
try
etc.
Min
ing
and
Qua
rrin
g
Man
ufac
turi
ng,
Proc
essi
ng in
H
H i
ndus
trie
s
Man
ufac
turi
ng, P
roce
ssin
g,
othe
r tha
n H
H i
ndus
trie
s
Trad
e an
d co
mm
erce
Tran
spor
t, s
tora
ge a
nd
Com
mun
icat
ions
othe
rs
Tota
l Non
Agr
i mal
e w
orke
rs
Year-2001 Male Male Male Male Male Male Male Male Male Male 2001 1991Alangad 10396 146 341 798 31 226 2772 2246 1028 2808 9909 95.3 78Kadungalloor 9795 216 251 198 70 118 3580 2041 1705 1616 9328 95.2 75.7Eloor 8187 48 38 291 19 25 3670 1228 861 2007 8101 99 95.9Varapuzha 6949 69 167 975 115 105 1576 1159 609 2174 6713 96.6 91.6Karumalloor 9511 496 924 805 231 204 2195 2000 957 1699 8091 85.1 69.6Ayyampuzha 2786 498 751 215 177 63 255 243 188 396 1537 55.2 63.3Kalady 8533 515 710 298 78 141 3075 1094 923 1699 7308 85.6 71.7Kanjoor 6279 385 330 301 117 120 1394 1325 607 1700 5564 88.6 65.5Karukutty 7257 341 631 451 594 170 1512 1143 593 1822 6285 86.6 54Malayattoor-Neeleshwaram
7969 594 1098 625 361 162 2699 912 382 1136 6277 78.8 60.1
Manjapra 4765 569 560 671 65 166 821 778 309 826 3636 76.3 50.8Mookkannoor 5257 732 650 700 255 81 722 775 281 1061 3875 73.7 44.9Sreemoolanagaram 6837 262 845 301 58 49 2116 1201 622 1383 5730 83.8 73.7Thuravoor 6106 505 641 352 110 405 1326 1009 486 1272 4960 81.2 56.6Cheranalloor 6571 21 21 452 21 36 1221 1086 826 2887 6529 99.4 93.3Kadamakkudy 4444 85 159 513 58 35 1186 547 399 1462 4200 94.5 90.7Thrikkakkara 18466 146 289 798 780 91 3925 3986 3489 4962 18031 97.6 84.9Asamannoor 5208 788 1107 641 124 56 498 732 449 813 3313 63.6 44.9Koovappady 9556 1057 1160 525 217 1213 1678 1341 765 1600 7339 76.8 63.2Okkal 7787 608 463 1705 21 14 1189 1220 803 1764 6716 86.3Mudakkuzha 5103 986 885 285 135 76 728 544 354 1110 3232 63.3 39.6Rayamangalam 11036 1439 1654 410 176 195 1835 1384 1170 2773 7943 72 48.5Vengoor 6890 1333 1814 768 103 50 624 592 420 1186 3743 54.3 31.7Kavalangad 9324 1608 1631 1905 78 149 609 1157 630 1557 6085 65.3 41.8Keerampara 3967 490 1153 645 30 23 191 558 234 643 2324 58.6 33.9
% o
f Non
agr
mal
e w
orke
rs
Cont....
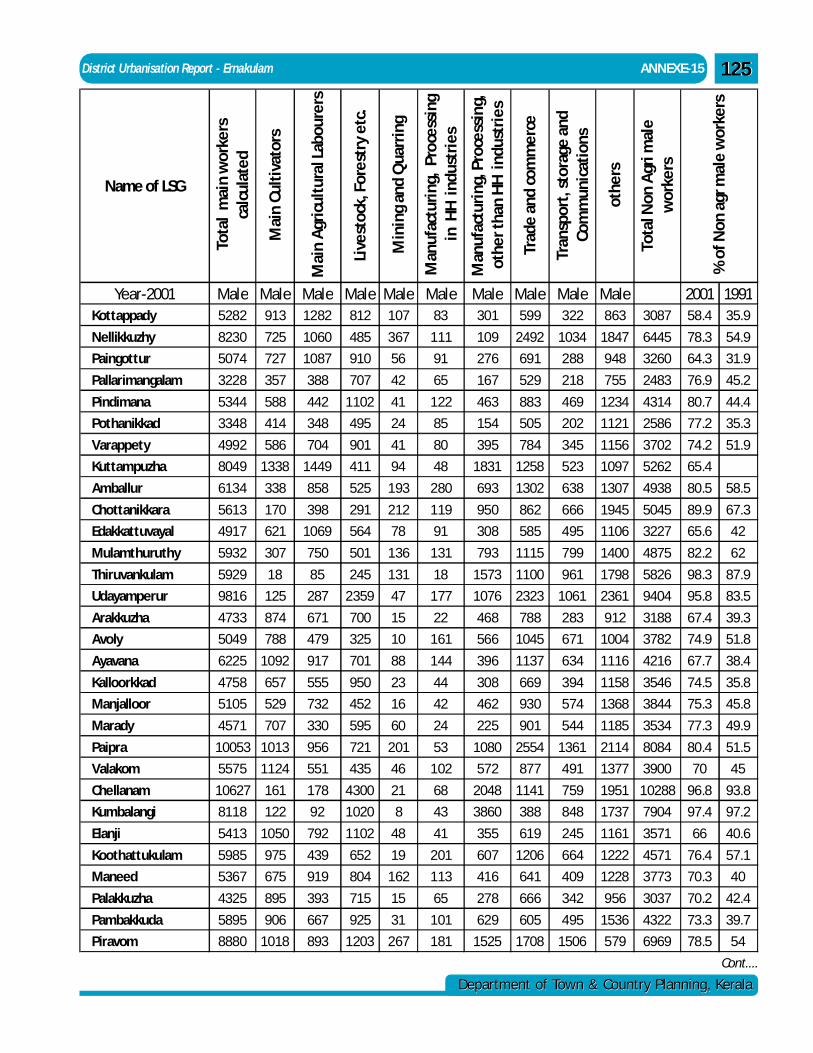
District Urbanisation Report - Ernakulam ANNEXE-15
Department of Town & Country Planning, KeralaDepartment of Town & Country Planning, Kerala
125125
Name of LSG
Tota
l m
ain
wor
kers
ca
lcul
ated
Mai
n Cu
ltiv
ator
s
Mai
n A
gric
ultu
ral L
abou
rers
Live
stoc
k, F
ores
try
etc.
Min
ing
and
Qua
rrin
g
Man
ufac
turi
ng,
Proc
essi
ng
in H
H i
ndus
trie
s
Man
ufac
turi
ng, P
roce
ssin
g,
othe
r tha
n H
H i
ndus
trie
s
Trad
e an
d co
mm
erce
Tran
spor
t, s
tora
ge a
nd
Com
mun
icat
ions
othe
rs
Tota
l Non
Agr
i mal
e
wor
kers
Year-2001 Male Male Male Male Male Male Male Male Male Male 2001 1991Kottappady 5282 913 1282 812 107 83 301 599 322 863 3087 58.4 35.9
Nellikkuzhy 8230 725 1060 485 367 111 109 2492 1034 1847 6445 78.3 54.9
Paingottur 5074 727 1087 910 56 91 276 691 288 948 3260 64.3 31.9
Pallarimangalam 3228 357 388 707 42 65 167 529 218 755 2483 76.9 45.2
Pindimana 5344 588 442 1102 41 122 463 883 469 1234 4314 80.7 44.4
Pothanikkad 3348 414 348 495 24 85 154 505 202 1121 2586 77.2 35.3
Varappety 4992 586 704 901 41 80 395 784 345 1156 3702 74.2 51.9
Kuttampuzha 8049 1338 1449 411 94 48 1831 1258 523 1097 5262 65.4
Amballur 6134 338 858 525 193 280 693 1302 638 1307 4938 80.5 58.5
Chottanikkara 5613 170 398 291 212 119 950 862 666 1945 5045 89.9 67.3
Edakkattuvayal 4917 621 1069 564 78 91 308 585 495 1106 3227 65.6 42
Mulamthuruthy 5932 307 750 501 136 131 793 1115 799 1400 4875 82.2 62
Thiruvankulam 5929 18 85 245 131 18 1573 1100 961 1798 5826 98.3 87.9
Udayamperur 9816 125 287 2359 47 177 1076 2323 1061 2361 9404 95.8 83.5
Arakkuzha 4733 874 671 700 15 22 468 788 283 912 3188 67.4 39.3
Avoly 5049 788 479 325 10 161 566 1045 671 1004 3782 74.9 51.8
Ayavana 6225 1092 917 701 88 144 396 1137 634 1116 4216 67.7 38.4
Kalloorkkad 4758 657 555 950 23 44 308 669 394 1158 3546 74.5 35.8
Manjalloor 5105 529 732 452 16 42 462 930 574 1368 3844 75.3 45.8
Marady 4571 707 330 595 60 24 225 901 544 1185 3534 77.3 49.9
Paipra 10053 1013 956 721 201 53 1080 2554 1361 2114 8084 80.4 51.5
Valakom 5575 1124 551 435 46 102 572 877 491 1377 3900 70 45
Chellanam 10627 161 178 4300 21 68 2048 1141 759 1951 10288 96.8 93.8
Kumbalangi 8118 122 92 1020 8 43 3860 388 848 1737 7904 97.4 97.2
Elanji 5413 1050 792 1102 48 41 355 619 245 1161 3571 66 40.6
Koothattukulam 5985 975 439 652 19 201 607 1206 664 1222 4571 76.4 57.1
Maneed 5367 675 919 804 162 113 416 641 409 1228 3773 70.3 40
Palakkuzha 4325 895 393 715 15 65 278 666 342 956 3037 70.2 42.4
Pambakkuda 5895 906 667 925 31 101 629 605 495 1536 4322 73.3 39.7
Piravom 8880 1018 893 1203 267 181 1525 1708 1506 579 6969 78.5 54
% o
f Non
agr
mal
e w
orke
rs
Cont....
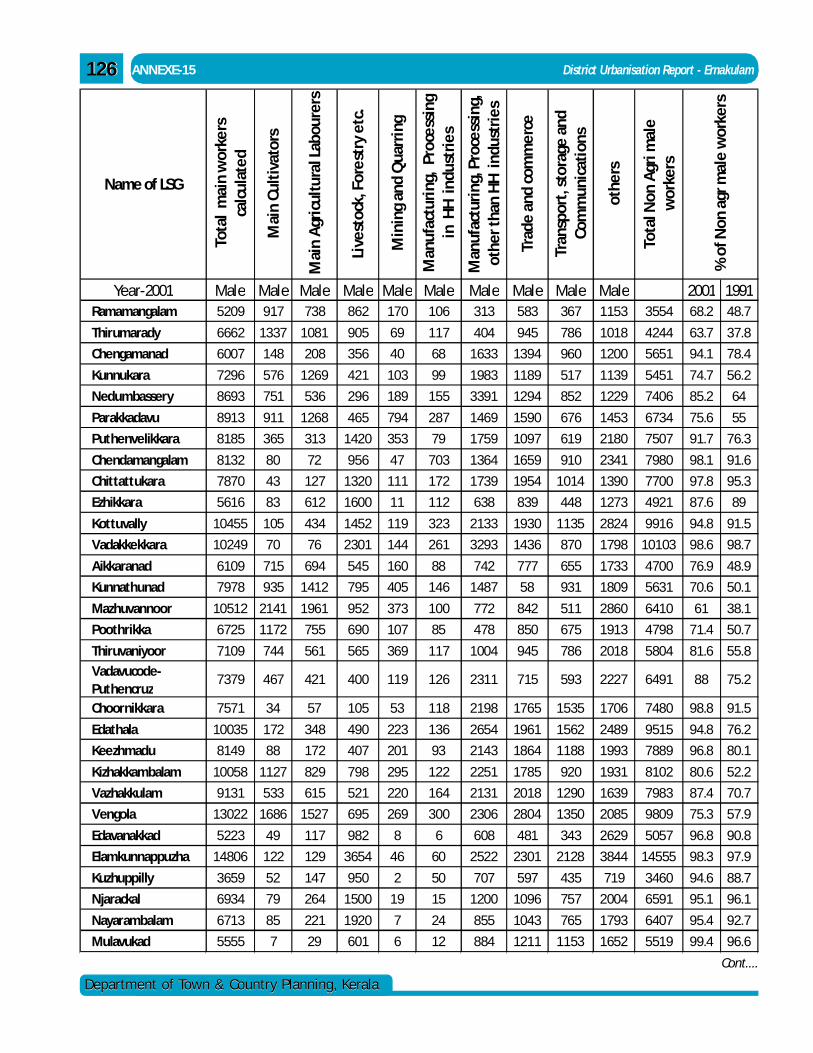
126126
Department of Town & Country Planning, KeralaDepartment of Town & Country Planning, Kerala
ANNEXE-15 District Urbanisation Report - Ernakulam
Name of LSG
Tota
l m
ain
wor
kers
ca
lcul
ated
Mai
n Cu
ltiv
ator
s
Mai
n A
gric
ultu
ral L
abou
rers
Live
stoc
k, F
ores
try
etc.
Min
ing
and
Qua
rrin
g
Man
ufac
turi
ng,
Proc
essi
ng
in H
H i
ndus
trie
s
Man
ufac
turi
ng, P
roce
ssin
g,
othe
r tha
n H
H i
ndus
trie
s
Trad
e an
d co
mm
erce
Tran
spor
t, s
tora
ge a
nd
Com
mun
icat
ions
othe
rs
Tota
l Non
Agr
i mal
e
wor
kers
Year-2001 Male Male Male Male Male Male Male Male Male Male 2001 1991Ramamangalam 5209 917 738 862 170 106 313 583 367 1153 3554 68.2 48.7
Thirumarady 6662 1337 1081 905 69 117 404 945 786 1018 4244 63.7 37.8
Chengamanad 6007 148 208 356 40 68 1633 1394 960 1200 5651 94.1 78.4
Kunnukara 7296 576 1269 421 103 99 1983 1189 517 1139 5451 74.7 56.2
Nedumbassery 8693 751 536 296 189 155 3391 1294 852 1229 7406 85.2 64
Parakkadavu 8913 911 1268 465 794 287 1469 1590 676 1453 6734 75.6 55
Puthenvelikkara 8185 365 313 1420 353 79 1759 1097 619 2180 7507 91.7 76.3
Chendamangalam 8132 80 72 956 47 703 1364 1659 910 2341 7980 98.1 91.6
Chittattukara 7870 43 127 1320 111 172 1739 1954 1014 1390 7700 97.8 95.3
Ezhikkara 5616 83 612 1600 11 112 638 839 448 1273 4921 87.6 89
Kottuvally 10455 105 434 1452 119 323 2133 1930 1135 2824 9916 94.8 91.5
Vadakkekkara 10249 70 76 2301 144 261 3293 1436 870 1798 10103 98.6 98.7
Aikkaranad 6109 715 694 545 160 88 742 777 655 1733 4700 76.9 48.9
Kunnathunad 7978 935 1412 795 405 146 1487 58 931 1809 5631 70.6 50.1
Mazhuvannoor 10512 2141 1961 952 373 100 772 842 511 2860 6410 61 38.1
Poothrikka 6725 1172 755 690 107 85 478 850 675 1913 4798 71.4 50.7
Thiruvaniyoor 7109 744 561 565 369 117 1004 945 786 2018 5804 81.6 55.8
Vadavucode-Puthencruz
7379 467 421 400 119 126 2311 715 593 2227 6491 88 75.2
Choornikkara 7571 34 57 105 53 118 2198 1765 1535 1706 7480 98.8 91.5
Edathala 10035 172 348 490 223 136 2654 1961 1562 2489 9515 94.8 76.2
Keezhmadu 8149 88 172 407 201 93 2143 1864 1188 1993 7889 96.8 80.1
Kizhakkambalam 10058 1127 829 798 295 122 2251 1785 920 1931 8102 80.6 52.2
Vazhakkulam 9131 533 615 521 220 164 2131 2018 1290 1639 7983 87.4 70.7
Vengola 13022 1686 1527 695 269 300 2306 2804 1350 2085 9809 75.3 57.9
Edavanakkad 5223 49 117 982 8 6 608 481 343 2629 5057 96.8 90.8
Elamkunnappuzha 14806 122 129 3654 46 60 2522 2301 2128 3844 14555 98.3 97.9
Kuzhuppilly 3659 52 147 950 2 50 707 597 435 719 3460 94.6 88.7
Njarackal 6934 79 264 1500 19 15 1200 1096 757 2004 6591 95.1 96.1
Nayarambalam 6713 85 221 1920 7 24 855 1043 765 1793 6407 95.4 92.7
Mulavukad 5555 7 29 601 6 12 884 1211 1153 1652 5519 99.4 96.6
% o
f Non
agr
mal
e w
orke
rs
Cont....
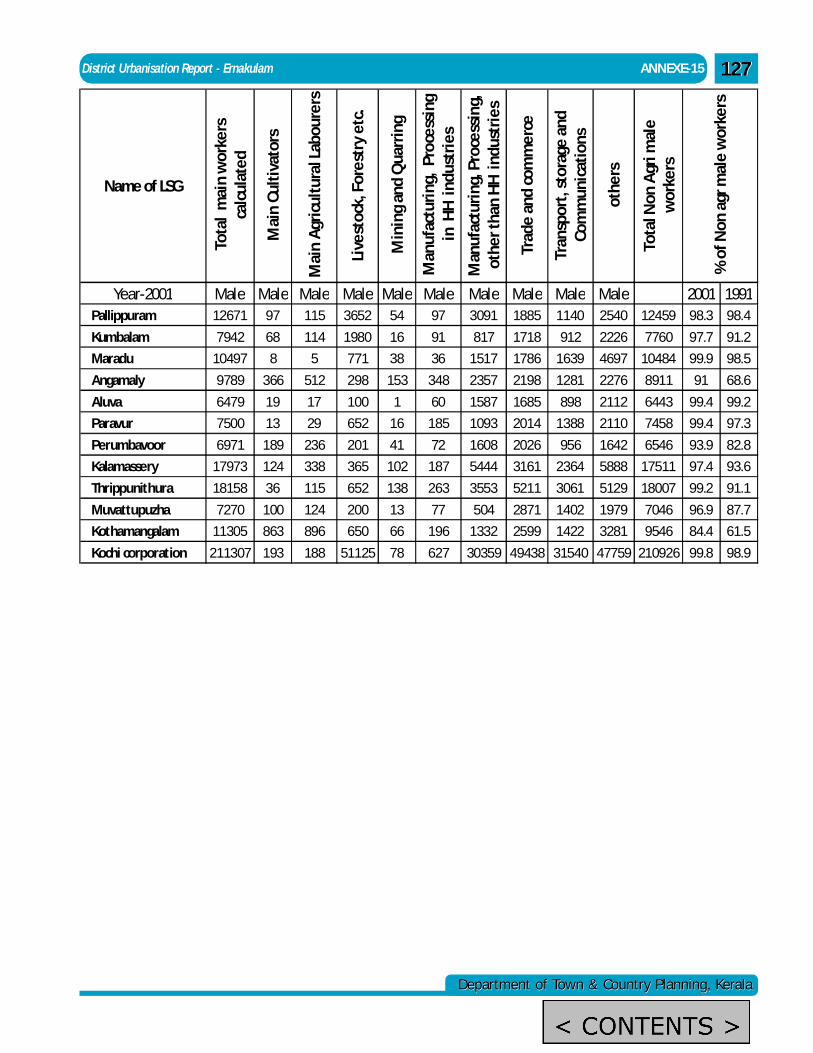
District Urbanisation Report - Ernakulam ANNEXE-15
Department of Town & Country Planning, KeralaDepartment of Town & Country Planning, Kerala
127127
Name of LSG
Tota
l m
ain
wor
kers
ca
lcul
ated
Mai
n Cu
ltiv
ator
s
Mai
n A
gric
ultu
ral L
abou
rers
Live
stoc
k, F
ores
try
etc.
Min
ing
and
Qua
rrin
g
Man
ufac
turi
ng,
Proc
essi
ng
in H
H i
ndus
trie
s
Man
ufac
turi
ng, P
roce
ssin
g,
othe
r tha
n H
H i
ndus
trie
s
Trad
e an
d co
mm
erce
Tran
spor
t, s
tora
ge a
nd
Com
mun
icat
ions
othe
rs
Tota
l Non
Agr
i mal
e
wor
kers
Year-2001 Male Male Male Male Male Male Male Male Male Male 2001 1991Pallippuram 12671 97 115 3652 54 97 3091 1885 1140 2540 12459 98.3 98.4
Kumbalam 7942 68 114 1980 16 91 817 1718 912 2226 7760 97.7 91.2
Maradu 10497 8 5 771 38 36 1517 1786 1639 4697 10484 99.9 98.5
Angamaly 9789 366 512 298 153 348 2357 2198 1281 2276 8911 91 68.6
Aluva 6479 19 17 100 1 60 1587 1685 898 2112 6443 99.4 99.2
Paravur 7500 13 29 652 16 185 1093 2014 1388 2110 7458 99.4 97.3
Perumbavoor 6971 189 236 201 41 72 1608 2026 956 1642 6546 93.9 82.8
Kalamassery 17973 124 338 365 102 187 5444 3161 2364 5888 17511 97.4 93.6
Thrippunithura 18158 36 115 652 138 263 3553 5211 3061 5129 18007 99.2 91.1
Muvattupuzha 7270 100 124 200 13 77 504 2871 1402 1979 7046 96.9 87.7
Kothamangalam 11305 863 896 650 66 196 1332 2599 1422 3281 9546 84.4 61.5
Kochi corporation 211307 193 188 51125 78 627 30359 49438 31540 47759 210926 99.8 98.9
% o
f Non
agr
mal
e w
orke
rs