Embed Size (px)
Citation preview
SOUTH ASIAN ASSOCIATION FOR REGIONAL COOPERATION
STUDY ON
Prefeasibility Study for Setting Up SAARC Regional/Sub Regional Coal Power Plant
Final Report
SAARC ENERGY CENTRE
ISLAMABAD
2013
Prefeasibility Study for Setting Up SAARC Regional/Sub Regional Coal Power Plant
I
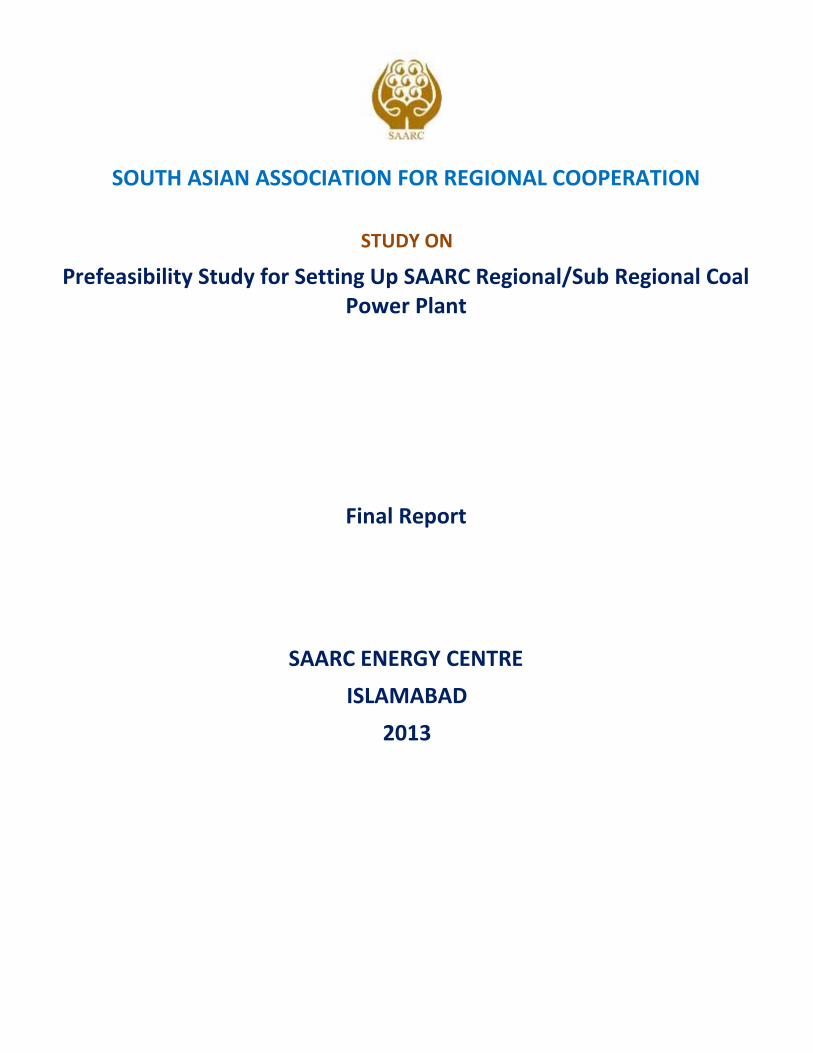
Table of Contents List of Abbreviations ......................................................................................................................... II
List of Figures ................................................................................................................................... III
List of Tables .................................................................................................................................... IV
1. Executive Summary ....................................................................................................................1
2. Market .......................................................................................................................................7
2.1. Energy situation in South Asia ..................................................................................................7
2.2. Pakistan’s Energy Sector ..........................................................................................................7
2.3. Coal and Power Sector in India ............................................................................................... 13
2.4. Bangladesh Power Sector Review ........................................................................................... 25
3. Project Location and Logistics ................................................................................................... 33
4. Plant & Mine Technology .......................................................................................................... 44
5. Project Economics and Commercial ........................................................................................... 58
5.1. Project Economics .................................................................................................................. 58
5.2. Implementation Issues ........................................................................................................... 68
6. Environmental Issues ................................................................................................................ 74
7. Conclusions and Recommendations .......................................................................................... 81
Appendices ...................................................................................................................................... 84
Appendix-I: .................................................................................................................................. 84
Appendix-II .................................................................................................................................. 93
Appendix – III ............................................................................................................................. 112
Appendix – IV: ............................................................................................................................ 119
Appendix – V .............................................................................................................................. 125
References ..................................................................................................................................... 132
TERMS OF REFERENCE (TOR) .......................................................................................................... 133
Prefeasibility Study for Setting Up SAARC Regional/Sub Regional Coal Power Plant
II
List of Abbreviations AEDB = Alternate Energy Development Board BCF = Billion Cubic Feet BPDB = Bangladesh Power Development Board COGE = Cost of Generating Electricity CPPA = Central Power Purchase Authority DISCOs = Distribution Companies GENCOs = Generating Companies GJ = Giga Joule GW = Giga watt = 1billion watt = 1000MW GWh = Giga watt hour = 1000 MWh IAEA = International Atomic Energy Agency IEA = International Energy Agency IRR = Internal Rate of Return LCOE = Levelised Cost of Electricity LESCO = Lahore Electric Company LNG = Liquefied Natural Gas LPG = Liquid Petroleum Gas MCF = Thousand cubic feet MMBtu = Million British Thermal Unit MTOE = Million Tons of Oil Equivalent Mtpa = million tons per annum Mtpd = million tons per day MW = 1 million watt = 1000kw MWh = Mega watt hours = 1000 kwh NEPRA = National Electric Power Regulatory Authority (Pakistan) NTDC = National Transmission & Dispatch Company (Pakistan) p.a. = per annum (year) PEPCO = Pakistan Electric Power Company PPIB = Private Power & Infrastructure Board (Pakistan) ROA = Return on Assets ROE = Return on Equity TCF = Trillion Cubic Feet TOE = Tons of Oil Equipment WAPDA = Water & Power Development Authority (Pakistan) CEA = Central Electric Authority (India) TCEB = Thar Coal Energy Board SCA = Sindh Coal Authority
Prefeasibility Study for Setting Up SAARC Regional/Sub Regional Coal Power Plant
III
List of Figures Fig 2.2.1: Power Demand and Supply _Pakistan .......................................................................................................... 8
Fig 2.2.2: Maximum Power Demand ............................................................................................................................ 8
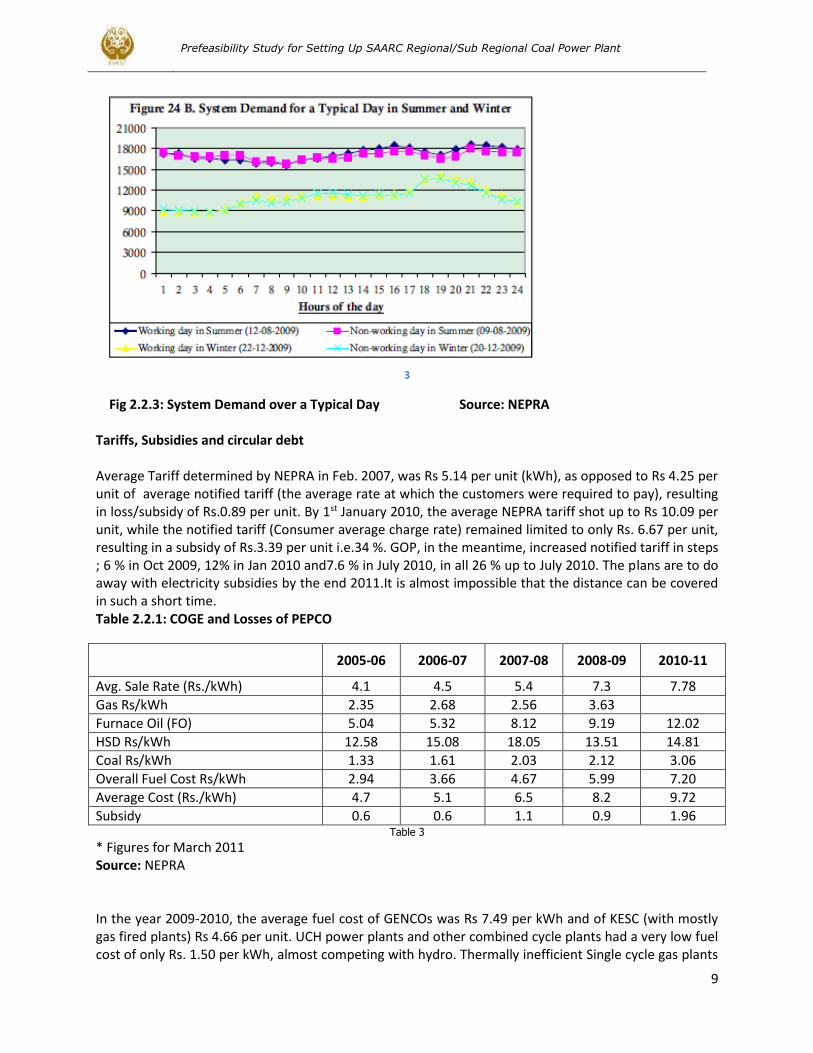
Fig 2.2.3: System Demand over a Typical Day ............................................................................................................. 9
Fig 2.3.1: Coal deposits in India ............................................................................................................................ 15
Fig 2.3.2: Lignite Resources in India ........................................................................................................................... 16
Fig 2.3.3: Coal Production Trend in India ................................................................................................................... 16
Fig 2.3.4: Lignite Production Trend, India .................................................................................................................. 17
Fig 2.3.5: Coal Trade Trend India ................................................................................................................................ 17
Fig 2.3.6: Power sector organization India ................................................................................................................. 23
Fig 2.3.7.Power Transmission Grid India .................................................................................................................... 24
Fig 2.4.1: Phulbari Coal Location Bangladesh ........................................................................................................... 29
Fig 2.4.2: Power Sector Organization Bangladesh (Courtesy BPDB) ......................................................................... 31
Fig 2.4.3: Power Transmission Grid Bangladesh ........................................................................................................ 32
Fig 3.1: Project Location between Goth Soomro (Pakistan) and Satrau/Barmer (India) ......................................... 34
Fig 3.2: Phulbari Coal Location in Bangladesh and proximity to potential Power Plant Sites in India .................... 35
Fig 3.3: A Coal Train in the U.S................................................................................................................................... 36
Fig 3.4: Trend of Coal Rail Transport rates in the U.S. ............................................................................................... 37
Fig 3.5: A bucket wheel-type combination stacker/reclaimer at work at the Port of Koper, Slovenia. ................... 42
Fig 3.6: This traveling, luffing, and slewing stacker at the Callide Coal Mine in Australia has a maximum
throughput of 2,100 tons per hour ............................................................................................................................. 43
Fig 3.7: The portal scraper at Callide, shown during its erection. The boom is 135 feet long and can reclaim coal
at the rate of 1,800 tons per hour .............................................................................................................................. 43
Fig 4.1: Input Output Diagram .................................................................................................................................... 44
Fig 4.2: A typical Coal Power Plant Process Diagram ................................................................................................ 45
Fig 4.3: Schematic Layout PCFB Coal Power Plant ..................................................................................................... 48
Fig 4.4: Large Scale CFB Combustion demo ................................................................................................................ 48
Fig 4.5: Mechanism of Coal Combustion .................................................................................................................... 49
Fig 4.6: Surface mining................................................................................................................................................ 53
Fig: 4.7. A Schematic of an open cast coal mine ........................................................................................................ 53
Fig 4.8: A Lignite mine in South Dakota in USA ......................................................................................................... 54
Fig 4.9: Behemoth Coal Wheel Excavator being transported on its own wheels, RWE Germany ............................ 55
Fig 4.10: Some typical Layouts for Coal Power Plants ............................................................................................... 56
Fig 4.11: Some typical Layouts for Coal Power Plants ............................................................................................... 57
Fig 5.2.1: Interconnection between India and Bangladesh Power grids ................................................................... 70
Fig 5.2.2: Conceptual Diagram SAARC Power Grid .................................................................................................... 71
Fig 5.2.3: Project Structure and Flows ....................................................................................................................... 73
Fig 6.1: A FGD Schematic ............................................................................................................................................ 77
Fig A2.1: Broader Regional Map ................................................................................................................................ 95
Fig A2.2: Location Map Thar Coal Field ...................................................................................................................... 95
Fig A2.3: Mine Cross Section (Courtesy Engro Presentation)................................................................................... 101
Fig A2.4: Generalized Cross Section through Thar Lignite Blocks I, II, III and IV ..................................................... 101
Fig A2.5: Phulbari Regional Map(courtesy:www.phulbaricoal.com) ..................................................................... 111
Fig A3.1: District Map of Rajasthan, India ............................................................................................................... 112
Fig A3.2: Gujarat District Map (Courtesy Info base) ................................................................................................ 118
Prefeasibility Study for Setting Up SAARC Regional/Sub Regional Coal Power Plant
IV
Fig A3.3: Dashkin Dinajpur District in India showing Hilli and Kumarganj (potential Sites for Coal Power plant)
adjoining Phulbari Coal ............................................................................................................................................. 119
Fig A4.1: Dust suppression on haul roads by water spraying from Water Lorries .................................................. 122
List of Tables
Table 2.1.1: Electricity net installed generating capacities for 2010 (000 kw) ........................................................... 7
Table 2.1.2: Production of electricity by-type for 2010 (Million kwh) ..................................................................... 7
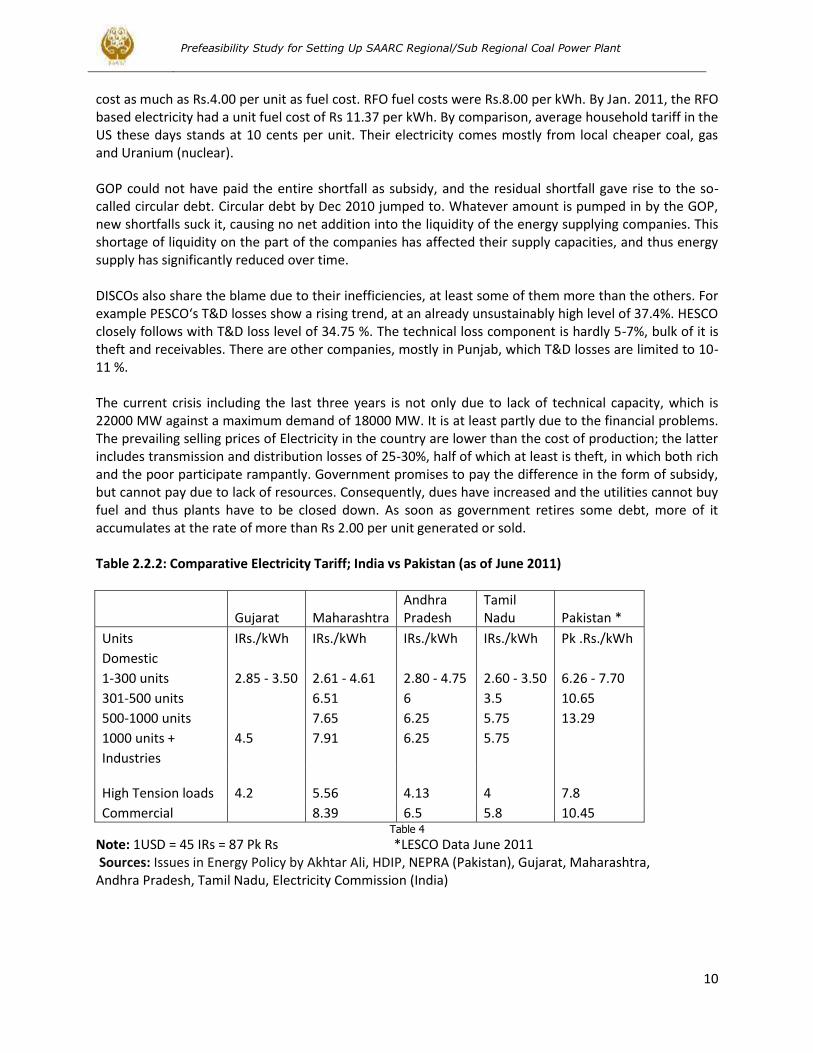
Table 2.2.1: COGE and Losses of PEPCO ................................................................................................................. 9
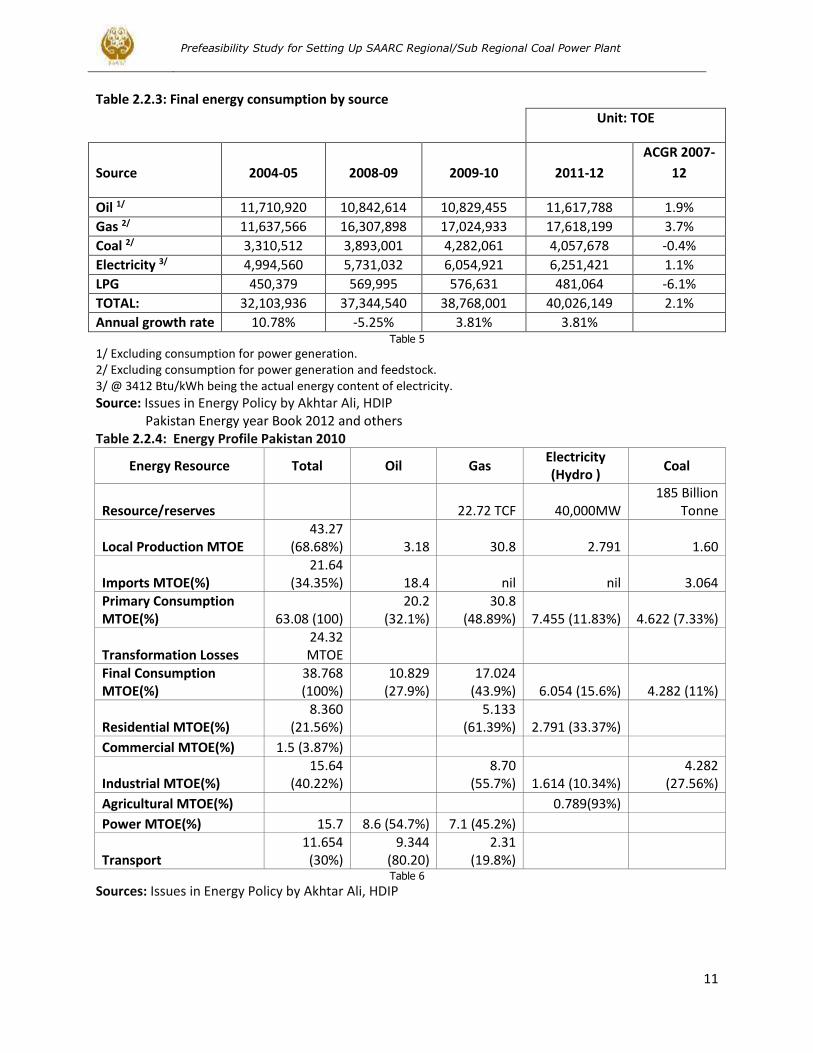
Table 2.2.2: Comparative Electricity Tariff; India vs Pakistan (as of June 2011) ...................................................... 10
Table 2.2.3: Final energy consumption by source ...................................................................................................... 11
Table 2.2.4: Energy Profile Pakistan 2010 ................................................................................................................. 11
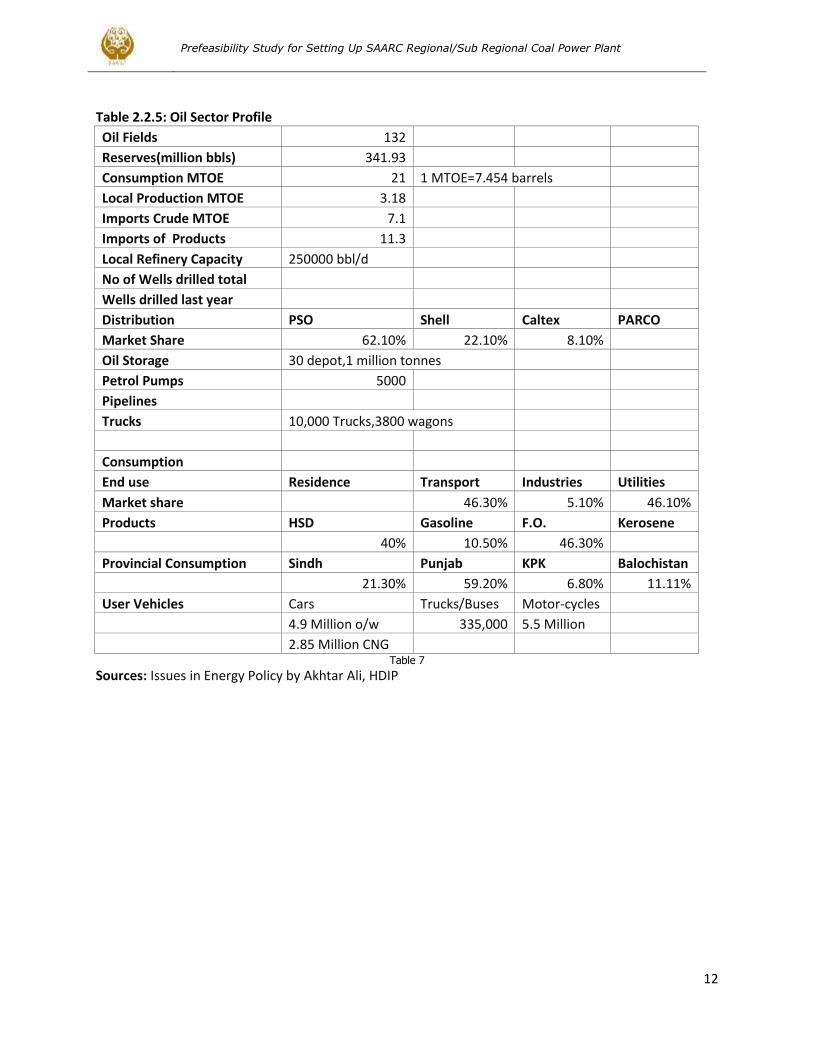
Table 2.2.5: Oil Sector Profil ....................................................................................................................................... 12
Table 2.2.6: Natural Gas Sector Profile ...................................................................................................................... 13
Table: 2.3.1: Power Generation Capacity India (2012) .............................................................................................. 14
Table: 2.3.2: India Power Supply Position .................................................................................................................. 14
Table 2.3.3: Trends of production of Coal and Lignite during last ten years (in Million Tonnes) ............................. 18
Table 2.3.4: Share of Lignite production by states in last ten years (in Million Tonnes) ......................................... 18
Table 2.3.5: Specifications of Lignite India (Rajhastan-Gujarat) ............................................................................... 19
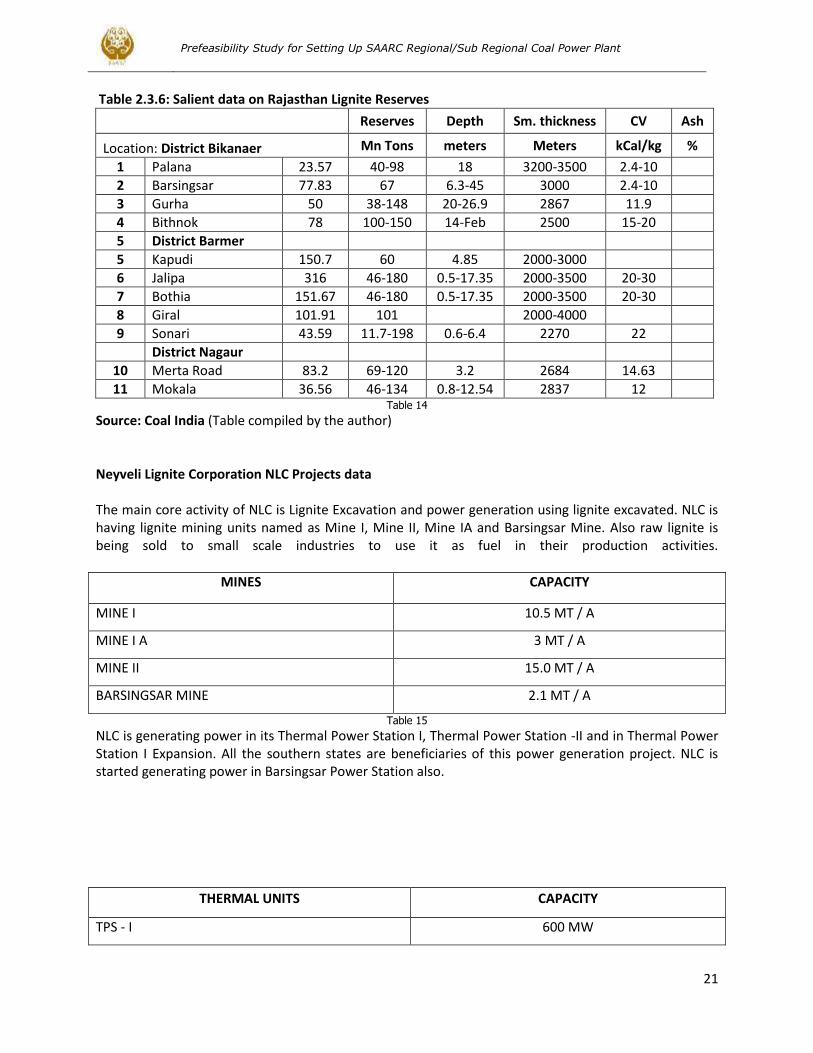
Table 2.3.6: Salient data on Rajasthan Lignite Reserves ........................................................................................... 21
Table 2.4.1: Present Generation Capacity in Bangladesh (MW) 2012 ...................................................................... 25
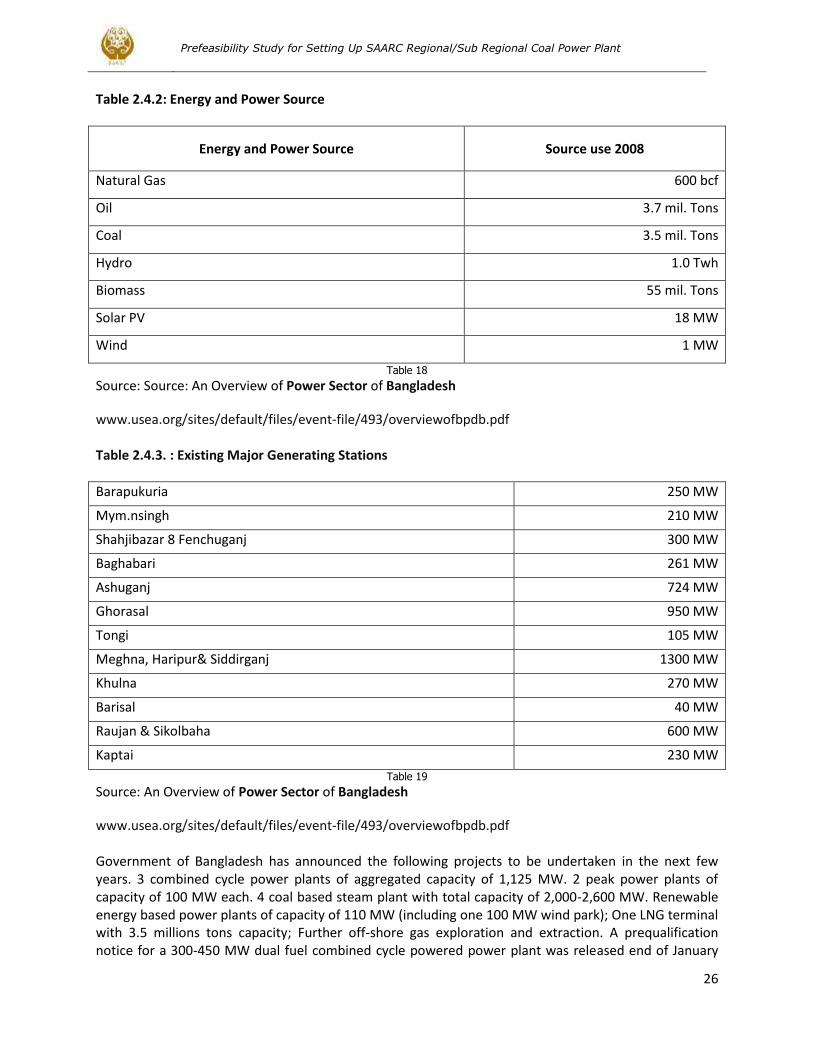
Table 2.4.2: Energy and Power Source ....................................................................................................................... 26
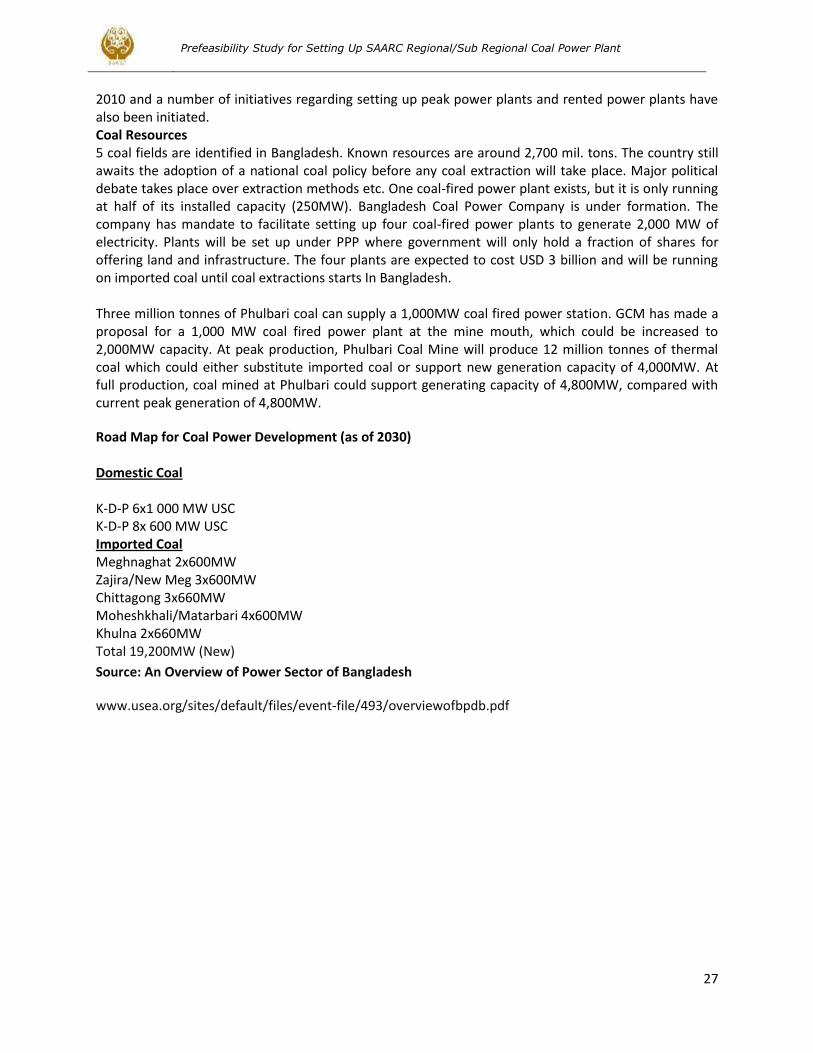
Table 2.4.3. : Existing Major Generating Stations ..................................................................................................... 26
Table 2.4.4: Estimated Demand Supply Gap up to 2015 (Fiscal Year) ....................................................................... 28
Table 2.4.5: Probable Power Generation: Primary Fuel Sources by 2030 ................................................................ 28
Table 3.1: Coal Transportation Infrastructure Estimations ....................................................................................... 38
Table 4.1: List of CFBC Technology suppliers worldwid ............................................................................................. 51
Table 5.1.1: Estimated CAPEX for the pro proposed Project ..................................................................................... 59
Table 5.1.2: Estimated CAPEX and COGE for Power Plant 1000 MW ........................................................................ 60
Table 5.1.3: Cost Estimates Coal Power Plants various capacities based on CERC India guidelines ........................ 61
Table 5.1.4: Power Plant Hard Cost Break down into Work Packages ...................................................................... 62
Table 5.1.5: Salient data on Raj West Power RWPL (2007-13) Rajasthan ................................................................ 63
Table 5.1.6: Average Sales Rate Coal Power Plants in various regions India (2010-11) .......................................... 64
Table 5.1.7: Comparative coal cost and Energy Charge; Thar vs India vs Indonesian Coals .................................... 64
Table 5.1.8: Input -Output Analysis of a 1000 MW Power Plant based on Thar Coal .............................................. 65
Table 5.1.9: Coal mining (surface) Production Cost based on various scenario of seam thickness, stripping ratio
and production rates .................................................................................................................................................. 65
Table 5.1.10: Coal Transportation Infrastructure Estimations .................................................................................. 66
Table 5.1.11: NEPRA upfront Coal Tariff: local and imported coal 1000 MW ........................................................... 67
Table 5.2.1: Proposed Capital of SCPC(SAARC Coal Power Company) ...................................................................... 72
Table 6.1: Emission Estimates for brown Coal/Lignite 1000 MW.............................................................................. 74
Table 6.2: Estimates of Emissions CFB Lignite (MIT methodology)-500 MW ............................................................ 75
Table 6.3: Environmental CAPEX ................................................................................................................................ 75
Table A1.1: SIPAT Super Thermal Power Station, Delhi (2x500 MW) ....................................................................... 87
Table A1.3: India Coal Mining Project CAPEX (March 2012 Costs) ............................................................................ 89
Prefeasibility Study for Setting Up SAARC Regional/Sub Regional Coal Power Plant
V
Table A1.4: PLANT PRICING ESTIMATES FOR GENERATION TECHNOLOGIES (2008 $), $/KW NET ........................... 91
Table A1.5: 500 MW PULVERIZED COAL POWER PLANT COSTS FOR 1 X 500 MW SUB CRITICAL PULVERIZED COAL-
FIRED PLANT EACH COST ITEM INCLUDES EQUIPMENT, MATERIAL & LABOR (JAN-2008 $) .................................... 92
Table A1.6: Comparative capital cost AES vs MIITSUI (1200 MW) ............................................................................ 93
Table A2.1: Thar Block Coordinates............................................................................................................................ 94
Table A2.2: Strati-graphic Sequence in the Thar Coal Field ....................................................................................... 97
Table A2.3: Detailed evaluation on four blocks ....................................................................................................... 97
Table A2.4: Chemical Composition ............................................................................................................................. 98
Table A2.5: Alternative Estimates, Lignite Production and Waste............................................................................ 99
Table A2.6: Major Coal Seams – thickness and quality (air dried) .......................................................................... 108
Table A5.1: U.S. average levelized costs (2011 $/megawatt hour) for plants entering service in 2018 ................ 128
Table A5.2: U.S. average levelized costs (2011 $/megawatthour) for plants entering service in 2018 ................. 129
Table A5.3: Range for total system levelized costs (2011 $/megawatthour) for plants entering service in 2018 130
Prefeasibility Study for Setting Up SAARC Regional/Sub Regional Coal Power Plant
1
1. Executive Summary Background 1) South Asia, as a whole, is having difficulties of supplies in the energy sector. There is load-shedding in all SAARC countries of varying intensities. In Pakistan and Bangladesh, gas shortages have initiated crisis conditions both in thermal as well as electric power sector. Traditionally cheap and abundant gas is no more. In India, major reliance of power sector has been on coal. Despite abundant coal resources, there are coal shortages in India now and coal has to be imported. Oil and Gas is short in all SAARC countries. However, South Asia is rich in Hydro and Coal resources, the latter being the focus of this study. 2) India produces and consumes coal both in Industrial and power sector with an annual production of 527 Million Tonnes per year and a coal resource of 276 Billion Tonnes. Coal Power plant capacity in India stands at 121611 MW .In Pakistan , there is a Lignite resource of 185 Billion tonnes in Thar and some small quantities elsewhere, while 5 Million tonnes of Coal is imported per year mainly to cater to the requirement of Cement sector. There is negligible amount of coal power capacity in Pakistan and also in Bangladesh. In Bangladesh, there is a hard coal resource of 2.5 Billion Tonnes which largely remains unutilized. 3) India has been very successful in Coal and Coal power sector, as the numbers indicate. It has acquired and developed both; coal Power plant capacity and as well as indigenous coal technology. Pakistan and Bangladesh can benefit from India’s technological lead and achievements towards utilization of the coal resources, especially in an anti-coal emerging scenario in the Western world. India can earn revenue and import surplus coal from Pakistan, if not from Bangladesh. Thus there is a win-win opportunity among the three countries to cooperate in Coal-electricity trade and technology. 4) While across the border investments by the SAARC countries are a laudable objective, there are constraints in this respect which may go away with time only. However, India can make investments and coal power capacity within its own border rather efficiently and without much issue, to export coal power (electricity) to the two countries, Pakistan and Bangladesh. Coal can be mined in the two countries from their respective sources near the border areas (Thar in Pakistan and( say) Phulbari in Bangladesh) and exported to India for power production there, only to be exported to these two countries. India can keep a portion of the electricity so produced for its own consumption. This way every country does what it can do best and lets the other do what they can do best for the common good. Import bill (of electricity)of the two coal exporting countries ,Pakistan and Bangladesh, is reduced, while India earns exports of electricity production services. 5) This concept can be applied to Thar Coal in Pakistan and Phulbari Coal in Bangladesh. In both the regions, mineral activity has not been started yet for a variety of reasons pertaining to technology, funding and others. In this study, we have focused on Thar Coal, while it is inferred that the same model, mutatis -mutandis, can be applied to Phulbari Coal in Bangladesh. Project Concept and options 6) There are two options; Option I involves an integrated coal-mining cum Power Plant to be located in Pakistan territory and financed under a Pakistan-India JV and electricity and coal consumed in Pakistan and exported to India as well; Option II involves coal mined in Thar is transported to a border location in
Prefeasibility Study for Setting Up SAARC Regional/Sub Regional Coal Power Plant
2
India and electricity produced in a Power plant built by India as an Indian supplied and owned facility and electricity exported to Pakistan and a share of it consumed in India. We have recommended option II for reasons elaborated here as well as in the body of the report. 7) We recommend a project under option II of a capacity of 1000 MW initially and to go to a 5-10,000 MW ultimately. The mine to be located around Pakistan border village Gadar/Goth Soomro and Power plant to be located around Satrau/Barmer Town in India to be connected by a dedicated Railway Track of estimated length of 50-100 kms. Accordingly an electric transmission line is built to connect power plant with Pakistan transmission network. Both countries are to build and own the facilities in their own borders. Technical expertise in Lignite mining, however, comes from India to be supplied by the relevant commercial companies .A border office may be built alongside the proposed rail track for holding routine management and coordination meetings and even installing a Training Centre manned by Instructors from India. 8) While option I is not to be totally excluded, Option II has the following advantage; a) It is least intrusive and least risky comprising of autonomous and independent facilities in both the countries. b) The project is to be financed independently under the individual country domain and commercial framework. c) It minimizes physical travel of persons which is often the scare-crow factor impeding cooperative ventures. d)All it requires is a trade agreement in coal and electricity wherein coal is exported by Pakistan to India and Electricity is exported by India to Pakistan; coal and electricity pricing formulae are to be agreed which may be a slightly involved issue. e) In case of a break-down in relation among the two countries, both countries have the option to utilize their investments for their own use. f) The only unknown in this arrangement are; availability of water around the proposed location in Rajasthan; and secondly the risk free railway transportation, although reportedly studies have been done in Pakistan indicating transportability of Thar coal. For that reason, Thar coal is being proposed to be used in other GENCO coal conversion projects in Pakistan. A dedicated Rail track further reduces the consequences of possible fire during the transportation. About Thar Coal 9) A total of 175 billion tons of coal resource potential has been assessed over an area of 9000 sq kms. The coal is brownish black, black and grayish black in color. The overburden consists of three kinds of material; dune sand, alluvium and sedimentary sequence. The total overburden is around 150 to 230 meters. The roof and the floor rocks are clay stone and loose sandstone beds. The overall vertical stripping ration (m3 waste: t lignite) is around 6.5:1.Cumulative lignite thickness in the average is about 27 meter and depth from top is about 150 meter. The coal beds of variable thickness ranging from 0.20 – 22.81 meters are developed. The maximum number of coal seams found in some of the drill holes is 20.The cumulative thickness of the coal beds range from 0.2 to 36 meters. Clay stone invariably forms the roof and the floor rock of the coal beds. The hydro-geological studies and drill hole geology shows the presence of three possible aquifer zones at varying depths: (i) above the coal zone (ii) within the coal zone and (iii) below the coal zone. Drilling data has indicated three aquifers (water-bearing Zones) at an average depth of 50 m, 120 m and more than 200 meters. The Lignite quality parameters as follows; a)Fixed Carbon: 22%; b)Volatile matter: 33% ; c)Ash: 6.56 %; d)Moisture:49%; e)Sulpher:0.6-1.34%; f)CV:5-6000 Btu/lb.
Prefeasibility Study for Setting Up SAARC Regional/Sub Regional Coal Power Plant
3
10) Several power projects are at various stages of planning and implementation totaling 2000 MW. Infrastructural arrangements including Roads, air strip, water supply and transmission facilities are being constructed. Project Parameters 9) A coal mining capacity of 7 Million tons per year with proven reserves of 250 Million tons would be required for the project of 1000 MW. The mine is to be sited at the north-eastern most apex of the Thar coal field near the border village of Ghadar and across the town of Barmer in District Barmer of India. Geological and mining studies on the Thar deposit have indicated Surface Mining to be optimum and the same recommendation is adopted for the project. 10) As detailed siting studies cannot be undertaken at this concept stage, an estimated 70 kms Rail Track, dedicated and especially purpose built for the project has been provided for in CAPEX estimates. A dual track (2X70 kms), two locomotives, 100 Wagons (100 tons each) and two coal terminals (1 loading and 1 off-loading) has been estimated. A CAPEX of 48 Million USD has been estimated which would add 5 USD/ton to coal cost. 11) The project can be implemented in a time framework of 3-5 years and would involve the following investment s;
Power Plant 1600 Million USD(India)
Lignite /Coal Mine 750 Million USD(Pakistan/Bangladesh)
Logistics(Rail) 48 Million USD(joint)
Transmission 50 Million USD(joint)
Total 2448 Million USD
Project Economics and commercials: 12) Commercial agreement could be either Take or Pay or Take and Pay. As both parties can use the facilities built for the project for their own use, Take and Pay would be quite practical and agreeable option. Both sides bill each other and net payment is to be made by the relevant party. Or India bills for the amortization price based on CERC India parameters. 13) If coal is supplied by Pakistan at prices prevailing for Lignite/coal in Rajasthan and Gujarat, Electricity export price from India can be expected at prices prevailing in India. Currently, Coal based Electricity is sold in India at a rate of 3-4 IRs (avg 5.82 cents) per kWh and Coal to power sector is sold at 880 IRs (20 USD) per ton. However due to higher estimated production cost of Thar coal at USD 40 per ton and a lower Calorific value, of 6000 Btu/lb, Thar coal is to coat three times that of Indian coal costs (3 USD per MMBtu vs 1 MMBtu for Indian Coal).Adjusting for coal price difference, projected electricity price from India based on Thar Coal under the proposed project configuration would be expected as 7.31 cents per kWh. This can be cheaper than Pakistan produced electricity (Engro has reportedly proposed a price of 11 cents per kWh).Although, a detailed cost of production is to be worked out under a feasibility study; these figures indicate the attractiveness of the proposition for Pakistan.
Prefeasibility Study for Setting Up SAARC Regional/Sub Regional Coal Power Plant
4
14) As to the Project and production cost, we had had access to some data of 1000 MW lignite Power Plant that has been used as a model in this study. RajWest Power Plant is located in Barmer district, where we proposed to export Lignite in return for electricity. Barmer is just across Tharparkar district in Pakistan where Thar Lignite is found. There are 8-135 MW units with CFB boilers burning Lignite from Jalipa and Kapurdi mines. The two mines together have proven reserves of 466 Million tons which would be sufficient for 30-50 yrs of plant life. The plant has been gradually installed in stages of 135 MW from 2007 t0 2013.The Mine CAPEX has been 400 Million USD and Power Plant CAPEX has been reported to be 1.3 Billion USD. Transfer price of Lignite invested in by a sister concern, as per Gujarat Electric Regulatory Commission (GERC) document has been approved at 24 USD per ton, as an interim decision. The power plant tariff has been approved to be 7.24 cents. The project has been implemented in private sector by Jindal Power and there have been public protestations on higher tariff compared to other similar projects in India. While power plant figures are on the higher side as compared to the Indian median figure of 1000 USD per kW on the average, mining CAPEX in India appears to be very low. Under perhaps harder mining conditions as indicated by the stripping ratio of 1:15 as compared to 1:8 for Thar Lignite, the production cost stands at 24 USD per ton as opposed to some 40 USD per ton that has been estimated for Tar. Similarly CAPEX for Jalipa and Kapurdi mines for 1000 MW of RajWest Power Plant has been around 400 Mn.USD, less than half of what has been estimated for Thar Project cost for 1000 MW. This indicates the scope for assistance India’s assistance to Pakistan in mining sector, although we have not included it in our proposal due to the intrusive nature of such assistance that may not be politically admissible in the prevailing circumstances. Thar Coal market potential in India 15) India has a mature coal power industry with an installed capacity of 131628 MW out of a total power production capacity of 225133 MW. Another 60,000 MW is being planned for addition under 12th Indian Plan.30, 000 MW of coal power is installed in Northern region alone. One could expect 25% of new coal capacities to be sited in Northern regions of India which could be a potential market for Thar coal. It should be noted, however, that apart from transportation issues, there are some technical limitations. Thar Lignite can be burnt in CFB boilers, while most Indian coal power is based on PC boilers. 16) Although India is richly endowed in Coal with reserves of 111 Bn Tons( total resource:286 Bn Tons)and a local production rate of 460 Million tons per year sustaining power production of around 100,000 MW beside other industrial users, there is a shortage of 120 Million tons per year which is met through imports. Also most of its coal resources are concentrated in Central and Eastern parts like Madhya Pradesh, Chattisgarh, Orissa, Jharkand and West Bengal. Northern India does not have much of coal except comparatively smaller lignite deposits. 17) In Gujarat, Mundra (5x800 MW) is being installed at Coastal Town Mundra based on imported coal at a very low tariff of 2.264 IRs per kWh. It cannot be expected a customer of Pakistan’s Lignite, as it has been designed on imported Sub-Bituminous Coal. Gujarat is already a Power surplus province, although Fast growing Gujarat economy may require Pakistan’s Thar Lignite in future. Other states like Rajasthan, Punjab and Haryana are a potential market for Pakistan’s Thar coal. 18) Other futuristic although realistic options are production and export of Syngas or border production of Fertilizer badly needed in both the countries. Gas based Fertilizer will be expensive if ultimately switched to LNG in both the countries. Although coal based fertilizer is expensive as compared to cheap gas, it would be much more economical than LNG and would be more secure. India Coal has high ash content and has been found to be posing difficulties in Syngas/Fertilizer production. Environmental Issues
Prefeasibility Study for Setting Up SAARC Regional/Sub Regional Coal Power Plant
5
19) It is a common knowledge that coal creates environmental problems. On the other hand ,research is going on in the area of Clean Coal and quite some success has been achieved in this respect ,although the deployment of CO2 storage technologies are still to come. Sox, NOx and Particulate matter control technologies are in global practice for quite a while and have proved useful. Induction of environmental technologies has been rather slow in the region. For example, Sox control equipment has been seldom employed and Electrostatic Precipitators –ESP (ash control) has been a rather recent entry in India’s coal sector. 20) Thar coal/Lignite, fortunately, is low ash (6%)-medium Sulfur (0.6-1.6%) coal. Our cost estimates do include ESP installation; however, it is debatable that FGD should be necessarily installed for its operations create secondary pollution problems. Also, the proposed CFB boilers capture significant amounts of sulfur in its slag combination with lime. Otherwise, in India quite some achievements have been made in sustainable mining with respect to NLC’s operations in Tamil Nadu, especially, in the area of dust suppression, water management and good house-keeping. The project can borrow from these successful practices. 21) We have worked out the emission load generated by the project under controlled and uncontrolled conditions based on international emission factor data and the local coal specs, and have provided a review of good environmental practices that have been successfully adopted in the Lignite mining and Power sector. Project Risk Analysis and Mitigation 22) As there is already a lignite mine in Barmer and elsewhere in Rajasthan and also in Gujarat, one may wonder whether there is competition or synergy with the existing infrastructure in Rajasthan? One may ask as to why would one import and transport expensive Thar Lignite (USD 40 per ton) from Pakistan, when a cheaper (USD 24USD per ton) one of comparable specs is available locally? Existing infrastructure in Rajasthan may prove to be an asset in the short term for the uncertainties on Pakistan side in terms of her ability to start activities in Thar and make the additional investment for the proposed project, at least in the short term perspective. Existing mining infrastructure in Rajasthan may be employed in the initial years to utilize local lignite for the proposed project. In the medium (3-5 yrs from now), one may be reasonably optimistic about the possibilities of mining and additional mining in Thar for the proposed project. In the medium to long run, there would remain a rationale for Pakistani lignite exports to India, in the light of coal shortages and huge demand in India. 23) The real energy and electricity scarcity is in Pakistani Punjab and may remain to be so for quite a while. In Sindh, there would be surplus due to many energy resources including Wind. Sindh to Punjab transmission is expected to be overloaded due to the induction of Thar coal and Wind power generation there. The proposed project may seem to multiply the transmission congestion. However, the transmission from Barmer under the proposed project may not necessarily pass through Sindh. Possibilities may be investigated for routing the transmission through Rajasthan- Indian Punjab. There are already proposals and negotiations for importing electricity from India to Pakistan’s Punjab province and laying transmission network for that purpose has been actively considered by the two sides. 24) There are all kinds of risks of various kinds of discontinuities in the political domain among the two countries posing risks for the continued operation for the proposed project. However, the project is robust enough in the sense that both sides may be able to utilize the facilities within their territories for domestic purposes. Only transmission and coal transport infrastructure may not have alternative usage.
Prefeasibility Study for Setting Up SAARC Regional/Sub Regional Coal Power Plant
6
Project Sensitivity Analysis: There are possibilities of variations around the point values, we have assumed for our analysis. And there is a question as to what happens, if the power plant is also sited in Pakistan territory(Option –I)PPIB/NEPRA have approved a tariff of 6.6 cents/kWh ,both for local and imported coal for 1000 MW power plants based on foreign debt finance. NEPRA RoE for local coal is 20% as opposed to the normal one of 15%.This data, however, is not applicable for Thar Coal for which a special process is due. Newspaper accounts indicate an asking tariff of 11.5 cents by Engro. While all other variables like CAPEX and OPEX may remain the same, except for ROE which in India is 15 % and in Pakistan as stated is 20%.We have done sensitivity analysis taking two RoEs of 15 and 20%.Secondly, there may be variations, when final choices of project capacities and technologies (sub vs supercritical, Indian vs Europe or Japanese, PC vs CFBC etc) are made which may cause variations in Thermal efficiencies. We have thus assumed Heat rates varying between 10,000 to 11500 Btu/kWh and attempted to calculate impact on COGE of such variations. There may also be variations on Thar coal CV depending on the final choice of site. Thus our sensitivity analysis allowed for CV variations between 5000 to 6000 Btu/lb. The lowest COGE comes out to be 7.24 cents/kWh and the highest COGE to be 8.52 cents. How do we explain the difference between NEPRA coal tariff (6.6 cents) and our computations in this report. First of all NEPRA tariff does not apply to Thar coal and the other differences are due to variations in coal price, CV and CAPEX values. However, our computations of COGE compare well with RajWest Lignite Power station of 7.24 cents. Salient Project Data: 1) Power Plant Capacity = 1000 MW
2) Annual Electricity generation= 7 Billion kWh
3 ) Raw material =Lignite from Thar Coal Pakistan
4) Coal Mine Capacity= 7 Million tons/yr (reserve requirement= 250 Million tons)
4) Project Location=Lignite mine near Ghadar/Goth Soomro in Sindh and Power Plant near Satrau Barmer
District Rajhastan
5) Distance between mine and Power Plant=70 kms
6) Logistics =Dedicated dual track Rail link to be installed
7) key specs of Thar Lignite=CV 6000 Btu/lb; ash 6%;Sulfur 0.6-1.6%
8) CAPEX_Mine= 750 Million USD(to be developed and financed by Pakistan)
9) CAPEX_Power Plant=1600 Million USD (to be developed and financed by India)
10) CAPEX_Logistics =48 Million USD (developed by parties in their respective areas)
11) Estimated Lignite cost= 40 USD/ton (3 USD/MMBtu)
12) Lignite transport cost= 5 USD per Ton
13) Estimated Power Generation Tariff = 7.31 US cents/kWh
14) Estimated Sales Revenue Lignite Mine=200 Million USD/yr
15 ) Estimated Sales Revenue Power Plant =510 Million USD/yr
16) Net Trade Flow to India =310 Million USD
Prefeasibility Study for Setting Up SAARC Regional/Sub Regional Coal Power Plant
7
2. Market
2.1. Energy situation in South Asia
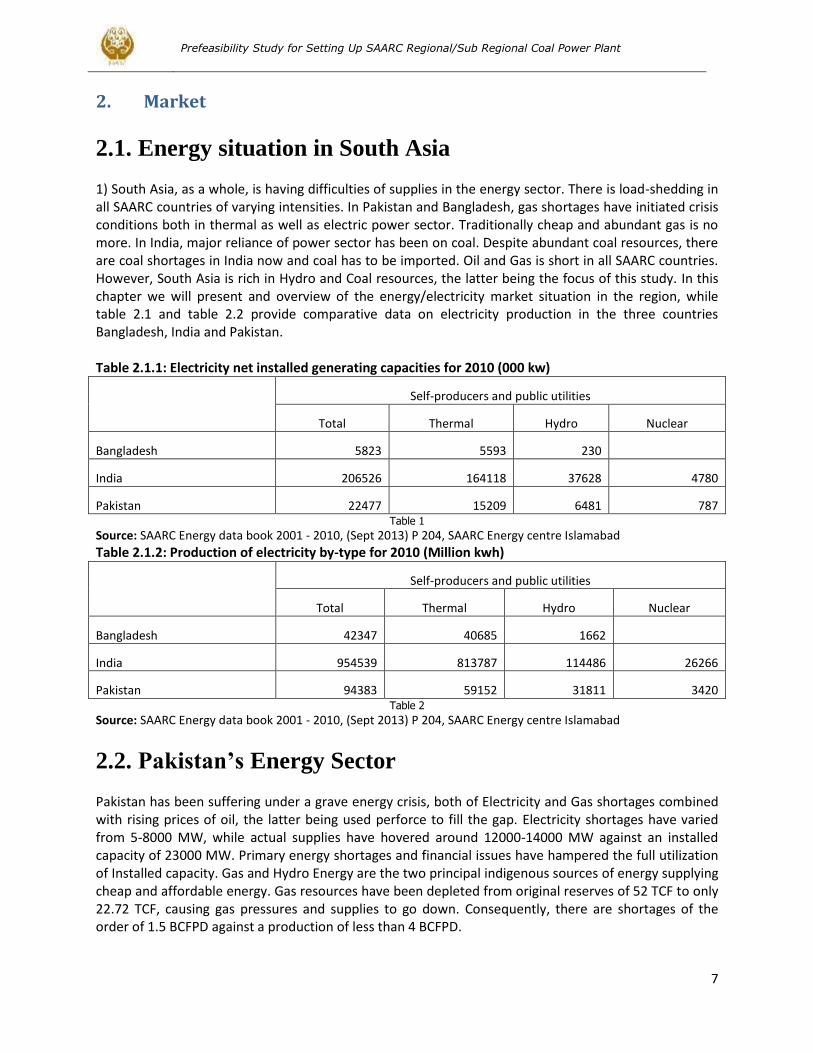
1) South Asia, as a whole, is having difficulties of supplies in the energy sector. There is load-shedding in all SAARC countries of varying intensities. In Pakistan and Bangladesh, gas shortages have initiated crisis conditions both in thermal as well as electric power sector. Traditionally cheap and abundant gas is no more. In India, major reliance of power sector has been on coal. Despite abundant coal resources, there are coal shortages in India now and coal has to be imported. Oil and Gas is short in all SAARC countries. However, South Asia is rich in Hydro and Coal resources, the latter being the focus of this study. In this chapter we will present and overview of the energy/electricity market situation in the region, while table 2.1 and table 2.2 provide comparative data on electricity production in the three countries Bangladesh, India and Pakistan. Table 2.1.1: Electricity net installed generating capacities for 2010 (000 kw)
Self-producers and public utilities
Total Thermal Hydro Nuclear
Bangladesh 5823 5593 230
India 206526 164118 37628 4780
Pakistan 22477 15209 6481 787 Table 1
Source: SAARC Energy data book 2001 - 2010, (Sept 2013) P 204, SAARC Energy centre Islamabad
Table 2.1.2: Production of electricity by-type for 2010 (Million kwh)
Self-producers and public utilities
Total Thermal Hydro Nuclear
Bangladesh 42347 40685 1662
India 954539 813787 114486 26266
Pakistan 94383 59152 31811 3420 Table 2
Source: SAARC Energy data book 2001 - 2010, (Sept 2013) P 204, SAARC Energy centre Islamabad
2.2. Pakistan’s Energy Sector
Pakistan has been suffering under a grave energy crisis, both of Electricity and Gas shortages combined with rising prices of oil, the latter being used perforce to fill the gap. Electricity shortages have varied from 5-8000 MW, while actual supplies have hovered around 12000-14000 MW against an installed capacity of 23000 MW. Primary energy shortages and financial issues have hampered the full utilization of Installed capacity. Gas and Hydro Energy are the two principal indigenous sources of energy supplying cheap and affordable energy. Gas resources have been depleted from original reserves of 52 TCF to only 22.72 TCF, causing gas pressures and supplies to go down. Consequently, there are shortages of the order of 1.5 BCFPD against a production of less than 4 BCFPD.
Prefeasibility Study for Setting Up SAARC Regional/Sub Regional Coal Power Plant
8
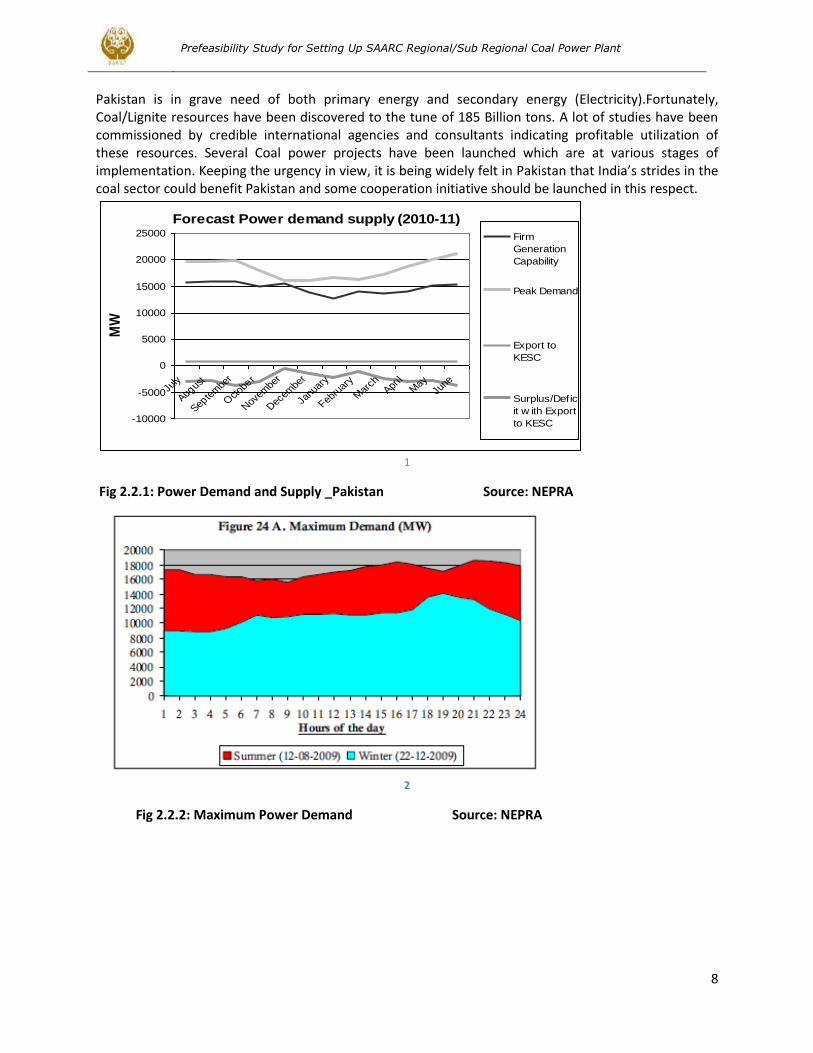
Pakistan is in grave need of both primary energy and secondary energy (Electricity).Fortunately, Coal/Lignite resources have been discovered to the tune of 185 Billion tons. A lot of studies have been commissioned by credible international agencies and consultants indicating profitable utilization of these resources. Several Coal power projects have been launched which are at various stages of implementation. Keeping the urgency in view, it is being widely felt in Pakistan that India’s strides in the coal sector could benefit Pakistan and some cooperation initiative should be launched in this respect.
1
Fig 2.2.1: Power Demand and Supply _Pakistan Source: NEPRA
2
Fig 2.2.2: Maximum Power Demand Source: NEPRA
Forecast Power demand supply (2010-11)
-10000
-5000
0
5000
10000
15000
20000
25000
July
Augus
t
Septe
mbe
r
Octob
er
Nov
embe
r
Dec
embe
r
Janu
ary
Febru
ary
Mar
chApr
ilM
ayJu
ne
MW
Firm
Generation
Capability
Peak Demand
Export to
KESC
Surplus/Defic
it w ith Export
to KESC
Prefeasibility Study for Setting Up SAARC Regional/Sub Regional Coal Power Plant
9
3
Fig 2.2.3: System Demand over a Typical Day Source: NEPRA Tariffs, Subsidies and circular debt Average Tariff determined by NEPRA in Feb. 2007, was Rs 5.14 per unit (kWh), as opposed to Rs 4.25 per unit of average notified tariff (the average rate at which the customers were required to pay), resulting in loss/subsidy of Rs.0.89 per unit. By 1st January 2010, the average NEPRA tariff shot up to Rs 10.09 per unit, while the notified tariff (Consumer average charge rate) remained limited to only Rs. 6.67 per unit, resulting in a subsidy of Rs.3.39 per unit i.e.34 %. GOP, in the meantime, increased notified tariff in steps ; 6 % in Oct 2009, 12% in Jan 2010 and7.6 % in July 2010, in all 26 % up to July 2010. The plans are to do away with electricity subsidies by the end 2011.It is almost impossible that the distance can be covered in such a short time. Table 2.2.1: COGE and Losses of PEPCO
2005-06 2006-07 2007-08 2008-09 2010-11
Avg. Sale Rate (Rs./kWh) 4.1 4.5 5.4 7.3 7.78
Gas Rs/kWh 2.35 2.68 2.56 3.63
Furnace Oil (FO) 5.04 5.32 8.12 9.19 12.02
HSD Rs/kWh 12.58 15.08 18.05 13.51 14.81
Coal Rs/kWh 1.33 1.61 2.03 2.12 3.06
Overall Fuel Cost Rs/kWh 2.94 3.66 4.67 5.99 7.20
Average Cost (Rs./kWh) 4.7 5.1 6.5 8.2 9.72
Subsidy 0.6 0.6 1.1 0.9 1.96 Table 3
* Figures for March 2011 Source: NEPRA In the year 2009-2010, the average fuel cost of GENCOs was Rs 7.49 per kWh and of KESC (with mostly gas fired plants) Rs 4.66 per unit. UCH power plants and other combined cycle plants had a very low fuel cost of only Rs. 1.50 per kWh, almost competing with hydro. Thermally inefficient Single cycle gas plants
Prefeasibility Study for Setting Up SAARC Regional/Sub Regional Coal Power Plant
10
cost as much as Rs.4.00 per unit as fuel cost. RFO fuel costs were Rs.8.00 per kWh. By Jan. 2011, the RFO based electricity had a unit fuel cost of Rs 11.37 per kWh. By comparison, average household tariff in the US these days stands at 10 cents per unit. Their electricity comes mostly from local cheaper coal, gas and Uranium (nuclear). GOP could not have paid the entire shortfall as subsidy, and the residual shortfall gave rise to the so-called circular debt. Circular debt by Dec 2010 jumped to. Whatever amount is pumped in by the GOP, new shortfalls suck it, causing no net addition into the liquidity of the energy supplying companies. This shortage of liquidity on the part of the companies has affected their supply capacities, and thus energy supply has significantly reduced over time. DISCOs also share the blame due to their inefficiencies, at least some of them more than the others. For example PESCO‘s T&D losses show a rising trend, at an already unsustainably high level of 37.4%. HESCO closely follows with T&D loss level of 34.75 %. The technical loss component is hardly 5-7%, bulk of it is theft and receivables. There are other companies, mostly in Punjab, which T&D losses are limited to 10-11 %. The current crisis including the last three years is not only due to lack of technical capacity, which is 22000 MW against a maximum demand of 18000 MW. It is at least partly due to the financial problems. The prevailing selling prices of Electricity in the country are lower than the cost of production; the latter includes transmission and distribution losses of 25-30%, half of which at least is theft, in which both rich and the poor participate rampantly. Government promises to pay the difference in the form of subsidy, but cannot pay due to lack of resources. Consequently, dues have increased and the utilities cannot buy fuel and thus plants have to be closed down. As soon as government retires some debt, more of it accumulates at the rate of more than Rs 2.00 per unit generated or sold. Table 2.2.2: Comparative Electricity Tariff; India vs Pakistan (as of June 2011)
Gujarat Maharashtra Andhra Pradesh
Tamil Nadu Pakistan *
Units IRs./kWh IRs./kWh IRs./kWh IRs./kWh Pk .Rs./kWh
Domestic
1-300 units 2.85 - 3.50 2.61 - 4.61 2.80 - 4.75 2.60 - 3.50 6.26 - 7.70
301-500 units 6.51 6 3.5 10.65
500-1000 units 7.65 6.25 5.75 13.29
1000 units + 4.5 7.91 6.25 5.75
Industries
High Tension loads 4.2 5.56 4.13 4 7.8
Commercial 8.39 6.5 5.8 10.45 Table 4
Note: 1USD = 45 IRs = 87 Pk Rs *LESCO Data June 2011 Sources: Issues in Energy Policy by Akhtar Ali, HDIP, NEPRA (Pakistan), Gujarat, Maharashtra, Andhra Pradesh, Tamil Nadu, Electricity Commission (India)
Prefeasibility Study for Setting Up SAARC Regional/Sub Regional Coal Power Plant
11
Table 2.2.3: Final energy consumption by source
Unit: TOE
Source 2004-05 2008-09 2009-10 2011-12
ACGR 2007-
12
Oil 1/ 11,710,920 10,842,614 10,829,455 11,617,788 1.9%
Gas 2/ 11,637,566 16,307,898 17,024,933 17,618,199 3.7%
Coal 2/ 3,310,512 3,893,001 4,282,061 4,057,678 -0.4%
Electricity 3/ 4,994,560 5,731,032 6,054,921 6,251,421 1.1%
LPG 450,379 569,995 576,631 481,064 -6.1%
TOTAL: 32,103,936 37,344,540 38,768,001 40,026,149 2.1%
Annual growth rate 10.78% -5.25% 3.81% 3.81% Table 5
1/ Excluding consumption for power generation. 2/ Excluding consumption for power generation and feedstock. 3/ @ 3412 Btu/kWh being the actual energy content of electricity.
Source: Issues in Energy Policy by Akhtar Ali, HDIP Pakistan Energy year Book 2012 and others Table 2.2.4: Energy Profile Pakistan 2010
Energy Resource Total Oil Gas Electricity (Hydro )
Coal
Resource/reserves
22.72 TCF 40,000MW 185 Billion
Tonne Local Production MTOE
43.27 (68.68%) 3.18 30.8 2.791 1.60
Imports MTOE(%) 21.64
(34.35%) 18.4 nil nil 3.064 Primary Consumption MTOE(%) 63.08 (100)
20.2 (32.1%)
30.8 (48.89%) 7.455 (11.83%) 4.622 (7.33%)
Transformation Losses 24.32 MTOE
Final Consumption MTOE(%)
38.768 (100%)
10.829 (27.9%)
17.024 (43.9%) 6.054 (15.6%) 4.282 (11%)
Residential MTOE(%) 8.360
(21.56%)
5.133 (61.39%) 2.791 (33.37%)
Commercial MTOE(%) 1.5 (3.87%)
Industrial MTOE(%) 15.64
(40.22%)
8.70 (55.7%) 1.614 (10.34%)
4.282 (27.56%)
Agricultural MTOE(%)
0.789(93%) Power MTOE(%) 15.7 8.6 (54.7%) 7.1 (45.2%)
Transport
11.654 (30%)
9.344 (80.20)
2.31 (19.8%)
Table 6
Sources: Issues in Energy Policy by Akhtar Ali, HDIP
Prefeasibility Study for Setting Up SAARC Regional/Sub Regional Coal Power Plant
12
Table 2.2.5: Oil Sector Profile
Oil Fields 132 Reserves(million bbls) 341.93 Consumption MTOE 21 1 MTOE=7.454 barrels
Local Production MTOE 3.18 Imports Crude MTOE 7.1 Imports of Products 11.3 Local Refinery Capacity 250000 bbl/d No of Wells drilled total
Wells drilled last year Distribution PSO Shell Caltex PARCO
Market Share 62.10% 22.10% 8.10% Oil Storage 30 depot,1 million tonnes
Petrol Pumps 5000 Pipelines
Trucks 10,000 Trucks,3800 wagons
Consumption End use Residence Transport Industries Utilities
Market share
46.30% 5.10% 46.10%
Products HSD Gasoline F.O. Kerosene
40% 10.50% 46.30%
Provincial Consumption Sindh Punjab KPK Balochistan
21.30% 59.20% 6.80% 11.11%
User Vehicles Cars Trucks/Buses Motor-cycles
4.9 Million o/w 335,000 5.5 Million
2.85 Million CNG
Table 7
Sources: Issues in Energy Policy by Akhtar Ali, HDIP
Prefeasibility Study for Setting Up SAARC Regional/Sub Regional Coal Power Plant
13
Table 2.2.6: Natural Gas Sector Profile
Reserves 22.72 TCF Gas Fields o/W 128 Major Fields 6 Share 70% Major Gas Fields Sui Zamzama Bhit Mari Qadirpur Sawan
Production Share(%) 16.5 10 8.7 12.2 13.78 11
Provincial Share Sindh Punjab KPK Baloch Production Share(%) 68.7 4.1 4.95 19.7 Consumption 38 51.5 3.5 7 Producer company OGDC PPL BHP OMV Mari ENI
Market Share 22.7 20.84 16.4 13 11.6 9.7
End users Domestic Industry+ Fertilize Transprt Power Market Share % 19.6 23.5 17.6 8.5 27.8 Distribution
Companies SNGPL SSGC Total Market Share
No of Consumers tot 3.6 million 2.3 million 5.9 million Domestic
5.685 mln Commercial
78789
Industrial 6126 4112 10238 Transport
Transmission network kms
7000 3000 10000 Distribution Network
kms 60000 31930 91930
Production (bcfd) 4.00 Demand(bcfd) 5.5 Shortfall 1.5 Table 8
Sources: Issues in Energy Policy by Akhtar Ali, HDIP
2.3. Coal and Power Sector in India
India has a large power sector with an installed capacity of 211766 MW catering to a peak demand of 135455 and with peak supply of 123294 MW resulting in a power deficit of 12159 MW (9%).Coal provides a major share (57.42%) in total power production and Hydro 19%.There are ambitious plans of adding another 75000 MW of Coal power in the next ten years.
Prefeasibility Study for Setting Up SAARC Regional/Sub Regional Coal Power Plant
14
Table: 2.3.1: Power Generation Capacity India (2012)
Fuel MW % age
Total Thermal 141713.68 66.91
Coal 121,610.88 57.42
Gas 18,903.05 8.92
Oil 1,199.75 0.56
Hydro (Renewable) 39,416.40 18.61
Nuclear 4,780.00 2.25
RES** (MNRE) 25,856.14 12.20
Total 2,11,766 100
Table 9
Source: Ministry of Power India Table: 2.3.2: India Power Supply Position
Energy Peak
Year Requirement Availability Surplus/Deficts (-)
Peak Demand
Peak Met
Sirplus/Deficts (-)
(MU) (MU) (MU) (%) (MW) (MW) (MW) (%)
2009-10 8,30,594 7,46,644 83,950 10.1 1,19,166 1,04,009 15,157 12.7
2010-11 8,61,591 7,88,355 73,236 8.5 1,22,287 1,10,256 12,031 9.8
2011-12 9,37,199 8,57,886 79,313 8.5 1,30,006 1,16,191 13,815 10.6
2012-13 9,95,500 9,08,574 86,926 8.7 1,35,453 1,23,294 12,159 9.0
Table 10
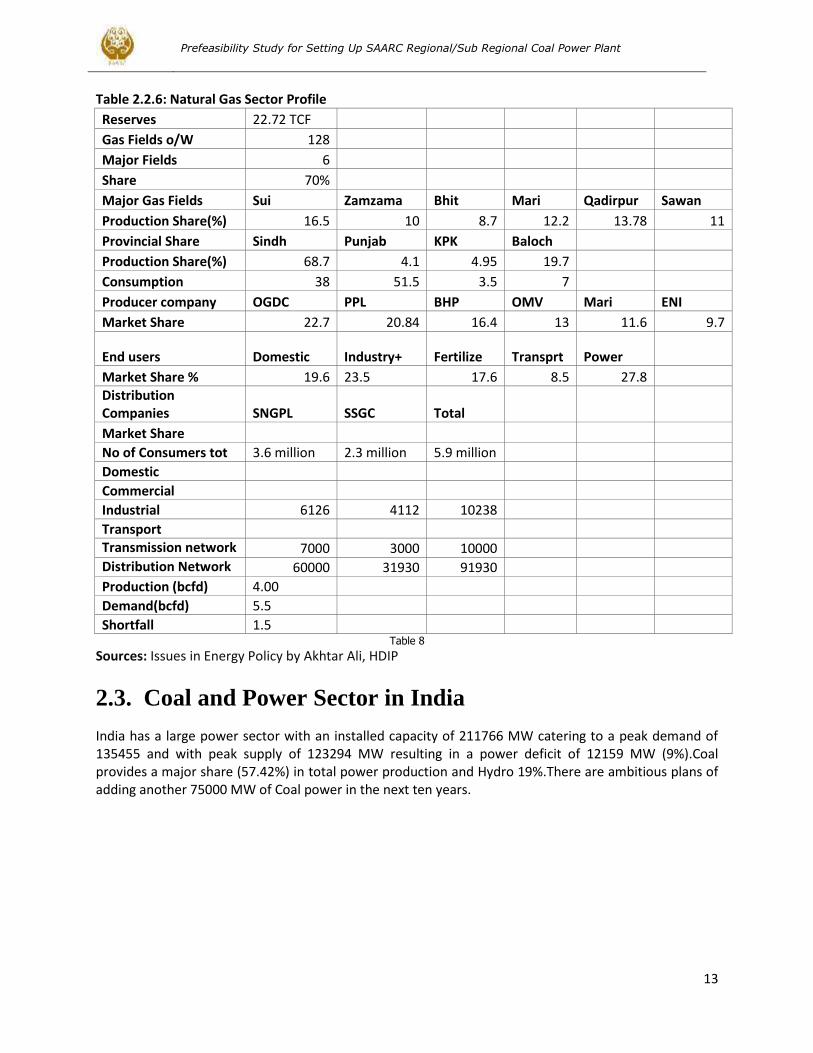
Source: Ministry of Power India Although India is richly endowed in Coal with reserves of 111 Bn Tons( total resource:286 Bn Tons)and a local production sustaining power production of around 100,000 MW beside other industrial users, there is a shortage of 120 Million tons per year which is met through imports. Also most of its coal resources are concentrated in Central and Eastern parts like Madhya Pradesh, Chattisgarh, Orissa, Jharkand and West Bangal. Northern India does not have much of coal except comparatively smaller lignite deposits. According to the Ministry of Coal, India is currently the third largest producer of coal in the world, with a production of about 582 million tons (MT) of hard coal and 34 MT of lignite in 2009–10. India has significant coal resources, but there is considerable uncertainty about the coal reserve estimates for the country. With-out improvements in coal technology and economics, the existing power plants and the new plants added in the next 10–15 years could consume most of India’s extractable coal over the course of the plants’ estimated40- to 50-year life spans. Indian coal demand, driven primarily by the coal power sector, already has been outstripping supply; over the past few years, many power plants have restricted generation or have partially shut down because of coal supply shortages. India has a mature coal power industry with an installed capacity of 131628 MW out of a total power installed capacity of 211766 MW. Another 60,000 MW is being planned for addition under 12th Indian Plan.30, 000 MW of coal power is installed in Northern region alone. One could expect 25% of new coal capacities to be sited in Northern regions of India which could be a potential market for Thar coal. It
Prefeasibility Study for Setting Up SAARC Regional/Sub Regional Coal Power Plant
15
should be noted, however, that apart from transportation issues, there are some technical limitations. Thar Lignite can be burnt in CFB boilers, while most Indian coal power is based on PC boilers. In Gujarat, Mundra (5x800 MW) is being installed at Coastal Town Mundra based on imported coal at a very low tariff of 2.264 IRs per kWh. It cannot be expected a customer of Pakistan’s Lignite, as it has been designed on imported Sub-Bituminous Coal. Gujarat is already a Power surplus province, although Fast growing Gujarat economy may require Pakistan’s Thar Lignite in future. Other states like Rajasthan, Punjab and Haryana are a potential market for Pakistan’s Thar coal.
4
Fig 2.3.1: Coal deposits in India
Prefeasibility Study for Setting Up SAARC Regional/Sub Regional Coal Power Plant
16
5
Courtesy: Coal India
Fig 2.3.2: Lignite Resources in India
6
Courtesy: India Coal Statistics
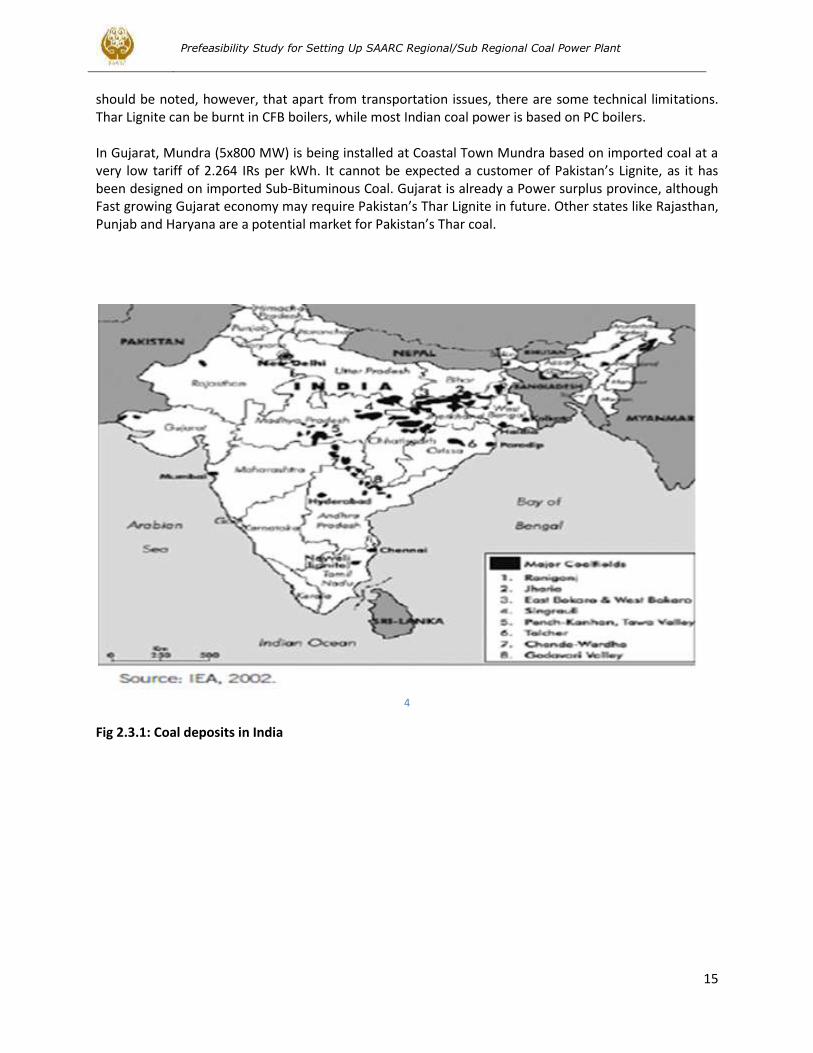
Fig 2.3.3: Coal Production Trend in India
Prefeasibility Study for Setting Up SAARC Regional/Sub Regional Coal Power Plant
17
7
Courtesy: India Coal Statistics
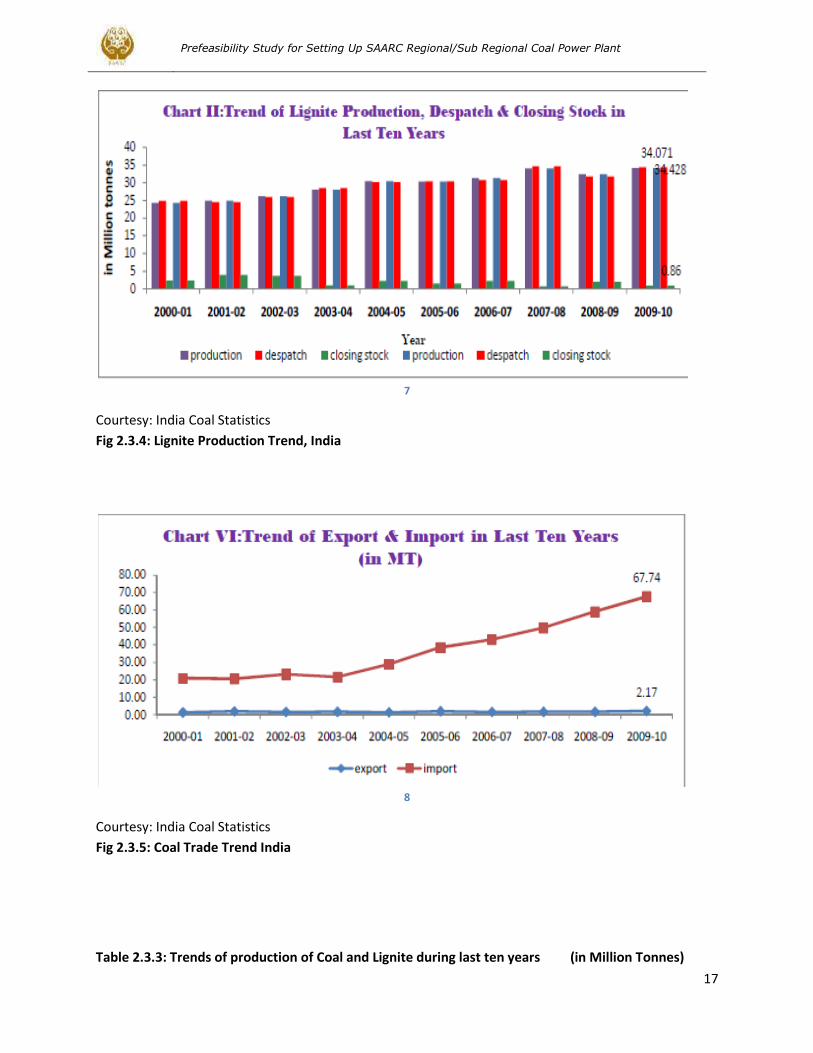
Fig 2.3.4: Lignite Production Trend, India
8
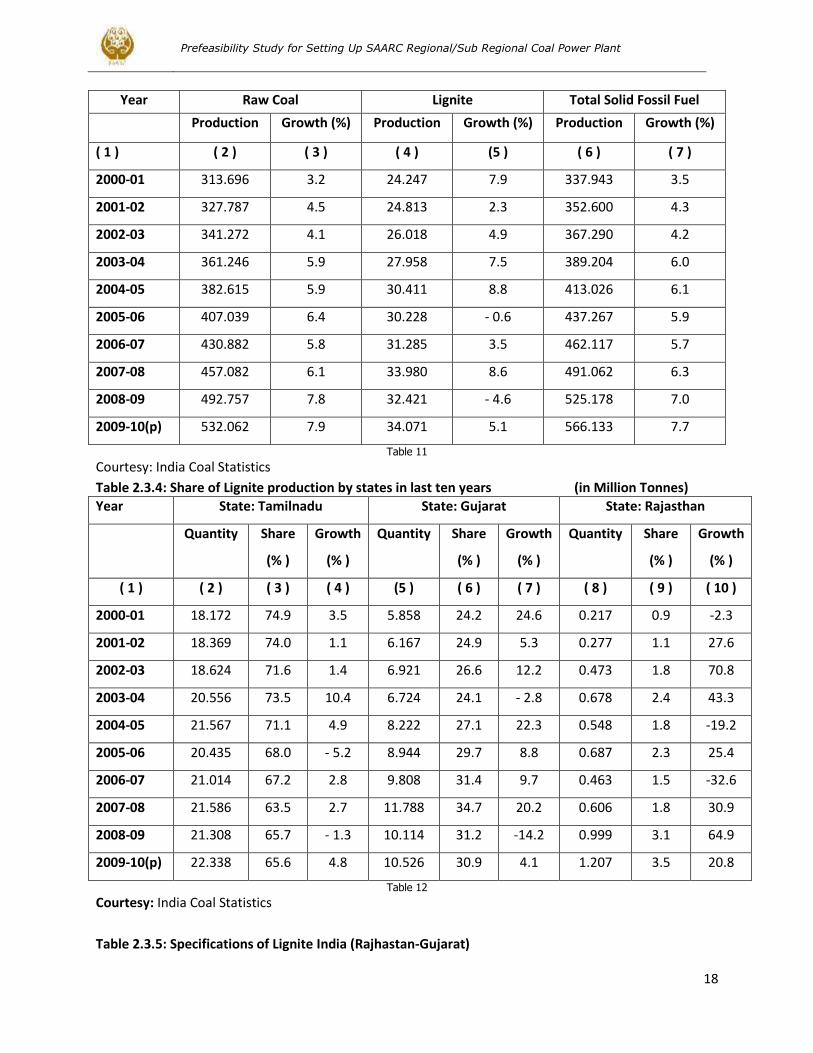
Courtesy: India Coal Statistics
Fig 2.3.5: Coal Trade Trend India
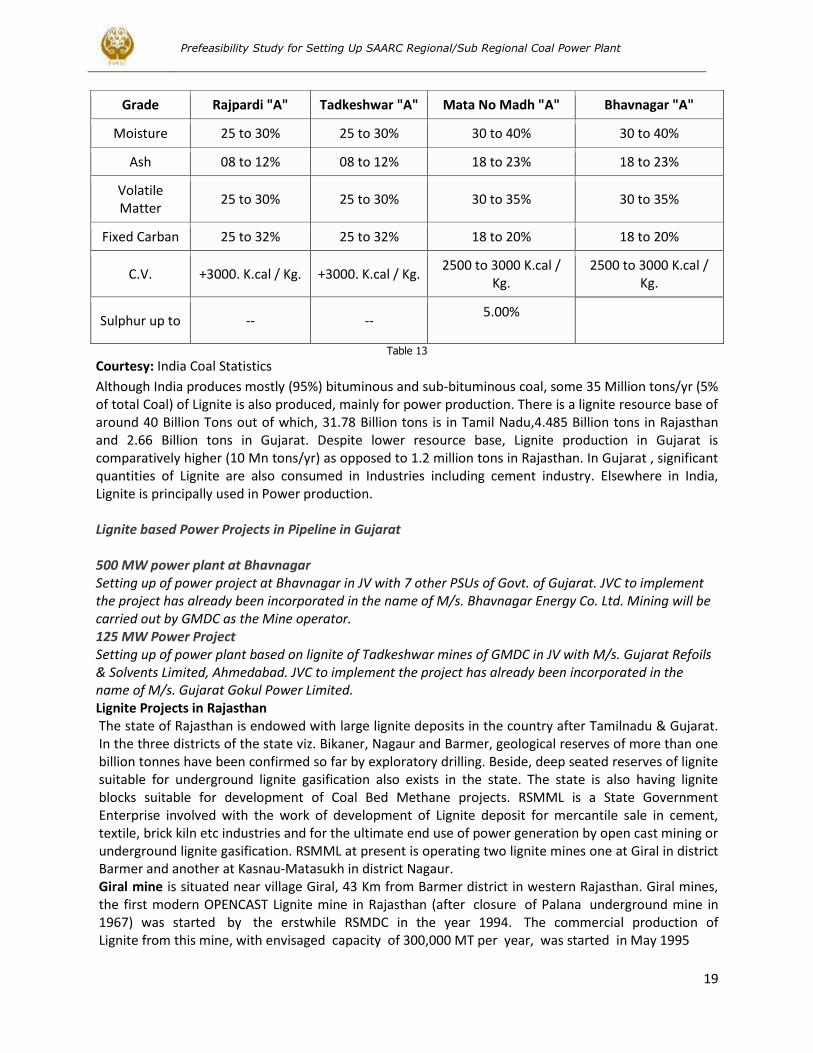
Table 2.3.3: Trends of production of Coal and Lignite during last ten years (in Million Tonnes)
Prefeasibility Study for Setting Up SAARC Regional/Sub Regional Coal Power Plant
18
Year Raw Coal Lignite Total Solid Fossil Fuel
Production Growth (%) Production Growth (%) Production Growth (%)
( 1 ) ( 2 ) ( 3 ) ( 4 ) (5 ) ( 6 ) ( 7 )
2000-01 313.696 3.2 24.247 7.9 337.943 3.5
2001-02 327.787 4.5 24.813 2.3 352.600 4.3
2002-03 341.272 4.1 26.018 4.9 367.290 4.2
2003-04 361.246 5.9 27.958 7.5 389.204 6.0
2004-05 382.615 5.9 30.411 8.8 413.026 6.1
2005-06 407.039 6.4 30.228 - 0.6 437.267 5.9
2006-07 430.882 5.8 31.285 3.5 462.117 5.7
2007-08 457.082 6.1 33.980 8.6 491.062 6.3
2008-09 492.757 7.8 32.421 - 4.6 525.178 7.0
2009-10(p) 532.062 7.9 34.071 5.1 566.133 7.7
Table 11
Courtesy: India Coal Statistics
Table 2.3.4: Share of Lignite production by states in last ten years (in Million Tonnes)
Year State: Tamilnadu State: Gujarat State: Rajasthan
Quantity Share
(% )
Growth
(% )
Quantity Share
(% )
Growth
(% )
Quantity Share
(% )
Growth
(% )
( 1 ) ( 2 ) ( 3 ) ( 4 ) (5 ) ( 6 ) ( 7 ) ( 8 ) ( 9 ) ( 10 )
2000-01 18.172 74.9 3.5 5.858 24.2 24.6 0.217 0.9 -2.3
2001-02 18.369 74.0 1.1 6.167 24.9 5.3 0.277 1.1 27.6
2002-03 18.624 71.6 1.4 6.921 26.6 12.2 0.473 1.8 70.8
2003-04 20.556 73.5 10.4 6.724 24.1 - 2.8 0.678 2.4 43.3
2004-05 21.567 71.1 4.9 8.222 27.1 22.3 0.548 1.8 -19.2
2005-06 20.435 68.0 - 5.2 8.944 29.7 8.8 0.687 2.3 25.4
2006-07 21.014 67.2 2.8 9.808 31.4 9.7 0.463 1.5 -32.6
2007-08 21.586 63.5 2.7 11.788 34.7 20.2 0.606 1.8 30.9
2008-09 21.308 65.7 - 1.3 10.114 31.2 -14.2 0.999 3.1 64.9
2009-10(p) 22.338 65.6 4.8 10.526 30.9 4.1 1.207 3.5 20.8
Table 12
Courtesy: India Coal Statistics
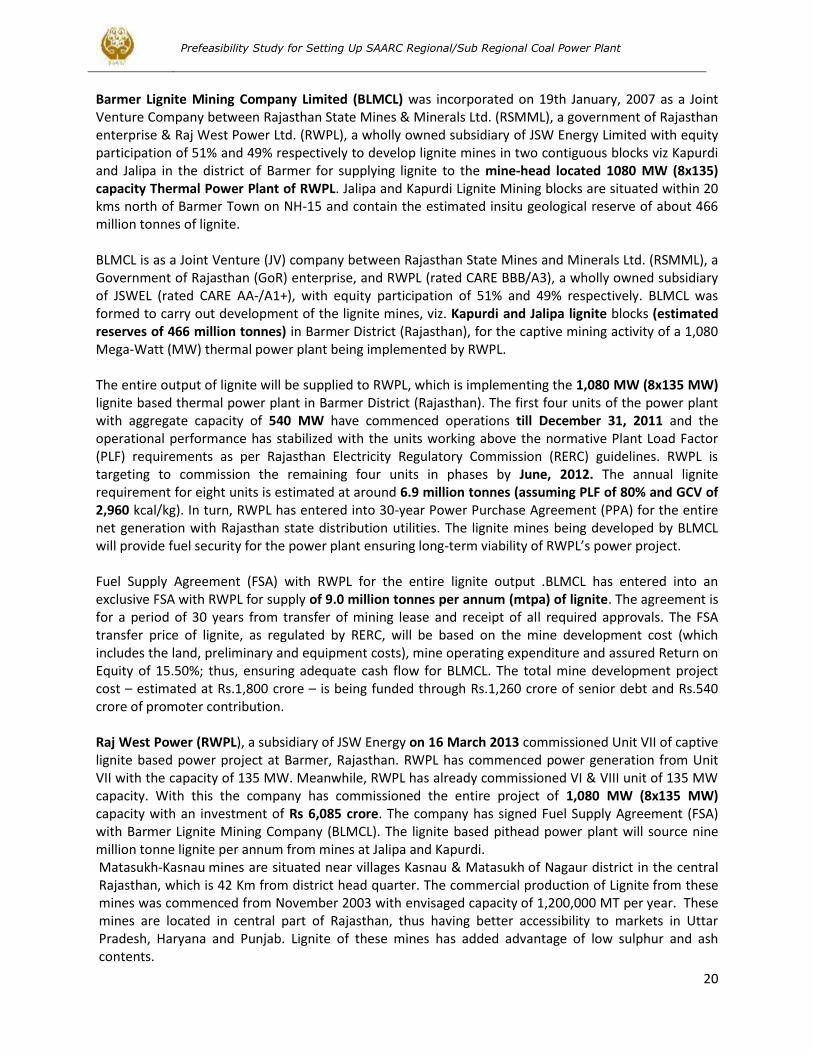
Table 2.3.5: Specifications of Lignite India (Rajhastan-Gujarat)
Prefeasibility Study for Setting Up SAARC Regional/Sub Regional Coal Power Plant
19
Grade Rajpardi "A" Tadkeshwar "A" Mata No Madh "A" Bhavnagar "A"
Moisture 25 to 30% 25 to 30% 30 to 40% 30 to 40%
Ash 08 to 12% 08 to 12% 18 to 23% 18 to 23%
Volatile Matter
25 to 30% 25 to 30% 30 to 35% 30 to 35%
Fixed Carban 25 to 32% 25 to 32% 18 to 20% 18 to 20%
C.V. +3000. K.cal / Kg. +3000. K.cal / Kg. 2500 to 3000 K.cal /
Kg. 2500 to 3000 K.cal /
Kg.
Sulphur up to -- -- 5.00%
Table 13
Courtesy: India Coal Statistics
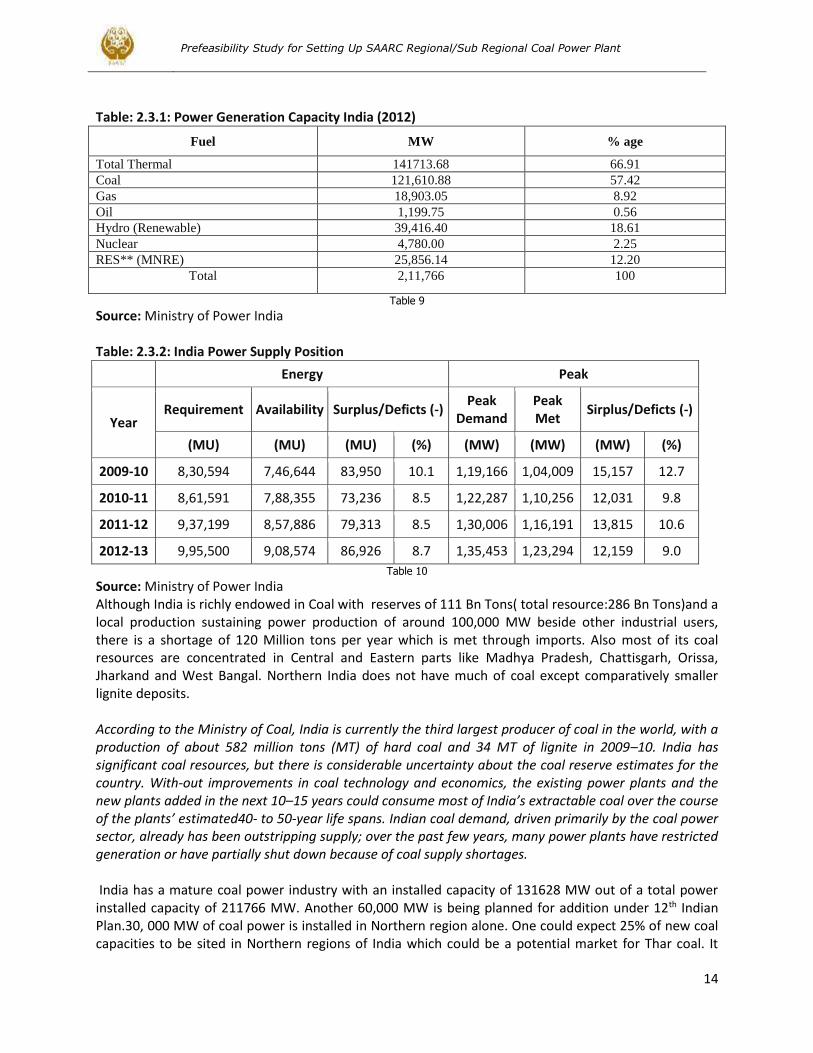
Although India produces mostly (95%) bituminous and sub-bituminous coal, some 35 Million tons/yr (5% of total Coal) of Lignite is also produced, mainly for power production. There is a lignite resource base of around 40 Billion Tons out of which, 31.78 Billion tons is in Tamil Nadu,4.485 Billion tons in Rajasthan and 2.66 Billion tons in Gujarat. Despite lower resource base, Lignite production in Gujarat is comparatively higher (10 Mn tons/yr) as opposed to 1.2 million tons in Rajasthan. In Gujarat , significant quantities of Lignite are also consumed in Industries including cement industry. Elsewhere in India, Lignite is principally used in Power production. Lignite based Power Projects in Pipeline in Gujarat 500 MW power plant at Bhavnagar Setting up of power project at Bhavnagar in JV with 7 other PSUs of Govt. of Gujarat. JVC to implement the project has already been incorporated in the name of M/s. Bhavnagar Energy Co. Ltd. Mining will be carried out by GMDC as the Mine operator. 125 MW Power Project Setting up of power plant based on lignite of Tadkeshwar mines of GMDC in JV with M/s. Gujarat Refoils & Solvents Limited, Ahmedabad. JVC to implement the project has already been incorporated in the name of M/s. Gujarat Gokul Power Limited. Lignite Projects in Rajasthan The state of Rajasthan is endowed with large lignite deposits in the country after Tamilnadu & Gujarat. In the three districts of the state viz. Bikaner, Nagaur and Barmer, geological reserves of more than one billion tonnes have been confirmed so far by exploratory drilling. Beside, deep seated reserves of lignite suitable for underground lignite gasification also exists in the state. The state is also having lignite blocks suitable for development of Coal Bed Methane projects. RSMML is a State Government Enterprise involved with the work of development of Lignite deposit for mercantile sale in cement, textile, brick kiln etc industries and for the ultimate end use of power generation by open cast mining or underground lignite gasification. RSMML at present is operating two lignite mines one at Giral in district Barmer and another at Kasnau-Matasukh in district Nagaur. Giral mine is situated near village Giral, 43 Km from Barmer district in western Rajasthan. Giral mines, the first modern OPENCAST Lignite mine in Rajasthan (after closure of Palana underground mine in 1967) was started by the erstwhile RSMDC in the year 1994. The commercial production of Lignite from this mine, with envisaged capacity of 300,000 MT per year, was started in May 1995
Prefeasibility Study for Setting Up SAARC Regional/Sub Regional Coal Power Plant
20
Barmer Lignite Mining Company Limited (BLMCL) was incorporated on 19th January, 2007 as a Joint Venture Company between Rajasthan State Mines & Minerals Ltd. (RSMML), a government of Rajasthan enterprise & Raj West Power Ltd. (RWPL), a wholly owned subsidiary of JSW Energy Limited with equity participation of 51% and 49% respectively to develop lignite mines in two contiguous blocks viz Kapurdi and Jalipa in the district of Barmer for supplying lignite to the mine-head located 1080 MW (8x135) capacity Thermal Power Plant of RWPL. Jalipa and Kapurdi Lignite Mining blocks are situated within 20 kms north of Barmer Town on NH-15 and contain the estimated insitu geological reserve of about 466 million tonnes of lignite. BLMCL is as a Joint Venture (JV) company between Rajasthan State Mines and Minerals Ltd. (RSMML), a Government of Rajasthan (GoR) enterprise, and RWPL (rated CARE BBB/A3), a wholly owned subsidiary of JSWEL (rated CARE AA-/A1+), with equity participation of 51% and 49% respectively. BLMCL was formed to carry out development of the lignite mines, viz. Kapurdi and Jalipa lignite blocks (estimated reserves of 466 million tonnes) in Barmer District (Rajasthan), for the captive mining activity of a 1,080 Mega-Watt (MW) thermal power plant being implemented by RWPL. The entire output of lignite will be supplied to RWPL, which is implementing the 1,080 MW (8x135 MW) lignite based thermal power plant in Barmer District (Rajasthan). The first four units of the power plant with aggregate capacity of 540 MW have commenced operations till December 31, 2011 and the operational performance has stabilized with the units working above the normative Plant Load Factor (PLF) requirements as per Rajasthan Electricity Regulatory Commission (RERC) guidelines. RWPL is targeting to commission the remaining four units in phases by June, 2012. The annual lignite requirement for eight units is estimated at around 6.9 million tonnes (assuming PLF of 80% and GCV of 2,960 kcal/kg). In turn, RWPL has entered into 30-year Power Purchase Agreement (PPA) for the entire net generation with Rajasthan state distribution utilities. The lignite mines being developed by BLMCL will provide fuel security for the power plant ensuring long-term viability of RWPL’s power project. Fuel Supply Agreement (FSA) with RWPL for the entire lignite output .BLMCL has entered into an exclusive FSA with RWPL for supply of 9.0 million tonnes per annum (mtpa) of lignite. The agreement is for a period of 30 years from transfer of mining lease and receipt of all required approvals. The FSA transfer price of lignite, as regulated by RERC, will be based on the mine development cost (which includes the land, preliminary and equipment costs), mine operating expenditure and assured Return on Equity of 15.50%; thus, ensuring adequate cash flow for BLMCL. The total mine development project cost – estimated at Rs.1,800 crore – is being funded through Rs.1,260 crore of senior debt and Rs.540 crore of promoter contribution. Raj West Power (RWPL), a subsidiary of JSW Energy on 16 March 2013 commissioned Unit VII of captive lignite based power project at Barmer, Rajasthan. RWPL has commenced power generation from Unit VII with the capacity of 135 MW. Meanwhile, RWPL has already commissioned VI & VIII unit of 135 MW capacity. With this the company has commissioned the entire project of 1,080 MW (8x135 MW) capacity with an investment of Rs 6,085 crore. The company has signed Fuel Supply Agreement (FSA) with Barmer Lignite Mining Company (BLMCL). The lignite based pithead power plant will source nine million tonne lignite per annum from mines at Jalipa and Kapurdi. Matasukh-Kasnau mines are situated near villages Kasnau & Matasukh of Nagaur district in the central Rajasthan, which is 42 Km from district head quarter. The commercial production of Lignite from these mines was commenced from November 2003 with envisaged capacity of 1,200,000 MT per year. These mines are located in central part of Rajasthan, thus having better accessibility to markets in Uttar Pradesh, Haryana and Punjab. Lignite of these mines has added advantage of low sulphur and ash contents.
Prefeasibility Study for Setting Up SAARC Regional/Sub Regional Coal Power Plant
21
Table 2.3.6: Salient data on Rajasthan Lignite Reserves
Reserves Depth Sm. thickness CV Ash
Location: District Bikanaer Mn Tons meters Meters kCal/kg %
1 Palana 23.57 40-98 18 3200-3500 2.4-10
2 Barsingsar 77.83 67 6.3-45 3000 2.4-10
3 Gurha 50 38-148 20-26.9 2867 11.9
4 Bithnok 78 100-150 14-Feb 2500 15-20
5 District Barmer
5 Kapudi 150.7 60 4.85 2000-3000
6 Jalipa 316 46-180 0.5-17.35 2000-3500 20-30
7 Bothia 151.67 46-180 0.5-17.35 2000-3500 20-30
8 Giral 101.91 101 2000-4000
9 Sonari 43.59 11.7-198 0.6-6.4 2270 22
District Nagaur
10 Merta Road 83.2 69-120 3.2 2684 14.63
11 Mokala 36.56 46-134 0.8-12.54 2837 12 Table 14
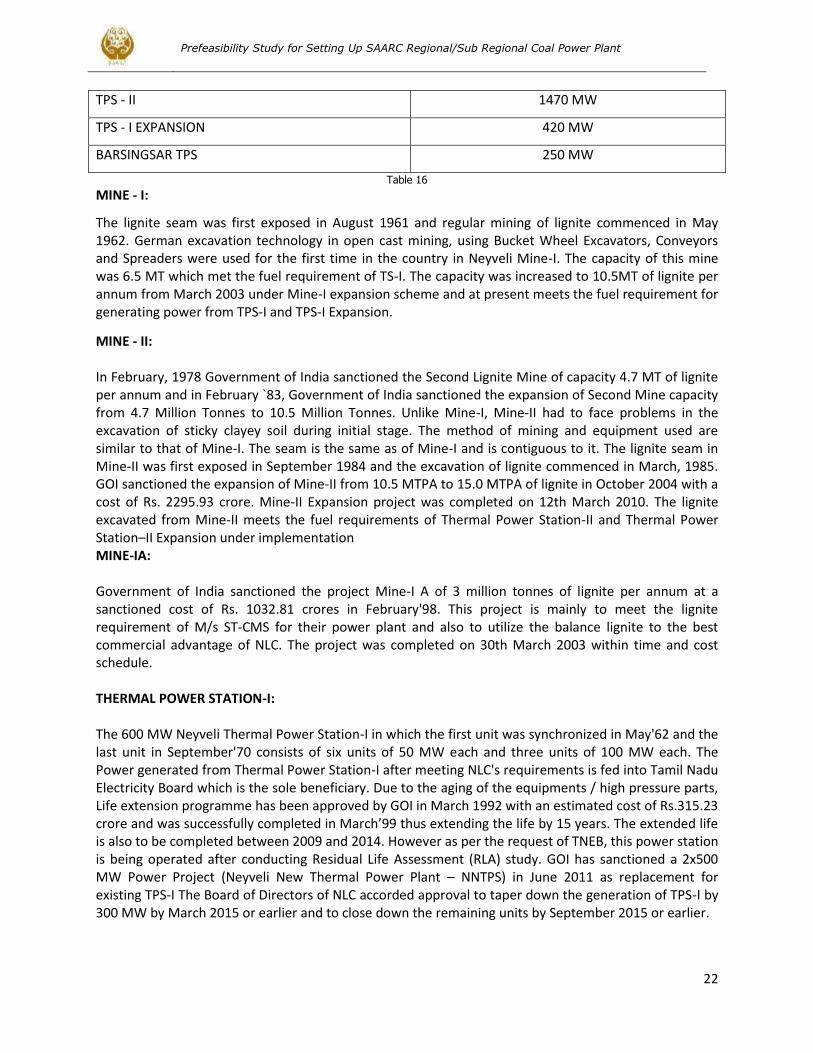
Source: Coal India (Table compiled by the author) Neyveli Lignite Corporation NLC Projects data The main core activity of NLC is Lignite Excavation and power generation using lignite excavated. NLC is having lignite mining units named as Mine I, Mine II, Mine IA and Barsingsar Mine. Also raw lignite is being sold to small scale industries to use it as fuel in their production activities.
MINES CAPACITY
MINE I 10.5 MT / A
MINE I A 3 MT / A
MINE II 15.0 MT / A
BARSINGSAR MINE 2.1 MT / A
Table 15
NLC is generating power in its Thermal Power Station I, Thermal Power Station -II and in Thermal Power Station I Expansion. All the southern states are beneficiaries of this power generation project. NLC is started generating power in Barsingsar Power Station also.
THERMAL UNITS CAPACITY
TPS - I 600 MW
Prefeasibility Study for Setting Up SAARC Regional/Sub Regional Coal Power Plant
22
TPS - II 1470 MW
TPS - I EXPANSION 420 MW
BARSINGSAR TPS 250 MW
Table 16 MINE - I:
The lignite seam was first exposed in August 1961 and regular mining of lignite commenced in May 1962. German excavation technology in open cast mining, using Bucket Wheel Excavators, Conveyors and Spreaders were used for the first time in the country in Neyveli Mine-I. The capacity of this mine was 6.5 MT which met the fuel requirement of TS-I. The capacity was increased to 10.5MT of lignite per annum from March 2003 under Mine-I expansion scheme and at present meets the fuel requirement for generating power from TPS-I and TPS-I Expansion.
MINE - II: In February, 1978 Government of India sanctioned the Second Lignite Mine of capacity 4.7 MT of lignite per annum and in February `83, Government of India sanctioned the expansion of Second Mine capacity from 4.7 Million Tonnes to 10.5 Million Tonnes. Unlike Mine-I, Mine-II had to face problems in the excavation of sticky clayey soil during initial stage. The method of mining and equipment used are similar to that of Mine-I. The seam is the same as of Mine-I and is contiguous to it. The lignite seam in Mine-II was first exposed in September 1984 and the excavation of lignite commenced in March, 1985. GOI sanctioned the expansion of Mine-II from 10.5 MTPA to 15.0 MTPA of lignite in October 2004 with a cost of Rs. 2295.93 crore. Mine-II Expansion project was completed on 12th March 2010. The lignite excavated from Mine-II meets the fuel requirements of Thermal Power Station-II and Thermal Power Station–II Expansion under implementation MINE-IA: Government of India sanctioned the project Mine-I A of 3 million tonnes of lignite per annum at a sanctioned cost of Rs. 1032.81 crores in February'98. This project is mainly to meet the lignite requirement of M/s ST-CMS for their power plant and also to utilize the balance lignite to the best commercial advantage of NLC. The project was completed on 30th March 2003 within time and cost schedule. THERMAL POWER STATION-I: The 600 MW Neyveli Thermal Power Station-I in which the first unit was synchronized in May'62 and the last unit in September'70 consists of six units of 50 MW each and three units of 100 MW each. The Power generated from Thermal Power Station-I after meeting NLC's requirements is fed into Tamil Nadu Electricity Board which is the sole beneficiary. Due to the aging of the equipments / high pressure parts, Life extension programme has been approved by GOI in March 1992 with an estimated cost of Rs.315.23 crore and was successfully completed in March’99 thus extending the life by 15 years. The extended life is also to be completed between 2009 and 2014. However as per the request of TNEB, this power station is being operated after conducting Residual Life Assessment (RLA) study. GOI has sanctioned a 2x500 MW Power Project (Neyveli New Thermal Power Plant – NNTPS) in June 2011 as replacement for existing TPS-I The Board of Directors of NLC accorded approval to taper down the generation of TPS-I by 300 MW by March 2015 or earlier and to close down the remaining units by September 2015 or earlier.
Prefeasibility Study for Setting Up SAARC Regional/Sub Regional Coal Power Plant
23
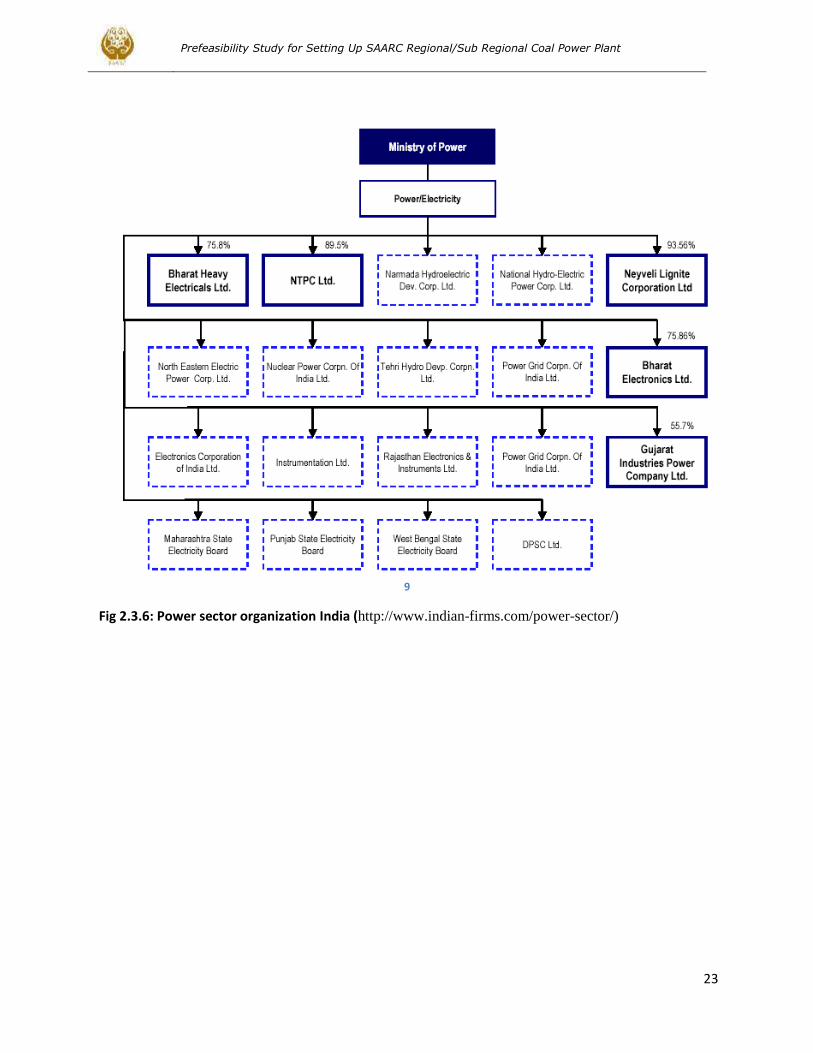
9
Fig 2.3.6: Power sector organization India (http://www.indian-firms.com/power-sector/)
Prefeasibility Study for Setting Up SAARC Regional/Sub Regional Coal Power Plant
24
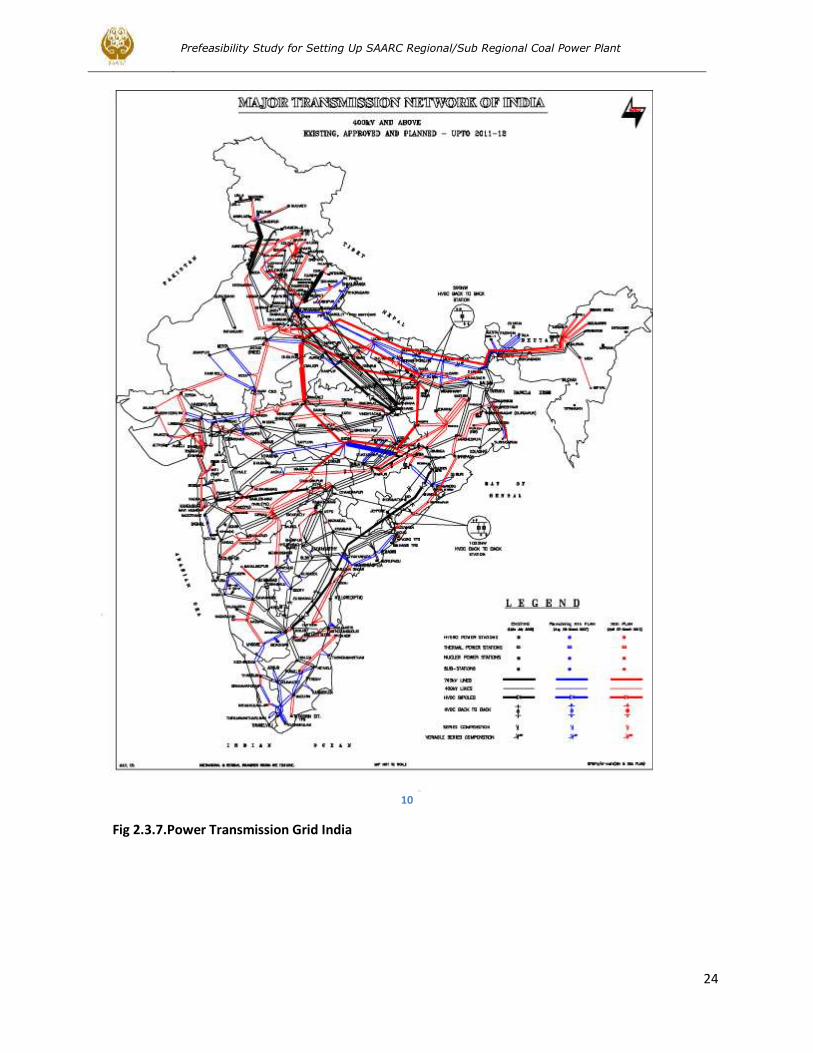
10
Fig 2.3.7.Power Transmission Grid India

Prefeasibility Study for Setting Up SAARC Regional/Sub Regional Coal Power Plant
25
2.4. Bangladesh Power Sector Review
Bangladesh is in the midst of a severe and worsening energy crisis. About half of the country’s 162 million people have access to electricity and those that do have access suffer from frequent power cuts. Lack of available power is a barrier to the development of industry and also impedes agricultural production due to restrictions on crop irrigation in the dry season. It is widely accepted that the availability of electricity is a necessary condition for sustainable economic and human development. For countries such as Bangladesh, which have relatively low per capita electricity consumption, small increases in electricity consumption are associated with substantial improvements in education, life expectancy and levels of income. The Government of Bangladesh has prioritised the increase in electricity availability as key to achieving many of its objectives including poverty alleviation and the Millennium Development Goals.
Energy and power Sources Of the ~ 4,000 MW electricity produced 90% is generated by natural gas. An additional 1,200 MW captive power production is taking place. Of this, 95% is generated by the use of gas. Imported oil and coal are the main two alternative sources of energy production. Renewable energy produces close to 20 MW of electricity with solar being the dominant source. Bangladesh's current generating capacity is largely (89%) fuelled by gas and there are insufficient reserves to support current demand let alone a meaningful increase in capacity. In contrast, Bangladesh has substantial reserves of high quality coal and this provides the fastest, lowest risk and most reliable means of delivering a step change in electricity availability for the people of Bangladesh .
Per capita power generation is “183 kWh and it is among the lowest in the world. Energy intensity (kgOe/US$) is only 0.29 — e.g. less than half of India. Despite high growth rates only a few hundred MW has been added to the power grid over the last 7 years. Today ‘4,000 MW is produced, while demand is soaring around 6,000 MW and growing at ~ 50O MW a year. 1,800 MMCFD of gas is produced. Demand Is 2.300 MMCFD. Table 2.4.1: Present Generation Capacity in Bangladesh (MW) 2012
Public Sector Generation Capacity (MW)
BPDB 3700
APSCL 682
EGCB 210
NWPGCL 150
RPCL 52
Subtotal 4794(56%)
Private Sector
IPPs 1297
SIPPs(BPDB) 99
SIPPs(REB) 226
15 YR. Rental 169
3/5 YR. Rental 558
Quick Rental 1382
Subtotal 3731(44%)
TOTAL 8525
MAXIMUM DEMAND SERVED FAR 6350 MW Table 17
Source: Bangladesh Power Development Board (BPDB)
Prefeasibility Study for Setting Up SAARC Regional/Sub Regional Coal Power Plant
26
Table 2.4.2: Energy and Power Source
Energy and Power Source Source use 2008
Natural Gas 600 bcf
Oil 3.7 mil. Tons
Coal 3.5 mil. Tons
Hydro 1.0 Twh
Biomass 55 mil. Tons
Solar PV 18 MW
Wind 1 MW
Table 18
Source: Source: An Overview of Power Sector of Bangladesh
www.usea.org/sites/default/files/event-file/493/overviewofbpdb.pdf Table 2.4.3. : Existing Major Generating Stations
Barapukuria 250 MW
Mym.nsingh 210 MW
Shahjibazar 8 Fenchuganj 300 MW
Baghabari 261 MW
Ashuganj 724 MW
Ghorasal 950 MW
Tongi 105 MW
Meghna, Haripur& Siddirganj 1300 MW
Khulna 270 MW
Barisal 40 MW
Raujan & Sikolbaha 600 MW
Kaptai 230 MW
Table 19
Source: An Overview of Power Sector of Bangladesh
www.usea.org/sites/default/files/event-file/493/overviewofbpdb.pdf Government of Bangladesh has announced the following projects to be undertaken in the next few years. 3 combined cycle power plants of aggregated capacity of 1,125 MW. 2 peak power plants of capacity of 100 MW each. 4 coal based steam plant with total capacity of 2,000-2,600 MW. Renewable energy based power plants of capacity of 110 MW (including one 100 MW wind park); One LNG terminal with 3.5 millions tons capacity; Further off-shore gas exploration and extraction. A prequalification notice for a 300-450 MW dual fuel combined cycle powered power plant was released end of January
Prefeasibility Study for Setting Up SAARC Regional/Sub Regional Coal Power Plant
27
2010 and a number of initiatives regarding setting up peak power plants and rented power plants have also been initiated. Coal Resources 5 coal fields are identified in Bangladesh. Known resources are around 2,700 mil. tons. The country still awaits the adoption of a national coal policy before any coal extraction will take place. Major political debate takes place over extraction methods etc. One coal-fired power plant exists, but it is only running at half of its installed capacity (250MW). Bangladesh Coal Power Company is under formation. The company has mandate to facilitate setting up four coal-fired power plants to generate 2,000 MW of electricity. Plants will be set up under PPP where government will only hold a fraction of shares for offering land and infrastructure. The four plants are expected to cost USD 3 billion and will be running on imported coal until coal extractions starts In Bangladesh. Three million tonnes of Phulbari coal can supply a 1,000MW coal fired power station. GCM has made a proposal for a 1,000 MW coal fired power plant at the mine mouth, which could be increased to 2,000MW capacity. At peak production, Phulbari Coal Mine will produce 12 million tonnes of thermal coal which could either substitute imported coal or support new generation capacity of 4,000MW. At full production, coal mined at Phulbari could support generating capacity of 4,800MW, compared with current peak generation of 4,800MW.
Road Map for Coal Power Development (as of 2030) Domestic Coal K-D-P 6x1 000 MW USC K-D-P 8x 600 MW USC Imported Coal Meghnaghat 2x600MW Zajira/New Meg 3x600MW Chittagong 3x660MW Moheshkhali/Matarbari 4x600MW Khulna 2x660MW Total 19,200MW (New)
Source: An Overview of Power Sector of Bangladesh
www.usea.org/sites/default/files/event-file/493/overviewofbpdb.pdf
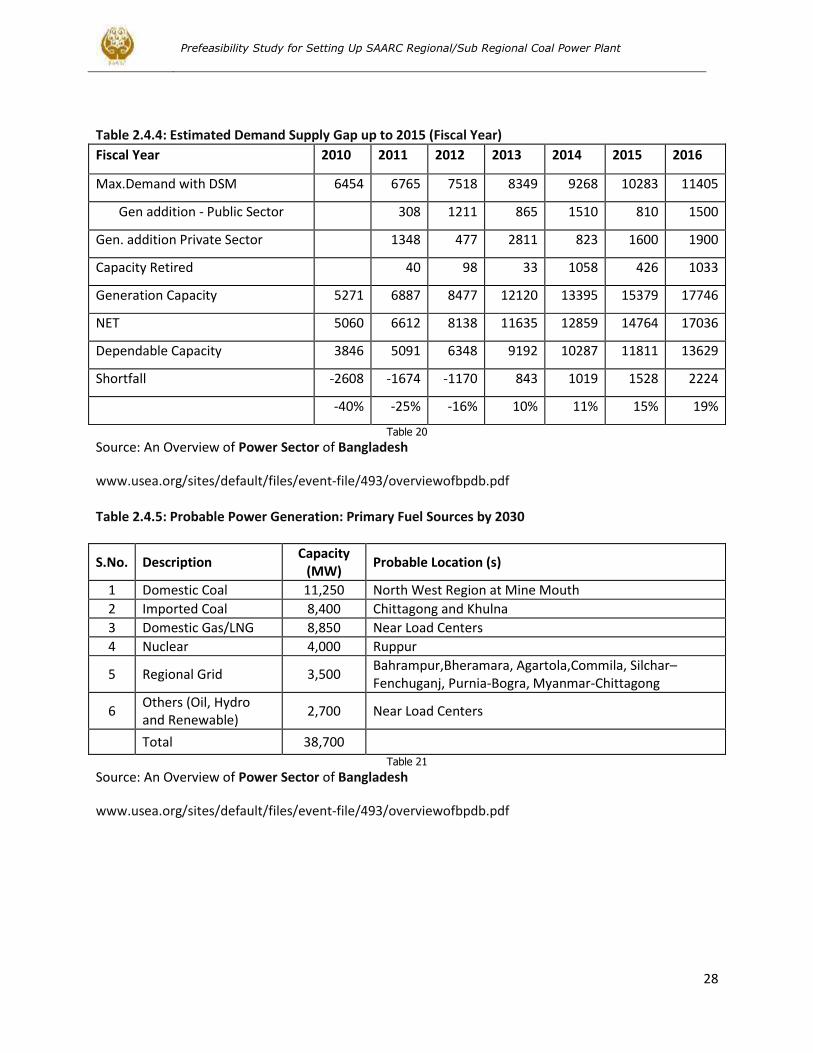
Prefeasibility Study for Setting Up SAARC Regional/Sub Regional Coal Power Plant
28
Table 2.4.4: Estimated Demand Supply Gap up to 2015 (Fiscal Year)
Fiscal Year 2010 2011 2012 2013 2014 2015 2016
Max.Demand with DSM 6454 6765 7518 8349 9268 10283 11405
Gen addition - Public Sector
308 1211 865 1510 810 1500
Gen. addition Private Sector
1348 477 2811 823 1600 1900
Capacity Retired
40 98 33 1058 426 1033
Generation Capacity 5271 6887 8477 12120 13395 15379 17746
NET 5060 6612 8138 11635 12859 14764 17036
Dependable Capacity 3846 5091 6348 9192 10287 11811 13629
Shortfall -2608 -1674 -1170 843 1019 1528 2224
-40% -25% -16% 10% 11% 15% 19%
Table 20
Source: An Overview of Power Sector of Bangladesh
www.usea.org/sites/default/files/event-file/493/overviewofbpdb.pdf Table 2.4.5: Probable Power Generation: Primary Fuel Sources by 2030
S.No. Description Capacity
(MW) Probable Location (s)
1 Domestic Coal 11,250 North West Region at Mine Mouth
2 Imported Coal 8,400 Chittagong and Khulna
3 Domestic Gas/LNG 8,850 Near Load Centers
4 Nuclear 4,000 Ruppur
5 Regional Grid 3,500 Bahrampur,Bheramara, Agartola,Commila, Silchar–Fenchuganj, Purnia-Bogra, Myanmar-Chittagong
6 Others (Oil, Hydro and Renewable)
2,700 Near Load Centers
Total 38,700
Table 21
Source: An Overview of Power Sector of Bangladesh
www.usea.org/sites/default/files/event-file/493/overviewofbpdb.pdf
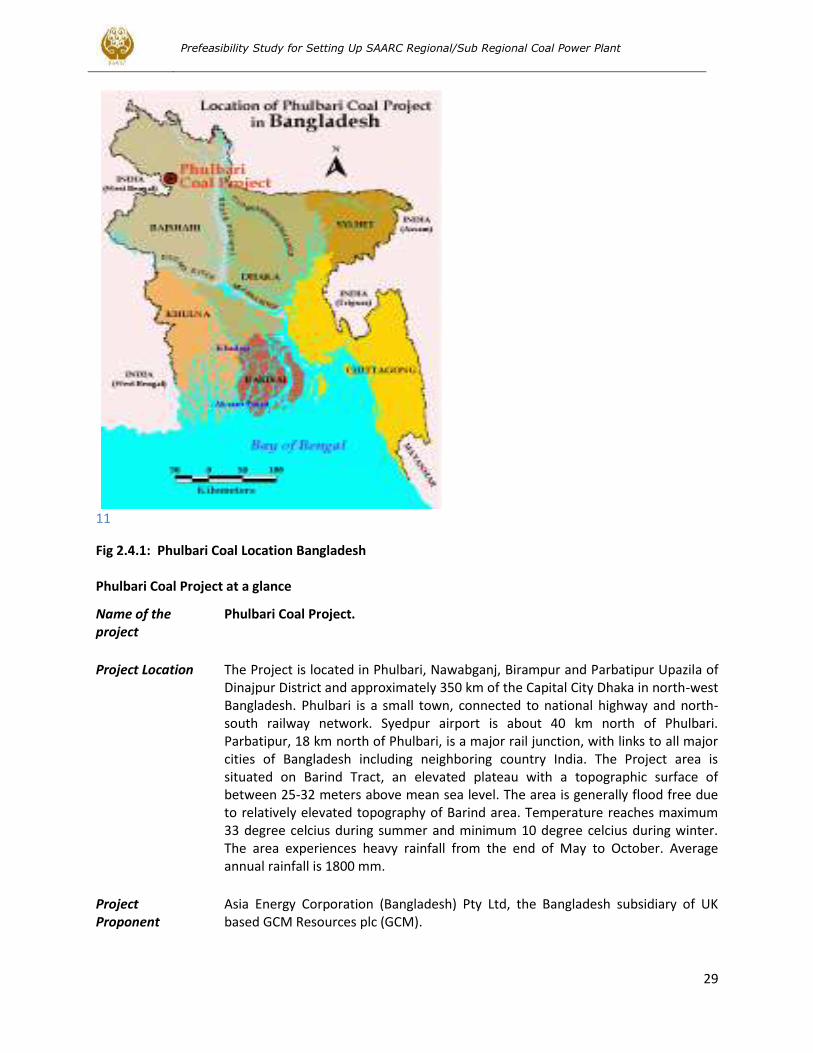
Prefeasibility Study for Setting Up SAARC Regional/Sub Regional Coal Power Plant
29
11
Fig 2.4.1: Phulbari Coal Location Bangladesh Phulbari Coal Project at a glance
Name of the project
Phulbari Coal Project.
Project Location The Project is located in Phulbari, Nawabganj, Birampur and Parbatipur Upazila of Dinajpur District and approximately 350 km of the Capital City Dhaka in north-west Bangladesh. Phulbari is a small town, connected to national highway and north-south railway network. Syedpur airport is about 40 km north of Phulbari. Parbatipur, 18 km north of Phulbari, is a major rail junction, with links to all major cities of Bangladesh including neighboring country India. The Project area is situated on Barind Tract, an elevated plateau with a topographic surface of between 25-32 meters above mean sea level. The area is generally flood free due to relatively elevated topography of Barind area. Temperature reaches maximum 33 degree celcius during summer and minimum 10 degree celcius during winter. The area experiences heavy rainfall from the end of May to October. Average annual rainfall is 1800 mm.
Project Proponent
Asia Energy Corporation (Bangladesh) Pty Ltd, the Bangladesh subsidiary of UK based GCM Resources plc (GCM).
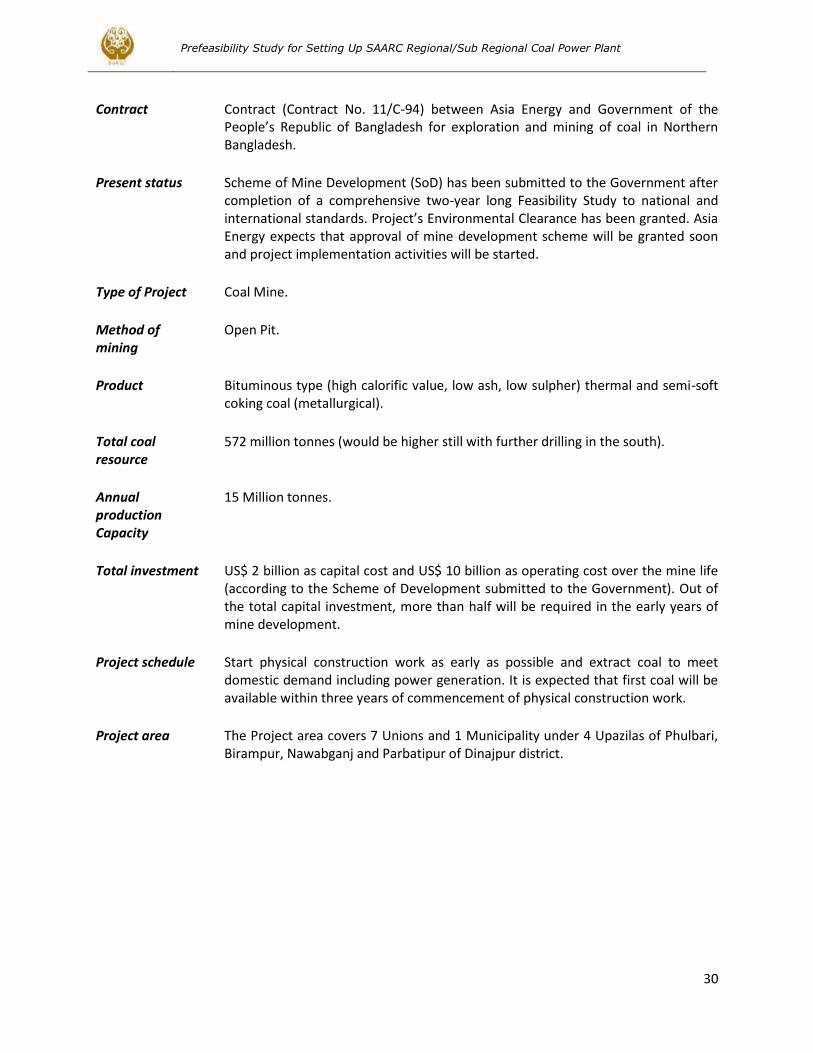
Prefeasibility Study for Setting Up SAARC Regional/Sub Regional Coal Power Plant
30
Contract Contract (Contract No. 11/C-94) between Asia Energy and Government of the People’s Republic of Bangladesh for exploration and mining of coal in Northern Bangladesh.
Present status Scheme of Mine Development (SoD) has been submitted to the Government after completion of a comprehensive two-year long Feasibility Study to national and international standards. Project’s Environmental Clearance has been granted. Asia Energy expects that approval of mine development scheme will be granted soon and project implementation activities will be started.
Type of Project Coal Mine.
Method of mining
Open Pit.
Product Bituminous type (high calorific value, low ash, low sulpher) thermal and semi-soft coking coal (metallurgical).
Total coal resource
572 million tonnes (would be higher still with further drilling in the south).
Annual production Capacity
15 Million tonnes.
Total investment US$ 2 billion as capital cost and US$ 10 billion as operating cost over the mine life (according to the Scheme of Development submitted to the Government). Out of the total capital investment, more than half will be required in the early years of mine development.
Project schedule Start physical construction work as early as possible and extract coal to meet domestic demand including power generation. It is expected that first coal will be available within three years of commencement of physical construction work.
Project area The Project area covers 7 Unions and 1 Municipality under 4 Upazilas of Phulbari, Birampur, Nawabganj and Parbatipur of Dinajpur district.
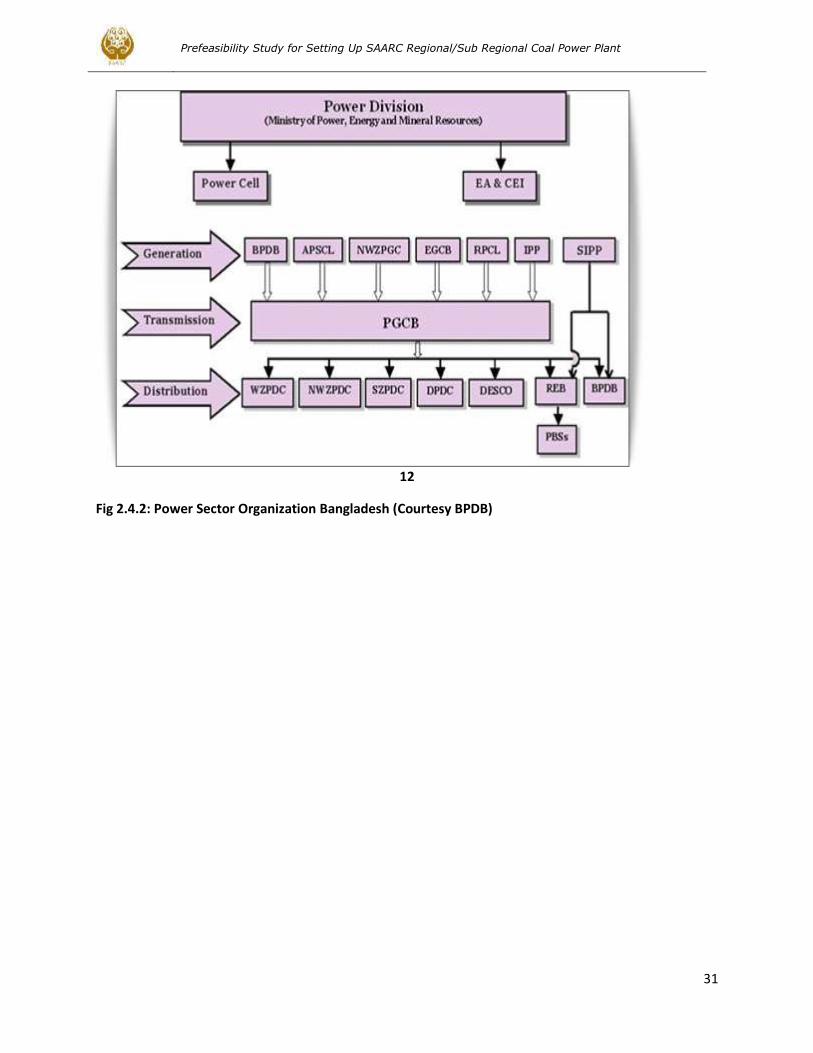
Prefeasibility Study for Setting Up SAARC Regional/Sub Regional Coal Power Plant
31
12
Fig 2.4.2: Power Sector Organization Bangladesh (Courtesy BPDB)
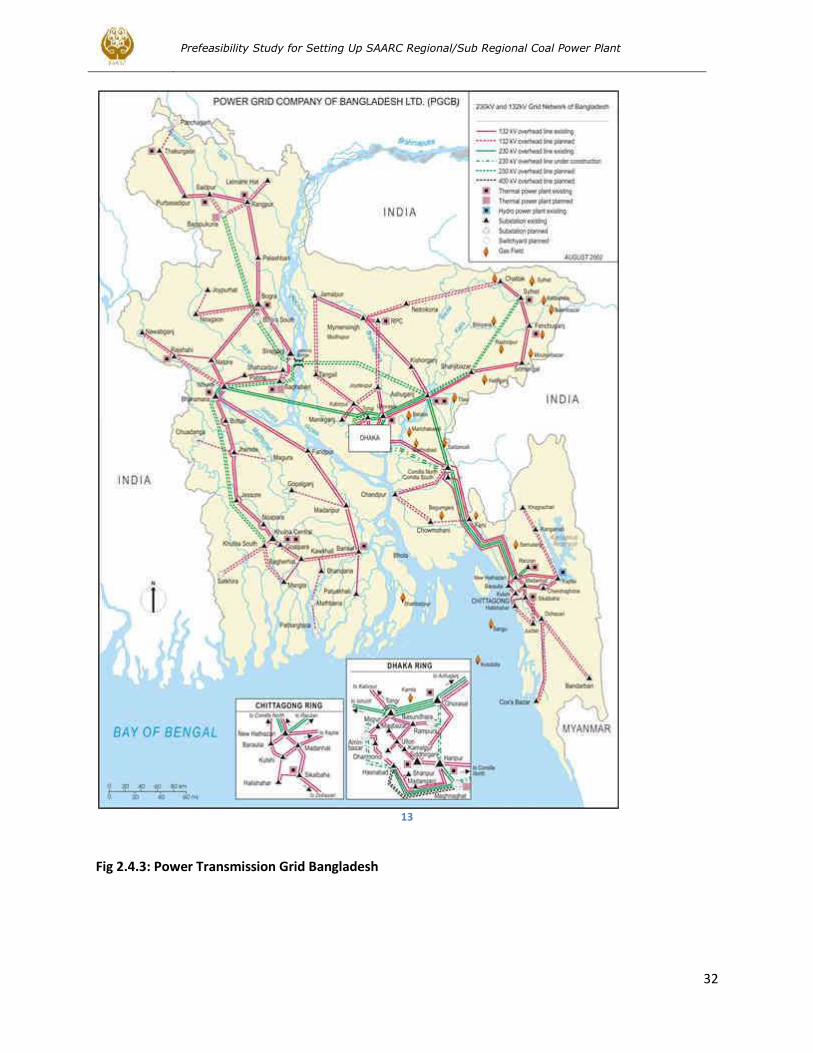
Prefeasibility Study for Setting Up SAARC Regional/Sub Regional Coal Power Plant
32
13
Fig 2.4.3: Power Transmission Grid Bangladesh
Prefeasibility Study for Setting Up SAARC Regional/Sub Regional Coal Power Plant
33
3. Project Location and Logistics We recommend a project under option II of a capacity of 1000 MW initially and to go to a 5-10,000 MW ultimately. The mine to be located around Pakistan border village Gadar and Power plant to be located around Barmer Town in India to be connected by a dedicated Railway Track of estimated length of 50-100 kms. Accordingly an electric transmission line is built to connect power plant with Pakistan transmission network. Both countries build and own the facilities in their own borders. Technical expertise in Lignite mining, however, comes from India to be supplied by the relevant commercial companies .A border office may be built alongside the proposed rail track for holding routine management and coordination meetings and even installing a Training Centre manned by Instructors from India. Similarly, under option 3, Phulbari-Bangladesh project is to be implemented as Phase 2 component; mining to be done at Phulbari and coal transported to Power Plant in India to be installed in Dashkin District. Dedicated Rail and Transmission link to be installed in the same way as in option #2. As detailed siting studies cannot be undertaken at this concept stage, an estimated 70 kms Rail Track, dedicated and especially purpose built for the project has been provided for in CAPEX estimates. A dual track (2X70 kms), two locomotives, 100 Wagons (100 tons each) and two coal terminals (1 loading and 1 off-loading) has been estimated. A CAPEX of 48 Million USD has been estimated which would add 5 USD/ton to coal cost. Current Coal Freight offered by Indian Rail is 1 IRs per ton- km. For a 70 kms, estimated transportation, it means a coal transport cost of 1.4 USD per ton. Coal Freight in the U.S. has varied between 1 to 5 cents per ton-mile in 2008 depending on the routes. Our estimated Freight rate comes out to be 7 cents per ton-kms, which is comparable with the Tariff in the U.S., and is higher than the prevailing rates in Indian Rail which is reportedly subsidized. Adding 5 USD per ton as freight cost means an additional cost component of 12.5 % which does not appear to be very high. A 20 kms per hour speed has been assumed which is fairly conservative against mean speeds of 60 kms per hour for such trains. This means that the tracks may be able to handle 4 times the proposed load for 1000 MW of Coal power.
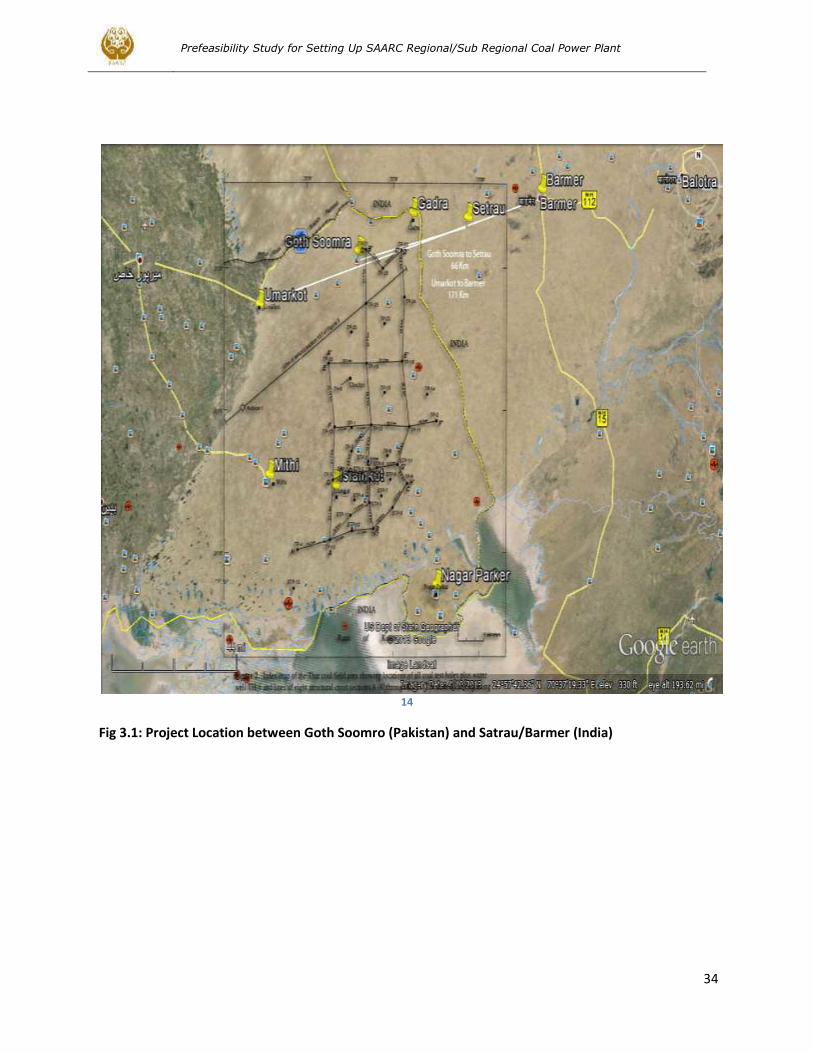
Prefeasibility Study for Setting Up SAARC Regional/Sub Regional Coal Power Plant
34
14
Fig 3.1: Project Location between Goth Soomro (Pakistan) and Satrau/Barmer (India)
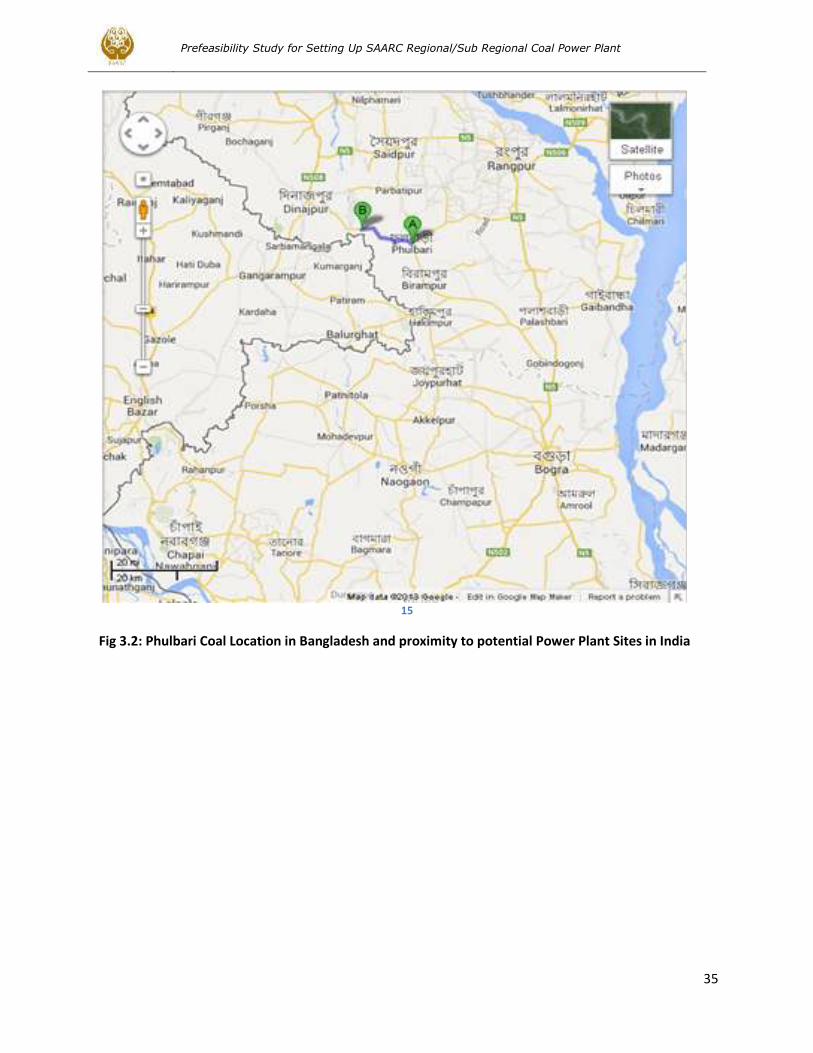
Prefeasibility Study for Setting Up SAARC Regional/Sub Regional Coal Power Plant
35
15
Fig 3.2: Phulbari Coal Location in Bangladesh and proximity to potential Power Plant Sites in India
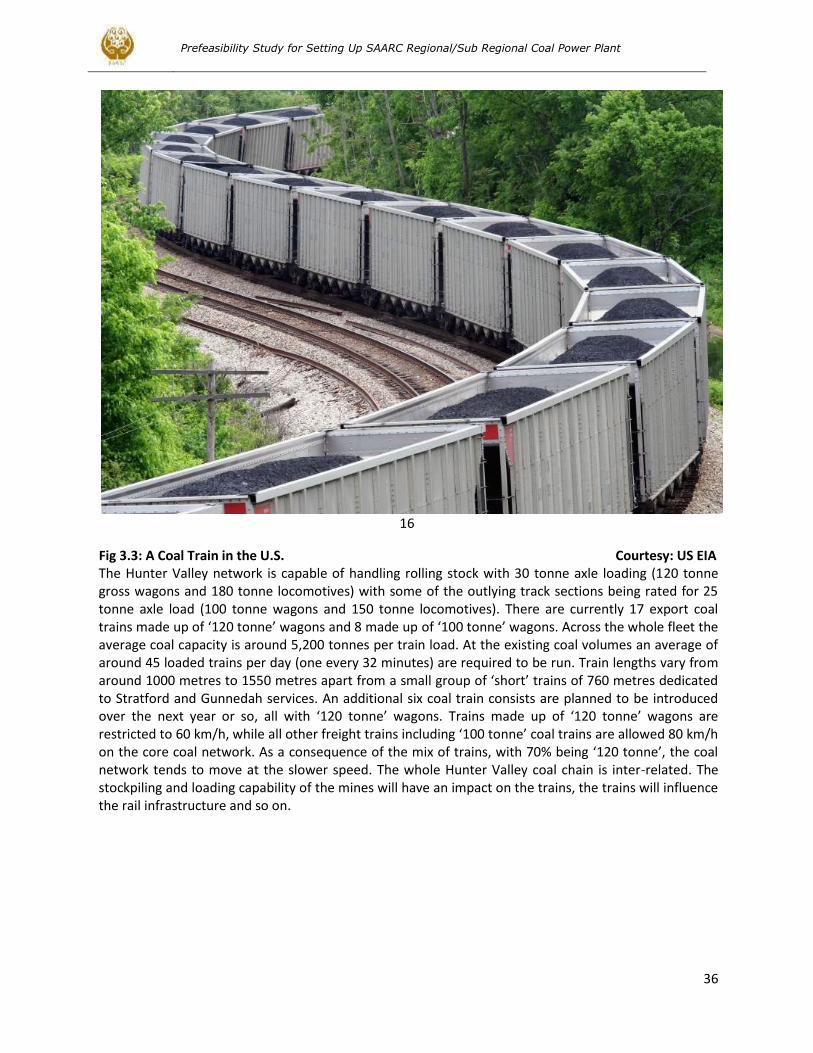
Prefeasibility Study for Setting Up SAARC Regional/Sub Regional Coal Power Plant
36
16
Fig 3.3: A Coal Train in the U.S. Courtesy: US EIA The Hunter Valley network is capable of handling rolling stock with 30 tonne axle loading (120 tonne gross wagons and 180 tonne locomotives) with some of the outlying track sections being rated for 25 tonne axle load (100 tonne wagons and 150 tonne locomotives). There are currently 17 export coal trains made up of ‘120 tonne’ wagons and 8 made up of ‘100 tonne’ wagons. Across the whole fleet the average coal capacity is around 5,200 tonnes per train load. At the existing coal volumes an average of around 45 loaded trains per day (one every 32 minutes) are required to be run. Train lengths vary from around 1000 metres to 1550 metres apart from a small group of ‘short’ trains of 760 metres dedicated to Stratford and Gunnedah services. An additional six coal train consists are planned to be introduced over the next year or so, all with ‘120 tonne’ wagons. Trains made up of ‘120 tonne’ wagons are restricted to 60 km/h, while all other freight trains including ‘100 tonne’ coal trains are allowed 80 km/h on the core coal network. As a consequence of the mix of trains, with 70% being ‘120 tonne’, the coal network tends to move at the slower speed. The whole Hunter Valley coal chain is inter-related. The stockpiling and loading capability of the mines will have an impact on the trains, the trains will influence the rail infrastructure and so on.
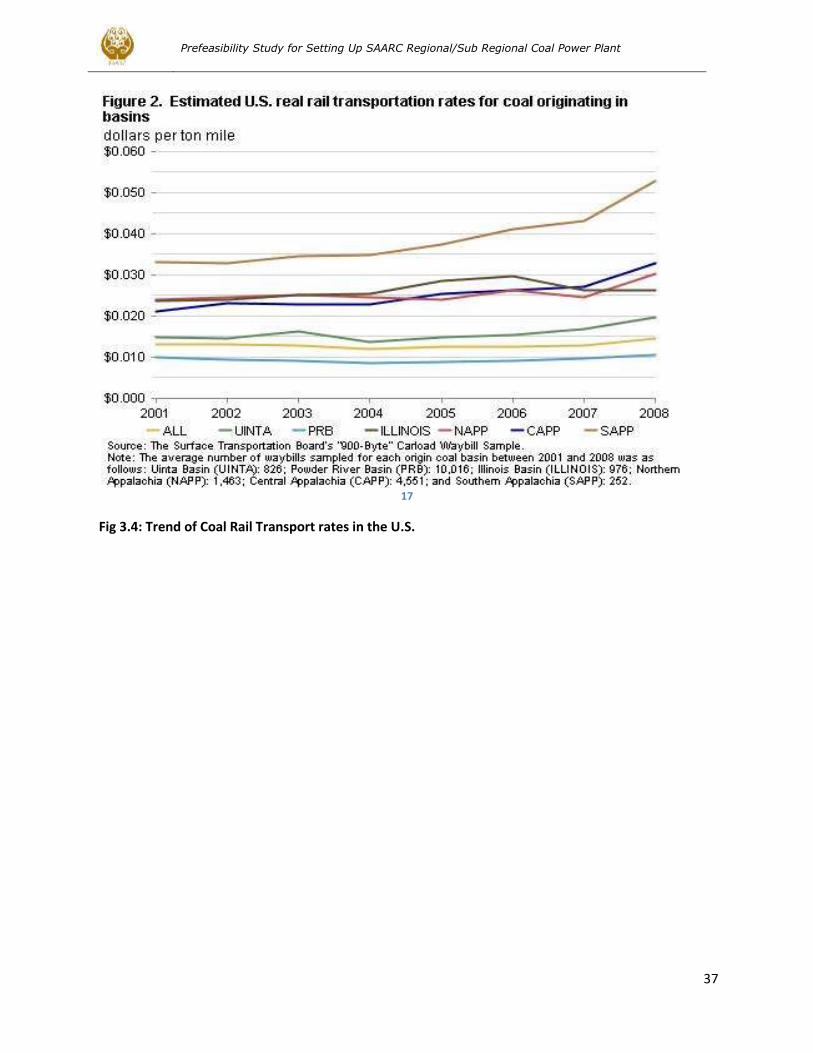
Prefeasibility Study for Setting Up SAARC Regional/Sub Regional Coal Power Plant
37
17
Fig 3.4: Trend of Coal Rail Transport rates in the U.S.

Prefeasibility Study for Setting Up SAARC Regional/Sub Regional Coal Power Plant
38
Table 3.1: Coal Transportation Infrastructure Estimations
Annual Coal Transport tons/yr 7,000,000
Assumed Distance kms 70
Rail; speed kms/hr 20
Loading-unloading hrs 3
Turn-around time hrs 6.5
Round trips per year
1231
Train carrying capacity tons/trip 10000
Locomotive Engines pcs 2
Coal Wagons pcs 100
Railway track-dual kms 140
Unit Price Locomotive USD 4,000,000 2,000,000
Unit Price Coal Wagon 100 t USD 250,000
unit Rail Track USD/km 200,000
Locomotive costs
4,000,000
Wagon costs USD 12,000,000
Rail Track Cost USD 24,000,000
Others
8,000,000
Total rail Infrastructure Cost USD 48,000,000
Coal Transportation Rate USD/t 5
Annual Revenue transport USD 25,000,000
Unit ton km cost cents/ton-kms 0.07
Existing rail coal tariff India Irs/ton-kms 1
Capacity utilization % 40.63 Table 22
Source: Estimates and Compilation by the author CEA India Guidelines for Rail Transport of Coal Coal transportation mode The selection of particular mode of transportation of coal depends on the location of power plant with respect to coal mines/ coal sources and other site conditions. Various transportation means such as rail or other captive systems such as merry go round (MGR), belt conveyors are adopted. For coastal stations, coal is received at ports by ships/barges and transported through belt/pipe conveyor system or rail etc. Most of the power stations receive coal through rail. Power stations located near to the indigenous coal source (i.e. mine mouth) receive coal through their own MGR and those located far away (load centre stations) from the coal mines receive coal rakes through Indian Railway network. Conveyor Belt may also be used as an alternative to MGR. This type of transportation system is preferred when the coal mine or port is close to the power plant.
Prefeasibility Study for Setting Up SAARC Regional/Sub Regional Coal Power Plant
39
The coal received at power station may be unloaded by means of track hopper or wagon tippler or by combination of both depending on the type of wagons (BOBR or Box-N wagons) in the coal rakes expected to be received at the station. BRIEF DESCRIPTION OF COAL HANDLING PLANT SYSTEM Coal unloading system As mentioned above, the coal received at power station may be unloaded by means of wagon tippler or track hopper or by combination of both depending on the type of coal rakes to be used for transportation of coal to the station. Generally coal rake consists of 59 wagons, each wagon carrying payload of 60 tons. The two unloading systems are briefly described below: Track hopper unloading system The coal received through bottom opening bottom release (BOBR) wagon rakes is unloaded in under ground R.C.C. track hopper. Paddle feeders are employed under track hopper to scoop the coal and feeding onto underground reclaim conveyors. Belt weigh scales are provided on these conveyors for measurement of coal flow rate. 2 x 500MW or above) Wagon tippler unloading system The coal received from Box-N wagons is unloaded in underground RCC hoppers by means of rota side type wagon tipplers. Side arm chargers are employed for placement of wagons on the tippler table and removal of empty wagon from tippler table after tippling. Apron feeders are employed under each wagon tippler for extracting coal from wagon tippler hopper and feeding onto underground reclaim conveyors. Belt weigh scales are provided on these conveyors for measurement of coal flow rate. Provision is kept for shunting locomotives for placing the rakes in position for the side arm charger to handle and begin unloading operation. Coal crushing Coal unloaded in the wagon tippler hoppers/track hoppers is conveyed to crusher house by belt conveyors via pent house and transfer points depending on the CHP layout. Suspended magnets are provided on conveyors at pent house for removal of tramp Iron pieces. Metal detectors are also provided to detect non-ferrous materials present in the coal before crushers. In case the sized coal is received, then the coal is sent directly to stockyard and the crusher is by-passed. Conveyors leading to crusher house have facility for manual stone picking, at a suitable location after penthouse. In line magnetic separators are also provided at discharge end of conveyors for removal of remaining metallic ferrous tramp from the coal before it reaches the crushers. Coal sampling unit is provided to sample the uncrushed coal. The size of the coal received is normally (-) 300 mm which may, however, depend on coal tie up. The received coal is sized in crushers (ring granulators) from (-) 300 mm to (-) 20 mm. Screens (vibrating grizzly type or roller screens) provided upstream of the crushers screen out (-) 20 mm coal from the feed and (+) 20 mm coal is fed to the crushers. A set of rod gates and rack & pinion gates is provided before screens to permit maintenance of equipment downstream without affecting the operation of other stream. The crushed coal is either fed to coal bunkers of the boilers or discharged on to conveyors for storage in coal stockyard through conveyors and transfer points.
Prefeasibility Study for Setting Up SAARC Regional/Sub Regional Coal Power Plant
40
Coal Stacking & Reclaiming at Stockyard Crushed coal is sent to stockyard when coal bunkers are full. Stacking/ reclaiming of coal is done by bucket wheel type stacker-cum- reclaimer moving on rails. The stacker-cum- reclaimer can stack coal on either sides of the yard conveyor. During stacking mode coal is fed from conveyors on boom conveyor and while in reclaim mode, boom conveyor discharges coal on the yard conveyor for feeding coal to bunkers through conveyors and transfer points. The yard conveyor can be reversible type depending on layout requirement. When direct unloading from rakes is not in operation, coal is reclaimed by the stacker –cum-reclaimer and fed to the coal bunkers. Emergency reclaim hopper (ERH) can be provided to reclaim coal by dozers when stacker –cum- reclaimer is not in operation. Emergency reclaim hopper can also be used for coal blending. Coal stockpile is provided with required storage capacity depending on location of plant vis-à-vis coal source. Metal detectors and in-line magnetic separators are also provided before feeding to bunkers for removal of metallic ferrous tramp from reclaimed crushed coal. Coal sampling unit is provided to sample crushed coal of (-) 20 mm size. Belt weigh scales are also provided, on conveyors for measurement of flow rate of as fired coal. Dust Control System and Ventilation system The dust control system is required for control of fugitive dust emissions from dust generation points such as transfer points, feeders, crushers etc. Dust control is achieved by dust suppression and extraction system. Dust suppression is achieved by two methods viz. Plain Water Dust Suppression System and Dry Fog Type Dust Suppression System. Ventilation system is provided for all the working areas/ locations/ buildings/ underground structures of CHP. The required ventilation is achieved by mechanical ventilation system/ pressurized ventilation system depending on the area requirement. The pressurized ventilation system is capable of pressurizing slightly above atmospheric pressure to prevent ingress of dust from outside. The MCC/switchgear room areas of coal handling plant are provided with pressurized ventilation system while other areas have mechanical ventilation. The control rooms, office room and RIO (Remote Input/ Output) room are provided with air conditioning system. DESIGN CRITERIA AND BROAD FEATURES Capacity of CHP and Major Equipment i) Peak daily coal requirement shall be met by 14 hrs operating hours of coal handling plant so that balance 10 hrs per day are available for upkeep and maintenance. Ten (10%) percent margin shall be considered over the peak daily coal requirement (based on GCV of worst coal and normative heat rate) for arriving at the rated capacity of the coal handling plant. Margin is provided to take care of the variation in the GCV of the coal received, aging of the equipment and different operating conditions of the CHP equipment. Typically for a 2x500 MW plant, capacity is worked out as under: Plant Capacity 1000 MW Heat Rate 2450 kCal/kWh PLF 100 %
Prefeasibility Study for Setting Up SAARC Regional/Sub Regional Coal Power Plant
41
GCV of Worst Coal 3150 kCal/kg Specific coal requirement 0.78 kg/kWh Daily Coal Requirement 18666.67 Tons Hourly Coal Requirement 777.78 TPH Peak daily coal requirement for BMCR flow 833.00 TPH Working Hours 14 Hrs Plant Capacity 1428.00 TPH Add 10% margin 142.80 TPH Rated Capacity 1570.80 TPH Rated Capacity (rounded off) 1600.00 TPH Typically, two streams of conveyors and equipment shall be provided for coal handling system with rated capacity of 1600 TPH for a 2 x 500 MW power plant. The two streams of conveyors shall be interlinked at transfer points for conveyor changeover for flexibility of operation in the event of breakdown of any conveyer. Rated capacity would vary with calorific value of the coal intended to be used. ii) Capacities of different equipment for 2x500 MW plant shall be under. @ Applicable for track hoppers served by MGR. In case of coal supply by Indian Railways, track hopper capacity may be considered as 6000 MT. Normally a CHP should require only 1x100% S-R for 2x500 MW units. At some sites, depending on layout of stockpiles, 2x100% S-R may be required due to constraint in stock pile length. The Coal Unloading System shall be capable of unloading the rake within the time as stipulated in the latest Commercial Policy (Freight) of Indian Railways. The currently applicable Policy of 2007 stipulates 7 hours unloading time for a coal rake for BOX, BOX-N, BOXNHA etc type wagons and 2 hours 30 min for BOBR type wagons. Wagon Tipplers Wagon tipplers shall be suitable to handle any type of wagons being used by Indian Railways as on date for transportation of coal as per IS-10095 (Latest edition) and shall conform to all stipulations with regard to suitability for handling wagons having width, height and length over coupler faces as indicated by RDSO at the time of approval of wagon tippler drawings. xi) The wagon tippler shall be ‘rotaside’ type suitable to unload a coal wagon by lifting and rotating it sideways. The angle of tip shall be at least 150° giving 60° angle to the side of the wagon for emptying the coal contents into the hopper below. wagon tippler design shall conform to latest edition of G-33 and its amendments issued by RDSO. The tippler shall be designed to allow passage of all standard broad gauge (1676 mm) Indian Railways diesel locomotives over tippler table at creep speed. The tippler shall be designed to accommodate 150 Tons locomotive as per G-33 requirement. An electronic static weighing system shall be provided to measure / record the quantum of coal, wagon wise on the wagon tippler table before & after tippling. It shall have a minimum accuracy of 1% of the gross weight of the wagon. Side arm charger
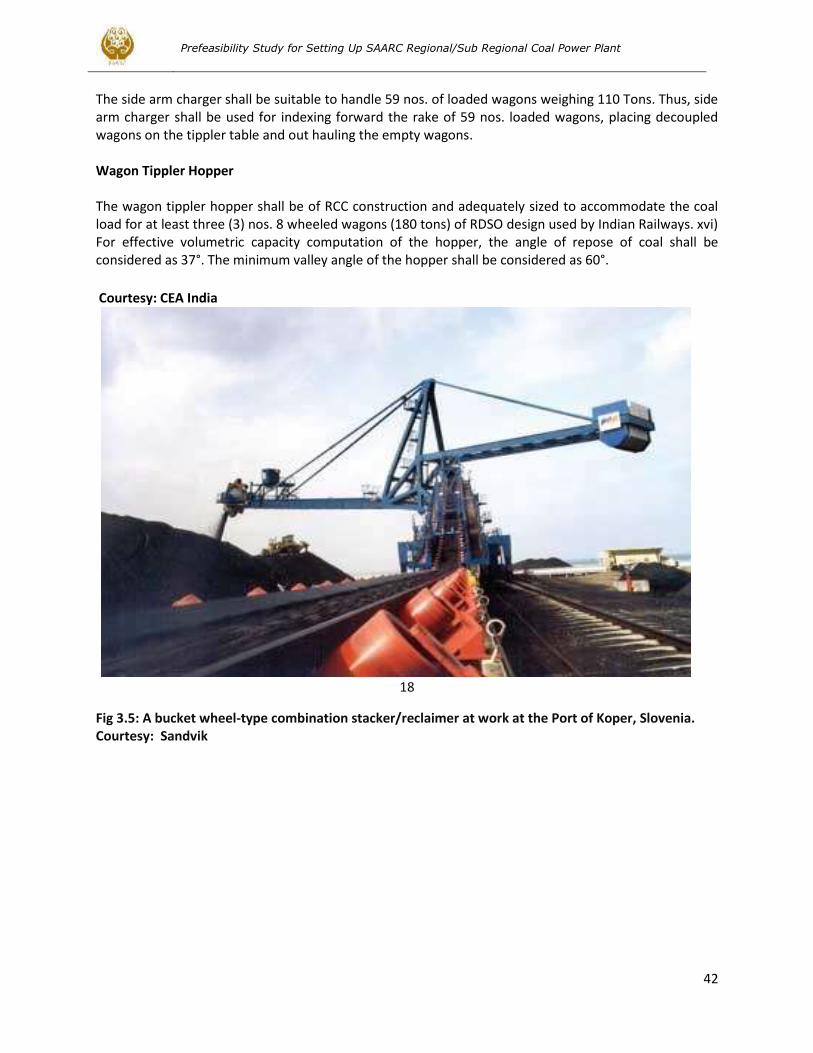
Prefeasibility Study for Setting Up SAARC Regional/Sub Regional Coal Power Plant
42
The side arm charger shall be suitable to handle 59 nos. of loaded wagons weighing 110 Tons. Thus, side arm charger shall be used for indexing forward the rake of 59 nos. loaded wagons, placing decoupled wagons on the tippler table and out hauling the empty wagons. Wagon Tippler Hopper The wagon tippler hopper shall be of RCC construction and adequately sized to accommodate the coal load for at least three (3) nos. 8 wheeled wagons (180 tons) of RDSO design used by Indian Railways. xvi) For effective volumetric capacity computation of the hopper, the angle of repose of coal shall be considered as 37°. The minimum valley angle of the hopper shall be considered as 60°.
Courtesy: CEA India
18
Fig 3.5: A bucket wheel-type combination stacker/reclaimer at work at the Port of Koper, Slovenia. Courtesy: Sandvik
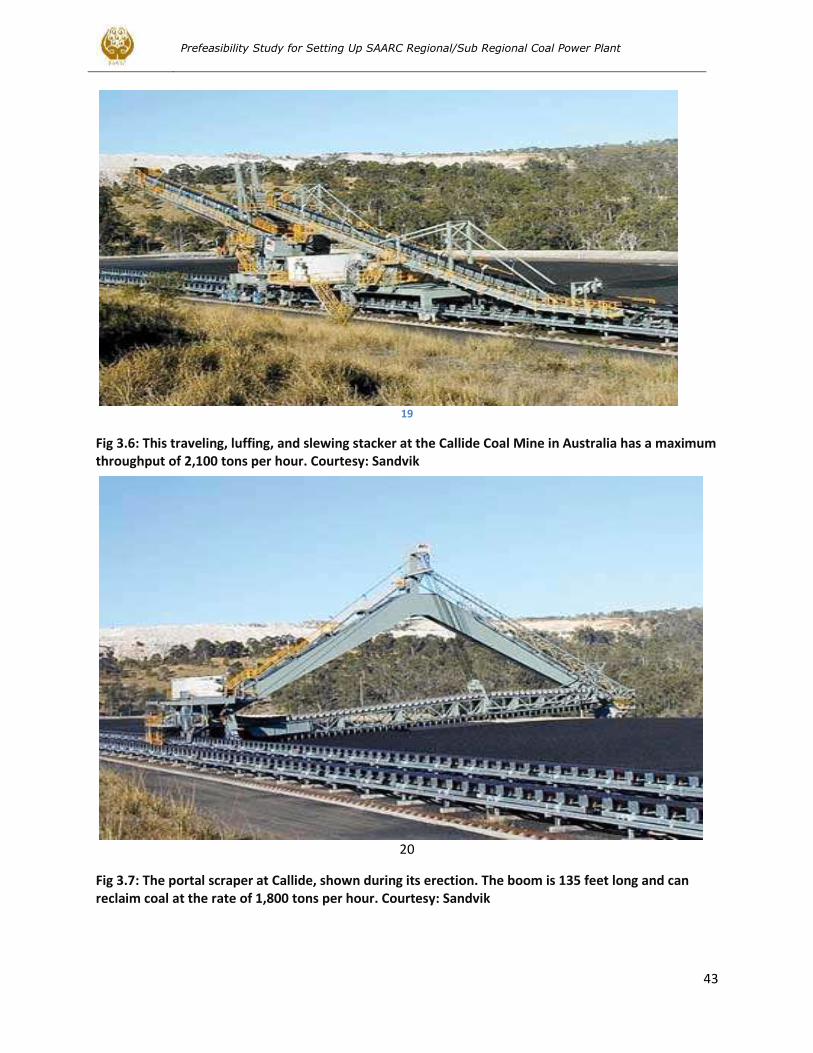
Prefeasibility Study for Setting Up SAARC Regional/Sub Regional Coal Power Plant
43
19
Fig 3.6: This traveling, luffing, and slewing stacker at the Callide Coal Mine in Australia has a maximum throughput of 2,100 tons per hour. Courtesy: Sandvik
20
Fig 3.7: The portal scraper at Callide, shown during its erection. The boom is 135 feet long and can reclaim coal at the rate of 1,800 tons per hour. Courtesy: Sandvik
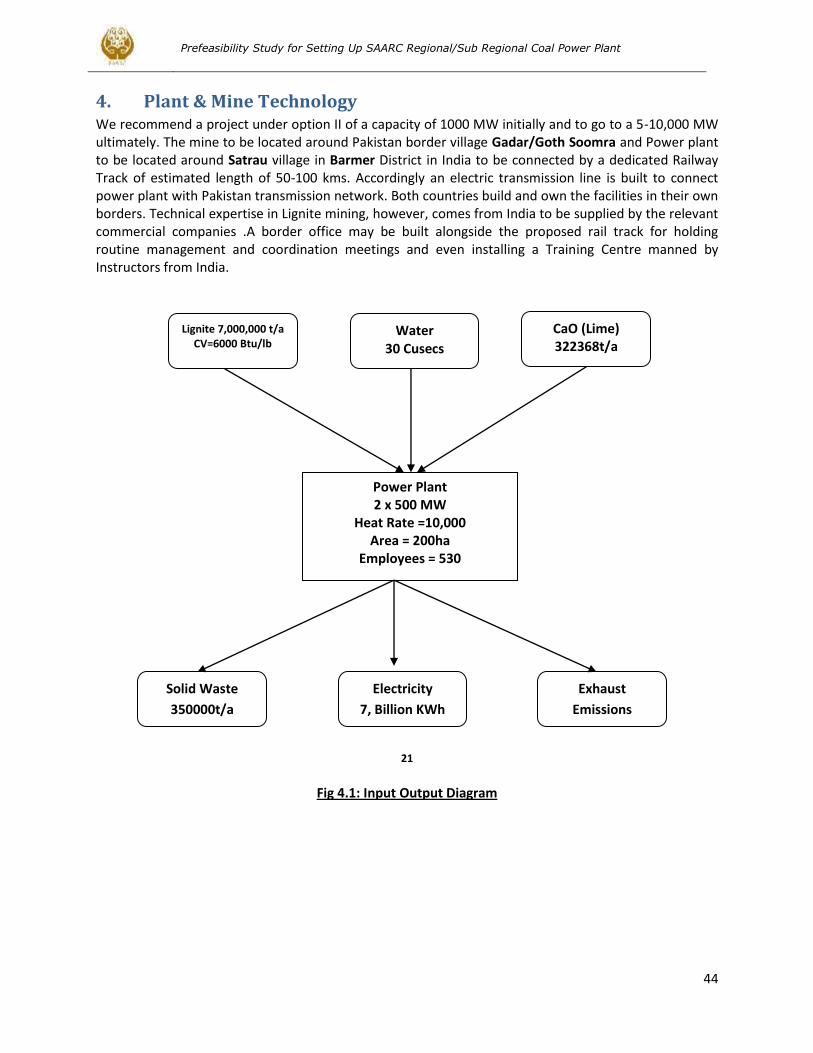
Prefeasibility Study for Setting Up SAARC Regional/Sub Regional Coal Power Plant
44
4. Plant & Mine Technology We recommend a project under option II of a capacity of 1000 MW initially and to go to a 5-10,000 MW ultimately. The mine to be located around Pakistan border village Gadar/Goth Soomra and Power plant to be located around Satrau village in Barmer District in India to be connected by a dedicated Railway Track of estimated length of 50-100 kms. Accordingly an electric transmission line is built to connect power plant with Pakistan transmission network. Both countries build and own the facilities in their own borders. Technical expertise in Lignite mining, however, comes from India to be supplied by the relevant commercial companies .A border office may be built alongside the proposed rail track for holding routine management and coordination meetings and even installing a Training Centre manned by Instructors from India.
Fig 4.1: Input Output Diagram
Lignite 7,000,000 t/a CV=6000 Btu/lb
Water 30 Cusecs
CaO (Lime) 322368t/a
Power Plant 2 x 500 MW
Heat Rate =10,000 Area = 200ha
Employees = 530
Solid Waste
350000t/a
Electricity
7, Billion KWh
Exhaust
Emissions
21
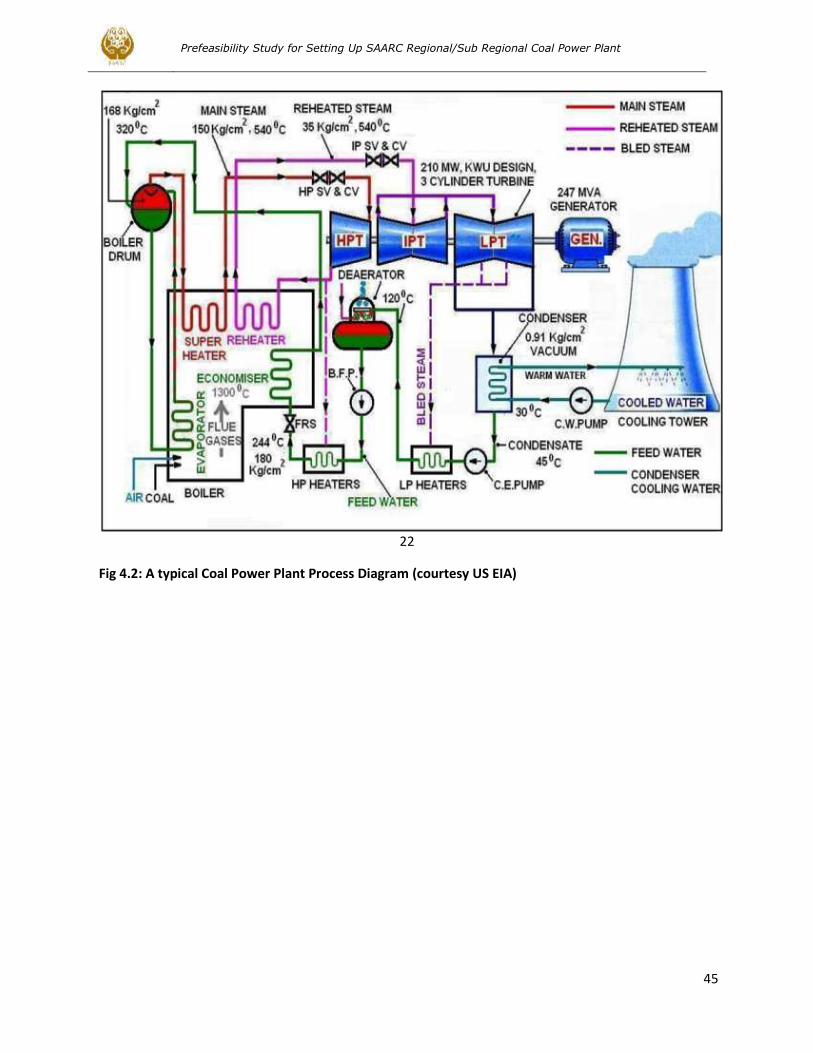
Prefeasibility Study for Setting Up SAARC Regional/Sub Regional Coal Power Plant
45
22
Fig 4.2: A typical Coal Power Plant Process Diagram (courtesy US EIA)
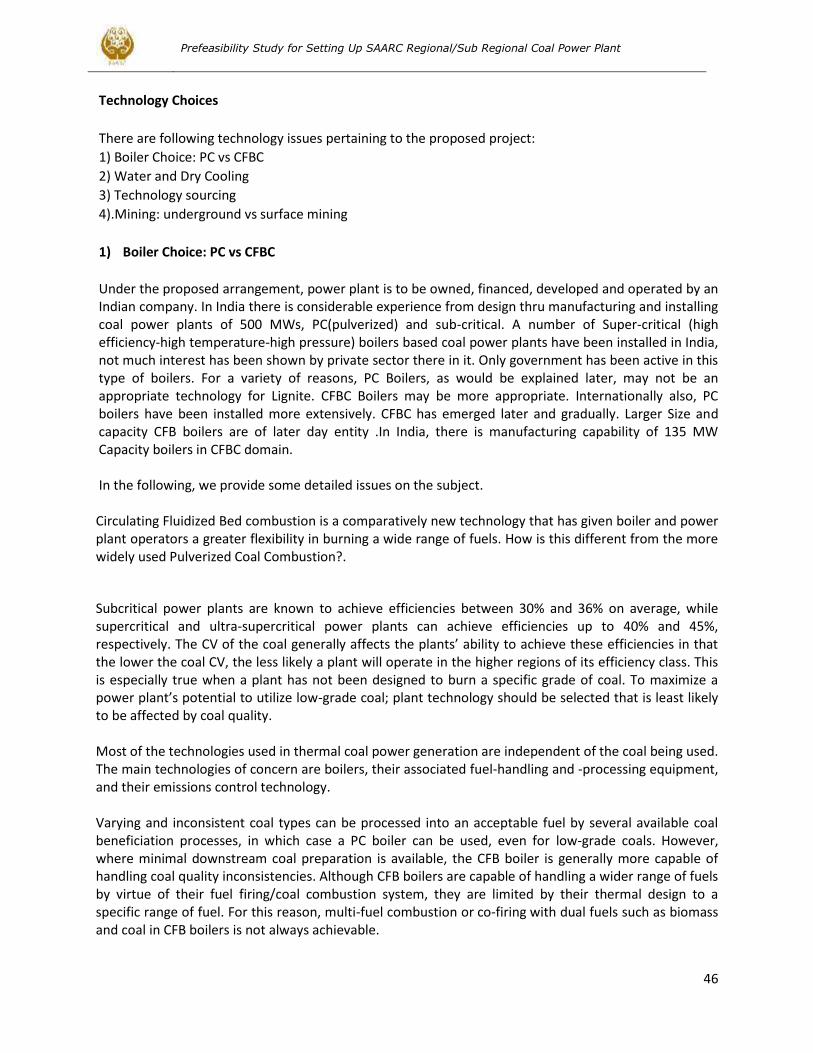
Prefeasibility Study for Setting Up SAARC Regional/Sub Regional Coal Power Plant
46
Technology Choices
There are following technology issues pertaining to the proposed project:
1) Boiler Choice: PC vs CFBC
2) Water and Dry Cooling
3) Technology sourcing
4).Mining: underground vs surface mining
1) Boiler Choice: PC vs CFBC
Under the proposed arrangement, power plant is to be owned, financed, developed and operated by an Indian company. In India there is considerable experience from design thru manufacturing and installing coal power plants of 500 MWs, PC(pulverized) and sub-critical. A number of Super-critical (high efficiency-high temperature-high pressure) boilers based coal power plants have been installed in India, not much interest has been shown by private sector there in it. Only government has been active in this type of boilers. For a variety of reasons, PC Boilers, as would be explained later, may not be an appropriate technology for Lignite. CFBC Boilers may be more appropriate. Internationally also, PC boilers have been installed more extensively. CFBC has emerged later and gradually. Larger Size and capacity CFB boilers are of later day entity .In India, there is manufacturing capability of 135 MW Capacity boilers in CFBC domain. In the following, we provide some detailed issues on the subject. Circulating Fluidized Bed combustion is a comparatively new technology that has given boiler and power plant operators a greater flexibility in burning a wide range of fuels. How is this different from the more widely used Pulverized Coal Combustion?.
Subcritical power plants are known to achieve efficiencies between 30% and 36% on average, while supercritical and ultra-supercritical power plants can achieve efficiencies up to 40% and 45%, respectively. The CV of the coal generally affects the plants’ ability to achieve these efficiencies in that the lower the coal CV, the less likely a plant will operate in the higher regions of its efficiency class. This is especially true when a plant has not been designed to burn a specific grade of coal. To maximize a power plant’s potential to utilize low-grade coal; plant technology should be selected that is least likely to be affected by coal quality. Most of the technologies used in thermal coal power generation are independent of the coal being used. The main technologies of concern are boilers, their associated fuel-handling and -processing equipment, and their emissions control technology. Varying and inconsistent coal types can be processed into an acceptable fuel by several available coal beneficiation processes, in which case a PC boiler can be used, even for low-grade coals. However, where minimal downstream coal preparation is available, the CFB boiler is generally more capable of handling coal quality inconsistencies. Although CFB boilers are capable of handling a wider range of fuels by virtue of their fuel firing/coal combustion system, they are limited by their thermal design to a specific range of fuel. For this reason, multi-fuel combustion or co-firing with dual fuels such as biomass and coal in CFB boilers is not always achievable.
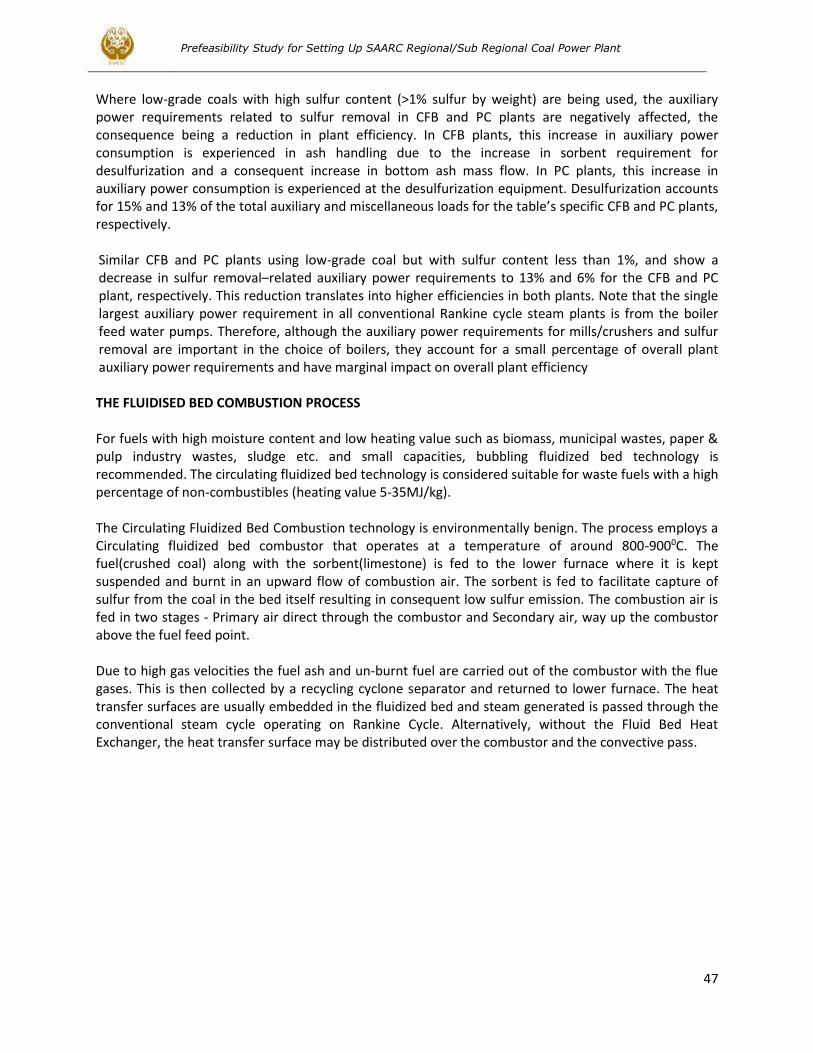
Prefeasibility Study for Setting Up SAARC Regional/Sub Regional Coal Power Plant
47
Where low-grade coals with high sulfur content (>1% sulfur by weight) are being used, the auxiliary power requirements related to sulfur removal in CFB and PC plants are negatively affected, the consequence being a reduction in plant efficiency. In CFB plants, this increase in auxiliary power consumption is experienced in ash handling due to the increase in sorbent requirement for desulfurization and a consequent increase in bottom ash mass flow. In PC plants, this increase in auxiliary power consumption is experienced at the desulfurization equipment. Desulfurization accounts for 15% and 13% of the total auxiliary and miscellaneous loads for the table’s specific CFB and PC plants, respectively. Similar CFB and PC plants using low-grade coal but with sulfur content less than 1%, and show a decrease in sulfur removal–related auxiliary power requirements to 13% and 6% for the CFB and PC plant, respectively. This reduction translates into higher efficiencies in both plants. Note that the single largest auxiliary power requirement in all conventional Rankine cycle steam plants is from the boiler feed water pumps. Therefore, although the auxiliary power requirements for mills/crushers and sulfur removal are important in the choice of boilers, they account for a small percentage of overall plant auxiliary power requirements and have marginal impact on overall plant efficiency THE FLUIDISED BED COMBUSTION PROCESS For fuels with high moisture content and low heating value such as biomass, municipal wastes, paper & pulp industry wastes, sludge etc. and small capacities, bubbling fluidized bed technology is recommended. The circulating fluidized bed technology is considered suitable for waste fuels with a high percentage of non-combustibles (heating value 5-35MJ/kg). The Circulating Fluidized Bed Combustion technology is environmentally benign. The process employs a Circulating fluidized bed combustor that operates at a temperature of around 800-9000C. The fuel(crushed coal) along with the sorbent(limestone) is fed to the lower furnace where it is kept suspended and burnt in an upward flow of combustion air. The sorbent is fed to facilitate capture of sulfur from the coal in the bed itself resulting in consequent low sulfur emission. The combustion air is fed in two stages - Primary air direct through the combustor and Secondary air, way up the combustor above the fuel feed point. Due to high gas velocities the fuel ash and un-burnt fuel are carried out of the combustor with the flue gases. This is then collected by a recycling cyclone separator and returned to lower furnace. The heat transfer surfaces are usually embedded in the fluidized bed and steam generated is passed through the conventional steam cycle operating on Rankine Cycle. Alternatively, without the Fluid Bed Heat Exchanger, the heat transfer surface may be distributed over the combustor and the convective pass.
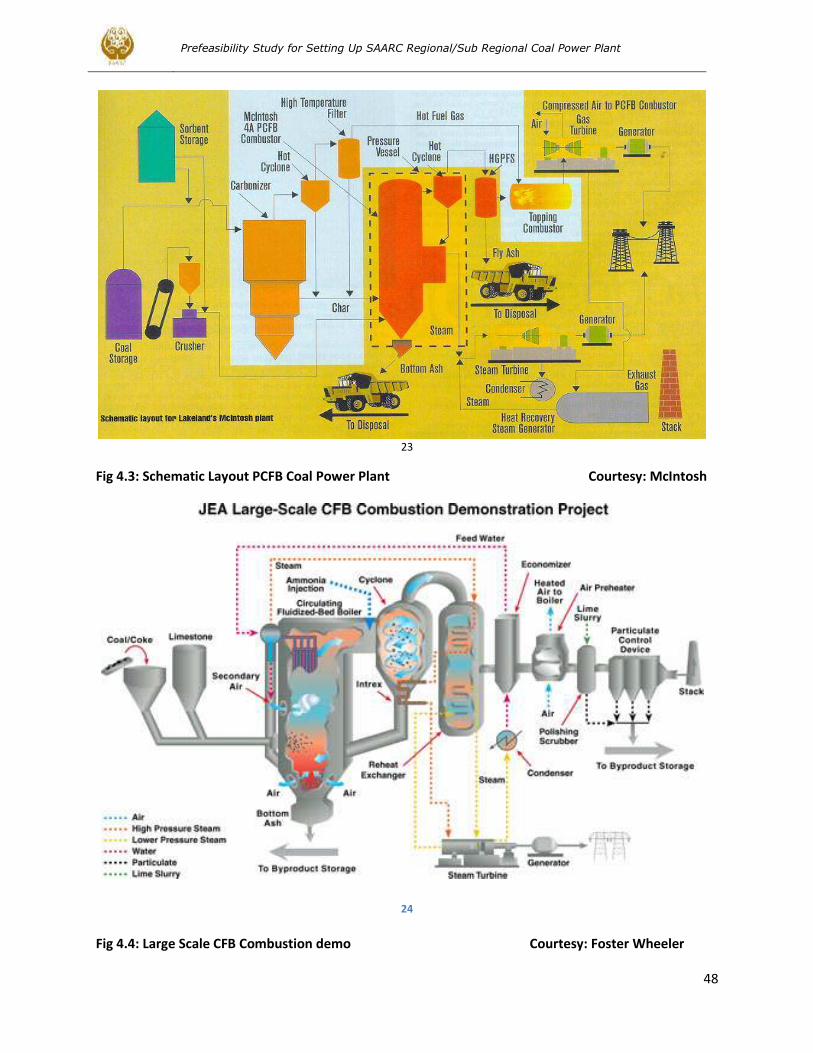
Prefeasibility Study for Setting Up SAARC Regional/Sub Regional Coal Power Plant
48
23
Fig 4.3: Schematic Layout PCFB Coal Power Plant Courtesy: McIntosh
24
Fig 4.4: Large Scale CFB Combustion demo Courtesy: Foster Wheeler
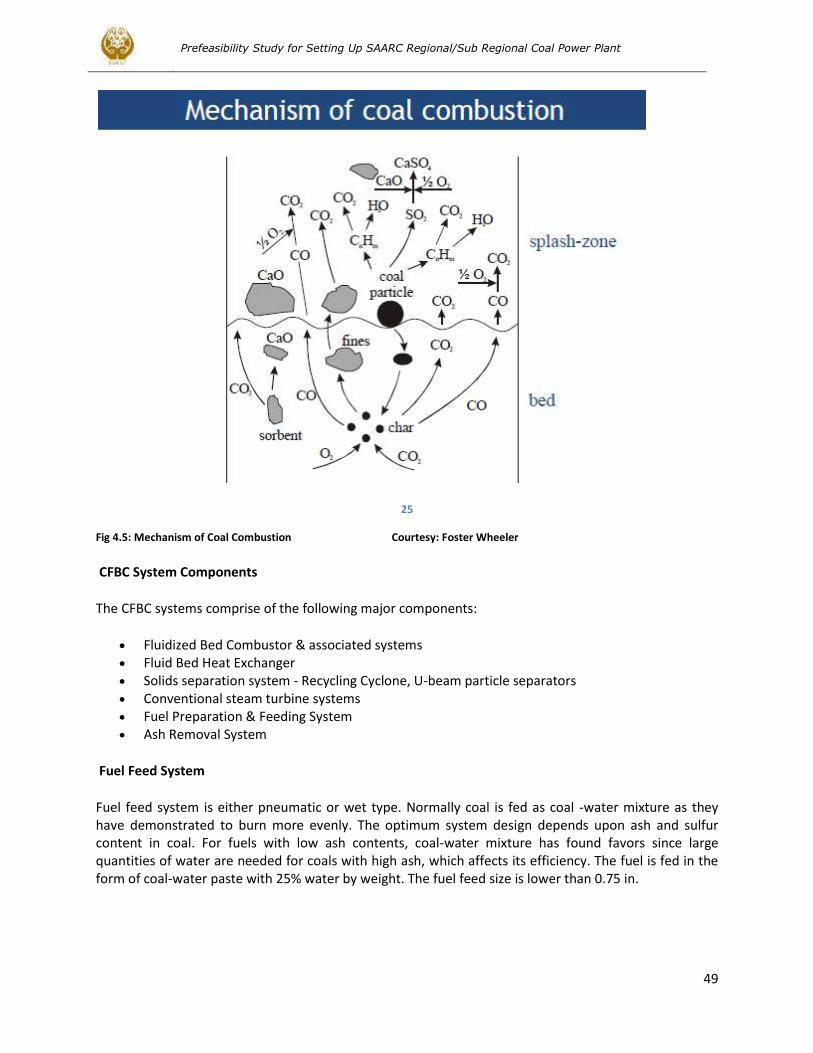
Prefeasibility Study for Setting Up SAARC Regional/Sub Regional Coal Power Plant
49
25
Fig 4.5: Mechanism of Coal Combustion Courtesy: Foster Wheeler
CFBC System Components
The CFBC systems comprise of the following major components:
Fluidized Bed Combustor & associated systems Fluid Bed Heat Exchanger Solids separation system - Recycling Cyclone, U-beam particle separators Conventional steam turbine systems Fuel Preparation & Feeding System Ash Removal System
Fuel Feed System
Fuel feed system is either pneumatic or wet type. Normally coal is fed as coal -water mixture as they have demonstrated to burn more evenly. The optimum system design depends upon ash and sulfur content in coal. For fuels with low ash contents, coal-water mixture has found favors since large quantities of water are needed for coals with high ash, which affects its efficiency. The fuel is fed in the form of coal-water paste with 25% water by weight. The fuel feed size is lower than 0.75 in.
Prefeasibility Study for Setting Up SAARC Regional/Sub Regional Coal Power Plant
50
Sorbent Feed System Sorbents are not combustibles and are generally fed either continuously or intermittent. In the latter case, lock-hoppers are used. The sorbent is crushed to around 3 mm top size, dries and fed in lock hoppers. Technological Advancements In addition to external particle recirculation CFB, internal recirculation CFB has been developed. Internal recirculation CFB uses U-Beam separators installed in the flue gas exit path to collect and recycle the solids directly to the bottom of the furnace. U-beams are a staggered array of stainless steel channels in the furnace exit plane which capture most of the solids suspended in the flue gas. In addition, the multi cyclone dust collector captures finer solids which pass through the U-beam and recycles them to the lower furnace in a controlled manner. The regulation of this secondary recycle system offers furnace temperature control resulting in improved boiler performance. The manufacturer claims to achieve >99.8% particle collection efficiency for the two-stage particle separation system. The IR-CFB operates at low flue gas velocities of 8 m/s as compared to 27 m/s with external recirculation CFB. This reduces erosion problems in the furnace which are a major cause for maintenance problems in CFBC. This design uses significantly less amount of refractory due to elimination of hot gas cyclone path. This IR-CFB technology is exclusively patented by Babcock & Wilcox. The CFBC process has been integrated with Advanced Pressurized Fluidized Bed Combustion system. The fuel & sorbent are fed into a PFB either Circulating or Bubbling. Combustion is aided by compressed air usually under a pressure of 10 to 14 bars at around 8710C. A cyclone separates particulate from pressurized flue gas stream and returns them to the bed. The flue gas undergoes a final clean-up through ceramic candle filters before entering the combustion turbine at around 8160C. The waste heat from the combustion turbine is recovered in a HRSG that generates steam to drive the steam turbine of the combined cycle. Pressurized Circulating Fluidized Bed (PCFB) process has been preferred by Foster Wheeler over the Bubbling bed. It offers higher combustion efficiency due to more carbon burnout in circulating mode; Low sorbent consumption for the same sulfur removal because of increased efficiency. Better NOx control from ease of staged combustion, since a circulating unit is taller and more slender. A higher velocity in the circulating mode results in units of smaller size for the same capacity. Technology Status CFBC technology has been proven for all type of fuels including high ash coal, lignite, wood wastes, refinery residue etc. There are over 310 operating CFBC boilers worldwide. Foster Wheeler has more than 150 CFB steam generators in operation. The commercial availability of most of these units exceeds 98%. M/s Lurgi Lentjes Babcock Energietechnik Gmbh (LLB), Germany has 42 CFBC steam generators (>8700 MW) in operation worldwide. M/s Babcock & Wilcox have about 40 operating CFB units worldwide. Table 4.1: List of CFBC Technology suppliers worldwide
Prefeasibility Study for Setting Up SAARC Regional/Sub Regional Coal Power Plant
51
S. No. Name Of Technology Supplier Technical Collaboration
No. Of Operating
Plants
Remarks
1. Foster Wheeler, USA (47%) 150 Circulating fluid bed technology
2. Lentjes Energietechnik, Germany (7.7%)
Lurgi 42 (870 MW)
Circulating fluid bed technology
3. Babcock & Wilcox, USA 40 Internal Circulation & Bubbling fluid bed technology
4. ABB (14.5%)
5. BHEL Lurgi 19
6. GEC Alstom Stein Industrie, (8.5%) Lurgi 150
7. Austrian Energy & Environment Bubbling, External/Internal Circulating FB
8. Kvaerner Pulping Oy, Finland (8%) Cymic Advanced CFBC/ Bubbling Bed
9. Deutche Babcock (4.5%) Table 23
Source: CEA India Fluidized Bed Combustion is a proven & established technology (not new, in contrast to general perception). Pilot and experimental FBC boilers were in operation as early as 1977 in India at BHEL, Trichy ; CFRI, Dhanbad etc. All these plants are still in operation. However FBC plants are economical only for poor quality fuels which cannot be fired in conventional boilers. Initially these boilers were used for co-generation and process gas/steam applications at industrial installations. Later small size captive power plants also used FBC boilers. The common Indian fuels used include high ash coals, coal washery rejects, biomass and lignite. All initial FBC boilers, before 1992, were invariably supplied by BHEL and based on obsolete Lurgi bubbling bed FBC technology licensed to BHEL by Lurgi Lentjes Babcock. Later Foster Wheeler, USA supplied few Circulating FBC boilers in 1992-95 through its Indian licensee, ISGEC John Thompson. Currently Foster Wheeler is directly executing two new orders from Rain Calcining, Vizag(25MW, petroleum coke) and Mysore Paper Mills, Bhadravati(20MW, multi-fuel). Babcock & Wilcox has also supplied few bubbling bed FBC boilers in India since 1992. The most important of these is the Kanoria Chemicals, Renukoot 81MW captive power plant based on the most advanced Internal-particle recirculation FBC. Recently, B&W has formed a joint venture with Thermax Ltd. to supply B&W boilers of all types in India as Thermax Babcock & Wicox Ltd. This company has supplied the FBC boilers to Kanoria Chemicals, Renukoot and Central Pulp Mills, Surat.
2. Water and Dry Cooling Considerable cooling water is required for coal power plant. For the proposed project, a minimum of 10 cusecs and maximum of 40 cusecs of water may be required. In case of competing power projects, the proposed location of Barmer may not be able to offer the required water. Fortunately, dry cooling ( ala automotive Radiators) has emerged as a viable option. In Saudi Arabia, some power plant installations
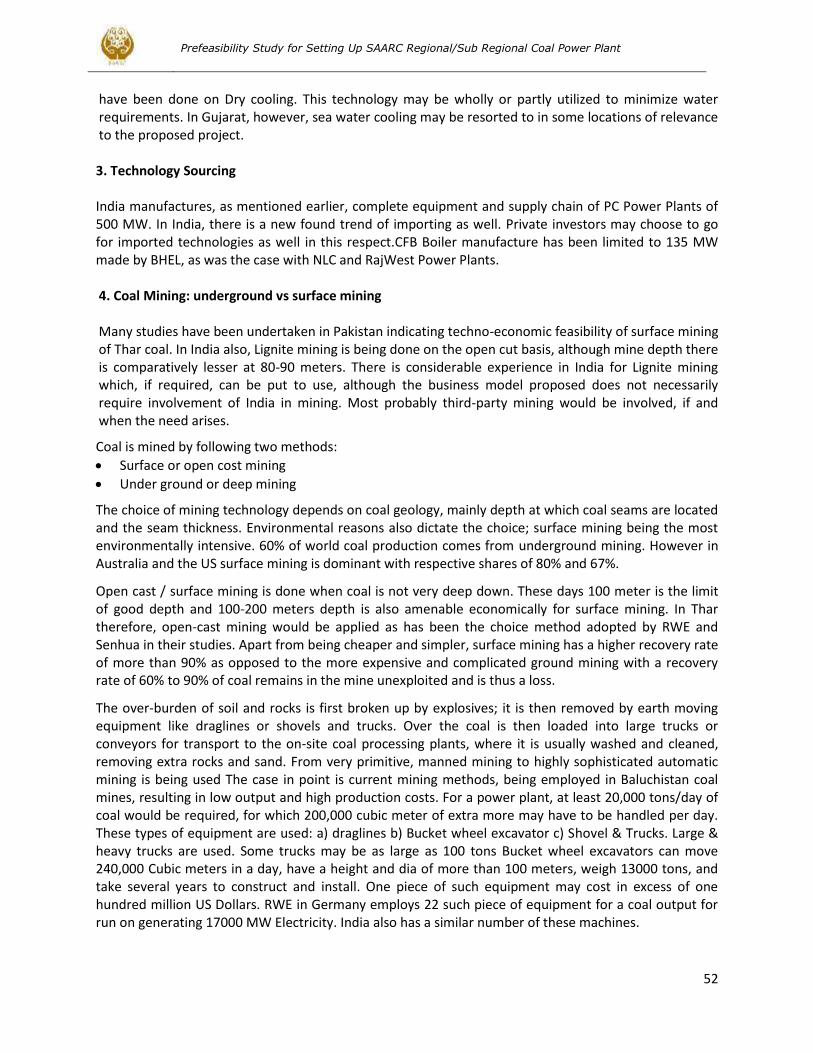
Prefeasibility Study for Setting Up SAARC Regional/Sub Regional Coal Power Plant
52
have been done on Dry cooling. This technology may be wholly or partly utilized to minimize water requirements. In Gujarat, however, sea water cooling may be resorted to in some locations of relevance to the proposed project. 3. Technology Sourcing India manufactures, as mentioned earlier, complete equipment and supply chain of PC Power Plants of 500 MW. In India, there is a new found trend of importing as well. Private investors may choose to go for imported technologies as well in this respect.CFB Boiler manufacture has been limited to 135 MW made by BHEL, as was the case with NLC and RajWest Power Plants. 4. Coal Mining: underground vs surface mining Many studies have been undertaken in Pakistan indicating techno-economic feasibility of surface mining of Thar coal. In India also, Lignite mining is being done on the open cut basis, although mine depth there is comparatively lesser at 80-90 meters. There is considerable experience in India for Lignite mining which, if required, can be put to use, although the business model proposed does not necessarily require involvement of India in mining. Most probably third-party mining would be involved, if and when the need arises.
Coal is mined by following two methods:
Surface or open cost mining
Under ground or deep mining
The choice of mining technology depends on coal geology, mainly depth at which coal seams are located and the seam thickness. Environmental reasons also dictate the choice; surface mining being the most environmentally intensive. 60% of world coal production comes from underground mining. However in Australia and the US surface mining is dominant with respective shares of 80% and 67%.
Open cast / surface mining is done when coal is not very deep down. These days 100 meter is the limit of good depth and 100-200 meters depth is also amenable economically for surface mining. In Thar therefore, open-cast mining would be applied as has been the choice method adopted by RWE and Senhua in their studies. Apart from being cheaper and simpler, surface mining has a higher recovery rate of more than 90% as opposed to the more expensive and complicated ground mining with a recovery rate of 60% to 90% of coal remains in the mine unexploited and is thus a loss.
The over-burden of soil and rocks is first broken up by explosives; it is then removed by earth moving equipment like draglines or shovels and trucks. Over the coal is then loaded into large trucks or conveyors for transport to the on-site coal processing plants, where it is usually washed and cleaned, removing extra rocks and sand. From very primitive, manned mining to highly sophisticated automatic mining is being used The case in point is current mining methods, being employed in Baluchistan coal mines, resulting in low output and high production costs. For a power plant, at least 20,000 tons/day of coal would be required, for which 200,000 cubic meter of extra more may have to be handled per day. These types of equipment are used: a) draglines b) Bucket wheel excavator c) Shovel & Trucks. Large & heavy trucks are used. Some trucks may be as large as 100 tons Bucket wheel excavators can move 240,000 Cubic meters in a day, have a height and dia of more than 100 meters, weigh 13000 tons, and take several years to construct and install. One piece of such equipment may cost in excess of one hundred million US Dollars. RWE in Germany employs 22 such piece of equipment for a coal output for run on generating 17000 MW Electricity. India also has a similar number of these machines.
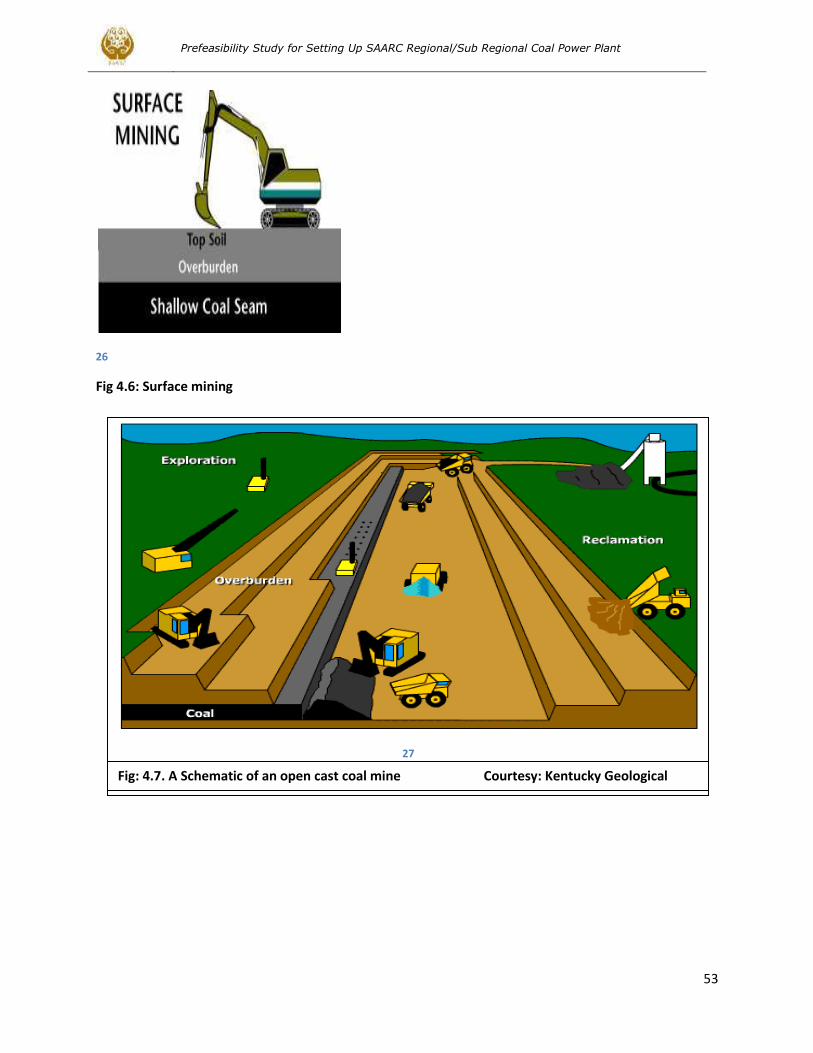
Prefeasibility Study for Setting Up SAARC Regional/Sub Regional Coal Power Plant
53
26
Fig 4.6: Surface mining
27
Fig: 4.7. A Schematic of an open cast coal mine Courtesy: Kentucky Geological
Institute
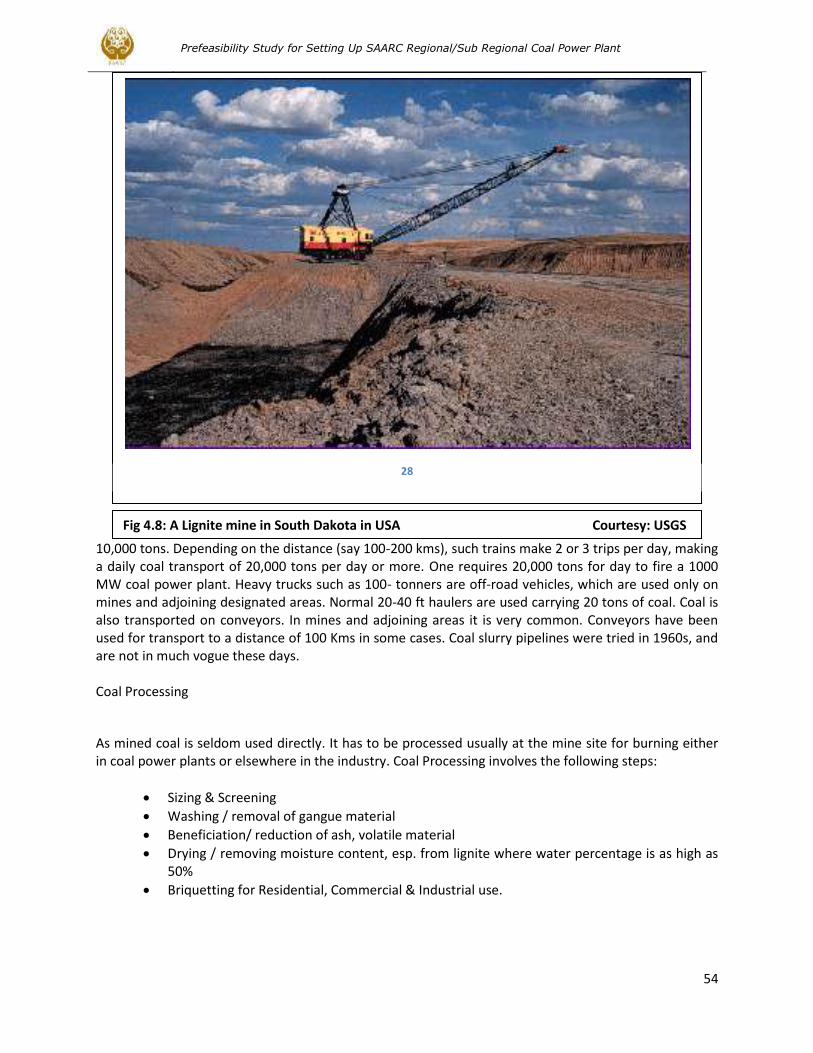
Prefeasibility Study for Setting Up SAARC Regional/Sub Regional Coal Power Plant
54
10,000 tons. Depending on the distance (say 100-200 kms), such trains make 2 or 3 trips per day, making a daily coal transport of 20,000 tons per day or more. One requires 20,000 tons for day to fire a 1000 MW coal power plant. Heavy trucks such as 100- tonners are off-road vehicles, which are used only on mines and adjoining designated areas. Normal 20-40 ft haulers are used carrying 20 tons of coal. Coal is also transported on conveyors. In mines and adjoining areas it is very common. Conveyors have been used for transport to a distance of 100 Kms in some cases. Coal slurry pipelines were tried in 1960s, and are not in much vogue these days. Coal Processing
As mined coal is seldom used directly. It has to be processed usually at the mine site for burning either in coal power plants or elsewhere in the industry. Coal Processing involves the following steps:
Sizing & Screening
Washing / removal of gangue material
Beneficiation/ reduction of ash, volatile material
Drying / removing moisture content, esp. from lignite where water percentage is as high as 50%
Briquetting for Residential, Commercial & Industrial use.
Fig 4.8: A Lignite mine in South Dakota in USA Courtesy: USGS
Kentuctute
28
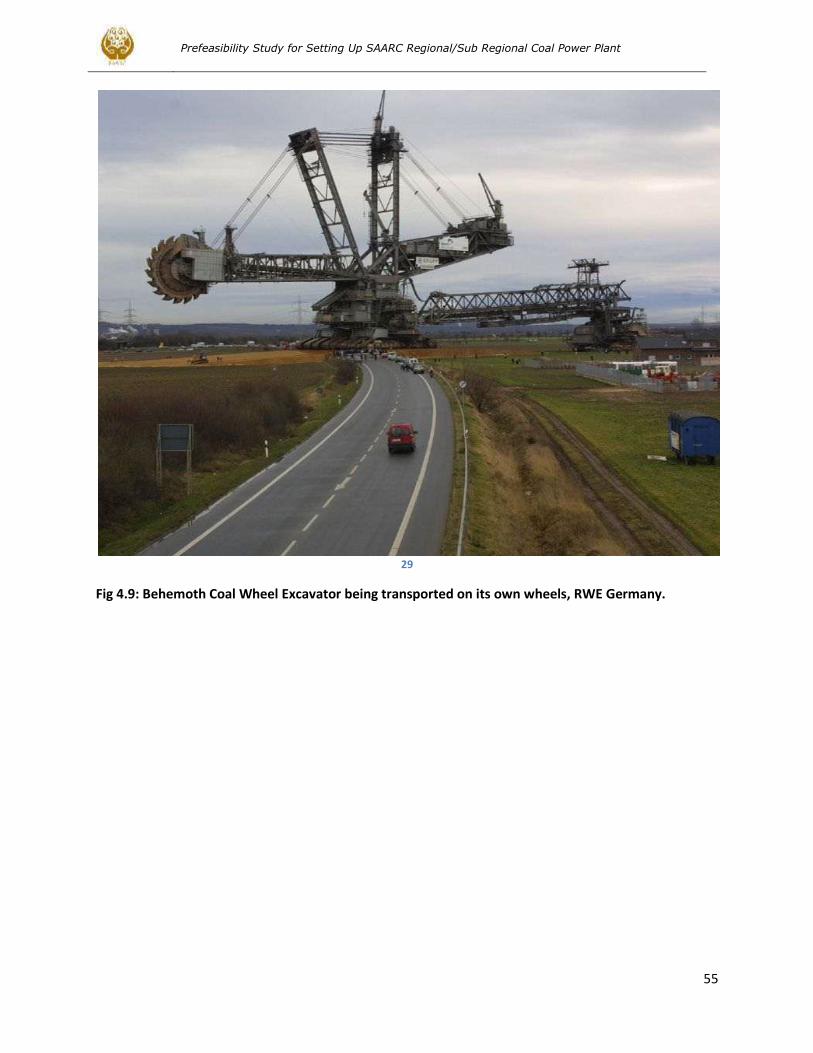
Prefeasibility Study for Setting Up SAARC Regional/Sub Regional Coal Power Plant
55
29
Fig 4.9: Behemoth Coal Wheel Excavator being transported on its own wheels, RWE Germany.
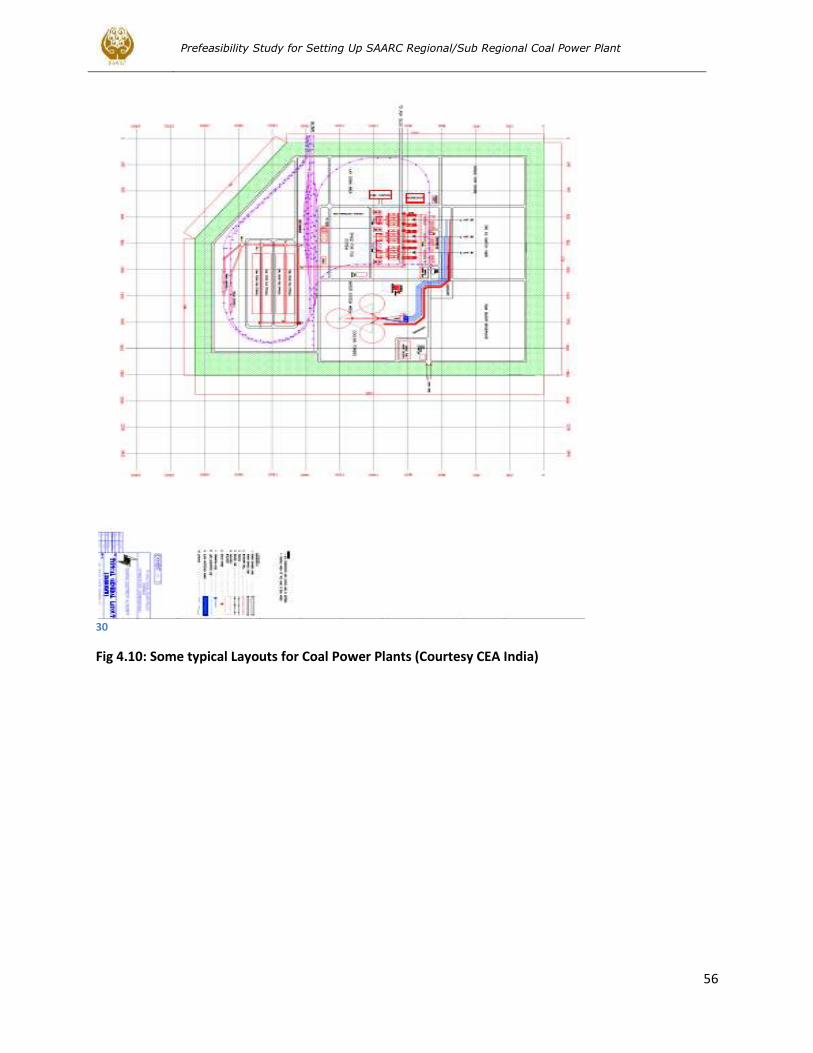
Prefeasibility Study for Setting Up SAARC Regional/Sub Regional Coal Power Plant
56
30
Fig 4.10: Some typical Layouts for Coal Power Plants (Courtesy CEA India)
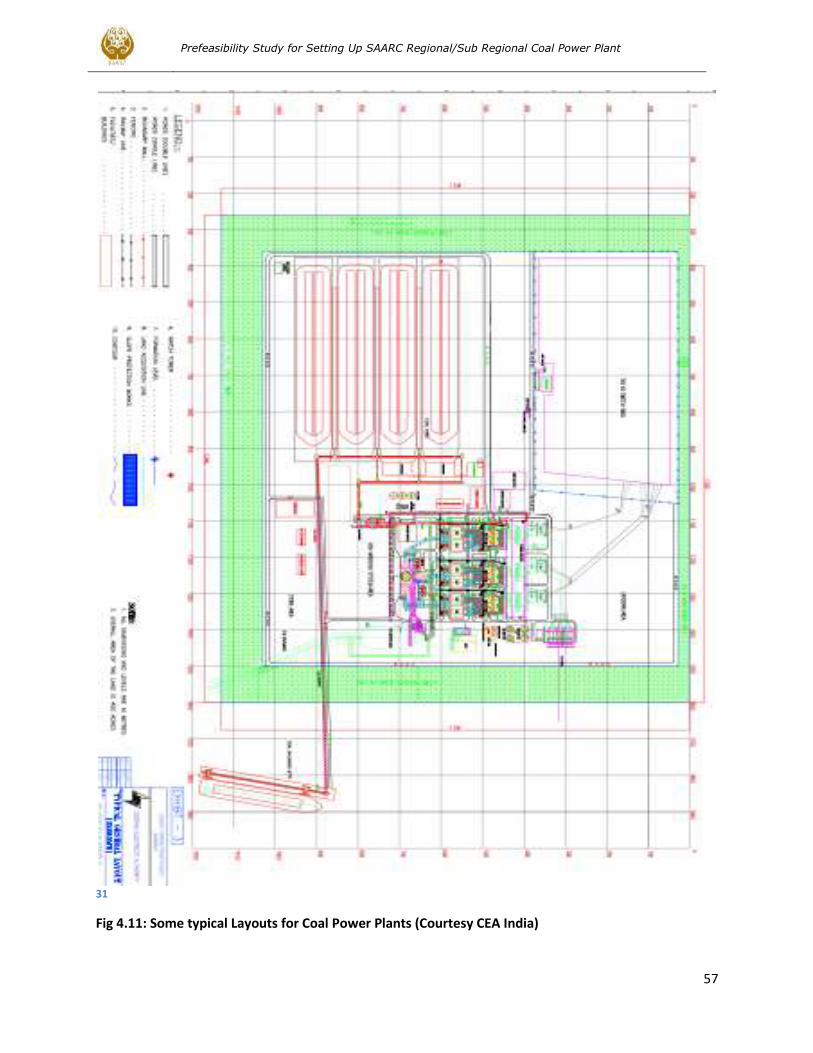
Prefeasibility Study for Setting Up SAARC Regional/Sub Regional Coal Power Plant
57
31
Fig 4.11: Some typical Layouts for Coal Power Plants (Courtesy CEA India)
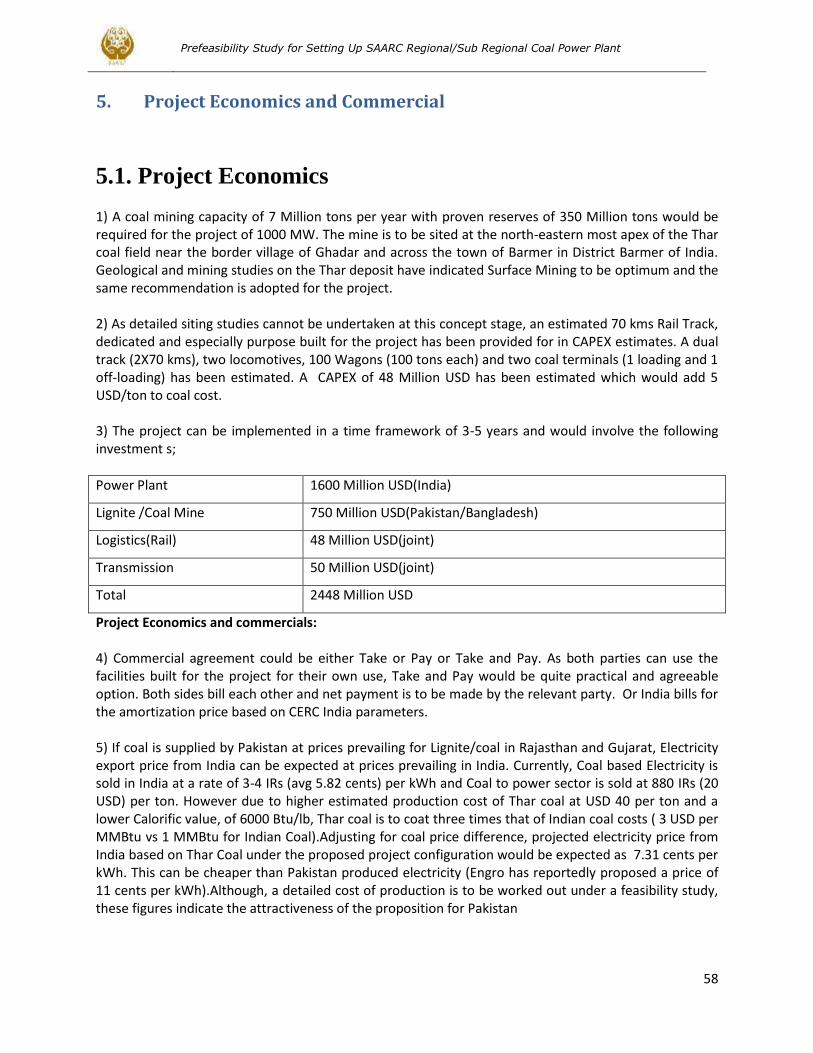
Prefeasibility Study for Setting Up SAARC Regional/Sub Regional Coal Power Plant
58
5. Project Economics and Commercial
5.1. Project Economics
1) A coal mining capacity of 7 Million tons per year with proven reserves of 350 Million tons would be required for the project of 1000 MW. The mine is to be sited at the north-eastern most apex of the Thar coal field near the border village of Ghadar and across the town of Barmer in District Barmer of India. Geological and mining studies on the Thar deposit have indicated Surface Mining to be optimum and the same recommendation is adopted for the project. 2) As detailed siting studies cannot be undertaken at this concept stage, an estimated 70 kms Rail Track, dedicated and especially purpose built for the project has been provided for in CAPEX estimates. A dual track (2X70 kms), two locomotives, 100 Wagons (100 tons each) and two coal terminals (1 loading and 1 off-loading) has been estimated. A CAPEX of 48 Million USD has been estimated which would add 5 USD/ton to coal cost. 3) The project can be implemented in a time framework of 3-5 years and would involve the following investment s;
Power Plant 1600 Million USD(India)
Lignite /Coal Mine 750 Million USD(Pakistan/Bangladesh)
Logistics(Rail) 48 Million USD(joint)
Transmission 50 Million USD(joint)
Total 2448 Million USD
Project Economics and commercials: 4) Commercial agreement could be either Take or Pay or Take and Pay. As both parties can use the facilities built for the project for their own use, Take and Pay would be quite practical and agreeable option. Both sides bill each other and net payment is to be made by the relevant party. Or India bills for the amortization price based on CERC India parameters. 5) If coal is supplied by Pakistan at prices prevailing for Lignite/coal in Rajasthan and Gujarat, Electricity export price from India can be expected at prices prevailing in India. Currently, Coal based Electricity is sold in India at a rate of 3-4 IRs (avg 5.82 cents) per kWh and Coal to power sector is sold at 880 IRs (20 USD) per ton. However due to higher estimated production cost of Thar coal at USD 40 per ton and a lower Calorific value, of 6000 Btu/lb, Thar coal is to coat three times that of Indian coal costs ( 3 USD per MMBtu vs 1 MMBtu for Indian Coal).Adjusting for coal price difference, projected electricity price from India based on Thar Coal under the proposed project configuration would be expected as 7.31 cents per kWh. This can be cheaper than Pakistan produced electricity (Engro has reportedly proposed a price of 11 cents per kWh).Although, a detailed cost of production is to be worked out under a feasibility study, these figures indicate the attractiveness of the proposition for Pakistan
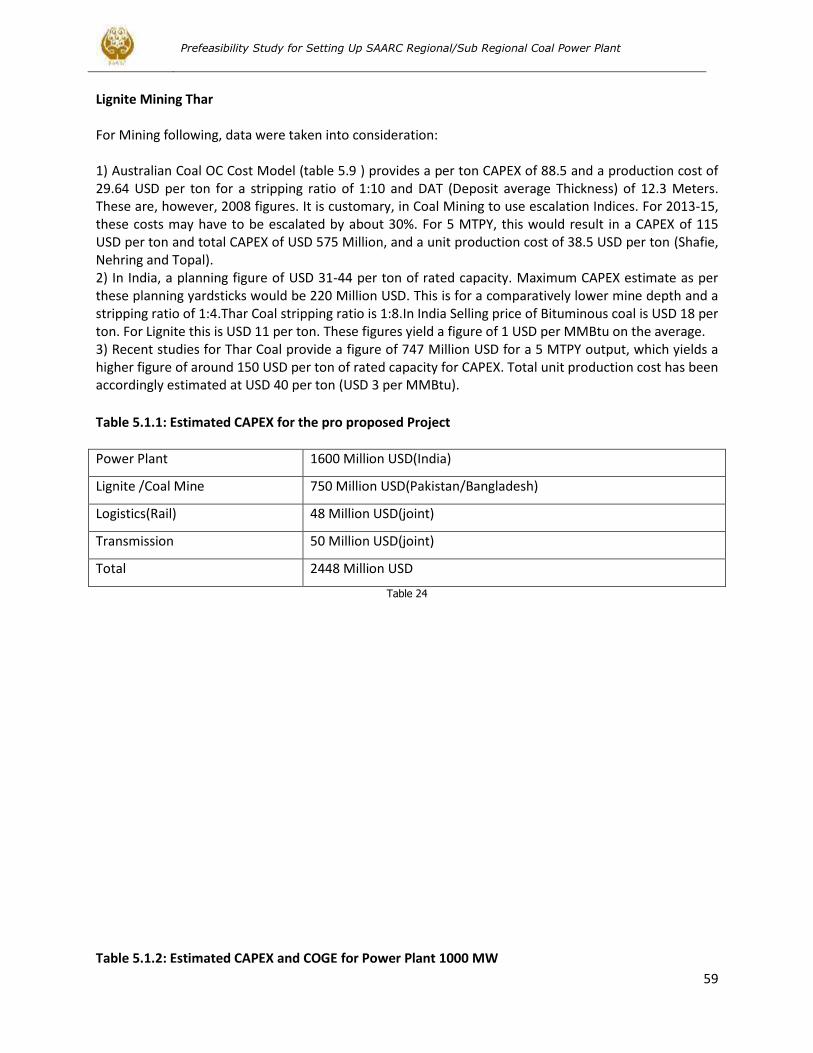
Prefeasibility Study for Setting Up SAARC Regional/Sub Regional Coal Power Plant
59
Lignite Mining Thar For Mining following, data were taken into consideration: 1) Australian Coal OC Cost Model (table 5.9 ) provides a per ton CAPEX of 88.5 and a production cost of 29.64 USD per ton for a stripping ratio of 1:10 and DAT (Deposit average Thickness) of 12.3 Meters. These are, however, 2008 figures. It is customary, in Coal Mining to use escalation Indices. For 2013-15, these costs may have to be escalated by about 30%. For 5 MTPY, this would result in a CAPEX of 115 USD per ton and total CAPEX of USD 575 Million, and a unit production cost of 38.5 USD per ton (Shafie, Nehring and Topal). 2) In India, a planning figure of USD 31-44 per ton of rated capacity. Maximum CAPEX estimate as per these planning yardsticks would be 220 Million USD. This is for a comparatively lower mine depth and a stripping ratio of 1:4.Thar Coal stripping ratio is 1:8.In India Selling price of Bituminous coal is USD 18 per ton. For Lignite this is USD 11 per ton. These figures yield a figure of 1 USD per MMBtu on the average. 3) Recent studies for Thar Coal provide a figure of 747 Million USD for a 5 MTPY output, which yields a higher figure of around 150 USD per ton of rated capacity for CAPEX. Total unit production cost has been accordingly estimated at USD 40 per ton (USD 3 per MMBtu).
Table 5.1.1: Estimated CAPEX for the pro proposed Project
Power Plant 1600 Million USD(India)
Lignite /Coal Mine 750 Million USD(Pakistan/Bangladesh)
Logistics(Rail) 48 Million USD(joint)
Transmission 50 Million USD(joint)
Total 2448 Million USD
Table 24
Table 5.1.2: Estimated CAPEX and COGE for Power Plant 1000 MW
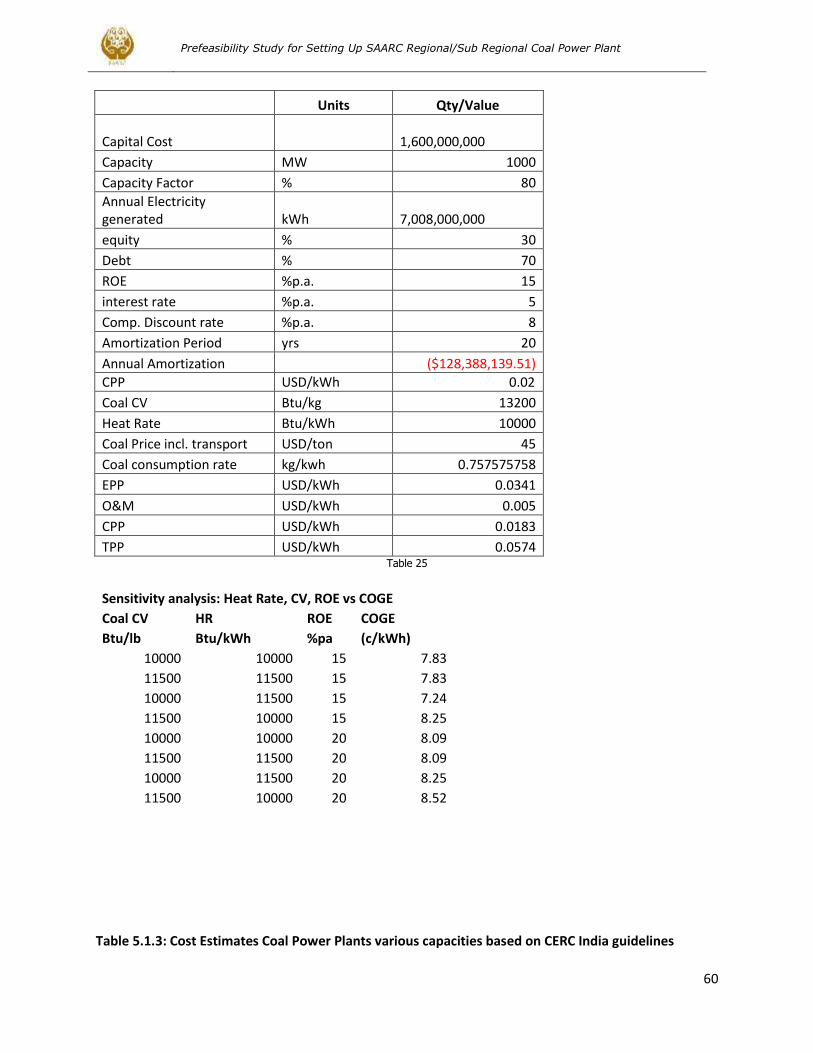
Prefeasibility Study for Setting Up SAARC Regional/Sub Regional Coal Power Plant
60
Units Qty/Value
Capital Cost 1,600,000,000
Capacity MW 1000
Capacity Factor % 80
Annual Electricity generated kWh
7,008,000,000
equity % 30
Debt % 70
ROE %p.a. 15
interest rate %p.a. 5
Comp. Discount rate %p.a. 8
Amortization Period yrs 20
Annual Amortization ($128,388,139.51)
CPP USD/kWh 0.02
Coal CV Btu/kg 13200
Heat Rate Btu/kWh 10000
Coal Price incl. transport USD/ton 45
Coal consumption rate kg/kwh 0.757575758
EPP USD/kWh 0.0341
O&M USD/kWh 0.005
CPP USD/kWh 0.0183
TPP USD/kWh 0.0574 Table 25
Sensitivity analysis: Heat Rate, CV, ROE vs COGE
Coal CV HR ROE COGE
Btu/lb Btu/kWh %pa (c/kWh)
10000 10000 15 7.83
11500 11500 15 7.83
10000 11500 15 7.24
11500 10000 15 8.25
10000 10000 20 8.09
11500 11500 20 8.09
10000 11500 20 8.25
11500 10000 20 8.52 Table 5.1.3: Cost Estimates Coal Power Plants various capacities based on CERC India guidelines
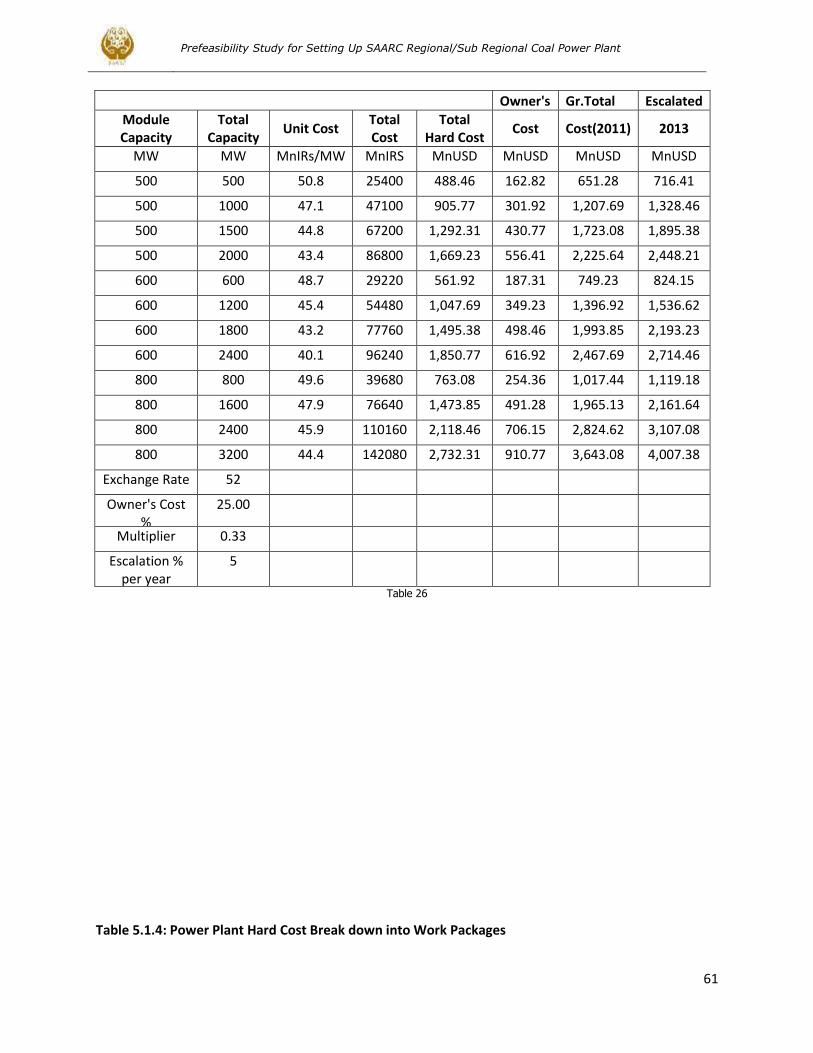
Prefeasibility Study for Setting Up SAARC Regional/Sub Regional Coal Power Plant
61
Owner's Gr.Total Escalated
Module Capacity
Total Capacity
Unit Cost Total Cost
Total Hard Cost
Cost Cost(2011) 2013
MW MW MnIRs/MW MnIRS MnUSD MnUSD MnUSD MnUSD
500 500 50.8 25400 488.46 162.82 651.28 716.41
500 1000 47.1 47100 905.77 301.92 1,207.69 1,328.46
500 1500 44.8 67200 1,292.31 430.77 1,723.08 1,895.38
500 2000 43.4 86800 1,669.23 556.41 2,225.64 2,448.21
600 600 48.7 29220 561.92 187.31 749.23 824.15
600 1200 45.4 54480 1,047.69 349.23 1,396.92 1,536.62
600 1800 43.2 77760 1,495.38 498.46 1,993.85 2,193.23
600 2400 40.1 96240 1,850.77 616.92 2,467.69 2,714.46
800 800 49.6 39680 763.08 254.36 1,017.44 1,119.18
800 1600 47.9 76640 1,473.85 491.28 1,965.13 2,161.64
800 2400 45.9 110160 2,118.46 706.15 2,824.62 3,107.08
800 3200 44.4 142080 2,732.31 910.77 3,643.08 4,007.38
Exchange Rate 52
Owner's Cost %
25.00
Multiplier 0.33
Escalation % per year
5
Table 26
Table 5.1.4: Power Plant Hard Cost Break down into Work Packages
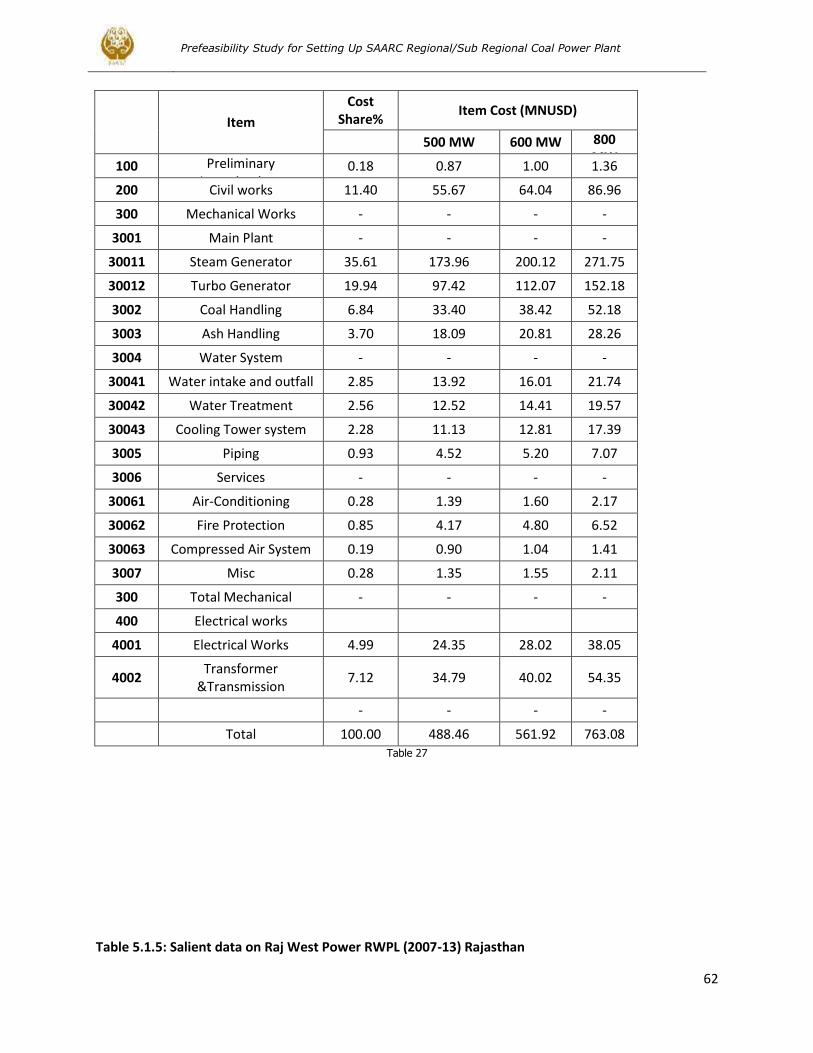
Prefeasibility Study for Setting Up SAARC Regional/Sub Regional Coal Power Plant
62
Item
Cost Share%
Item Cost (MNUSD)
500 MW 600 MW 800
MW 100 Preliminary
Investigations 0.18 0.87 1.00 1.36
200 Civil works 11.40 55.67 64.04 86.96
300 Mechanical Works - - - -
3001 Main Plant - - - -
30011 Steam Generator 35.61 173.96 200.12 271.75
30012 Turbo Generator 19.94 97.42 112.07 152.18
3002 Coal Handling 6.84 33.40 38.42 52.18
3003 Ash Handling 3.70 18.09 20.81 28.26
3004 Water System - - - -
30041 Water intake and outfall 2.85 13.92 16.01 21.74
30042 Water Treatment 2.56 12.52 14.41 19.57
30043 Cooling Tower system 2.28 11.13 12.81 17.39
3005 Piping 0.93 4.52 5.20 7.07
3006 Services - - - -
30061 Air-Conditioning 0.28 1.39 1.60 2.17
30062 Fire Protection 0.85 4.17 4.80 6.52
30063 Compressed Air System 0.19 0.90 1.04 1.41
3007 Misc 0.28 1.35 1.55 2.11
300 Total Mechanical - - - -
400 Electrical works
4001 Electrical Works 4.99 24.35 28.02 38.05
4002 Transformer
&Transmission 7.12 34.79 40.02 54.35
- - - -
Total 100.00 488.46 561.92 763.08
Table 27
Table 5.1.5: Salient data on Raj West Power RWPL (2007-13) Rajasthan
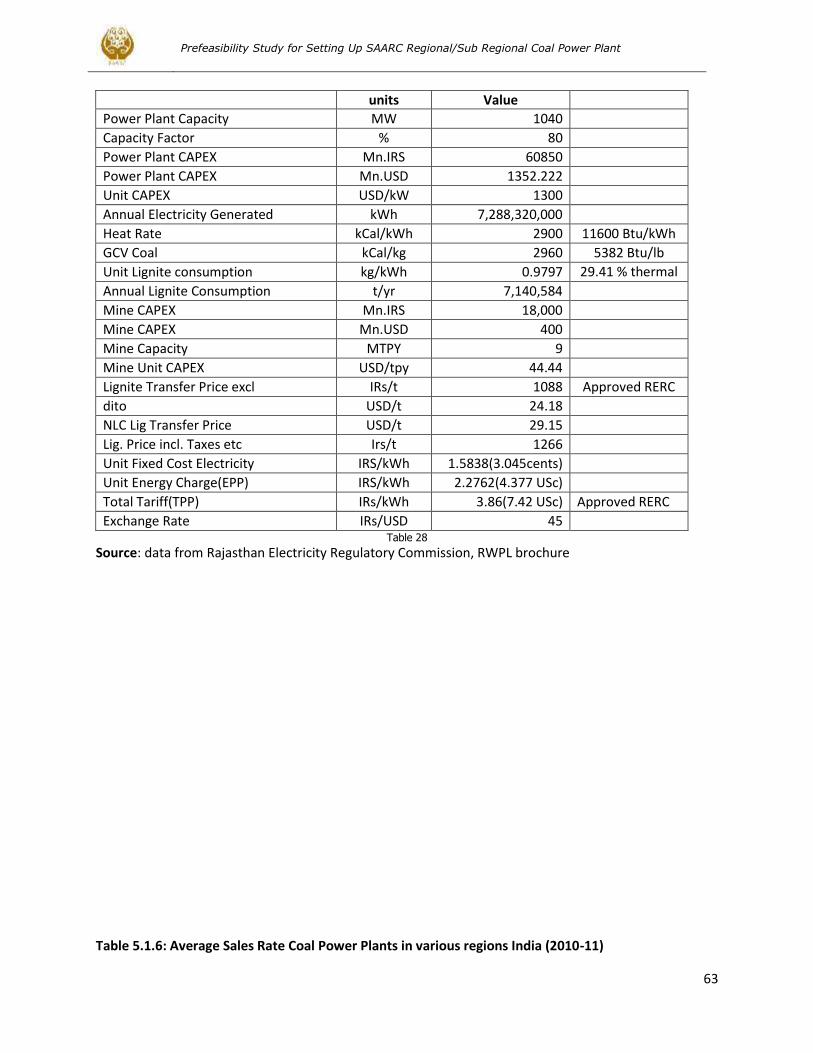
Prefeasibility Study for Setting Up SAARC Regional/Sub Regional Coal Power Plant
63
units Value
Power Plant Capacity MW 1040
Capacity Factor % 80
Power Plant CAPEX Mn.IRS 60850
Power Plant CAPEX Mn.USD 1352.222
Unit CAPEX USD/kW 1300
Annual Electricity Generated kWh 7,288,320,000
Heat Rate kCal/kWh 2900 11600 Btu/kWh
GCV Coal kCal/kg 2960 5382 Btu/lb
Unit Lignite consumption kg/kWh 0.9797 29.41 % thermal
Eff Annual Lignite Consumption t/yr 7,140,584
Mine CAPEX Mn.IRS 18,000
Mine CAPEX Mn.USD 400
Mine Capacity MTPY 9
Mine Unit CAPEX USD/tpy 44.44
Lignite Transfer Price excl IRs/t 1088 Approved RERC
dito USD/t 24.18
NLC Lig Transfer Price USD/t 29.15
Lig. Price incl. Taxes etc Irs/t 1266
Unit Fixed Cost Electricity IRS/kWh 1.5838(3.045cents)
Unit Energy Charge(EPP) IRS/kWh 2.2762(4.377 USc)
Total Tariff(TPP) IRs/kWh 3.86(7.42 USc) Approved RERC
Exchange Rate IRs/USD 45
Table 28
Source: data from Rajasthan Electricity Regulatory Commission, RWPL brochure Table 5.1.6: Average Sales Rate Coal Power Plants in various regions India (2010-11)
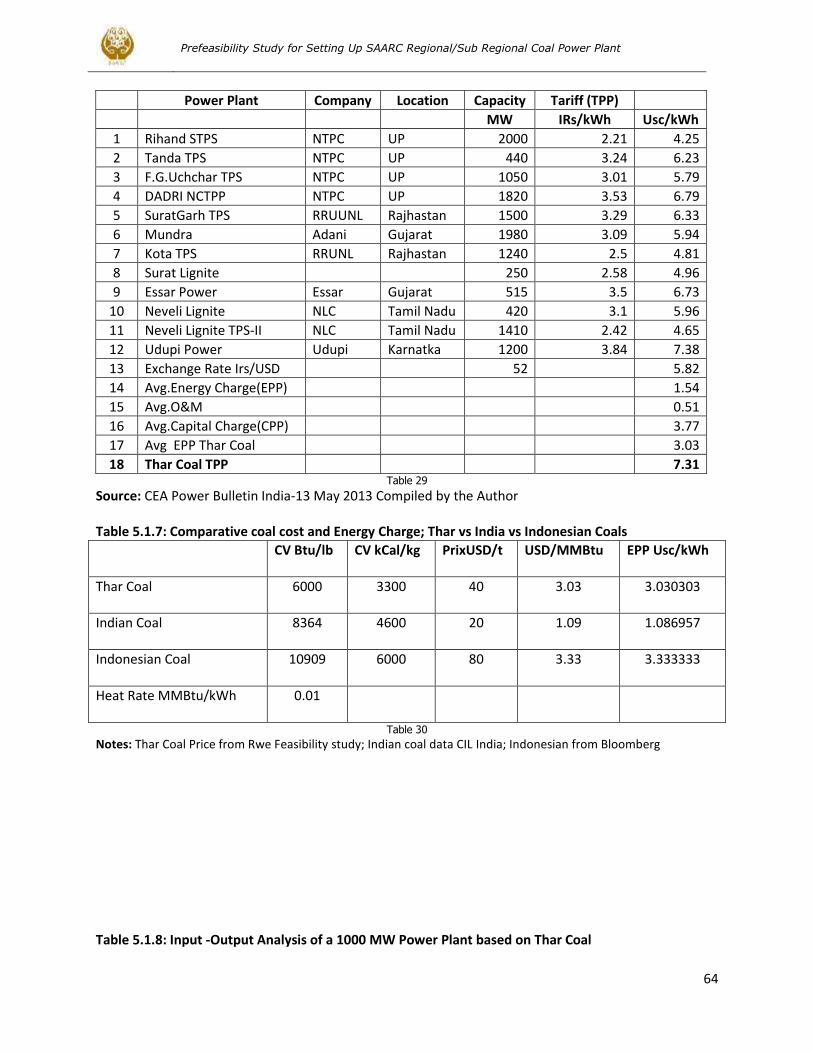
Prefeasibility Study for Setting Up SAARC Regional/Sub Regional Coal Power Plant
64
Power Plant Company Location Capacity Tariff (TPP)
MW IRs/kWh Usc/kWh
1 Rihand STPS NTPC UP 2000 2.21 4.25
2 Tanda TPS NTPC UP 440 3.24 6.23
3 F.G.Uchchar TPS NTPC UP 1050 3.01 5.79
4 DADRI NCTPP NTPC UP 1820 3.53 6.79
5 SuratGarh TPS RRUUNL Rajhastan 1500 3.29 6.33
6 Mundra Adani Gujarat 1980 3.09 5.94
7 Kota TPS RRUNL Rajhastan 1240 2.5 4.81
8 Surat Lignite
250 2.58 4.96
9 Essar Power Essar Gujarat 515 3.5 6.73
10 Neveli Lignite NLC Tamil Nadu 420 3.1 5.96
11 Neveli Lignite TPS-II NLC Tamil Nadu 1410 2.42 4.65
12 Udupi Power Udupi Karnatka 1200 3.84 7.38
13 Exchange Rate Irs/USD
52
5.82
14 Avg.Energy Charge(EPP)
1.54
15 Avg.O&M
0.51
16 Avg.Capital Charge(CPP)
3.77
17 Avg EPP Thar Coal
3.03
18 Thar Coal TPP
7.31 Table 29
Source: CEA Power Bulletin India-13 May 2013 Compiled by the Author Table 5.1.7: Comparative coal cost and Energy Charge; Thar vs India vs Indonesian Coals
CV Btu/lb CV kCal/kg PrixUSD/t USD/MMBtu EPP Usc/kWh
Thar Coal 6000 3300 40 3.03 3.030303
Indian Coal 8364 4600 20 1.09 1.086957
Indonesian Coal 10909 6000 80 3.33 3.333333
Heat Rate MMBtu/kWh 0.01
Table 30
Notes: Thar Coal Price from Rwe Feasibility study; Indian coal data CIL India; Indonesian from Bloomberg
Table 5.1.8: Input -Output Analysis of a 1000 MW Power Plant based on Thar Coal
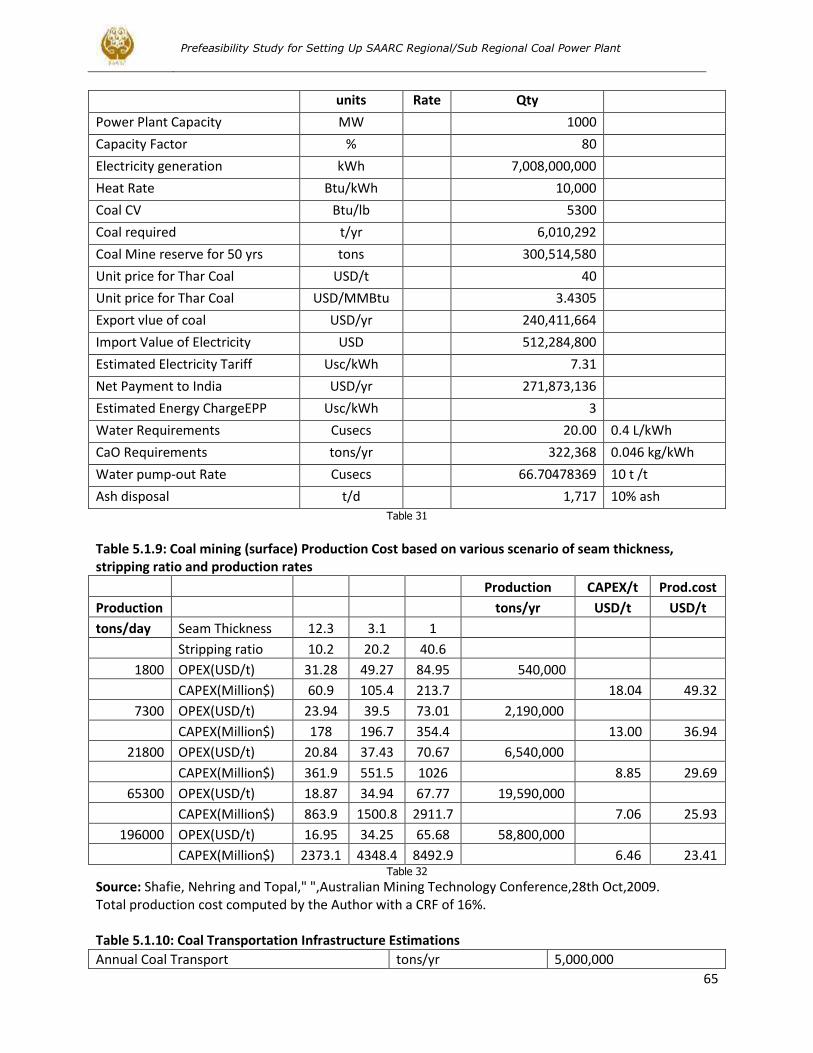
Prefeasibility Study for Setting Up SAARC Regional/Sub Regional Coal Power Plant
65
units Rate Qty
Power Plant Capacity MW
1000
Capacity Factor %
80
Electricity generation kWh
7,008,000,000
Heat Rate Btu/kWh
10,000
Coal CV Btu/lb
5300
Coal required t/yr
6,010,292
Coal Mine reserve for 50 yrs tons
300,514,580
Unit price for Thar Coal USD/t
40
Unit price for Thar Coal USD/MMBtu
3.4305
Export vlue of coal USD/yr
240,411,664
Import Value of Electricity USD
512,284,800
Estimated Electricity Tariff Usc/kWh
7.31
Net Payment to India USD/yr
271,873,136
Estimated Energy ChargeEPP Usc/kWh
3
Water Requirements Cusecs
20.00 0.4 L/kWh
CaO Requirements tons/yr
322,368 0.046 kg/kWh
Water pump-out Rate Cusecs
66.70478369 10 t /t
Ash disposal t/d
1,717 10% ash
Table 31
Table 5.1.9: Coal mining (surface) Production Cost based on various scenario of seam thickness, stripping ratio and production rates
Production CAPEX/t Prod.cost
Production
tons/yr USD/t USD/t
tons/day Seam Thickness 12.3 3.1 1
Stripping ratio 10.2 20.2 40.6
1800 OPEX(USD/t) 31.28 49.27 84.95 540,000
CAPEX(Million$) 60.9 105.4 213.7
18.04 49.32
7300 OPEX(USD/t) 23.94 39.5 73.01 2,190,000
CAPEX(Million$) 178 196.7 354.4
13.00 36.94
21800 OPEX(USD/t) 20.84 37.43 70.67 6,540,000
CAPEX(Million$) 361.9 551.5 1026
8.85 29.69
65300 OPEX(USD/t) 18.87 34.94 67.77 19,590,000
CAPEX(Million$) 863.9 1500.8 2911.7
7.06 25.93
196000 OPEX(USD/t) 16.95 34.25 65.68 58,800,000
CAPEX(Million$) 2373.1 4348.4 8492.9
6.46 23.41
Table 32
Source: Shafie, Nehring and Topal," ",Australian Mining Technology Conference,28th Oct,2009. Total production cost computed by the Author with a CRF of 16%. Table 5.1.10: Coal Transportation Infrastructure Estimations
Annual Coal Transport tons/yr 5,000,000
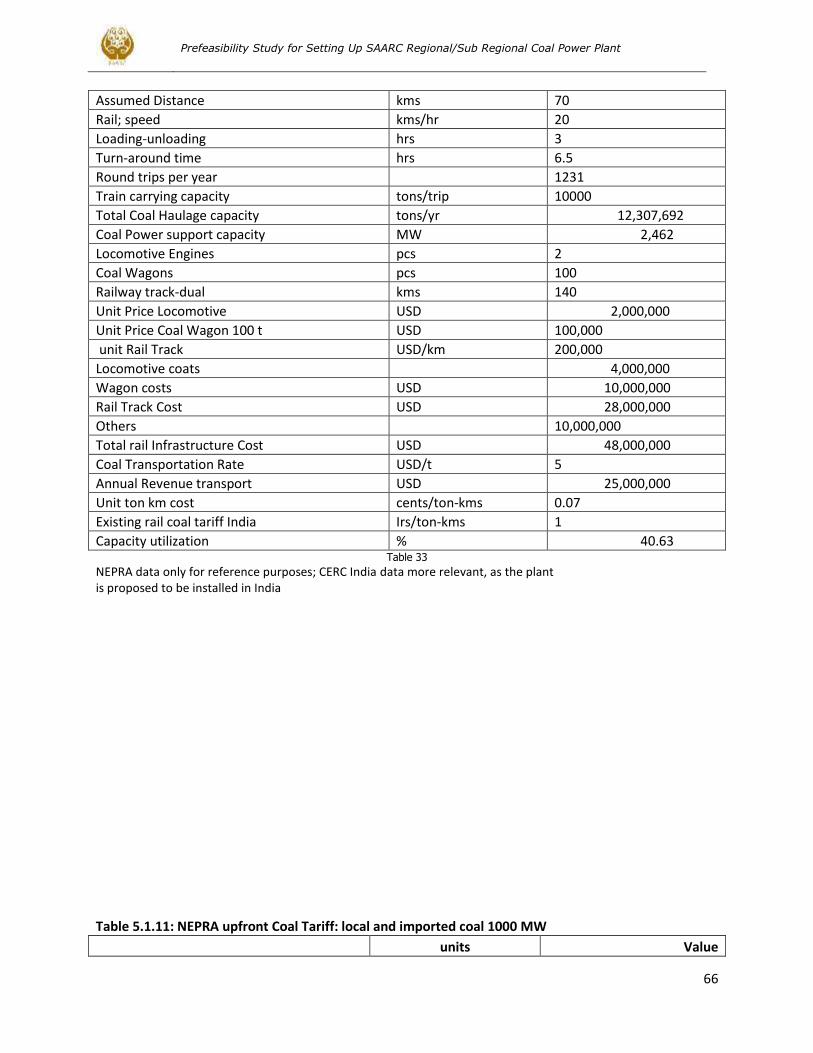
Prefeasibility Study for Setting Up SAARC Regional/Sub Regional Coal Power Plant
66
Assumed Distance kms 70
Rail; speed kms/hr 20
Loading-unloading hrs 3
Turn-around time hrs 6.5
Round trips per year
1231
Train carrying capacity tons/trip 10000
Total Coal Haulage capacity tons/yr 12,307,692
Coal Power support capacity MW 2,462
Locomotive Engines pcs 2
Coal Wagons pcs 100
Railway track-dual kms 140
Unit Price Locomotive USD 2,000,000
Unit Price Coal Wagon 100 t USD 100,000
unit Rail Track USD/km 200,000
Locomotive coats
4,000,000
Wagon costs USD 10,000,000
Rail Track Cost USD 28,000,000
Others
10,000,000
Total rail Infrastructure Cost USD 48,000,000
Coal Transportation Rate USD/t 5
Annual Revenue transport USD 25,000,000
Unit ton km cost cents/ton-kms 0.07
Existing rail coal tariff India Irs/ton-kms 1
Capacity utilization % 40.63 Table 33
NEPRA data only for reference purposes; CERC India data more relevant, as the plant is proposed to be installed in India
Table 5.1.11: NEPRA upfront Coal Tariff: local and imported coal 1000 MW
units Value
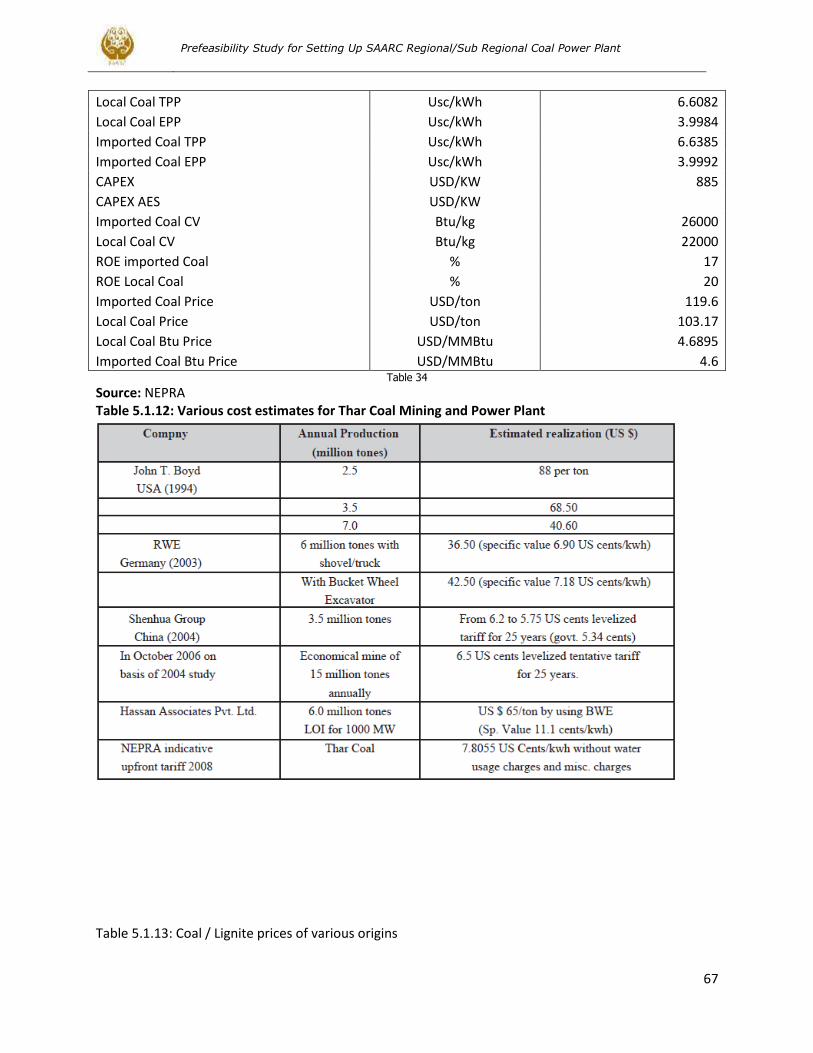
Prefeasibility Study for Setting Up SAARC Regional/Sub Regional Coal Power Plant
67
Local Coal TPP Usc/kWh 6.6082
Local Coal EPP Usc/kWh 3.9984
Imported Coal TPP Usc/kWh 6.6385
Imported Coal EPP Usc/kWh 3.9992
CAPEX USD/KW 885
CAPEX AES USD/KW Imported Coal CV Btu/kg 26000
Local Coal CV Btu/kg 22000
ROE imported Coal % 17
ROE Local Coal % 20
Imported Coal Price USD/ton 119.6
Local Coal Price USD/ton 103.17
Local Coal Btu Price USD/MMBtu 4.6895
Imported Coal Btu Price USD/MMBtu 4.6 Table 34
Source: NEPRA Table 5.1.12: Various cost estimates for Thar Coal Mining and Power Plant
Table 5.1.13: Coal / Lignite prices of various origins
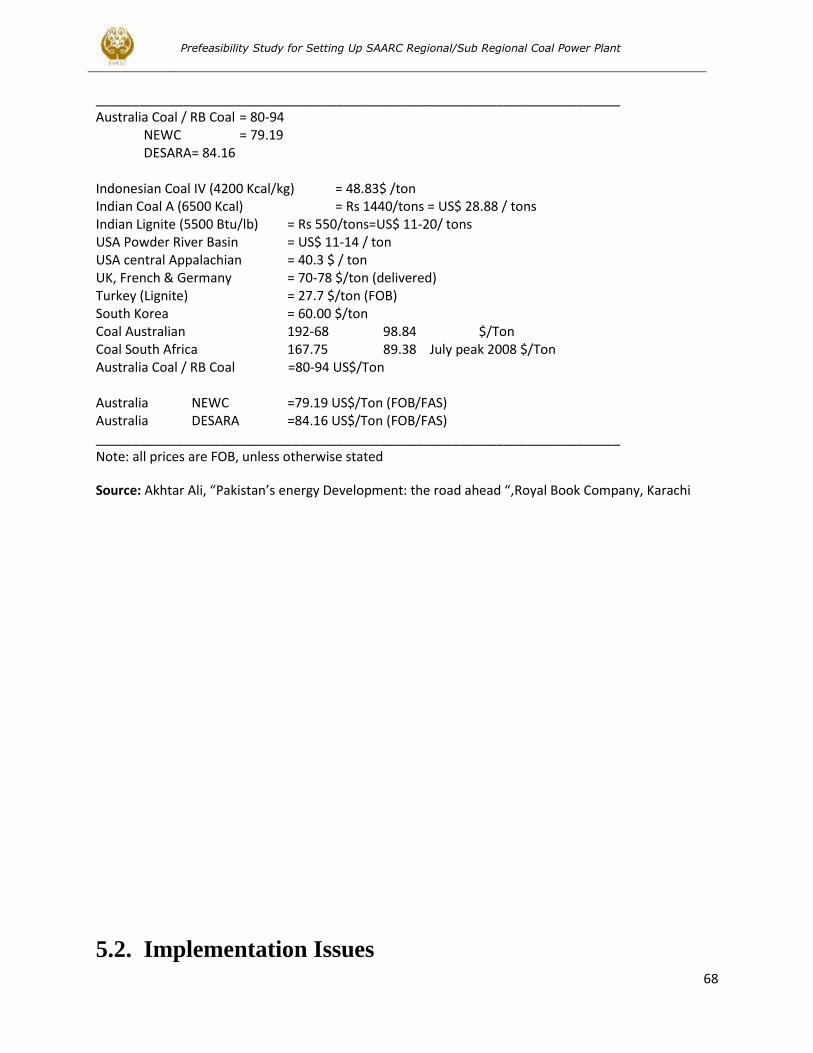
Prefeasibility Study for Setting Up SAARC Regional/Sub Regional Coal Power Plant
68
________________________________________________________________________ Australia Coal / RB Coal = 80-94 NEWC = 79.19 DESARA = 84.16 Indonesian Coal IV (4200 Kcal/kg) = 48.83$ /ton Indian Coal A (6500 Kcal) = Rs 1440/tons = US$ 28.88 / tons Indian Lignite (5500 Btu/lb) = Rs 550/tons=US$ 11-20/ tons USA Powder River Basin = US$ 11-14 / ton USA central Appalachian = 40.3 $ / ton UK, French & Germany = 70-78 $/ton (delivered) Turkey (Lignite) = 27.7 $/ton (FOB) South Korea = 60.00 $/ton Coal Australian 192-68 98.84 $/Ton Coal South Africa 167.75 89.38 July peak 2008 $/Ton Australia Coal / RB Coal =80-94 US$/Ton Australia NEWC =79.19 US$/Ton (FOB/FAS) Australia DESARA =84.16 US$/Ton (FOB/FAS) ________________________________________________________________________ Note: all prices are FOB, unless otherwise stated
Source: Akhtar Ali, “Pakistan’s energy Development: the road ahead “,Royal Book Company, Karachi
5.2. Implementation Issues
Prefeasibility Study for Setting Up SAARC Regional/Sub Regional Coal Power Plant
69
1. Transmission Facilities: The easiest and timely solution would be a bilateral Project transmission link between India-Pakistan and India-Bangladesh for respective sub-regional projects. The transmission code and protocols are to be as per importing country rules. Integration with Indian network for India’s needs are to be as per Indian grid Code. If HVDC networks are implemented in due course, these considerations may become irrelevant due to better integration flexibility offered by such systems. SAARC grid may be a long shot, although when it comes up, the project can be integrated with it. A purpose built transmission grid from mine to coal power plant has been proposed and has been included in the project cost. The transmission line would be alongside the proposed rail link. A dirt road parallel and close to these facilities would be a by-product of Rail and Transmission projects and would be handy in the transport link between the mine and the power plant. Alternatively, power can be routed through Indian local network to the proposed links (Pakistan India and Bangladesh-India) and exported via these non-project facilities. In that case only interlinking with the nearby Indian local transmission would have to be made. The proposed budget for transmission would take care of this aspect as the two are mutually exclusive. Following transmission links between the three countries are already under discussion.
Bangladesh-India Link
Under the electricity exchange programme with Bangladesh, transmission links at suitable locations will be established to supply power from Eastern India to Western Zone of Bangladesh and receive power from power surplus Eastern Zone of Bangladesh to North Eastern Region of India. Initially 2 No. 220 KV interconnections are under consideration to exchange power to the tune of 150 MW. With proposed large sized gas projects in Bangladesh, 400 KV interconnections with Eastern Region of India are envisaged.
The transmission utility Power Grid Corporation of India, which is executing the crucial 71km Baharampur-Bheramara transmission link, will complete the line by mid-August. The inauguration of the transmission link is being tentatively set for the first week of September. The location will have a capacity to wheel 500 megawatts of electricity, Full load testing, including 10 percent overload testing of the HVDC (high voltage direct current) back-to-back terminal is slated for mid-September 2013.A crucial part of the cooperation is a joint venture power project — named the Bangladesh-India Friendship Power Co Ltd. It is being set up India’s NTPC Ltd and the Bangladesh Power Development Board. The project, which will mark NTPC’s first joint venture abroad, will entail the setting up of 1,320 megawatt coal plant in Bagerhat in Bangladesh on a 50:50 basis. Under the arrangement, a total of 500 megawatt of power is slated to flow from India to Bangladesh, of which 250 megawatts will be from the centre’s unallocated quota of power (at rates notified by the Central Electricity Regulatory Commission) and the other 250 megawatts from the electricity market here.
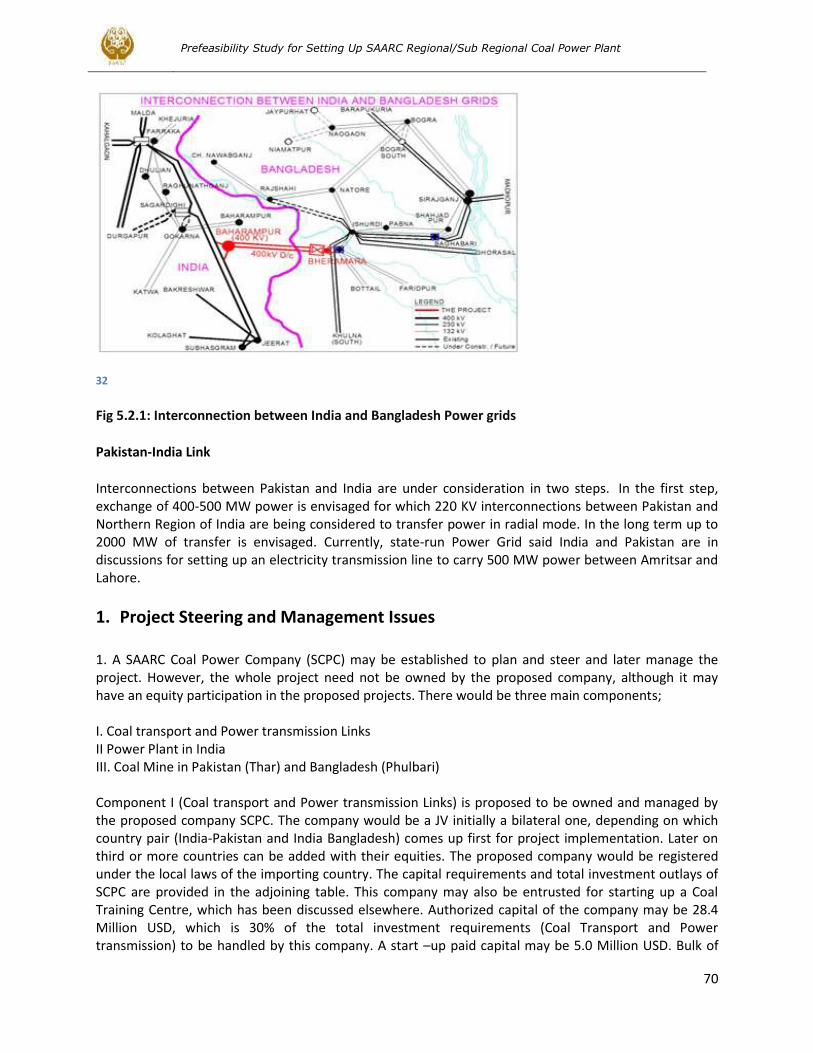
Prefeasibility Study for Setting Up SAARC Regional/Sub Regional Coal Power Plant
70
32
Fig 5.2.1: Interconnection between India and Bangladesh Power grids
Pakistan-India Link
Interconnections between Pakistan and India are under consideration in two steps. In the first step, exchange of 400-500 MW power is envisaged for which 220 KV interconnections between Pakistan and Northern Region of India are being considered to transfer power in radial mode. In the long term up to 2000 MW of transfer is envisaged. Currently, state-run Power Grid said India and Pakistan are in discussions for setting up an electricity transmission line to carry 500 MW power between Amritsar and Lahore.
1. Project Steering and Management Issues
1. A SAARC Coal Power Company (SCPC) may be established to plan and steer and later manage the project. However, the whole project need not be owned by the proposed company, although it may have an equity participation in the proposed projects. There would be three main components; I. Coal transport and Power transmission Links II Power Plant in India III. Coal Mine in Pakistan (Thar) and Bangladesh (Phulbari) Component I (Coal transport and Power transmission Links) is proposed to be owned and managed by the proposed company SCPC. The company would be a JV initially a bilateral one, depending on which country pair (India-Pakistan and India Bangladesh) comes up first for project implementation. Later on third or more countries can be added with their equities. The proposed company would be registered under the local laws of the importing country. The capital requirements and total investment outlays of SCPC are provided in the adjoining table. This company may also be entrusted for starting up a Coal Training Centre, which has been discussed elsewhere. Authorized capital of the company may be 28.4 Million USD, which is 30% of the total investment requirements (Coal Transport and Power transmission) to be handled by this company. A start –up paid capital may be 5.0 Million USD. Bulk of
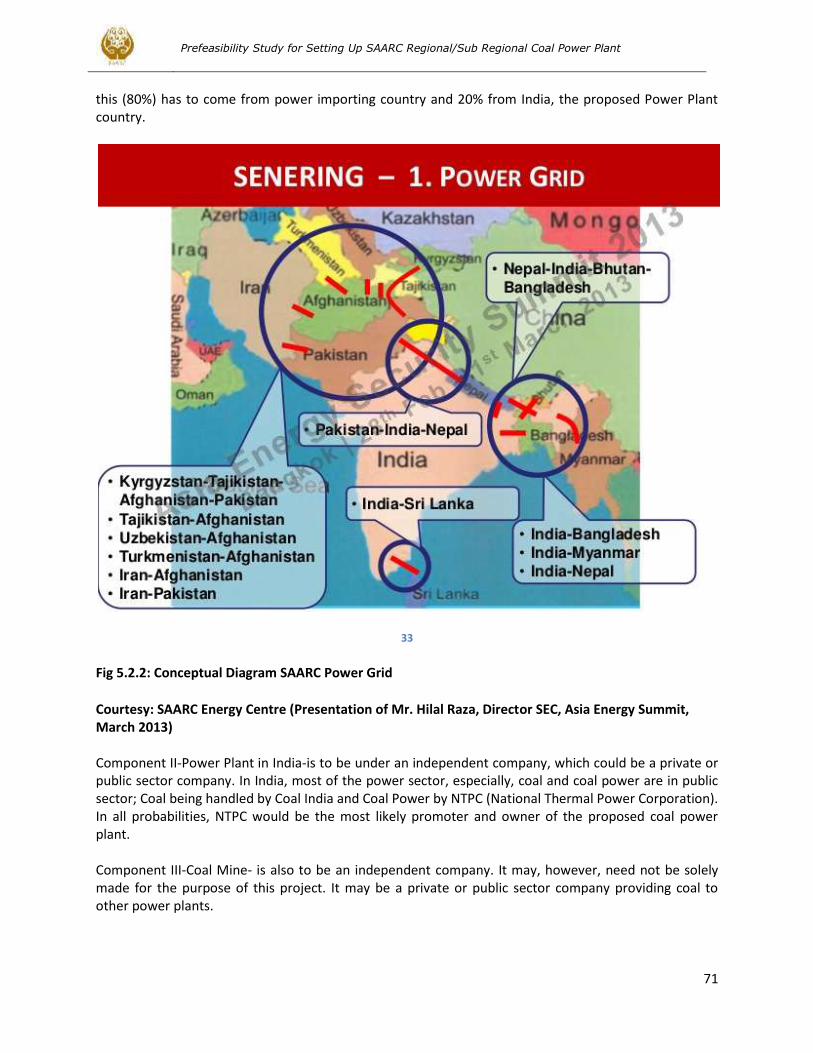
Prefeasibility Study for Setting Up SAARC Regional/Sub Regional Coal Power Plant
71
this (80%) has to come from power importing country and 20% from India, the proposed Power Plant country.
33
Fig 5.2.2: Conceptual Diagram SAARC Power Grid
Courtesy: SAARC Energy Centre (Presentation of Mr. Hilal Raza, Director SEC, Asia Energy Summit, March 2013) Component II-Power Plant in India-is to be under an independent company, which could be a private or public sector company. In India, most of the power sector, especially, coal and coal power are in public sector; Coal being handled by Coal India and Coal Power by NTPC (National Thermal Power Corporation). In all probabilities, NTPC would be the most likely promoter and owner of the proposed coal power plant. Component III-Coal Mine- is also to be an independent company. It may, however, need not be solely made for the purpose of this project. It may be a private or public sector company providing coal to other power plants.
Prefeasibility Study for Setting Up SAARC Regional/Sub Regional Coal Power Plant
72
2. Contractual Arrangements 1. Bilateral Treaty may have to be signed between the coal exporting and Power-importing countries under which the proposed framework project is approved. Sovereign Guarantees for payments may be required to be covered under the proposed treaty. 2. A Fuel Supply Agreement would be signed between the Mining company the proposed project company (SCPC) and thus it would be an internal arrangement within the Coal exporting country. Project Company would make payments to the Coal Mining Company. 3. A Power Purchase Agreement (PPA) would have to be signed between the project company SCPC and the Power Plant Company and thus it would be an across border agreement between the two companies under the bilateral treaty. Pricing Mechanism can be agreed to be a multiplier on CERC (Central Electric Regulatory Authority, India) rates. There is an elaborate CERC framework that is already there. Although meant for domestic supply, it can be relevant for export as well. Tax treatments will have to be worked out under a framework agreement/Bilateral Treaty. The Project Company SCPC will make payments to Power Plant Company under the proposed frame work. 4. SCPC will sell to DISCO or CPPA in case of Pakistan and to relevant counterparties in Bangladesh. Regulatory Bodies (NEPRA/BPRA) would provide the regulatory oversight to the transactions. Table 5.2.1: Proposed Capital of SCPC(SAARC Coal Power Company) Outlay(Million USD)
Coal Transport Rail Link 48
Power Transmission 50
Total 98
Capital/Equity 29.4
Authorized capital 29.4
Start up Paid -up Capital o/w 5
Pakistan or Bangladesh Share 4 India Share 1
Table 35
Energy Trading Issues: As this is a special purpose investment with free fuel supplies, only Fixed Charges(CPP) and Operating Expenditure(O&M) is to be billed to the customer, Energy Trading(through energy exchanges) is not applicable to this case. The proposed SCPC would invite bids either; a)CAPEX bids under CERC India framework or more simply ;b)quotes for Production Services(CPP+O&M) with suitable indexation for 20 years. As the Power Plant is proposed to be built in India, there is precedence and acceptance of both models there.
Power Supply to India
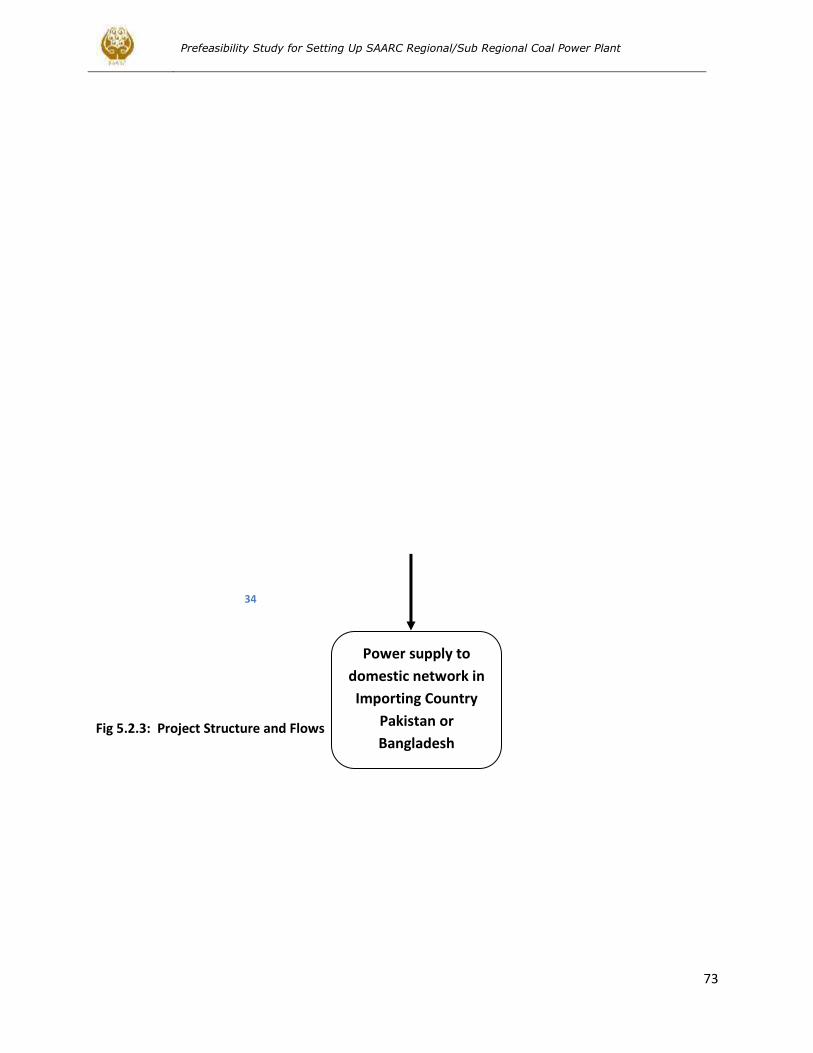
Prefeasibility Study for Setting Up SAARC Regional/Sub Regional Coal Power Plant
73
Fig 5.2.3: Project Structure and Flows
Power supply to
domestic network in
Importing Country
Pakistan or
Bangladesh
34
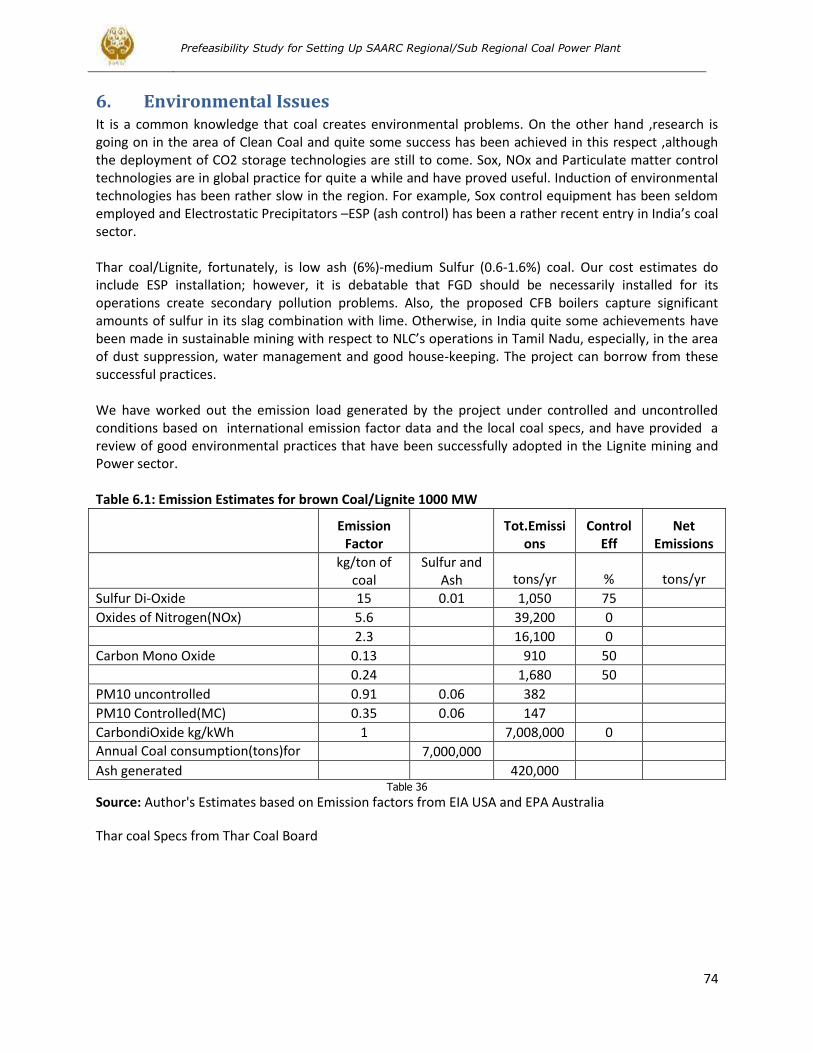
Prefeasibility Study for Setting Up SAARC Regional/Sub Regional Coal Power Plant
74
6. Environmental Issues It is a common knowledge that coal creates environmental problems. On the other hand ,research is going on in the area of Clean Coal and quite some success has been achieved in this respect ,although the deployment of CO2 storage technologies are still to come. Sox, NOx and Particulate matter control technologies are in global practice for quite a while and have proved useful. Induction of environmental technologies has been rather slow in the region. For example, Sox control equipment has been seldom employed and Electrostatic Precipitators –ESP (ash control) has been a rather recent entry in India’s coal sector. Thar coal/Lignite, fortunately, is low ash (6%)-medium Sulfur (0.6-1.6%) coal. Our cost estimates do include ESP installation; however, it is debatable that FGD should be necessarily installed for its operations create secondary pollution problems. Also, the proposed CFB boilers capture significant amounts of sulfur in its slag combination with lime. Otherwise, in India quite some achievements have been made in sustainable mining with respect to NLC’s operations in Tamil Nadu, especially, in the area of dust suppression, water management and good house-keeping. The project can borrow from these successful practices. We have worked out the emission load generated by the project under controlled and uncontrolled conditions based on international emission factor data and the local coal specs, and have provided a review of good environmental practices that have been successfully adopted in the Lignite mining and Power sector. Table 6.1: Emission Estimates for brown Coal/Lignite 1000 MW
Emission
Factor
Tot.Emissions
Control Eff
Net Emissions
kg/ton of
coal Sulfur and
Ash tons/yr % tons/yr
Sulfur Di-Oxide 15 0.01 1,050 75 Oxides of Nitrogen(NOx) 5.6
39,200 0
2.3
16,100 0 Carbon Mono Oxide 0.13
910 50
0.24
1,680 50 PM10 uncontrolled 0.91 0.06 382
PM10 Controlled(MC) 0.35 0.06 147 CarbondiOxide kg/kWh 1
7,008,000 0
Annual Coal consumption(tons)for 1000 MW
7,000,000 Ash generated
420,000
Table 36
Source: Author's Estimates based on Emission factors from EIA USA and EPA Australia
Thar coal Specs from Thar Coal Board
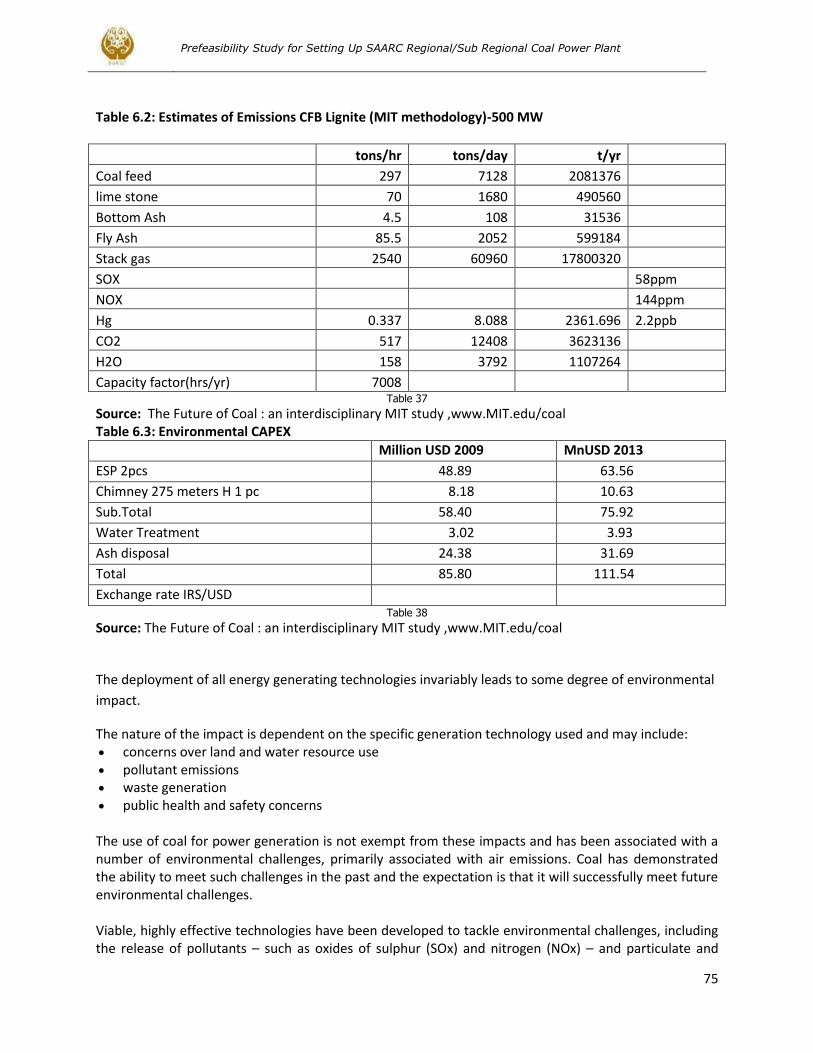
Prefeasibility Study for Setting Up SAARC Regional/Sub Regional Coal Power Plant
75
Table 6.2: Estimates of Emissions CFB Lignite (MIT methodology)-500 MW
tons/hr tons/day t/yr
Coal feed 297 7128 2081376 lime stone 70 1680 490560 Bottom Ash 4.5 108 31536 Fly Ash 85.5 2052 599184 Stack gas 2540 60960 17800320 SOX
58ppm
NOX
144ppm
Hg 0.337 8.088 2361.696 2.2ppb
CO2 517 12408 3623136 H2O 158 3792 1107264 Capacity factor(hrs/yr) 7008
Table 37
Source: The Future of Coal : an interdisciplinary MIT study ,www.MIT.edu/coal Table 6.3: Environmental CAPEX
Million USD 2009 MnUSD 2013
ESP 2pcs 48.89 63.56
Chimney 275 meters H 1 pc 8.18 10.63
Sub.Total 58.40 75.92
Water Treatment 3.02 3.93
Ash disposal 24.38 31.69
Total 85.80 111.54
Exchange rate IRS/USD Table 38
Source: The Future of Coal : an interdisciplinary MIT study ,www.MIT.edu/coal
The deployment of all energy generating technologies invariably leads to some degree of environmental
impact.
The nature of the impact is dependent on the specific generation technology used and may include: concerns over land and water resource use pollutant emissions waste generation public health and safety concerns The use of coal for power generation is not exempt from these impacts and has been associated with a number of environmental challenges, primarily associated with air emissions. Coal has demonstrated the ability to meet such challenges in the past and the expectation is that it will successfully meet future environmental challenges. Viable, highly effective technologies have been developed to tackle environmental challenges, including the release of pollutants – such as oxides of sulphur (SOx) and nitrogen (NOx) – and particulate and
Prefeasibility Study for Setting Up SAARC Regional/Sub Regional Coal Power Plant
76
trace elements, such as mercury. More recently, the focus has been on developing and deploying technologies to tackle greenhouse gas emissions associated with the use of coal, including carbon dioxide (CO2) and methane (CH4). Reducing Pollution
Technologies are now available to improve the environmental performance of coal-fired power stations for a range of pollutants. In many cases a number of technologies are available to mitigate any given environmental impact. Which technology option is selected for a power plant will vary depending on its specific characteristics such as location, age, and fuel source. The maturity of environmental technologies varies substantially, with some being widely deployed and available ‘off the shelf’ to new innovative technologies which are still in the demonstration phase. A key strategy in the mitigation of coal’s environmental impacts is to improve the energy efficiency of power plants. Efficient plants burn less coal per unit of energy produced and consequently has lower associated environmental impacts. Efficiency improvements, particularly those related to combustion technologies, are an active area of research and an important component of a climate change mitigation strategy. Coal Washing
Mined coal is of variable quality and is frequently associated with mineral and chemical material including clay, sand, sulphur and trace elements. Coal cleaning by washing and beneficiation removes this associated material, prepares the coal to customer specifications and is an important step in reducing emissions from coal use. Coal cleaning reduces the ash content of coal by over 50% resulting in less waste, lower sulphur dioxide (SO2) emissions and improved thermal efficiencies, leading to lower CO2 emissions. While coal preparation is standard practice in many countries, greater uptake in developing countries is needed as a low-cost way to improve the environmental performance of coal. Particulates
Particulate emissions are finely divided solid and liquid (other than water) substances that are emitted from power stations. Particulates can affect people’s respiratory systems, impact local visibility and cause dust problems. A number of technologies have been developed to control particulate emissions and are widely deployed in both developed and developing countries, including: electrostatic precipitators fabric filters or bag houses wet particulate scrubbers hot gas filtration systems. Electrostatic precipitators (ESP) are the most widely used particulate control technology and use an electrical field to create a charge on particles in the flue gas in order to attract them to collecting plates. Fabric filters collect particulates from the flue gas as it passes through the tightly woven fabric of the bag. Both ESP and fabric filters are highly efficient, removing over 99.95% of particulate emissions. Wet scrubbers are used to capture both particulates and SO2 by injecting water droplets into the flue gas to form a wet by-product. The addition of lime to the water helps to increase SO2 removal.
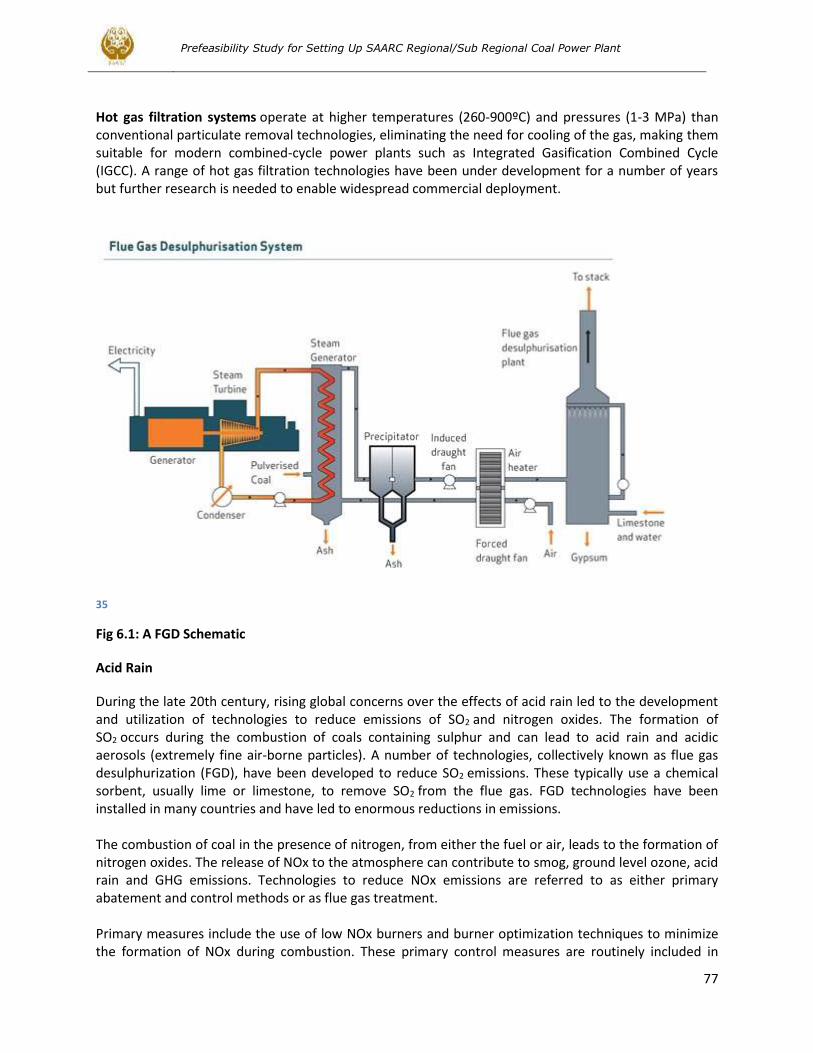
Prefeasibility Study for Setting Up SAARC Regional/Sub Regional Coal Power Plant
77
Hot gas filtration systems operate at higher temperatures (260-900ºC) and pressures (1-3 MPa) than conventional particulate removal technologies, eliminating the need for cooling of the gas, making them suitable for modern combined-cycle power plants such as Integrated Gasification Combined Cycle (IGCC). A range of hot gas filtration technologies have been under development for a number of years but further research is needed to enable widespread commercial deployment.
35
Fig 6.1: A FGD Schematic
Acid Rain
During the late 20th century, rising global concerns over the effects of acid rain led to the development and utilization of technologies to reduce emissions of SO2 and nitrogen oxides. The formation of SO2 occurs during the combustion of coals containing sulphur and can lead to acid rain and acidic aerosols (extremely fine air-borne particles). A number of technologies, collectively known as flue gas desulphurization (FGD), have been developed to reduce SO2 emissions. These typically use a chemical sorbent, usually lime or limestone, to remove SO2 from the flue gas. FGD technologies have been installed in many countries and have led to enormous reductions in emissions. The combustion of coal in the presence of nitrogen, from either the fuel or air, leads to the formation of nitrogen oxides. The release of NOx to the atmosphere can contribute to smog, ground level ozone, acid rain and GHG emissions. Technologies to reduce NOx emissions are referred to as either primary abatement and control methods or as flue gas treatment. Primary measures include the use of low NOx burners and burner optimization techniques to minimize the formation of NOx during combustion. These primary control measures are routinely included in
Prefeasibility Study for Setting Up SAARC Regional/Sub Regional Coal Power Plant
78
newly built power stations and may also be retrofitted when reductions in NOx emissions are required. Alternatively technologies such as Selective Catalytic Reduction (SCR) and Selective Non-Catalytic Reduction (SNCR) lower NOx emissions by treating the NOx post-combustion in the flue gas. SCR technology has been used commercially for almost 30 years and is now deployed throughout the world, removing between 80-90% of NOx emissions at a given plant. Research is under way to develop combined SO2/NOx removal technologies. Such technologies are technically challenging and expensive but new advances hold the promise of overcoming these issues. Trace Elements
Coal is a chemically complex substance, naturally containing many trace elements including mercury, selenium and arsenic. The combustion of coal can result in trace elements being released from power stations with potentially harmful impacts to both human health and the environment. A number of technologies are used to limit the release of trace elements including coal washing, particulate control devices, fluidised bed combustion, activated carbon injection and FGDs. The choice of mitigation technology will be dependent on the trace elements present and local air quality standard objectives. Research is ongoing to develop better sorbents and reagents that will improve the performance of FGD with respect to trace element removal. Waste
The combustion of coal generates waste consisting primarily of non-combustible mineral matter along with a small amount of unreacted carbon. The production of this waste can be minimised by coal cleaning prior to combustion. This represents a cost-effective method of providing high quality coal, while helping to reduce power station waste and increasing efficiencies. Waste can be further minimised through the use of high efficiency coal combustion technologies. There is increasing awareness of the opportunities to reprocess power station waste into valuable materials for use primarily in the construction and civil engineering industry. A wide variety of uses have been developed for coal waste including boiler slag for road surfacing, fluidised bed combustion waste as an agricultural lime and the addition of fly ash to cement . Clean Coal Technology
In India, most coal power plants only employ only ESPs for controlling dust and ash emissions, as India has high ash coal. There is hardly any FGD installation in India in Coal Power Plants. Most Power plants in India run on Pulverized technology which involves high temperature coal burning generating NOx, control installations for NOx are rare in South Asia. However, Lignite Power plants in India mostly employ CFB technology that has built in burning system that controls and reduces Sox formation. Also the lower burning temperature in CFB, reduces NOx formation. We have proposed CFB technology that is expected to do the needful. It is to be admitted that Coal combustion is the greatest source of generation of GHGs.CCS control technologies are still under development and have not been yet deployed commercially. For a poor South Asia, CCS appears to be a theoretical issue for quite some time to come, despite inequitable policies and pressures pursued by environmental lobbies of the industrialized countries. This study has, therefore, excluded GHG components from the project considerations. In the following, we provide some conceptual information:
Prefeasibility Study for Setting Up SAARC Regional/Sub Regional Coal Power Plant
79
Power plants being built today emit 90 percent less pollutants (SO2, NOx, particulates and mercury) than the plants they replace from the 1970s, according the National Energy Technology Laboratory (NETL). Regulated emissions from coal-based electricity generation have decreased overall by over 40 percent since the 1970s, while coal use has tripled. Examples of technologies that are deployed today and continue to be improved upon include:
Fluidized-bed combustion –Limestone and dolomite are added during the combustion process to mitigate sulfur dioxide formation. There are 170 of these units deployed in the U.S. and 400 throughout the world.
Integrated Gasification Combined Cycle (IGCC) – Heat and pressure are used to convert coal into a gas or liquid that can be further refined and used cleanly. The heat energy from the gas turbine also powers a steam turbine. IGCC has the potential to improve coal’s fuel efficiency rate to 50 percent. Two IGCC electricity generation plants are in operation in the U.S.
Flue Gas Desulfurization – Also called “scrubbers,” and removes large quantities of sulfur, other impurities and particulate matter from emissions to prevent their release into the atmosphere.
Low Nitrogen Oxide (NOx) Burners – Reduce the creation of NOx, a cause of ground-level ozone, by restricting oxygen and manipulating the combustion process. Low NOx burners are now on 75 percent of existing coal power plants.
Selective Catalytic Reduction (SCR) – Achieves NOx reductions of 80-90 percent or more and is deployed on approximately 30 percent of U.S. coal plants.
Electrostatic Precipitators – Remove particulates from emissions by electrically charging particles and then capturing them on collection plates.
Clean Coal Technologies on the Horizon -New federal programs, such as the Clean Coal Power Initiative (CCPI), focus on eliminating emissions of pollutants, including particulates and mercury; improving technologies to increase efficiency and thereby reduce carbon dioxide and other emissions; and reducing carbon dioxide emissions through carbon capture and storage. Other technologies such as coal liquefaction and gasification are being pursued to produce low cost, secure alternatives to oil and natural gas for use in electricity generation and transportation. Focus areas for new technology R&D include: Efficiency Improvements – To raise plant efficiency and reduce carbon dioxide (CO2) and other emissions. While some efficiency technologies are commercially available, others, such as Ultra Supercritical Pulverized Coal (USPC) and IGCC require continued research, development and demonstration. Improved efficiency at an existing plant can reduce CO2 emissions by 10-16 percent, and by 2025, new units could reduce CO2 emissions by as much as 30 percent. Green House Gases (GHG)
Gases that trap heat in the atmosphere are called greenhouse gases.
Carbon dioxide (CO2) : Carbon dioxide enters the atmosphere through burning fossil fuels (coal, natural
gas and oil), solid waste, trees and wood products, and also as a result of certain chemical reactions
(e.g., manufacture of cement). Carbon dioxide is removed from the atmosphere (or "sequestered")
when it is absorbed by plants as part of the biological carbon cycle.
Methane (CH4) : Methane is emitted during the production and transport of coal, natural gas,
and oil. Methane emissions also result from livestock and other agricultural practices and by
the decay of organic waste in municipal solid waste landfills.

Prefeasibility Study for Setting Up SAARC Regional/Sub Regional Coal Power Plant
80
Nitrous oxide (N2O) : Nitrous oxide is emitted during agricultural and industrial activities, as well as during combustion of fossil fuels and solid waste.
Carbon Capture and Storage (CCS) – Captures and stores CO2 emissions in geologic formations or deep in the ocean where it dissolves under pressure. CCS technologies under development include:
• Post-combustion capture from flue gas using an amine solvent and chilled ammonia
• Pre-combustion capture using IGCC to isolate and capture CO2 before it is released
• Oxy-Coal combustion using pure oxygen in the boiler to significantly reduce the dilution of CO2 in the exhaust gas stream
Prefeasibility Study for Setting Up SAARC Regional/Sub Regional Coal Power Plant
81
7. Conclusions and Recommendations 1) Following three project options have been explored in this study;
Pakistan: Mine Mouth Coal Power Plant at Thar
Pakistan: Thar coal transported to Power plant located in India in the adjacent border region (Barmer district)
Bangladesh: Coal Mining at Phulbari and coal transported to Power Plant in adjacent border region (Dakshin Dinajpur district)
There were two major overriding criteria against which project options have been explored;
Utilization of national and regional energy resources and raw materials
Utilization of regional technology , know-how and resources .Considering limitations on travel and across-the-border investment activities, this implied the necessity of installing coal power plants in India and thus transport of coal to India from Pakistan(Thar) and Bangladesh(Phulbari)
There are many other benefits in locating the power plants in India. Apart from technology and know-how in India, there is an established cost, investment, regulatory and pricing framework in that country which would facilitate and encourage private sector investment from India. Other impact criteria include the following:
Promotion of bilateral and regional trade
Foreign Exchange savings
Private sector participation
Minimal burden on SAARC and national governments
Significant Impact on Energy supplies
Financial competitiveness 2) Based on the afore-mentioned, option #1 of mine-mouth power plant has been excluded from further consideration. And option #2 and #3 have been selected based on coal transport model. It is a happy coincidence that Thar and Phulbari coal resources share identical characteristics in terms of geographical location i.e. both are located in border regions with India. A distance of 70 kms has been budgeted for in estimating logistics infrastructure cost. Coal is to be transported through a purpose built dedicated rail track to Indian border regions(Barmer district in Rajasthan in case of Thar coal and Dakshin Dinajpur district in West Bengal India).Similarly Electricity is to be transported back thru a specially laid transmission link parallel to the rail-track , from India to Phulbari and Thar for onwards transmission. 3) The projects (Mining in Pakistan and Bangladesh and Coal power plant in India) are to be financed by private sectors in the three countries, although there should be no bar in national governments preferring to acquire minority share-holding. Transmission and rail link investments can be owned and financed by a proposed SAARC company (detailed later) or internalized within projects in national boundaries. The role of SAARC and the national governments is to facilitate the project and its covenants GSPA (General Sales and purchase Agreements), PPAs (Power Purchase Agreements), guarantees including sovereign guarantees etc. 4) Project Phasing: Phulwari Coal Mining Project despite its great potential is suffering from opposition of many quarters including environmentalists, farmers, political parties and the general public. There are other project design operations that have been proposed such as underground mining that may not cause significant land and livings losses of the farmers and better environmental foot-print. India has
Prefeasibility Study for Setting Up SAARC Regional/Sub Regional Coal Power Plant
82
offered a coal power plant to Bangladesh based on imported coal and the deal is reportedly at an advanced stages. On the other hand being a desert and a thinly populated area, Thar has not invited any controversy and opposition. It has therefore been recommended that Thar Coal-Pakistan project be taken in phase one and Phulwari-Bangladesh project be taken up in phase two.
1. The proposed concept under which Power Plant(s) of 1000 MW or equivalent capacity are installed by India with coal imports from Coal mines developed in Pakistan and Bangladesh appears to be viable and attractive. It is commercially viable and implementable in the shortest possible time. From the point of view of practical security constraints, the proposed model is even more attractive, being the least intrusive. As Coal Power market and industry is highly developed in India, it would be cheaper and faster to build a coal power plant in India.
2. The project may be implemented in several phases; Phase I could be the model 1000 MW plant based on Thar coal; Phase II could be a similar capacity project based on Phulbari Coal. The phasing has been proposed due to political opposition to Phulbari mining project from the public and local residents.
3. A SAARC Coal Power Company (SCPC) may be established to plan and steer and later manage the project. However, the whole project need not be owned by the proposed company, although it may have an equity participation in the proposed projects. There would be three main components;
I. Coal transport and Power transmission Links II Power Plant in India III. Coal Mine in Pakistan (Thar) and Bangladesh (Phulbari)
Component I (Coal transport and Power transmission Links) is proposed to be owned and managed by the proposed company SCPC. The company would be a JV initially a bilateral one, depending on which country pair (India-Pakistan and India Bangladesh) comes up first for project implementation. Later on third or more countries can be added with their equities. The proposed company would be registered under the local laws of the importing country. The capital requirements and total investment outlays of SCPC are provided in the adjoining table. This company may also be entrusted for starting up a Coal Training Centre, which has been discussed elsewhere. Authorized capital of the company may be 28.4 Million USD, which is 30% of the total investment requirements (Coal Transport and Power transmission) to be handled by this company. A start –up paid capital may be 5.0 Million USD. Bulk of this (80%) has to come from power importing country and 20% from India, the proposed Power Plant country. Component II-Power Plant in India-is to be under an independent company, which could be a private or public sector company. In India, most of the power sector, especially, coal and coal power are in public sector; Coal being handled by Coal India and Coal Power by NTPC (National Thermal Power Corporation). In all probabilities, NTPC would be the most likely promoter and owner of the proposed coal power plant. Component III-Coal Mine- is also to be an independent company. It may, however, need not be solely made for the purpose of this project. It may be a private or public sector company providing coal to other power plants. 4. A working group may be formed with members from the three countries, India, Pakistan and Bangladesh, under the SEC secretariat to steer the project .Officials and private sector may be taken from the relevant bodies like Thar Coal Energy Board, PPIB, NTPC, Ministries and Federations of Chamber of Commerce and Industries in the three countries.
Prefeasibility Study for Setting Up SAARC Regional/Sub Regional Coal Power Plant
83
5. Mine locations and siting studies along with reserve proving drilling work may be initiated by the respective countries under their own administrative and commercial domains. Location and siting studies may be commissioned in India for the proposed power plant. 6. A prefeasibility study be commissioned for establishing a regional Coal Training Centre under SAARC. Human resource constraints may hamper coal power development in the participating countries, while India can offer technology, pedagogy and facilities for the purpose. A regional coal laboratory may also be a part of such a training centre 7.As this is a special purpose investment with free fuel supplies, only Fixed Charges(CPP) and Operating Expenditure(O&M) is to be billed to the customer, Energy Trading(through energy exchanges) is not applicable to this case. The proposed SCPC would invite bids either; a)CAPEX bids under CERC India framework or more simply ;b)quotes for Production Services(CPP+O&M) with suitable indexation for 20 years. As the Power Plant is proposed to be built in India, there is precedence and acceptance of both models there.
Prefeasibility Study for Setting Up SAARC Regional/Sub Regional Coal Power Plant
84
Appendices
Appendix-I:
An overview of Coal/lignite Mining and Coal Power cost structure in India
CERC India 2012
Benchmark Coal Power Plant costs: Hard Costs
IRs 4.44-5.08 Crore/MW for 500-800 MW capacities
14.1 Model has been prepared for hard cost of units of sizes 500/660/800 MW. Financing cost, interest
during construction, taxes and duties, right of way charges, cost of R&R etc. would be additional and are
not factored in benchmark costs.
14.2 ESP package is considered as a part of SG package
14.3 Cost of transportation, insurance, statutory fees paid to IBR, IR etc is included
16. Cost towards erection, testing and commissioning should get indicated separately. 16.1 These costs
constitute minor percentage of total cost and have been factored in.
17.1 As stated above Model is broad based and detailing as desired is prerogative of project proponent,
variations on all these counts will have to be factored during prudence checks.
18.1 Most common commercial variables have been used based on discussions and interactions with
manufacturers, suppliers, developers, experts, industry and power utilities. Due to data limitations, it
may not be feasible to capture the impact of all the variables in the model. However, the variables used
in the model are considered adequate to provide a reasonable cost figure for “prudence check”.
Issue No.15
19. Coal Handling Plant / Ash Handling Plant Cost
19.1 These costs largely depend on plant layout, varying coal quantity due to import/indigenous type of
coal, storage requirement etc. Benchmarked cost is based on either track hopper or wagon tippler
scheme, whereas, depending upon the requirement, at times both the schemes are in use which needs
to be considered. Further, in case of Ash Handling Plant Cost, the Commission has considered only 5 km
of length, whereas in reality the overall length varies significantly depending on the layout.
20. Change in evacuation voltage level from 400KV to 765KV results in significant increase in switchyard
cost i.e. per bay cost almost trebles. While factoring evacuation voltage, Commission report is silent on
the following. As per Central Electricity Authority, the power evacuation voltage level has been typically
considered as 400KV for 2x500MW, 765KV for 2x660/800MW. However, Power evacuation voltage
Prefeasibility Study for Setting Up SAARC Regional/Sub Regional Coal Power Plant
85
levels are finalized by CTU/CEA based on present capacity of plant, future capacity addition provisions,
location of plant and beneficiaries of projects. Accordingly voltage levels are decided as 765 KV, 400KV
or both 765KV and 400KV levels. Accordingly number of lines both at 400KV & 765KV along with
associated 765/400KV Inter Connecting Transformers shall have to be considered. Provision of these
requirements should be considered as per project requirement. The base switchyard type taken for
thermal project in the CERC report appears to be only of AIS for 400 kV/765 kV. Factors for GIS type
switchyard should also be considered as these are being planned based on land availability and
environmental conditions. It appears Commission has only considered tie lines (dedicated lines) up to
pooling substation as twin conductor for 400KV. Provision of lines with high capacity configurations i.e.
quad conductor for 400KV & other variants based on line configurations should also be considered.
20.1 For the present, no correction is envisaged in the model. Deviations on this count
will be considered at the time of prudence based on facts of the case.
21. Packages not Considered in the Report: (a) Certain mandatory packages like Site Leveling, Station
Piping, Generator Bus duct, Startup Power cost, Construction Power cost have not been considered in
the CERC report. (b) Few other optional packages like Extra High Voltage cables package
400/220/132KV as per requirement), Gypsum Handling package, Lime Handling package, over head
lines/sub-stations for power supply to remote loads outside the plant like makeup water needs to be
considered. (c) Factors like diversions of existing overhead lines from project site to clear the land
should also be considered. (d) Off-late water availability has been a major concern for NTPC projects.
Because of this at times we are required to create a storage capacity for one to three months, which
again requires construction of Reservoir / Weir / Annicut / Barrage and these needs to be considered by
CERC.
21.2 Mandatory packages have been factored. Optional packages and specific issues like diversion of
lines, impact due to water availability will be dealt based on facts of case and deviations caused.
Issue No.18: Corrections in the Model
Conclusion
24. In view of the forgoing, we approve the benchmark norms as on December 2011 as per Annexure II
to this order for capital cost for Thermal Power Station/Unit size(s) 500/600/660/800 MW which shall be
taken into consideration while determining the capital cost in accordance with clause (2) of Regulation 7
of 2009 Tariff Regulations. The benchmark cost may be reviewed and updated on 6 monthly basis or at
such interval as may be decided by the Commission. We further direct that the generating companies
whose tariff is determined by the Commission under Section 62 of the Act shall be required to submit
information on the forms attached as Annexure III to this order in addition to the formats being
submitted in accordance with 2009.
Norms for Operating Costs
Lignite-fired thermal generating stations:
(i) All generating stations with 200 MW sets and above:
Prefeasibility Study for Setting Up SAARC Regional/Sub Regional Coal Power Plant
86
The auxiliary energy consumption norms shall be 0.5 percentage point more than the auxiliary energy
consumption norms of coal- based generating stations at (iv) (a) above. Provided that for the lignite fired
stations using CFBC technology, the auxiliary energy consumption norms shall be 1.5 percentage point
more than the auxiliary energy consumption norms of coal-based generating stations at (iv) (a) above.
(ii) Barsingsar Generating station of NLC using CFBC technology: 11.5%
(iii) TPS-I, TPS-I (Expansion) and TPS-II Stage-I&II of Neyveli Lignite Corporation Ltd.: TPS-I 12.0%
TPS-II 10.0%
TPS-I (Expansion) 9.50%
(iv) Lime stone consumption for lignite-based generating station using CFBC technology:
Barsingsar : 0.056 kg/kWh.
TPS-II (Expansion) :0.046 kg/kWh
Secondary fuel oil consumption
Coal-based generating stations other than at (c) below : 1.0 ml/kWh
(b) (i) Lignite-fired generating stations except stations based on CFBC technology and
TPS-I (ii) TPS-I
(iii) Lignite-fired generating stations based on CFBC technology
(c) Coal-based generating stations of DVC
Mejia TPS Unit I to IV 2.0 ml/kWh; Bokaro TPS 2.0 ml/kWh; Chandrapura TPS 3.0 ml/kWh; Durgapur TPS
2.4ml/kWh
(iv) Auxiliary Energy Consumption
(a) Coal-based generating stations except at (b) below:
With Natural Draft cooling tower or without cooling tower (i) 200 MW series 8.5%
New Thermal Generating Station achieving COD on or after 1.4.2009
(a) Coal-based and lignite-fired Thermal Generating Stations = 1.065 X Design Heat Rate (kCal/kWh)
Where the Design Heat Rate of a unit means the unit heat rate guaranteed by the supplier at conditions
of 100% MCR, zero percent make up, design coal and design cooling water temperature/back pressure.
Provided that the design heat rate shall not exceed the following maximum design unit
Lignite-fired Thermal Generating Stations Heat Rates
(1) For lignite-fired thermal generating stations, except for TPS-I and TPS- II (Stage I & II) of Neyveli Lignite Corporation Ltd, the gross station heat rates specified under sub-clause (a) for coal-based thermal generating stations shall be applied with correction, using multiplying factors as given below: (i) For lignite having 50% moisture: 1.10 (ii) For lignite having 40% moisture: 1.07 (iii) For lignite having 30% moisture: 1.04 (iv) For other values of moisture content, multiplying factor shall be pro- rated for moisture content between 30-40% and 40-50% depending upon the rated values of multiplying factor for the respective range given under sub-clauses (i) to (iii) above. (2) TPS-I and TPS-II (Stage I & II) of Neyveli Lignite Corporation Ltd TPS-I 4000 kCal/kWh TPS-II 2900 kCal/kWh
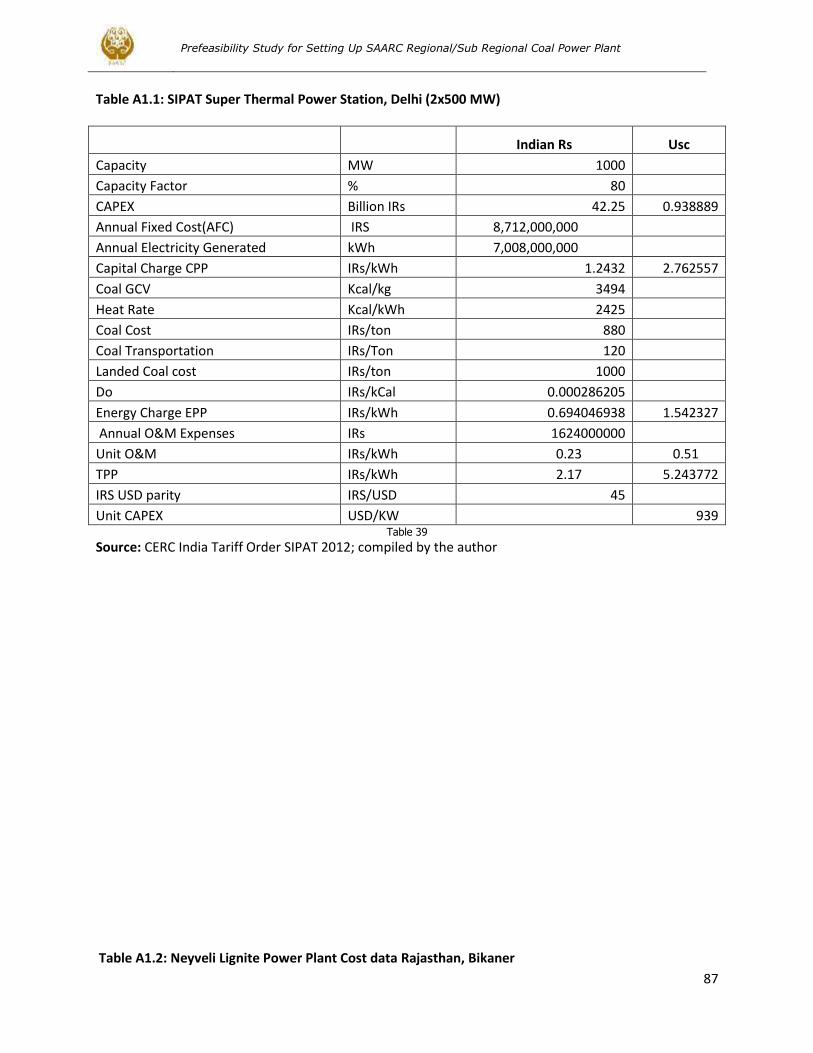
Prefeasibility Study for Setting Up SAARC Regional/Sub Regional Coal Power Plant
87
Table A1.1: SIPAT Super Thermal Power Station, Delhi (2x500 MW)
Indian Rs Usc
Capacity MW 1000 Capacity Factor % 80 CAPEX Billion IRs 42.25 0.938889
Annual Fixed Cost(AFC) IRS 8,712,000,000 Annual Electricity Generated kWh 7,008,000,000 Capital Charge CPP IRs/kWh 1.2432 2.762557
Coal GCV Kcal/kg 3494 Heat Rate Kcal/kWh 2425 Coal Cost IRs/ton 880 Coal Transportation IRs/Ton 120 Landed Coal cost IRs/ton 1000 Do IRs/kCal 0.000286205 Energy Charge EPP IRs/kWh 0.694046938 1.542327
Annual O&M Expenses IRs 1624000000 Unit O&M IRs/kWh 0.23 0.51
TPP IRs/kWh 2.17 5.243772
IRS USD parity IRS/USD 45 Unit CAPEX USD/KW
939
Table 39
Source: CERC India Tariff Order SIPAT 2012; compiled by the author Table A1.2: Neyveli Lignite Power Plant Cost data Rajasthan, Bikaner
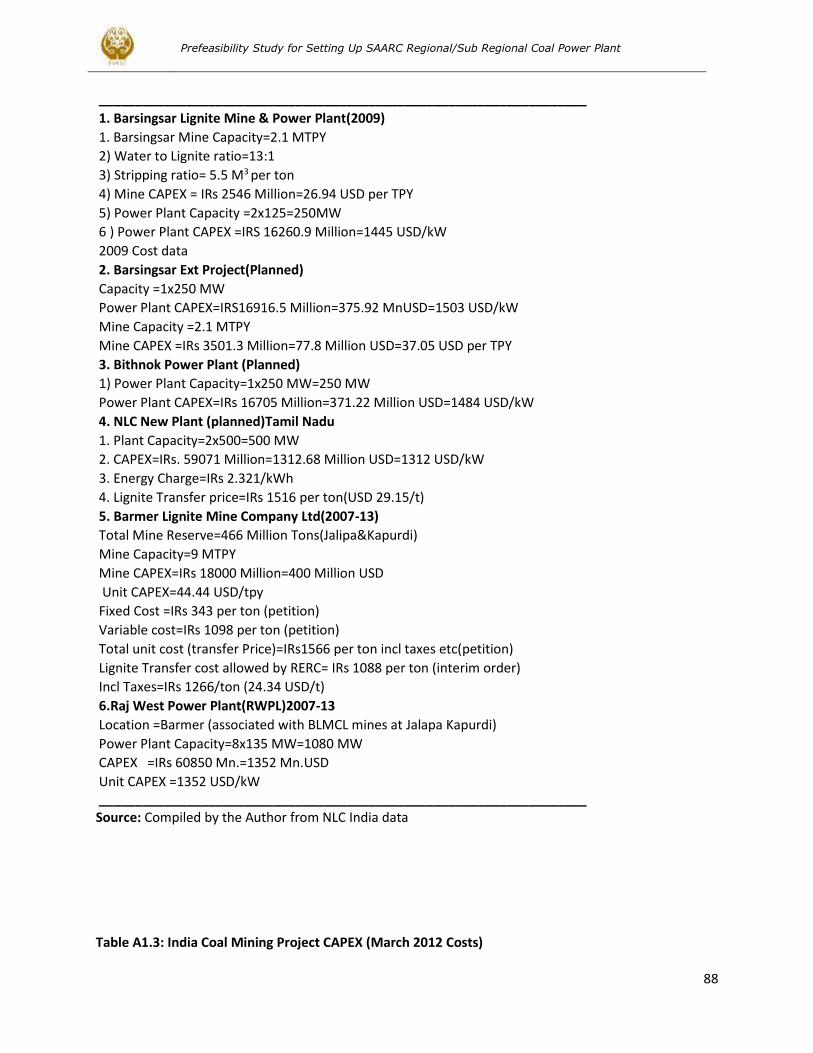
Prefeasibility Study for Setting Up SAARC Regional/Sub Regional Coal Power Plant
88
___________________________________________________________________
1. Barsingsar Lignite Mine & Power Plant(2009)
1. Barsingsar Mine Capacity=2.1 MTPY
2) Water to Lignite ratio=13:1
3) Stripping ratio= 5.5 M3 per ton
4) Mine CAPEX = IRs 2546 Million=26.94 USD per TPY
5) Power Plant Capacity =2x125=250MW
6 ) Power Plant CAPEX =IRS 16260.9 Million=1445 USD/kW
2009 Cost data
2. Barsingsar Ext Project(Planned)
Capacity =1x250 MW
Power Plant CAPEX=IRS16916.5 Million=375.92 MnUSD=1503 USD/kW
Mine Capacity =2.1 MTPY
Mine CAPEX =IRs 3501.3 Million=77.8 Million USD=37.05 USD per TPY
3. Bithnok Power Plant (Planned)
1) Power Plant Capacity=1x250 MW=250 MW
Power Plant CAPEX=IRs 16705 Million=371.22 Million USD=1484 USD/kW
4. NLC New Plant (planned)Tamil Nadu
1. Plant Capacity=2x500=500 MW
2. CAPEX=IRs. 59071 Million=1312.68 Million USD=1312 USD/kW
3. Energy Charge=IRs 2.321/kWh
4. Lignite Transfer price=IRs 1516 per ton(USD 29.15/t)
5. Barmer Lignite Mine Company Ltd(2007-13)
Total Mine Reserve=466 Million Tons(Jalipa&Kapurdi)
Mine Capacity=9 MTPY
Mine CAPEX=IRs 18000 Million=400 Million USD
Unit CAPEX=44.44 USD/tpy
Fixed Cost =IRs 343 per ton (petition)
Variable cost=IRs 1098 per ton (petition)
Total unit cost (transfer Price)=IRs1566 per ton incl taxes etc(petition)
Lignite Transfer cost allowed by RERC= IRs 1088 per ton (interim order)
Incl Taxes=IRs 1266/ton (24.34 USD/t)
6.Raj West Power Plant(RWPL)2007-13
Location =Barmer (associated with BLMCL mines at Jalapa Kapurdi)
Power Plant Capacity=8x135 MW=1080 MW
CAPEX =IRs 60850 Mn.=1352 Mn.USD
Unit CAPEX =1352 USD/kW ___________________________________________________________________ Source: Compiled by the Author from NLC India data Table A1.3: India Coal Mining Project CAPEX (March 2012 Costs)
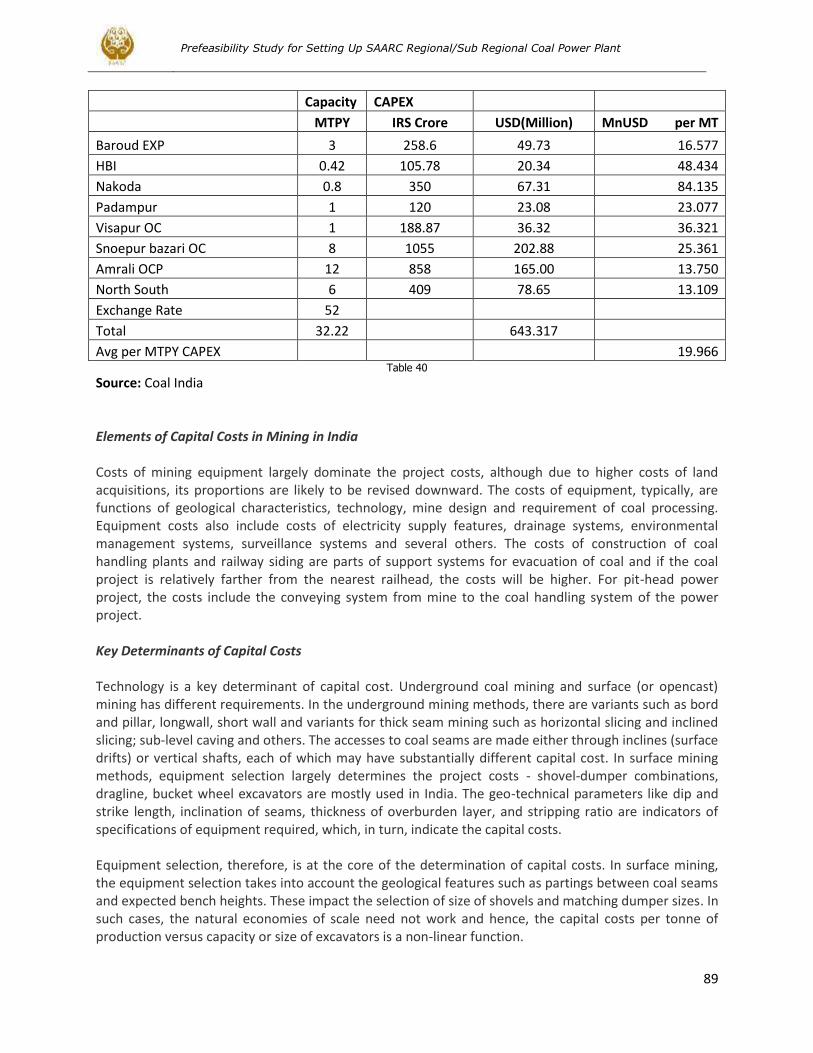
Prefeasibility Study for Setting Up SAARC Regional/Sub Regional Coal Power Plant
89
Capacity CAPEX
MTPY IRS Crore USD(Million) MnUSD per MT
Baroud EXP 3 258.6 49.73 16.577
HBI 0.42 105.78 20.34 48.434
Nakoda 0.8 350 67.31 84.135
Padampur 1 120 23.08 23.077
Visapur OC 1 188.87 36.32 36.321
Snoepur bazari OC 8 1055 202.88 25.361
Amrali OCP 12 858 165.00 13.750
North South 6 409 78.65 13.109
Exchange Rate 52 Total 32.22
643.317 Avg per MTPY CAPEX
19.966
Table 40
Source: Coal India Elements of Capital Costs in Mining in India Costs of mining equipment largely dominate the project costs, although due to higher costs of land acquisitions, its proportions are likely to be revised downward. The costs of equipment, typically, are functions of geological characteristics, technology, mine design and requirement of coal processing. Equipment costs also include costs of electricity supply features, drainage systems, environmental management systems, surveillance systems and several others. The costs of construction of coal handling plants and railway siding are parts of support systems for evacuation of coal and if the coal project is relatively farther from the nearest railhead, the costs will be higher. For pit-head power project, the costs include the conveying system from mine to the coal handling system of the power project. Key Determinants of Capital Costs Technology is a key determinant of capital cost. Underground coal mining and surface (or opencast) mining has different requirements. In the underground mining methods, there are variants such as bord and pillar, longwall, short wall and variants for thick seam mining such as horizontal slicing and inclined slicing; sub-level caving and others. The accesses to coal seams are made either through inclines (surface drifts) or vertical shafts, each of which may have substantially different capital cost. In surface mining methods, equipment selection largely determines the project costs - shovel-dumper combinations, dragline, bucket wheel excavators are mostly used in India. The geo-technical parameters like dip and strike length, inclination of seams, thickness of overburden layer, and stripping ratio are indicators of specifications of equipment required, which, in turn, indicate the capital costs. Equipment selection, therefore, is at the core of the determination of capital costs. In surface mining, the equipment selection takes into account the geological features such as partings between coal seams and expected bench heights. These impact the selection of size of shovels and matching dumper sizes. In such cases, the natural economies of scale need not work and hence, the capital costs per tonne of production versus capacity or size of excavators is a non-linear function.
Prefeasibility Study for Setting Up SAARC Regional/Sub Regional Coal Power Plant
90
Apart from the excavators and hauling equipment, capital cost of surface mines also depend on size and number of drilling machines, which, in turn, are dependent on the hardness of the rock. For blasting, the use of site mix slurries or site mix emulsion explosives can eliminate the need to maintain a magazine at mine project and thus, lower the capital costs. Relatively softer rock formation, such as those of lignite, the drilling blasting processes may be replaced by continuous mining system as bucket wheel excavator. Rock fragmentation and the requirement of crushing (including secondary crushing and sizing) will determine the additional equipment required that have a direct bearing on capital costs. Hydrological characteristics of mine indicate the requirement of drainage and pump capacities. These may be significant where the water tables are high and may have large capital costs required to keep the working faces prevented from being inundated. Estimates According to estimates, investments needed in surface coal mining in India are in the range of INR 1500-2100 (approximately US$ 31.65 - 44.30) per tonne of rated capacity. For example, investment in a one million tonne per annum capacity mine is expected to be INR 210 crore (approximately US$ 44.295 million). This estimation is based on a stripping ratio of 4:1 and appropriate adjustments can be made for projects that have higher or lower stripping ratios. This, however, is as good as only an estimate and for the purpose of evaluations and investment decision making purposes, nothing can substitute a detailed plan, including equipment selection and fleet size determination. For underground mining, the estimates are in the range of INR 1900-2800 (approximately US$ 40.07 - 59.05) per tonne of rated capacity. These are estimated for project that are shallow (within 150 meters depth) and are worked with semi-mechanized board and pillar mining methods. Source: Coal Spot Tuesday, 13 September 11 CAPITAL COSTS OF INDIAN COAL MINING PROJECT - AN ANALYST VIEW Dipesh Dipu, Director - Consulting (Mining), Deloitte Touche Tohmatsu India Private Limited Table A1.4: PLANT PRICING ESTIMATES FOR GENERATION TECHNOLOGIES (2008 $), $/KW NET
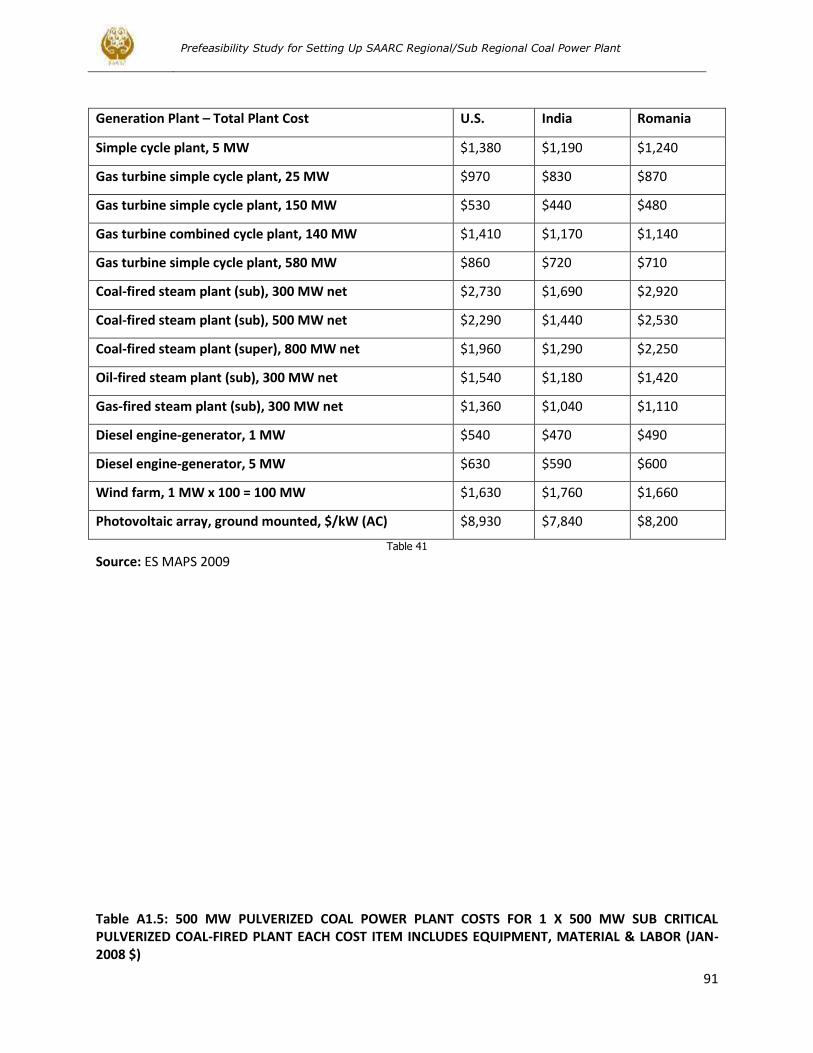
Prefeasibility Study for Setting Up SAARC Regional/Sub Regional Coal Power Plant
91
Generation Plant – Total Plant Cost U.S. India Romania
Simple cycle plant, 5 MW $1,380 $1,190 $1,240
Gas turbine simple cycle plant, 25 MW $970 $830 $870
Gas turbine simple cycle plant, 150 MW $530 $440 $480
Gas turbine combined cycle plant, 140 MW $1,410 $1,170 $1,140
Gas turbine simple cycle plant, 580 MW $860 $720 $710
Coal-fired steam plant (sub), 300 MW net $2,730 $1,690 $2,920
Coal-fired steam plant (sub), 500 MW net $2,290 $1,440 $2,530
Coal-fired steam plant (super), 800 MW net $1,960 $1,290 $2,250
Oil-fired steam plant (sub), 300 MW net $1,540 $1,180 $1,420
Gas-fired steam plant (sub), 300 MW net $1,360 $1,040 $1,110
Diesel engine-generator, 1 MW $540 $470 $490
Diesel engine-generator, 5 MW $630 $590 $600
Wind farm, 1 MW x 100 = 100 MW $1,630 $1,760 $1,660
Photovoltaic array, ground mounted, $/kW (AC) $8,930 $7,840 $8,200
Table 41
Source: ES MAPS 2009 Table A1.5: 500 MW PULVERIZED COAL POWER PLANT COSTS FOR 1 X 500 MW SUB CRITICAL PULVERIZED COAL-FIRED PLANT EACH COST ITEM INCLUDES EQUIPMENT, MATERIAL & LABOR (JAN-2008 $)
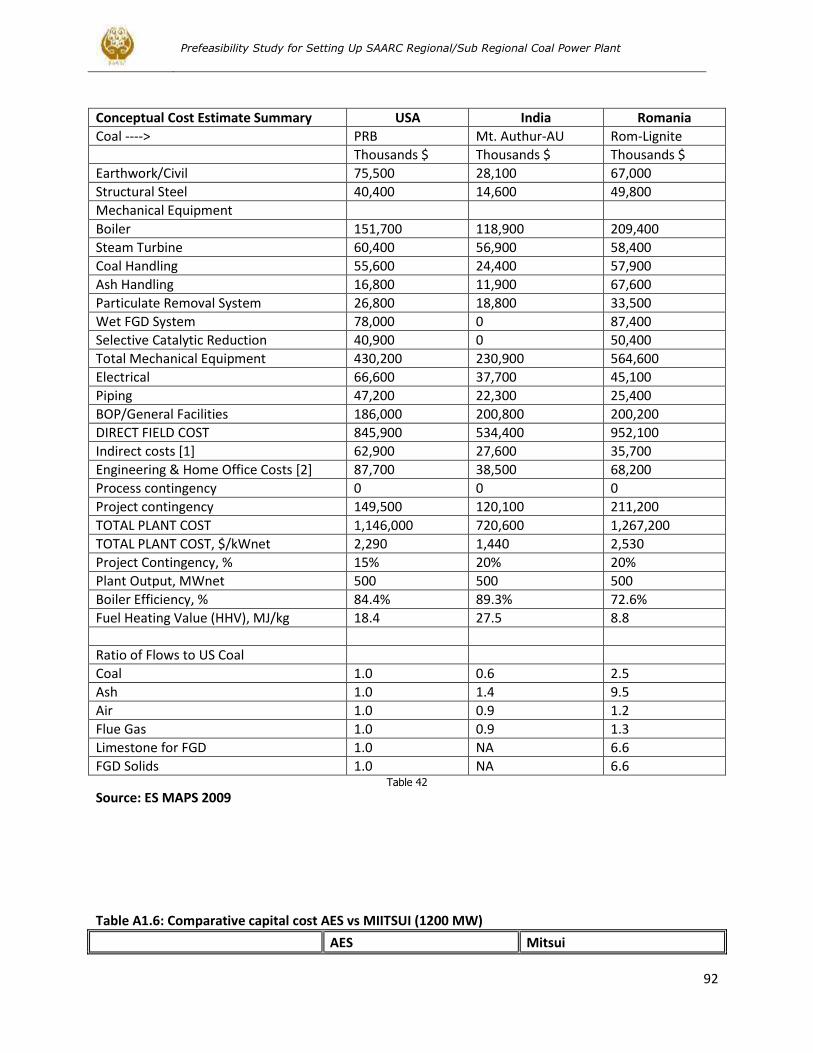
Prefeasibility Study for Setting Up SAARC Regional/Sub Regional Coal Power Plant
92
Conceptual Cost Estimate Summary USA India Romania
Coal ----> PRB Mt. Authur-AU Rom-Lignite
Thousands $ Thousands $ Thousands $
Earthwork/Civil 75,500 28,100 67,000
Structural Steel 40,400 14,600 49,800
Mechanical Equipment
Boiler 151,700 118,900 209,400
Steam Turbine 60,400 56,900 58,400
Coal Handling 55,600 24,400 57,900
Ash Handling 16,800 11,900 67,600
Particulate Removal System 26,800 18,800 33,500
Wet FGD System 78,000 0 87,400
Selective Catalytic Reduction 40,900 0 50,400
Total Mechanical Equipment 430,200 230,900 564,600
Electrical 66,600 37,700 45,100
Piping 47,200 22,300 25,400
BOP/General Facilities 186,000 200,800 200,200
DIRECT FIELD COST 845,900 534,400 952,100
Indirect costs [1] 62,900 27,600 35,700
Engineering & Home Office Costs [2] 87,700 38,500 68,200
Process contingency 0 0 0
Project contingency 149,500 120,100 211,200
TOTAL PLANT COST 1,146,000 720,600 1,267,200
TOTAL PLANT COST, $/kWnet 2,290 1,440 2,530
Project Contingency, % 15% 20% 20%
Plant Output, MWnet 500 500 500
Boiler Efficiency, % 84.4% 89.3% 72.6%
Fuel Heating Value (HHV), MJ/kg 18.4 27.5 8.8
Ratio of Flows to US Coal
Coal 1.0 0.6 2.5
Ash 1.0 1.4 9.5
Air 1.0 0.9 1.2
Flue Gas 1.0 0.9 1.3
Limestone for FGD 1.0 NA 6.6
FGD Solids 1.0 NA 6.6 Table 42
Source: ES MAPS 2009
Table A1.6: Comparative capital cost AES vs MIITSUI (1200 MW)
AES Mitsui
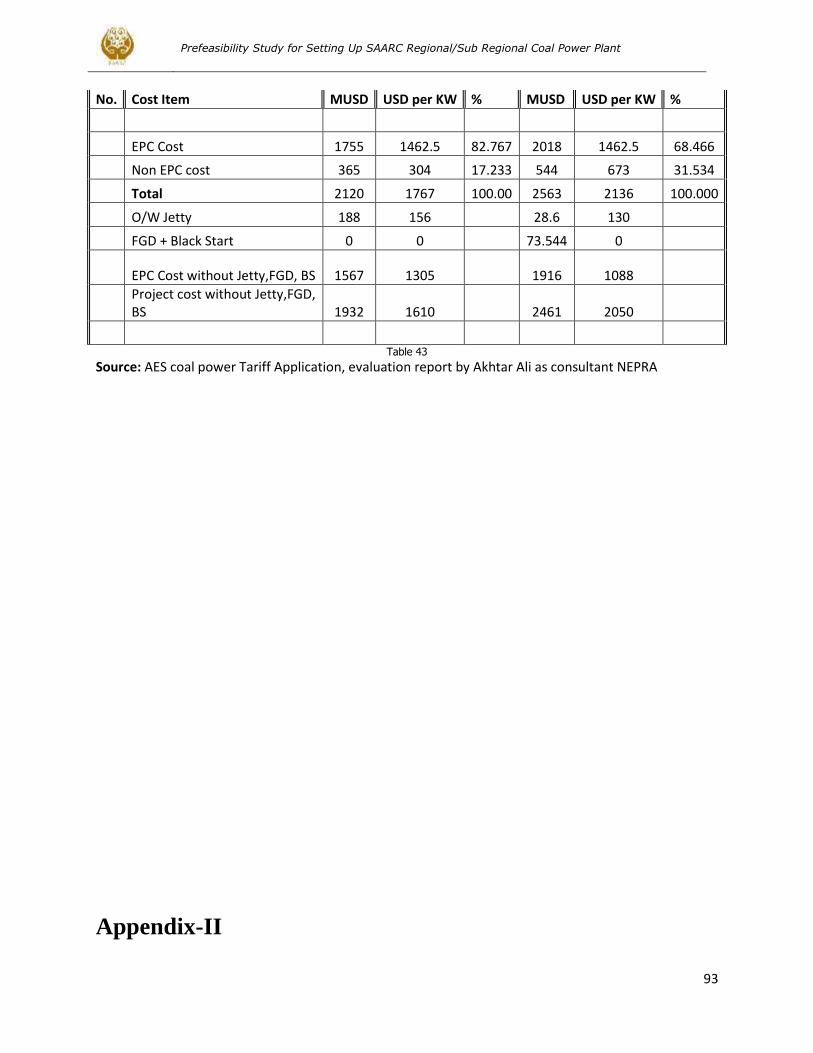
Prefeasibility Study for Setting Up SAARC Regional/Sub Regional Coal Power Plant
93
No. Cost Item MUSD USD per KW % MUSD USD per KW %
EPC Cost 1755 1462.5 82.767 2018 1462.5 68.466
Non EPC cost 365 304 17.233 544 673 31.534
Total 2120 1767 100.00 2563 2136 100.000
O/W Jetty 188 156 28.6 130
FGD + Black Start 0 0 73.544 0
EPC Cost without Jetty,FGD, BS 1567 1305 1916 1088
Project cost without Jetty,FGD, BS 1932 1610 2461 2050
Table 43
Source: AES coal power Tariff Application, evaluation report by Akhtar Ali as consultant NEPRA
Appendix-II
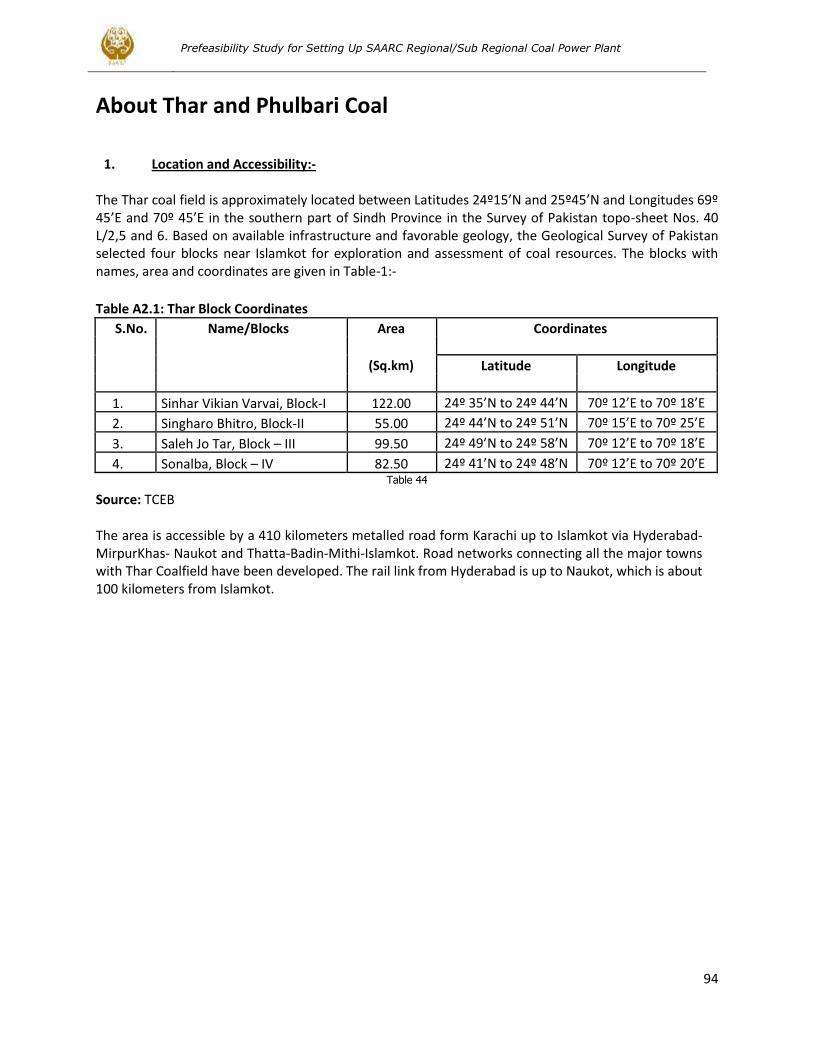
Prefeasibility Study for Setting Up SAARC Regional/Sub Regional Coal Power Plant
94
About Thar and Phulbari Coal
1. Location and Accessibility:- The Thar coal field is approximately located between Latitudes 24º15’N and 25º45’N and Longitudes 69º 45’E and 70º 45’E in the southern part of Sindh Province in the Survey of Pakistan topo-sheet Nos. 40 L/2,5 and 6. Based on available infrastructure and favorable geology, the Geological Survey of Pakistan selected four blocks near Islamkot for exploration and assessment of coal resources. The blocks with names, area and coordinates are given in Table-1:-
Table A2.1: Thar Block Coordinates
S.No. Name/Blocks Area Coordinates
(Sq.km)
Latitude Longitude
1. Sinhar Vikian Varvai, Block-I 122.00 24º 35’N to 24º 44’N 70º 12’E to 70º 18’E
2. Singharo Bhitro, Block-II 55.00 24º 44’N to 24º 51’N 70º 15’E to 70º 25’E
3. Saleh Jo Tar, Block – III 99.50 24º 49’N to 24º 58’N 70º 12’E to 70º 18’E
4. Sonalba, Block – IV 82.50 24º 41’N to 24º 48’N 70º 12’E to 70º 20’E Table 44
Source: TCEB The area is accessible by a 410 kilometers metalled road form Karachi up to Islamkot via Hyderabad-MirpurKhas- Naukot and Thatta-Badin-Mithi-Islamkot. Road networks connecting all the major towns with Thar Coalfield have been developed. The rail link from Hyderabad is up to Naukot, which is about 100 kilometers from Islamkot.
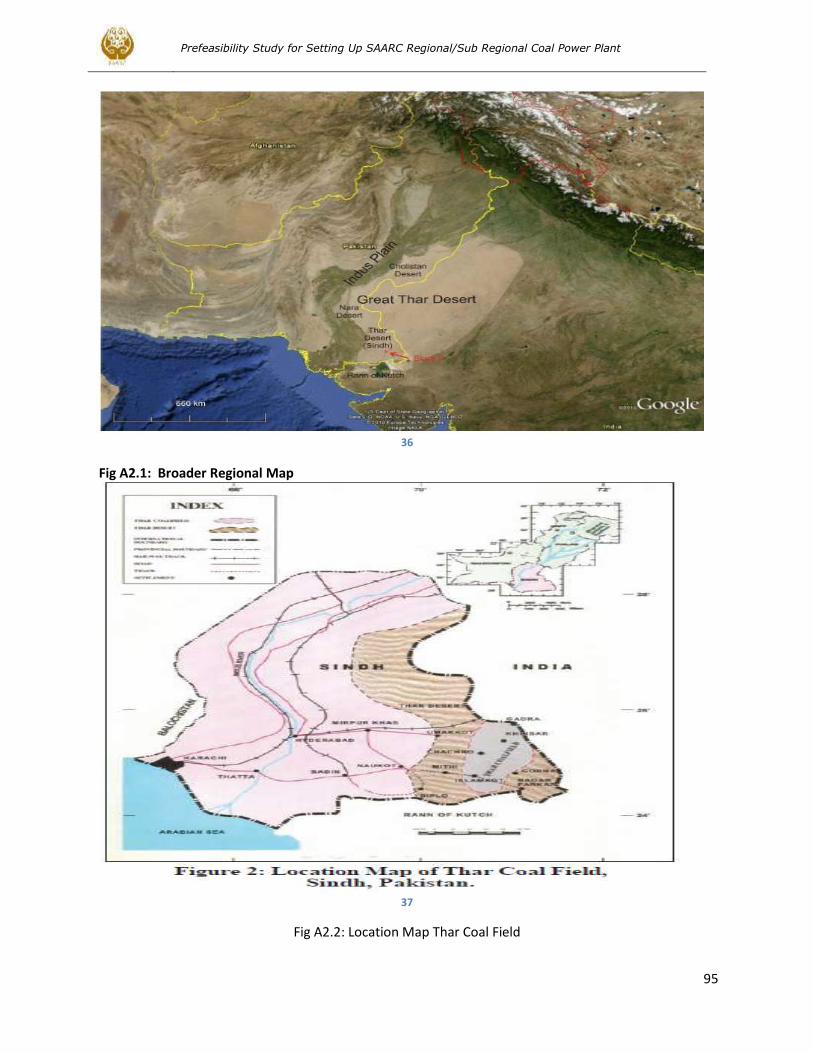
Prefeasibility Study for Setting Up SAARC Regional/Sub Regional Coal Power Plant
95
36
Fig A2.1: Broader Regional Map
37
Fig A2.2: Location Map Thar Coal Field
Prefeasibility Study for Setting Up SAARC Regional/Sub Regional Coal Power Plant
96
THAR COAL RESOURCES IN THAR DESERT, SINDH– PAKISTAN 2. Relief, Topography and Climate
Thar coalfield is a part of the Thar Desert of Pakistan and is the 9th largest desert of the world. It is bounded in the north, east and south by India, in the west by flood plains of the Indus River. The terrain is sandy and rough with sand dunes forming the topography. The relief in the area varies between near sea level to more than 150 meters AMSL. The climate is essentially that of an aid to semi arid region with scorching hot summers and relatively cold winters. It is one of the most densely populated deserts of the world with over 91 thousand inhabitants. The livelihood of the population is dependent on agriculture and livestock. 3. Water Resources The area is a part of the desert where precipitation is very little with a high rate of evaporation. As such, limited water resources are of great significance. a. SURFACE WATER The water is scanty and found in a few small “tarais” and artificially dug depressions where rain water collects. These depressions generally consist of silty clay and caliche material. b. GROUNDWATER The hydro-geological studies and drill hole geology shows the presence of three possible aquifer zones at varying depths: (i) above the coal zone (ii) within the coal zone and (iii) below the coal zone. Drilling data has indicated three aquifers (water-bearing Zones) at an average depth of 50 m, 120 m and more than 200 meters:
One aquifer above the coal zone: Ranges between 52.70 and 93.27 meters depth.
Second aquifer with the coal zone at 120 meters depth: Varying thickness up to 68.74 meters.
Third aquifer below the coal zone at 200 metes depth: Varying thickness up to 47 meters.
Water quality is brackish to saline 4. Geology The Thar coalfield area is covered by dune sand that extends to an average depth of over 80 meters and rests upon a structural platform in the eastern part of the desert. The generalized stratigraphic sequence in the Thar coalfield area is shown in table. It comprises Basement Complex, coal bearing Bara Formation, alluvial deposits and dune sand.
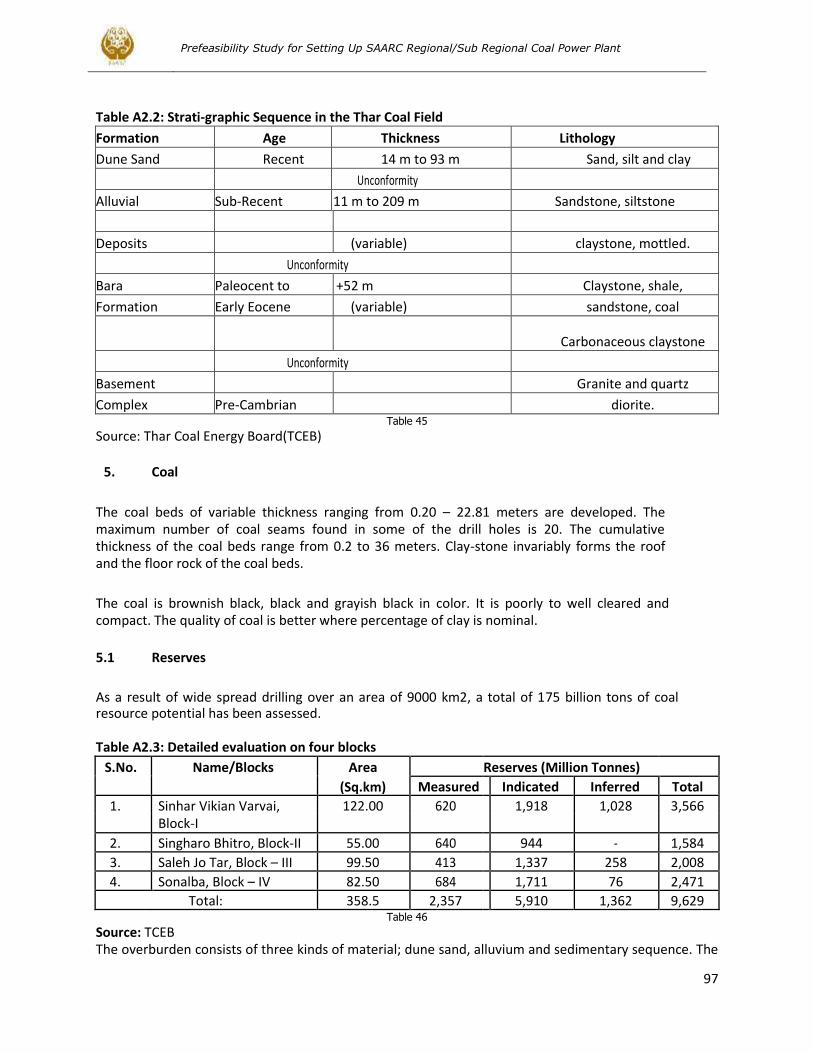
Prefeasibility Study for Setting Up SAARC Regional/Sub Regional Coal Power Plant
97
Table A2.2: Strati-graphic Sequence in the Thar Coal Field
Formation Age Thickness Lithology
Dune Sand Recent 14 m to 93 m Sand, silt and clay
Unconformity
Alluvial Sub-Recent 11 m to 209 m Sandstone, siltstone
Deposits (variable) claystone, mottled.
Unconformity
Bara Paleocent to +52 m Claystone, shale,
Formation Early Eocene (variable) sandstone, coal
Carbonaceous claystone
Unconformity
Basement Granite and quartz
Complex Pre-Cambrian diorite. Table 45
Source: Thar Coal Energy Board(TCEB)
5. Coal
The coal beds of variable thickness ranging from 0.20 – 22.81 meters are developed. The maximum number of coal seams found in some of the drill holes is 20. The cumulative thickness of the coal beds range from 0.2 to 36 meters. Clay-stone invariably forms the roof and the floor rock of the coal beds.
The coal is brownish black, black and grayish black in color. It is poorly to well cleared and compact. The quality of coal is better where percentage of clay is nominal.
5.1 Reserves
As a result of wide spread drilling over an area of 9000 km2, a total of 175 billion tons of coal resource potential has been assessed.
Table A2.3: Detailed evaluation on four blocks
S.No. Name/Blocks Area Reserves (Million Tonnes)
(Sq.km) Measured Indicated Inferred Total
1. Sinhar Vikian Varvai, 122.00 620 1,918 1,028 3,566 Block-I
2. Singharo Bhitro, Block-II 55.00 640 944 - 1,584
3. Saleh Jo Tar, Block – III 99.50 413 1,337 258 2,008
4. Sonalba, Block – IV 82.50 684 1,711 76 2,471
Total: 358.5 2,357 5,910 1,362 9,629 Table 46
Source: TCEB The overburden consists of three kinds of material; dune sand, alluvium and sedimentary sequence. The
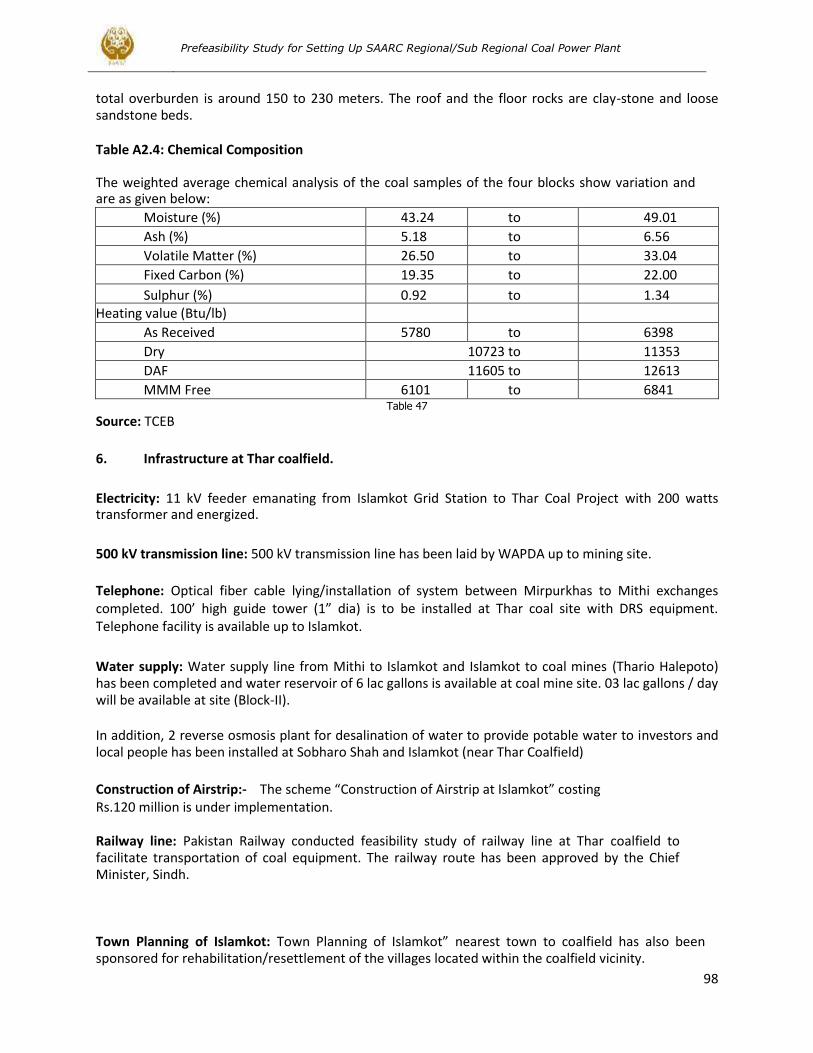
Prefeasibility Study for Setting Up SAARC Regional/Sub Regional Coal Power Plant
98
total overburden is around 150 to 230 meters. The roof and the floor rocks are clay-stone and loose sandstone beds. Table A2.4: Chemical Composition The weighted average chemical analysis of the coal samples of the four blocks show variation and are as given below:
Moisture (%) 43.24 to 49.01
Ash (%) 5.18 to 6.56
Volatile Matter (%) 26.50 to 33.04
Fixed Carbon (%) 19.35 to 22.00
Sulphur (%) 0.92 to 1.34 Heating value (Btu/lb)
As Received 5780 to 6398
Dry 10723 to 11353
DAF 11605 to 12613
MMM Free 6101 to 6841 Table 47
Source: TCEB
6. Infrastructure at Thar coalfield.
Electricity: 11 kV feeder emanating from Islamkot Grid Station to Thar Coal Project with 200 watts transformer and energized.
500 kV transmission line: 500 kV transmission line has been laid by WAPDA up to mining site.
Telephone: Optical fiber cable lying/installation of system between Mirpurkhas to Mithi exchanges completed. 100’ high guide tower (1” dia) is to be installed at Thar coal site with DRS equipment. Telephone facility is available up to Islamkot.
Water supply: Water supply line from Mithi to Islamkot and Islamkot to coal mines (Thario Halepoto) has been completed and water reservoir of 6 lac gallons is available at coal mine site. 03 lac gallons / day will be available at site (Block-II).
In addition, 2 reverse osmosis plant for desalination of water to provide potable water to investors and local people has been installed at Sobharo Shah and Islamkot (near Thar Coalfield)
Construction of Airstrip:- The scheme “Construction of Airstrip at Islamkot” costing Rs.120 million is under implementation. Railway line: Pakistan Railway conducted feasibility study of railway line at Thar coalfield to facilitate transportation of coal equipment. The railway route has been approved by the Chief Minister, Sindh. Town Planning of Islamkot: Town Planning of Islamkot” nearest town to coalfield has also been sponsored for rehabilitation/resettlement of the villages located within the coalfield vicinity.
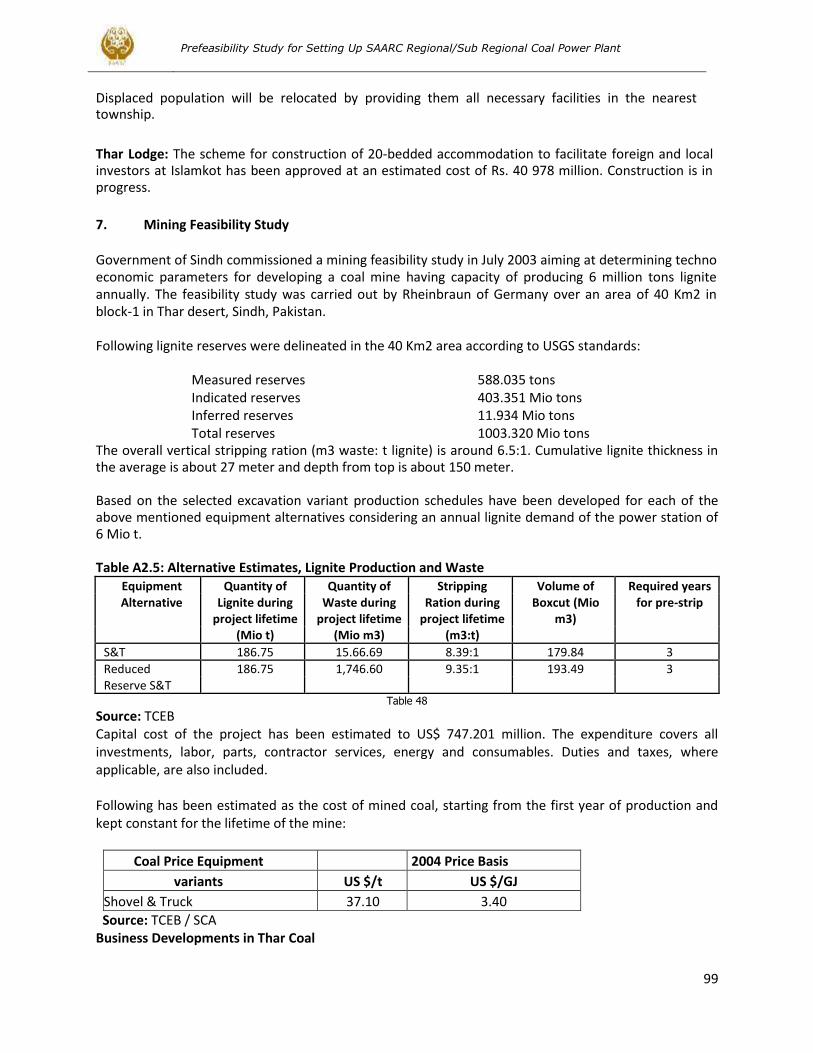
Prefeasibility Study for Setting Up SAARC Regional/Sub Regional Coal Power Plant
99
Displaced population will be relocated by providing them all necessary facilities in the nearest township.
Thar Lodge: The scheme for construction of 20-bedded accommodation to facilitate foreign and local investors at Islamkot has been approved at an estimated cost of Rs. 40 978 million. Construction is in progress.
7. Mining Feasibility Study
Government of Sindh commissioned a mining feasibility study in July 2003 aiming at determining techno economic parameters for developing a coal mine having capacity of producing 6 million tons lignite annually. The feasibility study was carried out by Rheinbraun of Germany over an area of 40 Km2 in block-1 in Thar desert, Sindh, Pakistan. Following lignite reserves were delineated in the 40 Km2 area according to USGS standards:
Measured reserves 588.035 tons Indicated reserves 403.351 Mio tons Inferred reserves 11.934 Mio tons Total reserves 1003.320 Mio tons
The overall vertical stripping ration (m3 waste: t lignite) is around 6.5:1. Cumulative lignite thickness in the average is about 27 meter and depth from top is about 150 meter. Based on the selected excavation variant production schedules have been developed for each of the above mentioned equipment alternatives considering an annual lignite demand of the power station of 6 Mio t. Table A2.5: Alternative Estimates, Lignite Production and Waste
Equipment Quantity of Quantity of Stripping Volume of Required years Alternative Lignite during Waste during Ration during Boxcut (Mio for pre-strip
project lifetime project lifetime project lifetime m3) (Mio t) (Mio m3) (m3:t)
S&T 186.75 15.66.69 8.39:1 179.84 3
Reduced 186.75 1,746.60 9.35:1 193.49 3 Reserve S&T
Table 48
Source: TCEB Capital cost of the project has been estimated to US$ 747.201 million. The expenditure covers all investments, labor, parts, contractor services, energy and consumables. Duties and taxes, where applicable, are also included. Following has been estimated as the cost of mined coal, starting from the first year of production and kept constant for the lifetime of the mine:
Coal Price Equipment 2004 Price Basis
variants US $/t US $/GJ
Shovel & Truck 37.10 3.40
Source: TCEB / SCA Business Developments in Thar Coal
Prefeasibility Study for Setting Up SAARC Regional/Sub Regional Coal Power Plant
100
The Federal and Provincial governments are endeavoring to harness the huge coal resources of Thar by utilizing these as a source of energy for power generation through international investment. As part of the promotional activity to increase the share of coal, the Government of Sindh has leased out a coal block for an integrated mining project. The details are as under:- 1. Government of Sindh has entered into a joint venture with M/s Engro Powergen (Pvt.) Limited for Coal Mining in Block-II and established a Company under Companies Act, 1984 viz. “ Sindh Engro Coal Mining Company” for development of coal mines and installing 600-1000 MW Power Plant 2. M/s Cougar Energy UK limited has been allocated Block-III in Thar coalfield for extraction of under ground Coal Gasification and establishing a 400 MW power plant 3. M/s Bin Daen Group, UAE has been allocated Block-IV in Thar coalfield for coal mine and installing 1000 MW Power Plant 4. One block has been allocated to Planning Commission of Pakistan for a Pilot Project of 50 MW based on Underground Coal 4. Gasification Project in Block-V 5. M/s Oracle Coalfield Plc, UK has been allocated Block-VI in Thar coalfield for developing coal mine and installing power plant of 300 MW extendable up to 1000 MW 6. M/s China National Machinery Import and Export Corporation of China (CMC) conducted a feasibility study for 400 MW integrated coal mining and coal fired power plant at Sonda-Jerrick in district Thatta 6. The Government of Sindh is entering into a Joint Venture with M/s Al-Abbas Group company and allocated an area in Badin coalfield for developing coal mine and installing Coal-fired Power Plant of 300-600 MW .
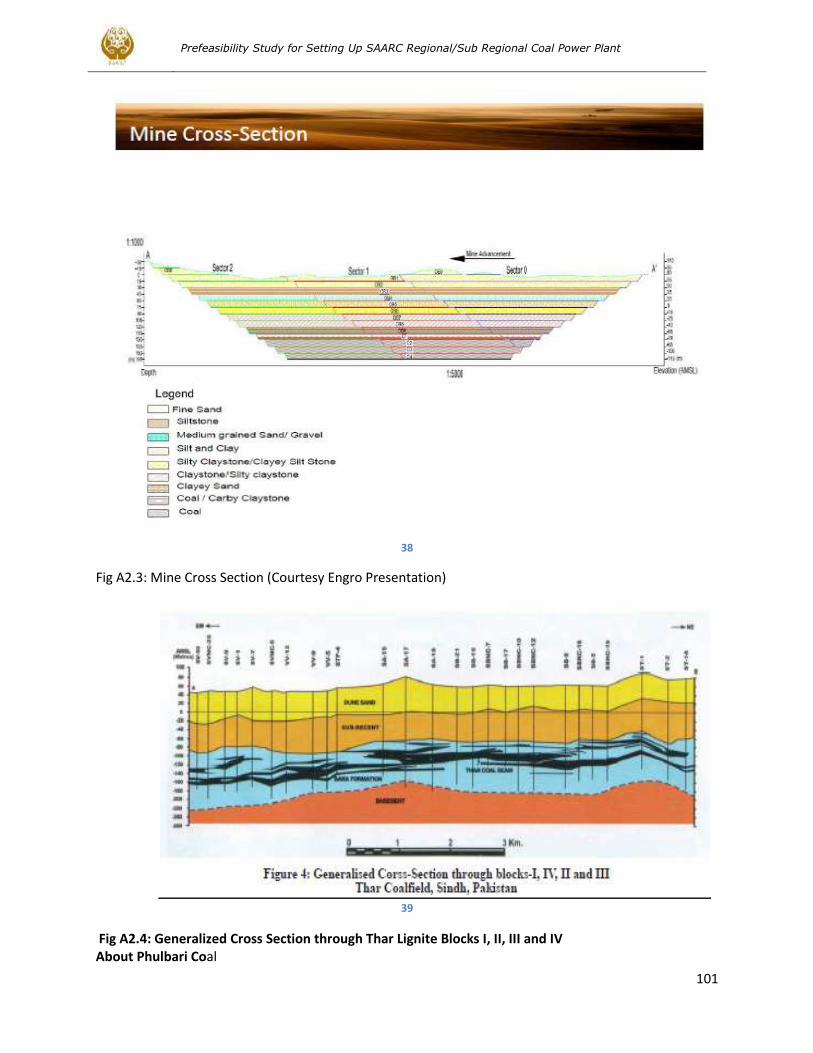
Prefeasibility Study for Setting Up SAARC Regional/Sub Regional Coal Power Plant
101
38
Fig A2.3: Mine Cross Section (Courtesy Engro Presentation)
39
Fig A2.4: Generalized Cross Section through Thar Lignite Blocks I, II, III and IV About Phulbari Coal
Prefeasibility Study for Setting Up SAARC Regional/Sub Regional Coal Power Plant
102
Asia Energy Corporation (Bangladesh) Pty Ltd (Asia Energy), the subsidiary of UK-based GCM Resources plc, is planning to develop and operate a world class open pit coal mine in its Phulbari Coal Project (the `Project’) in the district of Dinajpur, Northwest of Bangladesh. Asia Energy intends to develop and operate the mine adhering highest national and international environmental and social standards. In this regard, the Project’s Feasibility Study and Scheme of Development was submitted to the Government on 2 October 2005 for approval. According to the plan, the mine, in its full capacity, will produce annually 15 million tonnes of high quality bituminous coal. At the same time Asia Energy delivered to the Government a proposal for developing a coal fired power station with up to 1000 MW capacity at the mine site and subsequently a capacity increase to 2000 MW. Up to 4000 MW of electricity can be generated using coal mined at Phulbari that will make significant contribution to meet the power demand of the country. The Department of Environment approved the Project’s Environmental Impact Assessment and granted environmental clearance in September 2005. Asia Energy has been working openly under national and international scrutiny to show respect of its obligation to the Government and the people of Bangladesh. The Company has been working with all relevant stakeholders at local, regional and national level and will also continue the same in future. Asia Energy is committed to environmental, social justice, sustainable development and complete disclosure of various aspects of the Project. Asia Energy expressed its intention to be listed in the Bangladesh Joint Stock Exchange in March 2006. This decision is part of Company’s commitment to allow Bangladeshi investors to be involved in this landmark development project.
Project at a glance
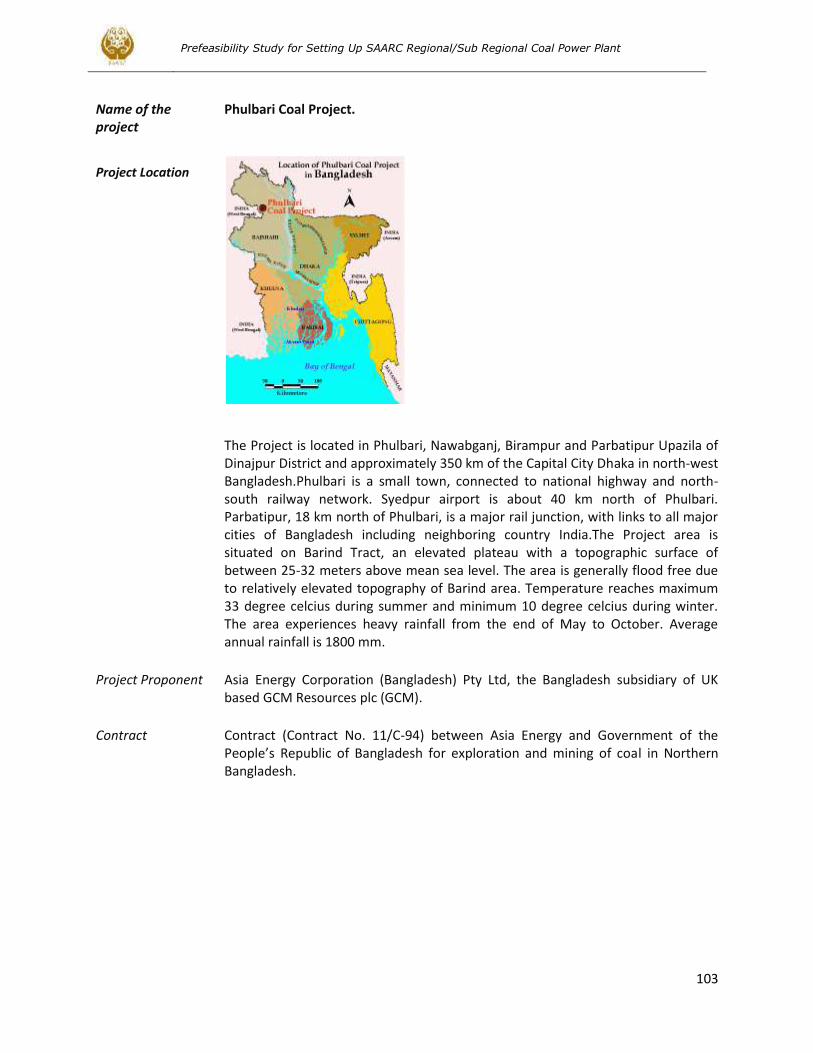
Prefeasibility Study for Setting Up SAARC Regional/Sub Regional Coal Power Plant
103
Name of the project
Phulbari Coal Project.
Project Location
The Project is located in Phulbari, Nawabganj, Birampur and Parbatipur Upazila of Dinajpur District and approximately 350 km of the Capital City Dhaka in north-west Bangladesh.Phulbari is a small town, connected to national highway and north-south railway network. Syedpur airport is about 40 km north of Phulbari. Parbatipur, 18 km north of Phulbari, is a major rail junction, with links to all major cities of Bangladesh including neighboring country India.The Project area is situated on Barind Tract, an elevated plateau with a topographic surface of between 25-32 meters above mean sea level. The area is generally flood free due to relatively elevated topography of Barind area. Temperature reaches maximum 33 degree celcius during summer and minimum 10 degree celcius during winter. The area experiences heavy rainfall from the end of May to October. Average annual rainfall is 1800 mm.
Project Proponent Asia Energy Corporation (Bangladesh) Pty Ltd, the Bangladesh subsidiary of UK based GCM Resources plc (GCM).
Contract Contract (Contract No. 11/C-94) between Asia Energy and Government of the People’s Republic of Bangladesh for exploration and mining of coal in Northern Bangladesh.
Prefeasibility Study for Setting Up SAARC Regional/Sub Regional Coal Power Plant
104
Lease/Licenses Asia Energy received Mining Lease for the core coal resource area and Exploration Licenses for the adjoining other areas (presently under application for conversion into Mining Leases).
Present status Scheme of Mine Development (SoD) has been submitted to the Government after completion of a comprehensive two-year long Feasibility Study to national and international standards. Project’s Environmental Clearance has been granted. Asia Energy expects that approval of mine development scheme will be granted soon and project implementation activities will be started.
Type of Project Coal Mine.
Method of mining Open Pit.
Product Bituminous type (high calorific value, low ash, low sulpher) thermal and semi-soft coking coal (metallurgical).
Total coal resource
572 million tonnes (would be higher still with further drilling in the south).
Annual production Capacity
15 Million tonnes.
Use of coal Main use in power generation. Has also use in steel industry and brick kilns, and as briquette in domestic and small industries.
Co-Products Silica sand, gravel, china clay (Kaolin), water
Project life More than 30 years.
Total investment US$ 2 billion as capital cost and US$ 10 billion as operating cost over the mine life (according to the Scheme of Development submitted to the Government). Out of the total capital investment, more than half will be required in the early years of mine development.
Project schedule Start physical construction work as early as possible and extract coal to meet domestic demand including power generation. It is expected that first coal will be available within three years of commencement of physical construction work.
Project area The Project area covers 7 Unions and 1 Municipality under 4 Upazilas of Phulbari, Birampur, Nawabganj and Parbatipur of Dinajpur district.
Total land area required for the Project
About 5,933 hectares over the mine life. But Project land use will be in phases and there will be no more than one-third of Project land in use at any point of mine development.
Prefeasibility Study for Setting Up SAARC Regional/Sub Regional Coal Power Plant
105
Phulbari Township
The Municipality will maintain its status with a redefined boundary. A small part of eastern Phulbari will fall in the mine footprint area and a new township will be developed on the west of the Little Jamuna River as an extension of the existing western part of Phulbari Town.
Resettlement and rehabilitation
About 40,000 people from the mine footprint will need relocation (in phases over a period of 10 years) over the Project life. The affected people, who so require or wish, will be resettled in the new township or to well developed new villages where all civic amenities including education, health, water supply and sanitation facilities will be made available.
Compensation All Project affected people will be fully and fairly compensated for the loss of land, assets, and livelihoods. They will be provided with skill development training, employment and support for alternative livelihood opportunities including agriculture and businesses. No one will be worse off than their present position; rather most will be much better off.
Mine rehabilitation
The mine pit will be progressively backfilled and restored to its productive state; the final void will be transformed into a fresh water lake to be used for various community purposes including recreation and aquaculture.
Water management
During mine development groundwater needs to be extracted to maintain safe and dry working condition in the mine pit. To manage the impacts water will be provided to affected households and agricultural lands. New and existing Phulbari Township and resettlement villages will be brought under water supply system. Water will also be discharged to Little Jamuna River and diverted Khari pul creek to conserve ecosystem and the natural habitats of Ashoorer Beel. There will be no shortage of water and no area would become dry due to the Project. A separate study has been conducted in this regard.
Environment Various management measures will be implemented to manage environmental impacts. Biodiversity will be conserved, and noise, dust and wastewater will be contained within acceptable limit. Environmental parameters will be rigorously monitored, and a detailed environmental management plan will be implemented to ensure all project activities remain environmentally acceptable throughout the life of the mine.
Benefits of Bangladesh
No financial risk, zero investment. Government’s net earning over the project life is over US$ 8 billion. Other benefits include a new source of readily available long term primary energy for the country; power generation at affordable cost; development of new industries, new transport infrastructure, potential co-product based industries; employment opportunities; regional development and poverty alleviation. All these will have direct contribution to GDP growth
Prefeasibility Study for Setting Up SAARC Regional/Sub Regional Coal Power Plant
106
Project Proponent
Asia Energy Corporation (Bangladesh) Pty Ltd, the project proponent of Phulbari Coal Project, is a wholly owned subsidiary of London based GCM Resources plc (Former Asia Energy plc).
Asia Energy GCM Resources plc
Asia Energy
Asia Energy Corporation (Bangladesh) Pty Ltd is an Australian company (Australian company no.-080406819) registered on 15 October 1997 under the corporation law of New South Wales. Asia Energy received Bangladesh Government’s permission to open company branch office in Bangladesh for exploration and extraction of mineral resources on 10 December 1997. The permission is renewed by Ministry of Industry and Bangladesh Board of Investment (BoI) from time to time. According to the company law 1994 (Volume 379), Asia Energy Corporation (Bangladesh) Pty Ltd applied for registration to registrar of Joint Stock Company Bangladesh and received certificate of listing on 18 May 1998.
GCM Resources plc
GCM Resources plc (GCM) is a London based mineral exploration and mining company. Its former name was Asia Energy plc. Asia Energy incorporated as a public limited company (No. 04913119) in England and Wales on 26 September 2003 to raise capital for exploration and development of Phulbari Coal Project in Bangladesh. Company’s share listed in the Alternative Investment Market (AIM) of London Stock Exchange for trading on 19 April 2004. Phulbari Coal Project is one of the major investment projects of GCM. The Company has also investment in a number of other companies in the world involved in mineral resources development.
Major features of the Contract
Government is the owner of the mineral resources of the country and intends to encourage exploration, development and extraction of these resources.
The Contract signed with the Government is a comprehensive contract of coal exploration, mine development, extraction and investment in the northern region of the country. The Contract has four parts, first one is exploration area (first right of transforming later into mining lease has been ensured after successful exploration). The second part details about prospecting license and conducting exploration activity, part three about mining lease and conducting activity and part four describes the terms and conditions of investment for coal exploration and extraction. .
With the continuation of the Contract, exploration licence was awarded for commercially attractive, economically and technically exploitable coal reserve which is consistent with the Mines and Minerals Rules of the country. As under the Contract, discovered areas were not included in exploration licences consciously, exploration activities in licence areas, for that reason, are uncertain and a risky venture.
Prefeasibility Study for Setting Up SAARC Regional/Sub Regional Coal Power Plant
107
Obligation has been imposed in the Contract to conduct exploration activities ensuring highest environmental and labour safety. Obligation has also been imposed to take prior permission of plans of all the activities conducted under the Contract and submit detailed report of accomplished activities to relevant Government office at regular interval.
Detailed terms and conditions have been described for development of discovered coal field and modern, safe, environmentally and technically sustainable mine development through exploration of the licence areas. There is obligation for submission with detailed explanation for approval of the Government of technology and equipment used, technical expert, volume of coal extraction and method, required infrastructure for marketing of extracted coal, estimated time and expenditure for mine development of designated coal field. At the same time, provision has been ensured for supplying required amount of extracted coal with first right to the Government in defined cost through bilateral discussion with the Government.
The land required for mine development can be purchased directly or acquired through government paying applicable compensation and ensuring rehabilitation measures for affected people.
Specific rules and regulations have been incorporated to comply fully with local laws and internationally recognized standards in coal exploration, mine development and operation and assurance given for environmental conservation.
Condition has been imposed for payment of annual fee, royalty, tax and other payable according to the terms and conditions of the Contract signed with the Government for mine development.
Upon approval, if the company wants , it could issue shares to the local share market. Successive and continuous report of mining activities has to be submitted to the relevant department. The right for getting lease of applied land and renewal of it after fulfilling required conditions for the
company for mine development has been ensured by this Contract. According to the Contract, the company will ensure maximum use of capabilities of Bangladeshi human
resources and institutions at exploration, mine development and operation stages and create training opportunity for them.
The part four of the Contract details about the terms and conditions of investment including the required terms and conditions of import for coal exploration, mine development and coal production, payable import duties (2.5%), royalty (6%), corporate tax (45%), dividend on withholding tax (5%) of the company. The company has also given responsibility for marketing of produced coal. The structure for ensuring proper sales price in marketing of produced coal has been defined so that government can ensure its maximum income and the mine can be operated economically profitably.
Company could transfer capital and profit through appropriate authority as part of existing legal facility of foreign investment. The company will enjoy tax holiday benefit (up to 9 years) as part of investors’ incentive.
Obligation has been imposed specifically in this part of the Contract to prepare income-expenditure record to international standard and submit to the Government for information. At the same time system of monitoring and assessing appropriateness of the income-expenditure record submitted by the company has been incorporated employing government’s own audit farm.
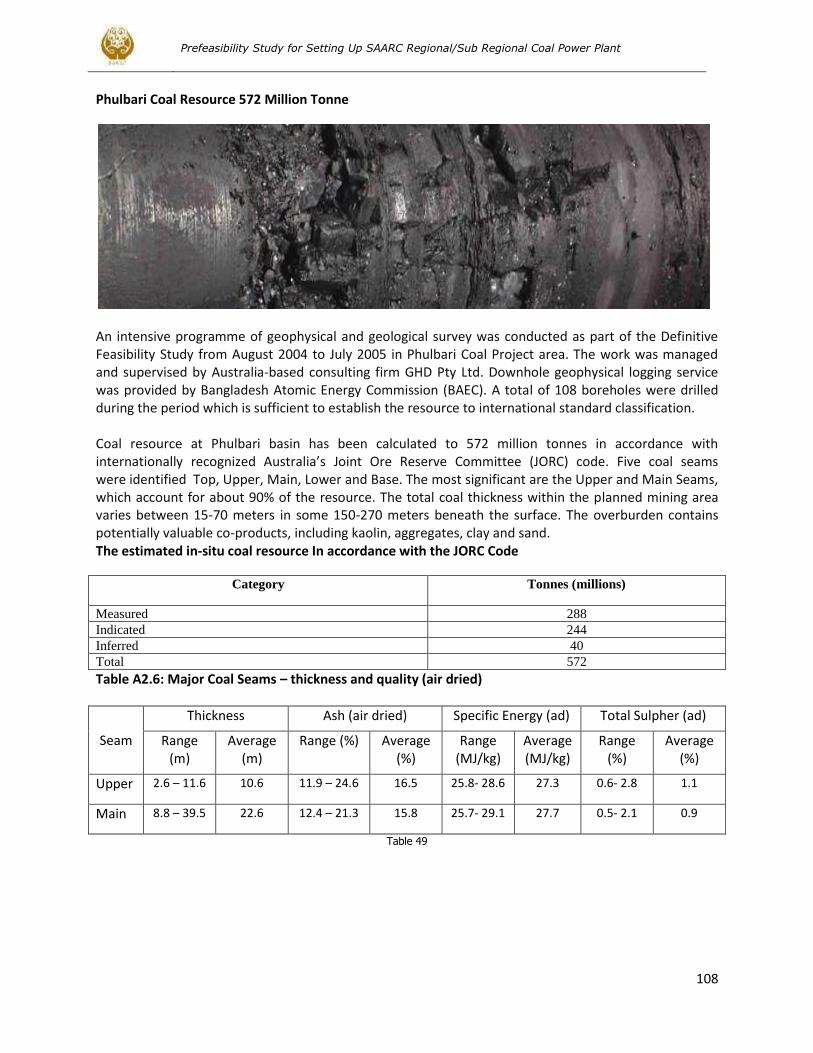
Prefeasibility Study for Setting Up SAARC Regional/Sub Regional Coal Power Plant
108
Phulbari Coal Resource 572 Million Tonne
An intensive programme of geophysical and geological survey was conducted as part of the Definitive Feasibility Study from August 2004 to July 2005 in Phulbari Coal Project area. The work was managed and supervised by Australia-based consulting firm GHD Pty Ltd. Downhole geophysical logging service was provided by Bangladesh Atomic Energy Commission (BAEC). A total of 108 boreholes were drilled during the period which is sufficient to establish the resource to international standard classification. Coal resource at Phulbari basin has been calculated to 572 million tonnes in accordance with internationally recognized Australia’s Joint Ore Reserve Committee (JORC) code. Five coal seams were identified Top, Upper, Main, Lower and Base. The most significant are the Upper and Main Seams, which account for about 90% of the resource. The total coal thickness within the planned mining area varies between 15-70 meters in some 150-270 meters beneath the surface. The overburden contains potentially valuable co-products, including kaolin, aggregates, clay and sand. The estimated in-situ coal resource In accordance with the JORC Code
Category Tonnes (millions)
Measured 288
Indicated 244
Inferred 40
Total 572
Table A2.6: Major Coal Seams – thickness and quality (air dried)
Seam
Thickness Ash (air dried) Specific Energy (ad) Total Sulpher (ad)
Range (m)
Average (m)
Range (%) Average (%)
Range (MJ/kg)
Average (MJ/kg)
Range (%)
Average (%)
Upper 2.6 – 11.6 10.6 11.9 – 24.6 16.5 25.8- 28.6 27.3 0.6- 2.8 1.1
Main 8.8 – 39.5 22.6 12.4 – 21.3 15.8 25.7- 29.1 27.7 0.5- 2.1 0.9
Table 49
Prefeasibility Study for Setting Up SAARC Regional/Sub Regional Coal Power Plant
109
Proposed Phulbari Open Pit Mine
Asia Energy confirmed the resource of 572 million tonnes of high quality bituminous coal in Phulbari basin. The study also established that open pit mining is the only economically and technically viable option to extract this coal resource. The proposed Phulbari mining area is approximately 8 kms long in north-south direction and 3 kms wide in east-west direction. Total coal seam thickness varies between 15-70 meters in some 150-270 meters beneath the surface. The coal deposit is overlain by approximately 160 meters of Tertiary sands, silts, gravels and clays, and Permian sediments. It was established through comparative analysis and alternative methods study that underground mining at Phulbari is unsafe and uneconomic. Maximum 20 percent or less resource can be extracted in this method which will make the Project nonviable and also a loss of valuable resource of the country. The experience of underground mining in similar geological situation is also very disappointing. The existing geological and hydrogeological conditions of Phulbari region and other technical limitations offer open pit mining as the acceptable solution. It is the most economic and safe way of extraction of Phulbari coal resource. The method allows extraction of 90 percent or more of the coal including some valuable co-products like kaolin, glass sand, and rock and aggregates economically. Mining will commence with an initial box cut in the north of the coal basin and progressively move south. The initial open cut mine, including the pit area, associated facilities and infrastructure will cover an area of about 2,000 hectares. The Project will require a total of 5,933 hectares for the mine and associated infrastructure over the entire life of the mine. Initially the overburden materials will be placed in the ex-pit dump east of the mine. About 25 percent of the overburden materials will be placed in the ex-pit dump area. The mine will advance southerly with an approximate annual rate of 200 meters, and progressive backfilling of the pit after coal extraction will commence within about six years of construction. It is estimated that about 70 percent of the overburden materials will thus be placed in the in-pit dump. In the process of moving mine face from north to south, coal will be extracted removing overburden materials and mined out land will be backfilled progressively. The backfilled mine pit area and overburden dump area will be progressively reclaimed and rehabilitated as part of Mine Closure Plan and put back to productive uses including agriculture. At full production, the mine will produce 15 million tonnes of coal over its 35 years mine life. At the end of the mine life a final void (696 hectares will be left (approximately after three decades) which would be turned into a fresh water lake to be used for water supply, irrigation, recreation and aquaculture.
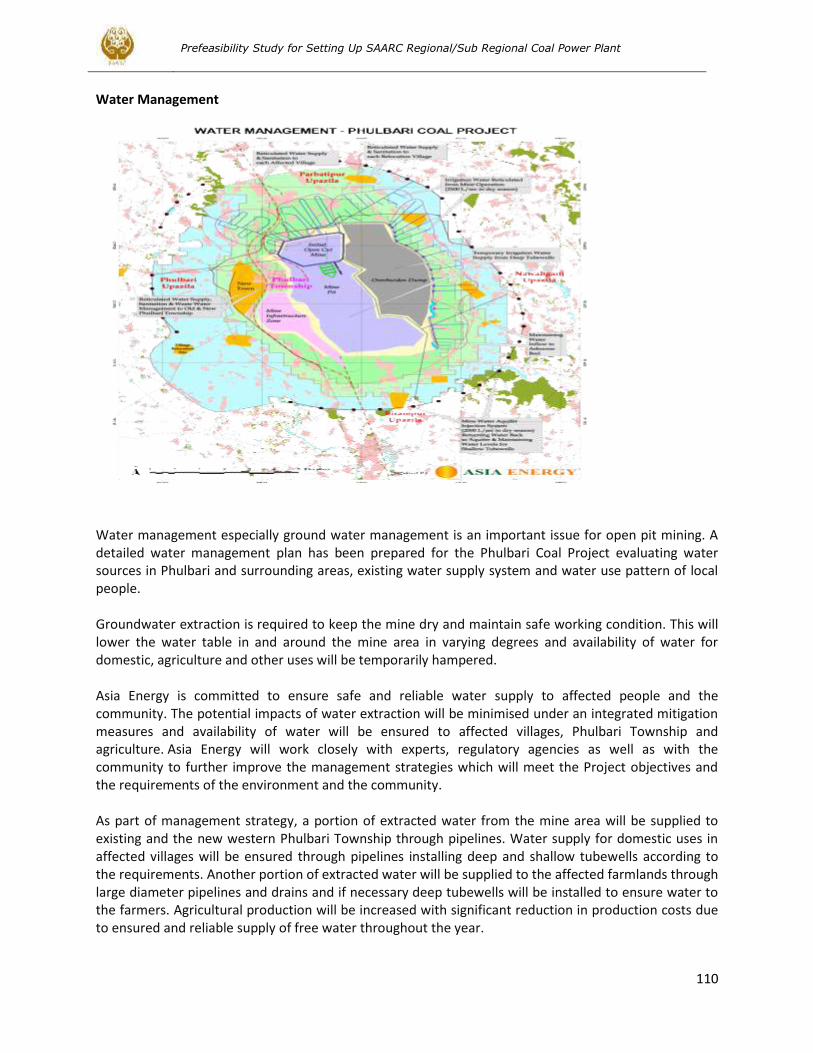
Prefeasibility Study for Setting Up SAARC Regional/Sub Regional Coal Power Plant
110
Water Management
Water management especially ground water management is an important issue for open pit mining. A detailed water management plan has been prepared for the Phulbari Coal Project evaluating water sources in Phulbari and surrounding areas, existing water supply system and water use pattern of local people. Groundwater extraction is required to keep the mine dry and maintain safe working condition. This will lower the water table in and around the mine area in varying degrees and availability of water for domestic, agriculture and other uses will be temporarily hampered. Asia Energy is committed to ensure safe and reliable water supply to affected people and the community. The potential impacts of water extraction will be minimised under an integrated mitigation measures and availability of water will be ensured to affected villages, Phulbari Township and agriculture. Asia Energy will work closely with experts, regulatory agencies as well as with the community to further improve the management strategies which will meet the Project objectives and the requirements of the environment and the community. As part of management strategy, a portion of extracted water from the mine area will be supplied to existing and the new western Phulbari Township through pipelines. Water supply for domestic uses in affected villages will be ensured through pipelines installing deep and shallow tubewells according to the requirements. Another portion of extracted water will be supplied to the affected farmlands through large diameter pipelines and drains and if necessary deep tubewells will be installed to ensure water to the farmers. Agricultural production will be increased with significant reduction in production costs due to ensured and reliable supply of free water throughout the year.
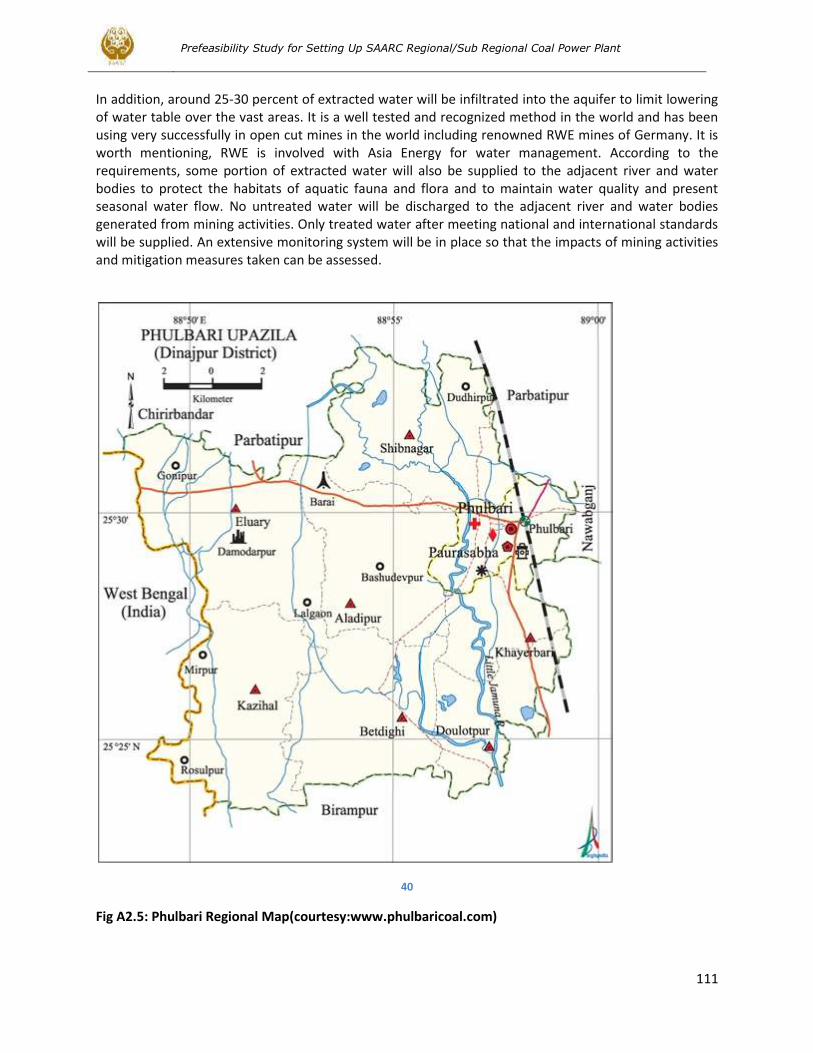
Prefeasibility Study for Setting Up SAARC Regional/Sub Regional Coal Power Plant
111
In addition, around 25-30 percent of extracted water will be infiltrated into the aquifer to limit lowering of water table over the vast areas. It is a well tested and recognized method in the world and has been using very successfully in open cut mines in the world including renowned RWE mines of Germany. It is worth mentioning, RWE is involved with Asia Energy for water management. According to the requirements, some portion of extracted water will also be supplied to the adjacent river and water bodies to protect the habitats of aquatic fauna and flora and to maintain water quality and present seasonal water flow. No untreated water will be discharged to the adjacent river and water bodies generated from mining activities. Only treated water after meeting national and international standards will be supplied. An extensive monitoring system will be in place so that the impacts of mining activities and mitigation measures taken can be assessed.
40
Fig A2.5: Phulbari Regional Map(courtesy:www.phulbaricoal.com)
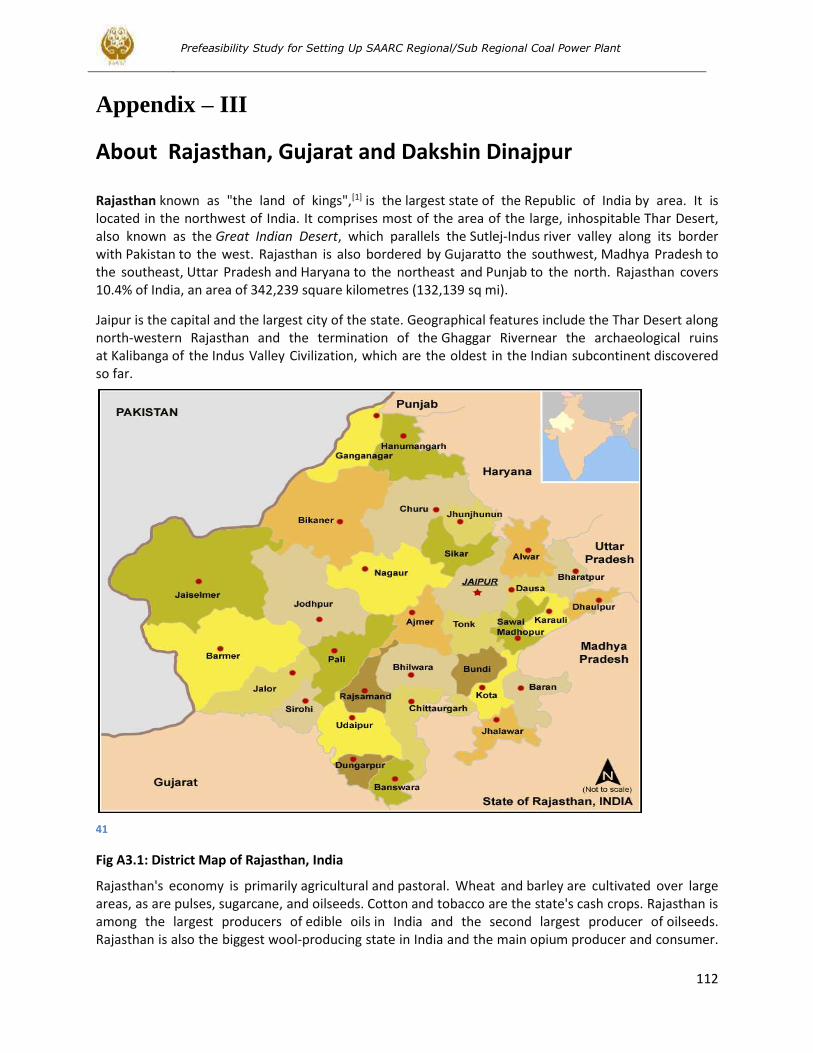
Prefeasibility Study for Setting Up SAARC Regional/Sub Regional Coal Power Plant
112
Appendix – III
About Rajasthan, Gujarat and Dakshin Dinajpur
Rajasthan known as "the land of kings",[1] is the largest state of the Republic of India by area. It is located in the northwest of India. It comprises most of the area of the large, inhospitable Thar Desert, also known as the Great Indian Desert, which parallels the Sutlej-Indus river valley along its border with Pakistan to the west. Rajasthan is also bordered by Gujaratto the southwest, Madhya Pradesh to the southeast, Uttar Pradesh and Haryana to the northeast and Punjab to the north. Rajasthan covers 10.4% of India, an area of 342,239 square kilometres (132,139 sq mi).
Jaipur is the capital and the largest city of the state. Geographical features include the Thar Desert along north-western Rajasthan and the termination of the Ghaggar Rivernear the archaeological ruins at Kalibanga of the Indus Valley Civilization, which are the oldest in the Indian subcontinent discovered so far.
41
Fig A3.1: District Map of Rajasthan, India
Rajasthan's economy is primarily agricultural and pastoral. Wheat and barley are cultivated over large areas, as are pulses, sugarcane, and oilseeds. Cotton and tobacco are the state's cash crops. Rajasthan is among the largest producers of edible oils in India and the second largest producer of oilseeds. Rajasthan is also the biggest wool-producing state in India and the main opium producer and consumer.
Prefeasibility Study for Setting Up SAARC Regional/Sub Regional Coal Power Plant
113
There are mainly two crop seasons. The water for irrigation comes from wells and tanks. The Indira Gandhi Canal irrigates northwestern Rajasthan. Rajasthan has a mainly Rajasthani population of approximately 68,621,012. Rajasthan's population is made up mainly of Hindus, who account for 88.8% of the population.[24] Muslims make up 8.5%,Sikhs 1.4% and Jains 1.2% of the population.[24] The state of Rajasthan is also populated bySindhis, who came to Rajasthan from Sindh province (now in Pakistan) during the India-Pakistan separation in 1947. Map of Rajasthan Coordinates (Jaipur): 26.57268°N 73.83902°E Coordinates 26.57268°N 73.83902°E Capital Jaipur Largest city Jaipur Districts 33 total Area Total 342,239 km2(132,139 sq mi) Area rank 1st Population (2011) Total 68,621,012 Rank 8th Density 201/km2 (520/sq mi) HDI 0.637 (medium) HDI rank 21st (2005) Literacy 68% (20th) Lignite in Rajasthan Lignite popularly known as brown coal is a lower rank premature stage coal, which would have converted to black coal under favorable geological conditions in due course of time. It is brown in color, soft, friable, contain high insitu-moisture and volatile matter. Its calorific value on in situ basis varies from 2,000 to 4,000 k. cal/kg. First occurrence of lignite in Rajasthan was reported in 1896 while digging well at Palana village in Bikaner district. The first mining activity by underground method commenced in 1898 at Palana for utilizing lignite primarily for power station of the erstwhile Bikaner State. With the availability of hydro-electricity from Bhakhra, the demand of lignite went down and the mining of lignite was suspended in 1967. After a gap of about 13 years, in 1980 the state department of Mines & Geology restored the lignite exploration activities in Bikaner, Barmer & Nagaur districts of Western Rajasthan and located good deposit of lignite in these districts. To give a boost to the systematic and detailed exploration for lignite, Planning Commission, Govt. of India constituted an Expert Group under the aegis of Neyveli Lignite Corporation (NLC) in 1982, with G.S.I. & DMGR as its members. Detailed exploration work was planned and initiated jointly by MECL, GSI & DMGR in the areas identified for each agency. District wise brief account of lignite deposits is summarized below:
Prefeasibility Study for Setting Up SAARC Regional/Sub Regional Coal Power Plant
114
BIKANER DISTRICT:- Palana : It is located about 23 km. S.E. of Bikaner city. About 16.71 sq. km. area was prospected by D.M.G. by carrying out about 35493.0 mtrs, drilling spread over 482 bore holes. The lignite seams were intersected between 40 to 98 mts. depth with cumulative thickness of few cm. to 18.0 mts. The analytical results indicate that Ash content varies from 3.5-8% V.M. 20-35%, FC 21% and C.V. 3200-3500 K. Cal./kg. Based on exploratory drilling geological reserves of the order of 23.57 M.T. were estimated in the area. The area was previously being worked for power generation but due to fire in the mines, it was closed. Barsingsar : This area is located about 25 km. S.W. of Bikaner and 3 km. S.W. of Palana lignite area. Barsingsar lignite prospect was located and explored by the state department and M.E.C.L. by carrying out 35487.75 mts. drilling (313 bore holes) over an area of about 5.35 sq. kms. Exploratory drilling has the presence of lignite seams at about 67 mts. depth. The thickness of lignite seams varies from 6.30 mts. to 45.50 mts. The lignite of this area contains 2.4-10%Ash, 20-28% V.M., 16-28% F.C. and CV 3000 KCal/kg. Based on exploration data 77.83 M.T. reserves have been estimated. Gurha :
Gurha lignite deposit is located 22 km. N.W. of Kolayat. The Geological survey of India first noticed the presence of lignite in the area. Detail exploration was initiated by state department by carrying out 9428.35 mts. drilling in 76 boreholes over an area of 9.0 sq.km. Exploratory drilling intersected 20 to 26.90 mts. thick lignite seam at 38m to 148.0 mts. varying depth. About 38.00 million tonnes of reserves have been estimated in this area with 1:15 lignite overburden ratio. Average ash content is 11.9%, V.M. is 31.81, FC is 21.28% and calorific value at 45% in situ moisture is 2867 k. cal./kg.
Subsequently M.E.C.L. has carried out 42,867.85 mts. drilling in 322 boreholes in Gurha east and west blocks. Total reserves in these two blocks are estimated to be around 50 million tonnes. The details of each block are given below:
Block Tonnes (M.T.) Grade K. Cal/kg. Area sq. km. Average thickness mts.
Gurha East 20.94 2010 1.48 14.21
Gurha West 29.12 2580 4.60 6.74
Apparently, Gurha deposits appear to be exploitable by open cast mining. Bithnoke & Bithnoke Ext: Area is located about 30 km. west of Kolayat Exploratory drilling was initiated by MECL by carrying out 9358.20 mts. drilling in 50 boreholes over an area of 3 sq.km. M.E.C.L. intersected a 2 to 14.00 mts. thick lignite seam at depths varying from 100 to 150 mts. in this area. About 78 M.T. geological reserves have been estimated with 1:8 to 1:10 lignite overburden ratio. The average calorific value at 45% in situ moisture is 2500 K. Cal/kg. (Indicative). The ash content varies from 15 to 20% and V.M. from 20 to 25%.
Prefeasibility Study for Setting Up SAARC Regional/Sub Regional Coal Power Plant
115
Raneri : The area is located about 80 Kms. S.W. of Bikaner. The lignite prospect of the area was explored by department of Mines & Geology and 14895 mts. drilling in 96 boreholes have been carried out over an area of 28 sq.km. Borehole drilled indicated the lignite seam occurs at depth varying from 48.50 to 134.40 mts. The thickness of the seam varies from, 0.50 tp 12.00 mts. 30.92 million tonnes reserves have been estimated with 1:29.23 lignite overburden ratio and 4.54 million tonnes in 1:15 ratio. Hadla-Bhteyan : The area is located about 45 km. from Bikaner and about 15 km. from Barsingsar lignite deposit. The area is well connected by fair weathered tar road from Bikaner and Kolayat. Hadla lignite prospects was located and explored by the state department and so far 15440 mts..drilling in 106 boreholes have been done over an area of 1.10 sq. km. Exploration is still under progress .In the boreholes lignite seams were intersected at 93 to 124 mts. depth with thickness ranging from 13 to 18 mts. Based on exploration data 17.98 M.T. reserves have been estimated in the area .Apart from above, department also carried out exploratory drilling for lignite in other parts of Bikaner district namely; Chak- Vijaisinghpura, Badhnu-Bania, Hira Ki Dhani, Khari Charran, Ranasar, Bhojasar, Akasar, Lalamdesar- Bada Lalamdesar, Gajroopdesar, Surpura. Mion-Ki-Dhani, Gajner, Sarupdesar, Pyan Chhaneri, Mudhah-Kotri etc. The lignite prospects in above areas are not encouraging and as such have no economic value. BARMER DISTRICT: Kapurdi : Kapurdi lignite prospects is located 28 km. north of Barmer. The area was investigated by state department and later on M.E.C.L. under took regional and detailed exploration by carrying out 68473.00 mt of drilling in 539 boreholes covering an area of 12.50 sq.kms. Three distinct lignite zones below an overburden of about 60 mts. were encountered. The thickness of the individual seams varies from less than a meter to 5.60 m. the average being 4.85 m. Based on exploration data 150.70 million tonnes reserves have been estimated in the area within 1:15 lignite overburden ratio. The lignite of the area contains 5-20%, Ash, 21-15% V.M. and 13-26% F.C. The calorific value at 40-66% moisture is 2000-3000 K.cal/kg. Jalipa: Jalipa lignite deposit is located 12 km. north of Barmer. M.E.C.L. commenced its exploration in 1985 and 92,294 mts. drilling was done in 561 boreholes over an area of 15.00 sq.km. Lignite seams intersected between 46 to 180 mts. depth with thickness varying from 0.50 to 17.35 mts. 316.28 M.T. reserved have been proved with 1:15 Lignite O.B. ratio. The analytical result reveals the lignite contents as 5-20% Ash, 20-30% V.M., 15-25% F.C. of 2000-3500 k cal/kg C.V. at 35-50 at 35-50 at 35-50 moisture. Jalipa Extension (Bothia) : In extension of Jalipa NLC & MECL jointly took over the exploration work by carrying out 13,000 mts. drilling over an area of 14.11 sq. km. Based on exploratory drilling 151.67 mt. reserves have been proved. Giral : The area is located 43 kms North of Barmer. Giral lignite prospect was explored by NLC /MECL and 6058.60 m. drilling in 51 boreholes covering around 21.50 sq.km areas was done. Based on exploratory
Prefeasibility Study for Setting Up SAARC Regional/Sub Regional Coal Power Plant
116
drilling three broadly correlatable lignite horizons were observed, each shows development of 1 to 5 seams/bands of lignite. All horizons confined within 15m. to 101.60 mts. depth from surface. The proximate analysis indicates the lignite content as 10-30% Ash 20-25% V.M., 15-30% FC and 2001-4000 K.cal/kg CV at 30-40% moisture. Total 101.91 M.T. reserved have been proved in the area. Giral lignite area has been leased out to M/S R.S.M.D.C. mining activities has been started by open cast mining method. Sonari : Sonari lignite prospects were explored by NLC & MECL by carrying out 5813.80 mts. drilling in 47 boreholes over 7 sq.kms area. The lignite seams of 0.60 to 6.40 mts. thickness was intersected under the 11.70 to 198.2 mts. thick overburden. Based on exploration 43.59 million tonnes in situ lignite reserves have been estimated in the area with 22% Ash content, 20% V.M., 20% F.C. & 2270 C.V. (K. cal/kg). Sacha Souda : The 3.40 sq. km. area was undertaken by NLC & MECL for lignite exploration by putting 4339 mts. drilling in 17 boreholes. As a result of exploration multiple lignite seams were intersected of varying thickness from 0.60 from 0.60 to 3.90 mts. under the overburden of 44.20 to 183.0 mts. thickness. 28.70 million Tonnes geological reserves have been estimated in the area. Analytical results reveals the lignite content 20%Ash 20-30% V.M., 15-25 F.C. & 2819 k cal./kg. C.V. Apart from above MECL and NLC also took the exploration work in Jogeshwar talla, Thumbil area. NAGAUR DISTRICT: Merta Road: Department of Mines and Geology has carried out exploration over an area of 11.00 sq.km by doing 7428.0 mts. drilling in 55 boreholes. Subsequently CMPDI took over the exploration and drilled 239 boreholes amounting 24128.0 mts. drilling. Average thickness of the lignite seam is 3.20 mts. with an overburden of 69 to 120 mts. Indicated lignite reserves of the order of 83.20 million tonnes were assessed. The lignite has calorific value of 2684 K.cal/ kg with 45% in situ moisture, 14.63% Ash, 24.63% volatile matter and 17.75 fixed carbon. The average ratio of lignite to overburden is 1 :32. Merta Road block was considered suitable for underground gasification by team of Russian experts. Mokala : The area is located about 5 kms South of Mokala. State department commenced its exploration in 1984 and 10104.0 mts. drilling was done in 70 boreholes over an area of 14 sq.km. Multiple lignite seams of 0.80 to 12.50 m. thickness intersected with an overburden varying in thickness from 46 to 134 mts. About 36.56 million tonnes of lignite reserves have been estimated with 2837 k. cal/kg C.V., 45% insitu moisture, 18.81% fixed carbon, 25.89% volatile matter and 12.00% Ash. Kasnau-Igiar: State department undertook this area for exploratory drilling in year 1989-90 and carried out 16166 mts. drilling in 124 boreholes over an area of 7.74 sq. kms. Multiple lignite seams of 0.10 to 12.60 m. thickness were intersected with an overburden varying in thickness from 40 to 105 mts. A total of 64.90
Prefeasibility Study for Setting Up SAARC Regional/Sub Regional Coal Power Plant
117
million tonnes of lignite have been estimated with calorific value of 2800 k.ca. /kg and 43% insitu moisture with 12% Ash content, 20.13% fixed carbon and 23.75% volatile matter.
Gujarat Gujarat is a state in North-West India. It has an area of 196,204 km2 (75,755 sq mi) with a coastline of 1,600 km (990 mi), most of which lies on the Kathiawar peninsula, and a population in excess of 60 million. The state is bordered by Rajasthan to the north, Maharashtra to the south, Madhya Pradesh to the east, and the Arabian Sea as well as the Pakistani province of Sindh on the west. Its capital city is Gandhinagar, while its largest city is Ahmadabad. Gujarat is home to the Gujarati-speaking people of India. Gujarat borders with Pakistan's province of Sindh to the northwest, bounded by the Arabian Seato the southwest, the state of Rajasthan to the northeast, Madhya Pradesh to the east, and by Maharashtra to the south The Arabian Sea makes up the state's western coast. The capital, Gandhinagar is a planned city. Gujarat has an area of 75,686 sq mi (196,030 km2) with the longest coast line 1600 km, dotted with 41 ports: one major, 11 intermediate and 29 minor ports. The Rann of Kutch is a seasonally marshy saline clay desert located in the Thar Desert biogeographic region in between the province of Sindh and the state of Gujarat. Situated 8 km away from village Kharaghoda located in the Surendranagar District of northwestern India and the Sindh province of Pakistan. The population of the Gujarat State was 60,383,628 as per the 2011 census data. The density of population is 308/km2 (797.6/sq mi), a lower density compared to other states of the country. As per the census of 2011, the state has a sex ratio of 918 girls for every 1000 boys, one of the lowest (ranked 24) among the 29 states in India. Coordinates (Gandhinagar): 23°13′N 72°41′E Coordinates: 23°13′N 72°41′E Capital City Gandhinagar Largest city Ahmadabad Districts 33 total
Area Total 196,024 km2 (75,685 sq mi) Area rank 7th
Population (2011) Total 60,383,628 Rank 10th Density 310/ km2 (800/sq mi) HDI 0.527[1] (medium) HDI rank 11th (2011) Literacy 80.18 %
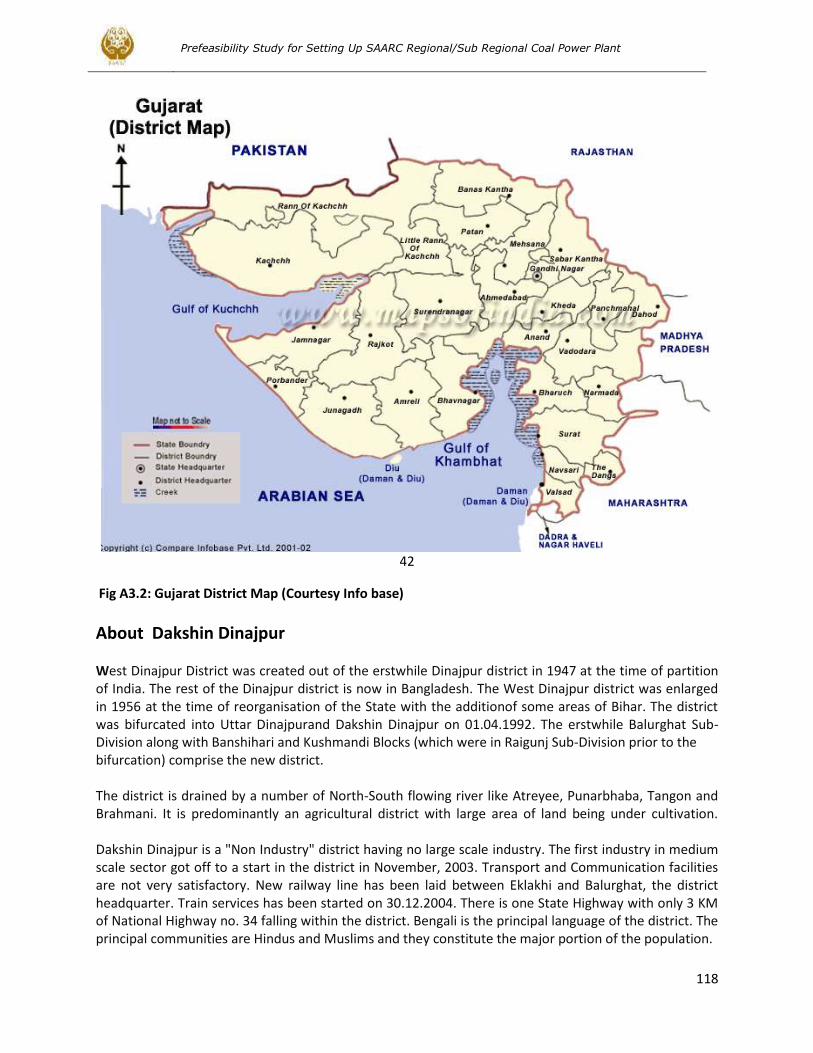
Prefeasibility Study for Setting Up SAARC Regional/Sub Regional Coal Power Plant
118
42
Fig A3.2: Gujarat District Map (Courtesy Info base)
About Dakshin Dinajpur West Dinajpur District was created out of the erstwhile Dinajpur district in 1947 at the time of partition of India. The rest of the Dinajpur district is now in Bangladesh. The West Dinajpur district was enlarged in 1956 at the time of reorganisation of the State with the additionof some areas of Bihar. The district was bifurcated into Uttar Dinajpurand Dakshin Dinajpur on 01.04.1992. The erstwhile Balurghat Sub-Division along with Banshihari and Kushmandi Blocks (which were in Raigunj Sub-Division prior to the bifurcation) comprise the new district. The district is drained by a number of North-South flowing river like Atreyee, Punarbhaba, Tangon and Brahmani. It is predominantly an agricultural district with large area of land being under cultivation. Dakshin Dinajpur is a "Non Industry" district having no large scale industry. The first industry in medium scale sector got off to a start in the district in November, 2003. Transport and Communication facilities are not very satisfactory. New railway line has been laid between Eklakhi and Balurghat, the district headquarter. Train services has been started on 30.12.2004. There is one State Highway with only 3 KM of National Highway no. 34 falling within the district. Bengali is the principal language of the district. The principal communities are Hindus and Muslims and they constitute the major portion of the population.
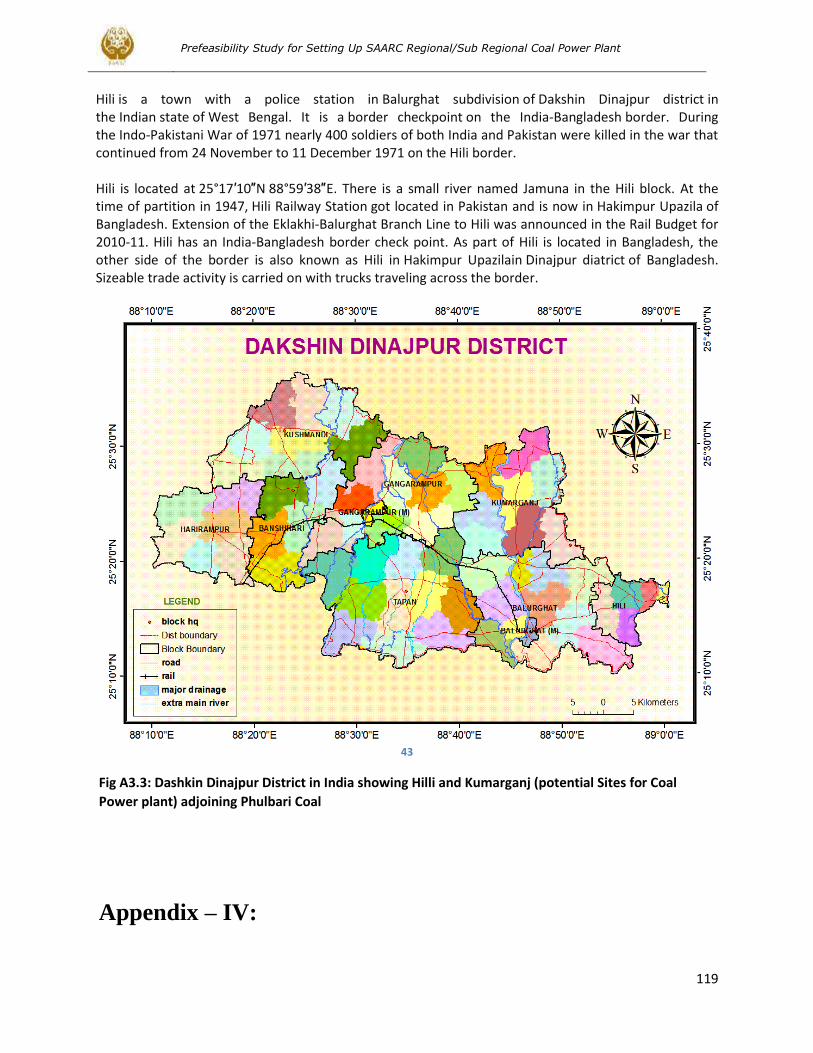
Prefeasibility Study for Setting Up SAARC Regional/Sub Regional Coal Power Plant
119
Hili is a town with a police station in Balurghat subdivision of Dakshin Dinajpur district in the Indian state of West Bengal. It is a border checkpoint on the India-Bangladesh border. During the Indo-Pakistani War of 1971 nearly 400 soldiers of both India and Pakistan were killed in the war that continued from 24 November to 11 December 1971 on the Hili border. Hili is located at 25°17′10″N 88°59′38″E. There is a small river named Jamuna in the Hili block. At the time of partition in 1947, Hili Railway Station got located in Pakistan and is now in Hakimpur Upazila of Bangladesh. Extension of the Eklakhi-Balurghat Branch Line to Hili was announced in the Rail Budget for 2010-11. Hili has an India-Bangladesh border check point. As part of Hili is located in Bangladesh, the other side of the border is also known as Hili in Hakimpur Upazilain Dinajpur diatrict of Bangladesh. Sizeable trade activity is carried on with trucks traveling across the border.
43
Fig A3.3: Dashkin Dinajpur District in India showing Hilli and Kumarganj (potential Sites for Coal
Power plant) adjoining Phulbari Coal
Appendix – IV:
Prefeasibility Study for Setting Up SAARC Regional/Sub Regional Coal Power Plant
120
Case Study of NLC India Environmental Aspects
Environment Impact of Mining Operations at NLC Tamil Nadu Lignite mining at Neyveli is carried out by open cast mining techniques with high mechanization for excavation, transportation and disposal. Lignite is covered by overburden consisting of different types of clay and hard abrasive Cuddalore sand stone. The thickness of the overburden is from 55 to 100 metres. The overburden is removed by specialized mining equipments such as bucket wheel excavators, conveyors, tripper cars & spreaders etc., Mining operation is a continuous process and the overburden soil removed is filled in the de-coaled area. The average thickness of the lignite is about 10 to 20 metres. Neyveli being an artesian area, the aquifer exerts an upward thrust of around 8 kg/sq.cm. For successful mining of lignite, depressurization of aquifer is essential. Large scale pumping is continuously done to avert heaving of the mine floor and consequent flooding of mine pit. Strip mining eliminates existing vegetation destroys the genetic soil profile, displaces or destroys wildlife and habitat, alters current land uses, and to some extent permanently changes the general topography for the area mined. The removal of vegetative cover, stockpiling, over-burden, hauling of soil and lignite increases the quantity of dust around mining operations. Dust, vibration and diesel exhaust odors are created (affecting sight, sound, and smell). Soil removal from the area to be surface-mined attesters or destroys many natural soil characteristic, and reduces its biodiversity and productivity for agricultural. Soil erosion and wash-off from the spoil heap formed from the soil excavated and dumped at dumping sites affects drainage and water bodies. Pumping of ground water may affect the water level in nearby wells and underground aquifer. Surface mining of coal causes direct and indirect damage to wildlife. Pit and spoil areas are not capable of providing food and cover for most species of wildlife. Mobile wildlife species like game animals, birds, and predators leave these areas. Invertebrates, reptiles, and small mammals may be destroyed. The community of microorganisms and nutrient-cycling processes are upset by movement, storage, and redistribution of soil. Many wildlife species are dependent on vegetation growing in natural drainage areas. The vegetation provides essential food, nesting sites and cover from predators. In the open cast mines like the one at Neyveli the presence of the above factors are considerable. The magnitude of environmental effect by mining could be imagined, if all the potential lignite in the area were to be tapped, then about 480 sq.kms. It will have to be covered by excavation and nearly 25% of this area will be additionally required for spoil banks. Confronted with multi-various pollutants as indicated above, the environment management demands much greater efforts than while dealing with a single pollutant factor or two. The problem in Neyveli mine is compounded with the factor that blasting is done for loosening the soil to relieve pressure, from the abrasive Cuddalore sand stone, off bucket Wheel Excavators. The overburden removal is carried out in 4 benches at different levels and each system has BWE, mobile transfer conveyor, conveyor system, and tripper – spreader combination. The environmental management in mining at Neyveli is done in the following areas with great alacrity and result orientation. 4.0 Environmental management To combat the above impacts, NLC has taken appropriate control measures. The details are given below:
Prefeasibility Study for Setting Up SAARC Regional/Sub Regional Coal Power Plant
121
4.1 Dust Suppression: The NLC has adopted continuous mining operation with SME such as BWE, conveyor, Tripper cars, spreaders etc. All are electrically operated equipments and hence during operation the dust emission in this system is comparatively low. The major dust emanating sources are due to movement of crawler equipments like dozer, pipe layer, mobile cranes and transport vehicles plying through the haul roads.
Methods adopted for reducing generation and dispersal of dust are:
Minimizing dust at the critical generating points: excavation is done by using sharp teeth of BWE and timely changing of the teeth; a system of teeth changing is instituted as a part of maintenance schedule.
Using sharp drill bits for blast hole drilling. Spraying water on roads and outside surfaces through mobile tankers or sprinklers for quenching
dust. To the extent possible, providing dust free roads within the mine area for movement of trucks and
conventional mining equipments. Providing protective respirators and masks to the operators, who are working in dusty areas. Studies conducted hitherto reveal that the dust concentration is within threshold limit. The lignite stacks in the bunker is being made wet with permanent sprinkler arrangements and water spraying, In addition to that special spraying systems are installed in the conveyors transporting the lignite. The lignite handling systems in the Power Stations are having arrangements to contain the dust by
effective sprinkling and spraying arrangements. Automatic Dust Suppression system have been installed in all the Thermal Power Stations covering the Dust emanating areas including Bunkers, Grinding Mills, etc.
Emission Control: Electrostatic Precipitators (ESPs) of more than 99% efficiency have been installed in all the three power stations of NLC to remove the ash particles from the outgoing flue gas. The stack heights are also as per the prescribed norms for effective disposal of other gases like SOx and NOx at wider range. To monitor the pollution in the stack emission, Online SPM and gas analyzers are installed. Apart from this, periodical survey by the State Pollution Control Board is also being carried out and so far, no abnormalities were reported.
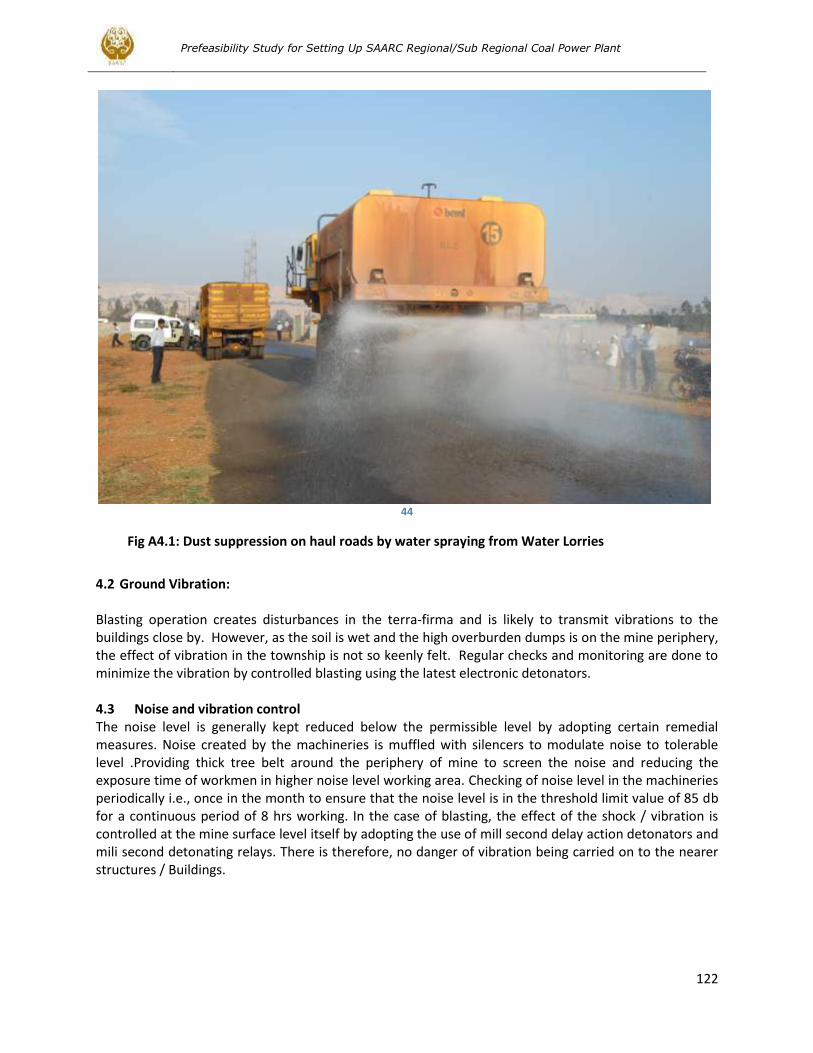
Prefeasibility Study for Setting Up SAARC Regional/Sub Regional Coal Power Plant
122
44
Fig A4.1: Dust suppression on haul roads by water spraying from Water Lorries
4.2 Ground Vibration:
Blasting operation creates disturbances in the terra-firma and is likely to transmit vibrations to the buildings close by. However, as the soil is wet and the high overburden dumps is on the mine periphery, the effect of vibration in the township is not so keenly felt. Regular checks and monitoring are done to minimize the vibration by controlled blasting using the latest electronic detonators. 4.3 Noise and vibration control The noise level is generally kept reduced below the permissible level by adopting certain remedial measures. Noise created by the machineries is muffled with silencers to modulate noise to tolerable level .Providing thick tree belt around the periphery of mine to screen the noise and reducing the exposure time of workmen in higher noise level working area. Checking of noise level in the machineries periodically i.e., once in the month to ensure that the noise level is in the threshold limit value of 85 db for a continuous period of 8 hrs working. In the case of blasting, the effect of the shock / vibration is controlled at the mine surface level itself by adopting the use of mill second delay action detonators and mili second detonating relays. There is therefore, no danger of vibration being carried on to the nearer structures / Buildings.
Prefeasibility Study for Setting Up SAARC Regional/Sub Regional Coal Power Plant
123
4.4. Balancing of Water Table: NLC is pumping ground water from the deep confined aquifer for safe lignite mining. The pumping is regulated on the scientific pattern and the drawl of water is as per the restriction laid down by Ministry of Environment and Forests, Government of India. While NLC is restricting drawl of ground water, it has no control over the industrial and agricultural requirement of the surrounding mostly in the hands of private people. Even for the pumping from NLC mines and to safeguard the water balance in the region, it has taken many proactive steps so that with the growth of NLC’s operation in Neyveli region, the balance in ground water is largely maintained. 4.5. Land Reclamation: Excavation of soil for the purpose of extracting lignite is a pre-requisite for mining operation. NLC is acquiring land for its mining activities in a phased manner from the adjacent villages by paying suitable compensation as per Government rules and norms. The Neyveli Lignite Mines at Neyveli is using Specialized Mining Equipments and in the process of mining lignite several hectares of land is disturbed every year. Even at the Project formulation stage, NLC has planned for refilling and reclamation of mined out area. The concept of reclamation is given due importance in NLC even at a time when the environmental awareness in Indian Mining sector was at a primitive stage. The soil excavated is backfilled in dumps and slope is stabilized by Conventional Mining Equipments. The back filled areas with sterile soil are reclaimed by adopting different methods. The land is reclaimed for agricultural, horticulture crops and development of forestry, pasture land etc. N.L.C. has undertaken various collaborative projects with Ministry of Coal (S&T) in co-ordination with Annamalai University, Central Fuel Research Institute, Dhanbad, Tamil Nadu Agricultural University, Coimbatore and Madras University, Chennai, etc. So far, a total area of about 2104 ha of land is reclaimed for agricultural, horticulture crops and a total area of 1926 ha. was afforested in all the three mines. An orchard has been developed in an area of 100 ha. by planting different varieties of fruit trees and also herbal cultivation is undertaken in the reclaimed area to cater to the needs of the Ayurvedic dispensary of NLC and also public. The yield from this land is as good as the produce from natural and normal agricultural lands. 4.6 Integrated Farming Systems (IFS): Integrated Farming System an innovative concept has been adopted in reclaiming the mine spoil areas. The sustainable integration of different agriculturally related enterprises such as grain crops, commercial crops, vegetables, flowers, medicinal plants, fodder crops, fruit trees, etc., with animal components such as cattle, birds, goats, aquaculture, etc., bio-gas generation, azolla and mushroom cultivation, provides ways to recycle products and by-products of one component serves as input to another linked component and reduce the cost of production. Further this farming system approach helps to sustain crop productivity in mine spoil with increased profitability and employment generation. Cattle rearing through integrated farming System
Prefeasibility Study for Setting Up SAARC Regional/Sub Regional Coal Power Plant
124
4.7 Slope Stabilization: The external over dumps created during the initial opening of the Mines cuts are causing a lot of environmental problems. In order to fulfill social obligations, that the huge quantities of mines spoil dumped over a large area should be converted into vegetative one making it fit for habitation, a Project namely SLOPE STABILISATION of the Mines Over Burden dumps has been undertaken with the collaboration of Tamil Nadu Agricultural University, Coimbatore. These dumps were terraced to different Benches with proper drainage facilities and irrigation facilities and suitable species are identified for plantations in the slopes in order to have soil compatibility and also for green belt. In order to have proper moisture on the slopes, drip irrigation system has been deployed and the slopes are being stabilized. N.L.C. on its own has taken up efforts to stabilize newly created slope in Mine-I A using, used coir mats and other local retaining materials. 4.8 Water management 4.8.1 Ground Water: To depressurize the deep aquifer below Lignite field, a certain quantity of ground water is to be pumped out and is diverted to the Thermal Power Plant Lakes for Industrial use. For safe mining operation, ground water is pumped out continuously round the clock through bore wells located at predetermined points. Over the years, through continuous study and implementation of new methods, the quantity of water pumped out has been reduced considerably. The water level is continuously monitored through observation wells for proper ground water management. 4.8.2 Storm Water: Major portion of the storm water, collected in sumps is due to rain and seepage from the Mines. This storm water is collected in sedimentation sumps and the part of the clear water from Mine-I is pumped to a modern Water Treatment Plant and treated water is supplied for domestic purpose to the Township. Similar treatment plant of 15000 GPM is under construction to treat the storm water from Mine-II, for utilization in the Thermal Power Station-II Expansion (2 x 250 MW) and for Thermal Power Station-II. Ground water pumping is avoided and the ground water is conserved. Further, the clear storm water from Mines is supplied to surrounding villages for agricultural activities. This in a great way reduces the ground water pumping, avoids wastage of water into the ground and conserves the ground water. Artificial Lake: Artificial lakes have been developed fully in all the three mines in a total area of 46 hectares and original habitant formation is being brought. It is to be noted that Mine-I artificial lake is developed under Indo-U.S. project collaboration. In Mine-I, the lake has been formed in the afforested area which serves as a bowl for collecting rain water. The whole area around this lake has been converted as a park by planting flowering trees, fruit trees and rest shelters. A Mini Zoo has also been developed with spotted deers, rabbits, peacocks, lovebirds, parrot, doves, fowls, etc. besides boating facilities. Different kinds of fishes are also reared in the aquarium maintained in the park. Apart from this, a nursery has also been established. Flora Fauna has been developed very well and more than 250 species of birds are settled in this area.
Prefeasibility Study for Setting Up SAARC Regional/Sub Regional Coal Power Plant
125
Rainwater harvesting and Artificial Recharge: Several rain water-harvesting pockets and water pools were created in the back filled area of all the three Mines. Water fowl refugees in Mine-I is being expanded and new waterfowl refugees in Mine-II and Mine-IA is under development. Rain water harvesting systems are established in the Township by constructing check dams across all the major drains and ultimately directed to a big reservoir built for collecting the huge quantity of rain water. Percolation wells are also drilled in this reservoir to charge the sub-soil aquifer. For maintenance of artificial recharge arrangement, two near by villages namely Maligampattu and Nadiapattu were chosen and check dams, percolation wells, observation wells, piezometer wells and recharge well were constructed. Continuous monitoring of the piezometer in and around recharge area has indicated that the percolation pond with percolation wells technique is the most effective for the Neyveli recharge area. 4.9 Effluent Treatment: Effluent Treatment Plants are installed and in service in all the three Mines, for taking care of effluents, from canteen, Service yards, etc. 4.10 Green Belt Development, Plantation and Nursery in Township and industrial Units N.L.C. is maintaining thick and massive green belt in its Industrial Units and Township. Township is maintaining greenery by planting trees like Neem, Eucalyptus, etc. including fruit bearing trees like mango, jack fruit, etc. Besides this, the circumferential areas of Township have been developed with Eucalyptus, acacia and cashew plantations, to maintain ecological balance. Green Belt development have been taken up and completed in the left out areas of Power Plants. Since the available areas within the Plants have been covered fully, additional plantations are being taken up in the vacant areas in Township.
Appendix – V
Prefeasibility Study for Setting Up SAARC Regional/Sub Regional Coal Power Plant
126
Levelized Cost of New Generation Resources in the Annual Energy Outlook 2013(courtesy Energy
Information Administration of USA)
January 28, 2013 This paper presents average levelized costs for generating technologies that are brought on line in 2018
as represented in the National Energy Modeling System (NEMS) for the Annual Energy Outlook 2013 (AEO2013) Early Release Reference case. Both national values and the minimum and maximum values across the 22 U.S. regions of the NEMS electricity market module are presented. Levelized cost is often cited as a convenient summary measure of the overall competiveness of different generating technologies. It represents the per-kilowatthour cost (in real dollars) of building and operating a generating plant over an assumed financial life and duty cycle. Key inputs to calculating levelized costs include overnight capital costs, fuel costs, fixed and variable operations and maintenance (O&M) costs, financing costs, and an assumed utilization rate for each plant type. The importance of the factors varies among the technologies. For technologies such as solar and wind generation that have no fuel costs and relatively small O&M costs, the levelized cost changes in rough proportion to the estimated overnight capital cost of generation capacity. For technologies with significant fuel cost, both fuel cost and overnight cost estimates significantly affect the levelized cost. The availability of various incentives, including state or federal tax credits, can also impact the calculation of levelized cost. The values shown in the tables in this discussion do not incorporate any such incentives.4 As with any projection, there is uncertainty about all of these factors and their values can vary regionally and across time as technologies evolve and fuel prices change. It is important to note that, while levelized costs are a convenient summary measure of the overall competiveness of different generating technologies, actual plant investment decisions are affected by the specific technological and regional characteristics of a project, which involve numerous other considerations. The projected utilization rate, which depends on the load shape and the existing resource mix in an area where additional capacity is needed, is one such factor. The existing resource mix in a region can directly affect the economic viability of a new investment through its effect on the economics surrounding the displacement of existing resources. For example, a wind resource that would primarily displace existing natural gas generation will usually have a different value than one that would displace existing coal generation. A related factor is the capacity value, which depends on both the existing capacity mix and load characteristics in a region. Since load must be balanced on a continuous basis, units whose output can be varied to follow demand (dispatchable technologies) generally have more value to a system than less flexible units (non-dispatchable technologies) or those whose operation is tied to the availability of an intermittent resource. The levelized costs for dispatchable and nondispatchable technologies are listed separately in the tables, because caution should be used when comparing them to one another.
Since projected utilization rates, the existing resource mix, and capacity values can all vary dramatically across regions where new generation capacity may be needed, the direct comparison of the levelized cost of electricity across technologies is often problematic and can be misleading as a method to assess the economic competitiveness of various generation alternatives. Conceptually, a better assessment of economic competitiveness can be gained through consideration of avoided cost, a measure of what it would cost the grid to generate the electricity that is otherwise displaced by a new generation project,
Prefeasibility Study for Setting Up SAARC Regional/Sub Regional Coal Power Plant
127
as well as its levelized cost. Avoided cost, which provides a proxy measure for the annual economic value of a candidate project, may be summed over its financial life and converted to a stream of equal annual payments, which may then be divided by average annual output of the project to develop a figure that expresses the "levelized" avoided cost of the project. This levelized avoided cost may then be compared to the levelized cost of the candidate project to provide an indication of whether or not the project’s value exceeds its cost. If multiple technologies are available to meet load, comparisons of each project’s levelized avoided cost to its levelized project cost may be used to determine which project provides the best net economic value. Estimating avoided costs is more complex than for simple levelized costs, because they require tools to simulate the operation of the power system with and without any project under consideration. The economic decisions regarding capacity additions in EIA's long-term projections reflect these concepts rather than simple comparisons of levelized project costs across technologies.
Policy-related factors, such as investment or production tax credits for specified generation sources, can also impact investment decisions. Finally, although levelized cost calculations are generally made using an assumed set of capital and operating costs, the inherent uncertainty about future fuel prices and future policies, may cause plant owners or investors who finance plants to place a value on portfolio diversification. While EIA considers many of these factors in its analysis of technology choice in the electricity sector, these concepts are not well represented in the context of levelized cost figures. The levelized cost shown for each utility-scale generation technology in the tables in this discussion are calculated based on a 30-year cost recovery period, using a real after tax weighted average cost of capital (WACC) of 6.6 percent. In reality, the cost recovery period and cost of capital can vary by technology and project type. In the AEO2013 reference case a 3-percentage point increase in the cost of capital is added when evaluating investments in greenhouse gas (GHG) intensive technologies like coal-fired power and coal-to-liquids (CTL) plants without carbon control and sequestration (CCS). While the 3-percentage point adjustment is somewhat arbitrary, in levelized cost terms its impact is similar to that of an emissions fee of $15 per metric ton of carbon dioxide (CO2) when investing in a new coal plant without CCS, similar to the costs used by utilities and regulators in their resource planning. The adjustment should not be seen as an increase in the actual cost of financing, but rather as representing the implicit hurdle being added to GHG-intensive projects to account for the possibility they may eventually have to purchase allowances or invest in other GHG emission-reducing projects that offset their emissions. As a result, the levelized capital costs of coal-fired plants without CCS are higher than would otherwise be expected.
Some technologies, notably solar photovoltaic (PV), are used in both utility-scale plants and distributed end-use residential and commercial applications. As noted above, the levelized cost calculations presented in the tables apply only to utility-scale use of those technologies.
In the tables in this discussion, the levelized cost for each technology is evaluated based on the capacity factor indicated, which generally corresponds to the high end of its likely utilization range. Simple combustion turbines (conventional or advanced technology) that are typically used for peak load duty cycles are evaluated at a 30-percent capacity factor. The duty cycle for intermittent renewable resources, wind and solar, is not operator controlled, but dependent on the weather or solar cycle (that is, sunrise/sunset) and so will not necessarily correspond to operator dispatched duty cycles. As a result, their levelized costs are not directly comparable to those for other technologies (even where the average annual capacity factor may be similar) and therefore are shown in separate sections within each of the tables. The capacity factors shown for solar, wind, and hydroelectric resources in Table 1 are simple averages of the capacity factor for the marginal site in each region. These capacity factors can
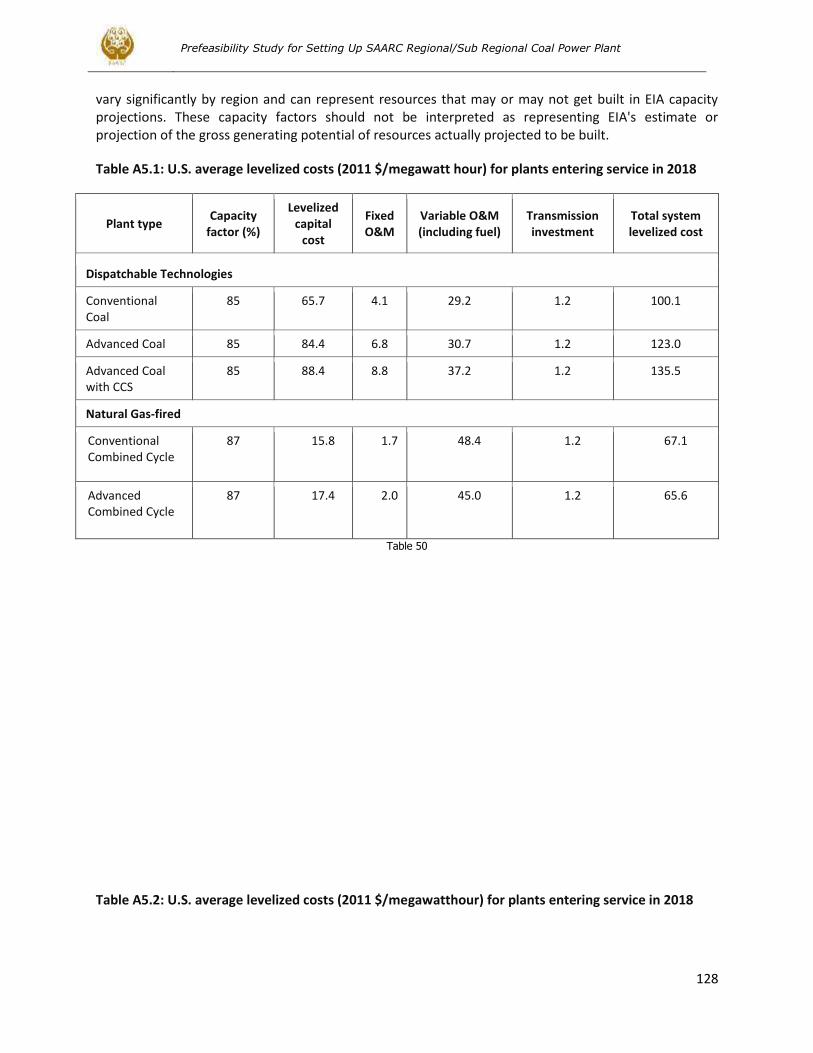
Prefeasibility Study for Setting Up SAARC Regional/Sub Regional Coal Power Plant
128
vary significantly by region and can represent resources that may or may not get built in EIA capacity projections. These capacity factors should not be interpreted as representing EIA's estimate or projection of the gross generating potential of resources actually projected to be built.
Table A5.1: U.S. average levelized costs (2011 $/megawatt hour) for plants entering service in 2018
Plant type Capacity
factor (%)
Levelized capital
cost
Fixed O&M
Variable O&M (including fuel)
Transmission investment
Total system levelized cost
Dispatchable Technologies
Conventional Coal
85 65.7 4.1 29.2 1.2 100.1
Advanced Coal 85 84.4 6.8 30.7 1.2 123.0
Advanced Coal with CCS
85 88.4 8.8 37.2 1.2 135.5
Natural Gas-fired
Conventional Combined Cycle
87 15.8 1.7 48.4 1.2 67.1
Advanced Combined Cycle
87 17.4 2.0 45.0 1.2 65.6
Table 50
Table A5.2: U.S. average levelized costs (2011 $/megawatthour) for plants entering service in 2018
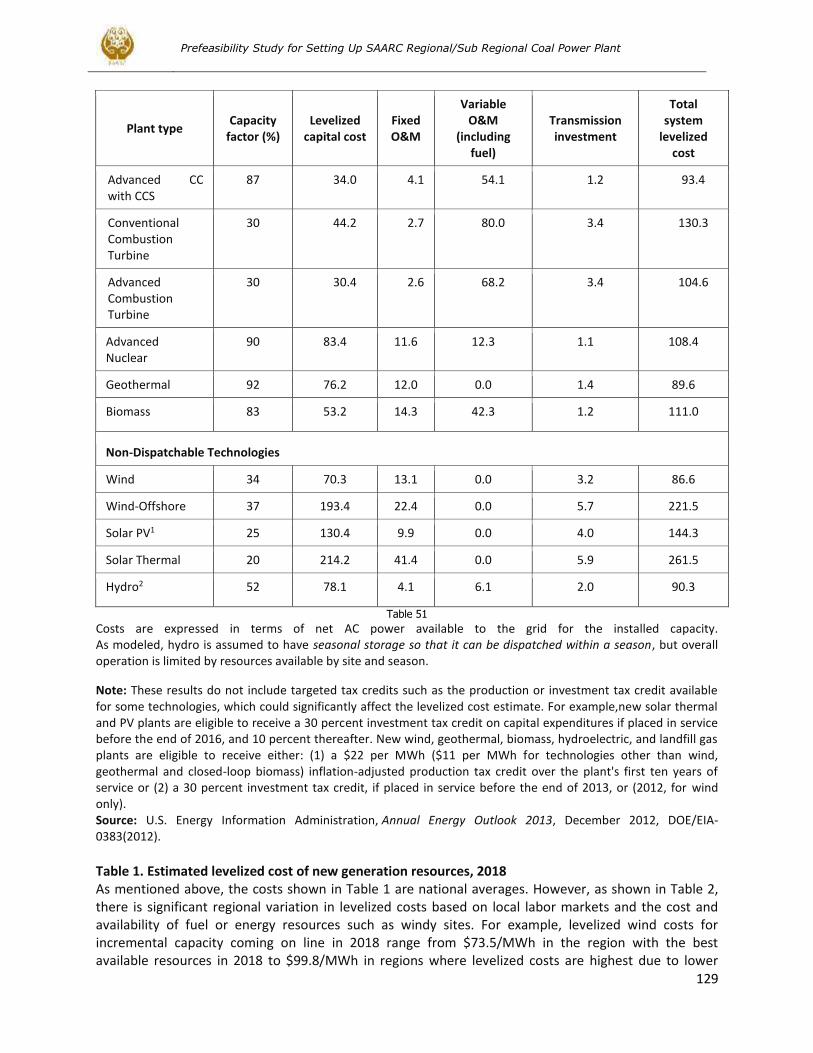
Prefeasibility Study for Setting Up SAARC Regional/Sub Regional Coal Power Plant
129
Plant type Capacity
factor (%) Levelized
capital cost Fixed O&M
Variable O&M
(including fuel)
Transmission investment
Total system
levelized cost
Advanced CC with CCS
87 34.0 4.1 54.1 1.2 93.4
Conventional Combustion Turbine
30 44.2 2.7 80.0 3.4 130.3
Advanced Combustion Turbine
30 30.4 2.6 68.2 3.4 104.6
Advanced Nuclear
90 83.4 11.6 12.3 1.1 108.4
Geothermal 92 76.2 12.0 0.0 1.4 89.6
Biomass 83 53.2 14.3 42.3 1.2 111.0
Non-Dispatchable Technologies
Wind 34 70.3 13.1 0.0 3.2 86.6
Wind-Offshore 37 193.4 22.4 0.0 5.7 221.5
Solar PV1 25 130.4 9.9 0.0 4.0 144.3
Solar Thermal 20 214.2 41.4 0.0 5.9 261.5
Hydro2 52 78.1 4.1 6.1 2.0 90.3
Table 51
Costs are expressed in terms of net AC power available to the grid for the installed capacity. As modeled, hydro is assumed to have seasonal storage so that it can be dispatched within a season, but overall operation is limited by resources available by site and season.
Note: These results do not include targeted tax credits such as the production or investment tax credit available for some technologies, which could significantly affect the levelized cost estimate. For example,new solar thermal and PV plants are eligible to receive a 30 percent investment tax credit on capital expenditures if placed in service before the end of 2016, and 10 percent thereafter. New wind, geothermal, biomass, hydroelectric, and landfill gas plants are eligible to receive either: (1) a $22 per MWh ($11 per MWh for technologies other than wind, geothermal and closed-loop biomass) inflation-adjusted production tax credit over the plant's first ten years of service or (2) a 30 percent investment tax credit, if placed in service before the end of 2013, or (2012, for wind only). Source: U.S. Energy Information Administration, Annual Energy Outlook 2013, December 2012, DOE/EIA-0383(2012).
Table 1. Estimated levelized cost of new generation resources, 2018 As mentioned above, the costs shown in Table 1 are national averages. However, as shown in Table 2, there is significant regional variation in levelized costs based on local labor markets and the cost and availability of fuel or energy resources such as windy sites. For example, levelized wind costs for incremental capacity coming on line in 2018 range from $73.5/MWh in the region with the best available resources in 2018 to $99.8/MWh in regions where levelized costs are highest due to lower
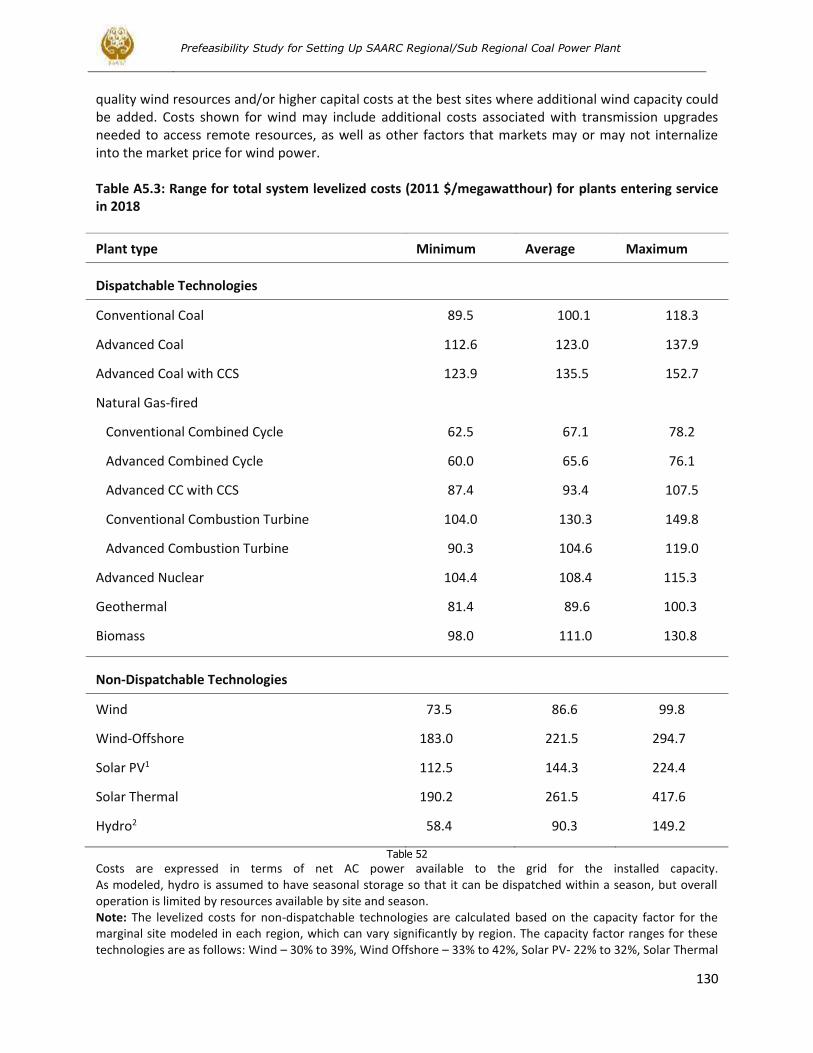
Prefeasibility Study for Setting Up SAARC Regional/Sub Regional Coal Power Plant
130
quality wind resources and/or higher capital costs at the best sites where additional wind capacity could be added. Costs shown for wind may include additional costs associated with transmission upgrades needed to access remote resources, as well as other factors that markets may or may not internalize into the market price for wind power. Table A5.3: Range for total system levelized costs (2011 $/megawatthour) for plants entering service in 2018
Plant type Minimum Average Maximum
Dispatchable Technologies
Conventional Coal 89.5 100.1 118.3
Advanced Coal 112.6 123.0 137.9
Advanced Coal with CCS 123.9 135.5 152.7
Natural Gas-fired
Conventional Combined Cycle 62.5 67.1 78.2
Advanced Combined Cycle 60.0 65.6 76.1
Advanced CC with CCS 87.4 93.4 107.5
Conventional Combustion Turbine 104.0 130.3 149.8
Advanced Combustion Turbine 90.3 104.6 119.0
Advanced Nuclear 104.4 108.4 115.3
Geothermal 81.4 89.6 100.3
Biomass 98.0 111.0 130.8
Non-Dispatchable Technologies
Wind 73.5 86.6 99.8
Wind-Offshore 183.0 221.5 294.7
Solar PV1 112.5 144.3 224.4
Solar Thermal 190.2 261.5 417.6
Hydro2 58.4 90.3 149.2
Table 52 Costs are expressed in terms of net AC power available to the grid for the installed capacity. As modeled, hydro is assumed to have seasonal storage so that it can be dispatched within a season, but overall operation is limited by resources available by site and season. Note: The levelized costs for non-dispatchable technologies are calculated based on the capacity factor for the marginal site modeled in each region, which can vary significantly by region. The capacity factor ranges for these technologies are as follows: Wind – 30% to 39%, Wind Offshore – 33% to 42%, Solar PV- 22% to 32%, Solar Thermal
Prefeasibility Study for Setting Up SAARC Regional/Sub Regional Coal Power Plant
131
– 11% to 26%, and Hydro – 30% to 65%. The levelized costs are also affected by regional variations in construction
labor rates and capital costs as well as resource availability. Source: U.S. Energy Information Administration, Annual Energy Outlook 2013, December 2012, DOE/EIA-0383(2012) Table 2. Regional variation in levelized cost of new generation resources, 2018
Footnotes
12018 is shown because the long lead time needed for some technologies means that the plant could not be brought on line prior to 2018 unless it was already under construction. 2 The full report is available at http://www.eia.gov/forecasts/aeo/er/index.cfm. 3 The specific assumptions for each of these factors are given in the Assumptions to the Annual Energy Outlook, available at http://www.eia.gov/forecasts/aeo/assumptions/. 4 These results do not include targeted tax credits such as the production or investment tax credit available for some technologies. Costs are estimated using tax depreciation schedules consistent with current law, which vary by technology. Source: http://www.eia.gov/forecasts/aeo/electricity_generation.cfm
Prefeasibility Study for Setting Up SAARC Regional/Sub Regional Coal Power Plant
132
References ESTIMATING THE COST OF COAL-FIRED GENERATION AN APPLICATION OF VISTATM, Anderson ,Ken Nowling State of Illinois Department of Commerce and Economic Opportunity Siting New Coal-Fired Power Plants A Guide to Permits and Economic Incentives Report of the Office of Coal Development Revised April 2007
Advanced 800+ MW Steam Power Plants and Future CCS Options Frank Cziesla , Hermann Kremer, Ulrich Much,Jan-Erik Riemschneider,Rainer Quinkertz Siemens AG, Energy Sector
Successful Completion of the 1320 MW (Gross) Coal-Fired Power Plant Iskenderun, Turkey Rainer Borgmann Iskenderun Üretim ve Tiçaret A.Ş (Isken) / Steag AG, Germany Rüdiger-Wolf Bentjen Siemens AG, Power Generation, Germany
Levellized Costs of Power Generation 4th SEE Energy Dialogue Thessaloniki 3-4 June 2010 Dr. Nick F Frydas
Survey 2012 Investment and Operation Cost Figures – Generation Portfolio September 2012 VGB PowerTech e.V. Essen
Report on the land requirement of thermal power stations, Central Electricity Authority,New Delhi,
December, 2007.
Standard technical specification for main plant package of Sub- critical thermal power project 2x (500 mw or above), Central electricity authority, New Delhi, September,2007 ESMAP Technical Paper 122/09, Dirk Pauschert , The International Bank for Reconstruction and Development/THE WORLD BANK GROUP
Prefeasibility Study for Setting Up SAARC Regional/Sub Regional Coal Power Plant
133
AFRICAN DEVELOPMENT BANK study Sendou 125 MW Coal Power Plant Senegal August 2009 Report to the Global CCS Institute, Cooling Alternatives Evaluation for a New Pulverized Coal Power Plant with Carbon Capture, August 2011we Electricity Generation Cost Model - 2011 Update, Revision 1, Department for Energy and Climate Change ‘August 2011, Parsons Brinckerhoff www.pbworld.co.uk C o a l I n d u s t r y Ad v i s o r y B o a r d ,I n t e r n a t i o n a l E n e r g y A g e n c y(IEA) Case Studies in Sustainable Development in the Coal Industry I n t e r n a t i o n a l E n e r g y A g e n c y: Clean Coal Technologies, Accelerating Commercial and Policy Drivers for Deployment I N T E R N A T I O N A L E N E R G Y A G E N C Y, Power Generation from Coal: Measuring and Reporting Efficiency Performance and CO2 Emissions IEA, Cleaner Coal in China, 2008 Cost and Performance Baseline for Fossil Energy Plants Volume 1: Bituminous Coal and Natural Gas to Electricity Revision 2, November 2010 DOE/NETL-2010/1397 Cost and Performance Baseline for Fossil Energy Plants Volume 3a: Low Rank Coal to Electricity: IGCC Cases May 2011 DOE/NETL-2010/1399 No. L-1/103/CERC/2012 CENTRAL ELECTRICITY REGULATORY COMMISSION NEW DELHI , In the matter of: Benchmark Capital Cost (Hard cost) for Thermal Power Stations with Coal as Fuel ,ORDER New Coal-Fired Power Plant Performance and Cost Estimates SL-009808 ,AUGUST 28, 2009,PROJECT 12301-003 www.sargentlundy.com
TERMS OF REFERENCE (TOR) FOR THE EXPERT(S)
Prefeasibility Study for Setting Up SAARC Regional/Sub Regional Coal Power Plant
134
SAARC ENERGY CENTRE
PRG- 46/2013/PENT Pre-feasibility Study for Setting up SAARC Regional / Sub-regional Coal
Based Power Plant.
Background: 1. South Asia’s electricity demand is increasing at the rate of around eight percent per year. By 2020, total electricity demand of South Asia would be around 500 GW. Coal based power plants dominate electricity generation in many industrialized as well as developing countries. Presently, coal is
the major source of electricity generation in India. Both Bangladesh and Pakistan have Coal resources which could not be fully utilized. Thar Coal and its vast deposits, apart from meeting Pakistan’s energy requirements, may have a potential for building and expanding regional economic cooperation. India has quite some experience in Coal. India has technology and the interest rates are low there. The fixed cost component of coal power plants in India may be 50-60% of the same in Pakistan and Bangladesh. 2. There has been a long held desire in some of the Member States to exploit the geographical advantage and expand trade and investment among closed neighbors. Efforts have been made, in the past and continue to be so, towards building a project portfolio for possible collaboration. Lack of availability of suitable projects has also been one of the reasons inhibiting economic cooperation among the Member States. The SAARC Regional Energy Trade Study (SRETS), carried out with the assistance of ADB also identified the development of regional/sub-regional power plant as one of the energy trade option for South Asia. Establishment of coal based power plants on the borders of the three countries (India-Pakistan, India-Bangladesh) can be a vehicle for commercial and economic cooperation , not only meeting the energy needs but also in technology sharing and transfer ,testing and laboratory facilities, and training at various levels of trade and professions. 3. The SEC proposed a pre-feasibility study for setting up regional or sub-regional coal based power
plant which has been approved by Governing Board and higher SAARC Bodies.
Objectives: 4. SEC under its thematic programme area Programme on “Energy Trade between the SAARC
Countries” (PENT) and Technology Transfer (POSIT) proposed a “Pre-feasibility Study for Setting up SAARC Regional/ Sub-regional Coal Based Power Plant” with the following
objectives: • to examine the scope and viability of coal-fired power plant(s) at sub-regional or
regional level so as to enable initial clearance and approval of competent authorities
and undertaking of detailed technical/feasibility studies in this respect • to enhance coal use in Member States • to promote regional energy cooperation through energy trade • meet increasing energy demand through exploitation of indigenous coal resources • to reduce oil imports • to improve energy security of the region
Methodology:
Prefeasibility Study for Setting Up SAARC Regional/Sub Regional Coal Power Plant
135
5. SEC will engage the short-term expert(s) from region or outside region having extensive experience of coal based power generation. The expert may be selected by SEC as per technical requirements of the study. The study report will be reviewed by SEC professionals and suitable expert (s) from the region. SEC will select a reviewer from South Asia having knowledge and experience in policy and planning. Final report will be published and circulated to relevant organizations in South Asia and it will be uploaded to SEC website for wider dissemination. Terms of Reference: 6. The study will cover, but not limited to, the following aspects:
• Comparative analysis of oil, gas and coal based power plants: • Review coal technology , market , environmental impacts: • Review available coal reserves for regional/sub-regional power projects in SAARC
Countries: • Review and propose clean coal technologies for the project: • Identification of suitable sites for at least three projects considering the followings:
Coal availability
Raw material logistics Demand location and trends
Transmission infrastructure, existing and projected
5.2 Estimated cost components, capacity i.e. size of the power plant: (600 MW at a minimum;2) (1000 MW;3) (2x 600 MW;4) (5X 1000 MW) to be implemented in a phased manner
Technology options keeping in view environmental concerns Interconnection
5.2 Analysis and share of the cost aspects of building and operating an regional/sub-
regional power project
5.3 Ownership i.e. joint venture among SAARC Member States or solely private or public private partnership
5.4 Financial arrangements and Project Economics 5.5 Electricity trade options and proposed power sharing mechanism 5.6 Suggest policy options for competitive price of electricity generated from regional/sub-
regional power plant. 5.7 Review construction and operational risks of the Project 5.8 Conclusions and Recommendations
Terms and Conditions
7. As an accomplishment of the assignment, the Expert will prepare and submit the Prefeasibility Report to the Director, SAARC Energy Centre as per given time schedule taking into account the above described background, objectives and the terms of reference.
8. The Expert will report to the Director, SAARC Energy Centre and will remain in close contact with SEC programme coordinator.
9. Email would be the preferred mode of communication with SEC and all involved in the
Study.

Prefeasibility Study for Setting Up SAARC Regional/Sub Regional Coal Power Plant
136
Deliverable: 7. A Pre-feasibility Study Report conforming to the background, objectives and TORs as described above
as per following details: Draft Report: 10 copies and a presentation will be organized to discuss the contents. Final Report: The Report would be finalized based on the inputs received during presentation,
Reviewers, SEC Professionals. Ten copies would be submitted along with a soft copy. Time Schedule: 8. First Draft of the Report will be submitted within three months after signing the Contract with SAARC
Energy Centre.