Embed Size (px)
Citation preview

Preferred orientation of planar microstructures determined via statistical
best-fit of measured intersection-lines: the ‘FitPitch’ computer program
Domingo Aerden*
Departamento de Geodinamica, Universidad de Granada, Granada 18071, Spain
Received 30 July 2001; received in revised form 10 July 2002; accepted 15 July 2002
Abstract
The ‘FitPitch’ computer program allows characterisation of preferred orientation of planar microstructures in a rock from the orientations
of their intersection-lines on different sections. Measured pitch or strike angles of such intersection-lines are fitted to the theoretical
intersection-lines of a single model-plane, or a combination of two or three model-planes. The degree of fit is quantified in terms of the
deviation between natural and theoretical intersection-lines, normalised by uniform data. A first application is described concerning
porphyroblast inclusion trails whose orientation in 28 samples from the Variscan Iberian Massif was measured. Analysis of these data
illustrates how the method can be used to quantify preferred orientation of relict foliations contained in a group of porphyroblasts and how
this complements existing techniques for determining foliation intersection axes (FIA) in porphyroblasts. A second described application
deals with previously published orientation data for microfracture trace lines in quartz grains of a Variscan granite in the Rhine Graben.
Qualitatively established best-fit planes derived originally from this data are compared with the numerically established planes using the
FitPitch program, and discussed in terms of the advantages and potential limitations of the method.
q 2002 Published by Elsevier Science Ltd.
Keywords: Microstructural analysis; Preferred orientation; Porphyroblast; Inclusion trails; Microfracture
1. Introduction
The use of porphyroblast inclusion trails as kinematic
indicators faces the difficulty that these microstructures
represent planar (2-D) cuts through often complex and
potentially variable microstructures in a rock. Conse-
quently, considerable efforts have been undertaken to
complement traditional qualitative study of selected por-
phyroblasts in 2-D with new quantitative approaches
concerned with 3-D data for large porphyroblast populations
(Johnson, 1990; Hayward, 1992; Davis, 1993; Huang, 1993;
Aerden, 1994, 1995, 1998; Guglielmo, 1994; Bell et al.,
1995, 1997, 1998; Mares, 1998; Bell and Mares, 1999; Jung
et al., 1999; Ilg and Karlstrom, 2000). Confirming an early
report (Fyson, 1980), these studies have revealed well
developed preferred orientation of planar and linear
porphyroblast microstructures in different metamorphic
belts, commonly contrasting with much more variable
orientation of dominant matrix fabrics. It has been shown
further how such information can be applied to correlate
complex (polyphase) deformation histories, and how 2D
inclusion trail geometries alone can lead to incomplete or
erroneous kinematic interpretations (e.g. Aerden, 1994).
As a methodological contribution to the above-men-
tioned new line of research, a computer program has been
developed that allows quantitative characterisation of the
spatial preferred orientation of foliation relicts preserved in
porphyroblasts. This is done by fitting inclusion trail
orientations measured from differently oriented thin-sec-
tions to one, two or three best-fit planes in order to
characterise potential unimodal, bimodal or trimodal
preferred orientation patterns. The program can be applied
equally to analyse other planar microstructures which may
occur as one or multiple orientational sets, such as
microfractures as will be shown further.
After a brief review of current 3-D microstructural
techniques and a description of program principles, the
results of two applications are presented and discussed. The
first application concerns porphyroblastic samples from the
Variscan orogen in NW-Iberia, and illustrates various
advantages and limitations of the method as compared
0191-8141/03/$ - see front matter q 2002 Published by Elsevier Science Ltd.
PII: S0 19 1 -8 14 1 (0 2) 00 1 19 -0
Journal of Structural Geology 25 (2003) 923–934
www.elsevier.com/locate/jsg
* Tel.: þ349-5827-2883; fax: þ349-5824-8527.
E-mail address: [email protected] (D. Aerden).
with previous 3-D techniques. A forthcoming paper in this
journal (Aerden, 2002) will address the relationship of these
results with field structures in NW-Iberia and tectonic
implications.
The second application described in this paper concerns
previously published microfracture orientation data from
four granite samples (Dezayes et al., 2000). The original
workers measured microfracture trace lines (fluid-inclusion
trails) in quartz grains and fitted their data ‘manually’ to
multiple best-fit planes. A comparison of their results with
the best-fit solutions obtained via FitPitch reveals interest-
ing coincidences and some differences.
2. Previous 3-D microstructural methods
2.1. Qualitative fitting of data using a stereonet
The spatial preferred orientation of foliation relicts in
porphyroblasts (i.e. inclusion planes) can be determined
simply if inclusion trails show well developed unimodal
orientation maxima for differently oriented thin-sections.
These modal maxima can be plotted as points on a stereonet
and fitted to a great circle (Jung et al., 1999). However,
complications arise when inclusion trails show bimodal,
trimodal or relatively scattered orientations in a thin-
section, potentially corresponding to multiple foliation
generations. Fitting such data requires previous correlation
of different 2-D maxima between different thin-sections,
which can be ambiguous. The FitPitch program eliminates
the need to interpret or correlate multimodal 2-D maxima by
fitting data individually.
2.2. The FIA method
Hayward (1990) developed a technique to determine the
spatial orientation of foliation-intersection axes (i.e. crenu-
lation axes) or foliation-inflexion axes (i.e. axes of relative
matrix-porphyroblast rotation) from asymmetrically crenu-
lated or curved inclusion trails (e.g. sigmoidal, spiral or
staircase geometry). Such microstructures (generally abbre-
viated as FIA) can be measured by recording the
predominant curvature asymmetry of inclusion trails (‘S’
or ‘Z’) in sets of vertical thin-sections with different strikes
around the compass. This allows the trend of a FIA to be
constrained between the strikes of two adjacent thin-
sections (of the radial set) that mark a switch in dominant
curvature asymmetry. The FIA plunge can be subsequently
determined in a similar way by cutting additional thin-
sections radially about a horizontal axes oriented perpen-
dicular to the FIA trend. Bell et al. (1995) refined the
method to allow determination of multiple FIA in rocks with
complex structural evolution from consistent curvature-
sense reversals of inclusion trails as they pass from the core
to the rim of individual porphyroblasts. The usefulness of
FIA data for unravelling orogenic histories, or studying
fundamental deformation processes at various scales has
been convincingly demonstrated since then (e.g. Bell et al.,
1998; Mares, 1998; Bell and Mares, 1999; Hickey and Bell,
1999; Stallard and Hickey, 2001; Aerden, 2002). However,
in the author’s experience, porphyroblastic rocks are
commonly unsuitable for the FIA method, because they
contain mainly straight inclusion trails, inclusion trails
showing inconsistent curvature senses in the same thin-
section (while lacking the earlier mentioned core-rime
relationships), or symmetrically crenulated inclusion trails.
Via calculation of multiple best-fit planes, FitPitch can still
furnish best-fit FIA for such samples.
2.3. 3-D imaging of single porphyroblasts
The internal geometry of individual large porphyroblasts
can be resolved in great detail by combining 2-D images of a
series of closely spaced thin-sections in a 3-D reconstruction
using various image-analysis techniques (Schoneveld,
1979; Johnson, 1993; Johnson and Moore, 1996; Jung
et al., 1999). Another promising imaging technique recently
applied to metamorphic textures (after earlier use in the
medical- and materials sciences) is high-resolution com-
puted X-ray tomography (Denison et al., 1997). Such
techniques represent valuable tools for fundamental studies
of the processes involved in synkinematic porphyroblast
growth, and for detailed reconstruction of P–T– t trajec-
tories. However, they are less suitable for the analysis of a
large number of porphyroblasts as required in regional
tectonic studies.
3. Program principles
3.1. Fitting intersection-lines
The program is written in FORTRAN and fits inclusion-
trail orientations (i.e. pitch angles or strike angles for
horizontal sections) gathered from differently oriented thin-
sections to one, two or three planes. Inclusion trails are
treated as intersection-lines of one or several foliation
planes (i.e. inclusion planes) on different thin-section
planes. Therefore, data are compared with the intersec-
tion-lines of a large number of uniformly spaced model-
planes on the same sections. A best model-plane or a best
combination of two or three model-planes can be identified
by minimising the deviation between data (i.e. natural
intersection-lines) and model intersection-lines. This is
fundamentally different from fitting lines that do not
represent the intersection of two planes (e.g. bedding
poles), which is done by minimising their angular deviation
from the planes themselves (Ramsay, 1967; Aerden and
Sanchez San Roman, 2002).
The difficulty of fitting data to multiple planes resides in
the huge number of combinations that can be formed with
only a limited number of elements. For a resolution of 18 in
D. Aerden / Journal of Structural Geology 25 (2003) 923–934924

spherical coordinates, 32401 planes can be defined with
which one can form 5.1 £ 108 different combinations of two
planes, and over 5.4 £ 1012 combinations of three planes.
Testing all of them is not practical even with modern
computers. Therefore, the strategy is adopted of first (STEP-
1) considering a reduced set of coarsely-spaced model-
planes, and then (STEP-2) iteratively refining a preliminary
solution obtained with this set.
3.2. STEP-1: calculation of a preliminary best-fit solution
The initial group of coarsely spaced model-planes is
defined by superposing a square grid on an equal-area
stereonet and taking grid-line intersections as the poles of
model-planes. Two additional poles are added on the
primitive circle to fill remaining gaps so that a total of 43
model poles is obtained (Fig. 1a). After the user has
specified if he desires to fit data to one, two or three planes,
the program calculates the pitches of all intersection-lines of
the 43 planes on the thin-sections. These ‘model pitches’ are
stored in a two-dimensional matrix called MODEL-
PITCH(i,j), where ‘i’ identifies a model-plane and ‘j’ a
thin-section. From this point onward, the program follows
different, but analogous paths for one-, two- or three-plane
fitting. The remainder of this section will only consider the
case of a three-plane fit.
For three-plane fitting, the heart of the program is an
algorithm containing four nested loops (‘do’ statements in
FORTRAN; see Appendix A) that test all possible plane
triplets (12341 total) that can be formed with the initial 43
planes. Each plane triplet is tested as follows. The angular
deviations of the first datum from three model intersection-
lines on that section are determined. The smallest deviation
is stored in memory and the datum is attributed to the
corresponding model-plane (i.e. producing the nearest
intersection-line). The deviations of the datum from the
other two intersection-lines are further ignored. The same is
repeated for the second datum, the third, and so on until the
last datum from the last thin-section. The sum of all smallest
deviations (i.e. ‘total deviation’) is stored in a 3-D array
called SCORE(i,j,k), where i, j and k identify the tested
model-plane triplet. After the above has been repeated
12341 times for all plane triplets, the smallest value in
SCORE(i,j,k) is searched and the corresponding plane
triplet (i,j,k) identified as the (preliminary) best-fit solution.
3.3. STEP-2: iterative refinement
To refine the preliminary solution (STEP-1), the original
grid spacing is first reduced by half and a new set of 27 test
poles is defined, distributed in three square clusters about
the poles of the preliminary best planes (Fig. 1b). Poles
falling outside the plot circle are automatically transferred
to the opposite side of the stereonet. New model-plane
triplets are then formed by taking one pole out of each
cluster giving a total of 729 ( ¼ 93) new plane triplets. All
these are tested identically as described for STEP-1. The
newly obtained best-plane triplet is returned to the start of
STEP-2 to perform a new iteration, which commences with
again halving the previously used grid spacing and
redefining 27 model poles at smaller distances about the
last best poles. After four iterations (not counting STEP-1) a
resolution of approximately 18 is reached and the definitive
best-fit planes are determined. These are printed with the
corresponding FIA (intersection-lines of best-fit planes),
average and standard deviations of data from model
intersection-lines, and three groups of data as fitted to
three planes.
Fig. 1. (a) Forty-three model-planes tested during STEP-1 obtained by superposing a rectangular grid on an equal-area stereonet and adding two poles on the
plot circle. (b) Hypothetical test-pole definition during the first two iterations of STEP-2 about the poles of the preliminary best planes obtained from STEP-1
(the larger black dots). Poles that fall outside the primitive circle (numbered 1–4) are transferred to the opposite side of the stereonet.
D. Aerden / Journal of Structural Geology 25 (2003) 923–934 925

3.4. STEP-3: evaluation of results
The degree of fit is expressed in terms of the average
angular deviation between data and the model intersection-
lines (ad), normalised by uniform data. The latter is
necessary, because uniform data will, generally, yield a
smaller average deviation for any combination of three
model-planes than two or one model-planes. Thus, the
deviations of all data from their nearest model intersection-
lines are summed and divided by the total number of data to
obtain ad. Then, the same is done for uniform data, and the
ratio Rd ¼ au/ad is calculated as a measure of the quality or
‘tightness’ of a best-fit solution (au is the average deviation
of uniform data from the model intersection-lines). The
probability that randomly generated data yield a particular
Rd value is P1 ¼ 1=ðRN22d Þ, P2 ¼ 1=ðRN24
d Þ, or P3 ¼
1=ðRN26d Þ for one-, two- or three-plane fitting, respectively,
N being the number of data. The differences between these
expressions stem from the fact that the first six, four or two
data can always be perfectly fitted to three-, two-, or one
planes, respectively. However, if N is relatively large, Rd for
one-, two- and three-plane fits can be compared to choose
the statistically more significant solution. For example, the
microfracture data for sample I of Dezayes et al. (2000)
(Table 1) yield average deviations of 16.9 and 12.28 in two-
and three-plane solutions, respectively, yet the former is
statistically favoured (Rd ¼ 1.51 versus Rd ¼ 1.41).
An additional criterion on which the choice of a
particular solution can be based is the degree to which a
best-fit solution is consistent with the orientation of (2-D)
modal maxima of separate thin-sections. To quantify this,
one, two or three best-fit lines are calculated for the data of
individual thin-sections separately. The average deviation
(am) of these lines from the best-fit intersection-lines as
based on all sections, normalised by uniform data, yields the
ratio Rm ¼ au/am which measures the degree of internal
consistency of a data set.
3.5. Other user-specified fit parameters
Besides specifying whether a best-fit with one, two or
three planes is desired, an additional parameter must be
entered by the user related to the fact that inclusion planes
subparallel to a thin-section are unlikely to produce a visible
inclusion trail line on it. Thus, a minimum cut-angle
between thin-sections and inclusion planes must be defined
below which an inclusion trail line is no longer attributable
to that plane. Estimating this angle is somewhat arbitrary
Table 1
Quantitative FitPitch results for three porphyroblastic samples from NW-Iberia plus four granite samples of Dezayes et al. (2000). Data sets are called after
sample numbers with the suffixes ‘A’ and ‘B’ referring to A-type or B-type inclusion-trails (see text). ad is the average angular deviation between measured and
model intersection-lines. am is the average deviation between best-fit lines calculated for separate thin-sections, and best-fit intersection-lines based on all data.
Rd and Rd are the corresponding values normalised by uniform data. The selection of one of three possible solutions (bold numbers) is based on the highest Rd
and Rm values
No. of model planes ad am Rd Rm Poles of best-fit planes (azimuth/plunge)
RESULTS FOR PORPHYROBLAST DATA
Data: 3 þ 4B 1 34.8 32.3 1.29 1.40 117/65
N ¼ 118 2 16.6 7.1 1.43 3.31 173/69; 099/06
Sections: 7 3 11.8 9.7 1.53 2.25 117/48; 131/02; 270/79
Data: 21A 1 14.6 11.9 3.07 3.79 072/05
N ¼ 52 2 7.9 10.6 3.95 2.94 271/16; 068/09
Sections: 3 3 4.7 2.7 5.58 9.74 271/07; 072/12; 241/16
Data: 27A þ B 1 38.1 35.6 1.27 1.27 166/15
N ¼ 195 2 21.3 17.7 1.14 1.37 156/10; 045/88
Sections: 7 3 13.6 9.2 1.38 2.05 167/17; 235/48; 315/20
RESULTS FOR MICROFRACTURE DATA
Data: I 1 37.9 37.9 1.19 1.19 259/28
N ¼ 1098 2 16.9 5.1 1.51 4.98 172/06; 081/34
Sections: 3 3 12.2 9.5 1.41 1.80 177/42; 258/10; 128/13
Data: II 1 37.9 37.1 1.19 1.13 283/12
N ¼ 1622 2 16.9 2.1 1.37 10.80 295/02; 035/68
Sections: 3 3 12.6 10.1 1.30 1.62 185/19; 294/03; 048/56
Data: III 1 33.6 33.1 1.34 1.36 000/00
N ¼ 1119 2 16.8 4.5 1.46 5.44 175/07; 303/47
Sections: 3 3 11.4 3.2 1.47 5.23 328/01; 217/25; 096/29
Data: IV 1 35.6 35.5 1.26 1.27 216/30
N ¼ 810 2 18.1 6.7 1.36 3.67 182/20; 084/47
Sections: 3 3 12.0 6.6 1.32 2.42 215/42; 002/44; 093/04
D. Aerden / Journal of Structural Geology 25 (2003) 923–934926

and depends on the coarseness, spacing, definition etc. of
inclusion trails, and on the type of microstructure that is
being analysed. For the porphyroblastic samples considered
in this paper, minimum cut angles were estimated as 5 and
108 for A- and B-type microstructures (see further),
respectively. For the microfracture data the angle was
taken as 108. However, slightly different values did not
appear to have a significant effect on the final results.
Finally, the user can choose between giving equal weight to
individual porphyroblast measurements, as in the present
study, or attribute equal weight to individual thin-sections
regardless of the number of data supplied by each.
4. Fitting inclusion-trail orientations in NW-Iberia
4.1. Geological setting
The Iberian Massif is a segment of the European
Variscan orogen built during the Devono-Carboniferous
Gondwana–Laurentia collision. An allochthonous nappe
complex composed of Lower Palaeozoic metasediments,
orthogneisses, granulites and eclogites is discontinuously
exposed in several synclinal massifs or tectonic klippen
(Ries and Shackleton, 1971; Fig. 2). These are carried by a
more continuously exposed para-autochthonous nappe
comprising mainly Silurian slates and schists. The larger
part of the Iberian Massif, however, comprises the footwall
of the above-mentioned nappes, and is traditionally
subdivided into five zones with contrasting structural styles
and palaeogeographic significance (Fig. 2). The Central
Iberian Zone (CIZ) forms the backbone of the orogen with
high- to medium-grade Upper-Proterozoic and Palaeozoic
rocks intruded by abundant syn- and post-orogenic grani-
toids. This zone is characterised by large upright folds
overprinted by younger flat-lying foliations and
detachments. The West-Asturian-Leonese Zone (WALZ)
and Ossa-Morena Zone (OMZ) occupy intermediate
positions in the orogen on both sides of the CIZ. They
exhibit large recumbent fold-nappes moderately refolded
Fig. 2. Simplified map of NW-Iberia showing the location of analysed porphyroblastic samples from the Variscan Iberian Massif. 1: Galicia-Tras-os-Montes
Zone (para-autochthonous) carrying several high-grade allochthonous klippen (solid black). 2: Central-Iberian Zone. 3: West-Asturian-Leonese Zone. 4: Ossa-
Morena Zone. 5: Cantabrian Zone. 6: South-Portuguese Zone.
D. Aerden / Journal of Structural Geology 25 (2003) 923–934 927

with subvertical axial planes. The external Cantabrian Zone
(CZ) and South-Portuguese Zone (SPZ) show thin-skinned
tectonics developed in Upper-Proterozoic to synorogenic
Carboniferous Flysch- and Molasse-type deposits.
A total of 28 samples from the ‘Basal Unit’ (Martınez
Catalan et al., 1996) of the allochthonous nappe complex,
the underlying para-autochthonous nappe, and the CIZ were
analysed with FitPitch (Fig. 2). Samples from the allochtho-
nous and para-autochthonous units are all albite–garnet
schists, except one staurolite–andalusite schist. Inclusion
trail compositions in some albite–garnet schist samples
witness early high-pressure, medium-temperature con-
ditions, followed by a generalised retrogradation of the
matrix (Arenas et al., 1995). All CIZ samples are Lower-
Palaeozoic micaschists containing andalusite, staurolite,
and/or cordierite porphyroblasts.
4.2. Measuring procedure
Radial sets of vertical thin-sections plus one or two
horizontal sections were cut from all samples. The angles
between all relatively straight inclusion trails in these
sections and the thin-section edge were measured and
converted to true pitch (vertical sections) or strike
angles (horizontal sections). Thin-sections were system-
atically surveyed by moving them in parallel bands
under the microscope and measuring inclusion trails in
every new porphyroblast that appeared in the field of
view. Measuring orientations for inclusion-trails that are
not perfectly straight can be ambiguous and requires
strict criteria (Hayward, 1992; Aerden, 1995; Paterson
and Vernon, 2001). In the present study, two different
types of data were distinguished: (1) orientations of
straight to moderately sigmoidal inclusion trails, and (2)
orientations for more complexly curved and/or micro-
folded inclusion trails with relatively straight isogons
and/or truncation surfaces. Both types of data will be
further referred to as ‘A-type’ and ‘B-type’. Fig. 3
shows the typical inclusion-trail geometries encountered
in the samples and illustrates how these were measured.
Very smoothly curving or disharmonically folded
inclusion trails lacking straight segments were ignored,
Fig. 3. Schematic sketches of transitional inclusion-trail geometries typically observed in the analysed samples of NW-Iberia. Straight to moderately sigmoidal
inclusion trails (A-type data) can be measured directly as indicated with bold bars. They commonly show evidence for having transposed an earlier fabric
(extreme right porphyroblast). B-type data correspond to more complex geometries, such as microfolded and/or truncational inclusion trails whose isogons
(dashed lines) or truncation surfaces can be measured. Disharmonically folded inclusion trails with strongly curved isogons, or irregular inclusion trail patterns
do not yield data. However, their curvature asymmetry (S or Z) can be recorded to apply Bell et al.’s (1995) FIA method.
Fig. 4. A-type data for sample 21 (see Fig. 2 for location) fitted to one plane, two planes and three planes. Dots represent inclusion trail orientations measured in
three mutually orthogonal thin-sections. Data from individual sections are presented in moving-average rose diagrams (208 counting interval) with the number
of data indicated below. A three-plane solution is quantitatively favoured (see Table 1) but is considered an artefact as explained in the text.
D. Aerden / Journal of Structural Geology 25 (2003) 923–934928

Fig. 5. (a) B-type inclusion trail data from samples 3 and 4 combined (Fig. 2 for sample location) plotted on an equal-area stereonet with accompanying moving
average rose diagrams (208 counting sweep) for a total of seven thin-sections used. The smaller stereograms show best-fit solutions with two and three planes. A
two-plane fit is favoured as explained in the text. (b) A-type plus B-type inclusion trail data from sample 27 (see Fig. 2b for location) and best-fit solutions with
two and three planes. A three-plane fit is favoured as explained in the text. (c) Oriented line drawings of all porphyroblasts observed in a horizontal thin-section
of sample 27 showing three fabric generations associated with distinctive trends. These roughly match the strikes of best-fit planes.
D. Aerden / Journal of Structural Geology 25 (2003) 923–934 929

as counted for poorly oriented or irregular inclusion
trails. Nevertheless, a very large majority of porphyr-
oblasts yielded useful data.
4.3. Results
Due to space limitations, data and best-fit results will
only be described for three selected samples in this paper to
illustrate the functioning of the program. Data and results
for the complete sample set are given as an electronic
supplement that can be accessed on the journals home page
(http://www.elsevier.com/locate/jsgi), and will be discussed
in a separate article (Aerden, 2002, in review).
The first data set considered here corresponds to A-
type microstructures in a staurolite–andalusite schist
sample of the Basal Unit of the Morais klippen (sample
21; Fig. 2). Inclusion trails in this sample are straight
and continuous with, but slightly oblique to, the matrix
foliation. They show very constant pitch on a horizontal
section and on an E–W-trending vertical section, but
more scattered orientations on a third N–S-trending
section (Fig. 4). The latter is due to a small angle
between this section and the inclusion planes, so that
slight variation in foliation orientation is strongly
amplified in intersection-line orientation. The single-
plane solution for this sample illustrates how the
FitPitch program reaches a solution, not by minimising
the deviation of data from the model-planes themselves,
but from the intersection-lines of those planes. In the
opposite case, a plane would have been found passing
much closer through the orientation maximum of the
E–W section, but highly inconsistent with the pitch
angles measured from the N–S section. Judging from
Rd and Rm values (Table 1), a three-plane solution is
favoured for the sample. However, this is thought to be
an artefact caused by slight ‘misfits’ between a limited
number of sections available for this sample. Small
‘misfits’ may arise from cumulative errors during
reorientation and cutting of samples, but in this case,
the origin is sought in gradually changing inclusion trail
orientations in a relatively large sample, different parts
of which were used for different sections.
Fig. 6. Microfracture data from samples I–IV of Dezayes et al. (2000; fig. 9) plotted in rose diagrams (58 class intervals and scaled to the same size) and
corresponding best-fit solutions as originally proposed and established with FitPitch. The original workers plotted the more prominent modal orientation
maxima of the rose diagrams on a stereonet (black dots) and drew several best-fit great circles for them. The FitPitch planes minimise the total deviation of the
corresponding intersection lines from individual data. The open square symbols represent best-fit lines as calculated for data from individual thin-sections
separately.
D. Aerden / Journal of Structural Geology 25 (2003) 923–934930

The second data set considered here concerns B-type
microstructures from two hand specimens combined
collected from the same outcrop in the Basal Unit of
the Ordenes Complex (samples 3 and 4; Fig. 2). Albite
porphyroblasts in the samples exhibit bimodal and
suborthogonal inclusion trail orientations corresponding
to multiple fabric generations (Fig. 5a; Aerden, 2002).
Although Rd is somewhat larger for the three-plane
solution than for the two-plane solution, the latter yields
a significantly larger Rm value (3.31 versus 2.25) and is
therefore considered more adequate.
The third data set presented combines A- and B-type data
from an andalusite–staurolite–schist sample of the CIZ
(sample 27; Fig. 2). A three-plane solution is favoured in
terms of both Rd and Rm (Table 1), and appears in good
agreement with the presence of at least three foliation
generations with distinctive strikes included in porphyro-
blasts of different timing (Fig. 5b and c).
5. Application to microfracture data of Dezayes et al.
(2000)
Dezayes et al. (2000) studied the orientation of micro-
fractures observed as fluid inclusion trails in quartz grains of
a Variscan granite in the Rhine graben. They measured the
pitch or strike angles of these fluid-inclusion trails on three
mutually orthogonal thin-sections (one horizontal and two
vertical) of four borehole samples (samples I to IV). Rose
diagrams for these data exhibit roughly bimodal or trimodal
distributions reflecting the existence of multiple microfracture
sets (fig. 9 of Dezayes et al., 2000; Fig. 6). To find the
orientation of these sets, the authors plotted prominent
orientation maxima of the rose diagrams on a stereonet and
fitted these to two or three great circles. They also measured
the orientation of mesoscopic fractures in the vicinity of each
sample location (their fig. 10) for comparison with the best-fit
planes based on the microscopic data.
Dezayes and coworkers kindly allowed me to analyse their
raw data with the FitPitch program to compare its solutions
with the best-fit planes established by them. In general terms,
our results are in good agreement, although some planes
identified originally were not found numerically and vice
versa. For sample I, Dezayes et al. (2000) deduced three best-
fit planes, whereas FitPitch favours a two-plane solution
judging from Rd and Rm values (Fig. 6). Nevertheless, two
planes of Dezayes et al. (2000) have very close orientations
and are both well approximated by one of the FitPitch planes.
For sample II, a best-fit to two planes is favoured by
FitPitch, but three planes were originally identified. The
additional plane of Dezayes et al. (2000) (labelled ‘e’ in
Fig. 6) implies that two close orientation maxima with
steep but opposite plunges on a vertical E–W-trending
section of this sample correlate with two separate strike
maxima (NE–SW and NW–SE) on a horizontal section.
However, FitPitch correlates these maxima both with the
prominent NE–SW strike maximum, while the smaller
strike maximum (NW–SE) is linked to a third, more
gently plunging maximum on the E–W section. Both
FitPitch planes are well matched by two best-fit planes of
Dezayes et al. (2000), and by distinctive orientation
maxima for mesoscopic fracture planes near the sample
location. By contrast, the third plane of Dezayes et al.
(2000) (labelled ‘e’ in Fig. 6) is not witnessed
mesoscopically.
Orientations for sample III were fitted to two planes by the
original workers, whereas FitPitch slightly favours three
planes. Two of these planes roughly match the two planes of
Dezayes et al. (2000). The additional third plane (subvertical
with ENE–WSW strike) closely matches a prominent
orientationmaximumformesoscopic fractures near the sample
location (fig.10c ofDezayesetal.,2000),whichsuggests itwas
correctly identified. Finally for sample IV, Dezayes et al.
(2000) deduced three best-fit planes, whereas a two-plane
solution is favoured byFitPitch.Again, bothFitPitch planesare
matched by two planes of Dezayes et al. (2000) and by
corresponding orientation maxima for mesoscopic fractures
(their fig. 10d). However, the third plane of the original
workers (labelled ‘k’ in Fig. 6) is not represented in the
mesoscopic fracture data.
6. Discussion
A best-fit solution can always be calculated for any set of
data but is not necessarily a meaningful result. If the degree
of preferred orientation is very low in a sample or the
number of data very limited, then FitPitch may generate
meaningless or false solutions. Consequently, solutions
must be regarded as statistical approximations to reality,
which need to be contrasted with qualitative microstructural
observations, and rose diagrams showing the raw data. If a
solution appears reasonable, then the significance of best-fit
planes must still be interpreted. In the case of inclusion trail
data, for example, the number of best-fit planes does not
necessarily match the number of foliations included by
porphyroblasts. Two best-fit planes may correspond to a
single foliation with a bimodal orientation in porphyro-
blasts, or a single best-fit plane may represent multiple
foliation generations with similar orientation.
Concerning the microfracture data of Dezayes et al.
(2000), some best-fit planes identified via FitPitch were not
recognised by these workers and vice versa, but a majority
of planes showed good correspondence. It is remarkable that
the additional plane identified by FitPitch (sample III) is
well matched by mesoscopic fracture orientations, whereas
the contrary is observed for the two extra planes of Dezayes
et al. (2000). This does not necessarily imply that the
additional planes of Dezayes et al. (2000) are false, but it
does perhaps provide impetus for further verification. In any
D. Aerden / Journal of Structural Geology 25 (2003) 923–934 931
case, it has been shown that correlating the multimodal
orientation maxima between different sections can be
ambiguous and in that respect, numerical fitting has the
advantage of yielding quantifiable and reproducible results
based on every single datum rather than on selected modal
maxima.
Concerning porphyroblast analysis, the method has
the advantage of being relatively simple and objective
only requiring the recognition of three fundamental
types of inclusion trail geometries (straight, micro-
folded, or truncational) without a need to interpret or
correlate these. Consequently, samples with relatively
poor-quality inclusion trails can still yield useful
information. As one is viewing only one or a few
porphyroblasts at a time during collection of data,
preferred orientation in a thin-section is generally not
perceived until data have been converted to true pitch
or strike and have been plotted. Even more difficult is
anticipating how 2-D orientations measured from
different sections will eventually combine in 3-D,
which practically excludes biased collection of data.
Porphyroblastic samples that mainly contain very
smoothly curving inclusion trails (lacking straight line
segments) are not suitable for analysis with FitPitch, but
are ideal for the conventional FIA method (see earlier).
Conversely, the latter method is not useful for samples
that mainly contain straight or inconsistently curving
inclusion trails while lacking core-rim curvature rever-
sals. Thus, both methods complement each other.
Specific advantages of FitPitch are the possibility to
quantify orientational variation of foliations and FIA in
a porphyroblast group, and fact that probably fewer
thin-sections are required to determine FIA with a
comparable resolution. The advantages of the conven-
tional FIA method are its high accuracy (provided a
large number of sections are available), and the direct
establishment of age relationships between multiple FIA
in single samples.
A final point worth mentioning is the non-cylindrical
nature of some complex porphyroblast microstructures (e.g.
Schoneveld, 1979; Hayward, 1992; Johnson, 1993), which
implies that pitch angles of such microstructures will
depend on the precise location of the intersecting thin-
section plane. However, provided a large enough number of
measurements can be made from a thin-section, such
variation can be expected to statistically cancel out. In
other words, different thin-sections with the same orien-
tation will normally yield similar data sets.
7. Conclusions
The FitPitch computer program is useful for deter-
mining the spatial preferred orientation of planar
microstructures whose intersection-lines can be
measured on different thin-section planes. Examples
have been shown of relict foliations in porphyroblasts
observed as inclusion trails in thin-section, and micro-
fractures observed as fluid inclusion trails. The program
calculates one, two or three best-fit planes by minimis-
ing the deviation between measured (microstructural)
intersection-lines and hypothetical intersection-lines of a
large number of model-planes or model-plane combi-
nations. The degree of fit is quantified by comparing the
deviation of real data with the deviation of hypothetical
uniform data from the best model intersection-lines.
Advantages over qualitative (i.e. visual) fitting of data
using a stereonet are that subjective correlation of
multimodal orientation maxima between different sec-
tions is eliminated, and that solutions are based on
every single datum rather than on selected modal
maxima. The method complements current techniques
for determining FIA orientations for groups of porphyr-
oblasts by allowing calculation of best-fit FIA from a
larger range of inclusion-trail types.
Acknowledgements
Jose-Ramon Martınez Catalan is thanked for discus-
sions that instigated this study. Scott Johnson, Kyuichi
Kanagawa and Jurgen Kraus provided very helpful
referee reports. With the insights of Richard Lisle they
allowed substantial improvement of the original manu-
script and widened the scope. Chrystel Dezayes and co-
workers are cordially thanked for permitting access to
their data and enabling me to test an additional
application (microfractures). Thanks to Neil Manckte-
low for use of “Stereoplot” and Javier Sanchez San
Roman for help with programming. This study was
funded by research grants from the Spanish “Direccion
General de Investigacion Cientıfica y Tecnica” coordi-
nated by Jose-Ramon Martınez Catalan and Francisco
Gonzalez Lodeiro.
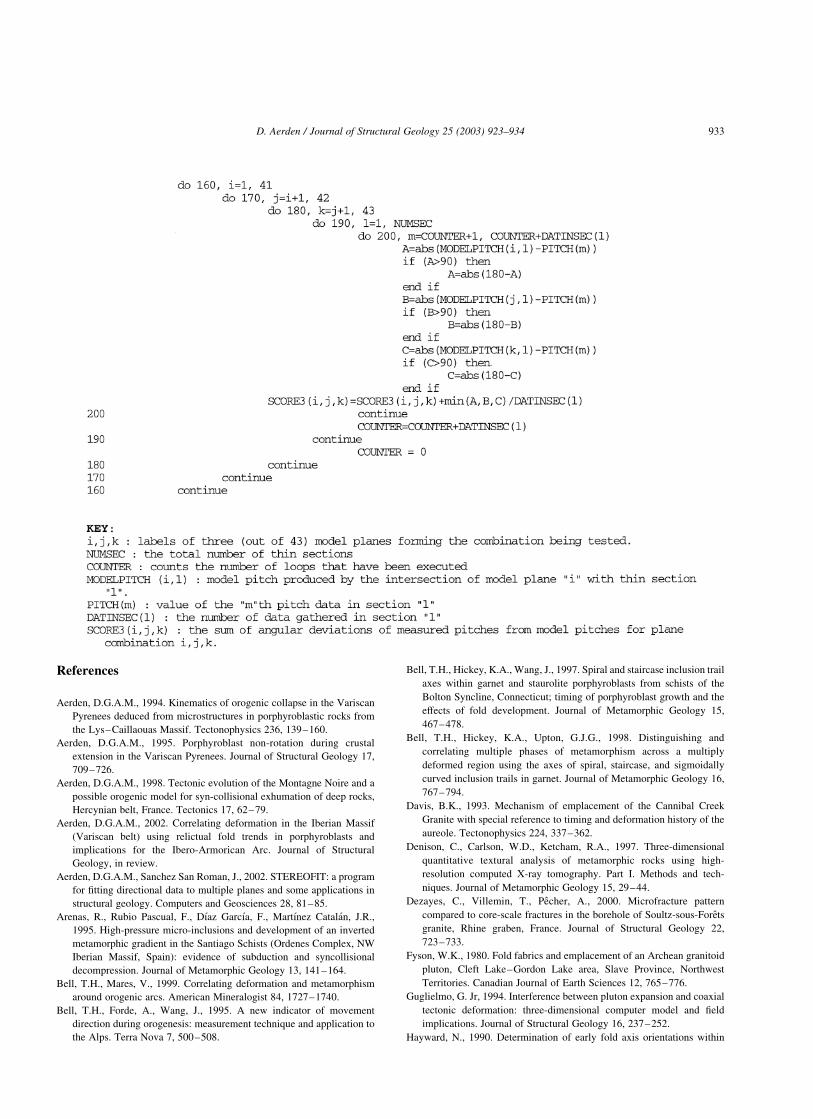
Appendix A
There is an algorithm that calculates, for every
combination of three planes that can be made with the
initial 43 model-planes of STEP-1 (Fig. 1a), the sum of
deviations between measured (microstructural) intersection-
lines and the nearest of three theoretical intersection-lines
on the corresponding section. These values (total deviation)
are stored in a three-dimensional matrix called SCOR-
E3(i,j,k), where i, j and k identify a particular plane
combination. The lowest value in this matrix is localised
and the corresponding plane combination identified as the
preliminary best-fit solution.
D. Aerden / Journal of Structural Geology 25 (2003) 923–934932
References
Aerden, D.G.A.M., 1994. Kinematics of orogenic collapse in the Variscan
Pyrenees deduced from microstructures in porphyroblastic rocks from
the Lys–Caillaouas Massif. Tectonophysics 236, 139–160.
Aerden, D.G.A.M., 1995. Porphyroblast non-rotation during crustal
extension in the Variscan Pyrenees. Journal of Structural Geology 17,
709–726.
Aerden, D.G.A.M., 1998. Tectonic evolution of the Montagne Noire and a
possible orogenic model for syn-collisional exhumation of deep rocks,
Hercynian belt, France. Tectonics 17, 62–79.
Aerden, D.G.A.M., 2002. Correlating deformation in the Iberian Massif
(Variscan belt) using relictual fold trends in porphyroblasts and
implications for the Ibero-Armorican Arc. Journal of Structural
Geology, in review.
Aerden, D.G.A.M., Sanchez San Roman, J., 2002. STEREOFIT: a program
for fitting directional data to multiple planes and some applications in
structural geology. Computers and Geosciences 28, 81–85.
Arenas, R., Rubio Pascual, F., Dıaz Garcıa, F., Martınez Catalan, J.R.,
1995. High-pressure micro-inclusions and development of an inverted
metamorphic gradient in the Santiago Schists (Ordenes Complex, NW
Iberian Massif, Spain): evidence of subduction and syncollisional
decompression. Journal of Metamorphic Geology 13, 141–164.
Bell, T.H., Mares, V., 1999. Correlating deformation and metamorphism
around orogenic arcs. American Mineralogist 84, 1727–1740.
Bell, T.H., Forde, A., Wang, J., 1995. A new indicator of movement
direction during orogenesis: measurement technique and application to
the Alps. Terra Nova 7, 500–508.
Bell, T.H., Hickey, K.A., Wang, J., 1997. Spiral and staircase inclusion trail
axes within garnet and staurolite porphyroblasts from schists of the
Bolton Syncline, Connecticut; timing of porphyroblast growth and the
effects of fold development. Journal of Metamorphic Geology 15,
467–478.
Bell, T.H., Hickey, K.A., Upton, G.J.G., 1998. Distinguishing and
correlating multiple phases of metamorphism across a multiply
deformed region using the axes of spiral, staircase, and sigmoidally
curved inclusion trails in garnet. Journal of Metamorphic Geology 16,
767–794.
Davis, B.K., 1993. Mechanism of emplacement of the Cannibal Creek
Granite with special reference to timing and deformation history of the
aureole. Tectonophysics 224, 337–362.
Denison, C., Carlson, W.D., Ketcham, R.A., 1997. Three-dimensional
quantitative textural analysis of metamorphic rocks using high-
resolution computed X-ray tomography. Part I. Methods and tech-
niques. Journal of Metamorphic Geology 15, 29–44.
Dezayes, C., Villemin, T., Pecher, A., 2000. Microfracture pattern
compared to core-scale fractures in the borehole of Soultz-sous-Forets
granite, Rhine graben, France. Journal of Structural Geology 22,
723–733.
Fyson, W.K., 1980. Fold fabrics and emplacement of an Archean granitoid
pluton, Cleft Lake–Gordon Lake area, Slave Province, Northwest
Territories. Canadian Journal of Earth Sciences 12, 765–776.
Guglielmo, G. Jr, 1994. Interference between pluton expansion and coaxial
tectonic deformation: three-dimensional computer model and field
implications. Journal of Structural Geology 16, 237–252.
Hayward, N., 1990. Determination of early fold axis orientations within
D. Aerden / Journal of Structural Geology 25 (2003) 923–934 933

multiply deformed rocks using porphyroblasts. Tectonophysics 179,
353–369.
Hayward, N., 1992. Microstructural analysis of the classical spiral garnet
porphyroblasts of south-east Vermont: evidence for non-rotation.
Journal of Metamorphic Geology 10, 567–587.
Hickey, K.A., Bell, T.H., 1999. Behaviour of rigid objects during
deformation and metamorphism: a test using schists from the Bolton
syncline, Connecticut, USA. Journal of Metamorphic Geology 17,
211–228.
Huang, W., 1993. Multiphase deformation and displacement within a
basement complex on a continental margin: the Wudang Complex in
the Qinling Orogen, China. Tectonophysics 224, 305–326.
Ilg, B.R., Karlstrom, K.E., 2000. Porphyroblast inclusion trail geometries in
the Grand Canyon: evidence for non-rotation and rotation? Journal of
Structural Geology 22, 231–244.
Johnson, S.E., 1990. Deformation history of the Otago schists, New
Zealand, from progressively developed porphyroblast-matrix micro-
structures: uplift-collapse orogenesis and its implications. Journal of
Structural Geology 12, 727–746.
Johnson, S.E., 1993. Unravelling the spirals; a serial thin-section study and
three-dimensional computer-aided reconstruction of spiral-shaped
inclusion trails in garnet porphyroblasts. Journal of Metamorphic
Geology 11, 621–634.
Johnson, S.E., Moore, R.R., 1996. De-bugging the “millipede” porphyr-
oblast microstructure; a serial thin-section study and 3-D computer
animation. Journal of Metamorphic Geology 14, 3–14.
Jung, W.S., Ree, J.H., Park, Y., 1999. Non-rotation of garnet porphyroblasts
and 3-D inclusion trail data—an example from the Imjingang Belt,
South Korea. Tectonophysics 307, 381–395.
Mares, V.M., 1998. The structural development of the Soldiers Cap Group
within a portion of the eastern foldbelt of the Mount Isa inlier: a
succession of near-horizontal and near-vertical deformation events and
large-scale shearing. Australian Journal of Earth Sciences 45, 373–388.
Martınez Catalan, J.R., Arenas, R., Dıaz Garcıa, F., Rubio Pascual, F.J.,
Abati, J., Marquınez, J., 1996. Variscan exhumation of a subducted
Palaeozoic continental margin: the basal units of the Ordenes Complex,
Galicia, NW Spain. Tectonics 15, 106–121.
Paterson, S.R., Vernon, R.H., 2001. Inclusion trail patterns in porphyro-
blasts from the Foothills Terrane, California: a record of orogenesis or
local strain heterogeneity? Journal of Metamorphic Geology 19,
351–372.
Ramsay, J.G., 1967. Folding and Fracturing of Rocks, McGraw-Hill, New
York, 568pp.
Ries, A.C., Shackleton, R.M., 1971. Catazonal complexes of North-West
Spain and North Portugal, remnants of a Hercynian Thrust Plate. Nature
234 (47), 65–79.
Schoneveld, C., 1979. The geometry and significance of inclusion patterns
in syntectonic porphyroblasts. Ph.D. Thesis, Institute of Earth Sciences,
Utrecht, The Netherlands. 125pp.
Stallard, A., Hickey, K., 2001. Fold mechanisms in the Canton Schist:
constraints on the contribution of flexural flow. Journal of Structural
Geology 23, 1865–1881.
D. Aerden / Journal of Structural Geology 25 (2003) 923–934934