Embed Size (px)
Citation preview
Kinematics Labp. 1/6
revised 9/23/2003by DSA
PRELAB: KINEMATICS LAB
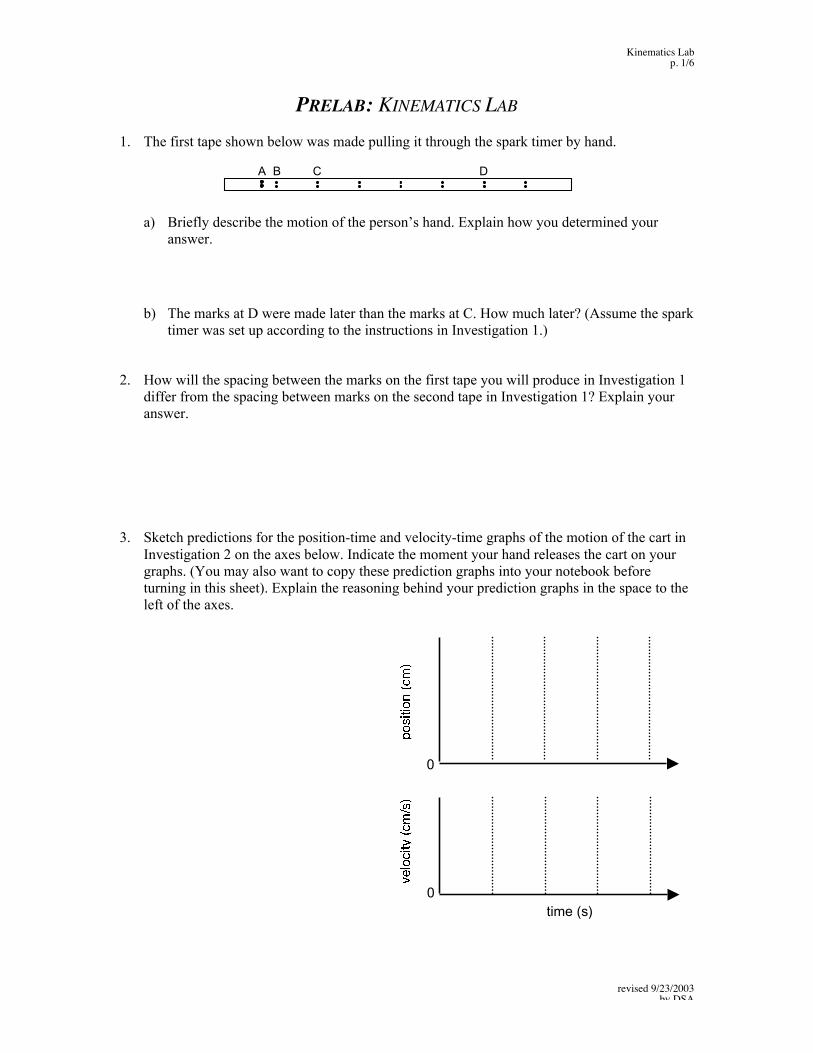
1. The first tape shown below was made pulling it through the spark timer by hand.
a) Briefly describe the motion of the person’s hand. Explain how you determined youranswer.
b) The marks at D were made later than the marks at C. How much later? (Assume the sparktimer was set up according to the instructions in Investigation 1.)
2. How will the spacing between the marks on the first tape you will produce in Investigation 1differ from the spacing between marks on the second tape in Investigation 1? Explain youranswer.
3. Sketch predictions for the position-time and velocity-time graphs of the motion of the cart inInvestigation 2 on the axes below. Indicate the moment your hand releases the cart on yourgraphs. (You may also want to copy these prediction graphs into your notebook beforeturning in this sheet). Explain the reasoning behind your prediction graphs in the space to theleft of the axes.
A B C D
time (s)
0
0

Kinematics Labp. 2/6
revised 9/23/2003by DSA
KINEMATICS LABTopic: Motion in one dimension
Overview:
You will be using a spark timer and long strips of spark paper (also called spark tape)to study the motion of various objects. The paper gets pulled past the two metal tipsin the spark timer. When the spark timer is on, two spark tips zap the paper every1/10 of a second (or every 1/60 of a second, depending on the setting you choose).Each time the tips zap the paper, a pair of black dots is produced.
The diagram above shows the spark timer and tape in action. When point A on thetape was underneath the spark tips, the timer was turned on and the person beganpulling the tape to the lett. As the hand moves to the left, so does the tape. One sparkinterval later (either 1/10 of a second or 1/60 of a second), point B on the tape wasunder the spark tips. Another spark interval later, point C was under the tips and soon. In this way, the spark tape makes a record of the motion of whatever the tape isattached to.
The dots provide a record of the position of the left end of the tape relative to thespark tips. For instance, when the dots at point C were made, the left end of the tapewas a distance Cx from the spark tips. Thus, the distance from the end of the tape is a
measure of the position of the left end of the tape relative to the spark tips. For thislab, “position” refers to the position of the left end of the tape relative to the sparktips.
You might have noticed that mark A is darker than the other marks in the diagram.This happens when the tape does not start moving immediately when the timer wasturned on. Several sparks were made at point A before the tape began moving.
Note: This lab involves repeated calculations and graphing. A spreadsheet programlike Excel can drastically reduce the amount of work required to analyze the data.
Writing it up: Throughout this handout, you will be asked to answer questions,sketch graphs and do calculations. Write these things in your lab notebook as you gothrough the experiment. Label each answer/graph/calculation so that you (or your labTA) can find things quickly. If you have any computer printouts (such as graphs),remember to affix them to your lab notebook. After lab, write a short (<300 words)conclusion of the experiment that summarizes what you did and the major findings of theexperiment.
C DBA E
SparkTimer
F
xC

Kinematics Labp. 3/6
revised 9/23/2003by DSA
Investigation 1: Constant speed
In this investigation of the lab, you will examine what happens when you pull a tapethrough the timer at constant speed. You will make and interpret a position-time graph ofthe motion of your hand.
1. Set the spark timer to 10 Hz (10 sparks/s).
2. Pull a tape through the timer slowly and steadily. Try to keep the speed of your handconstant. Label the tape.
Q1-1: Did your hand travel at constant velocity the entire time? How can you tellfrom the marks on the tape if your hand sped up? slowed down?
Q1-2: Use your tape to estimate the average speed of your hand (during the timeinterval when the speed of your hand was roughly constant). Record yourmeasurements and calculations in your notes.
3. Pull a second tape through timer steadily, but more quickly than before. Again, try tokeep the speed of your hand constant. Label the tape.
Q1-3: How did the marks on this tape differ from those on the previous one? Is thiswhat you predicted in the prelab? If not, explain the discrepancy.
Q1-4: Estimate the average speed of your hand during the time the hand was movingat constant velocity. Record your measurements and calculations in yournotes.
4. For each of the two tapes you made, make a table of position versus time for the firsttwenty points or so. Graph both sets of data on the same set of axes. [Note: Use aspreadsheet, like Microsoft Excel, to save time.]
Q1-5: Did your hand travel at constant velocity the entire time for both data sets?How can you tell from the graph if your hand sped up? slowed down?
Q1-6: Compare the two traces on your graph. Which one corresponds to the fastpull? How can you tell from the graph?
Q1-6: Find the equation btay += that best fits the linear portion of each set ofposition-time data. What is the meaning of a? What are the units of a? Howdo you know? What is the meaning of b? What are its units? How do youknow?
Kinematics Labp. 4/6
revised 9/23/2003by DSA
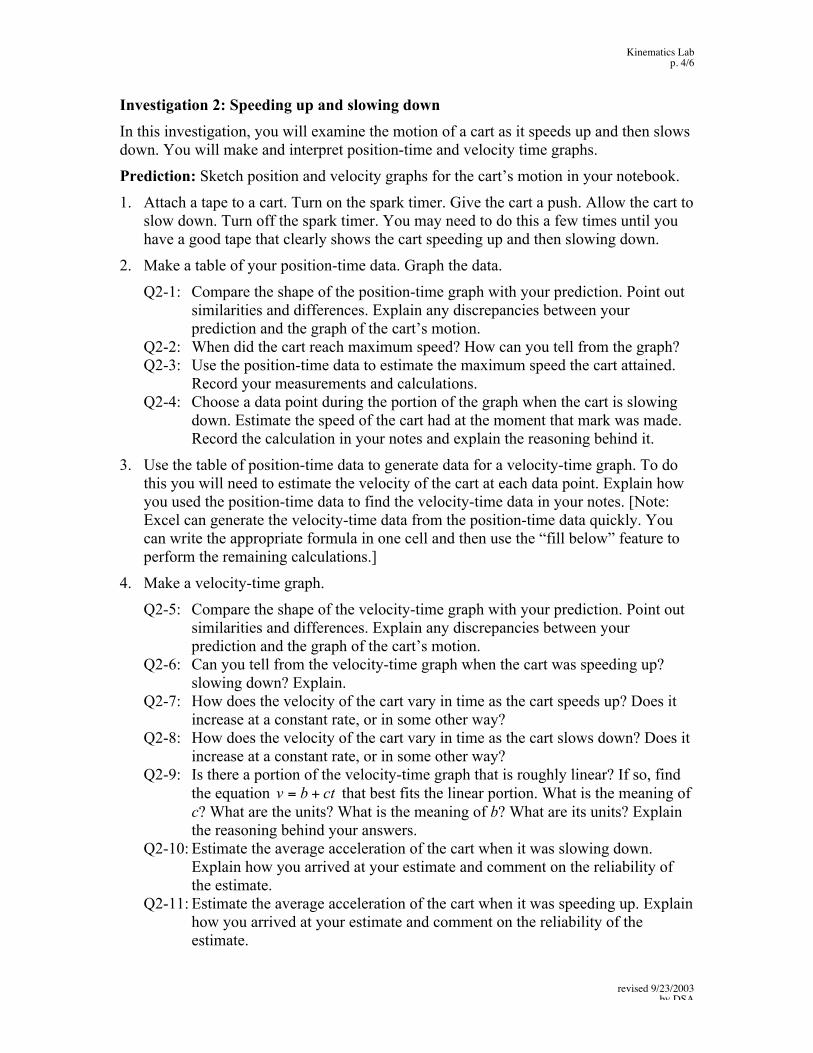
Investigation 2: Speeding up and slowing down
In this investigation, you will examine the motion of a cart as it speeds up and then slowsdown. You will make and interpret position-time and velocity time graphs.
Prediction: Sketch position and velocity graphs for the cart’s motion in your notebook.
1. Attach a tape to a cart. Turn on the spark timer. Give the cart a push. Allow the cart toslow down. Turn off the spark timer. You may need to do this a few times until youhave a good tape that clearly shows the cart speeding up and then slowing down.
2. Make a table of your position-time data. Graph the data.
Q2-1: Compare the shape of the position-time graph with your prediction. Point outsimilarities and differences. Explain any discrepancies between yourprediction and the graph of the cart’s motion.
Q2-2: When did the cart reach maximum speed? How can you tell from the graph?Q2-3: Use the position-time data to estimate the maximum speed the cart attained.
Record your measurements and calculations.Q2-4: Choose a data point during the portion of the graph when the cart is slowing
down. Estimate the speed of the cart had at the moment that mark was made.Record the calculation in your notes and explain the reasoning behind it.
3. Use the table of position-time data to generate data for a velocity-time graph. To dothis you will need to estimate the velocity of the cart at each data point. Explain howyou used the position-time data to find the velocity-time data in your notes. [Note:Excel can generate the velocity-time data from the position-time data quickly. Youcan write the appropriate formula in one cell and then use the “fill below” feature toperform the remaining calculations.]
4. Make a velocity-time graph.
Q2-5: Compare the shape of the velocity-time graph with your prediction. Point outsimilarities and differences. Explain any discrepancies between yourprediction and the graph of the cart’s motion.
Q2-6: Can you tell from the velocity-time graph when the cart was speeding up?slowing down? Explain.
Q2-7: How does the velocity of the cart vary in time as the cart speeds up? Does itincrease at a constant rate, or in some other way?
Q2-8: How does the velocity of the cart vary in time as the cart slows down? Does itincrease at a constant rate, or in some other way?
Q2-9: Is there a portion of the velocity-time graph that is roughly linear? If so, findthe equation ctbv += that best fits the linear portion. What is the meaning ofc? What are the units? What is the meaning of b? What are its units? Explainthe reasoning behind your answers.
Q2-10: Estimate the average acceleration of the cart when it was slowing down.Explain how you arrived at your estimate and comment on the reliability ofthe estimate.
Q2-11: Estimate the average acceleration of the cart when it was speeding up. Explainhow you arrived at your estimate and comment on the reliability of theestimate.
Kinematics Labp. 5/6
revised 9/23/2003by DSA
Analysis challenge: If the acceleration is constant during a part of the motion, the valueof acceleration can be found directly from the position-time graph by using Excel’sfitting tools and interpreting the output. What type of equation best would fit theposition-time graph if the acceleration is constant: btay += , or 2ctbtay ++= , orsomething else? Explain how you know which fit should work. Explain how youdetermine the acceleration from the equation. Compare the value you get to the valueyou found in step 4.
Investigation 3: Falling objects (time permitting)
In this optional investigation, you will examine the motion of falling objects withdifferent masses.
1. Use the available clamps and rods to mount the spark timer to measure theacceleration of a falling object. Place a pad below the timer, so that the falling massdoesn’t damage the floor. Set the spark timer to 60 Hz.
2. Make tapes for several different objects, ranging in mass as much as practically (andsafely) possible.
3. Plot the position-time data for all your data runs on a single graph.
4. Use the position-time data to calculate velocity-time. Plot the results on a singlegraph.
Q3-1: Does each mass speed up at a constant rate? Explain how you can tell.Q3-2: Does every mass speed up at the same rate? Is this what you expected?
Explain.
Kinematics Labp. 6/6
revised 9/23/2003by DSA
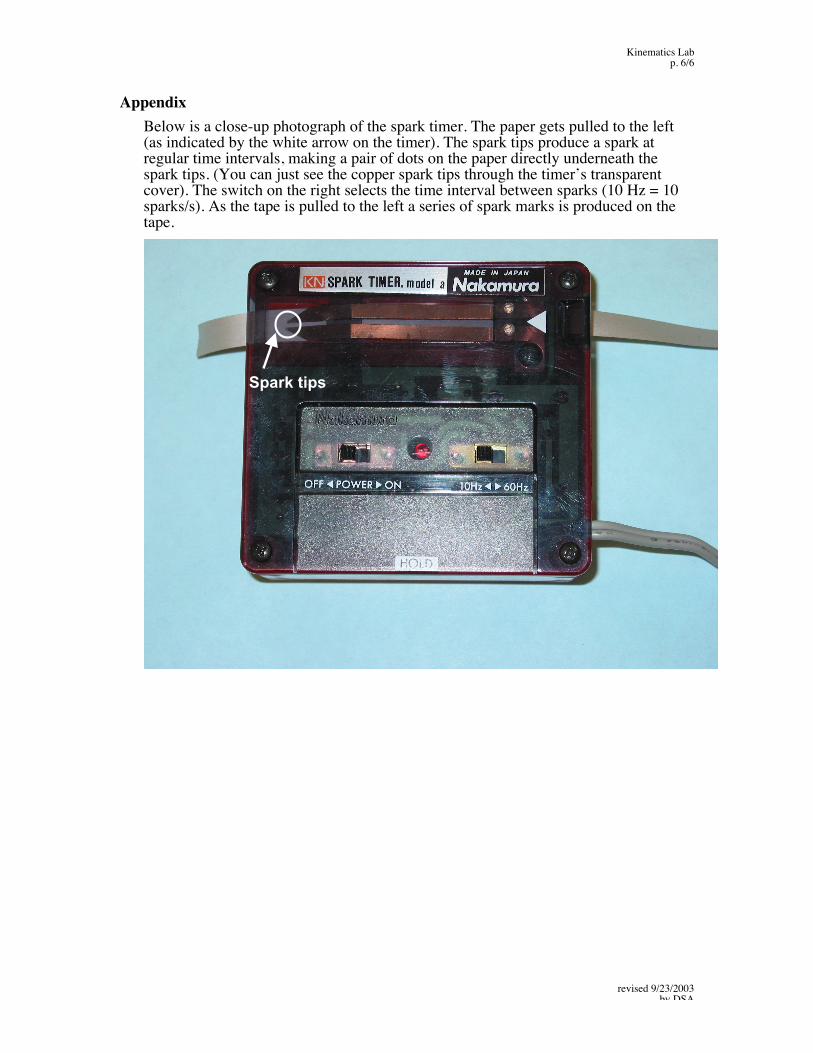
AppendixBelow is a close-up photograph of the spark timer. The paper gets pulled to the left(as indicated by the white arrow on the timer). The spark tips produce a spark atregular time intervals, making a pair of dots on the paper directly underneath thespark tips. (You can just see the copper spark tips through the timer’s transparentcover). The switch on the right selects the time interval between sparks (10 Hz = 10sparks/s). As the tape is pulled to the left a series of spark marks is produced on thetape.
Spark tips