Embed Size (px)
Citation preview

1
Draft March 2007
Preliminary Analysis of the Disease Burden of Islamic Populations in Low and Middle Income Countries
A.K. Nandakumar, PhD Brandeis University
Marwa Farag, MA, MS
Brandeis University
Joanne Beswick, MA Brandeis University
This analysis was supported by a Grant from the Bill and Melinda Gates Foundation.

2
Executive Summary Preliminary Analysis of the Disease Burden of Islamic Populations1
in Low and Middle Income Countries
Objective The analysis in this paper represents the first step of a multi-phase effort to understand the disease burden, and to develop strategies for tackling the health problems of Islamic populations. In this starting phase of the analysis, an overview of the burden of disease for selected Islamic populations is presented. Criteria Used for Country Selection Countries included in the analysis comprise two categories: Muslim countries and countries which have a sizeable Muslim population. Muslim countries are defined as countries in which Muslims comprise 50 percent or more of the population. Countries which have a sizeable Muslim population2 are countries which have 2 Million Muslims or more. Selected countries must be classified as Low or Middle Income countries3. Countries selected at this stage of the analysis are from the South & East Asia, Middle East & North Africa and Sub-Saharan Africa regions4. Measure of Burden of Disease Disease burden in the analysis is measured using DALYs (Disability Adjusted Life Years) DALYs for a disease or health condition are calculated as the sum of the years of life lost due to premature mortality (YLL) in the population and the years lost due to disability (YLD) for incident cases of the health condition. The analysis adjusts for the size of Muslim population within a country. For example, if country X has a population of 1,000,000 and a disease burden of 1000 DALYs and the Islamic population in the country represent only 50% of the country’s population, we consider DALYs for this country to be equal to 500. Key Findings: Burden of Disease In the three regions under study: South and East Asia, Middle East and North Africa, and Sub-Saharan Africa, the contribution to the total burden of disease for all the Islamic population under study is not proportionate to the population size representation from each region. While Sub-Saharan Africa represents 20% of the Islamic Population under study, it represents 36% of the disease burden. On the other hand, the Middle East and North Africa represent 23% of Islamic population under study and 15% of the disease burden. South and East Asia is the largest contributor, both in terms of population (58%) and disease burden (48%).
1 The term Islamic populations and Muslim populations are used interchangeably in this document 2 We have decided to use a population size of 2 million Muslims because this was the largest number of Muslims in a country where Muslims constituted 50% of the population 3 We have used the World Bank classification systems that uses GNI 4 In consultation with the Bill and Melinda Gates Foundation it was decided to exclude China from this round of the analysis

3
The analysis also examines the disease burden by type of disease. Overall, communicable, maternal, perinatal and nutritional conditions account for 53% of the disease burden, while non-communicable diseases account for 36% and injuries account for 11%. Of all communicable maternal, perinatal and nutritional disease burden, infectious and parasitic diseases account for the largest part of the burden at 57%, and the remainder is divided between respiratory infections (16%), perinatal conditions (15%), maternal conditions (6%) and nutritional deficiencies (6%). The non-communicable disease burden is comprised largely of neuropsychiatric conditions and cardiovascular diseases. For some of these diseases non-clinical interventions such as lifestyle changes and prevention initiatives can be effective. National Health Accounts studies of low and middle-income countries show that they spend a disproportionate share of their health expenditures on curative services with very little going to fostering life style changes and prevention. Investing in health education, fostering healthy lifestyles, and developing and implementing preventive interventions that target avoidable non-communicable disease burden would be cost-effective. Unintentional injuries and road traffic accidents are the two leading causes of burden of disease from injury. Violence, fires, falls, self-inflicted injuries and drowning each account for a greater proportion of the burden of disease than war or poisoning. The impact of many of these conditions can be mitigated through public safety interventions (e.g., seat belt laws) and the development and enforcement of policies that reduce violence and abuse5. Several diseases contributing to the disease burden can be considered “neglected diseases” in the policy arena, for example, low birth weight, unipolar depressive disorders and Ischemic heart disease. Perhaps one of the strongest examples is respiratory infections, which occur at approximately twice the rate of incidence as HIV/AIDS but have received comparatively little attention. In summary, the disease categories that comprise 75% of the total disease burden are fairly well distributed across disease-type. Key Findings: Country’s Income, Spending on Health and Burden of Disease Sixty-one percent of the Islamic population under study comes from low-income countries and they contribute 74% of the burden of disease. Thirty-nine percent of the Islamic population under study comes from middle-income countries and they contribute only 26% of the burden of disease. Low-income Islamic populations account for 85% of the communicable, maternal, perinatal and nutritional disease burden and 60% of the non-communicable disease burden. In low-income populations, 61% of the burden of disease is due to communicable, maternal, perinatal and nutritional conditions; non-communicable diseases account for 29% and Injuries account for 10%. The prevalence of communicable diseases among low-income populations is higher than the overall prevalence in Islamic populations in general. As for Middle-income populations, 30% of burden of disease is due to 5 Clearly more analysis is needed

4
communicable, maternal, perinatal and nutritional conditions, non-communicable diseases account for 56% and injuries for 14%. The pattern of disease burden differs considerably based on country’s income level and therefore it seems reasonable that different policies targeting different diseases are required for these two groups. The burden of disease in Islamic countries tends to decrease as income increases and this trend is particularly obvious for communicable diseases. Once a country crosses the $2,000 GNI per Capita PPP limit, the burden of disease does not continue to decrease with further increases in income. This raises the question of whether the largest impact can be obtained by focusing on low-income countries. Additionally, if this pattern indicates the achievement of a lower steady state in the rate of burden of disease in middle-income countries, then it is important to understand the underlying reasons for this. If some of the reasons are changes in access to health care, improved nutrition, greater awareness of healthy, life-promoting practices, then focusing on these interventions in low income countries might help them transition to the steady state6 faster. The burden of disease in Islamic countries decreases with increased spending on health. The rate of DALYs per 100,000 falls as total health expenditures per capita increase. This pattern holds for overall spending as well as government spending. However, the pattern is much less clear for the public share of health expenditures. Several confounders may be present which would need to be controlled to better understand this relationship. Additionally, there seems to be a large variance at the lower end of health spending which means that there are countries spending similarly low amounts on health and achieving very different levels of disease burden. This observation points to the need to conduct further research into the efficiency of utilizing health expenditures at lower levels of spending. Key Issues To Consider While Designing The Initiative Include: Several questions have been identified for further inquiry. We pose the question: should the focus be exclusively on Islamic populations or the entire population living in countries with a sizeable Islamic population? Focusing on the latter might mean significantly higher outlays in countries such as India where Muslims comprise less than 17% of the population; and yet only Indonesia has a higher number of Muslims. One solution is to use geo-spatial mapping to identify areas of high Muslim population concentrations and target such areas. Another question is whether the focus should be on diseases that together comprise the greatest overall burden of disease or whether we should concentrate on diseases that are currently under-funded and/or affect the poor disproportionately. Many diseases and conditions are amenable to improvements in lifestyle, prevention, public safety, and policy interventions and this is an area that needs attention. It is also important to examine what weight should be given to underlying health systems issues (we are yet to study this in great detail) such as public allocations
6 We use the term “steady state” in the absence of a better term. One hypothesis we would like to test is whether the pattern of the rate of disease burden changes at higher incomes. In other words it is feasible that as countries transition to becoming high middle-income countries or high income countries there will be changes in the rate of disease burden for certain disease categories

5
for health, infrastructure, manpower, enabling environment, governance etc. in choosing countries and interventions. Finally, more general concerns are raised as to the division of responsibility between Brandeis and the Gates Foundation for the design of country-level interventions and financing and how the impact of the initiative should be evaluated.

6
Preliminary Analysis of the Burden of Islamic Population7 in Low and Middle Income Countries
Introduction The purpose of this paper is to present an overview of the burden of disease for selected Islamic populations. The analysis is restricted to countries which are classified as Low or Middle Income in Africa and South and East Asia. Therefore, it does not represent an analysis of the burden of disease for all Islamic populations in the world. The paper starts by specifying country selection criteria and the country list with details on population distribution, region, per capital income (PPP) and income ranking. The second section is a general overview of the burden of disease for Islamic populations. The third and fourth and fifth sections provide more detailed analysis on the burden of disease for Islamic populations in general, low-income Islamic populations and middle-income populations respectively. The sixth section investigates the relationship between income and burden of disease for Islamic populations and the seventh section examines the relationship between expenditures on health and burden of disease in Islamic countries. The final section uses the analysis to identify some key issues that need to be considered as the initiative to address the burden of disease among Islamic populations is developed. The analysis presented in this paper represents the first step of a multi-phase effort which includes refining these analyses once specific countries and diseases have been prioritized, geo-spatial mapping, analyzing disease burden within the context of health systems characteristics and the development of the a joint strategy to target diseases afflicting Islamic populations. 1. Criteria Used for selecting countries The following criteria are used to select countries on which the analysis was conducted:
- Muslim countries -defined as countries which have Muslims making up half or more of their population
- Countries which have a sizeable Muslim population8 where sizeable is defined as
2 Million or more
- In addition to being Muslim countries or having a large enough Muslim population, selected countries must be classified as Low or Middle Income countries9.
- Countries selected at this stage are from the Southeast Asia and Africa regions10
7 The term Islamic populations and Muslim populations are used interchangeably in this document 8 We have decided to use a population size of 2 million Muslims because this was the largest number of Muslims in a country where Muslims constituted 50% of the population 9 We have used the World Bank classification systems that uses GNI

7
The analyses of the Burden of Disease were conducted for “Islamic Populations”. For this round of the analysis we have made the simplifying assumption that the rate of burden of disease is the same irrespective of religion. This was because not enough research has been done on classifying disease burden by whether the individuals are Muslim or non-Muslim. Under this approach we used the percentage of Muslim Population in a country to adjust the overall country burden of disease. For example, if the DALYs for a country = 100,000 and the country has 90% Muslim Population, we considered that the DALYs represented by Muslim populations = 100,000* 90% = 90,000 for this country. Table 1 provides the distribution of Islamic Populations, the region, Per capita national income (PPP), and the income ranking of these countries. Table 1a provides a list of countries where Muslims do not make up at least half the population but yet are a significant minority. India emerges as a country where Muslims constitute less than 17% of the total population in terms of numbers and is second only to Indonesia. Countries such as India pose specific challenges on how to target Muslim populations and this is discussed in subsequent sections. Table 1: Distribution of Islamic Populations
Country % Muslim Muslim Population Total Population Region
GNI per capita Atlas Method 2005 World Bank Rank
Somalia 100% 8,591,629 8,591,629 Sub-Saharan Africa H Low-income
Afghanistan 100% 29,629,697 29,629,697 South Asia H Low-income
Maldives 99.90% 348,756 349,105 South Asia 2,390 Lower-middle-income
Iran 99% 67,337,681 68,017,860 Asia/ Middle East 2,770 Lower-middle-income
Algeria 99% 32,206,534 32,531,853 North Africa 2,730 Lower-middle-income
Mauritania 99.90% 3,083,772 3,086,859 Sub-Saharan Africa 560 Low-income
Yemen 99% 20,519,792 20,727,063 Asia/ Middle East 600 Low-income
Tunisia 99% 9,974,201 10,074,951 North Africa 2,890 Lower-middle-income
Comoros 99% 664,534 671,246 Sub-Saharan Africa 640 Low-income
Djibouti 99% 471,935 476,702 Sub-Saharan Africa 1,020 Lower-middle-income
Morocco 98.70% 32,300,410 32,725,846 North Africa 1,730 Lower-middle-income
Pakistan 98% 162,487,489 165,803,560 South Asia 690 Low-income
Libya 97% 5,592,596 5,765,563 North Africa 5,530 Upper-middle-income
Iraq 97% 25,292,658 26,074,905 Asia/ Middle East K Lower-middle-income
Jordan 95% 5,471,745 5,759,732 Asia/ Middle East 2,500 Lower-middle-income
Senegal 94% 10,459,222 11,126,832 Sub-Saharan Africa 710 Low-income
Egypt 91% 70,530,237 77,505,755 North Africa/Middle East 1,250 Lower-middle-income
10 In consultation with the Bill and Melinda Gates Foundation it was decided to exclude China from this round of the analysis

8
Mali 90% 11,062,376 12,291,529 Sub-Saharan Africa 380 Low-income
Niger 90% 10,499,343 11,665,937 Sub-Saharan Africa 240 Low-income
Gambia 90% 1,433,930 1,593,256 Sub-Saharan Africa 290 Low-income
Indonesia 88.22% 213,469,356 241,973,879 East Asia and Pacific 1,280 Lower-middle-income
Bangladesh
88% 127,001,272 144,319,627 South Asia 470 Low-income
Syria 88% 16,234,901 18,448,751 Asia/ Middle East 1,380 Lower-middle-income
French Guinea 85% 8,047,686 9,467,866 Sub-Saharan Africa 370 Low-income
West Bank and Gaza 84% 3,159,999 3,761,904 Asia/ Middle East 1,120 Lower-middle-income
Lebanon 70% 2,678,212 3,826,017 Asia/ Middle East 6,180 Upper-middle-income
Sudan 65% 26,121,865 40,187,485 Sub-Saharan Africa 640 Low-income
Malaysia 60.40% 14,467,694 23,953,136 East Asia and Pacific 4,960 Upper-middle-income
Sierra Leone 60% 3,610,585 6,017,642 Sub-Saharan Africa 220 Low-income
Burkina Faso 55% 7,658,922 13,925,313 Sub-Saharan Africa 400 Low-income
Chad 54% 5,306,266 9,826,419 Sub-Saharan Africa 400 Low-income
Nigeria 50% 64,385,994 128,771,988 Sub-Saharan Africa 560 Low-income
Eritrea 50% 2,280,799 4,561,598 Sub-Saharan Africa 220 Low-income
Ethiopia 50% 37,533,500 75,067,000 Sub-Saharan Africa 160 Low-income
Table 1a: Other countries with sizeable Muslim Population
Ranked by number of Muslim Population
India 16.20% 174,862,240 1,079,396,543 South Asia 720 Low-income
Tanzania 35% 12,868,224 36,766,354 Sub-Saharan 340 Low-income
Côte d'Ivoire 38.60% 6,677,043 17,298,039 Sub-Saharan 840 Low-income
Congo (Kinshasa) 10% 6,008,500 60,085,000 Sub-Saharan 120 Low-income
Uganda 15% 4,090,422 27,269,480 Sub-Saharan 280 Low-income
Mozambique 20% 3,881,340 19,406,700 Sub-Saharan 310 Low-income
Ghana 16% 3,364,776 21,029,850 Sub-Saharan 450 Low-income
Cameroon 20% 3,276,001 16,380,005 Sub-Saharan 1,010 Lower-middle-income
Thailand 5% 3,272,218 65,444,360 East Asia and Pacific 2,750 Lower-middle-income
Malawi 20% 2,431,784 12,158,920 Sub-Saharan 160 Low-income
Kenya 7% 2,368,071 33,829,586 Sub-Saharan 530 Low-income
Tables 2 and 3 present information on the regional and income distribution of the Muslim Population under study. Table 2 indicates that 67% of the South and East Asia Islamic Populations are low income populations and the remaining 33% are middle income. The picture is different for the Middle East and North Africa region where 93% are middle income populations and the remaining 7% are low income. The Sub-Saharan region has mostly low income Islamic populations.

9
Table 2: Distribution of geographical region by income Geographical region by Income (Islamic Populations)
South and East Asia Middle East and North Africa
Sub-Saharan Africa
Middle Income 32.93% 92.98% 1.61%Low Income 67.07% 7.02% 98.39%Total 100.00% 100.00% 100.00% Table 3 shows that 47% of the middle income Islamic population comes from South and East Asia, 52% comes from the Middle East and North Africa and less than 1% comes from Sub-Saharan Africa. Sixtyfive percent of the low income Islamic population comes from South and East Asia, 3% from the Middle East and North Africa and the remaining 32% comes from Sub-Saharan Africa. Table 3: Distribution of income by geographical region
Income by geographical region (Islamic Populations)
South and East Asia
Middle East and North Africa
Sub-Saharan Africa Total
Middle Income 47.10% 52.12% 0.79% 100.00%Low Income 64.84% 2.66% 32.50% 100.00% 2. Overview of the distribution of the Burden of Disease- Islamic Populations This overview attempts to answer basic questions concerning the contribution of different geographical regions and income groups to the burden of disease of Islamic Populations. The burden of disease information is estimated using thousands of DALYs (Disability Adjusted Life Years) “The Disability Adjusted Life Year,” or DALY, is a health gap measure that extends the concept of potential years of life lost due to premature death (PYLL) to include equivalent years of ‘healthy’ life lost by virtue of being in states of poor health or disability (1). The DALY combines, in one measure, the time lived with disability and the time lost due to premature mortality. One DALY can be thought of as one lost year of ‘healthy’ life and the burden of disease as a measurement of the gap between current health status and an ideal situation where everyone lives into old age free of disease and disability. DALYs for a disease or health condition are calculated as the sum of the years of life lost due to premature mortality (YLL) in the population and the years lost due to disability (YLD) for incident cases of the health condition.” Table 4 indicates tha, while 23% of the Islamic population under study comes from the Middle East and North Africa region, it represents only 16% of the disease burden. On the other hand, Sub-Saharan Africa Muslim population constitutes 20% of the Islamic population and 36% of the disease burden. The largest part of the Islamic population under study comes from South and East Asia, which represent 58% of the population and 48% of the disease burden.

10
Table 5 presents more detail on diseases accounting for the burden of disease. While 61% of the Islamic Population comes from low-income countries, they contribute 74% of the disease burden. The remaining 39% are middle-income Muslim populations, and they contribute only 26% of the disease burden. Table 5 also shows that the low income Islamic populations account for most (85%) of the communicable, maternal, perinatal and nutritional disease burden and more than half non-communicable disease burden (60%). Table 4: Distribution of disease burden by region (DALYs ‘000)
Income and Geographical region (Islamic Populations)
South and East Asia
Middle East and North Africa
Sub-Saharan Africa Total
Islamic Populations % 58% 23% 20% 100%
Burden of Disease % 48% 16% 36% 100% Table 5: Distribution of disease burden by income group (DALYs ‘000)
Burden of Disease
Income Group Population
Communicable, maternal,
preinatal and nutritional %
Non-communicable % Injuries % Total
Low-Income 60.65% 85.62% 59.69% 67.48% 74.36%Middle Income 39.35% 14.38% 40.31% 32.52% 25.64%Total 100.00% 100.00% 100.00% 100.00% 100.00%
3. Detailed analysis of Burden of Disease for Islamic Populations under study Figure 1 indicates that communicable, maternal, preinatal and nutritional conditions account for more than half of the disease burden for Islamic Populations (53%). Non-communicable diseases account for 36%, while injuries account for 11%.

11
Figure 1: Distribution of disease burden by type of disease – Islamic Populations
Burden of Disease - Islamic Populations (DALYs '000)
53%
36%
11%
Communicable, maternal,perinatal and nutritionalconditions
Noncommunicable diseases
Injuries
Figure 2 provides a more detailed break down of the Communicable, maternal perinatal and nutritional conditions. It is observed that infectious and parasitic diseases account for the largest part of the communicable disease burden (57%) and the remainder is divided between respiratory infections (16%), perinatal conditions (15%), maternal conditions (6%) and nutritional deficiencies (6%). Figure 2: Distribution of Communicable, maternal, prenatal and nutritional conditions disease burden- Islamic Populations
Communicable, maternal, preinatal and nutritional conditions- Islamic Populations (DALYs '000)
57%
16%
6%
15%
6%
Infectious and parasiticdiseases
Respiratory infections
Maternal conditions
Perinatal conditions (h)
Nutritional deficiencies

12
Figure 3 provides a more detailed break down of the non-communicable disease burden. Neuropsychiatric conditions followed by cardiovascular diseases account for the largest part of the non-communicable disease burden. Some interesting findings emerge from the analysis. First, it is worth noting that neuropsychiatric conditions and sense organ diseases are numbers one and three in terms of disease burden. It is hypothesized that not enough attention has been paid to these conditions in both low and middl-income countries. Second, diseases such as cardiovascular disease, diabetes mellitus and oral conditions are amenable to lifestyle changes and prevention initiatives. National Health Accounts studies of low and middle-income countries show that they spend a disproportionate share of their health expenditures on curative services with very little going to fostering life style changes and prevention. We believe that investing in health education, fostering healthy lifestyles, and developing and implementing preventive interventions that target avoidable non-communicable disease burden can be cost-effective in the short and long run for both low and middle-income countries. Figure 3: Distribution of Non-Communicable Disease Burden- Islamic Populations
Non-Communicable Disease Burden- Islamic Populations (DALYs'000)
0
5,000
10,000
15,000
20,000
25,000
30,000
35,000
40,000
Neurop
sych
iatric
con
ditio
ns
Cardiov
ascu
lar d
isease
s
Sense
org
an dis
ease
s
Respira
tory
dise
ases
Diges
tive d
isea
ses
Malign
ant ne
oplas
ms
Congen
ital a
nomalie
s
Mus
culos
kelet
al disea
ses
Genito
urinar
y dis
eases
Diabe
tes m
ellitu
s
Ora
l con
ditio
ns
Endoc
rine d
isord
ers
Skin d
isea
ses
Other
neop
lasm
s
Diseases/Conditions
DA
LY
s '0
00
Figure 4 shows that unintentional injuries and road traffic accidents are the two leading causes of burden of disease from Injury. Violence, fires, falls, self-inflicted injuries and drowning account for a higher burden of disease than war or poisoning. Once again, the impact of many of these conditions can be mitigated through public safety interventions (seat belt laws) and the development and enforcement of policies that reduce violence and abuse11.
11 Clearly more analysis is needed

13
Figure 4: Distribution of Injuries-Disease Burden- Islamic Populations
Injuries- Islamic Populations (DALYs '000)
0
2,000
4,000
6,000
8,000
10,000
12,000
14,000
Oth
er u
ninten
tiona
l injur
ies
Road tra
ffic ac
cide
nts
Violenc
eFire
sFal
ls
Self-i
nflic
ted injurie
s
Drowni
ngs
War
Poiso
ning
s
Causes
DA
LY
s '0
00
In Table 6, we examine the disease categories that together account for 75% of the total disease burden. The table shows that 13 of the diseases are communicable, maternal, perinatal or nutritional conditions which together account for 43% of the burden; 17 are non-communicable diseases / conditions which together account for 25% of the disease burden; and 7 are injuries which account for 8% of the burden. From this table it appears that, if the objective is to tackle the disease conditions that account for the majority of the disease burden, one will need to look beyond just communicable, maternal, perinatal and nutritional conditions. Table 6: Diseases and Conditions accounting for 75% of Disease Burden by category– Islamic Populations under study
Disease Category
Communicable, maternal,
perinatal and nutritional conditions
Non-Communicable
diseases Injuries Total Total Burden of Disease
# of diseases in the Category 13 17 7 37
Burden of Disease DALYs '000 157,516 91,957 28,406 277,880 370,397% of total burden of disease 43% 25% 8% 75%

14
Table 7 presents a more detailed listing of the diseases/conditions that account for 75% of the disease burden for Islamic Populations and some important findings emerge. First, while there are diseases that have received both attention and investment from countries as well as funding agencies (HIV/AIDS, Malaria, Tuberculosis) there are a number of diseases that one can consider “neglected diseases” in today’s policy arena. Examples of such diseases include low birth weight, unipolar depressive disorders and Ischemic heart disease. Second, the findings reinforce earlier observations that mental health, health lifestyle and prevention issues are important but ignored areas in low and middle-income countries. Third, diseases associated with the elderly appear to be important and once again, while the global emphasis has been on diseases affecting mothers and children or HIV/AIDS, Malaria and TB we know little about the burden and costs of diseases affecting the elderly. Table 7: Diseases and Conditions accounting for 75% of Disease Burden – Islamic Populations under study
Diseases and conditions accounting for 75% of disease burden for Islamic Populations Causes
DALYs in '000 % contribution to burden of disease
1 Lower respiratory infections 31,648 8.54%2 Diarrhoeal diseases 22,113 5.97%3 HIV/AIDS 16,318 4.41%4 Low birth weight 16,228 4.38%5 Malaria 12,719 3.43%6 Other unintentional injuries 12,255 3.31%7 Unipolar depressive disorders 12,126 3.27%8 Ischemic heart disease 11,701 3.16%9 Tuberculosis 11,422 3.08%
10 Maternal conditions 11,377 3.07%11 Birth asphyxia and birth trauma 10,100 2.73%12 Road traffic accidents 9,847 2.66%13 Measles 8,596 2.32%14 Cataracts 8,016 2.16%15 Congenital anomalies 7,835 2.12%16 Cerebrovascular disease 6,602 1.78%17 Protein-energy malnutrition 5,755 1.55%18 Hearing loss, adult onset 5,179 1.40%19 Pertussis 4,706 1.27%20 Chronic obstructive pulmonary disease 4,062 1.10%21 Violence 3,926 1.06%22 Fires 3,775 1.02%23 Falls 3,541 0.96%24 Schizophrenia 3,511 0.95%25 Iron-deficiency anaemia 3,371 0.91%26 Tetanus 3,163 0.85%27 Self-inflicted injuries 3,143 0.85%

15
28 Asthma 3,115 0.84%29 Diabetes mellitus 3,024 0.82%30 Bipolar disorder 2,896 0.78%31 Vision disorders, age-related 2,743 0.74%32 Cirrhosis of the liver 2,631 0.71%33 Drownings 2,203 0.59%34 Osteoarthritis 2,199 0.59%35 Nephritis and nephrosis 2,065 0.56%36 Drug use disorders 1,997 0.54%37 War 1,971 0.53% Total 277,880 75.02% All Causes 370,397 % of total causes 75%
Figure 5 shows the top 15 conditions, which account for 55% of the disease burden. Lower respiratory infections are at the top of the list. From a policy perspective, this is interesting because relatively little attention has been paid to these diseases as compared to the level of attention that has been paid to HIV/AIDS, for example. Figure 5: Top 15 diseases/ conditions accounting for 55% of disease burden
Top 15 diseases - Islamic Populations (55% of Burden of Disease)
05,000
10,00015,00020,00025,00030,00035,000
Lower respiratory infe...
Diarrhoeal diseases
HIV/AID
SLow birth w
eight
Malaria
Other unintentional inj...
Unipolar depressive d...
Ischaemic heart disease
Tuberculosis
Maternal conditions
Birth asphyxia and birt..
Road traffic accidents
Measles
Cataracts
Congenital anom
alies
Diseases/Conditions
DA
LY
s '0
00

16
Figure 6 shows that low-income Islamic populations contribute the largest part of the disease burden resulting from the top 15 diseases/conditions. Figure 6: Distribution of disease burden (Top 15 diseases) by income group
0%
20%
40%
60%
80%
100%
Lower respiratory infections
Diarrhoeal diseases
HIV/AIDS
Low birth weight
Malaria
Other unintentional injuries
Unipolar depressive disorders
Ischaemic heart disease
Tuberculosis
Maternal conditions
Birth asphyxia and birth trauma
Road traffic accidents
Measles
CataractsCongenital anom
alies
Low-Income Populations
Middle Income Populations
As expected, table 8 shows that the countries that account for the largest share of the burden of disease are those which have large Muslim populations. However, the burden of disease varies by country. For example, Indonesia accounts for 16% of the Islamic population under study and only 11% of the disease burden, while Nigeria accounts for 5% of the population and 9% of the disease burden. Barring India, all the other countries on this list are those in which the Muslim population represents over half the total population. The presence of India on this list poses an important design issue. Targeting resources to Islamic populations residing in countries will lead to positive externalities for non-Muslim populations. In other words, one cannot restrict services to those who are Muslim. Given this, if one was to decide to tackle the disease burden of Muslims in India, then roughly 83% of the benefits will accrue to non-Muslims. This might not be the most cost-effective way to target funding. One solution might be to do geo-spatial mapping of Muslim populations within countries and use this information to implement interventions in specific geographic areas as opposed to the entire country.

17
Table 8: Countries accounting for 75% of Islamic Populations’ disease burden
Country Islamic Population
% of total Islamic Population under study
Disease Burden in DALYs '000 for Islamic Population
% Contribution to total burden for Islamic Populations
India 170,027 14% 48,585 13%Pakistan 146,913 12% 43,925 12%Indonesia 191,553 16% 40,921 11%Nigeria 60,456 5% 34,064 9%Bangladesh 126,551 11% 32,535 9%Ethiopia 34,481 3% 18,144 5%Afghanistan 22,930 2% 17,011 5%Iran (Islamic Republic of) 67,390 6% 12,552 3%Egypt 64,162 5% 12,460 3%Niger 10,390 1% 8,044 2%Iraq 23,775 2% 8,031 2%Total 918,626 77% 276,272 75% Total Islamic populations 1,185,974 370,397
3. Analysis of Burden of Disease for Low-Income Islamic Populations under study Figure 7 indicates that communicable, maternal, preinatal and nutritional conditions account for the largest part of the disease burden (61%) for low-income Islamic populations. Non-communicable diseases account for only 29%, while injuries account for 10%. Low-income Islamic populations suffer more from communicable, maternal, preinatal and nutritional conditions and less from non-communicable diseases, as compared to Islamic populations in general.

18
Figure 7: Distribution of disease burden by type of disease – Low Income Islamic Populations
Burden of Disease- Low-Income Islamic Populations (DALYs '000)
61%
29%
10%
Communicable, maternal,perinatal and nutritionalconditions
Noncommunicable diseases
Injuries
Figure 8 indicates that infectious and parasitic diseases account for the largest part of the communicable disease burden (58%) and the remaining is divided between respiratory infections (17%), perinatal conditions (14%), maternal conditions (6%) and nutritional deficiencies (5%). This pattern is very similar to the pattern observed for the Islamic populations in general. Figure 8: Distribution of Communicable, maternal, prenatal and nutritional conditions disease burden- Low Income Islamic Populations
Communicable, maternal, perinatal and nutritional conditions -Disease Burden- Low-Income Islamic Populations (DALYs '000_
58%
17%
6%
14%
5%
Infectious and parasiticdiseases
Respiratory infections
Maternal conditions
Perinatal conditions (h)
Nutritional deficiencies

19
Figure 9 shows that neuropsychiatric conditions, followed by cardiovascular diseases, account for the largest part of the non-communicable disease burden. As mentioned earlier, many of these conditions and diseases receive little attention or investment in low-income countries Fig 9: Distribution of Non-Communicable Disease Burden- Low Income Islamic Populations
Non-communicable disease -Low- Income Islamic Populations (DALYs '000)
0
5,000
10,000
15,000
20,000
25,000
Neurop
sych
iatric
condit
ions
Cardiov
ascu
lar d
isease
s
Sense
org
an dis
ease
s
Respira
tory
dise
ases
Diges
tive di
seas
es
Congen
ital a
nomalie
s
Mali
gnant
neop
lasm
s
Mus
culos
kelet
al dise
ases
Genito
urinar
y dise
ases
Diabe
tes m
ellitu
s
Endoc
rine d
isord
ers
Oral c
ondit
ions
Skin d
iseas
es
Other
neop
lasm
s
Diseases/Conditions
DA
LY
s '0
00
Figure 10 shows that unintentional injuries and road traffic accidents are the two leading causes of burden of disease from Injury. Figure 10: Distribution of Injuries Disease Burden- Low Income Islamic Populations
Injuries - Low-Income Islamic Populations (DALYs '000)
01,0002,0003,0004,0005,0006,0007,0008,0009,000
10,000
Other
unint
entiona
l injur
ies
Road tr
affic
accid
ents
Fires
Violen
ceFall
s
Self-in
flicte
d injur
ies
Drownings
War
Poisonin
gs
Causes
DA
LY
s '0
00
4. Analysis of Burden of Disease for Middle-Income Islamic Populations under study Figure 11 indicates that communicable, maternal, perinatal and nutritional conditions account for only 30% of the disease burden for middle-income Islamic populations. Non-communicable diseases account for the largest share of the burden (56%), while injuries account for 14%. The comparison between low and middle-income Islamic populations indicates that the picture is quite different for these two groups. Middle-income

20
populations suffer more from non-communicable disease and injuries. Therefore, it seems reasonable that different policies targeting different diseases are required for these two groups. Figure 11: Distribution of disease burden by type of disease – Low Income Islamic Populations
Burden of Disease - Middle Income Islamic Populations (DALYs '000)
30%
56%
14%
Communicable, maternal,perinatal and nutritionalconditions
Noncommunicable diseases
Injuries
Figure 12 shows that infectious and parasitic diseases account for the largest part of the communicable disease burden (47%) and the remainder is divided between respiratory infections (14%), perinatal conditions (22%), maternal conditions (7%) and nutritional deficiencies (10%). This pattern seems quite different from the pattern observed for low- income populations. Perinatal conditions and nutritional deficiencies account for a large share of the communicable disease burden and there is relatively less burden from infectious and paratactic conditions. Figure 12: Distribution of Communicable, maternal, prenatal and nutritional conditions disease burden- Middle Income Islamic Populations
Communicable, maternal, perinatal and nutritional conditions- Burden of Disease -Middle Income Islamic Populations (DALYs '000)
47%
14%
7%
22%
10%
Infectious and parasiticdiseases
Respiratory infections
Maternal conditions
Perinatal conditions (h)
Nutritional deficiencies
21
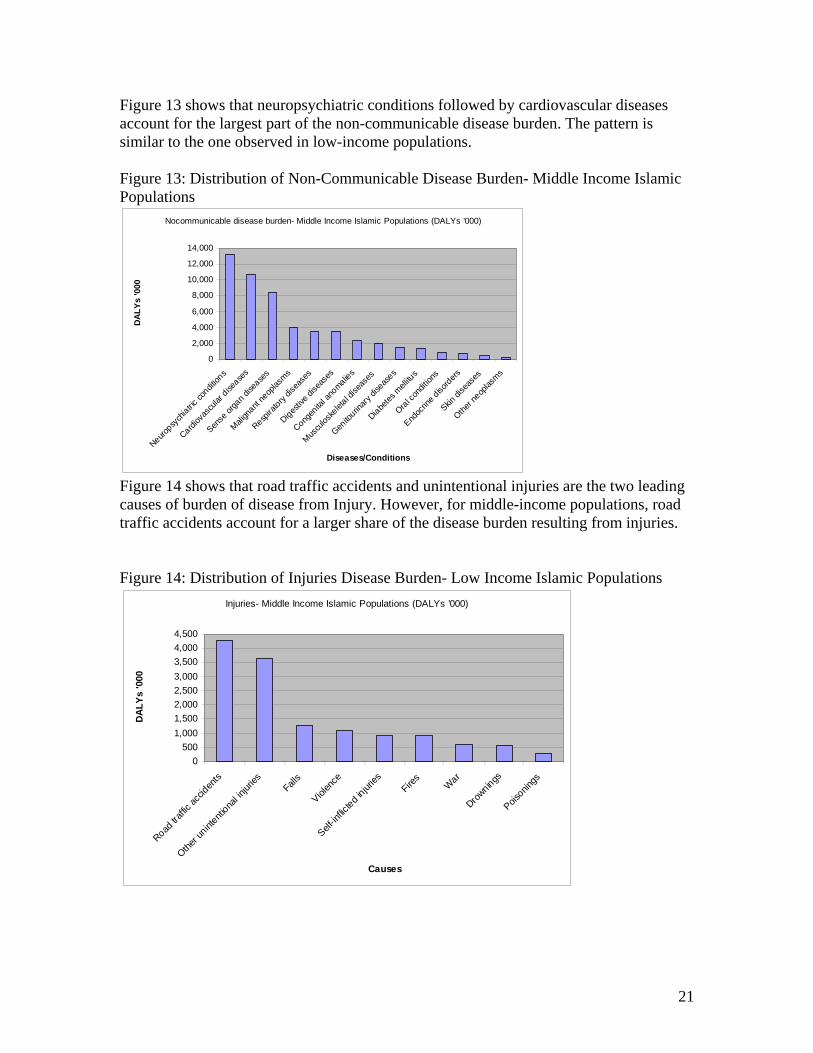
Figure 13 shows that neuropsychiatric conditions followed by cardiovascular diseases account for the largest part of the non-communicable disease burden. The pattern is similar to the one observed in low-income populations. Figure 13: Distribution of Non-Communicable Disease Burden- Middle Income Islamic Populations
Nocommunicable disease burden- Middle Income Islamic Populations (DALYs '000)
0
2,000
4,000
6,000
8,000
10,000
12,000
14,000
Neurop
sych
iatric
condit
ions
Cardiov
ascu
lar d
isease
s
Sense
org
an dis
ease
s
Mali
gnant
neop
lasm
s
Respira
tory
dise
ases
Diges
tive di
seas
es
Congen
ital a
nomalie
s
Mus
culos
kelet
al dise
ases
Genito
urinar
y dise
ases
Diabe
tes m
ellitu
s
Oral c
ondit
ions
Endoc
rine d
isord
ers
Skin d
iseas
es
Other
neop
lasm
s
Diseases/Conditions
DA
LY
s '0
00
Figure 14 shows that road traffic accidents and unintentional injuries are the two leading causes of burden of disease from Injury. However, for middle-income populations, road traffic accidents account for a larger share of the disease burden resulting from injuries. Figure 14: Distribution of Injuries Disease Burden- Low Income Islamic Populations
Injuries- Middle Income Islamic Populations (DALYs '000)
0
500
1,000
1,500
2,000
2,500
3,000
3,500
4,000
4,500
Road tr
affic
accid
ents
Other
unint
entiona
l injur
iesFall
s
Violen
ce
Self-in
flicte
d injur
iesFire
sW
ar
Drownings
Poisonin
gs
Causes
DA
LY
s '0
00

22
5. Income and Burden of Disease Figure 15 shows that the burden of disease in Islamic countries varies by income. As expected, the lower the income, the higher the communicable, non-communicable and injuries burden. The burden decreases as income increases. This trend is particularly obvious for the communicable disease burden, which is much higher in low-income countries, and it seems to steeply decrease with increases in income. It is interesting to observe that, once a country cross the $2000 GNI per capita PPP, the burden of disease does not seem to decrease any further with increases in income. The lines for communicable, non-communicable and injuries remain flat. This finding has important implications for a couple of reasons. First, it raises the question of whether the largest impacts can be obtained by focusing on low-income countries. Second, if the pattern indicates the achievement of a lower steady state in the rate of burden of disease in middle-income countries, then it is important to understand the underlying reasons for this. Finally, if some of the reasons are changes in access to health care, improved nutrition, greater awareness of healthy, life-promoting practices, then focusing on these in low income countries might help them transition to the steady state12 faster. Figure 15: Disease Burden in Islamic Countries by Income
Disease Burden in Islamic Countries (Age std DALY rate 100,000)
-
10,000
20,000
30,000
40,000
50,000
60,000
0 1,000 2,000 3,000 4,000 5,000 6,000 7,000
GNI per capita PPP
Dis
ease
Bu
rden
(D
AL
Y r
ate
100
,000)
CommunicableDiseaseBurden
Non-CommunicableDiseaseBurden
Injuries
Figure 16 shows that the share of disease burden from communicable, non-communicable and injuries conditions varies with income. Communicable diseases account for the largest share of the burden, followed by non-communicable in low-income countries. The pattern is reversed as income increases. Injuries seem to stay relatively stable, accounting for around 10% of the burden except for a peak around the $3000 GNI per capita at which level; it reaches almost 20% of the burden.
12 We use the term “steady state” in the absence of a better term. One hypothesis we would like to test is whether the pattern of the rate of disease burden changes at higher incomes. In other words it is feasible that as countries transition to becoming high middle-income countries or high income countries there will be changes in the rate of disease burden for certain disease categories

23
Figure 16: Type of Disease Burden in Islamic Countries by Income
Analysis of Burden of Disease
0.00%
10.00%
20.00%
30.00%
40.00%
50.00%
60.00%
70.00%
80.00%
90.00%
0 1,000 2,000 3,000 4,000 5,000 6,000 7,000
GNI per capita PPP
% o
f to
tal c
ou
ntr
y b
urd
en o
f d
isea
se
CommunicableDisease share
Non-Communicableshare
Injuries
6. Expenditures and Burden of Disease As expected, the burden of disease in Islamic countries decreases with increased spending on health. Figure 17 shows that the rate of DALYs per 100,000 falls as total health expenditures per capita increase. However, there seems to be a large variance at the lower end of health spending which means that there are countries spending similarly low amounts on health and achieving very different levels of disease burden. This observation points to the need to conduct further research into the issue of the efficiency of utilizing health expenditures at lower levels of spending. Figure 17: Analysis of Total Health Expenditures per capita and DALYs per 100,000
Analysis of Total Health Expenditures Per Capita and DALYs
per 100,000
y = 43630e-0.0021x
R2 = 0.5112
0
10,000
20,000
30,000
40,000
50,000
60,000
70,000
80,000
0 100 200 300 400 500 600 700 800
Total Health Expenditure Per Capita
DALYs per 100,000 Expon. (DALYs per 100,000)

24
The pattern observed in Figure 17 is repeated in Figure 18. Higher government per capita spending on health is associated with lower burden of disease. The same high variance at lower levels of spending is observed in Figure 18.
Figure 18: Total Government Expenditures on Health Per Capita and DALYs per 100,000
Total Govt Exp on Health Per Capita and DALYs
y = 42654e-0.0042x
R2 = 0.5195
0
10,000
20,000
30,000
40,000
50,000
60,000
70,000
80,000
0 50 100 150 200 250 300 350
Total Govt Exp on Health Per Capita
DALYs per 100,000 Expon. (DALYs per 100,000)
The pattern is much less clear in Figure 19. However, an increase in the public share of health expenditures seems to be associated with lower burden of disease. The pattern may be much less obvious because there are several potential confounders in the relationship between public share of health spending and burden of disease. These confounders would need to be controlled for in order to obtain an accurate representation of the relationship. Figure 19: Public Share of Health Expenditures and DALYs per 100,000
Public Share of Health Expenditure and DALYs
y = -16972x + 43806
R2 = 0.0305
0
10,000
20,000
30,000
40,000
50,000
60,000
70,000
80,000
0.00 0.10 0.20 0.30 0.40 0.50 0.60 0.70 0.80 0.90 1.00
Public Share of Health Expenditure
DALYs per 100,000 Linear (DALYs per 100,000)

25
9. Issues to Consider While Designing the Initiative The analysis highlights the need to focus on some key issues while designing the initiative. These include but are not limited to the following:
1. Should the focus be exclusively on Islamic populations or the entire population living in countries with a sizeable Islamic population?
Focusing on the latter might mean significantly higher outlays in countries such as India where Muslims comprise less than 17% of the population; and yet only Indonesia has a higher number of Muslims. One solution is to use geo-spatial mapping to identify areas of high Muslim population concentrations and target such areas.
2. Should the focus be more specifically on diseases that account for the largest burden of
disease, or should additional criteria expand the focus, such as diseases that are under-funded, neglected, and/or affect the poor disproportionately?
The analysis shows that there are a number of diseases that have received little attention, both at the country level as well as from international agencies. While it is important to focus on diseases that account for a large proportion of the disease burden, we feel that it is equally important to target some of these neglected and/or ignored diseases.
3. Should one focus on a sub-set of countries that account for the majority of the burden of
disease or on all counties with a sizeable Islamic population? Our recommendation is to focus primarily on those countries that account for the
majority of the burden of diseas, but to allow some flexibility to choose other countries if they are considered important for other strategic reasons.
4. The analysis clearly shows that many of the key diseases are amenable to changes in life
style, prevention, and implementation of policies that increase public safety, reduce violence and abuse and target the elderly. We strongly believe that focusing on these during the design of the project is both desirable and important.
5. What weight should be given to underlying health systems issues (we are yet to study this
in great detail) such as public allocations for health, infrastructure, manpower, enabling environment, governance etc. in choosing countries and interventions?
6. How will the responsibility for the design of country-level interventions, financing,
implementation and oversight be shared among the partners – Bill and Melinda Gates Foundation, UAE and the country?
7. What system should be put in place to measure the impact of the initiative? 8. How can we support research that can lead to a better understanding of the impact of
ethnicity on the burden of disease?

26
DATA SOURCES
% Muslim population: * US State Department's International Religious Freedom Report 2004 * CIA FactBook * Muslim Population Percentage from U.S Dept. of State * http://en.wikipedia.org/wiki/Islam_by_country Country Ranking: World Bank Website - http://web.worldbank.org/WBSITE/EXTERNAL/DATASTATISTICS/0,
contentMDK:20421402~pagePK:64133150~piPK:64133175~theSitePK:239419,00.html#Low_income* Income group: Economies are divided according to 2005 GNI per capita, calculated using the World Bank Atlas method Burden of Disease: World Health Organization Organisation Mondiale de la Santé Department of Measurement and Health Information December 2004 1. Mathers CD, Bernard C, Iburg K, Inoue M, Ma Fat D, Shibuya K, Stein C, Tomijima, N (2003). The Global Burden of Disease in 2002: data sources, methods and results. Geneva, World Health Organization (GPE Discussion Paper No. 54) Available at http://www.who.int/evidence" 2. Mathers CD (2005). Uncertainty and data availability for the global burden of disease estimates 2000-2002. Evidence and Information for Policy Working Paper. Geneva, World Health Organization. Available at http://www.who.int/evidence/bod