Embed Size (px)
Citation preview

‐1‐
PRELIMINARY AND INCOMPLETE
Religions, Human Capital and Earnings in Canada
Maryam Dilmaghani
McGill University, Department of Economics & CIRANO
Abstract Using the Ethnic Diversity Survey (EDS) I examine how religious belief and practice relate to earnings in Canada. I consider the impact of the degree of religiosity using a composite scored-based variable constructed by means of several questions in the survey as an explanatory variable in standard human capital-earnings function estimation. A negative correlation between religiosity and earnings is found controlling for demographic and human capital variables. I also estimate the human capital return differentials among religious denominations. The uncovered differentials are economically and statistically significant. Jews enjoy a premium and Muslims’ earnings are significantly lower compared to the average. The explanation of this gap seems to be the return to experience. Keywords: religiosity, earnings JEL Classification: Z12
Correspondence to the author:
‐2‐
I. Introduction
Although the relationship between religions and labour market outcomes is of interest to
labour economists, social economists and economic demographers, the last study of this
issue using Canadian data dates back to around 25 years ago (Tomes 1983, 1984 and
1985; Meng and Sentence 1984). This paper’s objective is to fill this gap by re-examining
this question with recent data. Moreover I examine the impact of the degree of religiosity
(regardless of the denomination as well as in interaction with the denomination) on
labour market outcomes. This study is carried out using the Ethnic Diversity Survey
(EDS hereafter) that contains the most comprehensive religion-related information in
Canada.
This paper aims at covering both questions of economic impact of religiosity as well as
cross-religion differentials in earnings and human capital return. In order to answer the
first question I construct a score-based religiosity index through a combination of several
questions of the survey. As such religiosity can be regarded as a continuous variable
helping to examine how religiosity, as an observable and measurable trait, can predict
labour market outcomes. To deal with the second question I compare labour market
outcomes of Catholics, Protestants, Jews, Muslims, individuals self-reporting of no
religious affiliations and the residual group (the rest of religious affiliations put together)
in a manner similar to the above mentioned studies (Tomes; Meng and Sentence).
However my study differs from the previous ones in that, given the important movements
of person in Canada during the past two decades, I have also included Muslims as one of
the comparable religions. Moreover I have not excluded females from the sample. A
literature review sheds light on how to situate this paper within the most recent related
research.
Since the classic study of Max Weber, the economic impact of religion by way of shaping
individual agents’ incentives and behaviours has been recognized by scholars of many
fields. This impact is manifested either in the organization of the society as a whole (see:
Dudley and Blum 2001; Guiso 2003; Boppart et al. 2008) or in the individual preferences
(see Iannaccone, 1998 for a survey). It is likely that because of the secularisation
‐3‐
hypothesis most recent studies have regarded the relationship between religions and
economic outcomes from the latter side (See for instance Inglehart and Norris 2004).
Using a panel of countries, McCleary and Barro (2003) find that while a country’s extent
of religious belief is positively related to economic growth, the frequency of religious
practice relates to economic growth through a negative coefficient. However, Durlauf et
al. (2006) show that the results obtained by Barro and MacCleary are not robust to the
changes in the specification. Within the micro-data literature, the relationship between
religiosity and a wide array of outcomes such as educational attainment (Sander 2001;
Sacerdote and Glaeser 2001; Blusch 2007), female labour force participation and fertility
(see for a review: Lehrer 2008), tendency towards entrepreneurship (e.g. Audretsch et al.
2007) and the like has been examined. Although the direction of causality still remains
undecided, the stylized facts of this literature (based on data from the United States) can
be summarized as follows: Education is generally a positive predictor of religiosity;
income is a strong, positive predictor of monetary contributions to religious causes, but a
very weak predictor of most other measures of religious activity, such as church
attendance and frequency of prayer. More importantly than income however age, gender,
and religious upbringing predicts religious involvement (see also: Azzi and Ehrenberg
1975; Ehrenberg 1977, Long and Settle 1977; Ulbrich and Wallace 1983 and 1984, and
Biddle 1992).
Finally, the studies that look at cross-religion differences in earnings and human capital
return find superior earnings of Jews (conditional on educational attainment) compared to
the rest of population in the US and in Canada (see: Steen 1996; Chiswick 1983 and
1985; Chiswick and Huang 2006; Meng and Sentence 1984; Tomes 1983, 1984 and
1985). Meng and Sentence (1984), using data from Canadian National Mobility Study
1973, found a statistically significant and economically sizable difference among
religious groups’ earnings: they found that Jews earned more than Catholics and
Protestants conditional on observed characteristics. Although Tomes (1984) , using 1971
Canadian Census, confirmed the existence of a positive gap in earnings in favour of Jews,
he found it to be much smaller than what was obtained by Meng and Sentence.

‐4‐
The reminder of paper is organized as follows. The next section is devoted to a
theoretical discussion. The third and fourth sections deal with the presentation of the
dataset, the construction of the Religiosity Index and the methodology used. In the fifth
section I report the estimation results of the impact of the degree of religiosity (measured
using religiosity index) and well as cross-religion differentials in earnings and human
capital return. The concluding remarks are included in the last section while the tabulated
results of the estimations are presented in an appendix at the end of the paper.
II. Theory and Conjectures
One of the conjectures establishing a link between religious affiliation and economics is
the view allowing for intergenerational transmission of economic status (for the formal
model see Becker and Tomes 1979). Religious affiliation, and to some extent the degree
of religiosity are highly persistent through consecutive generations. According to Tomes
(1985) 80% of males in the United States followed the affiliation they have been raised
with) and in my data among respondents with a religious affiliation more than 87%
adhere to same faith as at least one of their parents and even among respondents of no
religious affiliation more than 56% follow at least one of their parents in having no
religious affiliation. Therefore one can think of religious affiliation and religiosity as a
part of family background and by this virtue a constituent of a child’s endowment from
the family. From this perspective, religious denomination and religiosity are the
observable and somewhat measurable aspects of this endowment that affects the child’s
later economic and educational attainment. This hypothesis implies the persistence of
income inequality that is correlated with religious denomination and the degree of
religiosity.
The other way of linking religiosity and religion(s) to economic outcomes is through the
behavioural impact of religious tenets on economic attainment. It is so that it has been
suggested that religiosity and earnings can be related through the enhancing impact of
religion on some economically advantageous personality traits such as discipline,
diligence, trust and thrift. However the possibility of the presence of unobservable
‐5‐
common cause(s), mainly of sociological and psychological order, means any
relationship found may also be spurious (for a survey see: Iannoccone 1998).
Trust is an individual trait whose positive relationship with individual economic
attainment as well as country’s economic growth has been established through both
theoretical and empirical studies (see for instance: Arrow 1972; Zak and Knack 2001).
There are also a number of studies that report higher degrees of cooperative behaviour in
religious people. Anderson et al. (2008) through an experimental study found some
weak evidence that among subjects attending religious services, increased participation is
associated with cooperative behaviour in both public goods and trust games controlling
for income and other demographic attributes. Note that although cooperation and trust are
different issues cooperative behaviour presupposes trust. Hence the evidence for more
cooperative behaviour is indirect evidence for trusting behaviour as well.
A direct test of the relationship between religiosity and trust is provided by the
experimental study of Tan and Vogel (2006). They found that more religious trustees are
trusted more, and such behaviour is more pronounced in more religious trusters.
Moreover, the experimental data suggest that religious trustees are trustworthier. A
comparable study is the one by Johansson-Stenman et al. (2008) examining the
relationship between trust and religion in Bangledesh both through survey questions and
data from field experiment. The authors focusing on the cross-religion differences
between Muslims and Hindus found that the devotees of the minority religion, Hindus,
are less trusting.
The other possible channel is the enhancing impact of religion on the tendency towards
entrepreneurship. This hypothesis recalls the classic thesis of Max Weber. Recently,
Audretsch et al. (2007) looked at this question with data from India. Their results suggest
that certain denominations’ tenets and teaching impact negatively the tendency towards
entrepreneurship.
The study of the impact of education on economic attainment is one of the pillars of
labour economics. Therefore any relationship between education and religiosity is
‐6‐
susceptible of affecting labour market outcomes. However the nature of the relationship
between education and religiosity has been hitherto controversial in the literature. While
the common belief based on the secularization hypothesis suggests that this relationship
is negative, empirical studies discredited this belief at least for the United States (see for a
survey Iannoccone 1998). These newer results can be interpreted as showing that
education increases religious involvement. However Sander (2001) argues that education
is endogenous in the equations estimating the determinants and the extent of religious
activity. Thus the direction of causality in the relationship between education and
religiosity still remains uncertain, affecting any conclusion that can be drawn from it
about the relationship between religiosity (religions) and earnings.
Family structure has been suggested as another channel through which religiosity may
influence economic attainment. For instance religious sanctions on divorce may increase
the expected duration of marriage and hence encourage greater specialization and
division of labour between spouses raising the labour market skills and earnings of one
spouse (Tomes, 1984). Higher earnings of Jews were explained through their low
fertility levels influencing parental investments in the children. In contrast it has been
suggested that Roman Catholics face additional psychic costs of birth control, and this
lowers the price of numbers of children, the resulting larger family size would tend to
reduce investments in each child thus affecting their future labour market attainment.
There is a trend in the literature specifically devoted to the study of Jews’ labour market
attainment in the United States (Chiswick 1983 and 1985, Chiswick and Huang 2006).
Overall it is found that in North America Jews have not just higher earnings but also
higher education compared to average. With regard to the reasons behind Jews’ higher
educational attainment, Brenner and Kiefer (1981) proposed that because of their past
cultural history of the expropriation of material wealth, Jews make greater investments in
human capital, which is embodied and transportable. In the same direction Becker (1981)
relates the observed higher earnings of Jews to higher marginal return to their education.
Moreover Tomes (1985) noted that in Canada taking into account the Jewish female side
of labour market may make a substantial difference especially with respect to Jewish
‐7‐
earrings i.e. Jewish females, he suggested, earned less than average Canadian female to
the point that it could more than compensate the Jewish males’ premium.
Differences in religious denominations in a given society can also overlap with the racial
differences present in this society. In this case it is not obvious how to interpret the
observed gap in the labour market outcomes’ of these groups. Reitz et al. (2009) make a
case for the predominance of racial issues as explanatory factors in the labour market
discriminations against groups of individual in Canada: Emphasizing on the socio-
economic assimilation of immigrants to Canada and using EDS data, they find that
between race and religious denomination it is the former factor which has higher
importance in explaining the observed labour market attainment gap among groups.
Immigration related effects may also be a factor present at the same time or in interaction
with a specific religious denomination’s labour market performance. Canadian
immigration policy and its requirement on academic qualification of the immigration
candidates, more precisely their education, may cause correlations between specific
labour market outcomes and a religious affiliation. Also given that foreign labour market
experience can be, in some cases, a poor substitute of Canadian labour market or since its
value may be unrecognized by Canadian employers immigration might be behind a given
religious afflation’s lower attainment in earnings (see: Finnie and Meng 2002).
While keeping the framework of this empirical investigation Mincer equation I account
for the above-mentioned potentially relevant factors (trust, entrepreneurship, family
background, familial status, nativity status, linguistic ability and race) by adding extra
control to the standard version of this equation.
III. Data
The dataset used in this study is Ethnic Diversity Survey (EDS) of Statistics Canada
conducted between April and August 2002 and released in 2005. The dataset is a survey
of 41695 respondents of 15 years old and above, male or female legal residents of
Canada.
The survey contains precise information about religious affiliation and ethnic background
of the respondents, covering for some of the variables up to six earlier generations before
‐8‐
the respondents. The advantage of this survey over labour market surveys is that it
contains specific information about the self-reported importance of religion and the
frequency of religious practice. This feature makes it possible to treat religiosity as a
quantitative variable regardless of the denomination.
The education measured by the highest degree attained by the respondent as well as that
of their parents and their spouses (if applicable) is surveyed. The hours worked per week
as well as annual personal income and annual household income of the respondents are
included in the survey. Although the survey’s information is on income rather than
earnings it is possible to know the source of the reported income allowing me to exclude
the respondents whose reported incomes were from sources other than employment or
self-employment and to subsequently calculate the hourly wage that is used as dependent
variable in the regressions.
In addition, the dataset provides information such as ethnic background up to several
generations, the linguistic proficiency of the respondents, the sector of professional
activity, the structure of social network and family ties, trust and social attitude and the
like which enable me to augment the human capital earnings function by extra control
variables. The list of the variables used in this paper is reported in Table-1 and the
descriptive statistics in Table-2. Below I briefly report some descriptive statistics with
regard to religions and religiosity in Canada whose more detailed version can be found in
Table-1. Unless otherwise indicated, all reported statistics are computed using survey
weights.
As reported in Table-3 in the working respondents’ subsample self-reported Catholics
constitute 42% of sample followed by Protestants with 25 % and by the respondents of no
religious affiliation (including atheists but not limited to it1) with 17%. Among the
minority religions we have Judaism and Islam coming close to each other in terms of the
percentage of the devotees with around 1% and 2% respectively. 1 Note that it may be difficult to distinguish between sects and groups of philosophical thoughts and some religions in the absence of a clear definition of religion. The variable “no religious affiliation” defined in Table-2 explains how this distinction is made in the EDS. It is interesting to note that this way of distinguishing between having a religious affiliation and not having a religious affiliation is in accordance with the definition proposed by Iannaccone (1998). He defines religion as “any shared set of beliefs, activities, and institutions premised upon faith in supernatural forces”. His definition, he points out, excludes purely individualistic spirituality and systems of metaphysical thoughts including some variants of Buddhism.

‐9‐
With respect to the self-reported importance of religion, there is a question in the survey
in which the respondents are asked to express their opinion about the importance of
religion by ranking it from 5 to 1 where 5 stands for very important and 1 for not
important at all. Non religious individuals respond to this question by “not applicable”.
There are two other questions dealing with religiosity and religious activity of the
respondents. In one question the respondents are asked to choose among different options
the one that corresponds to their own frequency of religious practice with a group of
people of the same faith. The other question concerns the frequency of individual
religious practice. For both questions the options are: at least once a week, once a month,
at least three times a year, once or twice a year and not at all taking the values of 5 to 1.
And overall the frequency of collective religious practice is noticeably lower than
individual religious practice.
For sake of having a comprehensive measure of religiosity I defined the Religiosity Index
by summing the ranking numbers of the answers to the three questions introduced in the
previous paragraphs. Note that in the first questions the respondents had to rank the
importance of religion from 1 to 5 while in the two others the respondents’ answers were
on the frequency of their individual and collective religious practice bound by 5
predetermined categories. The problematic issue in the construction of my religiosity
index is that the passage from one category to the next in the questions regarding the
incidence of religious practice does not signify the same distance in a quantitative way.
More precisely, in the first category the reported incidence of religious practice is 52
times a year while in the second it falls to 12 times, and to 3 times in the third. In other
words the predetermined survey categories do not consistently map to a measure
proportionate to the respondents’ yearly frequency of practice.
It may be argued that any non-linear translation of categories into a quantitative measure
has the disadvantage of arbitrariness. A sensible translation of surveys’ predetermined
categories of religious practice is used by William Sander (2002). He maps the
predetermined General Social Survey categories to a quantitative measure as follows:
never equals 0, less than once a year equals 0.5, about once or twice a year equals 1,
several times a year equals 3, about once a month equals 12, two to three times per month

‐10‐
equals 30, nearly every week equals 40, every week or more often equals 52. As such I
opt for both an unweighted religiosity index by summing the above mentioned religion-
related three questions’ ranking score as well as an index constructed in consistency with
William Sander’s translation of the categories indicating religious practice frequency into
magnitudes (weighted religiosity index). Attributing the value of zero to the respondents who
have no religious affiliation the average score of the importance of religion in the survey
computed using survey weights is 2.7 while the unweighted index and weighted index
average at 7.70 and 5.72 respectively (Table-2).
Muslims’ family size is the largest among the groups under consideration while
respondents of no religious affiliation group comes the last in such classification. Also
Muslims’ number of children is the highest while Jews rank the last. The average age of
working Muslims (38 years old) is lower than average working Canadian (41 years old)
while average working Jews (45 years old) are noticeably older. This may be one of the
reasons behind the observed differences in mean earnings across groups especially
Muslims versus Jews (Table-3).
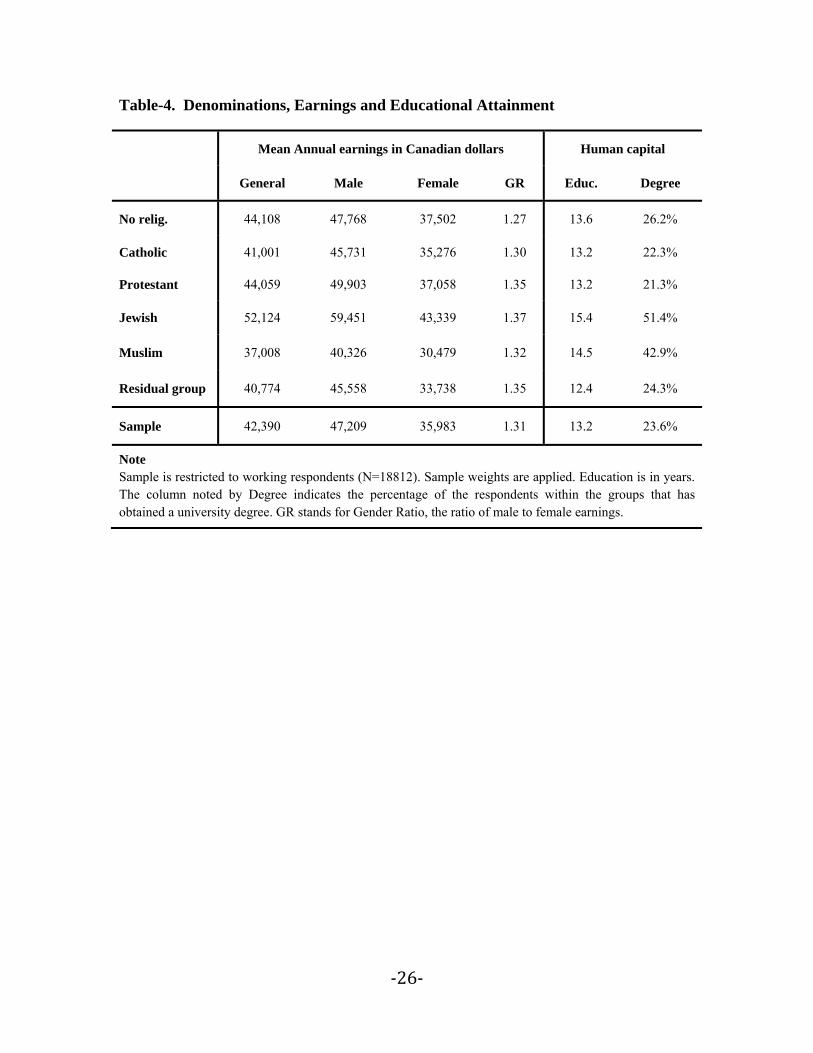
Descriptive statistics on the relationship between religious denomination and annual
earnings as well as educational attainment are reported in the Table-4. The statistics
suggest sizable differences among religious groups. Working Jewish males earn 26%
more than average working Canadian males while working Muslims earn 13% less than
average Canadian and working Muslim males earn 15% less than average working
Canadian males. It is interesting to note that the ratio of male to female earnings is the
highest among Jews while Muslims come second (Table-4). Such Jewish gap between
male and female has been previously suggested by Tomes (1985).
Jews enjoy a higher level of education evident from both average years of schooling and
the percentage of their population that holds a university (college) degree. Working Jews
have on average close to 2 more years of schooling and 51% of them hold a university
(college) degree against 23% of all working Canadians. Muslims also have on average
1.3 more years of schooling and the university graduate percentage of them is higher than
the average by close to 20 percentage point. Combining the larger family sizes of
‐11‐
Muslims with their lower earnings leads to the conclusion that belonging to Muslim
households is a predictor of economic disadvantage in Canada.
With regard to the reasons behind Jews’ higher educational attainment, one can refer to
aforementioned papers by Brenner and Kiefer (1981) and Becker (1981). With respect to
the Muslims, I believe that the main reason behind Muslims’ higher educational
attainment is that a high fraction of Muslims are immigrants (71%) and taken together
with Canadian immigration policy and its requirement on academic qualification of the
immigration candidates their education is higher than average (see: Finnie and Meng
2002). It is noteworthy that unlike in previous studies dating back to 1980s, Catholics
now have the same educational attainment as Protestants (see Tomes 1984).
IV. Methodology
Mincer wage equation (1974) is used as the benchmark for the regressions both for the
examination of cross-religion differential as well as the impact of religiosity. He
independent variable of this equation is natural logarithm of hourly wage and the main
predictors are education, experience and the squared term of experience. Habitually the
vector of additional explanatory variables includes dummies for location and job-
category along demographic and family background variables such as parents’ education
and marital status aimed at achieving a better fit of the regression equation to the data.
Given the insights gained from theoretical works enumerated in the previous pages I
chose the following set of extra explanatory variables: education, experience, experience
squared, parents’ education, marital status, dummies for female, immigrant, visible
minority, native speaker, trusting behaviour, self-employment and locations.
The estimated equation set for uncovering the relationship between religiosity (measured
through the score-based index) and earnings (measured by natural logarithm of hourly
wage) can be expressed as follows:
ln(wage)= + Schooling+ Experience + Experience2 + + δ Religiosity
Indicator + ε (1)
‐12‐
where is the scalar product of the vector of extra explanatory variables that I listed in
the previous paragraph and their partial effect on earnings and Religiosity indicator is
inclusive of weighted and unweighted religiosity indices as well as their components
accounted for separately.
In order to investigate whether the relationship between the degree of religiosity and
earnings differs across religions one can estimated the equation below.
ln(wage)= + Schooling+ Experience + Experience2 + +∑
) + ε i=1,...,5. (2)
Dichotomous variables I1 to I5 designate each religious affiliation (Catholic, Protestant,
Jew, Muslim and residual group) by taking the value of 1 for the devotees of each
religion and 0 otherwise. The omitted category is the group of respondents of no religious
affiliation.
Abstracting from degree of religiosity one can compare religions as groups. A version of
this conception is that in which the difference in earnings among the religious groups is
assumed to be additive. Taking the base group as respondents of no religious affiliation
estimating the equation below accomplishes this objective.
ln(wage)= + Schooling+ Experience + Experience2 + +∑ ) + ε
i=1,...,5 (3)
I am also interested in examining the differences in return to human capital variables. An
equation in which the return to education and labour market experience (both in levels
and squared from) have varied slopes depending to religious affiliation can be written as
follows.
ln(wage)= ∑ + + Schooling× + Experience× + Experience2× )+
+ ε j=1,...,6 (4)

‐13‐
Dichotomous variables J1 to J6 designate all the groups under consideration. The equation
(4) has to be estimated without a constant as all the groups are explicitly included in the
formulation.
In order to complete the analysis of the wage gap among religious groups Oaxaca-Blinder
decomposition technique is used (Oaxaca 1973, Blinder 1973). This method was
originally aimed at decomposing the measured wage gap between two groups into a
portion due to the differences in individual productivity traits and a portion due to
differences in labour market returns to those traits (suggesting discrimination by
assuming that the estimates from the base group constitutes the case of no
discrimination). In the literature the former component of the gap is called “explained”
and the latter “unexplained” part. Suppose that one takes the respondents of no religious
affiliation respondents as the basis of the comparison then for i=1,...5 we can write:
ln(wage)NRA - ln(wage)i = (XNRA×βNRA +εNRA) - (Xi×βi +εi)=
(XNRA-XI)×βi+ XI ×(βNRA-βi)+(XNRA-Xi)×(βNRA-βi)=
(XNRA-Xi)×βi+[Xi×(βNRA-βi)+(XNRA-Xi)×(βNRA-βi)]=
Explained +Unexplained (5)
It is noteworthy that the results of the decomposition are sensitive to the choice of the
reference group and the model’s formulation. Further decomposition of the explained and
unexplained part is also possible.
IV. Results
In this section the results of the estimation of the equations noted in the previous section
are reported. All the equations are estimated by OLS. The corresponding tables can be
found in the appendix at the end of the paper.
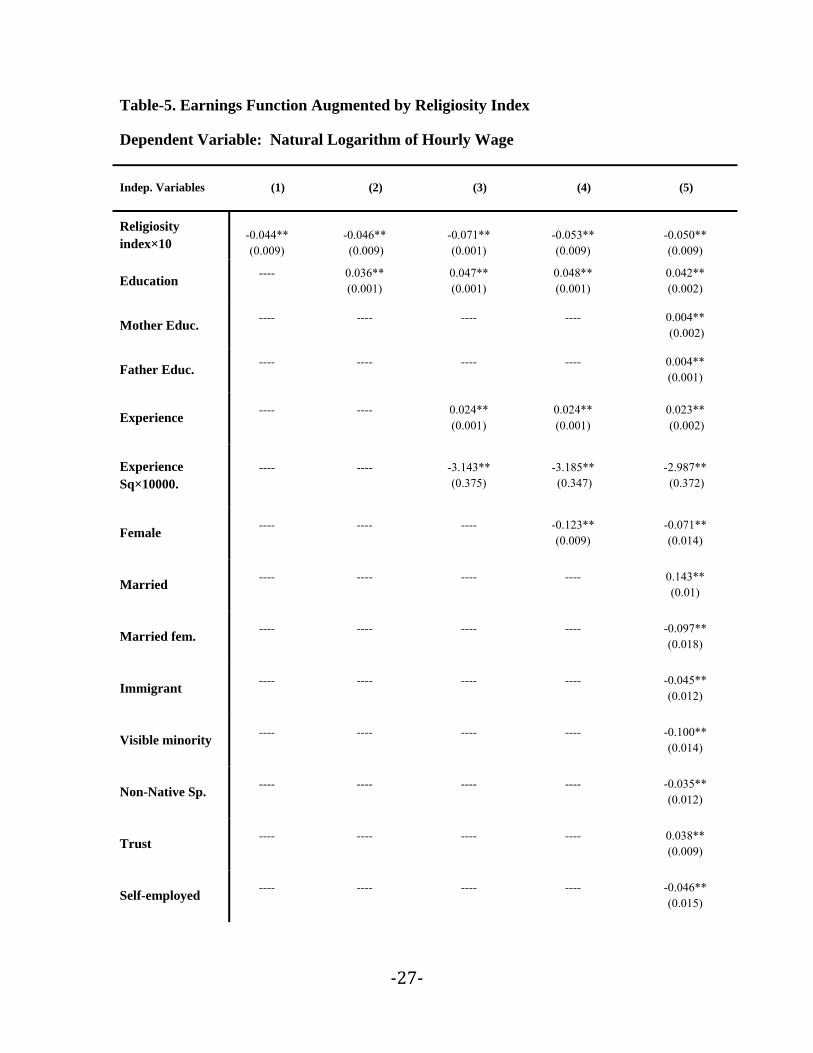
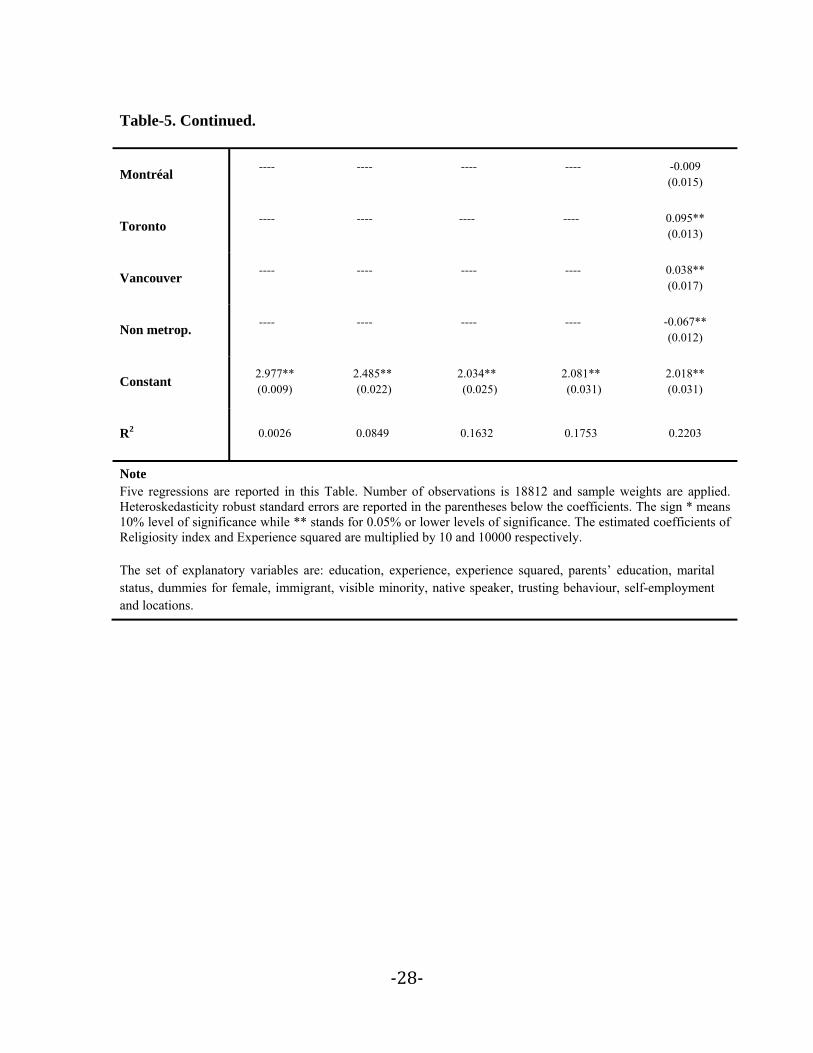
As the pilot examination Table-5 incorporates a set of the regressions in which extra
explanatory variables are gradually added starting with unweighted religiosity index in

‐14‐
the first column to the full set of explanatory variables in the fifth column. Recall that
religiosity index ranges from the value of 0 (for respondents of no religious affiliation) to
15 with the standard deviation of 5.23. As such an increase by one standard deviation in
religiosity index ranges from 2.1% decline in the hourly wage as reported in the first
column of Table-5 (results of a regression whose unique explanatory variable is the
religiosity index) to 2.6% decline in the hourly wage as reported in the last column of
Table-5 (results of a regression with full set of explanatory variables). This result
contrast the pattern uncovered in the United States where the impact of religiosity is
generally found to be positive (Iannaconne 1998).
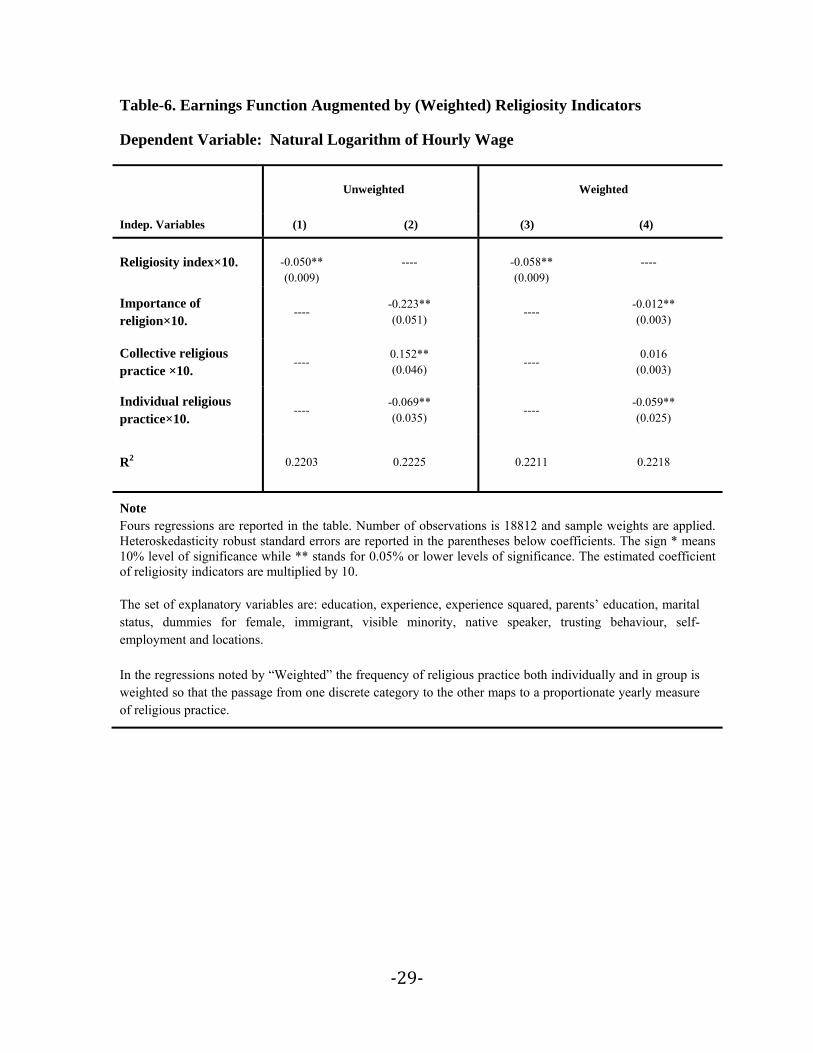
Table-6 reports the result of regressions set as sensitivity test of unweighted religiosity
index as well as its components. The first regression partially reported in the column (1)
in the same as the one reported in the last column on Table-5 and it is included for sake
of comparison. In the second regression partially reported in the next column each of the
components of the religiosity index is included in the regression separately. It seems that
much of the negative relationship between religiosity and earnings is captured by the
indicator standing for the self-reported importance of religion to the respondent
(Importance of religion). And it is interesting to note that collective religious practice has
a positive sign. Two other regressions are reported in this table. In the third column the
results of a regression in which the weighted religiosity index in used are partially
reported. The negative coefficient of religiosity slightly increases in absolute value.
When this index is decomposed in the column (4) of this table the qualitative conclusions
remain the same as the column (2). However the coefficient on collective religious
practice loses its statistical significance.
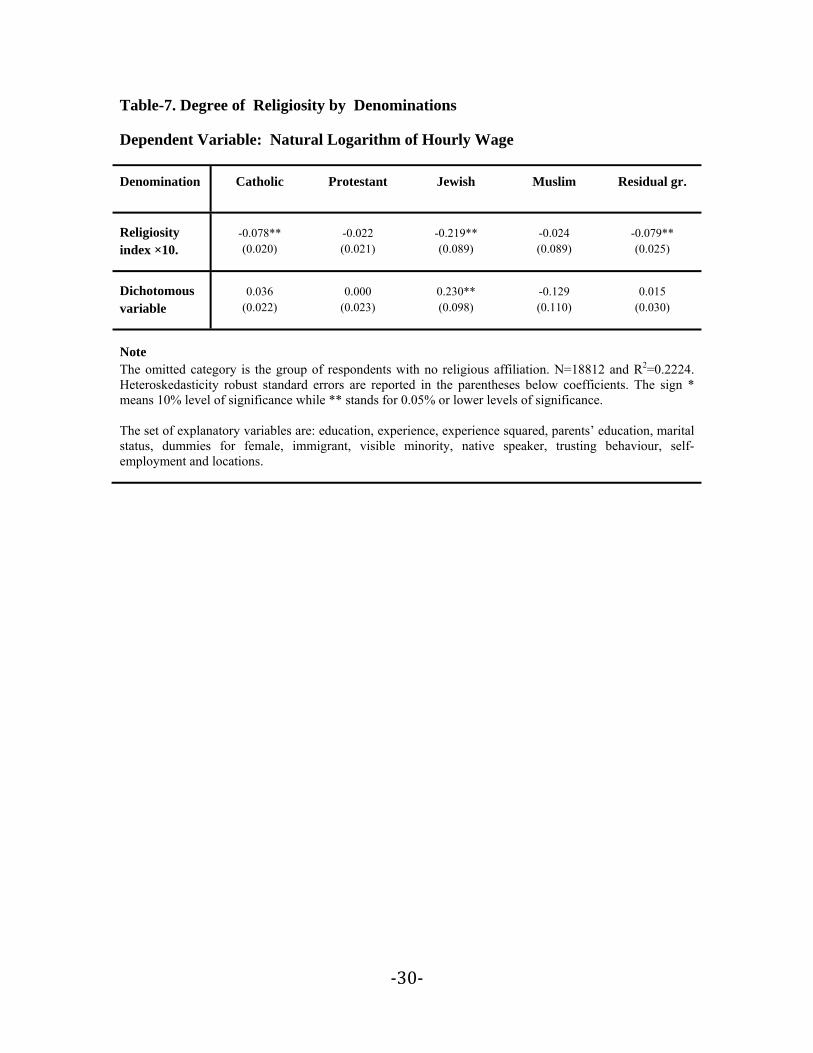
In Table-7 the results obtained by the estimation of the equation (2) are reported. Recall
that the equation (2) intends to relate the degree of religiosity to earnings by religious
denomination. This table’s results suggesting the absence of statistically significant
relationship between the degree of religiosity and some religious affiliations may be
caused by the high correlation between the dichotomous variable for these denominations
and the interaction terms set to measure the impact of the
degree of religiosity of denomination i.
‐15‐
These results are based on the assumption that the relationship between the degree of
religiosity (measured by various indicators: weighted and unweighted index and their
components) and earnings is monotonous. Chiswick and Huang (2006) found that the
impact of synagogue attendance is not monotonous in an equation for Jewish males’
earning in the United States. I tested such a hypothesis by using dummy variables for
each value of the religiosity indicators however the regressions did not lead to
statistically significant coefficients suggesting monotonically accounting for religiosity
indicators is more fruitful.
Turning to the question of the cross-religion differential in earnings regardless of degree
of religiosity the equation 3 and 4 must be estimated. The results reported in Table-8 are
based on the estimation of the equation 3. Through Table-8 it becomes clear that while
there is no statistically significant difference between the base group (respondents of no
religious affiliation) and Jews as well as Protestants, all else equal, Catholics fare slightly
and Muslims quite significantly worse than them. Muslims earn close to 15% less than
the reference group while Catholics earn around 4% less all else equal.
Table-9 summarises the results obtained by allowing the coefficients on human capital
variables (education, experience and experience squared) to vary with religious
affiliations. This estimation is based on the equation (4).
The results show that there is no significant difference in the return to education among
the religious groups under consideration. They contrast with Becker’s conjecture that the
high incomes and achievements of Jews are explained by high marginal returns to
education (1981). My results suggest that there is however a sizable statistically
significant difference between the return to experience of Jews and of Muslims with other
groups where the experience-earnings profile of Jews is steeper than other groups while
the experience factor turns out to have no economically and statistically significant
impact on the Muslims earnings.
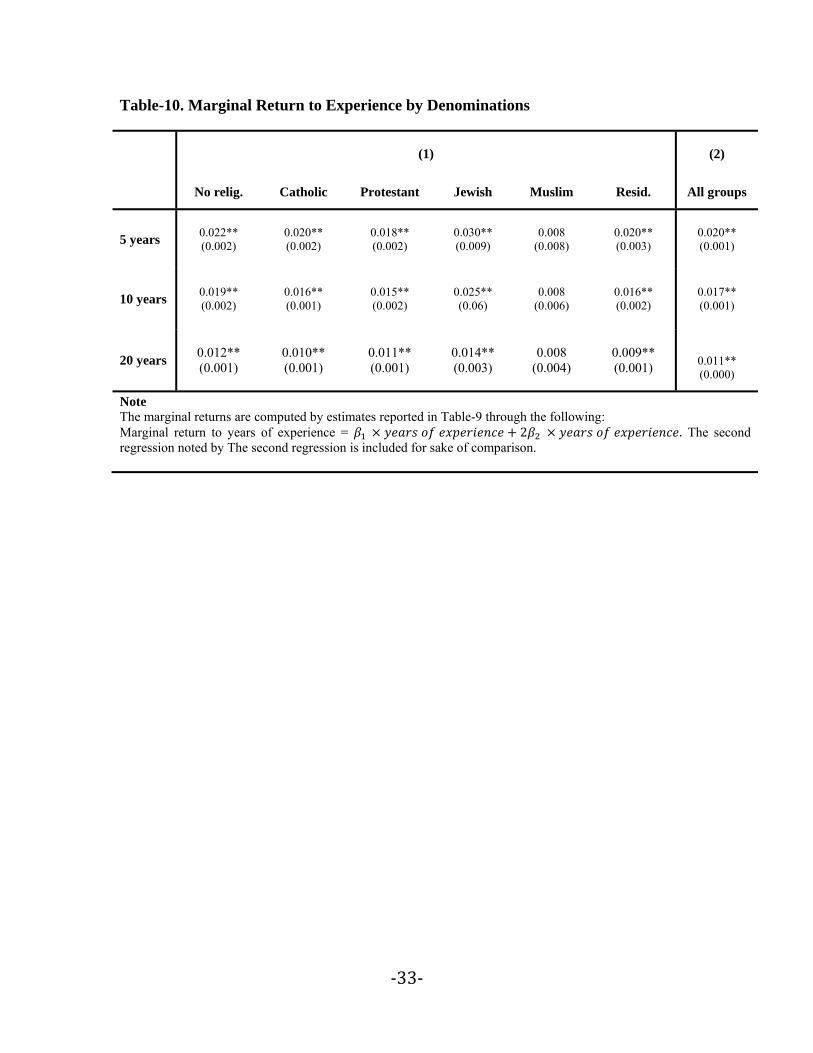
An illustration of the results presented in Table-9 is provided by Figure-1 and the
marginal return to experience for its three different levels (5, 10, 20 years) is computed
and reported in Table-10. The higher return to experience for Jews found in my study is

‐16‐
in conformity with previously published results for Canadian and American labour
market. However to my knowledge it is the first time Muslims are accounted for in such
study. With respect to the lack of return to experience for Muslims the fact that a high
proportion of Muslims are immigrants and given that the return to foreign experience is
practically zero in Canada may partially explain the result (Finnie and Meng, 2002). This
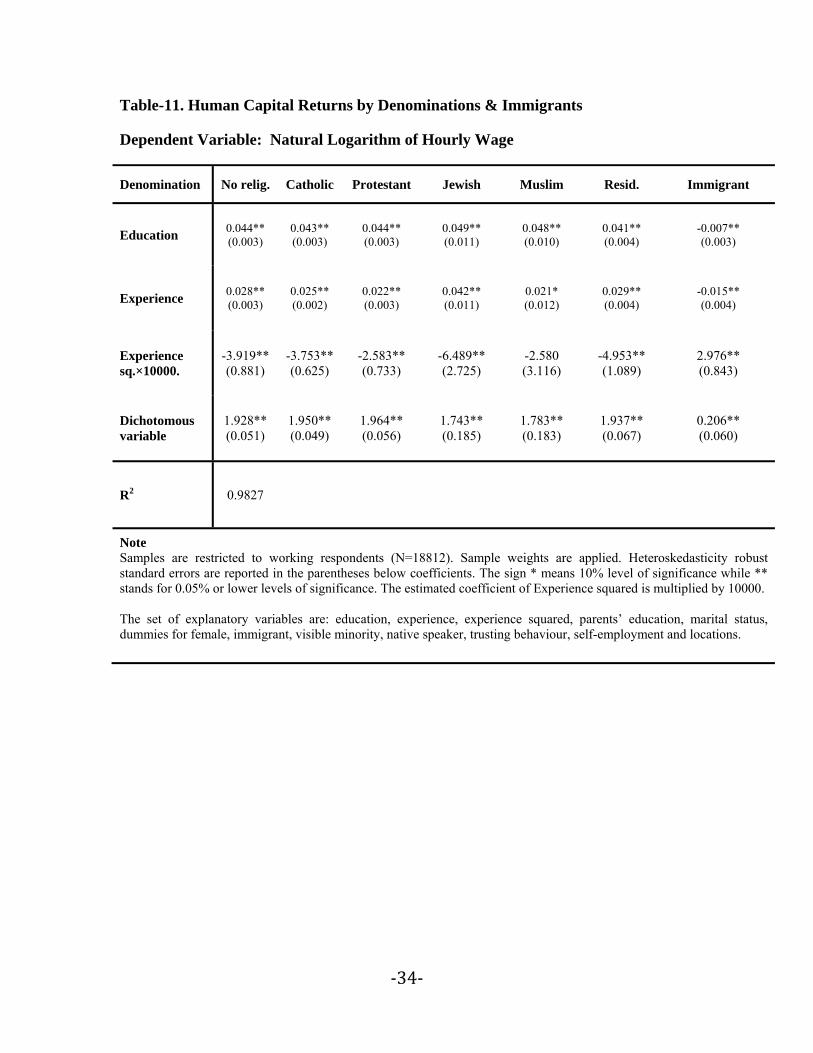
supposition is investigated by allowing the return to immigrant human capital variables to
differ from natives. The results are reported in Table-11 and Table-12 and Figure-2
illustrates these results. By allowing the return to immigrant experience to be different the
gap between Muslims and other groups appreciably lessens.
Finally Table-13 and Table-14 contain the results of Oaxaca-Blinder decomposition of
the wage differential among groups into the part related to discrepancies in explanatory
variables (endowment) and the part related to coefficients. The underlying model is the
one noted through the equation (5) and the base groups is the respondents of no religious
affiliation. The decomposition reported in the Table-13 is based on the estimation of an
augmented Mincer equation. It is found that the difference is negative for Jews and
Protestnat and Positive for the other groups. The relative importance of endowment is the
highest for Jews and the lowest for Muslims. The reverse is found with respect to
coefficients. Further decomposition of the relative contribution of explained and
unexplained part of the gap yields to the relevance of several variables.
The estimation behind the Oaxaca-Blinder decomposition reported in Table-14 is the
reduced from incorporating uniquely human capital variables (education, experience and
experience squared). The conclusions that one can draw from this table do not
qualitatively differ from the previous one. However the statistical significance of the
measures improves. Overall these tables suggest that there may exist some degrees of
discrimination in Canadian labour market against Muslims as a group. However this
differentiated treatment cannot be explained by the single cause of religious affiliation as
a variety of factors are simultaneously at work.
‐17‐
VI. Conclusion
Tomes said “The returns to research by economists on religion and earnings have been
small. One problem is that the lack of robust stylized facts leads to the rejection of most
simple hypotheses.” and the statement remains true after 25 years. Now that one should
mainly decide religion is still and may eventually remain an important aspect of human
culture it is legitimate to study its economic impact as systematically as other socio-
cultural factors such as race, ethnicity and gender. This paper was conceived to contribute
to the creation of stylised facts regarding the relationship between religions, religiosity
and labour market’s main indicators.
Using Canadian Ethnic Diversity Survey I examined the relationship between religions,
religiosity and earnings. With respect to the impact of overall religiosity on earnings the
relationship uncovered, although quantitatively slight, is negative. This result is in
contrast with common belief hold about the situation is the United States according to
which the relationship between religiosity and earnings is positive. Examining the cross-
denomination difference in earnings and human capital return the results show that there
are indeed statistically significant differences among religions.
For the first time in this paper I have explicitly accounted for Muslims along other
religious groups previously examined in Canadian context and the results show that their
earnings is significantly lower than average while Jews’ earnings are significantly higher.
More precisely I found the experience-earnings profile of Jew is steeper than others while
experience is not a relevant factor in explaining Muslims’ earnings.
An additional note might be in order with respect to Muslims’ earnings and from there
their economic state. As it is reported in Table-3 the average family size and number of
children are higher than average Canadian (average Muslim household size is 3.8 persons
against 3.0 persons as overall average). Taken together, the lower earnings and the larger
family size of Muslims make the affiliation to this religion a good predictor of economic
disadvantage in Canada. Also this paper’s results, through Table-13 and Table-14,
provide some evidences for the possibility of labour market discrimination against
Muslims in Canada.
‐18‐
This paper was a first step in updating and extending the knowledge of the relationship
between labour market outcomes and religion in Canada. This paper also showed how
Canadian pattern differ from the United States’ pattern in terms of the relationship
between earnings, educational attainment and religiosity. However the paper was largely
focused on uncovering descriptive relationships. Certainly future studies on the same
question using other data can help showing the robustness of the results. Moreover
various studies can be conceived aimed at explaining the eventual reasons behind the
relationships that I found in the present paper.
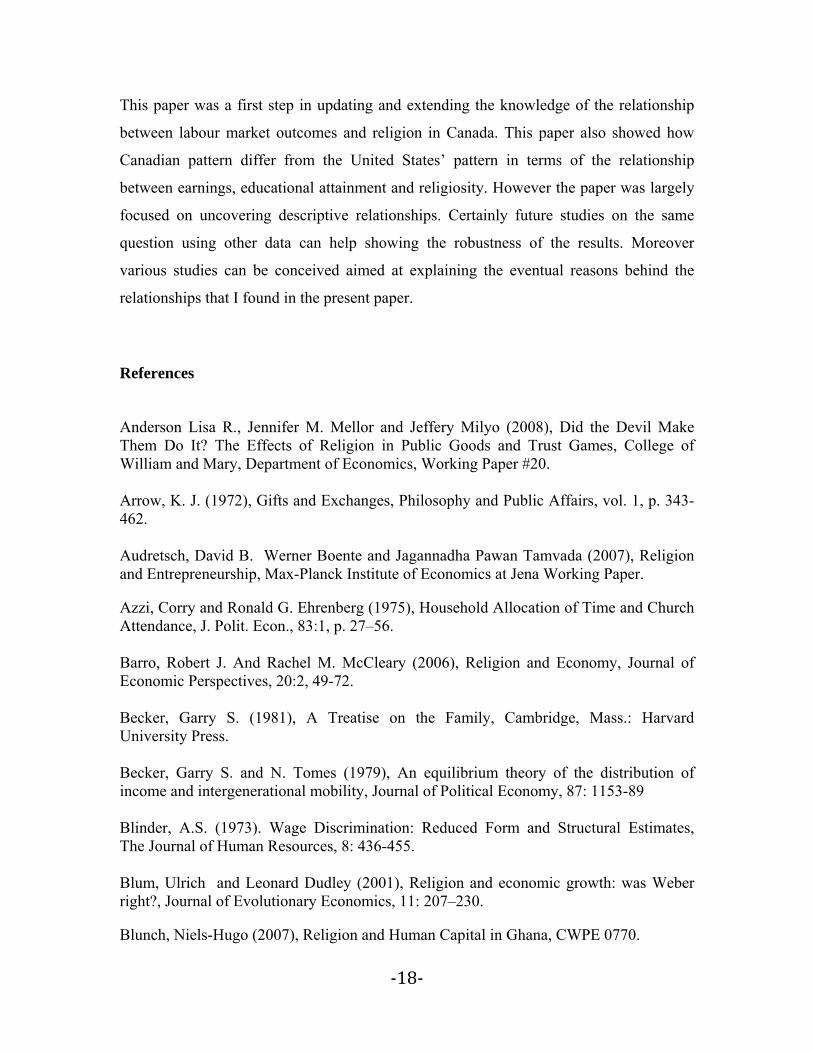
References Anderson Lisa R., Jennifer M. Mellor and Jeffery Milyo (2008), Did the Devil Make Them Do It? The Effects of Religion in Public Goods and Trust Games, College of William and Mary, Department of Economics, Working Paper #20. Arrow, K. J. (1972), Gifts and Exchanges, Philosophy and Public Affairs, vol. 1, p. 343-462. Audretsch, David B. Werner Boente and Jagannadha Pawan Tamvada (2007), Religion and Entrepreneurship, Max-Planck Institute of Economics at Jena Working Paper. Azzi, Corry and Ronald G. Ehrenberg (1975), Household Allocation of Time and Church Attendance, J. Polit. Econ., 83:1, p. 27–56. Barro, Robert J. And Rachel M. McCleary (2006), Religion and Economy, Journal of Economic Perspectives, 20:2, 49-72. Becker, Garry S. (1981), A Treatise on the Family, Cambridge, Mass.: Harvard University Press. Becker, Garry S. and N. Tomes (1979), An equilibrium theory of the distribution of income and intergenerational mobility, Journal of Political Economy, 87: 1153-89 Blinder, A.S. (1973). Wage Discrimination: Reduced Form and Structural Estimates, The Journal of Human Resources, 8: 436-455. Blum, Ulrich and Leonard Dudley (2001), Religion and economic growth: was Weber right?, Journal of Evolutionary Economics, 11: 207–230. Blunch, Niels-Hugo (2007), Religion and Human Capital in Ghana, CWPE 0770.

‐19‐
Boppart Timo, Josef Falkinger, Volker Grossmann, Ulrich Woitek and Gabriela Wüthrich (2008), Qualifying Religion: The Role of Plural Identities for Educational Production, Institute for Empirical Research in Economics University of Zurich, Working Paper Series, ISSN 1424-0459 Chiswick, Barry R. (1983), The Earnings and Human Capital of American Jews, J. Human Res., 18:3, p. 313–36. Chiswick, Barry R. (1985), The Labor Market Status of American Jews: Patterns and Determinants, American Jewish Yearbook, 85, p. 131–53. Chiswick Barry R. and Jidong Huang (2006), The Earnings of American Jewish Men: Human Capital, Denomination and Religiosity, IZA DP 2301. Durlauf Steven N., Andros Kourtellos and Chih Ming Tan (2006), Is God in the Details? A Re-examination of the Role of Religion in Economics Growth, Working Paper. Ehrenberg, Ronald G. (1977), Household Allocation of Time and Religiosity: Replication and Extension, J. Polit. Econ., 85:2, p. 415–23. Finnie R. and R. Meng (2002), Are Immigrants’ Human Capital Skills Discounted in Canada?,--- Glaeser E. L. And B. Sacerdote (2001), Education and Religion, Harvard Institute of Economic Research, Discussion Paper Number 1913. Guiso, Luigi, Paolo Sapienza and Luigi Zingales (2003), People’s Opium? Religion and Economic Attitudes, Journal of Monetary Economics, 50: 225–282. Iannaccone, Laurence R. (1998), Introduction to the Economics of Religion, Journal of Economic Literature, 36, p. 1465–1496. Inglehart, R. and P. Norris (2004), Sacred and Secular: Religion and Politics Worldwide, Cambridge University Press. Lehrer, Evelyn L. (2008), The Role of Religion in Economic and Demographic Behaviour in the United States: A Review of the Recent Literature, IZA DP No. 3541. Meng, R., and J. Sentance, (1984) Religion and the determination of earnings: further results, Canadian Journal of Economics, 17:3, p. 481-8. Mincer, J. (1974) Schooling, Experience and Earnings, New York: NBER. Moulton, B.R. (1990), An illustration of a pitfall in estimating the effects of aggregate variables on micro units, Review of Economics and Statistics, 72:334–338.
‐20‐
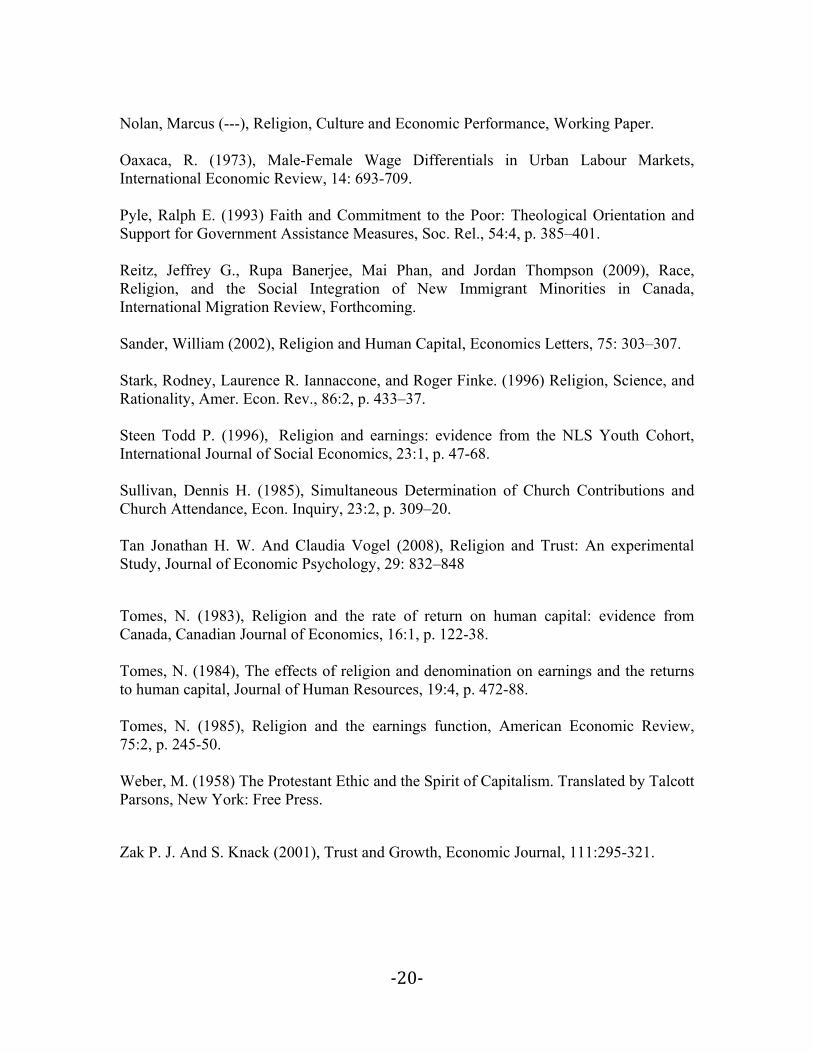
Nolan, Marcus (---), Religion, Culture and Economic Performance, Working Paper. Oaxaca, R. (1973), Male-Female Wage Differentials in Urban Labour Markets, International Economic Review, 14: 693-709. Pyle, Ralph E. (1993) Faith and Commitment to the Poor: Theological Orientation and Support for Government Assistance Measures, Soc. Rel., 54:4, p. 385–401. Reitz, Jeffrey G., Rupa Banerjee, Mai Phan, and Jordan Thompson (2009), Race, Religion, and the Social Integration of New Immigrant Minorities in Canada, International Migration Review, Forthcoming. Sander, William (2002), Religion and Human Capital, Economics Letters, 75: 303–307. Stark, Rodney, Laurence R. Iannaccone, and Roger Finke. (1996) Religion, Science, and Rationality, Amer. Econ. Rev., 86:2, p. 433–37. Steen Todd P. (1996), Religion and earnings: evidence from the NLS Youth Cohort, International Journal of Social Economics, 23:1, p. 47-68. Sullivan, Dennis H. (1985), Simultaneous Determination of Church Contributions and Church Attendance, Econ. Inquiry, 23:2, p. 309–20. Tan Jonathan H. W. And Claudia Vogel (2008), Religion and Trust: An experimental Study, Journal of Economic Psychology, 29: 832–848 Tomes, N. (1983), Religion and the rate of return on human capital: evidence from Canada, Canadian Journal of Economics, 16:1, p. 122-38. Tomes, N. (1984), The effects of religion and denomination on earnings and the returns to human capital, Journal of Human Resources, 19:4, p. 472-88. Tomes, N. (1985), Religion and the earnings function, American Economic Review, 75:2, p. 245-50. Weber, M. (1958) The Protestant Ethic and the Spirit of Capitalism. Translated by Talcott Parsons, New York: Free Press.
Zak P. J. And S. Knack (2001), Trust and Growth, Economic Journal, 111:295-321.

‐21‐
Appendix: Tables and Figures
Table-1. Definition of Variables
Variable Definition
Religiosity index
It is constructed as follows: Religiosity Index= Importance of religion (between 0 and 5) + Religious practice in group (between 0 and 5) + Individual religious practice (between 0 and 5).
Weighted religiosity index
It is constructed by summing the score of the importance of religion with the numbers obtained by modifying the degree of religious practice from their discrete categories to a number proportionate the yearly frequency of practice.
Importance of religion
The EDS question is framed as: “Using a scale of 1 to 5, where 1 is not important at all and 5 is very important, how important your religion to you is?” The coverage of this question is Respondents who reported having a religion. "Not applicable" includes respondents who did not report having a religion.
Religious practice in group
The EDS question is framed as: “In the past 12 months, how often did you participate in religious activities or attend religious services or meetings with other people, other than for events such as weddings and funerals?” Not applicable" includes respondents who did not report having a religion.
Individual religious practice
The EDS question is framed as: “In the past 12 months, how often did you do religious activities on your own? This may include prayer, meditation and other forms of worship taking place at home or in any other location.” Not applicable" includes respondents who did not report having a religion.
Non metropolitan area
Takes the value of 1 if the area of residence of the respondent is not a Census Metropolitan Area which is an area consisting of one or more adjacent municipalities situated around a major urban core. To form a census metropolitan area, the urban core must have a population of at least 100,000.
Trust
The EDS question is framed as: “Generally speaking, would you say that most people can be trusted or that you cannot be too careful in dealing with people?” The answers were binary.
Self employed
A dichotomous variable indicating the respondent being self-employed defined as the person who is 'self employed' earns an income directly from their own business, trade or profession, rather than being paid a specified salary or wage by an employer, EDS Guide, page. 288.
ln (wage) Natural logarithm of the respondents’ hourly wage.
ln(y) See ln(waye)
Education Years of schooling.
Mother’s educ. Mother’s education: Measured by years of schooling.
Father’s educ. Father’s education: Measured by years of schooling.

‐22‐
Continued: Table-1. Definition of Variables
Experience
Potential experience (in absence of any better measure) computed by age-years of education-6. The resulting number is truncated so that the potential experience is smaller or equal 40.
Experience Sq. Squared term of Experience
Immigrant
The information is extracted from the question Genstat3 which allowed me to identify individuals born outside Canada (first generation of immigrant) and individuals born inside Canada from parents born outside Canada (second generation of immigrants.
Visible minority
A dichotomous variable taking the value of 1 for visible minority as it is defined in the Employment Equity Act "persons, other than Aboriginal peoples, who are non-Caucasian in race or non-white in colour".
Non-native speaker A dichotomous variable taking the value of 1 for persons whose mother tongue (s) neither is (includes) French nor English.
No religious affiliation
No Religious Affiliation: It includes No religion, Agnostic, Atheist, Humanist, Personal Faith, Free Thinker, Spiritual and Other "not included elsewhere", EDS Guide, p. 87.
Catholic
It includes the following denomination: Roman Catholic, Ukrainian Catholic, Polish National Catholic Church, Other Catholic.
Protestant Anglican, Baptist, Jehovah's Witnesses, Lutheran, Mennonite, Pentecostal, Presbyterian, United Church, Other Protestant.
Residual group Other religions including Buddhism, Hinduism, Sikh, Other Eastern religions, Other Christian denominations such as Orthodox.
‐23‐
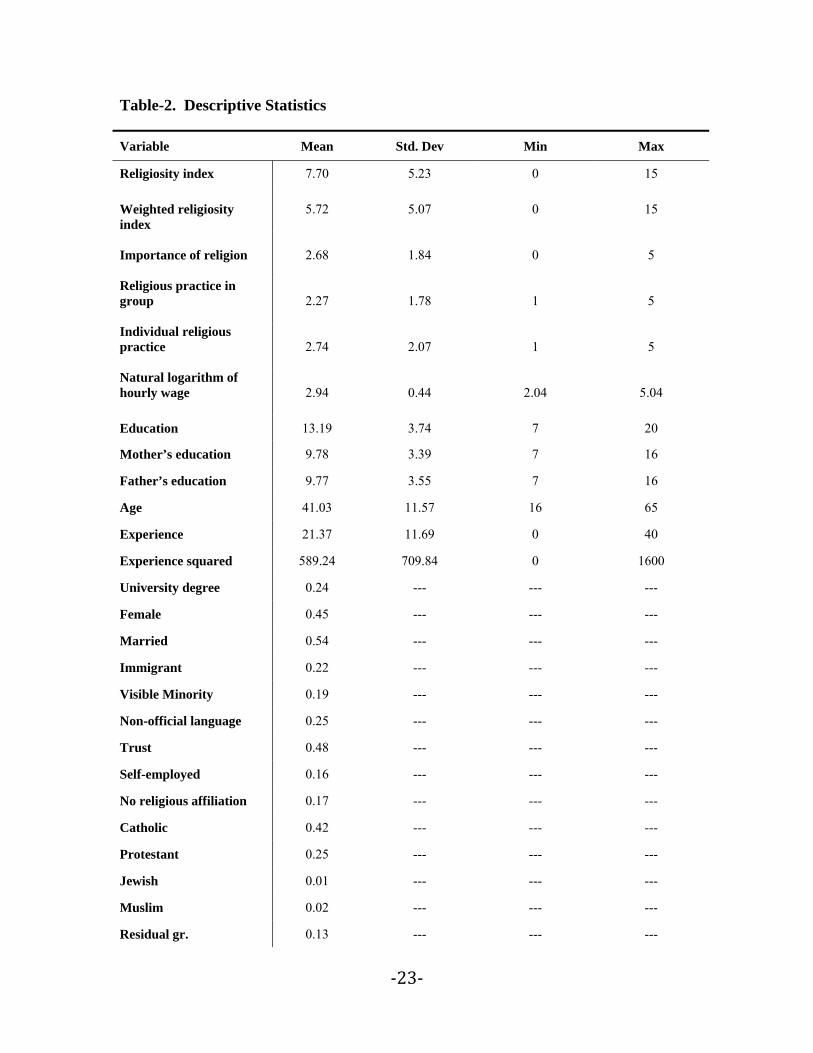
Table-2. Descriptive Statistics
Variable Mean Std. Dev Min Max
Religiosity index 7.70 5.23 0 15 Weighted religiosity index
5.72 5.07 0 15
Importance of religion
2.68 1.84 0 5
Religious practice in group
2.27 1.78 1 5
Individual religious practice
2.74 2.07 1 5
Natural logarithm of hourly wage
2.94 0.44 2.04 5.04
Education 13.19 3.74 7 20
Mother’s education 9.78 3.39 7 16
Father’s education 9.77 3.55 7 16
Age 41.03 11.57 16 65
Experience 21.37 11.69 0 40
Experience squared 589.24 709.84 0 1600
University degree 0.24 --- --- ---
Female 0.45 --- --- ---
Married 0.54 --- --- ---
Immigrant 0.22 --- --- ---
Visible Minority 0.19 --- --- ---
Non-official language 0.25 --- --- ---
Trust 0.48 --- --- ---
Self-employed 0.16 --- --- ---
No religious affiliation 0.17 --- --- ---
Catholic 0.42 --- --- ---
Protestant 0.25 --- --- ---
Jewish 0.01 --- --- ---
Muslim 0.02 --- --- ---
Residual gr. 0.13 --- --- ---
‐24‐
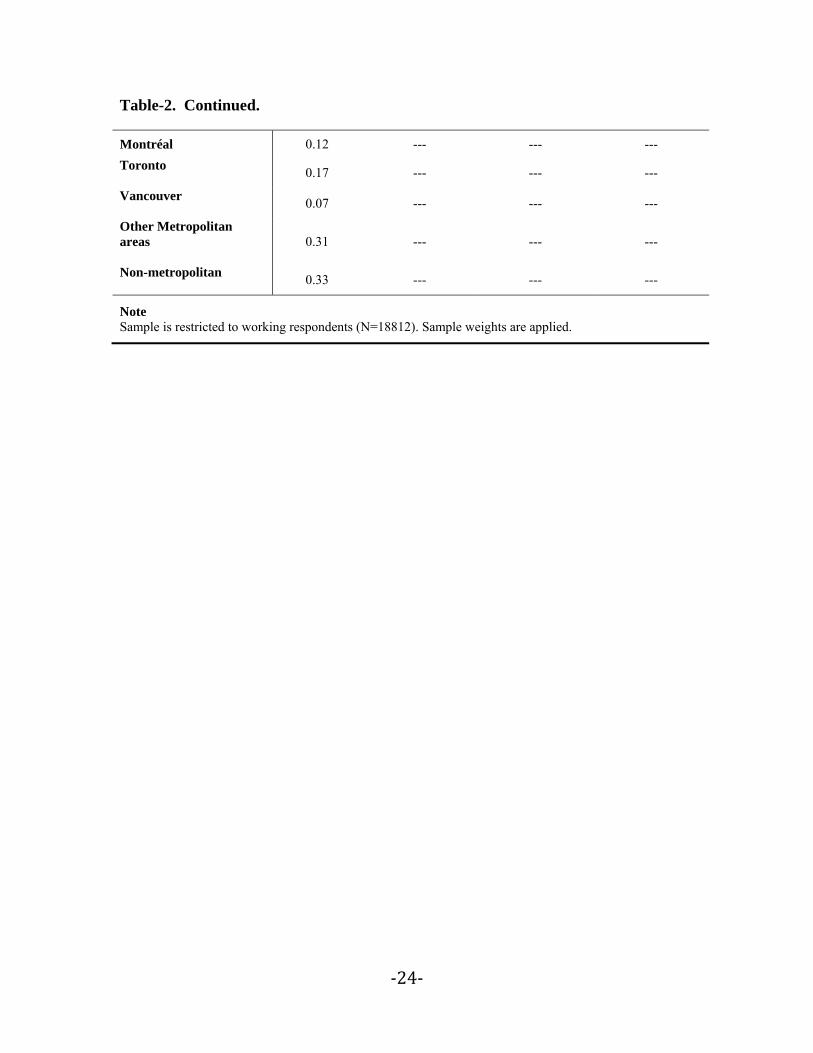
Table-2. Continued.
Montréal 0.12 --- --- --- Toronto 0.17 --- --- ---
Vancouver 0.07 --- --- ---
Other Metropolitan areas
0.31 --- --- ---
Non-metropolitan 0.33 --- --- ---
Note Sample is restricted to working respondents (N=18812). Sample weights are applied.

‐25‐
Table-3. Socio-demographics Indicators by Denominations
Religions Percentage Mean Age (Std. Dev.)
Number of Children (Std. Dev.)
Household Size (Std. Dev.)
No religious affiliation 17 38.71
(11.28) 0.70
(1.00) 2.78
(1.32)
Catholic 42 41.16 (11.12)
0.93 (1.07)
3.00 (1.30)
Protestant 25 43.33 (11.54)
0.95 (1.10)
2.97 (1.28)
Jewish 1 45.59 (12.85)
0.46 (0.89)
2.89 (1.39)
Muslim 2 38.87 (11.15)
1.44 (1.30)
3.79 (1.38)
Residual group 13 39.20 (12.35)
0.91 (1.08)
3.21 (1.42)
Sample 100 41.03 (11.57)
0.90 (1.08)
2.99 (1.33)
Note Sample is restricted to working respondents (N=18812). Sample weights are applied.
‐26‐
Table-4. Denominations, Earnings and Educational Attainment
Mean Annual earnings in Canadian dollars Human capital
General Male Female GR Educ. Degree
No relig. 44,108 47,768 37,502 1.27 13.6 26.2%
Catholic 41,001 45,731 35,276 1.30 13.2 22.3%
Protestant 44,059 49,903 37,058 1.35 13.2 21.3%
Jewish 52,124 59,451 43,339 1.37 15.4 51.4%
Muslim 37,008 40,326 30,479 1.32 14.5 42.9%
Residual group 40,774 45,558 33,738 1.35 12.4 24.3%
Sample 42,390 47,209 35,983 1.31 13.2 23.6%
Note Sample is restricted to working respondents (N=18812). Sample weights are applied. Education is in years. The column noted by Degree indicates the percentage of the respondents within the groups that has obtained a university degree. GR stands for Gender Ratio, the ratio of male to female earnings.
‐27‐
Table-5. Earnings Function Augmented by Religiosity Index
Dependent Variable: Natural Logarithm of Hourly Wage
Indep. Variables (1) (2) (3) (4) (5)
Religiosity index×10
-0.044** (0.009)
-0.046** (0.009)
-0.071** (0.001)
-0.053** (0.009)
-0.050** (0.009)
Education ----
0.036** (0.001)
0.047** (0.001)
0.048** (0.001)
0.042** (0.002)
Mother Educ. ----
----
----
----
0.004** (0.002)
Father Educ. ----
----
----
----
0.004** (0.001)
Experience ----
----
0.024** (0.001)
0.024** (0.001)
0.023** (0.002)
Experience
Sq×10000. ----
----
-3.143** (0.375)
-3.185** (0.347)
-2.987** (0.372)
Female ----
----
----
-0.123** (0.009)
-0.071** (0.014)
Married ----
----
----
----
0.143** (0.01)
Married fem. ----
----
----
----
-0.097** (0.018)
Immigrant ----
----
----
----
-0.045** (0.012)
Visible minority ----
----
----
----
-0.100** (0.014)
Non-Native Sp. ----
----
----
----
-0.035** (0.012)
Trust ----
----
----
----
0.038** (0.009)
Self-employed ----
----
----
----
-0.046** (0.015)
‐28‐
Table-5. Continued.
Montréal ----
----
----
----
-0.009 (0.015)
Toronto ----
----
----
----
0.095** (0.013)
Vancouver ----
----
----
----
0.038** (0.017)
Non metrop. ----
----
----
----
-0.067** (0.012)
Constant 2.977** (0.009)
2.485** (0.022)
2.034** (0.025)
2.081** (0.031)
2.018** (0.031)
R2 0.0026 0.0849 0.1632 0.1753 0.2203
Note Five regressions are reported in this Table. Number of observations is 18812 and sample weights are applied. Heteroskedasticity robust standard errors are reported in the parentheses below the coefficients. The sign * means 10% level of significance while ** stands for 0.05% or lower levels of significance. The estimated coefficients of Religiosity index and Experience squared are multiplied by 10 and 10000 respectively. The set of explanatory variables are: education, experience, experience squared, parents’ education, marital status, dummies for female, immigrant, visible minority, native speaker, trusting behaviour, self-employment and locations.
‐29‐
Table-6. Earnings Function Augmented by (Weighted) Religiosity Indicators
Dependent Variable: Natural Logarithm of Hourly Wage
Unweighted Weighted
Indep. Variables (1) (2) (3) (4)
Religiosity index×10.
-0.050** (0.009)
----
-0.058** (0.009)
----
Importance of religion×10.
---- -0.223** (0.051)
---- -0.012** (0.003)
Collective religious practice ×10.
---- 0.152** (0.046)
---- 0.016
(0.003)
Individual religious practice×10.
---- -0.069** (0.035)
---- -0.059** (0.025)
R2 0.2203 0.2225 0.2211 0.2218
Note Fours regressions are reported in the table. Number of observations is 18812 and sample weights are applied. Heteroskedasticity robust standard errors are reported in the parentheses below coefficients. The sign * means 10% level of significance while ** stands for 0.05% or lower levels of significance. The estimated coefficient of religiosity indicators are multiplied by 10. The set of explanatory variables are: education, experience, experience squared, parents’ education, marital status, dummies for female, immigrant, visible minority, native speaker, trusting behaviour, self-employment and locations. In the regressions noted by “Weighted” the frequency of religious practice both individually and in group is weighted so that the passage from one discrete category to the other maps to a proportionate yearly measure of religious practice.
‐30‐
Table-7. Degree of Religiosity by Denominations
Dependent Variable: Natural Logarithm of Hourly Wage
Denomination Catholic Protestant Jewish Muslim Residual gr.
Religiosity index ×10.
-0.078** (0.020)
-0.022 (0.021)
-0.219** (0.089)
-0.024 (0.089)
-0.079** (0.025)
Dichotomous variable
0.036 (0.022)
0.000 (0.023)
0.230** (0.098)
-0.129 (0.110)
0.015 (0.030)
Note The omitted category is the group of respondents with no religious affiliation. N=18812 and R2=0.2224. Heteroskedasticity robust standard errors are reported in the parentheses below coefficients. The sign * means 10% level of significance while ** stands for 0.05% or lower levels of significance. The set of explanatory variables are: education, experience, experience squared, parents’ education, marital status, dummies for female, immigrant, visible minority, native speaker, trusting behaviour, self-employment and locations.

‐31‐
Table-8. Earnings Function Augmented by Additive Terms for Denominations
Dependent Variable: Natural Logarithm of Hourly Wage
Denominations Catholic Protestant Jewish Muslim Resid.
Dichotomous variable
-0.039** (0.012)
-0.019 (0.013)
0.012 (0.034)
-0.145** (0.036)
-0.062** (0.015)
Note The omitted category is no religious affiliation. Sample weights are applied.. Number of observations is 18812 and R2 is equal 0.2197. Heteroskedasticity robust standard errors are reported in the parentheses below coefficients. The sign * means 10% level of significance while ** stands for 0.05% or lower levels of significance. The set of explanatory variables are: education, experience, experience squared, parents’ education, marital status, dummies for female, immigrant, visible minority, native speaker, trusting behaviour, self-employment and locations.

‐32‐
Table-9. Human Capital Returns by Denominations
Dependent Variable: Natural Logarithm of Hourly Wage
(1) (2)
Denomination No relig. Catholic Protestant Jewish Muslim Resid. All groups
Education 0.042** (0.002)
0.042** (0.003)
0.043** (0.003)
0.044** (0.011)
0.041** (0.010)
0.037** (0.004)
0.042** (0.002)
Experience 0.025** (0.003)
0.023** (0.002)
0.020** (0.003)
0.036** (0.012)
0.008 (0.011)
0.024** (0.004)
0.023** (0.002)
Experience sq. ×10000.
-3.387** (0.858)
-3.341** (0.593)
-2.240** (0.707)
-5.370* (2.800)
0.127 (3.025)
-3.887** (0.999)
-3.057** (0.372)
Dichotomous variable
1.976** (0.050)
1.989** (0.047)
1.995** (0.055)
1.858** (0.185)
2.007** (.176)
2.032** (0.062)
1.988** (0.031)
R2 0.9827 0.2173
Note Table contains two regressions. The second regression noted is included for sake of comparison. Samples are restricted to working respondents (N=18812). Sample weights are applied. Heteroskedasticity robust standard errors are reported in the parentheses below coefficients. The sign * means 10% level of significance while ** stands for 0.05% or lower levels of significance. The estimated coefficient of Experience squared is multiplied by 10000. The set of explanatory variables are: education, experience, experience squared, parents’ education, marital status, dummies for female, immigrant, visible minority, native speaker, trusting behaviour, self-employment and locations.
‐33‐
Table-10. Marginal Return to Experience by Denominations
(1) (2)
No relig. Catholic Protestant Jewish Muslim Resid. All groups
5 years 0.022** (0.002)
0.020** (0.002)
0.018** (0.002)
0.030** (0.009)
0.008 (0.008)
0.020** (0.003)
0.020** (0.001)
10 years 0.019** (0.002)
0.016** (0.001)
0.015** (0.002)
0.025** (0.06)
0.008 (0.006)
0.016** (0.002)
0.017** (0.001)
20 years 0.012** (0.001)
0.010** (0.001)
0.011** (0.001)
0.014** (0.003)
0.008 (0.004)
0.009** (0.001)
0.011** (0.000)
Note The marginal returns are computed by estimates reported in Table-9 through the following: Marginal return to years of experience = 2 . The second regression noted by The second regression is included for sake of comparison.
‐34‐
Table-11. Human Capital Returns by Denominations & Immigrants
Dependent Variable: Natural Logarithm of Hourly Wage
Denomination No relig. Catholic Protestant Jewish Muslim Resid. Immigrant
Education 0.044** (0.003)
0.043** (0.003)
0.044** (0.003)
0.049** (0.011)
0.048** (0.010)
0.041** (0.004)
-0.007** (0.003)
Experience 0.028** (0.003)
0.025** (0.002)
0.022** (0.003)
0.042** (0.011)
0.021* (0.012)
0.029** (0.004)
-0.015** (0.004)
Experience sq.×10000.
-3.919** (0.881)
-3.753** (0.625)
-2.583** (0.733)
-6.489** (2.725)
-2.580 (3.116)
-4.953** (1.089)
2.976** (0.843)
Dichotomous variable
1.928** (0.051)
1.950** (0.049)
1.964** (0.056)
1.743** (0.185)
1.783** (0.183)
1.937** (0.067)
0.206** (0.060)
R2 0.9827
Note Samples are restricted to working respondents (N=18812). Sample weights are applied. Heteroskedasticity robust standard errors are reported in the parentheses below coefficients. The sign * means 10% level of significance while ** stands for 0.05% or lower levels of significance. The estimated coefficient of Experience squared is multiplied by 10000. The set of explanatory variables are: education, experience, experience squared, parents’ education, marital status, dummies for female, immigrant, visible minority, native speaker, trusting behaviour, self-employment and locations.

‐35‐
Table-12. Marginal Return to Experience by Denominations
No relig. Catholic Protestant Jewish Muslim Resid. Immigrants
5 years 0.024** (0.002)
0.021** (0.002)
0.019** (0.002)
0.035** (0.009)
0.019** (0.009)
0.024** (0.003)
-0.012** (0.003)
10 years 0.020** (0.002)
0.018** (0.001)
0.016** (0.002)
0.029** (0.06)
0.016** (0.006)
0.019** (0.002)
-0.009** (0.002)
20 years 0.012** (0.001)
0.010** (0.001)
0.011** (0.001)
0.016** (0.003)
0.011** (0.004)
0.009** (0.001)
-0.003** (0.001)
Note The marginal returns are computed by estimates reported in Table-12 through the following: Marginal return to years of experience = 2 . The second regression noted by The second regression is included for sake of comparison.

‐36‐
Table-13. Oaxaca-Blinder Decomposition with Augmented Equation
Group Difference Endowment % Endow. Coefficient % Coeff.
Catholic 0.051** (0.013)
0.013* (0.007)
25** 0.038** (0.011)
75**
Protestant -0.008 (0.015)
-0.030** (0.008)
375** 0.022* (0.012)
-275*
Jew -0.186** (0.041)
-0.177** (0.025)
95** -0.010 (0.033)
5
Muslim 0.136** (0.038)
0.046* (0.025)
34** 0.090** (0.031)
66**
Residual gr. 0.072
(0.017) 0.019** (0.010)
26** 0.053** (0.014)
74**
Note: No religious affiliation is the base category. The underlying regressions have included the full set of human capital and socio-demographic variables.

‐37‐
Table-14. Oaxaca-Blinder Decomposition with Reduced Equation
Group Difference Endowment % Endow. Coefficient % Coeff.
Catholic 0.051** (0.013)
-0.010* (0.006)
-20** 0.061** (0.011)
120**
Protestant -0.009 (0.014)
-0.033** (0.007)
366** 0.024* (0.032)
-266*
Jew -0.186** (0.040)
-0.144** (0.019)
77** -0.042 (0.036)
23
Muslim 0.138** (0.038)
-0.060* (0.016)
-43** 0.198** (0.035)
143**
Residual gr. 0.074** (0.017)
-0.014** (0.007)
-18** 0.087** (0.015)
118**
Note: No religious affiliation is the base category. The underlying regressions have included only human capital variables Education, Experience and Experience Squared along a constant.

‐38‐
Figure-1. Return to Years of Experience by Denomination: All Sample
Legend
NRA Thin Solid
Catholic Thick Solid
Protestant Thin Dash
Jew Thick Dash
Muslim Empty Dots
Residual Filled Dots
Note The graph is based on the estimation reported in Table-9.
5 10 15 20 25 30 35 40
-0.1
0.0
0.1
0.2
0.3
0.4
0.5
0.6
Experience (yrs)
ln(y)

‐39‐
Figure-2. Return to Years of Experience by Denomination: Natives
Legend
NRA Thin Solid
Catholic Thick Solid
Protestant Thin Dash
Jew Thick Dash
Muslim Empty Dots
Residual Filled Dots
Note The graph is based on the estimation reported in Table-11
5 10 15 20 25 30 35 40
-0.1
0.0
0.1
0.2
0.3
0.4
0.5
0.6
0.7
Experience (yrs)
ln(y)
![Z8, Z10, Z12 Series · z8 series hydraulic performance range z10, z12 series hydraulic performance range q [m3 03830_b_ch 30 40 50 60 70 80 90 100 /h] 200 300 400 500 600 h [m] 4](https://img.pdfslide.net/doc/110x75/5e71cb5a3dff311faa12a318/z8-z10-z12-series-z8-series-hydraulic-performance-range-z10-z12-series-hydraulic.jpg)


![Z8, Z10, Z12 Series - xylem.com · z8 series hydraulic performance range z10, z12 series hydraulic performance range q [m3 03830_b_ch 30 40 50 60 70 80 90 100 /h] 200 300 400 500](https://img.pdfslide.net/doc/110x75/5ce6598a88c993812f8c4d53/z8-z10-z12-series-xylemcom-z8-series-hydraulic-performance-range-z10-z12.jpg)