Embed Size (px)
Citation preview
Preliminary Bulkhead and Shoreline Assessment Report Remedial Design – Lower 8.3 Miles of the Lower Passaic River Operable Unit Two of the Diamond Alkali Superfund Site In and About Essex, Hudson, Bergen and Passaic Counties – New Jersey
May 2019 Revision 2
LPROU2-19-5.06_01-004
LPROU2-PDI_PBSAR_Rev 2_2019-05-20_CLEAN.docx
Preliminary Bulkhead and Shoreline Assessment Report Remedial Design – Lower 8.3 Miles of the Lower Passaic River Operable Unit Two of the Diamond Alkali Superfund Site In and About Essex, Hudson, Bergen and Passaic Counties – New Jersey
May 2019 Revision 2 LPROU2-19-5.06_01-004
PREPARED ON BEHALF OF PREPARED BY
Settling Party Supervising Contractor Glenn Springs Holdings, Inc. A Subsidiary of Occidental Petroleum 5 Greenway Plaza, Suite 110 Houston, TX 77046
Tetra Tech Inc. 6 Century Drive, 3rd Floor Parsippany, NJ 07054
P +1-973-630-8000 F +1-973-630-8165 tetratech.com
Lower 8.3 Miles of the Lower Passaic River Preliminary Bulkhead and Shoreline OU 2 of the Diamond Alkali Superfund Site Assessment Report
Revision 2, May 2019
LPROU2-PDI_PBSAR_Rev 2_2019-05-20_CLEAN.docx
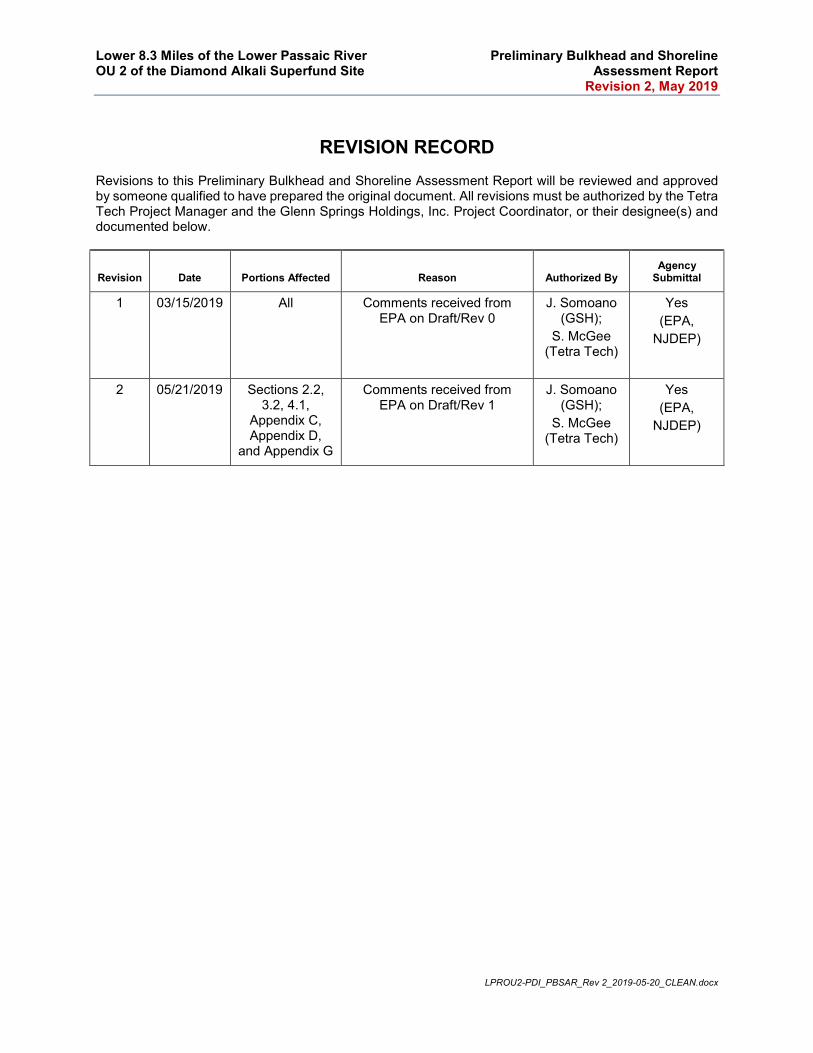
REVISION RECORD Revisions to this Preliminary Bulkhead and Shoreline Assessment Report will be reviewed and approved by someone qualified to have prepared the original document. All revisions must be authorized by the Tetra Tech Project Manager and the Glenn Springs Holdings, Inc. Project Coordinator, or their designee(s) and documented below.
Revision Date Portions Affected Reason Authorized By Agency
Submittal
1 03/15/2019 All Comments received from EPA on Draft/Rev 0
J. Somoano(GSH);
S. McGee(Tetra Tech)
Yes (EPA,
NJDEP)
2 05/21/2019 Sections 2.2, 3.2, 4.1,
Appendix C, Appendix D,
and Appendix G
Comments received from EPA on Draft/Rev 1
J. Somoano(GSH);
S. McGee(Tetra Tech)
Yes (EPA,
NJDEP)
Lower 8.3 Miles of the Lower Passaic River Preliminary Bulkhead and Shoreline OU 2 of the Diamond Alkali Superfund Site Assessment Report Revision 2, May 2019
i LPROU2-PDI_PBSAR_Rev 2_2019-05-20_CLEAN.docx
TABLE OF CONTENTS 1 INTRODUCTION ................................................................................................................................. 1-1
1.1 PROJECT BACKGROUND AND SETTING ........................................................................... 1-1 1.2 PURPOSE AND ORGANIZATION ......................................................................................... 1-2
2 PRELIMINARY DESKTOP EVALUATION AND FIELD RECONNAISSANCE ................................... 2-1 2.1 DATABASE SETUP FOR STRUCTURES .............................................................................. 2-1
2.1.1 Sources ................................................................................................................... 2-1 2.1.2 Nomenclature .......................................................................................................... 2-1 2.1.3 Management ........................................................................................................... 2-1
2.2 PRELIMINARY DESKTOP EVALUATION.............................................................................. 2-2 2.2.1 Pre-Existing Information .......................................................................................... 2-2 2.2.2 Topographic and Bathymetric Information .............................................................. 2-2 2.2.3 Geotechnical ........................................................................................................... 2-3 2.2.4 Owner Provided ...................................................................................................... 2-3 2.2.5 Data Gaps ............................................................................................................... 2-4
2.3 FIELD RECONNAISSANCE METHODS ................................................................................ 2-4 2.3.1 Marine Reconnaissance ......................................................................................... 2-5 2.3.2 Upland Reconnaissance ......................................................................................... 2-5
2.4 DEVIATIONS FROM THE WORK PLAN ................................................................................ 2-6 3 SUMMARY OF STRUCTURAL OBSERVATION DATA ..................................................................... 3-1
3.1 STRUCTURE IDENTIFICATION AND LOCATION ................................................................ 3-1 3.2 STRUCTURE CONDITIONS .................................................................................................. 3-1
3.2.1 Failing or Failed Structures ..................................................................................... 3-2 3.2.2 Active Mooring Structures ....................................................................................... 3-2 3.2.3 Bridges .................................................................................................................... 3-7 3.2.4 Bulkhead Walls ....................................................................................................... 3-8 3.2.5 Outfalls .................................................................................................................... 3-8 3.2.6 Miscellaneous Structures ........................................................................................ 3-8 3.2.7 Shorelines ............................................................................................................... 3-8
4 EVALUATION OF ZONE OF INFLUENCE ......................................................................................... 4-1 4.1 METHODS .............................................................................................................................. 4-1
4.1.1 Effect of Condition ................................................................................................... 4-1 4.2 SHEET AND SOLDIER PILE WALLS ..................................................................................... 4-1 4.3 GRAVITY WALLS ................................................................................................................... 4-2 4.4 OUTFALLS .............................................................................................................................. 4-2 4.5 SHORELINE AREAS .............................................................................................................. 4-3 4.6 RESULTS ................................................................................................................................ 4-3
5 RECOMMENDATIONS FOR FURTHER ASSESSMENT................................................................... 5-1 6 REFERENCES .................................................................................................................................... 6-1
Lower 8.3 Miles of the Lower Passaic River Preliminary Bulkhead and Shoreline OU 2 of the Diamond Alkali Superfund Site Assessment Report Revision 2, May 2019
ii LPROU2-PDI_PBSAR_Rev 2_2019-05-20_CLEAN.docx
LIST OF TABLES Table 2-1 Available Geotechnical Data Reviewed Table 2-2 Owner Provided Structure Data (Current as of November 6, 2018) Table 2-3 Structure Type Codes and Naming Designations Table 2-4 Data Collected by Structure Type Table 2-5 Future Development Plans Table 3-1 Structures Identified Table 3-2 Failed Structures Table 3-3 Summary of Mooring Structures Table 3-4 Lower Passaic River Datum Conversions Table 3-5 Identified Bridges Table 3-6 Summary of Bulkhead Structures (East) Table 3-7 Summary of Bulkhead Structures (West) Table 3-8 Wall Height Categories Table 3-9 Damage Categories Table 3-10 Slope Categories Table 3-11 Feasibility Characterization Table 3-12 Summary of Outfalls Table 3-13 Summary of Miscellaneous Structures Table 4-1 Summary of Steep Slopes Potentially Impacted by Dredging Table 4-2 OU2 Structure and Shoreline Type Distribution
LIST OF FIGURES Figure 1-1 OU 2 Location and Vicinity Map Figure 2-1 Comparison of Current and Historic Shorelines from Aerial and Sanborn Mapping Figure 3-1 Shell Oil Delancy Street Terminal - Dredge Boundary to EL -23’ NAVD88 based on
the Survey Provided by Shell Oil Company Figure 3-2 Center Point Terminal – Dredge Boundary to -24.7 feet NAVD88 based on the
Fathometric Survey Map provided by Center Point Figure 3-3 PVSC Location Plan (Structures M-0.33-W, P-0.34-W, M-0.35-W, C-0.35-W, W-
0.34-W) Figure 3-4 Dredge Limit based on the Fathometric Survey Map provided by PVSC Figure 3-5 Darling International (Structures W-0.50-W, P-0.52-W) with Navigation Channel Figure 3-6 Sunoco Logistics (Structures M-0.64-W, M-0.65-W, W-0.73-W, P-0.79-W) and
Estimated Dredge Limit Figure 3-7 Gotham Aggregate 1 (Structure M-0.84-W) Estimated Historic Dredge Limit Figure 3-8 George Harms Construction (Structure P-1.32-W) Estimated Historic Dredge Limit Figure 3-9 EIC Location (Structures and P-1.47-W) Estimated Dredge Limit Figure 3-10 Gotham Aggregates 2 (Structures W-1.75-W and P-1.79-W) Estimated Historic
Dredging Limit Figure 3-11 Clean Earth Facility (Structures H-2.28-E and W-2.28-E) Location Figure 4-1 Illustration of Slope Dimensions Figure 4-2 Influence Zone for Cantilevered Bulkheads Figure 4-3 Influence Zone for Anchored Bulkheads Figure 4-4 Influence Zone for Gravity Walls
Lower 8.3 Miles of the Lower Passaic River Preliminary Bulkhead and Shoreline OU 2 of the Diamond Alkali Superfund Site Assessment Report Revision 2, May 2019
iii LPROU2-PDI_PBSAR_Rev 2_2019-05-20_CLEAN.docx
Figure 4-5 Histogram of Wall Influence Zones Figure 4-6 Bar Chart for East Bank Structure Influence Zones Figure 4-7 Bar Chart for West Bank Structure Influence Zones Figure 4-8 Cumulative Area of Wall Influence Zones
LIST OF APPENDICES Appendix A Sources of Bulkhead and Shoreline Data
Appendix B Owner-Provided Structure Information
Appendix C Structure Data Tables − C.1 - Structure Naming Convention − C.2 - Bulkhead Structure Data Table − C.3 - Outfall Structure Data Table − C.4 - Mooring, Pier and Wharf Structure Data Table − C.5 - Bridge Structure Data Table − C.6 - Miscellaneous Structure Data Table − C.7 - Shoreline Data Table
Appendix D Structure Maps − D.1 - Key Map − D.2 - Identified Structures Map − D.3 - Bulkhead Structures Map − D.4 - Outfall Structures Map − D.5 - Mooring, Pier, Wharf, Bridge and Miscellaneous Structures Map − D.6 - Shoreline Map − D.7 - Failed Structures Map − D.8 - Active Mooring Structures Map
Appendix E Structure Photograph Log
Appendix F Bridge LiDAR and Photo Images − F.1 - Railroad Amtrak Dock Street Bridge, RM 4.97 − F.2 - Bridge Street Bridge, RM 5.66 − F.3 - Central New Jersey Railroad Bridge, RM 1.14 − F.4 - Clay Street Bridge, RM 6.06 − F.5 - Erie/Montclair Greenwood Lake, RM 8.07 − F.6 - Fourth Ave. Conrail Railroad Bridge, RM 6.30 − F.7 - Interstate 280 Bridge, RM 5.85 − F.8 - Jackson Street Bridge, RM 4.60 − F.9 - Lincoln Highway Bridge, RM 1.81 − F.10 - Morristown Line Railroad Bridge, RM 5.81 − F.11 - New Jersey Turnpike, RM 2.62/2.65 − F.12 - Point No Point Conrail Bridge, RM 2.56 − F.13 - Pulaski Skyway, RM 2.00
Appendix G Calculated Zones of Influence − G.1 - Table of Calculated Zones of Influence for Bulkhead Walls − G.2 - Influence Zones for Bulkheads Map
Lower 8.3 Miles of the Lower Passaic River Preliminary Bulkhead and Shoreline OU 2 of the Diamond Alkali Superfund Site Assessment Report Revision 2, May 2019
iv LPROU2-PDI_PBSAR_Rev 2_2019-05-20_CLEAN.docx
ACRONYMS / ABBREVIATIONS
Acronyms/Abbreviations Definition APPROX Approximately
BODR Basis of Design Report
BSE WP Bulkhead and Shoreline Evaluation Work Plan
COC contaminant of concern
DDT dichlorodiphenyltrichloroethane
E Bank on Harrison/Kearny side of the Passaic River is referred to as “east bank” and is abbreviated as “E”
EPA U.S. Environmental Protection Agency
FT feet
GBSD geophysical, bathymetry, shoreline and debris
GDR Geotechnical Data Report
GIS Geographic Information System
GPR ground-penetrating radar
GPS Global Positioning System
GSH Glenn Springs Holdings, Inc.
HDPE High Density Polyethylene
IN inches
INV invert
IRREG irregular
LiDAR Light Detection and Ranging
LPR Lower Passaic River
MAX maximum
MIN minimum
MLLW mean lower low water
MLW mean low water
NAVD88 North American Vertical Datum of 1988
NGVD29 National Geodetic Vertical Datum of 1929
NJDEP New Jersey Department of Environmental Protection
NJDOT New Jersey Department of Transportation
NJTP New Jersey Turnpike
NOAA National Oceanic and Atmospheric Administration
NRCS Natural Resources Conservation Service
OC On Center
OCC Occidental Chemical Corporation
OD outside diameter
Lower 8.3 Miles of the Lower Passaic River Preliminary Bulkhead and Shoreline OU 2 of the Diamond Alkali Superfund Site Assessment Report Revision 2, May 2019
v LPROU2-PDI_PBSAR_Rev 2_2019-05-20_CLEAN.docx
Acronyms/Abbreviations Definition
OU 2 Operable Unit 2 (the lower 8.3 miles of the Lower Passaic River); the Project
PBSAR Preliminary Bulkhead and Shoreline Assessment Report
PCB polychlorinated biphenyl
PDI Pre-Design Investigation
PDI ER Pre-Design Investigation Evaluation Report
Project Lower 8.3 miles of the Lower Passaic River (Operable Unit Two) of the Diamond Alkali Superfund Site located in and about Essex, Hudson, Bergen, and Passaic Counties, New Jersey
PVC polyvinyl chloride
PVSC Passaic Valley Sewerage Commission
QAPP Quality Assurance Project Plan
RA Remedial Action
RD Remedial Design
RDWP Remedial Design Work Plan
RM River Mile
ROD Record of Decision
Settlement Agreement Administrative Settlement Agreement and Order on Consent for Remedial Design
SOW Statement of Work
UFP-QAPP Uniform Federal Policy-Quality Assurance Project Plan
SPT Standard Penetration Test
USACE U.S. Army Corps of Engineers
USCS Unified Soil Classification System
USGS United States Geological Survey
W Bank on the Newark side of the Passaic River is referred to as the “west bank” and is abbreviated as ‘W’
WP Work Plan
Lower 8.3 Miles of the Lower Passaic River Preliminary Bulkhead and Shoreline OU 2 of the Diamond Alkali Superfund Site Assessment Report Revision 2, May 2019
1-1 LPROU2-PDI_PBSAR_Rev 2_2019-05-20_CLEAN.docx
1 INTRODUCTION
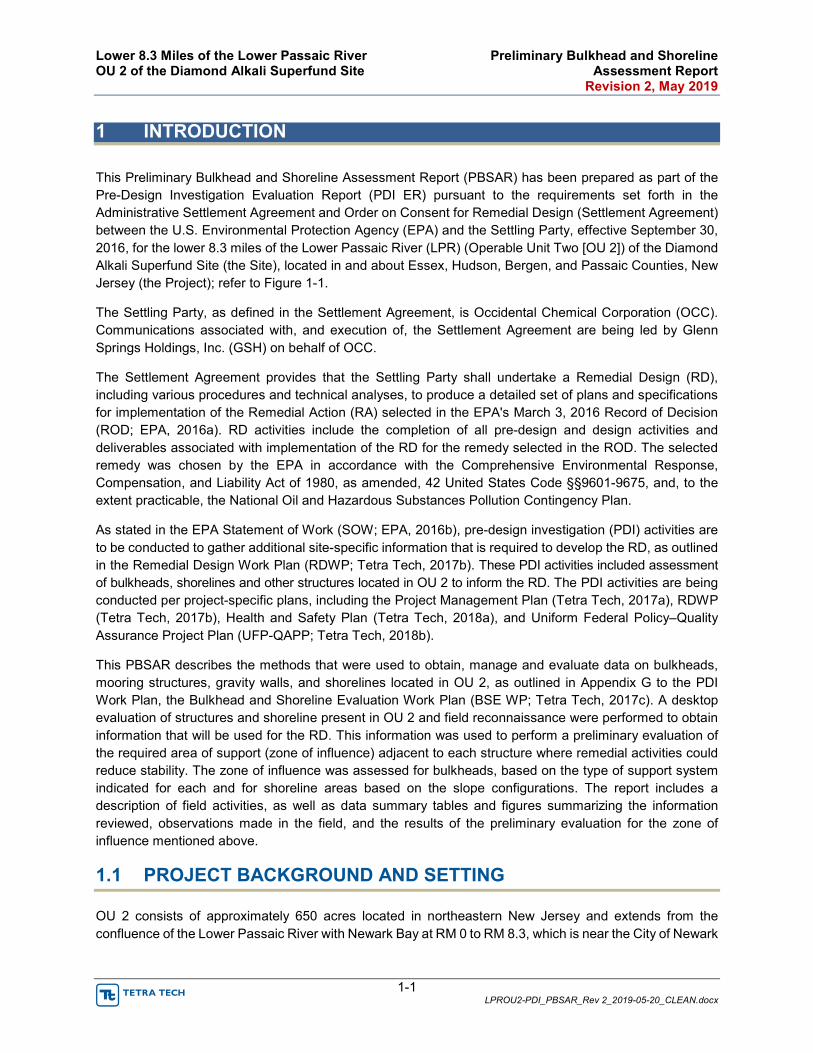
This Preliminary Bulkhead and Shoreline Assessment Report (PBSAR) has been prepared as part of the Pre-Design Investigation Evaluation Report (PDI ER) pursuant to the requirements set forth in the Administrative Settlement Agreement and Order on Consent for Remedial Design (Settlement Agreement) between the U.S. Environmental Protection Agency (EPA) and the Settling Party, effective September 30, 2016, for the lower 8.3 miles of the Lower Passaic River (LPR) (Operable Unit Two [OU 2]) of the Diamond Alkali Superfund Site (the Site), located in and about Essex, Hudson, Bergen, and Passaic Counties, New Jersey (the Project); refer to Figure 1-1.
The Settling Party, as defined in the Settlement Agreement, is Occidental Chemical Corporation (OCC). Communications associated with, and execution of, the Settlement Agreement are being led by Glenn Springs Holdings, Inc. (GSH) on behalf of OCC.
The Settlement Agreement provides that the Settling Party shall undertake a Remedial Design (RD), including various procedures and technical analyses, to produce a detailed set of plans and specifications for implementation of the Remedial Action (RA) selected in the EPA's March 3, 2016 Record of Decision (ROD; EPA, 2016a). RD activities include the completion of all pre-design and design activities and deliverables associated with implementation of the RD for the remedy selected in the ROD. The selected remedy was chosen by the EPA in accordance with the Comprehensive Environmental Response, Compensation, and Liability Act of 1980, as amended, 42 United States Code §§9601-9675, and, to the extent practicable, the National Oil and Hazardous Substances Pollution Contingency Plan.
As stated in the EPA Statement of Work (SOW; EPA, 2016b), pre-design investigation (PDI) activities are to be conducted to gather additional site-specific information that is required to develop the RD, as outlined in the Remedial Design Work Plan (RDWP; Tetra Tech, 2017b). These PDI activities included assessment of bulkheads, shorelines and other structures located in OU 2 to inform the RD. The PDI activities are being conducted per project-specific plans, including the Project Management Plan (Tetra Tech, 2017a), RDWP (Tetra Tech, 2017b), Health and Safety Plan (Tetra Tech, 2018a), and Uniform Federal Policy–Quality Assurance Project Plan (UFP-QAPP; Tetra Tech, 2018b).
This PBSAR describes the methods that were used to obtain, manage and evaluate data on bulkheads, mooring structures, gravity walls, and shorelines located in OU 2, as outlined in Appendix G to the PDI Work Plan, the Bulkhead and Shoreline Evaluation Work Plan (BSE WP; Tetra Tech, 2017c). A desktop evaluation of structures and shoreline present in OU 2 and field reconnaissance were performed to obtain information that will be used for the RD. This information was used to perform a preliminary evaluation of the required area of support (zone of influence) adjacent to each structure where remedial activities could reduce stability. The zone of influence was assessed for bulkheads, based on the type of support system indicated for each and for shoreline areas based on the slope configurations. The report includes a description of field activities, as well as data summary tables and figures summarizing the information reviewed, observations made in the field, and the results of the preliminary evaluation for the zone of influence mentioned above.
1.1 PROJECT BACKGROUND AND SETTING
OU 2 consists of approximately 650 acres located in northeastern New Jersey and extends from the confluence of the Lower Passaic River with Newark Bay at RM 0 to RM 8.3, which is near the City of Newark
Lower 8.3 Miles of the Lower Passaic River Preliminary Bulkhead and Shoreline OU 2 of the Diamond Alkali Superfund Site Assessment Report Revision 2, May 2019
1-2 LPROU2-PDI_PBSAR_Rev 2_2019-05-20_CLEAN.docx
and Belleville Township border. It is located in a highly developed urban area with a population of approximately 1.4 million, with Essex County to the west and Hudson County to the east. The land uses around Newark Bay (RM 0), at the mouth of the river, are primarily commercial and industrial. At RM 4, residential and recreational uses are present as well, resulting in mixed usage. Near RM 7, park land, suburban neighborhoods, and one boat launch are present. Approximately 95 percent of the OU 2 shoreline area is comprised of bulkheads or riprap hardened shorelines, while the remaining 5 percent consists of aquatic vegetation. Mudflats are present in OU 2, and provide potential habitat for fish, aquatic organisms, blue crab, and waterfowl.
The Site includes a federally authorized navigation channel, constructed in the 1880s, that originally extended from RM 0 to RM 8.1. It was subsequently expanded to RM 15.4, with depths of 30 feet below mean lower low water (MLLW) from RM 0 to RM 2.6, 20 feet below MLLW from RM 2.6 to RM 4.6, 16 feet below MLLW from RM 4.6 to RM 8.1, and 10 feet below MLLW from RM 8.1 to RM 15.4. The channel was maintained by the United States Army Corps of Engineers (USACE) through the 1950s. The channel below RM 1.9 was maintained until 1983. As the channel maintenance declined and later stopped, the channel filled with sediments. Industrial and municipal discharges during this period included chemical loading coincident with the sediment accumulation.
In 2018, the navigation channel upstream from RM 1.7 was de-authorized. The ROD identifies that in this section of OU2, a recreational channel will be established with a depth of 10 feet below Mean Low Water (MLW) and a width of 200 feet from RM 1.7 to RM 8.1 and 150 feet from RM 8.1 to RM 8.3, per the ROD.
The cross-sectional area of OU 2 decreases from RM 0 to RM 8.3, with a constriction at RM 8.3 caused by a large rocky deposit at the mouth of the Second River. Between RM 8.3 and RM8.1, the river is primarily coarse material and flow velocities are elevated this section. Development of the Lower Passaic River shoreline dates back more than 100 years. Shorelines structures have been modified and replaced at many locations since initial development, resulting in over 60 percent of the shorelines consisting of bulkheads, and nearly all of the remaining shoreline has been hardened to support some sort of existing commercial or industrial upland development. This long history of waterfront use has left many traces of prior uses including remnants of abandoned and collapsed piers, wharves, etc. that remain from historical industries no longer present. Active piers and vessel mooring facilities are scattered along the entire length of OU2 but are generally concentrated below RM 1.7 where the authorized navigation channel remains. The river is also crossed by eight highway bridges and three active railroad bridges, as well as three currently abandoned rail bridges.
1.2 PURPOSE AND ORGANIZATION
The primary objective of the bulkhead and shoreline evaluation is to develop a comprehensive understanding of the conditions of the shorelines and structures along OU 2 to inform the RD. The scope of the evaluation is presented in the EPA-approved BSE WP (Tetra Tech, 2017c), Appendix G to the PDI WP, September 2017. The deliverables associated with the BSE WP include:
(1) PBSAR (this report) - prepared at the completion of the desktop evaluation and field reconnaissance.
(2) Geotechnical Data Report (GDR) - prepared at the completion of the field investigation, which includes subsequent geotechnical borings associated with bulkhead stability evaluation (to be included in an appendix to the Basis of Design Report).

Lower 8.3 Miles of the Lower Passaic River Preliminary Bulkhead and Shoreline OU 2 of the Diamond Alkali Superfund Site Assessment Report Revision 2, May 2019
1-3 LPROU2-PDI_PBSAR_Rev 2_2019-05-20_CLEAN.docx
(3) Technical Memoranda on Structures - prepared to address results of analysis and recommendations for individual structures (to be included in an appendix to the Basis of Design Report).
This PBSAR presents the results of the desktop evaluation and field reconnaissance performed from June 4 to July 20, 2018, including a summary of the data collected. Data obtained from these activities and provided by landowners prior to December 2018 were used to perform this preliminary assessment of the zone of influence near structures in the evaluation area to be used for assessment of the zone in which the stability of the structure could potentially be impacted by dredging. In addition, recommendations for additional investigations are described in Section 3 of the BSE WP were identified and these activities will be included in a PDI Work Plan Addendum (submitted under separate cover).
The PBSAR is organized as follows:
• Section 1 – Introduction
• Section 2 – Preliminary Desktop Evaluation and Field Reconnaissance
• Section 3 – Summary of Structural Observation Data
• Section 4 – Evaluation of Zone of Influence
• Section 5 – Recommendations for Further Assessment
• Section 6 - References
Lower 8.3 Miles of the Lower Passaic River Preliminary Bulkhead and Shoreline OU 2 of the Diamond Alkali Superfund Site Assessment Report Revision 2, May 2019
2-1 LPROU2-PDI_PBSAR_Rev 2_2019-05-20_CLEAN.docx
2 PRELIMINARY DESKTOP EVALUATION AND FIELD RECONNAISSANCE
2.1 DATABASE SETUP FOR STRUCTURES
A voluminous amount of data was anticipated to be collected as part of the desktop evaluation and field reconnaissance activities. Therefore, a geographic information system (GIS) database was developed to manage the data and enable linkage of data and photographs to structures located on maps.
2.1.1 Sources The desktop evaluation and field reconnaissance were performed to obtain and review a wide range of data. Sources listed in Tables 2-1 Available Geotechnical Data Reviewed, Table 2-2 Owner Provided Structure Data, Appendix A Sources of Bulkhead and Shoreline Data, and Appendix B Owner Provided Structure Information were used to obtain data for these activities, in addition to the following sources:
• Bathymetric, geophysical, Light Detection and Ranging (LiDAR), and photogrammetry from the geophysical, bathymetric, shoreline and debris (GBSD) surveys performed in OU 2 in 2017 (Tetra Tech, 2018c).
• Records provided by state and local agencies, New Jersey Department of Transportation (NJDOT), public records, online resources, United States Army Corps of Engineers (USACE), and riparian landowners.
• Information from Gotham Aggregates and Clean Earth regarding future development plans.
2.1.2 Nomenclature Structure type codes and naming designations for structures are summarized on Table 2-3. The structures are designated as “[Structure Type]-RM-[Bank Location].” For example, a wall located at RM 1.24 on the east bank would be named: W-1.24-E. Clarifications on terminology are as follows:
• The bank on the Newark side of the Lower Passaic River is referred to as the ‘west bank’ (W) and the Harrison/Kearny side of the river is referred to as the ‘east bank’ (E).
• Not all data for each structure type were identifiable in the preliminary desktop data, and some structures that did not fit into the categories were identified as miscellaneous structures.
• Refer to Table 2-3 for the abbreviations and formats used in identifying various structures.
2.1.3 Management An overview of the type of data collected for each structure is presented in Table 2-4. Data obtained and used for the bulkhead and shoreline assessment are housed in the GIS database for the Project. This database will be enhanced as additional data are received.
Data for specific structures have been obtained through the desktop evaluation of published sources, field reconnaissance, and owner-provided documents. These data were organized in a GIS database for ease of reference and location of the various data. The tables included in this report and in the attached appendices have been extracted from this GIS database for presentation purposes.
Lower 8.3 Miles of the Lower Passaic River Preliminary Bulkhead and Shoreline OU 2 of the Diamond Alkali Superfund Site Assessment Report Revision 2, May 2019
2-2 LPROU2-PDI_PBSAR_Rev 2_2019-05-20_CLEAN.docx
2.2 PRELIMINARY DESKTOP EVALUATION
Existing structures and bulkheads along the OU 2 shoreline were evaluated as part of the preliminary desktop evaluation that preceded the field effort. The evaluation included a review of:
• Satellite imagery, present and historical aerial photographs, United States Geological Survey (USGS) topographic maps, Natural Resources Conservation Service (NRCS) Soil Survey maps, Sanborn Fire Insurance Maps, data collected during geophysical and bathymetric surveys, and documents provided by owners of riparian land (riparian landowners). An example is presented in Figure 2-1.
• Supplemental information from outside sources were gathered, including from state and local regulatory agencies, NJDOT, public records, on-line resources, USACE, and EPA.
• Reconnaissance and location data from the Combined Sewer Overflow/Stormwater Outfall Investigation (Tierra Solutions Inc., 2013).
Data evaluation as part of this preliminary desktop evaluation is summarized in the following sections.
2.2.1 Pre-Existing Information Information that existed from the sources listed in Sections 2.1.1 and 2.2 was reviewed during the desktop evaluation to identify and catalogue the structures and shoreline features known to be present. To the extent possible, this information was used to identify and catalog the structures present along the shoreline. The number and type of structures continued to evolve as additional information was obtained in the field and through review of new information.
2.2.2 Topographic and Bathymetric Information Existing topographic and bathymetric information was obtained from the listed sources and used as described below:
• Photographic, LiDAR, and bathymetric survey data collected during the GBSD surveys were reviewed and used to evaluate wall locations, dimensions and condition. The evaluation of this data focused on extracting the following information where feasible:
o Top of structure and sediment surface elevations were measured from these data for each structure.
o The length of walls and general dimensions of other structures were measured from the point cloud data.
o Structure type and support were noted (i.e., where wales, anchors, sheet piling, soldier piles, etc. were visible in the images or point cloud).
o A preliminary visual assessment of the condition of the structure.
• Maps of the existing shoreline, areas adjacent to the shoreline, and upland areas behind existing bulkheads were reviewed to assess structure or bulkhead conditions.
• USGS topographic maps and publicly available LiDAR survey data were assessed to create topographic contours to include in the GIS database as part of the assessment.
Lower 8.3 Miles of the Lower Passaic River Preliminary Bulkhead and Shoreline OU 2 of the Diamond Alkali Superfund Site Assessment Report Revision 2, May 2019
2-3 LPROU2-PDI_PBSAR_Rev 2_2019-05-20_CLEAN.docx
• Processed GIS layers of slope gradients for the topographic surfaces were included to assess the slope conditions surrounding each structure.
2.2.3 Geotechnical Existing geotechnical information useful for evaluation of shorelines, bulkheads and other structures was obtained from a variety of sources. This information was used as follows:
• Natural Resources Conservation Service (NRCS) soil survey maps were reviewed to determine soil types for upland areas.
• Area geology maps (Surficial Geology of the Elizabeth Quadrangle, Essex, Hudson, and Union Counties, New Jersey (Stanford, 2002) were reviewed to assess surficial geology and soils.
• Localized geotechnical information from available documents, including previous sediment studies conducted within OU 2. Documents were reviewed and noted for possible future use in evaluating structures or shorelines during the RD. These data included information from the Remedial Investigation (EPA, 2014a) and Focused Feasibility Study (EPA, 2014b), as well as other documents listed in Appendix A were reviewed to assess known geotechnical conditions.
• Geotechnical results from sediment sampling conducted during the sediment core collection as part of the PDI were reviewed to supplement the previous geotechnical information.
• Available geotechnical data from historical studies conducted within OU 2 (refer to Table 2-1) were also reviewed for additional relevant geotechnical information.
This information is used in the preliminary structure and shoreline slope evaluations together with additional data provided by landowners for active vessel use areas, and bulkheads, where applicable.
2.2.4 Owner Provided Information on the construction and use of existing structures was requested from owners in order to obtain specific details relevant to the evaluation of structures. Owners were identified based on property ownership data for properties for which structures were identified in the desktop evaluation. A total of 70 owners were sent letters requesting available data for structures along and within the Lower Passaic River within the OU2 boundaries. There were no responses to these letters. Second request letters were sent to 33 property owners in the areas identified for field reconnaissance specifically requesting as-built civil, structural and geotechnical information for their structures. Responses were received from 22 of the 33 property owners, and 11 of those provided documents.
Owner-provided information is summarized in Table 2-2 and includes as-built drawings of bulkheads and other structures, as well as other data summarized as follows:
• Structure data for bulkheads/shorelines
• Dredging and bathymetry records for mooring areas
• Geotechnical boring logs
In addition, some owners provided information on planned or desired future development for their waterfront areas (refer to Table 2-5).
This information was used to assess the structures present and identify areas where further investigation would be needed to complete the assessment for the RD. The evaluations within this report are based on
Lower 8.3 Miles of the Lower Passaic River Preliminary Bulkhead and Shoreline OU 2 of the Diamond Alkali Superfund Site Assessment Report Revision 2, May 2019
2-4 LPROU2-PDI_PBSAR_Rev 2_2019-05-20_CLEAN.docx
the information provided by owners received prior to December 2018, which is included as Appendix B. Since data collection and submissions from owners are ongoing, additional information that may be obtained as the work progresses will be included in the Geotechnical Data Report.
2.2.5 Data Gaps Data generated during the Preliminary Desktop Evaluation were used to identify data gaps to be addressed during the field reconnaissance, to the extent possible. The field reconnaissance focused on structure sensitivity to potential nearby dredging. This included structures adjacent to mudflats and those near navigation channel side slopes and active vessel mooring/berthing areas (i.e., areas where dredging may occur near the structures and/or where dredged channel side slopes might intersect the structures). Accordingly, preliminary mudflat polygons based on the National Oceanic and Atmospheric Administration (NOAA) mudflat mapping and the authorized navigation channel limits were input as GIS layers overlying the mapped structures. Structures identified in the initial desktop assessment that adjoin NOAA mapped mudflats or intersected by an estimated dredge slope of 3H:1V from the navigational channel were identified for the field reconnaissance. If a structure was not within the estimated dredge extent or not directly adjacent to mudflats based on the mudflat extents, it was considered to not be potentially affected by dredging and was excluded from the field reconnaissance. Based on this approach, 164 of the 333 structures identified during the desktop evaluation were included in the field reconnaissance.
Data gaps to be addressed during the field reconnaissance included the following:
• Location and extent of structures
• Verification of type of structures
• Dimensions and construction details of structures
• Condition of structures
• Identification of additional structures not identified in the initial desktop assessment
New mudflat mapping that became available in July 2018 was compared to the NOAA mapping used to determine reconnaissance requirements subsequent to completion of the field reconnaissance. This comparison indicated a net reduction in mudflat areas, so no additional structures were identified requiring reconnaissance.
2.3 FIELD RECONNAISSANCE METHODS
A field reconnaissance of bulkhead, structures and shoreline areas was performed to verify data from the desktop evaluation and to collect additional detailed information to address data gaps from the preliminary evaluation of these structures/areas.
The field reconnaissance was conducted from June 4 to July 20, 2018 and included marine and upland reconnaissance activities. This work was performed in accordance with the project-specific Health and Safety Plan (Tetra Tech, 2018a) and UFP-QAPP (Tetra Tech, 2018b), and the methods described in the BSE WP. These methods generally included the following:
• Identifying and recording the conditions of existing bulkheads, natural shoreline, riprapped areas, bridge abutments, scour mitigation structures, and other significant structures along the river from a boat.
Lower 8.3 Miles of the Lower Passaic River Preliminary Bulkhead and Shoreline OU 2 of the Diamond Alkali Superfund Site Assessment Report Revision 2, May 2019
2-5 LPROU2-PDI_PBSAR_Rev 2_2019-05-20_CLEAN.docx
• Observations and visual inspections from land where landowners granted access and where the shoreline was accessible through public land.
Additional details regarding these reconnaissance activities are provided in the subsections that follow.
2.3.1 Marine Reconnaissance The marine field reconnaissance was conducted by two teams aboard small vessels. Due to the presence of shallow mudflats in many areas near structures, the work was scheduled during high tide windows to permit access. Additional reconnaissance at lower tide levels was necessary for some locations where the structures were submerged at high tide.
The marine reconnaissance included visual observations, measurements, and photographs of the structures. Data were collected in the field using a global positioning system (GPS) linked to a data tablet. Hand measurements were made of sheet piles, anchors and other visible structures to identify features and dimensions that would be useful for further assessment of the structures. Measurements were recorded in the field and uploaded daily into the GIS database. The Spike® laser measuring tool, which attached to the tablet, was used to collect scaled images that could be used for making additional measurements, if needed. Photographs were taken of all surveyed structures and are linked to the locations in the database.
The structure data recorded including the following:
• Coordinates of the structure features (end points, inflection points, height, depth, etc.)
• Type of structure and construction (steel, wood, concrete, sheet pile, soldier pile, lagging, etc.)
• Structure condition (damage, deterioration, misalignment, perforations, collapse, etc.)
• River bottom substrate/conditions surrounding the structure (rip rap, eroded, etc.)
• Condition of the upland area above walls (land use, loadings atop the wall, slopes, etc.)
• Dimensions of structure components (wales, sheet piles, soldier pile size and spacing, lagging size, embedment, anchor size and location, anchor type, etc.) where accessible for measurement
• Operational issues related to the structures (equipment operations, stockpiling, vessel mooring, etc.)
• Foundation type, size, and depth (where measurable)
• Factors that would affect future investigation such as the presence of objects that would interfere with or obstruct access
2.3.2 Upland Reconnaissance Observations and visual inspections were conducted from land at the locations of three structures that were not accessible from the water due to obstructions such as permanently moored vessels. Riparian property owners granted access for the upland reconnaissance of these structures in advance of performing the field work. These structures included:
• Wall W-0.73-W (obstructed by floating booms and mooring structures)
• Wall W-1.06-W (obstructed by a permanently moored barge)
Lower 8.3 Miles of the Lower Passaic River Preliminary Bulkhead and Shoreline OU 2 of the Diamond Alkali Superfund Site Assessment Report Revision 2, May 2019
2-6 LPROU2-PDI_PBSAR_Rev 2_2019-05-20_CLEAN.docx
• Pier P-1.05-W (obstructed by a permanently moored barge)
The methods used for the upland reconnaissance were the same as those used for the marine reconnaissance, with the exception that no vessel was needed. Data from the marine and upland reconnaissance activities were collected using the web-based GIS that was updated daily throughout the reconnaissance efforts.
The observations made and data obtained from the field reconnaissance activities are presented in Section 3. Of the 164 structures slated for field reconnaissance, all were completed.
2.4 DEVIATIONS FROM THE WORK PLAN
Deviations from the BSE WP included the following:
• The BSE WP initially listed 52 structures for evaluation. The combined total of 383 structures identified in both the desktop assessment and field reconnaissance activities are evaluated in this report.
• The BSE WP indicates that the PBSAR would include a boring location plan for the recommended additional investigation. The preparation of the boring location plan was deferred from this report and, instead, will be included in a PDI Work Plan Addendum to be submitted separately, in order to enable coordination with other PDI sampling efforts and the ongoing remedial design effort.
Lower 8.3 Miles of the Lower Passaic River Preliminary Bulkhead and Shoreline OU 2 of the Diamond Alkali Superfund Site Assessment Report Revision 2, May 2019
3-1 LPROU2-PDI_PBSAR_Rev 2_2019-05-20_CLEAN.docx
3 SUMMARY OF STRUCTURAL OBSERVATION DATA
Structure data collected from the desktop and field reconnaissance efforts were compared and combined into a single data set that includes structure data tables with relevant information for the preliminary assessment of structures and shorelines that will be used for the remedial design. The tables are attached as Appendix C. During the field reconnaissance, 50 additional structures were identified that were not known during the desktop study. These structures were mostly outfalls, though some additional walls were also identified. At the completion of the field reconnaissance, the total number of structures identified was increased to 383. A breakdown of structures by type and location is presented in Table 3-1.
The zone of influence of bulkheads was also estimated to provide information for establishing dredging extents. The basis for determining the zone of influence is presented in Section 4 of this report. Evaluations were focused on the following:
• Structure identification and location: baseline identification of structures
• Structural integrity/condition: identification of vulnerable structures (that have failed or are failing)
• Structure-specific conditions: for walls, bridges, outfalls, moorings, and shorelines
During the preliminary assessment, structures and shorelines were sorted into feature categories based on exposed wall height, structural damage, shoreline slope, sediment slope, and mooring activity. Assessments were completed on a global basis for all structures based on these feature categories to evaluate the relative sensitivity and support influence for each structure. Appendix D contains these sorted structure maps.
3.1 STRUCTURE IDENTIFICATION AND LOCATION
Structure locations and shoreline areas were constructed as poly-lines in the GIS by connecting endpoints and transition points collected using GPS during the field reconnaissance and assigned an identification label as described in Section 2.1.2. For structures not evaluated during the field reconnaissance (refer to Section 2.2.5), poly-lines were drawn based on points located from the aerial imagery and LiDAR point cloud data for the structures. These lines are used to depict the identified structures location and extent presented on the figures in Appendix D.
3.2 STRUCTURE CONDITIONS
Structures were also sorted by type and condition and are shown on the maps in Appendix D. Representative photographs for each identified structure and shoreline are provided in Appendix E. Findings are summarized in the sections that follow for:
• Failing or failed structures
• Active mooring structures
• Bridges
• Bulkhead walls
• Outfalls
• Shorelines
Lower 8.3 Miles of the Lower Passaic River Preliminary Bulkhead and Shoreline OU 2 of the Diamond Alkali Superfund Site Assessment Report Revision 2, May 2019
3-2 LPROU2-PDI_PBSAR_Rev 2_2019-05-20_CLEAN.docx
3.2.1 Failing or Failed Structures The assessment of failing or failed structures was based on evidence of collapse and/or missing portions of the structure as outlined in Section 2.5 of the BSE WP. The factors considered during the assessment were subdivided into four categories: Structural, Dredging, Safety, and Landowner issues.
Structural. This factor is related to the structural condition and affects the ability to assess and analyze the existing structure. In general, all failed structures pose a problem for assessment. Given the state of disrepair and deterioration, assessment of the structure properties will be impractical, and the ability to fully assess conditions for structural assessment will not be possible.
Dredging. This factor relates to conditions that limit or impact the ability to dredge in and around these structures. The listed structures share the problem that they form obstructions to dredging and/or that dredging could produce further collapse of the structure.
Safety. There are safety concerns for personnel and equipment working around these structures. In general, there is the potential for further collapse of the structures that may endanger personnel and equipment and/or for submerged debris to be present that could become entangled in equipment.
Landowner. This factor relates to notification of and coordination with landowners. The landowners listed are primarily those that need to be notified should there be a need to remove the remnant structure or conduct other activities to support the structure.
All the structures identified as failed are in a condition that will preclude structural analysis and that would likely pose a hazard to dredging activities. A listing of failed structures is presented in Table 3-2. These structures are identified on the Failed Structures Map in Appendix D. Photographs of these structures are included in Appendix E. Further structural assessment or analysis of these structures is not feasible or warranted. The impact of these structures on the proposed remedial design will be considered in the Basis of Design Report (BODR) and existing conditions drawings.
Structures that were characterized as partially failed showed one or more structural conditions that included a limited area of collapse, a portion of the structure missing, a portion of the deck missing for mooring structures, or the structure was distorted in such a way that limited its functionality. However, partially failed structures were specifically distinguished from failed structures in that they still appeared to be partially functional based on assessment of desktop data, visual observation during field reconnaissance (where performed), or owner indication of use. Therefore, further structural assessment or analysis of these structures is warranted, and they are included in the evaluation of the zone of influence discussed in Section 4.
3.2.2 Active Mooring Structures Identified mooring structures are summarized in Table 3-3, and more detailed information on these structures is provided on C.4 - Moorings, Piers, and Wharfs Structure Data Table presented in Appendix C and D.5 - Moorings, Piers, Wharf, Bridge and Miscellaneous Map in Appendix D. Active moorings were identified based on the evidence of vessel activity and information provided by owners. Table 3-3 summarizes the conditions noted.
Structures in areas of active moorings may require dredging directly adjacent to the structures, within the support influence zones of these structures. Information obtained from owners of mooring facilities with
Lower 8.3 Miles of the Lower Passaic River Preliminary Bulkhead and Shoreline OU 2 of the Diamond Alkali Superfund Site Assessment Report Revision 2, May 2019
3-3 LPROU2-PDI_PBSAR_Rev 2_2019-05-20_CLEAN.docx
active use included draft requirements for vessels that use these structures. This information was evaluated together with structure data and bathymetric survey data. This was completed to assess the additional information needed to evaluate these structures for stability at potential dredge depths. This evaluation also examined the completeness of the data and need for further investigation.
To evaluate the structures, it was important to understand the dredging history and intended water depths near each structure. Where this information was not readily available, the evaluation was based in part on the historical dredged sediment surface elevations adjacent to each structure. This assumed that the structure was stable under the historical condition, providing a basis for assessment of potential additional dredging that may be needed to accommodate cap construction. If the required dredge elevation is below the historical dredging elevation in mooring areas, the stability of these structures will be affected, and additional assessment will be needed to obtain sufficient data to assess these impacts. The data collected have been reviewed to assess the historical dredge depths and/or the existing sediment surface where the sediment surface is below the required draft indicated by the owner.
Where data provided by owners was in different datums, it was corrected to North American Vertical Datum of 1988 (NAVD88) as presented in Table 3-4. Brief summaries are presented herein for the 10 active mooring/berthing sites identified. Where previous dredging information is not provided by the owner, the limit for historical dredging is estimated based on review of bathymetric data considering the depth for vessel access indicated by the owner of each facility as discussed below.
Shell Oil Delancey Street Terminal (Structures M-0.00-W, M-0.01-W, M-0.02-W, M-0.04-W, M-0.06-W, W-0.00-W)
This facility, shown on Figure 3-1, consists of a petroleum terminal owned by Shell Oil comprising multiple mooring points for offloading tankers within Parcel Nos. 0714_5074_25.01 and 0714_5066_20.01. The owner verbally reported minimum draft of 22 feet MLW. This correlates to a minimum dredge elevation of -24.74 feet NAVD88. The level conversions are presented in Table 3-4. A Condition Hydrographic Survey Map, for a survey conducted by S.T. Hudson Engineers, Inc. on December 27, 2017, indicates a dredging depth of 20 feet relative to MLW, which is indicated on the plan to be at -1.85 feet National Geodetic Vertical Datum 1929 (NGVD29) for a dredge elevation of -21.85 feet NGVD29. While the MLW level indicated on the plan deviates from the project MLW, the computed NGVD29 elevations are considered for this evaluation. The NGVD29 dredge levels correlate to a dredge elevation of -22.99 feet NAVD88.
Bathymetry collected in 2017 for this Project indicates sediment surface elevations between -22 and -25 feet NAVD88. Accordingly, the dredge data provided by the owner are consistent with the conditions identified in Tetra Tech’s 2017 field survey. Therefore, a historical dredge elevation of -23 feet NAVD88 is considered for the mooring/berthing area outlined in Figure 3-1.
Center Point Terminal (Structures M-0.13-W, M-0.14-W, M-0.16-W, M-0.18-W, P-0.15-W)
The facility, shown on Figure 3-2, consists of a petroleum terminal owned by Center Point Terminal Newark, LLC comprising multiple mooring points (Structures M-0.13-W, M-0.14-W, M-0.16-W, M-0.18-W, and P-0.15-W) for offloading tankers adjacent to Parcel No. 0714_5066_30.01. The owner verbally reported minimum draft of 21 feet MLW. This correlates to a minimum dredge elevation of -23.74 feet NAVD88. An owner-provided Fathometric Survey Map, for a survey conducted by Hydrographic Surveys on January 07, 2017, indicates a dredge depth to -22 feet MLW. The indicated dredge depth correlates to -24.74 feet NAVD88 based on the Table 3-4 conversion; however, the plan references the Point No Point Station located at the Point No Point Bridge (B-2.56), located at RM 2.56 with a different corresponding elevation for MLW.
Lower 8.3 Miles of the Lower Passaic River Preliminary Bulkhead and Shoreline OU 2 of the Diamond Alkali Superfund Site Assessment Report Revision 2, May 2019
3-4 LPROU2-PDI_PBSAR_Rev 2_2019-05-20_CLEAN.docx
The Tetra Tech 2017 bathymetric survey indicates an existing sediment surface elevation of -24.0 feet NAVD88 in the mooring area at this facility. Centerpoint’s post-dredging survey elevation appears to be reasonably close to the current sediment surface. Therefore, a historical dredge elevation of -24.7 feet NAVD88 is considered for the mooring/berthing area outlined in Figure 3-2.
Passaic Valley Sewerage Commission (Structures M-0.33-W, P-0.34-W, M-0.35-W, C-0.35-W, W-0.34-W)
The facility, shown on Figure 3-3, consists of a sewerage and solid waste processing center owned by Passaic Valley Sewerage Commission (PVSC) within Parcel Nos. 0714_5066_12.01 and 0714_5066_12.01. This facility has a boat lifting system (C-0.35-W) with floating dock (P-0.34-W) for a fire boat and trash skimmer, a waste conveyor for the trash skimmer boat (P-0.33-W), and timber dolphins (M-0.33-W and M-0.35-W) on the south, and a wall (W-0.34-W) with mooring system to the north. Based on the available information, it appears that the southern portion is used for small vessels, and the northern area, along W-0.34-W, is used for large vessels. The owner verbally reported a minimum draft of -20.5 feet MLW. This correlates to a minimum dredge elevation of -23.24 NAVD88. An owner-provided Fathometric Survey Map, for a survey conducted by Hydrographic Surveys on December 21, 2016, indicates the dredging limit and dredge depth to -25 feet MLLW in the northern area and no dredging in the southern floating dock area, as shown in Figure 3-4. The dredge depth was converted to NAVD88 datum using the indicated local datum elevation provided in both NAVD88 and MLLW (Table 3-4). Based on the relationship derived from these data, the previous dredge depth in the northern area correlates to an elevation of -28.46 feet NAVD88. The 2017 Tetra Tech bathymetric data indicates an existing sediment surface elevation of -28 feet NAVD88 in the northern area.
The mooring system in the southern area is used by only small vessels, and no dredging was performed in this area in 2016. Therefore, a draft of -23.24 feet MLLW does not appear to be appropriate for this area. The Hydrographic Survey Map provided by PVSC (December 2016) indicates sediment surface elevations between -5 and -11 feet MLW (-7.7 to -13.7 NAVD88), which agree reasonably well with the sediment surface levels indicated in the 2017 Tetra Tech bathymetry, which showed sediment surfaces ranging from -5 to -15 feet NAVD88 in the southern area.
Based on the above assessment, the historical dredge levels are considered to be -28.5 feet NAVD88 for the northern mooring area within the boundary shown on Figure 3-4 and -10 feet NAVD88 for the southern mooring area indicated as the Area of No Dredging in that same figure.
Darling International (Structures W-0.50-W, P-0.52-W)
The facility, shown on Figure 3-5, consists of a liquids terminal owned by Darling International, a recycling and rendering company. The moorings comprise two permanent barges moored to shore points and a small pier for loading/offloading tankers adjacent to Parcel No. 0714_5070_49. The facility consists of Wall W-0.50-W and Pier P-0.52-W. The owner verbally reported a minimum draft of -30 feet MLW. Since the anchored barges extend the mooring line to the Navigation Channel, the reported depth appears to be based on the depth of the channel. This correlates to a minimum dredge elevation of -32.74 feet NAVD88.
The 2017 Tetra Tech bathymetric survey indicated an existing sediment surface elevation of -25 feet NAVD88 in this area. While the owner-indicated minimum draft is 10 feet deeper than the existing sediment surface, it is consistent with the Navigation Channel approved depth. Since the barges are permanently moored, there is no need to dredge adjacent to the bulkhead or pier for mooring and berthing of large ships. Therefore, the historical dredging in this area should be considered as the minimum for maintenance of the
Lower 8.3 Miles of the Lower Passaic River Preliminary Bulkhead and Shoreline OU 2 of the Diamond Alkali Superfund Site Assessment Report Revision 2, May 2019
3-5 LPROU2-PDI_PBSAR_Rev 2_2019-05-20_CLEAN.docx
Navigation Channel within the boundaries of the channel, and no additional minimum draft should be considered beyond the channel limits.
Sunoco Logistics (Structures M-0.64-W, M-0.65-W, W-0.73-W, P-0.79-W)
The facility consists of a petroleum terminal owned by Sunoco Logistics, adjacent to Parcel No. 0714_5070_13. This facility consists of Mooring M-0.64-W, Timber Dolphin M-0.65-W, Wall W-0.73-W to the south, and Floating Dock P-0.79-W to the north, as shown on Figure 3-6. Mooring M-0.64-W consists of seven breasting cells (circular cofferdams) connected by walkways with two dock structures and fender system. Based on the available information, the southern portion is used for large vessels, and the northern area (P-0.79-W) is used for small vessels. The owner verbally reported a minimum draft of 20.0 feet MLW. This correlates to a minimum dredge elevation of -22.74 feet NAVD88. Tetra Tech’s 2017 bathymetric data indicated an existing sediment surface elevation of -23 feet NAVD88 over most of the mooring length in the southern area and about -18 feet NAVD88 in the northern area.
P-0.79-W located at the north end is in a shoreline area and used only for small vessels. Bathymetry indicated a sediment surface elevation of -5 NAVD88 in this area. Since the vessels mooring is limited by the proximity of the shore, it does not appear that the area around this pier is dredged.
Based on the above information, the historical dredge level is considered as -23 feet NAVD88 within the limits shown in Figure 3-6.
Gotham Aggregates 1 (Structure M-0.84-W, M-0.90-W, M-0.93-W, and P-0.91-W)
The facility, shown on Figure 3-7, consists of a parking lot within Parcel Nos. 0714_5070_11 and 0714_5070_11.01. Based on the provided information, Gotham Aggregates is in the process of purchasing this property and plans to expand waterfront mooring and berthing. Structure M-0.84-W, which adjoins the property, is a part of an unused facility to the north associated with Moorings M-0.90-W and M-0.93-W, and Pier P-0.91-W (Figure 3-7). At present, there is only a circular cofferdam mooring structure (breasting cell) with no dredged mooring area and an existing outfall obstructing vessels from approaching the dolphin. A representative of Gotham Aggregates indicated verbally that a dock will be setup at this property within the next six months with planned dredging to accommodate a minimum draft of 12.5 feet MLW. This correlates to an elevation of -15.24 feet NAVD88.
Bathymetric data obtained in 2017 indicated this to be a shoreline area with an existing sediment surface elevation of -2 feet NAVD88. The sediment surface elevation adjacent to Pier P-0.91W is -22 feet NAVD88, which is deeper than the owner-indicated draft. Since there are no active structures present, no defined dredge limits, and no historical evidence of prior dredging specific to this location, there would appear to be no basis for setting a dredge level; however, the bathymetry indicates a likely historical dredge level to -22 feet NAVD88.
George Harms Construction (Structure P-1.32-W)
The facility, shown on Figure 3-8, consists of a parking lot with construction equipment and material owned by George Harms Construction. The mooring facilities comprise multiple mooring points for offloading construction material within Parcel Nos. 0714_5014_1.03 and 0714-5014-1.04. Based on data included in the USACE Lower Passaic River Commercial Navigation Analysis (USACE, 2010), the maintenance dredge depth is -18 feet MLW. This correlates to a minimum elevation of -20.74 feet NAVD88. The 2017 bathymetric data indicated an existing sediment surface elevation ranging from -8 to -15 feet NAVD88. Accordingly, the minimum draft required is 5.74 to 12.74 feet deeper than the existing sediment surface.
Lower 8.3 Miles of the Lower Passaic River Preliminary Bulkhead and Shoreline OU 2 of the Diamond Alkali Superfund Site Assessment Report Revision 2, May 2019
3-6 LPROU2-PDI_PBSAR_Rev 2_2019-05-20_CLEAN.docx
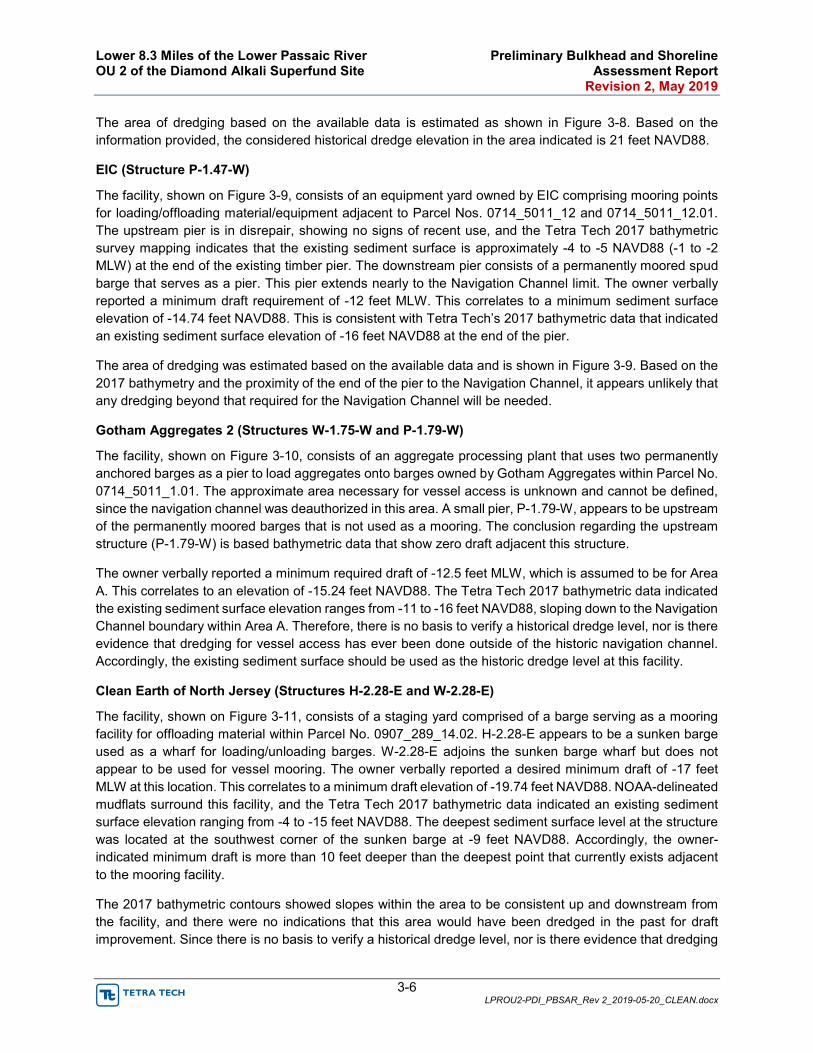
The area of dredging based on the available data is estimated as shown in Figure 3-8. Based on the information provided, the considered historical dredge elevation in the area indicated is 21 feet NAVD88.
EIC (Structure P-1.47-W)
The facility, shown on Figure 3-9, consists of an equipment yard owned by EIC comprising mooring points for loading/offloading material/equipment adjacent to Parcel Nos. 0714_5011_12 and 0714_5011_12.01. The upstream pier is in disrepair, showing no signs of recent use, and the Tetra Tech 2017 bathymetric survey mapping indicates that the existing sediment surface is approximately -4 to -5 NAVD88 (-1 to -2 MLW) at the end of the existing timber pier. The downstream pier consists of a permanently moored spud barge that serves as a pier. This pier extends nearly to the Navigation Channel limit. The owner verbally reported a minimum draft requirement of -12 feet MLW. This correlates to a minimum sediment surface elevation of -14.74 feet NAVD88. This is consistent with Tetra Tech’s 2017 bathymetric data that indicated an existing sediment surface elevation of -16 feet NAVD88 at the end of the pier.
The area of dredging was estimated based on the available data and is shown in Figure 3-9. Based on the 2017 bathymetry and the proximity of the end of the pier to the Navigation Channel, it appears unlikely that any dredging beyond that required for the Navigation Channel will be needed.
Gotham Aggregates 2 (Structures W-1.75-W and P-1.79-W)
The facility, shown on Figure 3-10, consists of an aggregate processing plant that uses two permanently anchored barges as a pier to load aggregates onto barges owned by Gotham Aggregates within Parcel No. 0714_5011_1.01. The approximate area necessary for vessel access is unknown and cannot be defined, since the navigation channel was deauthorized in this area. A small pier, P-1.79-W, appears to be upstream of the permanently moored barges that is not used as a mooring. The conclusion regarding the upstream structure (P-1.79-W) is based bathymetric data that show zero draft adjacent this structure.
The owner verbally reported a minimum required draft of -12.5 feet MLW, which is assumed to be for Area A. This correlates to an elevation of -15.24 feet NAVD88. The Tetra Tech 2017 bathymetric data indicated the existing sediment surface elevation ranges from -11 to -16 feet NAVD88, sloping down to the Navigation Channel boundary within Area A. Therefore, there is no basis to verify a historical dredge level, nor is there evidence that dredging for vessel access has ever been done outside of the historic navigation channel. Accordingly, the existing sediment surface should be used as the historic dredge level at this facility.
Clean Earth of North Jersey (Structures H-2.28-E and W-2.28-E)
The facility, shown on Figure 3-11, consists of a staging yard comprised of a barge serving as a mooring facility for offloading material within Parcel No. 0907_289_14.02. H-2.28-E appears to be a sunken barge used as a wharf for loading/unloading barges. W-2.28-E adjoins the sunken barge wharf but does not appear to be used for vessel mooring. The owner verbally reported a desired minimum draft of -17 feet MLW at this location. This correlates to a minimum draft elevation of -19.74 feet NAVD88. NOAA-delineated mudflats surround this facility, and the Tetra Tech 2017 bathymetric data indicated an existing sediment surface elevation ranging from -4 to -15 feet NAVD88. The deepest sediment surface level at the structure was located at the southwest corner of the sunken barge at -9 feet NAVD88. Accordingly, the owner-indicated minimum draft is more than 10 feet deeper than the deepest point that currently exists adjacent to the mooring facility.
The 2017 bathymetric contours showed slopes within the area to be consistent up and downstream from the facility, and there were no indications that this area would have been dredged in the past for draft improvement. Since there is no basis to verify a historical dredge level, nor is there evidence that dredging

Lower 8.3 Miles of the Lower Passaic River Preliminary Bulkhead and Shoreline OU 2 of the Diamond Alkali Superfund Site Assessment Report Revision 2, May 2019
3-7 LPROU2-PDI_PBSAR_Rev 2_2019-05-20_CLEAN.docx
for vessel access has ever been done outside of the historic navigation channel, the existing sediment surface should be used as the historic dredge level at this facility.
3.2.3 Bridges A summary of bridges identified in OU 2 is presented in Table 3-5. The bridges are typically old structures that may have been upgraded and improved over time, and some are in disuse and in poor repair. Detailed information for these bridges is presented on C.5 - Bridge Structure Data Table in Appendix C. The locations of these bridges are shown on D.5 - Mooring, Pier, Wharf and Bridge Maps presented in Appendix D.
Initially, a total of 18 bridge structures were identified along the 8.3-mile section of the LPR. Four (4) of these 18 structures, B-1.83 and B-5.36 located on the east shoreline and B-1.84 and B-5.34 located on the west shoreline, are structures that served as abutments of a former bridge that has been removed. Therefore, these structures were reclassified as walls and were assessed appropriately with the structures in Section 3.2.4. Accordingly, the remaining 14 bridges, where there are remaining piers and spans, were evaluated.
Three (3) of the bridge structures, B-1.14, B-6.30, and B-8.07, were identified as not-in-service. These are railroad-owned bridges, and the not-in-service classification is based on a review of historical aerial images and visual observations of the present-day structure conditions that indicated the bridge was damaged, bridge parts were dismantled, or that the rail has been removed or disconnected from the bridge.
The remaining 11 bridge structures are indicated as in use. Eight (8) structures, B-1.81, B-2.00, B-2.62, B-2.65, B-4.60, B-5.66, B-5.85, and B-6.06, serve as active roadway bridges, and three (3) structures, B-2.56, B-4.97, and B-5.81, serve as active railroad bridges. These bridge structures are located in the area of the deauthorized navigational channel.
For the purposes of this evaluation, it was assumed that the bridge structures are stable and have adequate factors of safety in their current configuration. If so, the influence of dredging and capping that results in no permanent lowering of the surface beneath the bridge should have little, if any, effect on structures (bridges and fender systems) performance, provided no dredging is performed within offset areas around bridge support structures. Accordingly, the temporary reduction of the skin friction of the piles supporting the bridges will be minimal, and there will be no permanent reduction in support for piles supporting bridges as a result of dredging and capping. If, during design, it is determined that dredging may be needed closer to this bridge piers than assumed, further evaluation may be needed. Critical dimensions in the evaluation are the bottoms of pilings, pile caps, and foundations and the bearing medium. Most of the bridge piling and caisson foundations extend to rock, though data are not available for all structures. Where these data have been determined, information is summarized in C.5 - Bridge Structure Data Table in Appendix C. LiDAR images of bridges from the GBSD survey (Tetra Tech, 2018c) also included some estimated bridge dimension data and are provided in Appendix F.
In many cases, the existing navigation channel under the bridges has been deepened since the original construction of the bridge. It was assumed that the bridges had adequate factors of safety in their original configuration, though the current safety factors are likely lower where channel dredging has lowered the sediment surface beneath the structures. Accordingly, efforts are continuing to obtain available construction records to confirm these conditions. As-built or bridge design drawings have been provided for 7 of the 14 bridges, and these documents are presented in Appendix B.
Lower 8.3 Miles of the Lower Passaic River Preliminary Bulkhead and Shoreline OU 2 of the Diamond Alkali Superfund Site Assessment Report Revision 2, May 2019
3-8 LPROU2-PDI_PBSAR_Rev 2_2019-05-20_CLEAN.docx
3.2.4 Bulkhead Walls The data collected for this evaluation are preliminary and include basic locations, extents, dimensions, and a visual assessment of conditions. Summaries of bulkhead walls identified on the east and west shorelines, totaling approximately 9.4 miles of shore within OU2 of the LPR, are presented in Tables 3-6 and 3-7. The locations and extents of bulkheads verified during the field reconnaissance are shown on the D.3 - Bulkhead Structures Map in Appendix D. Detailed information obtained on the bulkheads is summarized in C.2 - Bulkhead Structure Data Table in Appendix C.
The walls were classified into categories based on Wall Type, Wall Height, Observed Damage, Upland and Sediment Slopes, and Potential Mooring Activity. They were also classified into four wall types: Sheet Pile Wall, Soldier Pile Wall, Gravity Wall, and Crib Wall. Based on support type, sheet pile walls and soldier pile walls were classified as cantilevered or anchored. Many of the walls are composite construction, consisting of one wall type built over others. Some of the walls have been faced with concrete, with no visible evidence of the support mechanism. Where the support mechanism could not be discerned, the structures were listed as Gravity Walls. Walls that showed visible timber cribbing were classified as Crib Walls.
Walls were assessed for stability during shallow dredging to depths of 2.5 feet or less, based on the sufficiency of data for the general categories of structures. For the purposes of this evaluation, the walls were grouped by height as shown in Table 3-8. Walls were also assessed by condition and categorized by degree of damage, as shown in Table 3-9; and categorized by slope as shown in Table 3-10. Based on the slope information, most of the structures have slope factors of 1 or 2, with a few having a slope factor of 3. However, the slope is not a critical factor for these walls. The criteria for the initial feasibility assessment is presented in Table 3-11.
3.2.5 Outfalls A summary of the outfalls identified in OU 2 is presented in Table 3-12, and detailed information on each outfall is provided in C.3 Outfall Data Table in Appendix C. The locations of these outfalls are shown on the D.4 - Outfall Structures Map presented in Appendix D. A number of outfalls have tide valves. Some that have gates may serve as inlet structures, though use of each outfall was not specifically identified.
The most important consideration for design around outfalls is the presence of riprap or concrete aprons, and these have been noted where observed. However, the submerged surface conditions could not be determined at most locations based on the information reviewed. Additional reprocessing of bathymetric and LiDAR data is ongoing, and this information will be used to delineate riprap and concrete aprons, along with a subsequent field effort, completed in winter of 2018, to physically delineate these substrate conditions by poling.
3.2.6 Miscellaneous Structures Structures that did not fall into any of the categories described above were classified as miscellaneous structures. A total of 11 structures were identified as miscellaneous, and included a boat lift, an electrical tower, several concrete vault type structures, a boat launch ramp, and paved shorelines. These structures are summarized in Table 3-13 and the C.6 - Miscellaneous Structures Data Table in Appendix C.
3.2.7 Shorelines Shoreline areas were identified as those areas without evidence of other structures. The shoreline areas have a range of conditions that include mudflat areas, vegetated slopes, and riprap slopes. A total of 67
Lower 8.3 Miles of the Lower Passaic River Preliminary Bulkhead and Shoreline OU 2 of the Diamond Alkali Superfund Site Assessment Report Revision 2, May 2019
3-9 LPROU2-PDI_PBSAR_Rev 2_2019-05-20_CLEAN.docx
shoreline areas were identified, totaling approximately 6.5 miles of shore within OU2, and these areas are summarized in C.7 - Shoreline Structure Data Table in Appendix C. The locations of these shoreline areas are shown on D.6 - Shorelines Map in Appendix D.
Lower 8.3 Miles of the Lower Passaic River Preliminary Bulkhead and Shoreline OU 2 of the Diamond Alkali Superfund Site Assessment Report Revision 2, May 2019
4-1 LPROU2-PDI_PBSAR_Rev 2_2019-05-20_CLEAN.docx
4 EVALUATION OF ZONE OF INFLUENCE
The zone of influence for structures was evaluated to identify areas adjacent to these structures that could impact the stability of the structures if the current sediment surface elevations are lowered in these areas. Results of this evaluation will be considered in establishing limits for dredging for the design to avoid compromising the stability of structures. The methods used for this preliminary evaluation are described below, followed by the results.
4.1 METHODS
Preliminary criteria were developed for determining the approximate zone of influence for structure support. The influence zone was considered as that area where steepening slopes or lowering the sediment surface elevation through excavation or dredging would reduce the structure’s stability. The dimension of this zone was based on two different conditions depending upon the type of wall. For sheet pile and soldier pile walls, the support of the wall was derived from the resistance offered by the existing soils (sediments) at the toe of the wall. For gravity structures (crib walls, concrete walls, stone walls, etc.), the support was derived from bearing strength beneath the wall. For the purposes of this evaluation, lateral support from the structure toe for gravity structures is not considered. For this assessment, it was assumed that walls with a height of 2 feet or less would not be adversely affected by short-term impacts of dredging and cap placement. Also, for walls where the support condition was unknown, such as where structural elements were obscured by fenders, concrete encasement, etc., the walls were considered as gravity walls, since that produces a larger zone of influence.
4.1.1 Effect of Condition A factor was added for walls related to their condition, where damage was identified. This factor was applied to increase the effective influence zone where damage may affect the wall stability. Where walls were identified as sound, no increase was applied. The influence zone for cantilevered and anchored walls was increased by 50 percent for walls that were identified as “deteriorated but functional” and by 100 percent for walls indicated to be “partially failed” or “failed” where the wall was higher than 2 feet. The basis for this increase was that the impacts of dredging at the limits of the influence zone could disturb the passive wedge, potentially producing failure in marginally stable structures. A condition factor was not applied to gravity structures since the large influence zones for these structures are unlikely to be significantly affected by excavation beyond their limits. While behind-wall drainage may impact a structure’s stability, this was not assessed and will not be assumed for this report. If it comes to the point where specific walls are identified as critical and offsets are not permissible, then a more detailed assessment and additional investigation will be warranted for those structures during the design phase.
4.2 SHEET AND SOLDIER PILE WALLS
Sheet pile walls and soldier pile walls were first evaluated as to whether they were anchored or cantilevered. Where anchors were visible, or evidence of a whaler attachment was present (i.e., bolt heads on sheet pile face), walls were classified as anchored. Where evidence of anchorage was not visible, as in most instances, the means of support was listed as unknown. For practicality, and to limit deflections and minimize the size and depth of sheeting and soldier piles, walls greater than 15 feet in height are seldom installed as cantilevered. Therefore, all sheet pile and soldier pile walls higher than 15 feet were assumed to be anchored.
Lower 8.3 Miles of the Lower Passaic River Preliminary Bulkhead and Shoreline OU 2 of the Diamond Alkali Superfund Site Assessment Report Revision 2, May 2019
4-2 LPROU2-PDI_PBSAR_Rev 2_2019-05-20_CLEAN.docx
The support zone for the walls was based on the embedment of the wall. Since the embedment was only known for two walls where plans were received from the owners, the embedment was estimated for a majority of the walls, assuming typical embedment used for walls of similar construction. Cantilevered walls are typically embedded approximately 1.5 times the exposed height. Anchored walls are assumed to have one row of anchors. For sheet pile and soldier pile walls so anchored, the typical embedment is generally about 75 percent of the exposed height of the wall. For conservatism, the embedment assessment was based on the maximum observed wall height.
The influence zone was computed based on a passive soil wedge bearing against the embedded portion of the wall. The size of the wedge was computed considering a base angle of 45+ϕ/2 ; where ϕ is the angle of internal friction of the soil in degrees. Based on the available geotechnical data reviewed in section 2.2.3 above, this angle was assessed as 25 degrees for river sediments. On this basis, the width of the wedge was computed to be 1.6 times the depth of embedment.
4.3 GRAVITY WALLS
For gravity walls, the impact of dredging on the bearing for these walls was assessed based on the relationship of wall proximity to slopes, since the dredging will effectively create a slope adjacent to the wall. This methodology is published by Meyerhof, et al. (1957). This method rates the reduction in bearing due to the proximity of the slope as a factor of the bearing width. Since wall width was unknown, the foundation width was estimated as 70 percent of the wall height, which is typical for gravity structures. The influence zone for the foundation, based on the Meyerhof method, computed as distance from a slope to limit bearing reduction was calculated as 4.5 times the foundation width. The resulting factor for determining the influence zone was 3.15 times the exposed wall height.
This approach is conservative since it assumes the structure foundation is at the sediment surface. Additional embedment will increase the stability and reduce the impact of dredge. Since the embedment was unknown, this approach was considered to provide a safe evaluation.
4.4 OUTFALLS
Most of the outfalls extend through bulkhead walls and required no separate evaluation related to potential dredging influence, since their stability is governed by the bulkhead. Outfalls that have wingwalls are supported through the structure between the wing walls and were not considered to be influenced by dredging, where the temporary dredge slope does not exceed 1:1 and the area is backfilled to the original grade. Outfalls with an associated apron are not considered removable for dredging and therefore were not considered to be influenced by dredging. Outfalls that have headwalls and no wingwalls were evaluated using the same criteria as bulkheads. Outfalls without headwalls consisting only of pipes on the ground were not considered sensitive to dredging.
Based on this preliminary assessment, it is recommended that a nominal influence zone be considered as 10 feet for outfalls without headwalls and 20 feet for all other outfall structures. If, during design, it is determined that dredging may be needed within the influence zone, further evaluation may be needed. Requirements for structural support measures will be evaluated as part of the design, where appropriate.
Lower 8.3 Miles of the Lower Passaic River Preliminary Bulkhead and Shoreline OU 2 of the Diamond Alkali Superfund Site Assessment Report Revision 2, May 2019
4-3 LPROU2-PDI_PBSAR_Rev 2_2019-05-20_CLEAN.docx
4.5 SHORELINE AREAS
The shoreline areas were evaluated based on the likelihood that dredging near the shoreline would produce instability. The stability of the shoreline slopes is governed by the soil and surface materials present and the steepness of the slope. For evaluation purposes, slopes were categorized as to whether they are flatter or steeper than 33 percent (3H:1V), since this is the degree of slope below which dredging to accommodate cap thickness would be expected to have no significant effect. The shoreline assessment was based on the topographic and bathymetric contours and high-resolution point cloud data developed from the 2017 bathymetry completed as part of this PDI (Tetra Tech, 2018c) and publicly available LiDAR data.
Among 67 shorelines, 51 shorelines were identified with shoreline slopes greater than 33 percent. The range of shoreline slope varied for these steep shorelines from 33.5 to 78.0 percent. Most of these slopes were less than 20 feet high, although one formed a roadway embankment slope over 30 feet high. There were insufficient data to assess the stability of these slopes. A summary of the slopes is provided Appendix C. A typical cross-section illustrating the dimensions provided in Table 4-1 is presented in Figure 4-1.
Some steep slopes (slope > 33 percent) may be impacted by the proposed dredging. The potential for impacts of the dredging on the stability of steep slopes was evaluated based on the height of the slopes and the distance from the toe of the slope to the thalweg slope measured in the 3-D high resolution point cloud data. In general, the zone of influence for slopes was taken as twice the height of the slope from the toe of the shoreline slope steeper than 33 percent. Where this zone of influence extends past the crest of the thalweg slope, the slopes were identified as areas where dredging activity may have an adverse impact to stability. Where the toe of the slope does not coincide with the RA boundary, the adjusted influence zone relative to the RA boundary was computed. Where the adjusted influence zone is greater than 30 feet, these slopes were also identified as areas where dredging activity may adversely affect slope stability. The height of slope, slope angle (%), and adjusted influence zone are included in Appendix C for all slopes. The assessment indicates that among 51 steep shorelines, 20 shorelines are within the proximity of potential dredging that could adversely impact stability. Riprap was present at all 20 of these steep shoreline slopes. A summary of the steep slopes potentially impacted by dredging activity is included in Table 4-1. Additional geotechnical assessment will be needed to further evaluate these slopes.
Sixteen (16) shorelines have shoreline slopes less than 33 percent. The surface conditions on these shorelines varied and included riprap, concrete, and vegetation, in some areas. With respect to stability, these slopes were considered sufficiently stable to allow dredging up to 2.5 feet deep to the shore without significant stability concerns, where the original grade is restored immediately after dredging.
4.6 RESULTS
Graphical representations for the influence zones are presented on Figures 4-2 through 4-4. Based on the above criteria, the resulting assessments and calculations for walls are included in Appendix G. A histogram of the influence zones is presented as Figure 4-5. Figures 4-6 and 4-7 present the computed influence zones as a bar chart by river mile along the East and West banks, respectively. Figure 4-8 presents the cumulative area along each bank by river mile for the length of OU2. This evaluation is preliminary and based on the data currently available. In summary, the cumulative area affected by the zone of influence on the east bank is approximately 10.5 acres, and the cumulative area affected by the zone of influence on the west bank is approximately 15 acres. The computed influence zones are based on the limited available data and are considered suitable for the 30 percent design; however, the assessment will be refined as the work progresses and additional data becomes available for future phases of the design. Table 4-2 presents
Lower 8.3 Miles of the Lower Passaic River Preliminary Bulkhead and Shoreline OU 2 of the Diamond Alkali Superfund Site Assessment Report Revision 2, May 2019
4-4 LPROU2-PDI_PBSAR_Rev 2_2019-05-20_CLEAN.docx
the structure and shoreline type breakdown by length and percent of the total 16.6 miles of shoreline in OU2.
Further assessment of the structures and shorelines identified with zones of influence greater than 30 feet is needed to assess the impacts of the proposed remediation and refine the estimated zones of influence. Additional structural and geotechnical data will be obtained, and GDR will be prepared as outlined in Section 3 of the BSE WP. Additional subsurface information will be required to perform the detailed analyses, as outlined in Section 5. The additional assessments will include detailed structural and slope stability analyses performed based on the additional structural and geotechnical data. The results of these assessments will be submitted in Technical Structure Memoranda as described in the BSE WP that will be included in an Appendix of the BODR for the 60 and 95 percent designs, for any structures where dredging is planned within the structure’s zone of influence.
Lower 8.3 Miles of the Lower Passaic River Preliminary Bulkhead and Shoreline OU 2 of the Diamond Alkali Superfund Site Assessment Report Revision 2, May 2019
5-1 LPROU2-PDI_PBSAR_Rev 2_2019-05-20_CLEAN.docx
5 RECOMMENDATIONS FOR FURTHER ASSESSMENT
Inquiries to owners for structure information are ongoing and will continue in an effort to obtain this information for the 60 percent design. Additional contacts will be attempted for the one-third of owners who have not responded to our previous detailed requests for information, and follow-up requests will be made for data and reports referenced within the documents received to date that have not been provided. Any additional data obtained from structure owners will be evaluated and relevant features considered in adjusting the computed influence and assessment of structures.
Data gaps have been identified for bulkheads, structures and shoreline areas that may be impacted if dredging was performed within their respective zones of influence, as discussed in Section 4. Supplemental field investigations will be conducted to obtain additional information to address these data gaps. Specifically, the following walls, structures, and shoreline areas will be further investigated:
• 30 bulkhead walls with zones of influence estimated to be greater than 30 feet. These walls typically have a large zone of influence because they are higher than other walls and construction details of the walls are unknown. The data obtained will be used to refine the zone of influence and to assess potential impacts where dredging may be necessary within the zone of influence.
• 2 bulkhead walls actively-used as mooring structures.
• 11 active mooring structures (pier, wharf, dolphin).
• 51 shoreline areas with steep slopes.
• Among 51 shorelines, 20 shorelines are considered as critical for potential impact from dredging.
These 32 bulkhead structures and 20 shoreline areas will require additional stability evaluation for potential dredging impacts. The 11 active mooring structures will require assessment of foundation depth to determine potential impacts of dredging. The identified data gaps for these structures, where design drawings are not available, include embedment depth, anchorage properties, and soil properties. The supplemental field investigation will include ground-penetrating radar (GPR), and upland soil borings and marine soil borings with or without parallel seismic survey. This investigation will be coordinated with other investigations required to complete the design. Details regarding the proposed additional investigations will be submitted to EPA in the forthcoming PDI Work Plan Addendum.
Lower 8.3 Miles of the Lower Passaic River Preliminary Bulkhead and Shoreline OU 2 of the Diamond Alkali Superfund Site Assessment Report Revision 2, May 2019
6-1 LPROU2-PDI_PBSAR_Rev 2_2019-05-20_CLEAN.docx
6 REFERENCES
EPA. 2014a. Remedial Investigation Report for the Focused Feasibility Study. Prepared by The Louis Berger Group in conjunction with Battelle HDR|HydroQual. 2014.
EPA. 2014b. Focused Feasibility Study Report for the Lower Eight Miles of the Lower Passaic River. Prepared by The Louis Berger Group, Inc. in conjunction with Battelle HDR|HydroQual. 2014.
EPA. 2016a. Record of Decision for Lower 8.3 Miles of the Lower Passaic River Part of the Diamond Alkali Superfund Site Essex and Hudson Counties, New Jersey. EPA Region 2. March 3, 2016.
EPA. 2016b. Statement of Work for Pre-Remedial Design and Remedial Design Lower 8.3 Miles of Lower Passaic River Part of the Diamond Alkali Superfund Site. Essex and Hudson Counties, State of New Jersey. EPA Region 2. September 26, 2016.
Fenneman, N. 1938. Physiography of the Eastern United States. McGraw-Hill, Inc., New York.
FHWA. 1999. Geotechnical Engineering Circular No. 4 Ground Anchors and Anchored System. June 1999.
Meyerhof, G.G., 1957 The Ultimate Bearing Capacity of Foundations on Slopes. 4th International Conference on Soil Mechanics and Foundation Engineering, 384-386.
Nichols, W.O. 1968. Groundwater Resources of Essex County, New Jersey. Special Report No. 28, State of New Jersey Department of Conservation and Economic Development. Trenton, New Jersey.
Olsen, C.R., I.L. Larsen, R.L. Brewster, N.H. Cutshall, R.F. Bopp, and H. Simpson. 1984. A Geochemical Assessment of Sedimentation and Contaminant distributions in the Hudson-Raritan Estuary. NOAA, NOS OMS 2. June.
Stanford, Scott. 2002. Surficial Geology of the Elizabeth Quadrangle, Essex, Hudson, and Union Counties, New Jersey. Open File Map 42. New Jersey Department of Environmental Protection, Division of Science, Research, and Technology, New Jersey Geological Survey. Prepared in cooperation with the U.S. Geological Survey, National Geologic Mapping Program.
Tetra Tech. 2017a. Project Management Plan. Remedial Design – Lower 8.3 Miles of the Lower Passaic River, Operable Unit Two of the Diamond Alkali Superfund Site, In and About Essex, Hudson, Bergen and Passaic Counties – New Jersey. Revision 1, February 2017.
Tetra Tech. 2017b. Remedial Design Work Plan. Remedial Design – Lower 8.3 Miles of the Lower Passaic River, Operable Unit Two of the Diamond Alkali Superfund Site, In and About Essex, Hudson, Bergen and Passaic Counties – New Jersey. Revision 2, March 2017.
Tetra Tech. 2018a. Health and Safety Plan. Remedial Design – Lower 8.3 Miles of the Lower Passaic River, Operable Unit Two of the Diamond Alkali Superfund Site, In and About Essex, Hudson, Bergen, and Passaic Counties – New Jersey. Parsippany, New Jersey. Revision 4, July 2018.
Tetra Tech. 2018b. Uniform Federal Policy-Quality Assurance Project Plan (UFP-QAPP) [Field Sampling Plan (FSP) and Quality Assurance Project Plan (QAPP)]. Remedial Design – Lower 8.3 Miles of
Lower 8.3 Miles of the Lower Passaic River Preliminary Bulkhead and Shoreline OU 2 of the Diamond Alkali Superfund Site Assessment Report Revision 2, May 2019
6-2 LPROU2-PDI_PBSAR_Rev 2_2019-05-20_CLEAN.docx
the Lower Passaic River, Operable Unit Two of the Diamond Alkali Superfund Site, In and About Essex, Hudson, Bergen and Passaic Counties - New Jersey. Parsippany, New Jersey. Revision 10, June 2018.
Tetra Tech. 2018c. Geophysical, Bathymetric, Shoreline, and Debris Survey Report. Remedial Design – Lower 8.3 Miles of the Lower Passaic River, Operable Unit Two of the Diamond Alkali Superfund Site, In and About Essex, Hudson, Bergen and Passaic Counties - New Jersey. Parsippany, New Jersey. Revision 1, February 2018.
Tierra Solutions, Inc. 2013. Combined Sewer Overflow/Stormwater Outfall Investigation Quality Assurance Project Plan, Lower Passaic River Study, Area September 2013.
USACE. 2010. Lower Passaic River Commercial Navigation Analysis. United States Army Corps of Engineers. New York District. Revision 2, July 2010.
Lower 8.3 Miles of the Lower Passaic River Preliminary Bulkhead and Shoreline OU 2 of the Diamond Alkali Superfund Site Assessment Report Revision 2, May 2019
LPROU2-PDI_PBSAR_Rev 2_2019-05-20_CLEAN.docx
TABLES
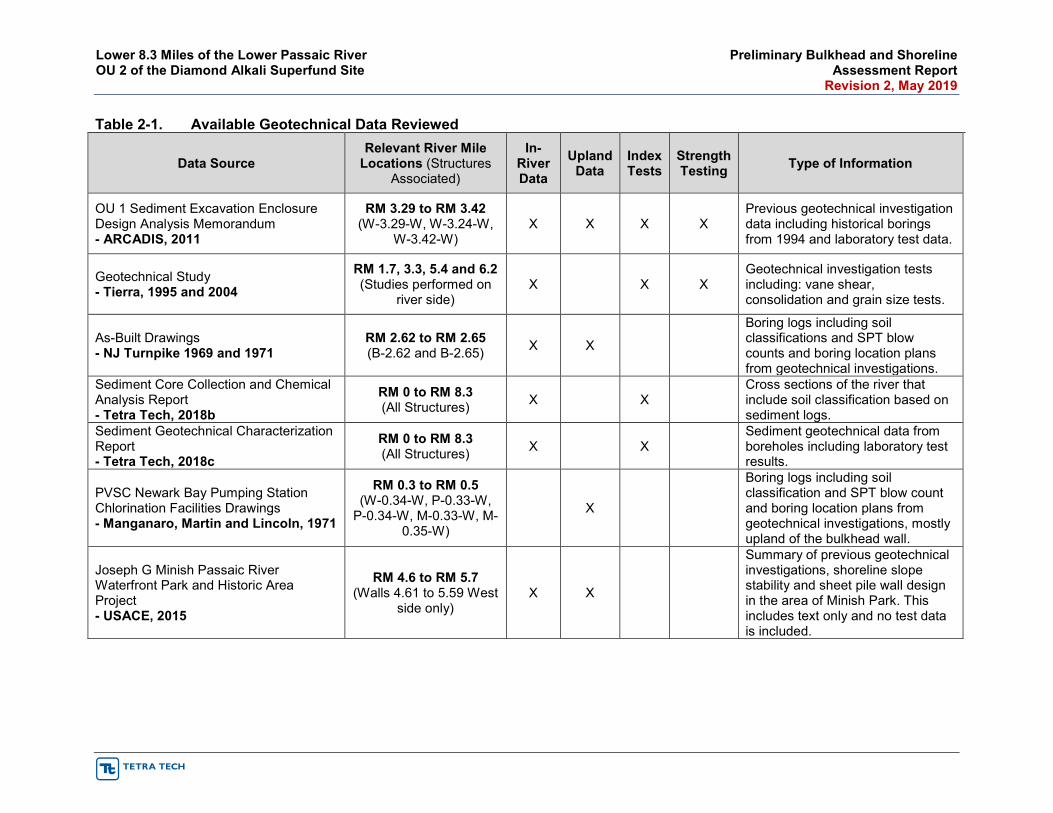
Lower 8.3 Miles of the Lower Passaic River Preliminary Bulkhead and Shoreline OU 2 of the Diamond Alkali Superfund Site Assessment Report Revision 2, May 2019
Table 2-1. Available Geotechnical Data Reviewed
Data Source Relevant River Mile
Locations (Structures Associated)
In-River Data
Upland Data
Index Tests
Strength Testing Type of Information
OU 1 Sediment Excavation Enclosure Design Analysis Memorandum - ARCADIS, 2011
RM 3.29 to RM 3.42 (W-3.29-W, W-3.24-W,
W-3.42-W) X X X X
Previous geotechnical investigation data including historical borings from 1994 and laboratory test data.
Geotechnical Study - Tierra, 1995 and 2004
RM 1.7, 3.3, 5.4 and 6.2 (Studies performed on
river side) X X X
Geotechnical investigation tests including: vane shear, consolidation and grain size tests.
As-Built Drawings - NJ Turnpike 1969 and 1971
RM 2.62 to RM 2.65 (B-2.62 and B-2.65) X X
Boring logs including soil classifications and SPT blow counts and boring location plans from geotechnical investigations.
Sediment Core Collection and Chemical Analysis Report - Tetra Tech, 2018b
RM 0 to RM 8.3 (All Structures) X X
Cross sections of the river that include soil classification based on sediment logs.
Sediment Geotechnical Characterization Report - Tetra Tech, 2018c
RM 0 to RM 8.3 (All Structures) X X
Sediment geotechnical data from boreholes including laboratory test results.
PVSC Newark Bay Pumping Station Chlorination Facilities Drawings - Manganaro, Martin and Lincoln, 1971
RM 0.3 to RM 0.5 (W-0.34-W, P-0.33-W,
P-0.34-W, M-0.33-W, M-0.35-W)
X
Boring logs including soil classification and SPT blow count and boring location plans from geotechnical investigations, mostly upland of the bulkhead wall.
Joseph G Minish Passaic River Waterfront Park and Historic Area Project - USACE, 2015
RM 4.6 to RM 5.7 (Walls 4.61 to 5.59 West
side only) X X
Summary of previous geotechnical investigations, shoreline slope stability and sheet pile wall design in the area of Minish Park. This includes text only and no test data is included.
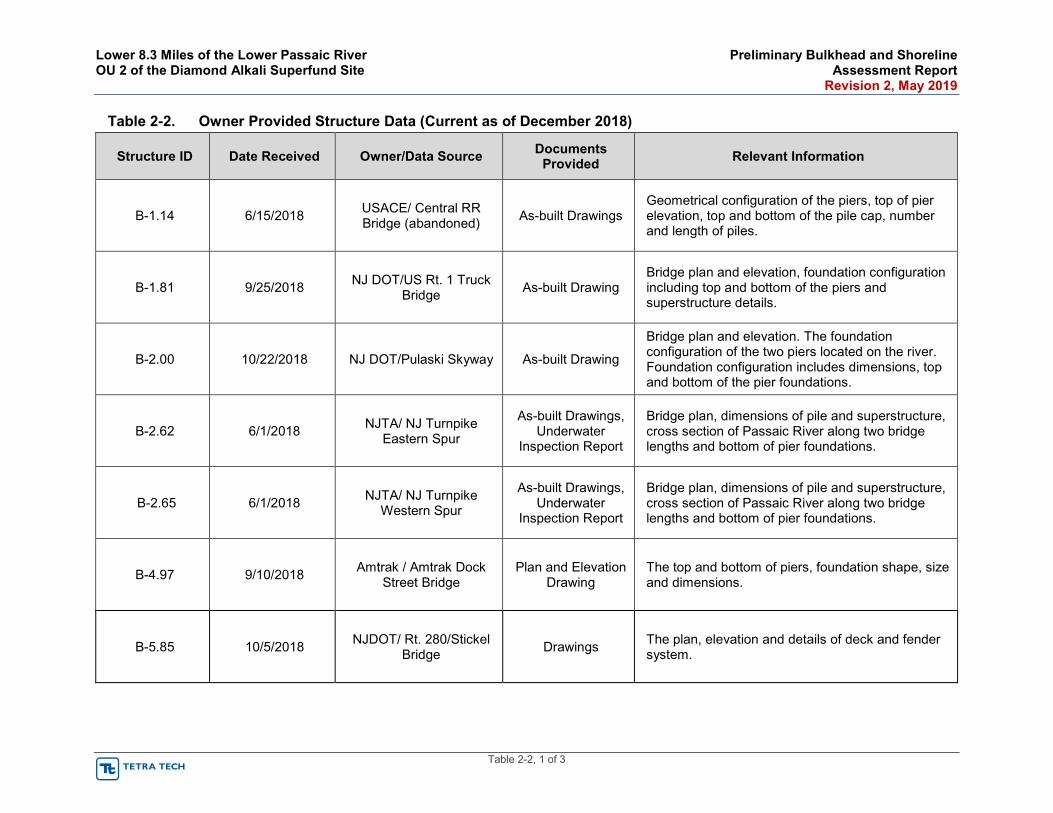
Lower 8.3 Miles of the Lower Passaic River Preliminary Bulkhead and Shoreline OU 2 of the Diamond Alkali Superfund Site Assessment Report Revision 2, May 2019
Table 2-2, 1 of 3
Table 2-2. Owner Provided Structure Data (Current as of December 2018)
Structure ID Date Received Owner/Data Source Documents Provided Relevant Information
B-1.14 6/15/2018 USACE/ Central RR Bridge (abandoned) As-built Drawings
Geometrical configuration of the piers, top of pier elevation, top and bottom of the pile cap, number and length of piles.
B-1.81 9/25/2018 NJ DOT/US Rt. 1 Truck Bridge As-built Drawing
Bridge plan and elevation, foundation configuration including top and bottom of the piers and superstructure details.
B-2.00 10/22/2018 NJ DOT/Pulaski Skyway As-built Drawing
Bridge plan and elevation. The foundation configuration of the two piers located on the river. Foundation configuration includes dimensions, top and bottom of the pier foundations.
B-2.62 6/1/2018 NJTA/ NJ Turnpike Eastern Spur
As-built Drawings, Underwater
Inspection Report
Bridge plan, dimensions of pile and superstructure, cross section of Passaic River along two bridge lengths and bottom of pier foundations.
B-2.65 6/1/2018 NJTA/ NJ Turnpike Western Spur
As-built Drawings, Underwater
Inspection Report
Bridge plan, dimensions of pile and superstructure, cross section of Passaic River along two bridge lengths and bottom of pier foundations.
B-4.97 9/10/2018 Amtrak / Amtrak Dock Street Bridge
Plan and Elevation Drawing
The top and bottom of piers, foundation shape, size and dimensions.
B-5.85 10/5/2018 NJDOT/ Rt. 280/Stickel Bridge Drawings The plan, elevation and details of deck and fender
system.
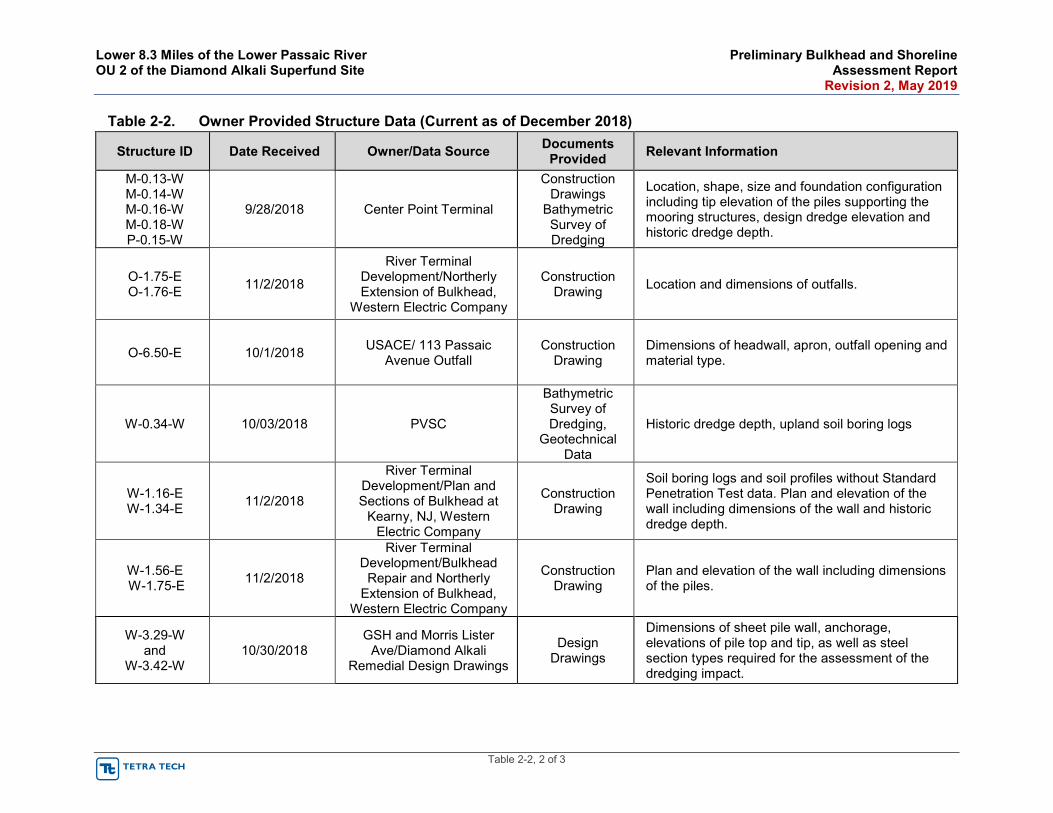
Lower 8.3 Miles of the Lower Passaic River Preliminary Bulkhead and Shoreline OU 2 of the Diamond Alkali Superfund Site Assessment Report Revision 2, May 2019
Table 2-2, 2 of 3
Table 2-2. Owner Provided Structure Data (Current as of December 2018)
Structure ID Date Received Owner/Data Source Documents Provided Relevant Information
M-0.13-W M-0.14-W M-0.16-W M-0.18-W P-0.15-W
9/28/2018 Center Point Terminal
Construction Drawings
Bathymetric Survey of Dredging
Location, shape, size and foundation configuration including tip elevation of the piles supporting the mooring structures, design dredge elevation and historic dredge depth.
O-1.75-E O-1.76-E 11/2/2018
River Terminal Development/Northerly Extension of Bulkhead,
Western Electric Company
Construction Drawing Location and dimensions of outfalls.
O-6.50-E 10/1/2018 USACE/ 113 Passaic Avenue Outfall
Construction Drawing
Dimensions of headwall, apron, outfall opening and material type.
W-0.34-W 10/03/2018 PVSC
Bathymetric Survey of Dredging,
Geotechnical Data
Historic dredge depth, upland soil boring logs
W-1.16-E W-1.34-E 11/2/2018
River Terminal Development/Plan and Sections of Bulkhead at
Kearny, NJ, Western Electric Company
Construction Drawing
Soil boring logs and soil profiles without Standard Penetration Test data. Plan and elevation of the wall including dimensions of the wall and historic dredge depth.
W-1.56-E W-1.75-E 11/2/2018
River Terminal Development/Bulkhead
Repair and Northerly Extension of Bulkhead,
Western Electric Company
Construction Drawing
Plan and elevation of the wall including dimensions of the piles.
W-3.29-W and
W-3.42-W 10/30/2018
GSH and Morris Lister Ave/Diamond Alkali
Remedial Design Drawings
Design Drawings
Dimensions of sheet pile wall, anchorage, elevations of pile top and tip, as well as steel section types required for the assessment of the dredging impact.
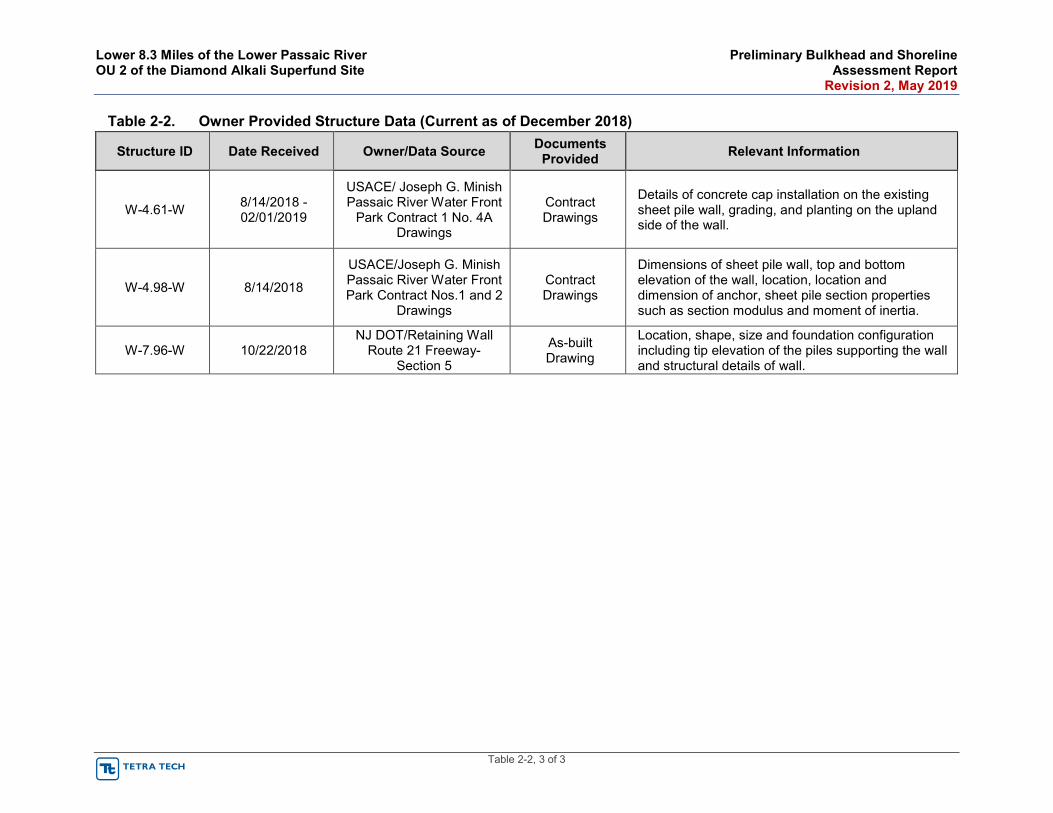
Lower 8.3 Miles of the Lower Passaic River Preliminary Bulkhead and Shoreline OU 2 of the Diamond Alkali Superfund Site Assessment Report Revision 2, May 2019
Table 2-2, 3 of 3
Table 2-2. Owner Provided Structure Data (Current as of December 2018)
Structure ID Date Received Owner/Data Source Documents Provided Relevant Information
W-4.61-W 8/14/2018 -02/01/2019
USACE/ Joseph G. Minish Passaic River Water Front
Park Contract 1 No. 4A Drawings
Contract Drawings
Details of concrete cap installation on the existing sheet pile wall, grading, and planting on the upland side of the wall.
W-4.98-W 8/14/2018
USACE/Joseph G. Minish Passaic River Water Front Park Contract Nos.1 and 2
Drawings
Contract Drawings
Dimensions of sheet pile wall, top and bottom elevation of the wall, location, location and dimension of anchor, sheet pile section properties such as section modulus and moment of inertia.
W-7.96-W 10/22/2018 NJ DOT/Retaining Wall
Route 21 Freeway-Section 5
As-built Drawing
Location, shape, size and foundation configuration including tip elevation of the piles supporting the wall and structural details of wall.
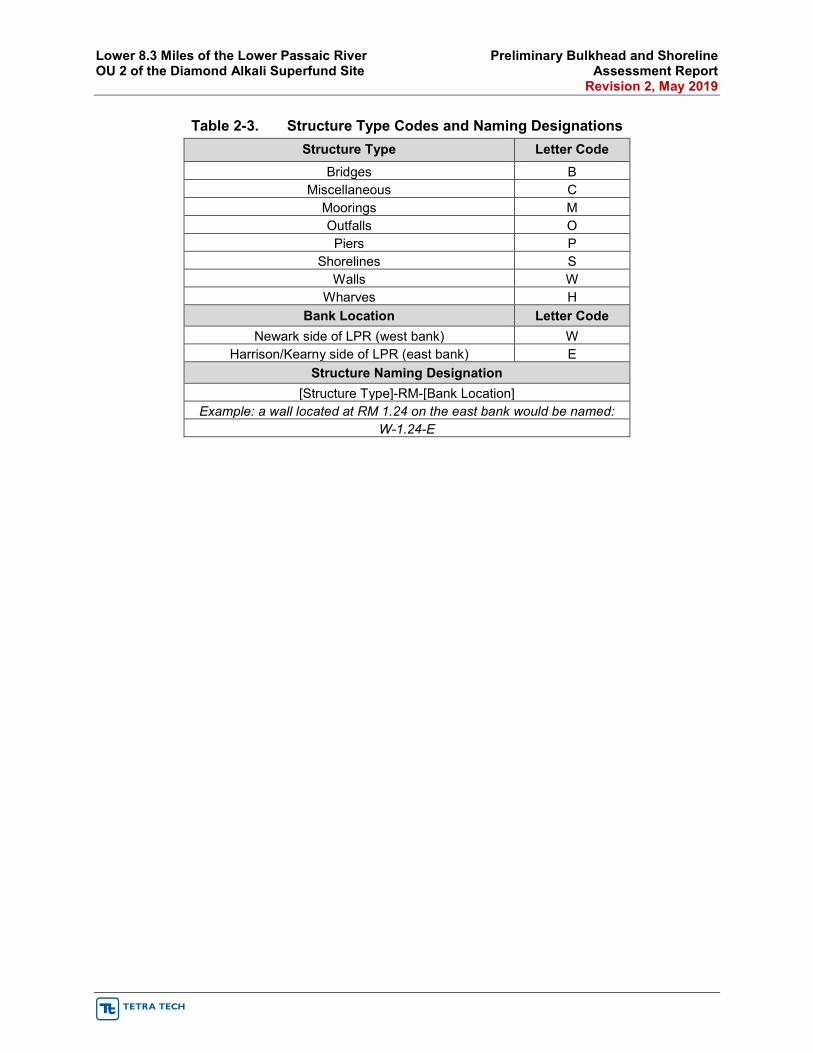
Lower 8.3 Miles of the Lower Passaic River Preliminary Bulkhead and Shoreline OU 2 of the Diamond Alkali Superfund Site Assessment Report Revision 2, May 2019
Table 2-3. Structure Type Codes and Naming Designations Structure Type Letter Code
Bridges B Miscellaneous C
Moorings M Outfalls O Piers P
Shorelines S Walls W
Wharves H Bank Location Letter Code
Newark side of LPR (west bank) W Harrison/Kearny side of LPR (east bank) E
Structure Naming Designation [Structure Type]-RM-[Bank Location]
Example: a wall located at RM 1.24 on the east bank would be named: W-1.24-E
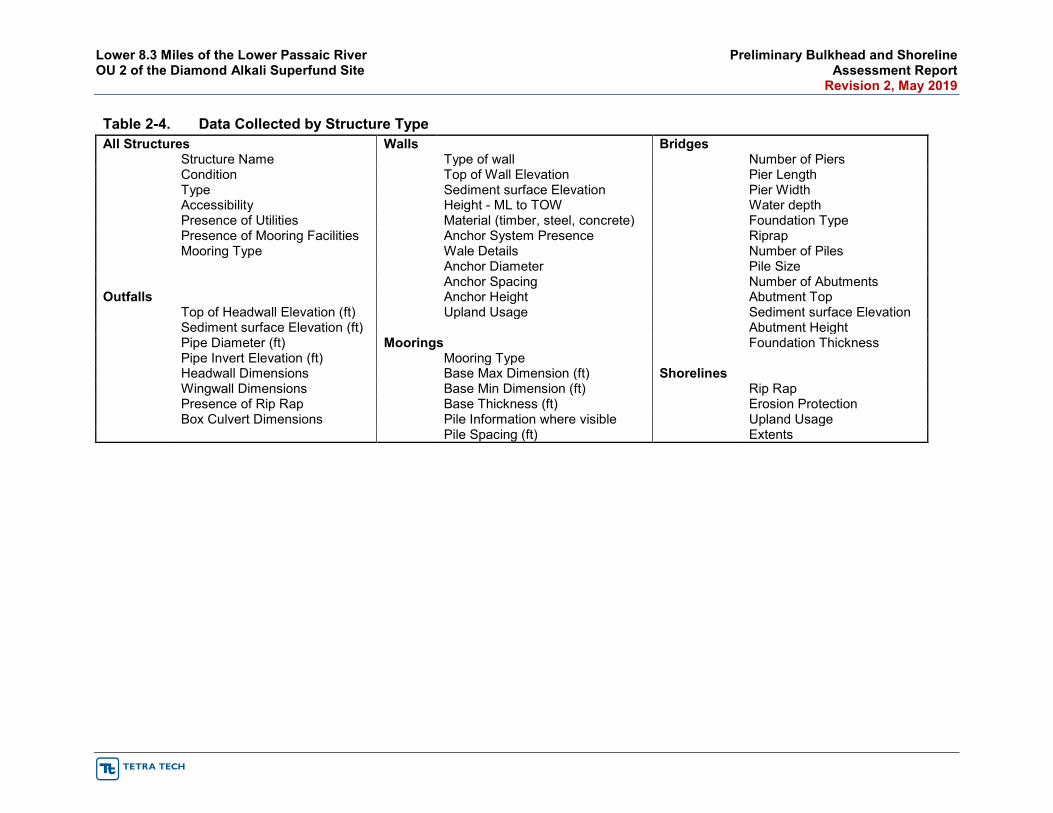
Lower 8.3 Miles of the Lower Passaic River Preliminary Bulkhead and Shoreline OU 2 of the Diamond Alkali Superfund Site Assessment Report Revision 2, May 2019
Table 2-4. Data Collected by Structure Type All Structures Walls Bridges Structure Name Type of wall Number of Piers Condition Top of Wall Elevation Pier Length Type Sediment surface Elevation Pier Width Accessibility Height - ML to TOW Water depth Presence of Utilities Material (timber, steel, concrete) Foundation Type Presence of Mooring Facilities Anchor System Presence Riprap Mooring Type Wale Details Number of Piles Anchor Diameter Pile Size Anchor Spacing Number of Abutments Outfalls Anchor Height Abutment Top Top of Headwall Elevation (ft) Upland Usage Sediment surface Elevation Sediment surface Elevation (ft) Abutment Height Pipe Diameter (ft) Moorings Foundation Thickness Pipe Invert Elevation (ft) Mooring Type Headwall Dimensions Base Max Dimension (ft) Shorelines Wingwall Dimensions Base Min Dimension (ft) Rip Rap Presence of Rip Rap Base Thickness (ft) Erosion Protection Box Culvert Dimensions Pile Information where visible Upland Usage Pile Spacing (ft) Extents

Lower 8.3 Miles of the Lower Passaic River Preliminary Bulkhead and Shoreline OU 2 of the Diamond Alkali Superfund Site Assessment Report Revision 2, May 2019
Table 2-5. Future Development Plans
Description RM Comment
Design of the Joseph G. Minish Passaic River Waterfront Park and Historic Area Project (USACE, 2015)
Locations of the shorelines are identified in terms of chainage; Bridge Street is located as chainage 0+00 and Jackson Street as chainage 92+13. Based on this report, construction of the bulkhead was already completed in the area of chainage 20+00 to 24+00, chainage 24+00 to 37+00 and chainage 45+00 to 57+00 in 2015. Bulkheads are proposed in the area of chainage 0+00 to 9+00, chainage 9+00 to 20+03, chainage 37+00 to 45+00 and chainage 57+00 to 62+00. The design parameters and a summary of the design including geometrical configurations of the bulkhead are available in this report. The geometrical parameters such as anchor elevation, angle of the anchor, design sediment surface elevation, minimum embedment to rock, the diameter of the anchor, minimum bonded length of the anchor, anchor capacity, and sheet pile section were included in this report. A sheet pile cap is provided in the proposed area of bulkhead construction except in the area of chainage 37+10 to 45+68.
4.61 This project has continued to progress since the issuance of this report with portions in various stages of planning and construction.
Gotham Aggregates Gotham is purchasing the property adjacent to the existing mooring dolphin M-0.84-W. This dolphin is associated with the abandoned Pier P-0.91-W located on the adjacent property to the north. In verbal communications on August 22, 2018 between Jason Darley of Tetra Tech and Thomas Wade, Director of Operations for Gotham Aggregates, Gotham plans to install a pier for mooring and offloading vessels at this property. Their intended development will include a dock to be built at the property within the next 6 months having a minimum draft of -12.5 feet MLW.
0.84 The shoreline of this property is presently undeveloped. There are no plans nor firm schedule for the Gotham’s desired development.
Clean Earth Clean Earth operates facilities at H-2.28-E and W-2.28-E. Based on current bathymetry, Clean Earth only has access for shallow-draft barges and small boats. On September 11, 2018, Robert Fixter, General Manager for Clean Earth indicated that they would like to deepen this area to accommodate a minimum draft of -17 feet MLW.
2.28 There is no indication of any prior dredging or access for deep drafted vessels for this site. No documentation is available relating to the desired improvements.
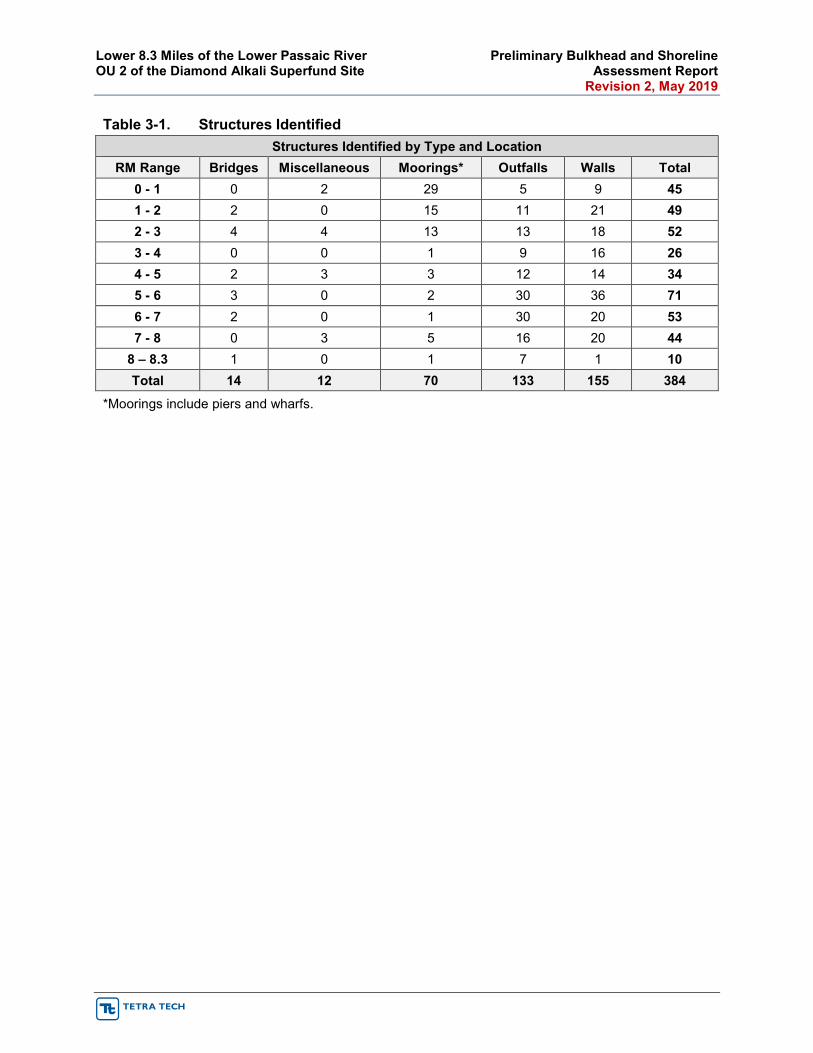
Lower 8.3 Miles of the Lower Passaic River Preliminary Bulkhead and Shoreline OU 2 of the Diamond Alkali Superfund Site Assessment Report Revision 2, May 2019
Table 3-1. Structures Identified Structures Identified by Type and Location
RM Range Bridges Miscellaneous Moorings* Outfalls Walls Total 0 - 1 0 2 29 5 9 45 1 - 2 2 0 15 11 21 49 2 - 3 4 4 13 13 18 52 3 - 4 0 0 1 9 16 26 4 - 5 2 3 3 12 14 34 5 - 6 3 0 2 30 36 71 6 - 7 2 0 1 30 20 53 7 - 8 0 3 5 16 20 44
8 – 8.3 1 0 1 7 1 10 Total 14 12 70 133 155 384
*Moorings include piers and wharfs.
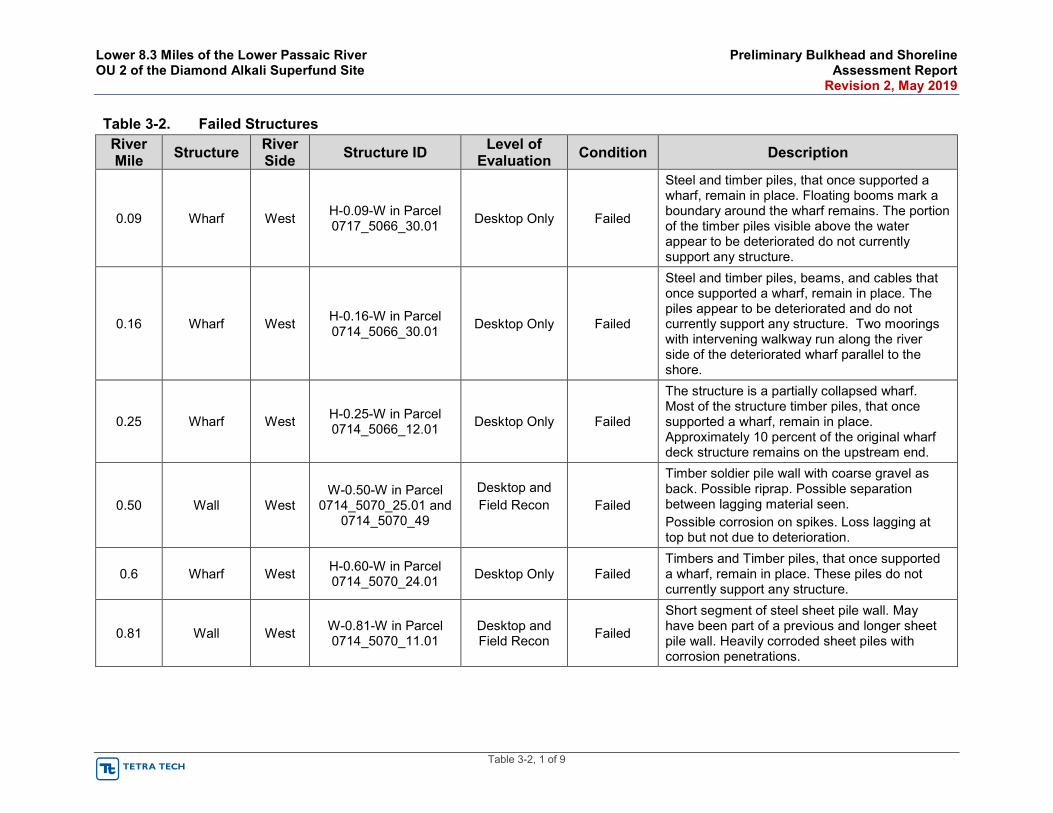
Lower 8.3 Miles of the Lower Passaic River Preliminary Bulkhead and Shoreline OU 2 of the Diamond Alkali Superfund Site Assessment Report Revision 2, May 2019
Table 3-2, 1 of 9
Table 3-2. Failed Structures River Mile Structure River
Side Structure ID Level of Evaluation Condition Description
0.09 Wharf West H-0.09-W in Parcel 0717_5066_30.01 Desktop Only Failed
Steel and timber piles, that once supported a wharf, remain in place. Floating booms mark a boundary around the wharf remains. The portion of the timber piles visible above the water appear to be deteriorated do not currently support any structure.
0.16 Wharf West H-0.16-W in Parcel 0714_5066_30.01 Desktop Only Failed
Steel and timber piles, beams, and cables that once supported a wharf, remain in place. The piles appear to be deteriorated and do not currently support any structure. Two moorings with intervening walkway run along the river side of the deteriorated wharf parallel to the shore.
0.25 Wharf West H-0.25-W in Parcel 0714_5066_12.01 Desktop Only Failed
The structure is a partially collapsed wharf. Most of the structure timber piles, that once supported a wharf, remain in place. Approximately 10 percent of the original wharf deck structure remains on the upstream end.
0.50 Wall West W-0.50-W in Parcel
0714_5070_25.01 and 0714_5070_49
Desktop and Field Recon Failed
Timber soldier pile wall with coarse gravel as back. Possible riprap. Possible separation between lagging material seen. Possible corrosion on spikes. Loss lagging at top but not due to deterioration.
0.6 Wharf West H-0.60-W in Parcel 0714_5070_24.01 Desktop Only Failed
Timbers and Timber piles, that once supported a wharf, remain in place. These piles do not currently support any structure.
0.81 Wall West W-0.81-W in Parcel 0714_5070_11.01
Desktop and Field Recon Failed
Short segment of steel sheet pile wall. May have been part of a previous and longer sheet pile wall. Heavily corroded sheet piles with corrosion penetrations.
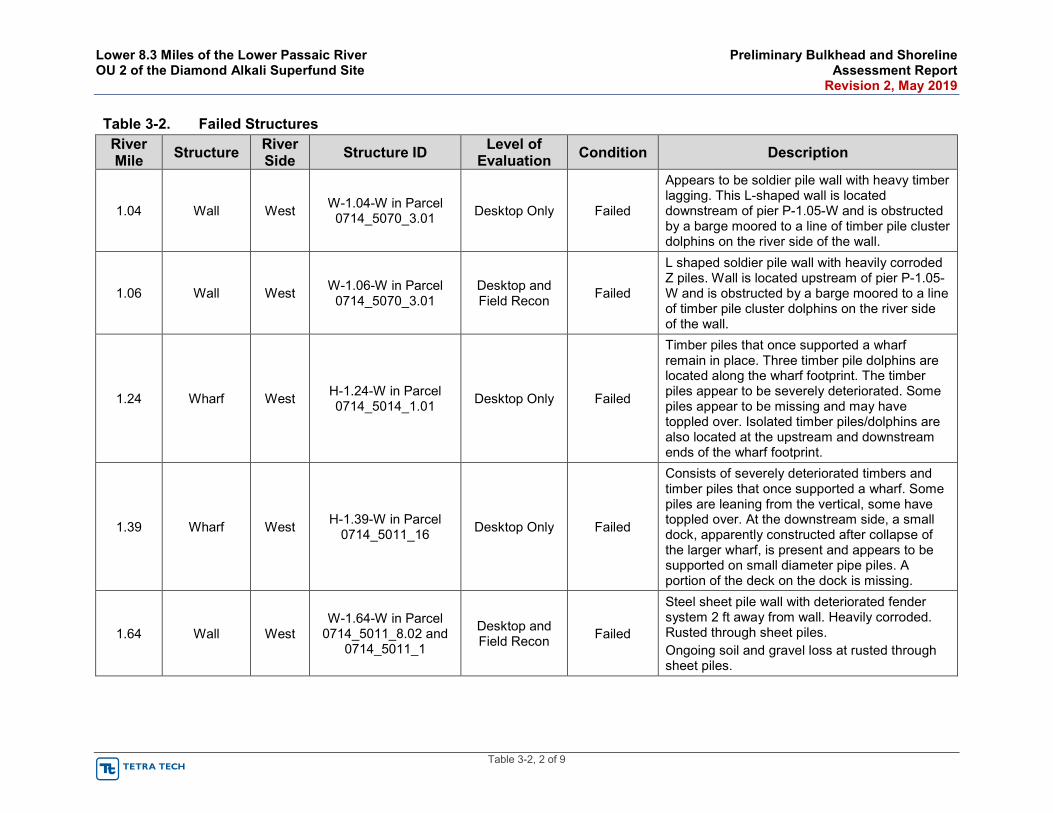
Lower 8.3 Miles of the Lower Passaic River Preliminary Bulkhead and Shoreline OU 2 of the Diamond Alkali Superfund Site Assessment Report Revision 2, May 2019
Table 3-2, 2 of 9
Table 3-2. Failed Structures River Mile Structure River
Side Structure ID Level of Evaluation Condition Description
1.04 Wall West W-1.04-W in Parcel 0714_5070_3.01 Desktop Only Failed
Appears to be soldier pile wall with heavy timber lagging. This L-shaped wall is located downstream of pier P-1.05-W and is obstructed by a barge moored to a line of timber pile cluster dolphins on the river side of the wall.
1.06 Wall West W-1.06-W in Parcel 0714_5070_3.01
Desktop and Field Recon Failed
L shaped soldier pile wall with heavily corroded Z piles. Wall is located upstream of pier P-1.05-W and is obstructed by a barge moored to a line of timber pile cluster dolphins on the river side of the wall.
1.24 Wharf West H-1.24-W in Parcel 0714_5014_1.01 Desktop Only Failed
Timber piles that once supported a wharf remain in place. Three timber pile dolphins are located along the wharf footprint. The timber piles appear to be severely deteriorated. Some piles appear to be missing and may have toppled over. Isolated timber piles/dolphins are also located at the upstream and downstream ends of the wharf footprint.
1.39 Wharf West H-1.39-W in Parcel 0714_5011_16 Desktop Only Failed
Consists of severely deteriorated timbers and timber piles that once supported a wharf. Some piles are leaning from the vertical, some have toppled over. At the downstream side, a small dock, apparently constructed after collapse of the larger wharf, is present and appears to be supported on small diameter pipe piles. A portion of the deck on the dock is missing.
1.64 Wall West W-1.64-W in Parcel
0714_5011_8.02 and 0714_5011_1
Desktop and Field Recon Failed
Steel sheet pile wall with deteriorated fender system 2 ft away from wall. Heavily corroded. Rusted through sheet piles. Ongoing soil and gravel loss at rusted through sheet piles.
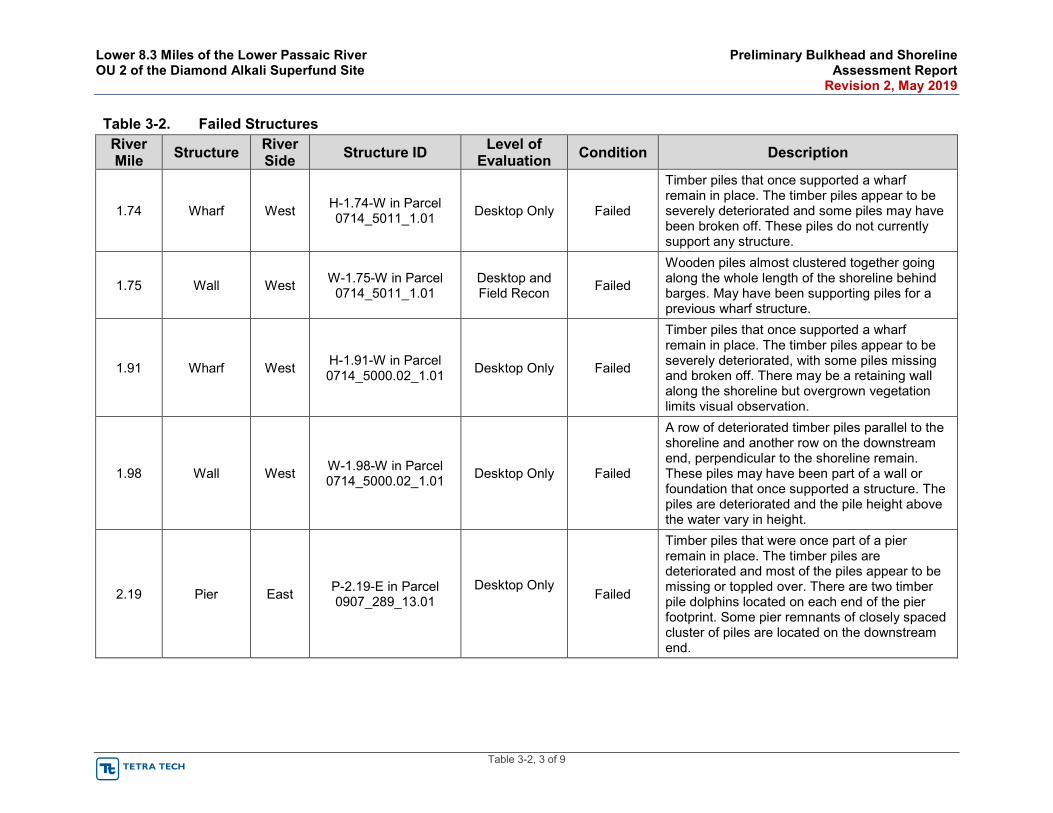
Lower 8.3 Miles of the Lower Passaic River Preliminary Bulkhead and Shoreline OU 2 of the Diamond Alkali Superfund Site Assessment Report Revision 2, May 2019
Table 3-2, 3 of 9
Table 3-2. Failed Structures River Mile Structure River
Side Structure ID Level of Evaluation Condition Description
1.74 Wharf West H-1.74-W in Parcel 0714_5011_1.01 Desktop Only Failed
Timber piles that once supported a wharf remain in place. The timber piles appear to be severely deteriorated and some piles may have been broken off. These piles do not currently support any structure.
1.75 Wall West W-1.75-W in Parcel 0714_5011_1.01
Desktop and Field Recon Failed
Wooden piles almost clustered together going along the whole length of the shoreline behind barges. May have been supporting piles for a previous wharf structure.
1.91 Wharf West H-1.91-W in Parcel 0714_5000.02_1.01 Desktop Only Failed
Timber piles that once supported a wharf remain in place. The timber piles appear to be severely deteriorated, with some piles missing and broken off. There may be a retaining wall along the shoreline but overgrown vegetation limits visual observation.
1.98 Wall West W-1.98-W in Parcel 0714_5000.02_1.01 Desktop Only Failed
A row of deteriorated timber piles parallel to the shoreline and another row on the downstream end, perpendicular to the shoreline remain. These piles may have been part of a wall or foundation that once supported a structure. The piles are deteriorated and the pile height above the water vary in height.
2.19 Pier East P-2.19-E in Parcel 0907_289_13.01
Desktop Only Failed
Timber piles that were once part of a pier remain in place. The timber piles are deteriorated and most of the piles appear to be missing or toppled over. There are two timber pile dolphins located on each end of the pier footprint. Some pier remnants of closely spaced cluster of piles are located on the downstream end.
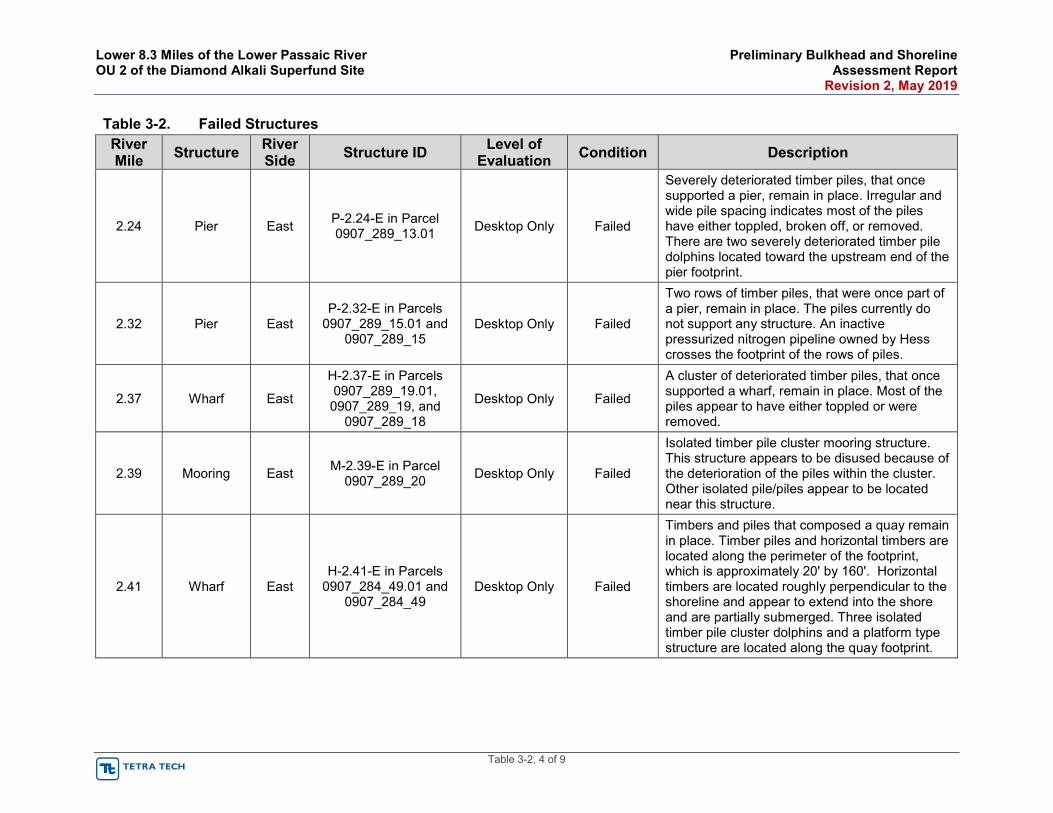
Lower 8.3 Miles of the Lower Passaic River Preliminary Bulkhead and Shoreline OU 2 of the Diamond Alkali Superfund Site Assessment Report Revision 2, May 2019
Table 3-2, 4 of 9
Table 3-2. Failed Structures River Mile Structure River
Side Structure ID Level of Evaluation Condition Description
2.24 Pier East P-2.24-E in Parcel 0907_289_13.01 Desktop Only Failed
Severely deteriorated timber piles, that once supported a pier, remain in place. Irregular and wide pile spacing indicates most of the piles have either toppled, broken off, or removed. There are two severely deteriorated timber pile dolphins located toward the upstream end of the pier footprint.
2.32 Pier East P-2.32-E in Parcels
0907_289_15.01 and 0907_289_15
Desktop Only Failed
Two rows of timber piles, that were once part of a pier, remain in place. The piles currently do not support any structure. An inactive pressurized nitrogen pipeline owned by Hess crosses the footprint of the rows of piles.
2.37 Wharf East
H-2.37-E in Parcels 0907_289_19.01, 0907_289_19, and
0907_289_18
Desktop Only Failed
A cluster of deteriorated timber piles, that once supported a wharf, remain in place. Most of the piles appear to have either toppled or were removed.
2.39 Mooring East M-2.39-E in Parcel 0907_289_20 Desktop Only Failed
Isolated timber pile cluster mooring structure. This structure appears to be disused because of the deterioration of the piles within the cluster. Other isolated pile/piles appear to be located near this structure.
2.41 Wharf East H-2.41-E in Parcels
0907_284_49.01 and 0907_284_49
Desktop Only Failed
Timbers and piles that composed a quay remain in place. Timber piles and horizontal timbers are located along the perimeter of the footprint, which is approximately 20' by 160'. Horizontal timbers are located roughly perpendicular to the shoreline and appear to extend into the shore and are partially submerged. Three isolated timber pile cluster dolphins and a platform type structure are located along the quay footprint.
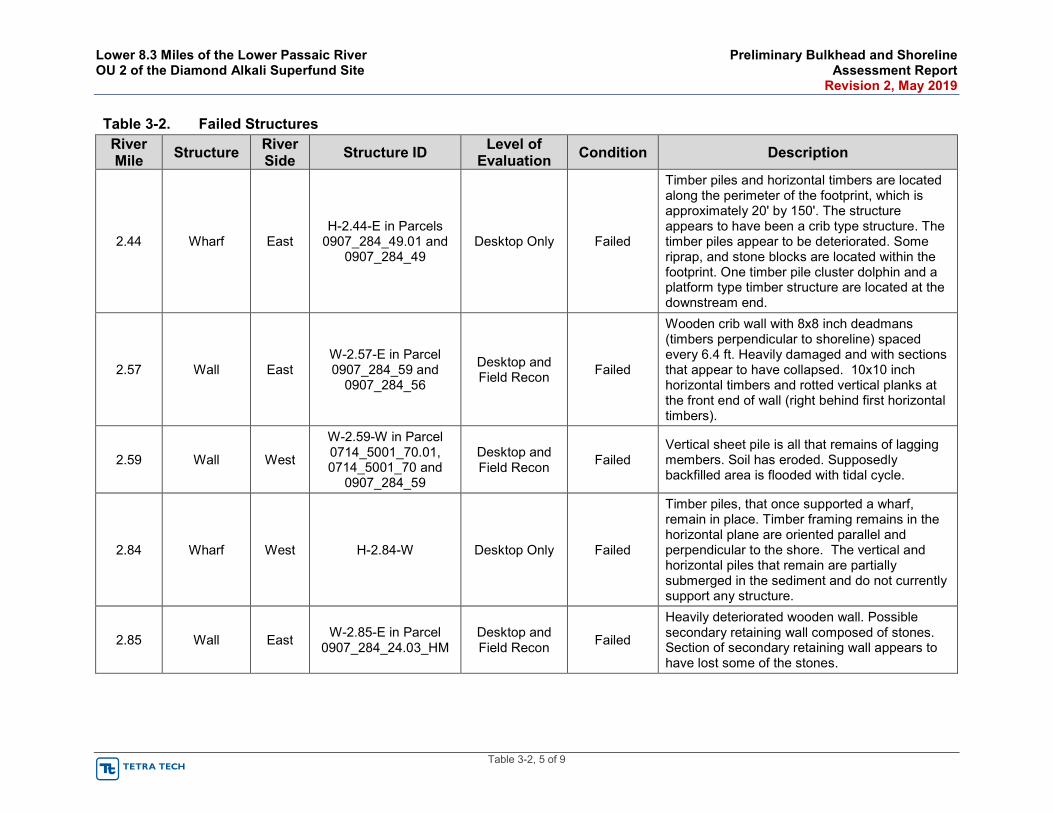
Lower 8.3 Miles of the Lower Passaic River Preliminary Bulkhead and Shoreline OU 2 of the Diamond Alkali Superfund Site Assessment Report Revision 2, May 2019
Table 3-2, 5 of 9
Table 3-2. Failed Structures River Mile Structure River
Side Structure ID Level of Evaluation Condition Description
2.44 Wharf East H-2.44-E in Parcels
0907_284_49.01 and 0907_284_49
Desktop Only Failed
Timber piles and horizontal timbers are located along the perimeter of the footprint, which is approximately 20' by 150'. The structure appears to have been a crib type structure. The timber piles appear to be deteriorated. Some riprap, and stone blocks are located within the footprint. One timber pile cluster dolphin and a platform type timber structure are located at the downstream end.
2.57 Wall East W-2.57-E in Parcel 0907_284_59 and
0907_284_56
Desktop and Field Recon Failed
Wooden crib wall with 8x8 inch deadmans (timbers perpendicular to shoreline) spaced every 6.4 ft. Heavily damaged and with sections that appear to have collapsed. 10x10 inch horizontal timbers and rotted vertical planks at the front end of wall (right behind first horizontal timbers).
2.59 Wall West
W-2.59-W in Parcel 0714_5001_70.01, 0714_5001_70 and
0907_284_59
Desktop and Field Recon Failed
Vertical sheet pile is all that remains of lagging members. Soil has eroded. Supposedly backfilled area is flooded with tidal cycle.
2.84 Wharf West H-2.84-W Desktop Only Failed
Timber piles, that once supported a wharf, remain in place. Timber framing remains in the horizontal plane are oriented parallel and perpendicular to the shore. The vertical and horizontal piles that remain are partially submerged in the sediment and do not currently support any structure.
2.85 Wall East W-2.85-E in Parcel 0907_284_24.03_HM
Desktop and Field Recon Failed
Heavily deteriorated wooden wall. Possible secondary retaining wall composed of stones. Section of secondary retaining wall appears to have lost some of the stones.
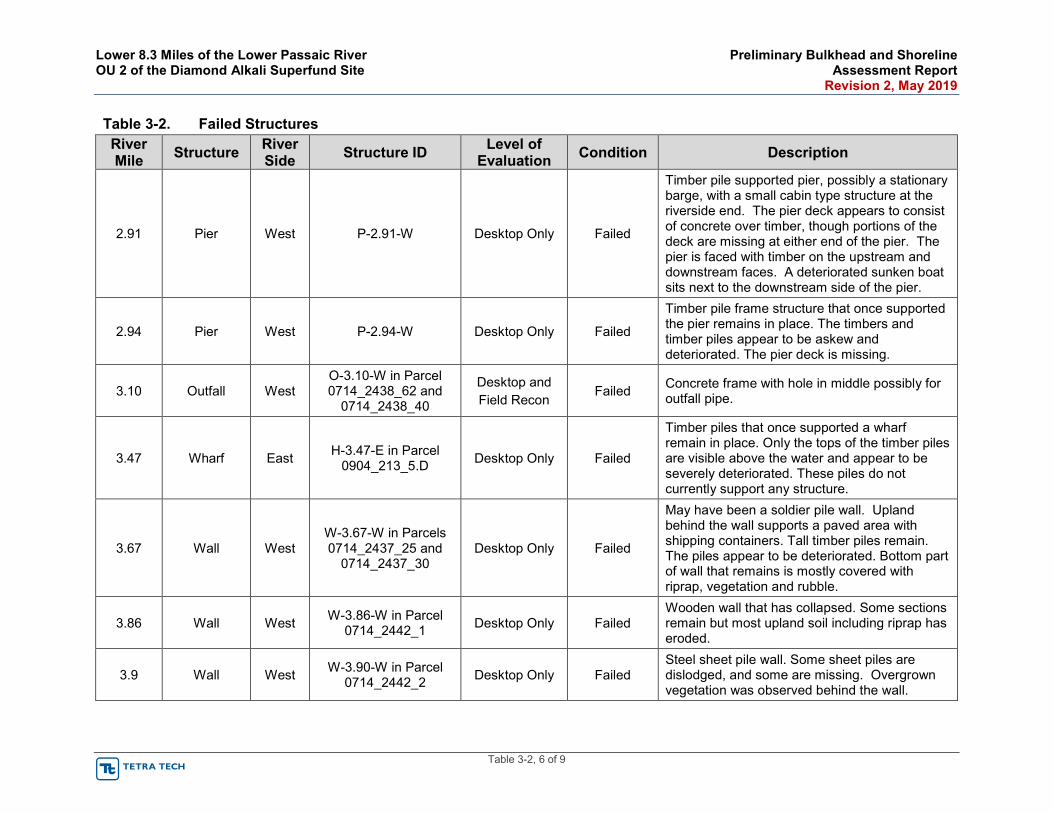
Lower 8.3 Miles of the Lower Passaic River Preliminary Bulkhead and Shoreline OU 2 of the Diamond Alkali Superfund Site Assessment Report Revision 2, May 2019
Table 3-2, 6 of 9
Table 3-2. Failed Structures River Mile Structure River
Side Structure ID Level of Evaluation Condition Description
2.91 Pier West P-2.91-W Desktop Only Failed
Timber pile supported pier, possibly a stationary barge, with a small cabin type structure at the riverside end. The pier deck appears to consist of concrete over timber, though portions of the deck are missing at either end of the pier. The pier is faced with timber on the upstream and downstream faces. A deteriorated sunken boat sits next to the downstream side of the pier.
2.94 Pier West P-2.94-W Desktop Only Failed
Timber pile frame structure that once supported the pier remains in place. The timbers and timber piles appear to be askew and deteriorated. The pier deck is missing.
3.10 Outfall West O-3.10-W in Parcel 0714_2438_62 and
0714_2438_40
Desktop and Field Recon
Failed Concrete frame with hole in middle possibly for outfall pipe.
3.47 Wharf East H-3.47-E in Parcel 0904_213_5.D Desktop Only Failed
Timber piles that once supported a wharf remain in place. Only the tops of the timber piles are visible above the water and appear to be severely deteriorated. These piles do not currently support any structure.
3.67 Wall West W-3.67-W in Parcels 0714_2437_25 and
0714_2437_30 Desktop Only Failed
May have been a soldier pile wall. Upland behind the wall supports a paved area with shipping containers. Tall timber piles remain. The piles appear to be deteriorated. Bottom part of wall that remains is mostly covered with riprap, vegetation and rubble.
3.86 Wall West W-3.86-W in Parcel 0714_2442_1 Desktop Only Failed
Wooden wall that has collapsed. Some sections remain but most upland soil including riprap has eroded.
3.9 Wall West W-3.90-W in Parcel 0714_2442_2 Desktop Only Failed
Steel sheet pile wall. Some sheet piles are dislodged, and some are missing. Overgrown vegetation was observed behind the wall.
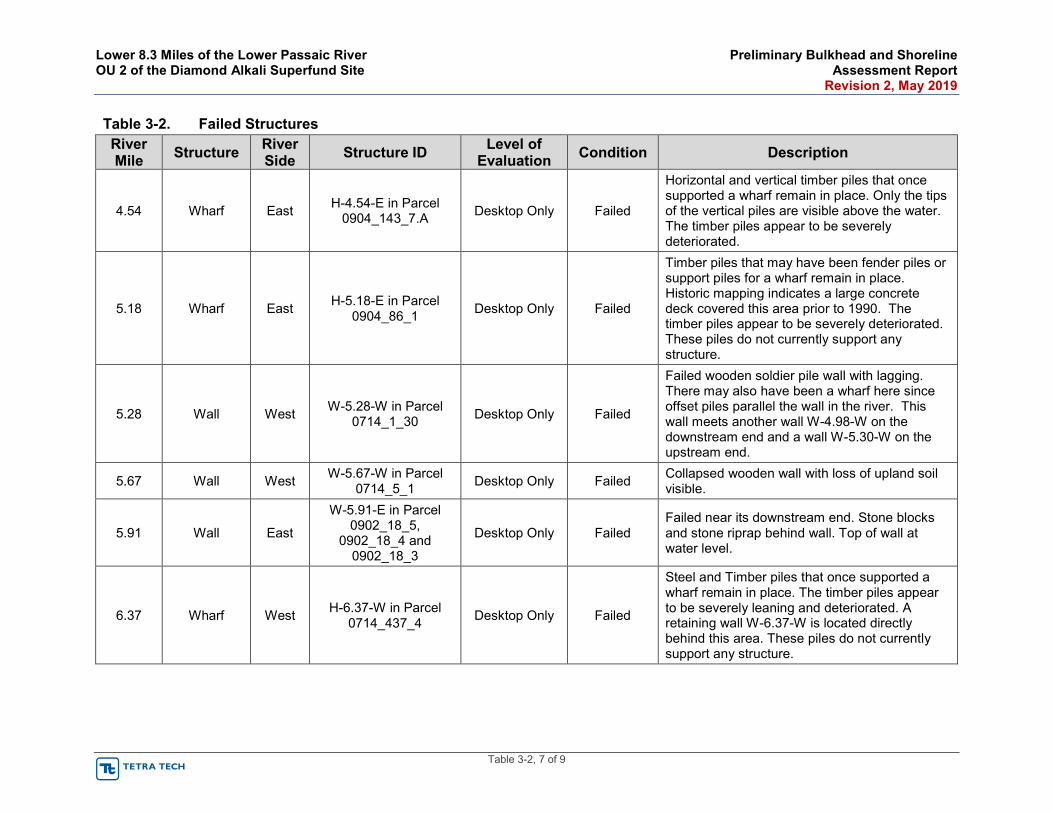
Lower 8.3 Miles of the Lower Passaic River Preliminary Bulkhead and Shoreline OU 2 of the Diamond Alkali Superfund Site Assessment Report Revision 2, May 2019
Table 3-2, 7 of 9
Table 3-2. Failed Structures River Mile Structure River
Side Structure ID Level of Evaluation Condition Description
4.54 Wharf East H-4.54-E in Parcel 0904_143_7.A Desktop Only Failed
Horizontal and vertical timber piles that once supported a wharf remain in place. Only the tips of the vertical piles are visible above the water. The timber piles appear to be severely deteriorated.
5.18 Wharf East H-5.18-E in Parcel 0904_86_1 Desktop Only Failed
Timber piles that may have been fender piles or support piles for a wharf remain in place. Historic mapping indicates a large concrete deck covered this area prior to 1990. The timber piles appear to be severely deteriorated. These piles do not currently support any structure.
5.28 Wall West W-5.28-W in Parcel 0714_1_30 Desktop Only Failed
Failed wooden soldier pile wall with lagging. There may also have been a wharf here since offset piles parallel the wall in the river. This wall meets another wall W-4.98-W on the downstream end and a wall W-5.30-W on the upstream end.
5.67 Wall West W-5.67-W in Parcel 0714_5_1 Desktop Only Failed Collapsed wooden wall with loss of upland soil
visible.
5.91 Wall East
W-5.91-E in Parcel 0902_18_5,
0902_18_4 and 0902_18_3
Desktop Only Failed Failed near its downstream end. Stone blocks and stone riprap behind wall. Top of wall at water level.
6.37 Wharf West H-6.37-W in Parcel 0714_437_4 Desktop Only Failed
Steel and Timber piles that once supported a wharf remain in place. The timber piles appear to be severely leaning and deteriorated. A retaining wall W-6.37-W is located directly behind this area. These piles do not currently support any structure.
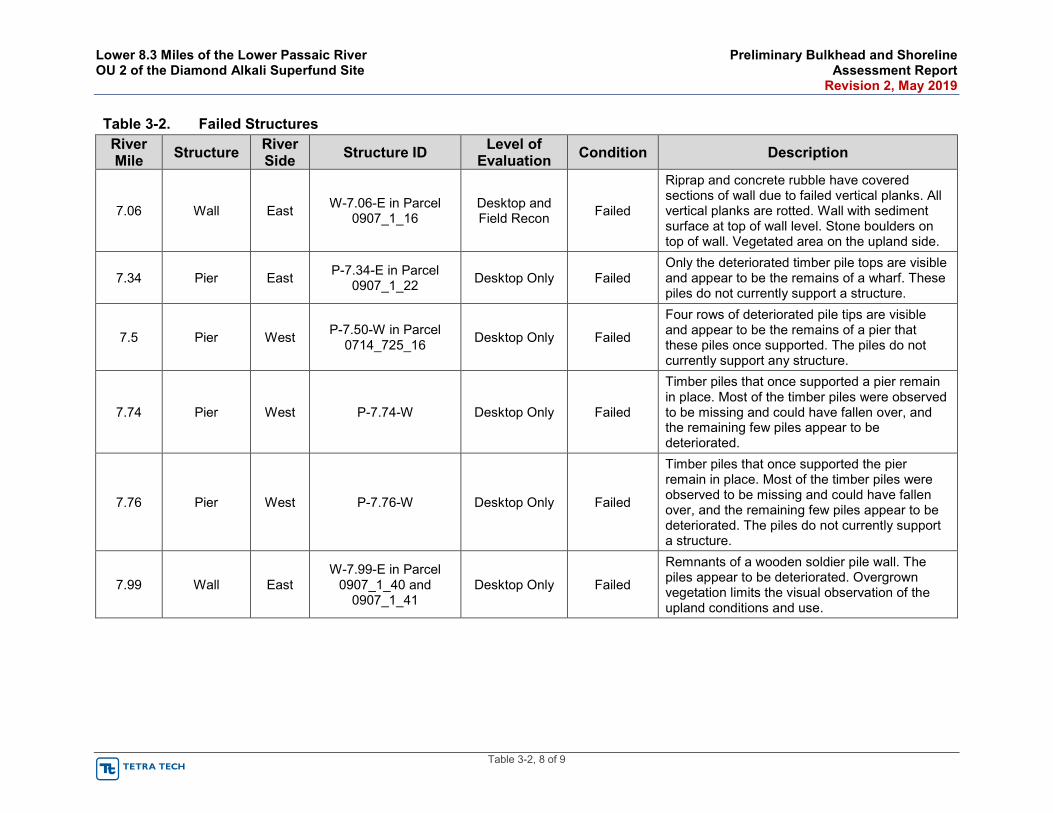
Lower 8.3 Miles of the Lower Passaic River Preliminary Bulkhead and Shoreline OU 2 of the Diamond Alkali Superfund Site Assessment Report Revision 2, May 2019
Table 3-2, 8 of 9
Table 3-2. Failed Structures River Mile Structure River
Side Structure ID Level of Evaluation Condition Description
7.06 Wall East W-7.06-E in Parcel 0907_1_16
Desktop and Field Recon Failed
Riprap and concrete rubble have covered sections of wall due to failed vertical planks. All vertical planks are rotted. Wall with sediment surface at top of wall level. Stone boulders on top of wall. Vegetated area on the upland side.
7.34 Pier East P-7.34-E in Parcel 0907_1_22 Desktop Only Failed
Only the deteriorated timber pile tops are visible and appear to be the remains of a wharf. These piles do not currently support a structure.
7.5 Pier West P-7.50-W in Parcel 0714_725_16 Desktop Only Failed
Four rows of deteriorated pile tips are visible and appear to be the remains of a pier that these piles once supported. The piles do not currently support any structure.
7.74 Pier West P-7.74-W Desktop Only Failed
Timber piles that once supported a pier remain in place. Most of the timber piles were observed to be missing and could have fallen over, and the remaining few piles appear to be deteriorated.
7.76 Pier West P-7.76-W Desktop Only Failed
Timber piles that once supported the pier remain in place. Most of the timber piles were observed to be missing and could have fallen over, and the remaining few piles appear to be deteriorated. The piles do not currently support a structure.
7.99 Wall East W-7.99-E in Parcel
0907_1_40 and 0907_1_41
Desktop Only Failed
Remnants of a wooden soldier pile wall. The piles appear to be deteriorated. Overgrown vegetation limits the visual observation of the upland conditions and use.
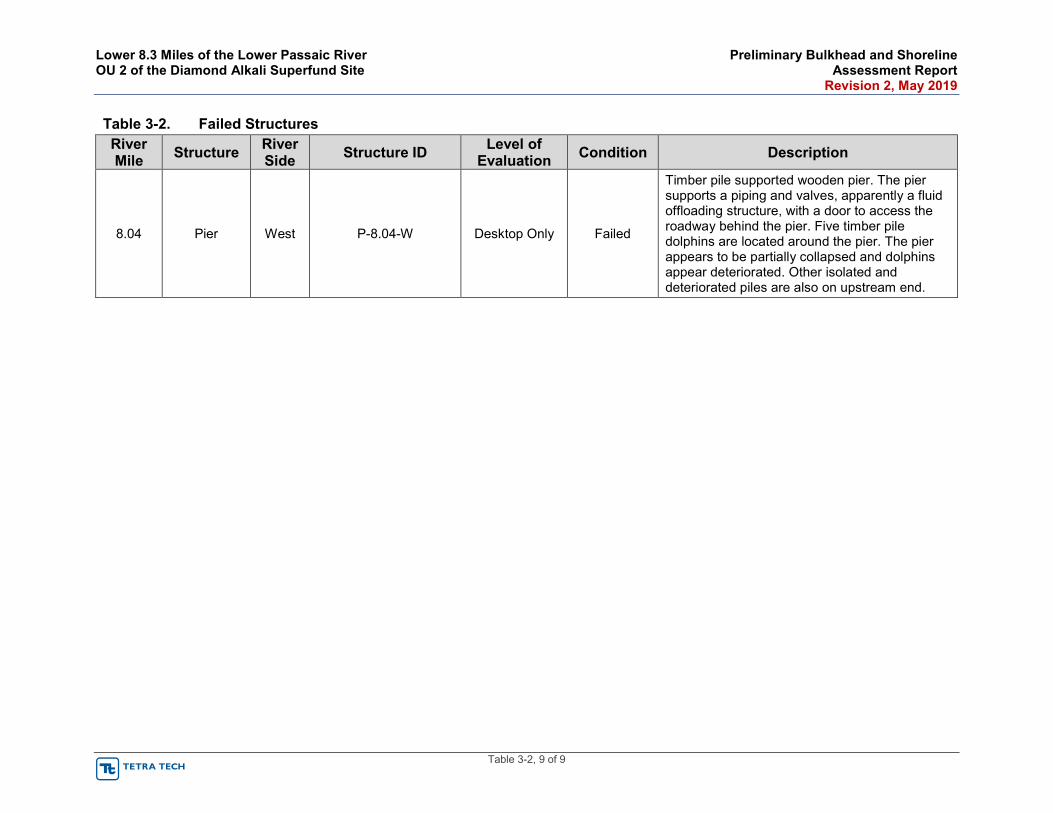
Lower 8.3 Miles of the Lower Passaic River Preliminary Bulkhead and Shoreline OU 2 of the Diamond Alkali Superfund Site Assessment Report Revision 2, May 2019
Table 3-2, 9 of 9
Table 3-2. Failed Structures River Mile Structure River
Side Structure ID Level of Evaluation Condition Description
8.04 Pier West P-8.04-W Desktop Only Failed
Timber pile supported wooden pier. The pier supports a piping and valves, apparently a fluid offloading structure, with a door to access the roadway behind the pier. Five timber pile dolphins are located around the pier. The pier appears to be partially collapsed and dolphins appear deteriorated. Other isolated and deteriorated piles are also on upstream end.
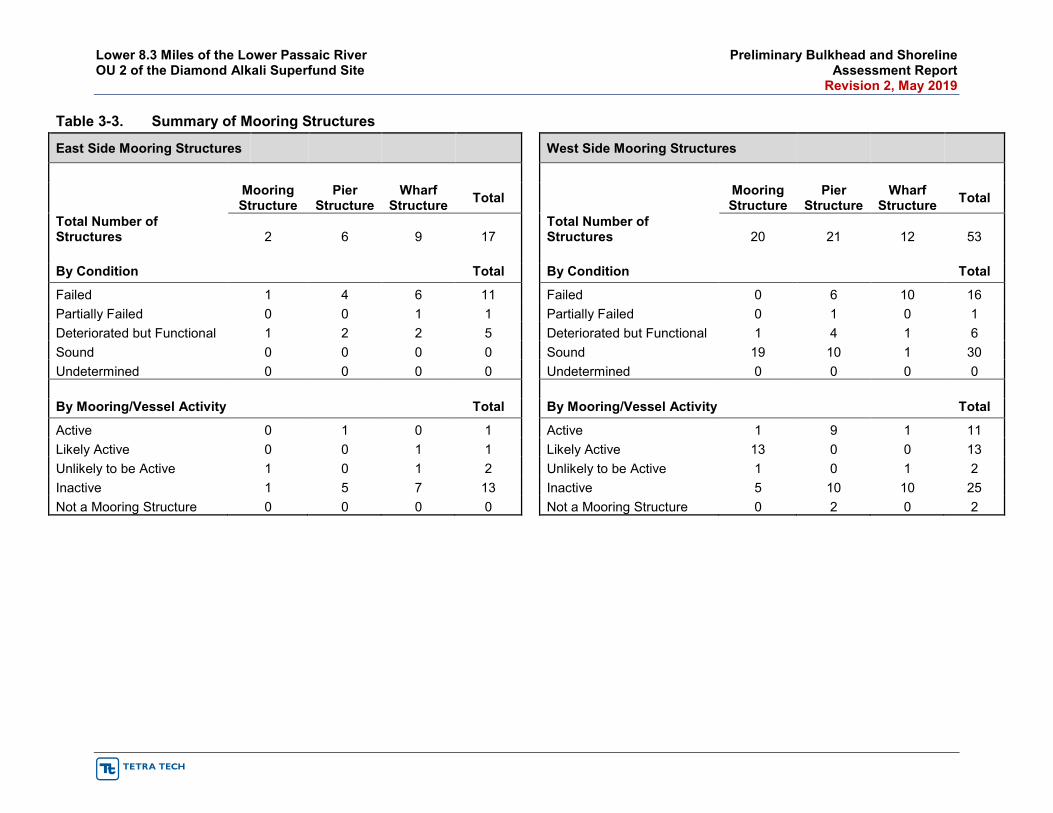
Lower 8.3 Miles of the Lower Passaic River Preliminary Bulkhead and Shoreline OU 2 of the Diamond Alkali Superfund Site Assessment Report Revision 2, May 2019
Table 3-3. Summary of Mooring Structures
East Side Mooring Structures West Side Mooring Structures
Mooring Structure
Pier Structure
Wharf Structure Total
Mooring Structure
Pier Structure
Wharf Structure Total
Total Number of Structures 2 6 9 17
Total Number of Structures 20 21 12 53
17 53 By Condition Total By Condition Total
Failed 1 4 6 11 Failed 0 6 10 16 Partially Failed 0 0 1 1 Partially Failed 0 1 0 1 Deteriorated but Functional 1 2 2 5 Deteriorated but Functional 1 4 1 6 Sound 0 0 0 0 Sound 19 10 1 30 Undetermined 0 0 0 0 Undetermined 0 0 0 0 By Mooring/Vessel Activity Total By Mooring/Vessel Activity Total
Active 0 1 0 1 Active 1 9 1 11 Likely Active 0 0 1 1 Likely Active 13 0 0 13 Unlikely to be Active 1 0 1 2 Unlikely to be Active 1 0 1 2 Inactive 1 5 7 13 Inactive 5 10 10 25 Not a Mooring Structure 0 0 0 0 Not a Mooring Structure 0 2 0 2
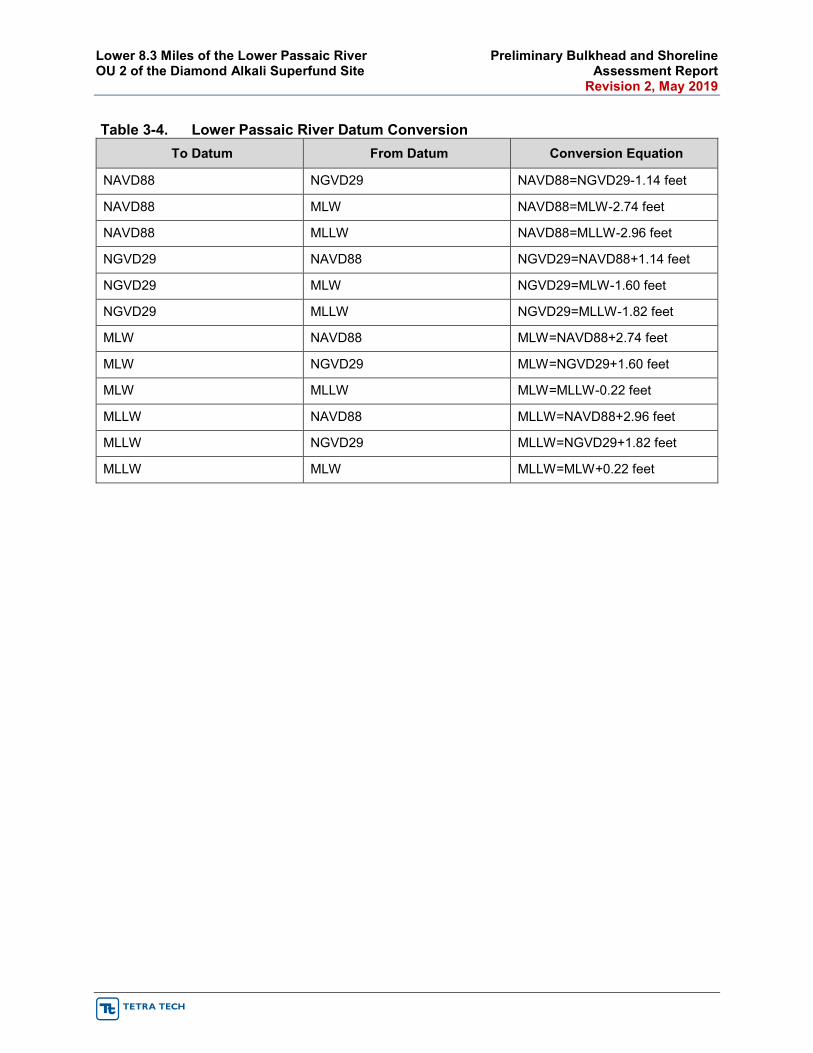
Lower 8.3 Miles of the Lower Passaic River Preliminary Bulkhead and Shoreline OU 2 of the Diamond Alkali Superfund Site Assessment Report Revision 2, May 2019
Table 3-4. Lower Passaic River Datum Conversion To Datum From Datum Conversion Equation
NAVD88 NGVD29 NAVD88=NGVD29-1.14 feet
NAVD88 MLW NAVD88=MLW-2.74 feet
NAVD88 MLLW NAVD88=MLLW-2.96 feet
NGVD29 NAVD88 NGVD29=NAVD88+1.14 feet
NGVD29 MLW NGVD29=MLW-1.60 feet
NGVD29 MLLW NGVD29=MLLW-1.82 feet
MLW NAVD88 MLW=NAVD88+2.74 feet
MLW NGVD29 MLW=NGVD29+1.60 feet
MLW MLLW MLW=MLLW-0.22 feet
MLLW NAVD88 MLLW=NAVD88+2.96 feet
MLLW NGVD29 MLLW=NGVD29+1.82 feet
MLLW MLW MLLW=MLW+0.22 feet
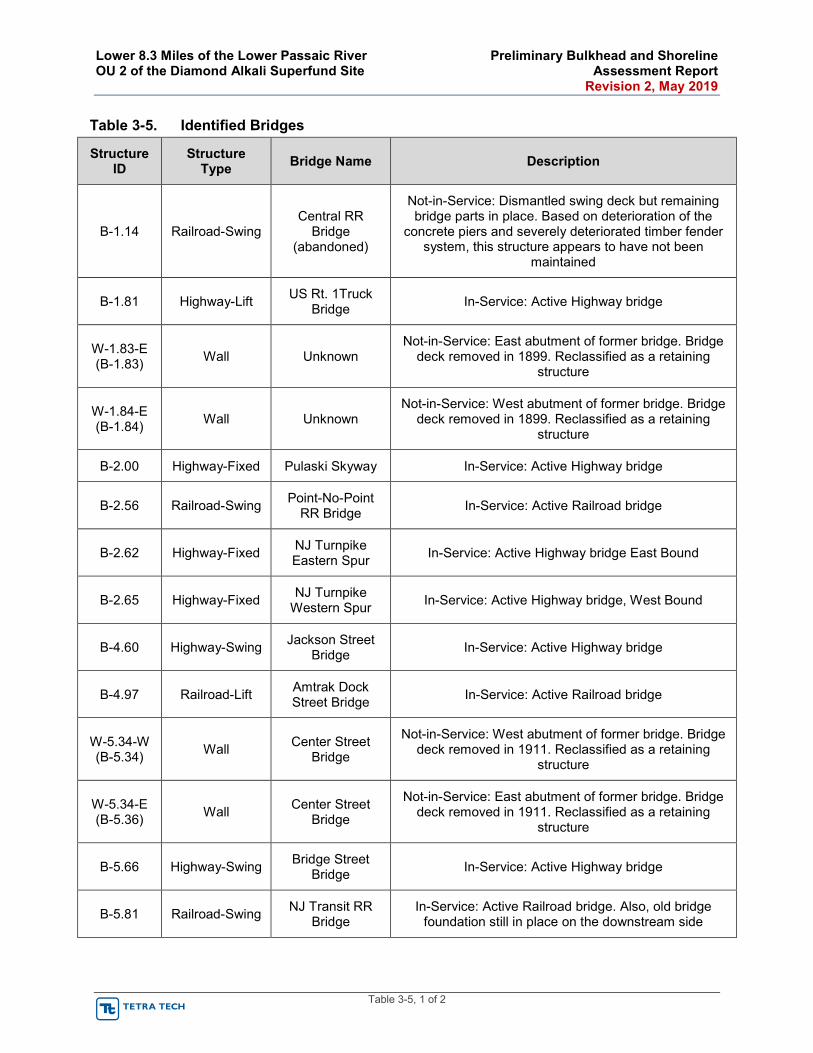
Lower 8.3 Miles of the Lower Passaic River Preliminary Bulkhead and Shoreline OU 2 of the Diamond Alkali Superfund Site Assessment Report Revision 2, May 2019
Table 3-5, 1 of 2
Table 3-5. Identified Bridges
Structure ID
Structure Type Bridge Name Description
B-1.14 Railroad-Swing Central RR
Bridge (abandoned)
Not-in-Service: Dismantled swing deck but remaining bridge parts in place. Based on deterioration of the
concrete piers and severely deteriorated timber fender system, this structure appears to have not been
maintained
B-1.81 Highway-Lift US Rt. 1Truck Bridge In-Service: Active Highway bridge
W-1.83-E (B-1.83) Wall Unknown
Not-in-Service: East abutment of former bridge. Bridge deck removed in 1899. Reclassified as a retaining
structure
W-1.84-E (B-1.84) Wall Unknown
Not-in-Service: West abutment of former bridge. Bridge deck removed in 1899. Reclassified as a retaining
structure
B-2.00 Highway-Fixed Pulaski Skyway In-Service: Active Highway bridge
B-2.56 Railroad-Swing Point-No-Point RR Bridge In-Service: Active Railroad bridge
B-2.62 Highway-Fixed NJ Turnpike Eastern Spur In-Service: Active Highway bridge East Bound
B-2.65 Highway-Fixed NJ Turnpike Western Spur In-Service: Active Highway bridge, West Bound
B-4.60 Highway-Swing Jackson Street Bridge In-Service: Active Highway bridge
B-4.97 Railroad-Lift Amtrak Dock Street Bridge In-Service: Active Railroad bridge
W-5.34-W (B-5.34) Wall Center Street
Bridge
Not-in-Service: West abutment of former bridge. Bridge deck removed in 1911. Reclassified as a retaining
structure
W-5.34-E (B-5.36) Wall Center Street
Bridge
Not-in-Service: East abutment of former bridge. Bridge deck removed in 1911. Reclassified as a retaining
structure
B-5.66 Highway-Swing Bridge Street Bridge In-Service: Active Highway bridge
B-5.81 Railroad-Swing NJ Transit RR Bridge
In-Service: Active Railroad bridge. Also, old bridge foundation still in place on the downstream side
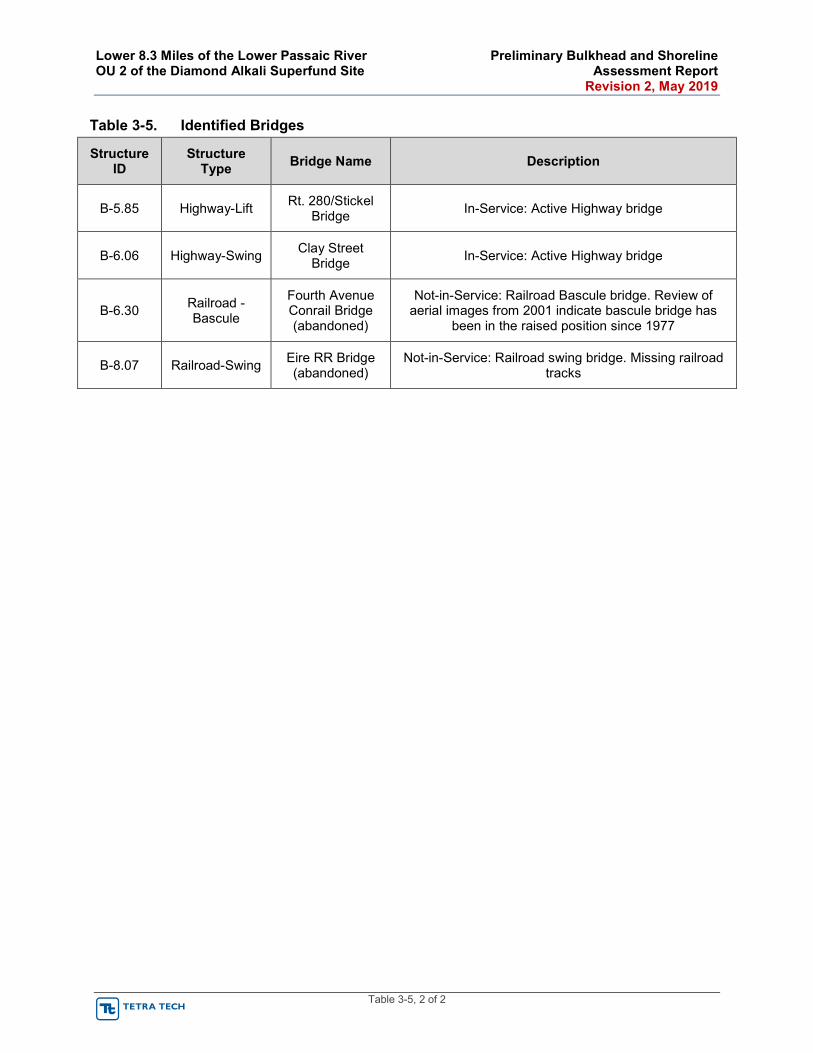
Lower 8.3 Miles of the Lower Passaic River Preliminary Bulkhead and Shoreline OU 2 of the Diamond Alkali Superfund Site Assessment Report Revision 2, May 2019
Table 3-5, 2 of 2
Table 3-5. Identified Bridges
Structure ID
Structure Type Bridge Name Description
B-5.85 Highway-Lift Rt. 280/Stickel Bridge In-Service: Active Highway bridge
B-6.06 Highway-Swing Clay Street Bridge In-Service: Active Highway bridge
B-6.30 Railroad - Bascule
Fourth Avenue Conrail Bridge (abandoned)
Not-in-Service: Railroad Bascule bridge. Review of aerial images from 2001 indicate bascule bridge has
been in the raised position since 1977
B-8.07 Railroad-Swing Eire RR Bridge (abandoned)
Not-in-Service: Railroad swing bridge. Missing railroad tracks
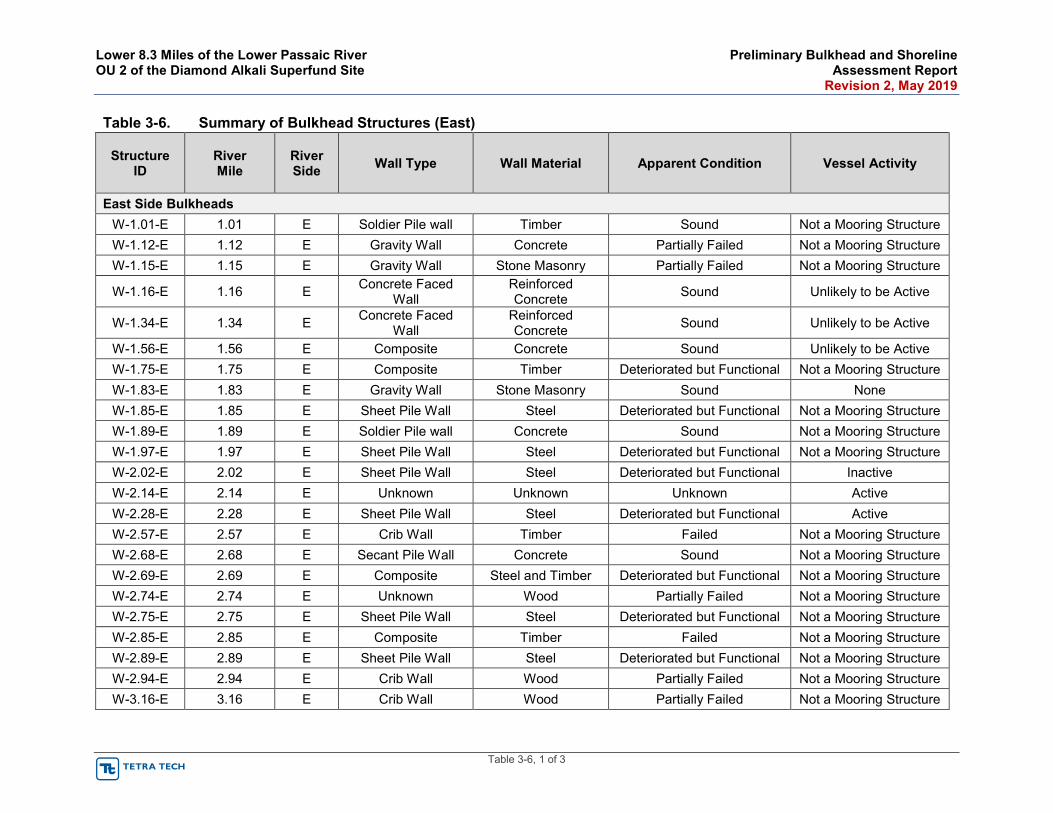
Lower 8.3 Miles of the Lower Passaic River Preliminary Bulkhead and Shoreline OU 2 of the Diamond Alkali Superfund Site Assessment Report Revision 2, May 2019
Table 3-6, 1 of 3
Table 3-6. Summary of Bulkhead Structures (East)
Structure ID
River Mile
River Side Wall Type Wall Material Apparent Condition Vessel Activity
East Side Bulkheads W-1.01-E 1.01 E Soldier Pile wall Timber Sound Not a Mooring Structure W-1.12-E 1.12 E Gravity Wall Concrete Partially Failed Not a Mooring Structure W-1.15-E 1.15 E Gravity Wall Stone Masonry Partially Failed Not a Mooring Structure
W-1.16-E 1.16 E Concrete Faced Wall
Reinforced Concrete Sound Unlikely to be Active
W-1.34-E 1.34 E Concrete Faced Wall
Reinforced Concrete Sound Unlikely to be Active
W-1.56-E 1.56 E Composite Concrete Sound Unlikely to be Active W-1.75-E 1.75 E Composite Timber Deteriorated but Functional Not a Mooring Structure W-1.83-E 1.83 E Gravity Wall Stone Masonry Sound None W-1.85-E 1.85 E Sheet Pile Wall Steel Deteriorated but Functional Not a Mooring Structure W-1.89-E 1.89 E Soldier Pile wall Concrete Sound Not a Mooring Structure W-1.97-E 1.97 E Sheet Pile Wall Steel Deteriorated but Functional Not a Mooring Structure W-2.02-E 2.02 E Sheet Pile Wall Steel Deteriorated but Functional Inactive W-2.14-E 2.14 E Unknown Unknown Unknown Active W-2.28-E 2.28 E Sheet Pile Wall Steel Deteriorated but Functional Active W-2.57-E 2.57 E Crib Wall Timber Failed Not a Mooring Structure W-2.68-E 2.68 E Secant Pile Wall Concrete Sound Not a Mooring Structure W-2.69-E 2.69 E Composite Steel and Timber Deteriorated but Functional Not a Mooring Structure W-2.74-E 2.74 E Unknown Wood Partially Failed Not a Mooring Structure W-2.75-E 2.75 E Sheet Pile Wall Steel Deteriorated but Functional Not a Mooring Structure W-2.85-E 2.85 E Composite Timber Failed Not a Mooring Structure W-2.89-E 2.89 E Sheet Pile Wall Steel Deteriorated but Functional Not a Mooring Structure W-2.94-E 2.94 E Crib Wall Wood Partially Failed Not a Mooring Structure W-3.16-E 3.16 E Crib Wall Wood Partially Failed Not a Mooring Structure
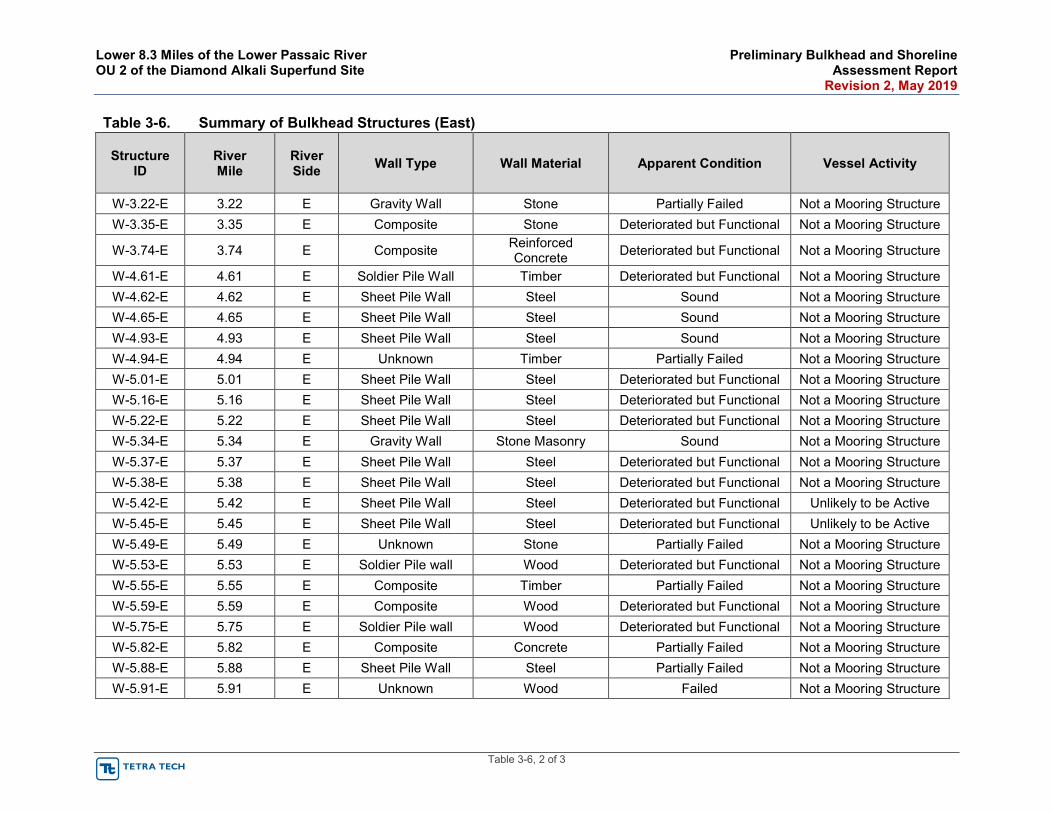
Lower 8.3 Miles of the Lower Passaic River Preliminary Bulkhead and Shoreline OU 2 of the Diamond Alkali Superfund Site Assessment Report Revision 2, May 2019
Table 3-6, 2 of 3
Table 3-6. Summary of Bulkhead Structures (East)
Structure ID
River Mile
River Side Wall Type Wall Material Apparent Condition Vessel Activity
W-3.22-E 3.22 E Gravity Wall Stone Partially Failed Not a Mooring Structure W-3.35-E 3.35 E Composite Stone Deteriorated but Functional Not a Mooring Structure
W-3.74-E 3.74 E Composite Reinforced Concrete Deteriorated but Functional Not a Mooring Structure
W-4.61-E 4.61 E Soldier Pile Wall Timber Deteriorated but Functional Not a Mooring Structure W-4.62-E 4.62 E Sheet Pile Wall Steel Sound Not a Mooring Structure W-4.65-E 4.65 E Sheet Pile Wall Steel Sound Not a Mooring Structure W-4.93-E 4.93 E Sheet Pile Wall Steel Sound Not a Mooring Structure W-4.94-E 4.94 E Unknown Timber Partially Failed Not a Mooring Structure W-5.01-E 5.01 E Sheet Pile Wall Steel Deteriorated but Functional Not a Mooring Structure W-5.16-E 5.16 E Sheet Pile Wall Steel Deteriorated but Functional Not a Mooring Structure W-5.22-E 5.22 E Sheet Pile Wall Steel Deteriorated but Functional Not a Mooring Structure W-5.34-E 5.34 E Gravity Wall Stone Masonry Sound Not a Mooring Structure W-5.37-E 5.37 E Sheet Pile Wall Steel Deteriorated but Functional Not a Mooring Structure W-5.38-E 5.38 E Sheet Pile Wall Steel Deteriorated but Functional Not a Mooring Structure W-5.42-E 5.42 E Sheet Pile Wall Steel Deteriorated but Functional Unlikely to be Active W-5.45-E 5.45 E Sheet Pile Wall Steel Deteriorated but Functional Unlikely to be Active W-5.49-E 5.49 E Unknown Stone Partially Failed Not a Mooring Structure W-5.53-E 5.53 E Soldier Pile wall Wood Deteriorated but Functional Not a Mooring Structure W-5.55-E 5.55 E Composite Timber Partially Failed Not a Mooring Structure W-5.59-E 5.59 E Composite Wood Deteriorated but Functional Not a Mooring Structure W-5.75-E 5.75 E Soldier Pile wall Wood Deteriorated but Functional Not a Mooring Structure W-5.82-E 5.82 E Composite Concrete Partially Failed Not a Mooring Structure W-5.88-E 5.88 E Sheet Pile Wall Steel Partially Failed Not a Mooring Structure W-5.91-E 5.91 E Unknown Wood Failed Not a Mooring Structure
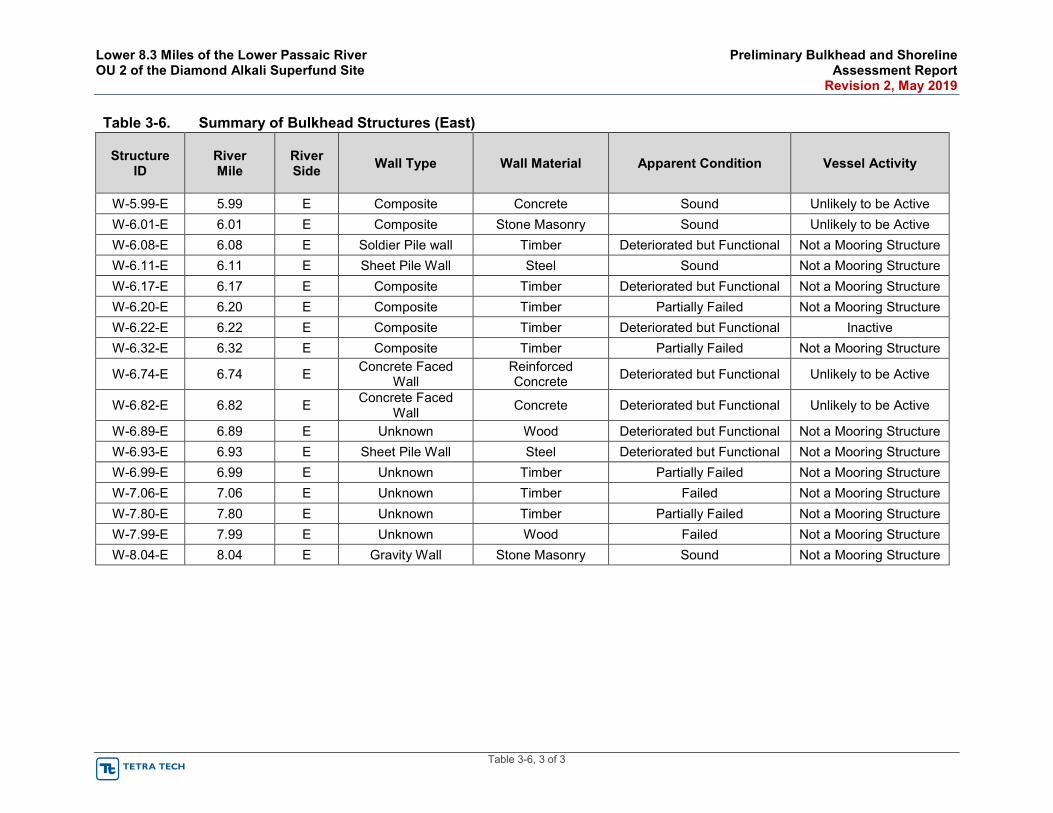
Lower 8.3 Miles of the Lower Passaic River Preliminary Bulkhead and Shoreline OU 2 of the Diamond Alkali Superfund Site Assessment Report Revision 2, May 2019
Table 3-6, 3 of 3
Table 3-6. Summary of Bulkhead Structures (East)
Structure ID
River Mile
River Side Wall Type Wall Material Apparent Condition Vessel Activity
W-5.99-E 5.99 E Composite Concrete Sound Unlikely to be Active W-6.01-E 6.01 E Composite Stone Masonry Sound Unlikely to be Active W-6.08-E 6.08 E Soldier Pile wall Timber Deteriorated but Functional Not a Mooring Structure W-6.11-E 6.11 E Sheet Pile Wall Steel Sound Not a Mooring Structure W-6.17-E 6.17 E Composite Timber Deteriorated but Functional Not a Mooring Structure W-6.20-E 6.20 E Composite Timber Partially Failed Not a Mooring Structure W-6.22-E 6.22 E Composite Timber Deteriorated but Functional Inactive W-6.32-E 6.32 E Composite Timber Partially Failed Not a Mooring Structure
W-6.74-E 6.74 E Concrete Faced Wall
Reinforced Concrete Deteriorated but Functional Unlikely to be Active
W-6.82-E 6.82 E Concrete Faced Wall Concrete Deteriorated but Functional Unlikely to be Active
W-6.89-E 6.89 E Unknown Wood Deteriorated but Functional Not a Mooring Structure W-6.93-E 6.93 E Sheet Pile Wall Steel Deteriorated but Functional Not a Mooring Structure W-6.99-E 6.99 E Unknown Timber Partially Failed Not a Mooring Structure W-7.06-E 7.06 E Unknown Timber Failed Not a Mooring Structure W-7.80-E 7.80 E Unknown Timber Partially Failed Not a Mooring Structure W-7.99-E 7.99 E Unknown Wood Failed Not a Mooring Structure W-8.04-E 8.04 E Gravity Wall Stone Masonry Sound Not a Mooring Structure
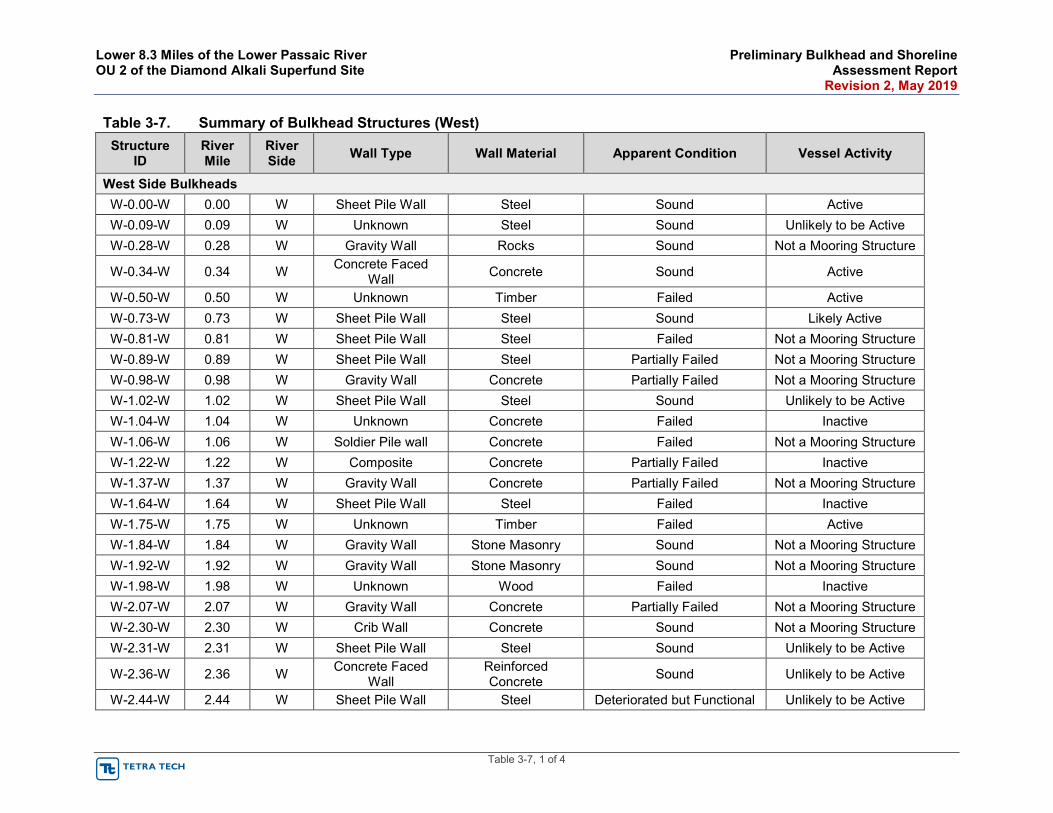
Lower 8.3 Miles of the Lower Passaic River Preliminary Bulkhead and Shoreline OU 2 of the Diamond Alkali Superfund Site Assessment Report Revision 2, May 2019
Table 3-7, 1 of 4
Table 3-7. Summary of Bulkhead Structures (West) Structure
ID River Mile
River Side Wall Type Wall Material Apparent Condition Vessel Activity
West Side Bulkheads W-0.00-W 0.00 W Sheet Pile Wall Steel Sound Active W-0.09-W 0.09 W Unknown Steel Sound Unlikely to be Active W-0.28-W 0.28 W Gravity Wall Rocks Sound Not a Mooring Structure
W-0.34-W 0.34 W Concrete Faced Wall Concrete Sound Active
W-0.50-W 0.50 W Unknown Timber Failed Active W-0.73-W 0.73 W Sheet Pile Wall Steel Sound Likely Active W-0.81-W 0.81 W Sheet Pile Wall Steel Failed Not a Mooring Structure W-0.89-W 0.89 W Sheet Pile Wall Steel Partially Failed Not a Mooring Structure W-0.98-W 0.98 W Gravity Wall Concrete Partially Failed Not a Mooring Structure W-1.02-W 1.02 W Sheet Pile Wall Steel Sound Unlikely to be Active W-1.04-W 1.04 W Unknown Concrete Failed Inactive W-1.06-W 1.06 W Soldier Pile wall Concrete Failed Not a Mooring Structure W-1.22-W 1.22 W Composite Concrete Partially Failed Inactive W-1.37-W 1.37 W Gravity Wall Concrete Partially Failed Not a Mooring Structure W-1.64-W 1.64 W Sheet Pile Wall Steel Failed Inactive W-1.75-W 1.75 W Unknown Timber Failed Active W-1.84-W 1.84 W Gravity Wall Stone Masonry Sound Not a Mooring Structure W-1.92-W 1.92 W Gravity Wall Stone Masonry Sound Not a Mooring Structure W-1.98-W 1.98 W Unknown Wood Failed Inactive W-2.07-W 2.07 W Gravity Wall Concrete Partially Failed Not a Mooring Structure W-2.30-W 2.30 W Crib Wall Concrete Sound Not a Mooring Structure W-2.31-W 2.31 W Sheet Pile Wall Steel Sound Unlikely to be Active
W-2.36-W 2.36 W Concrete Faced Wall
Reinforced Concrete Sound Unlikely to be Active
W-2.44-W 2.44 W Sheet Pile Wall Steel Deteriorated but Functional Unlikely to be Active

Lower 8.3 Miles of the Lower Passaic River Preliminary Bulkhead and Shoreline OU 2 of the Diamond Alkali Superfund Site Assessment Report Revision 2, May 2019
Table 3-7, 2 of 4
Table 3-7. Summary of Bulkhead Structures (West) Structure
ID River Mile
River Side Wall Type Wall Material Apparent Condition Vessel Activity
W-2.45-W 2.45 W Concrete Faced Wall
Reinforced Concrete Deteriorated but Functional Unlikely to be Active
W-2.59-W 2.59 W Unknown Timber Failed Not a Mooring Structure W-3.10-W 3.10 W Soldier Pile wall Timber Partially Failed Not a Mooring Structure W-3.20-W 3.20 W Soldier Pile wall Timber Partially Failed Not a Mooring Structure W-3.24-W 3.24 W Composite Timber Partially Failed Not a Mooring Structure W-3.29-W 3.29 W Sheet Pile Wall Steel Sound Not a Mooring Structure W-3.42-W 3.42 W Sheet Pile Wall Steel Sound Not a Mooring Structure W-3.64-W 3.64 W Soldier Pile wall Timber Sound Not a Mooring Structure W-3.67-W 3.67 W Unknown Wood Failed Not a Mooring Structure W-3.68-W 3.68 W Crib Wall Timber Partially Failed Inactive W-3.86-W 3.86 W Unknown Wood Failed Not a Mooring Structure W-3.90-W 3.90 W Sheet Pile Wall Steel Failed Not a Mooring Structure W-3.93-W 3.93 W Composite Wood Partially Failed Not a Mooring Structure W-3.98-W 3.98 W Sheet Pile Wall Steel Sound Not a Mooring Structure W-4.00-W 4.00 W Composite Wood Partially Failed Not a Mooring Structure W-4.02-W 4.02 W Composite Wood Partially Failed Not a Mooring Structure W-4.39-W 4.39 W Crib Wall Wood Partially Failed Not a Mooring Structure W-4.61-W 4.61 W Sheet Pile Wall Concrete and steel Sound Not a Mooring Structure W-4.83-W 4.83 W Unknown Wood Partially Failed Not a Mooring Structure W-4.90-W 4.90 W Unknown Wood Partially Failed Not a Mooring Structure W-4.92-W 4.92 W Soldier Pile wall Wood Deteriorated but Functional Not a Mooring Structure W-4.96-W 4.96 W Gravity Wall Gabion Deteriorated but Functional Not a Mooring Structure
W-4.98-W 4.98 W Concrete Faced Wall Concrete Sound Not a Mooring Structure
W-5.28-W 5.28 W Unknown Wood Failed Not a Mooring Structure W-5.30-W 5.30 W Sheet Pile Wall Steel Deteriorated but Functional Unlikely to be Active
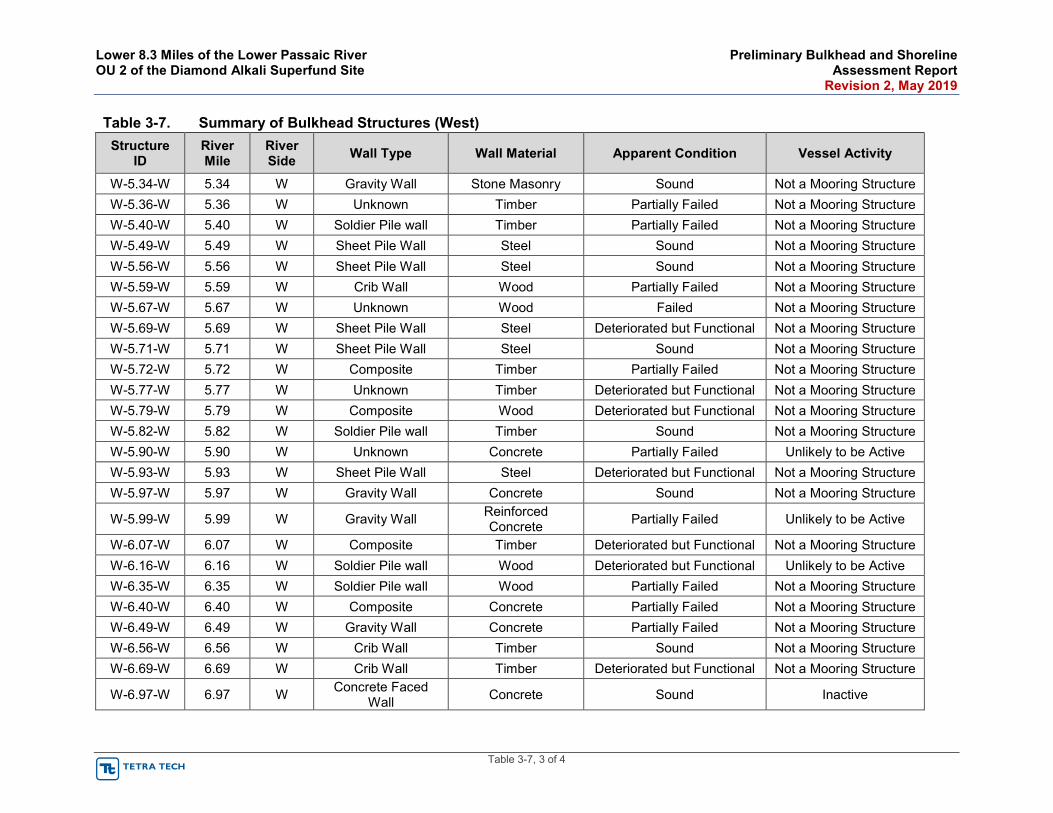
Lower 8.3 Miles of the Lower Passaic River Preliminary Bulkhead and Shoreline OU 2 of the Diamond Alkali Superfund Site Assessment Report Revision 2, May 2019
Table 3-7, 3 of 4
Table 3-7. Summary of Bulkhead Structures (West) Structure
ID River Mile
River Side Wall Type Wall Material Apparent Condition Vessel Activity
W-5.34-W 5.34 W Gravity Wall Stone Masonry Sound Not a Mooring Structure W-5.36-W 5.36 W Unknown Timber Partially Failed Not a Mooring Structure W-5.40-W 5.40 W Soldier Pile wall Timber Partially Failed Not a Mooring Structure W-5.49-W 5.49 W Sheet Pile Wall Steel Sound Not a Mooring Structure W-5.56-W 5.56 W Sheet Pile Wall Steel Sound Not a Mooring Structure W-5.59-W 5.59 W Crib Wall Wood Partially Failed Not a Mooring Structure W-5.67-W 5.67 W Unknown Wood Failed Not a Mooring Structure W-5.69-W 5.69 W Sheet Pile Wall Steel Deteriorated but Functional Not a Mooring Structure W-5.71-W 5.71 W Sheet Pile Wall Steel Sound Not a Mooring Structure W-5.72-W 5.72 W Composite Timber Partially Failed Not a Mooring Structure W-5.77-W 5.77 W Unknown Timber Deteriorated but Functional Not a Mooring Structure W-5.79-W 5.79 W Composite Wood Deteriorated but Functional Not a Mooring Structure W-5.82-W 5.82 W Soldier Pile wall Timber Sound Not a Mooring Structure W-5.90-W 5.90 W Unknown Concrete Partially Failed Unlikely to be Active W-5.93-W 5.93 W Sheet Pile Wall Steel Deteriorated but Functional Not a Mooring Structure W-5.97-W 5.97 W Gravity Wall Concrete Sound Not a Mooring Structure
W-5.99-W 5.99 W Gravity Wall Reinforced Concrete Partially Failed Unlikely to be Active
W-6.07-W 6.07 W Composite Timber Deteriorated but Functional Not a Mooring Structure W-6.16-W 6.16 W Soldier Pile wall Wood Deteriorated but Functional Unlikely to be Active W-6.35-W 6.35 W Soldier Pile wall Wood Partially Failed Not a Mooring Structure W-6.40-W 6.40 W Composite Concrete Partially Failed Not a Mooring Structure W-6.49-W 6.49 W Gravity Wall Concrete Partially Failed Not a Mooring Structure W-6.56-W 6.56 W Crib Wall Timber Sound Not a Mooring Structure W-6.69-W 6.69 W Crib Wall Timber Deteriorated but Functional Not a Mooring Structure
W-6.97-W 6.97 W Concrete Faced Wall Concrete Sound Inactive
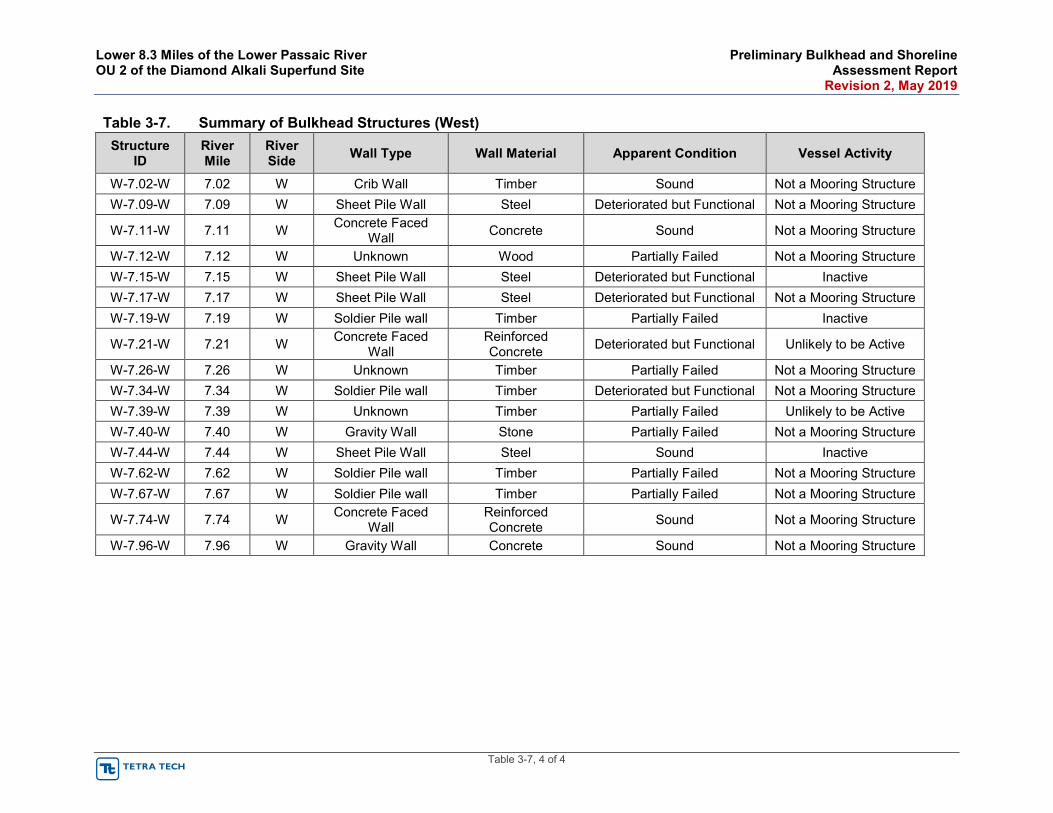
Lower 8.3 Miles of the Lower Passaic River Preliminary Bulkhead and Shoreline OU 2 of the Diamond Alkali Superfund Site Assessment Report Revision 2, May 2019
Table 3-7, 4 of 4
Table 3-7. Summary of Bulkhead Structures (West) Structure
ID River Mile
River Side Wall Type Wall Material Apparent Condition Vessel Activity
W-7.02-W 7.02 W Crib Wall Timber Sound Not a Mooring Structure W-7.09-W 7.09 W Sheet Pile Wall Steel Deteriorated but Functional Not a Mooring Structure
W-7.11-W 7.11 W Concrete Faced Wall Concrete Sound Not a Mooring Structure
W-7.12-W 7.12 W Unknown Wood Partially Failed Not a Mooring Structure W-7.15-W 7.15 W Sheet Pile Wall Steel Deteriorated but Functional Inactive W-7.17-W 7.17 W Sheet Pile Wall Steel Deteriorated but Functional Not a Mooring Structure W-7.19-W 7.19 W Soldier Pile wall Timber Partially Failed Inactive
W-7.21-W 7.21 W Concrete Faced Wall
Reinforced Concrete Deteriorated but Functional Unlikely to be Active
W-7.26-W 7.26 W Unknown Timber Partially Failed Not a Mooring Structure W-7.34-W 7.34 W Soldier Pile wall Timber Deteriorated but Functional Not a Mooring Structure W-7.39-W 7.39 W Unknown Timber Partially Failed Unlikely to be Active W-7.40-W 7.40 W Gravity Wall Stone Partially Failed Not a Mooring Structure W-7.44-W 7.44 W Sheet Pile Wall Steel Sound Inactive W-7.62-W 7.62 W Soldier Pile wall Timber Partially Failed Not a Mooring Structure W-7.67-W 7.67 W Soldier Pile wall Timber Partially Failed Not a Mooring Structure
W-7.74-W 7.74 W Concrete Faced Wall
Reinforced Concrete Sound Not a Mooring Structure
W-7.96-W 7.96 W Gravity Wall Concrete Sound Not a Mooring Structure
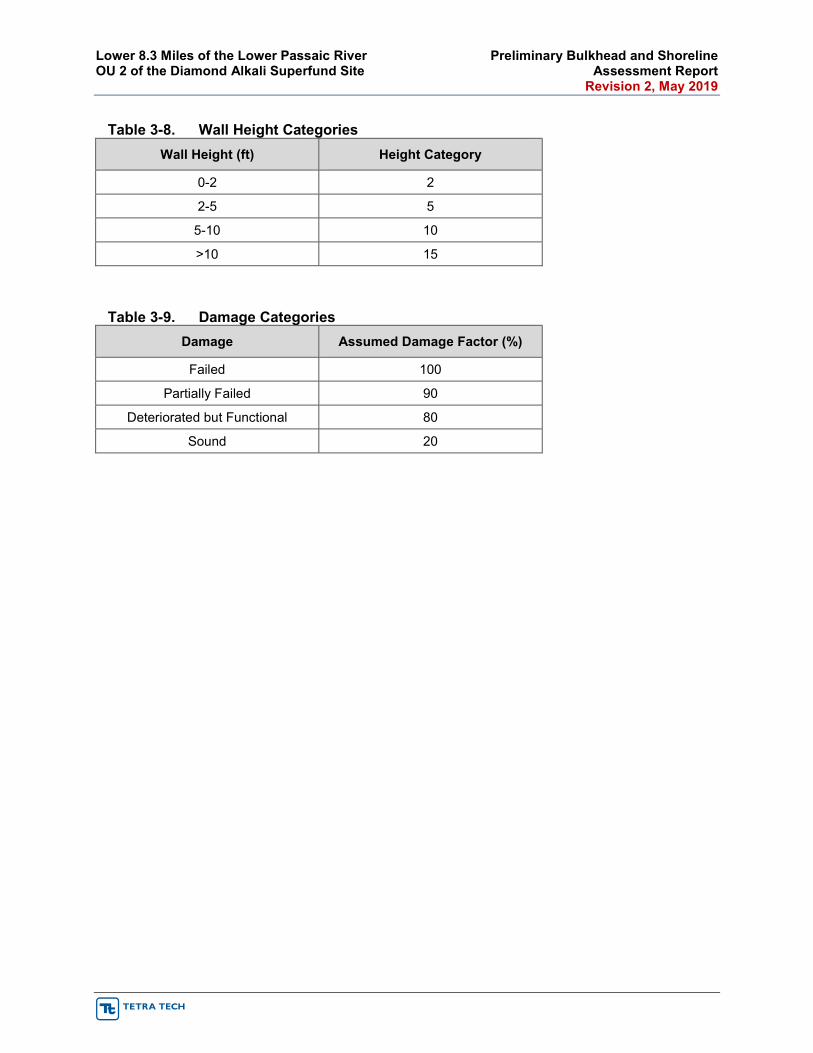
Lower 8.3 Miles of the Lower Passaic River Preliminary Bulkhead and Shoreline OU 2 of the Diamond Alkali Superfund Site Assessment Report Revision 2, May 2019
Table 3-8. Wall Height Categories Wall Height (ft) Height Category
0-2 2
2-5 5
5-10 10
>10 15
Table 3-9. Damage Categories Damage Assumed Damage Factor (%)
Failed 100
Partially Failed 90
Deteriorated but Functional 80
Sound 20
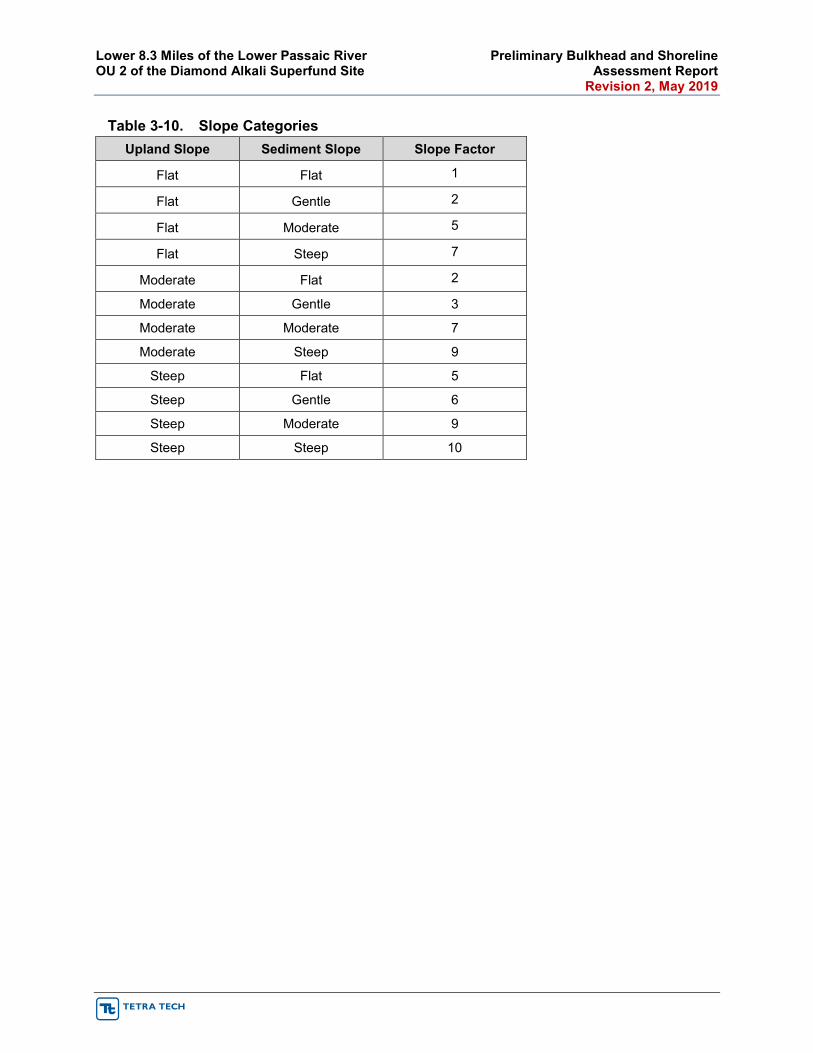
Lower 8.3 Miles of the Lower Passaic River Preliminary Bulkhead and Shoreline OU 2 of the Diamond Alkali Superfund Site Assessment Report Revision 2, May 2019
Table 3-10. Slope Categories Upland Slope Sediment Slope Slope Factor
Flat Flat 1
Flat Gentle 2
Flat Moderate 5
Flat Steep 7
Moderate Flat 2
Moderate Gentle 3
Moderate Moderate 7
Moderate Steep 9
Steep Flat 5
Steep Gentle 6
Steep Moderate 9
Steep Steep 10
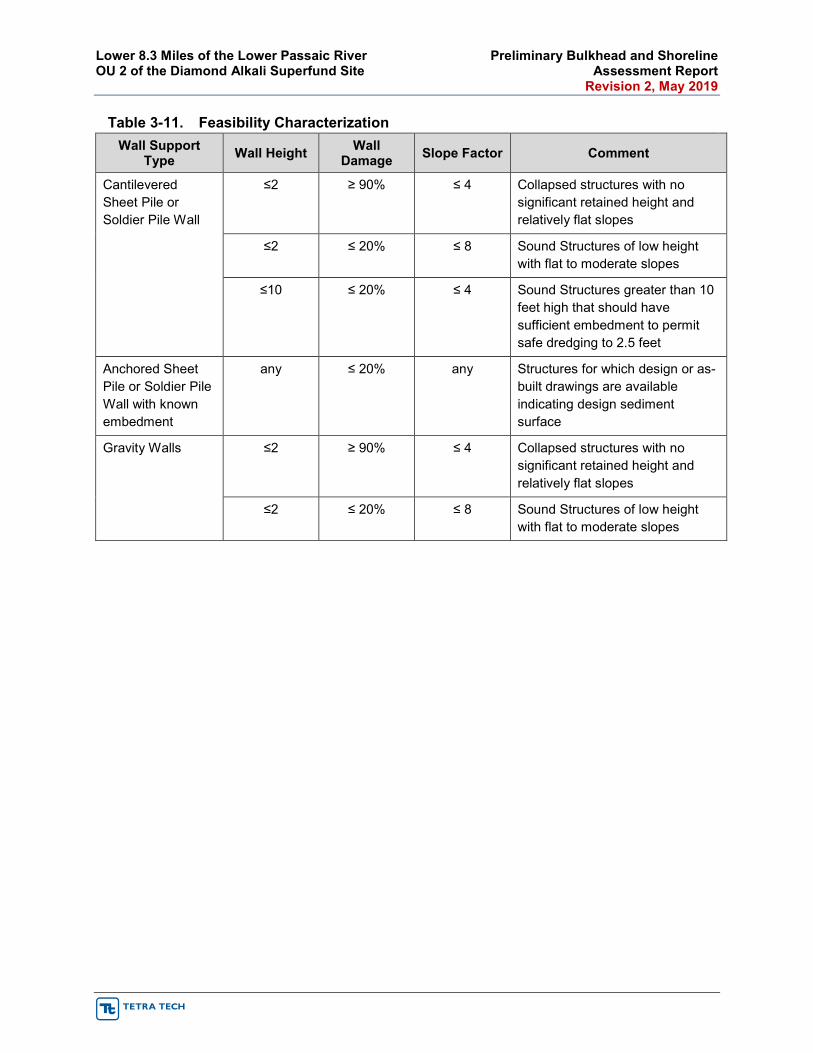
Lower 8.3 Miles of the Lower Passaic River Preliminary Bulkhead and Shoreline OU 2 of the Diamond Alkali Superfund Site Assessment Report Revision 2, May 2019
Table 3-11. Feasibility Characterization Wall Support
Type Wall Height Wall Damage Slope Factor Comment
Cantilevered Sheet Pile or Soldier Pile Wall
≤2 ≥ 90% ≤ 4 Collapsed structures with no significant retained height and relatively flat slopes
≤2 ≤ 20% ≤ 8 Sound Structures of low height with flat to moderate slopes
≤10 ≤ 20% ≤ 4 Sound Structures greater than 10 feet high that should have sufficient embedment to permit safe dredging to 2.5 feet
Anchored Sheet Pile or Soldier Pile Wall with known embedment
any ≤ 20% any Structures for which design or as-built drawings are available indicating design sediment surface
Gravity Walls ≤2 ≥ 90% ≤ 4 Collapsed structures with no significant retained height and relatively flat slopes
≤2 ≤ 20% ≤ 8 Sound Structures of low height with flat to moderate slopes
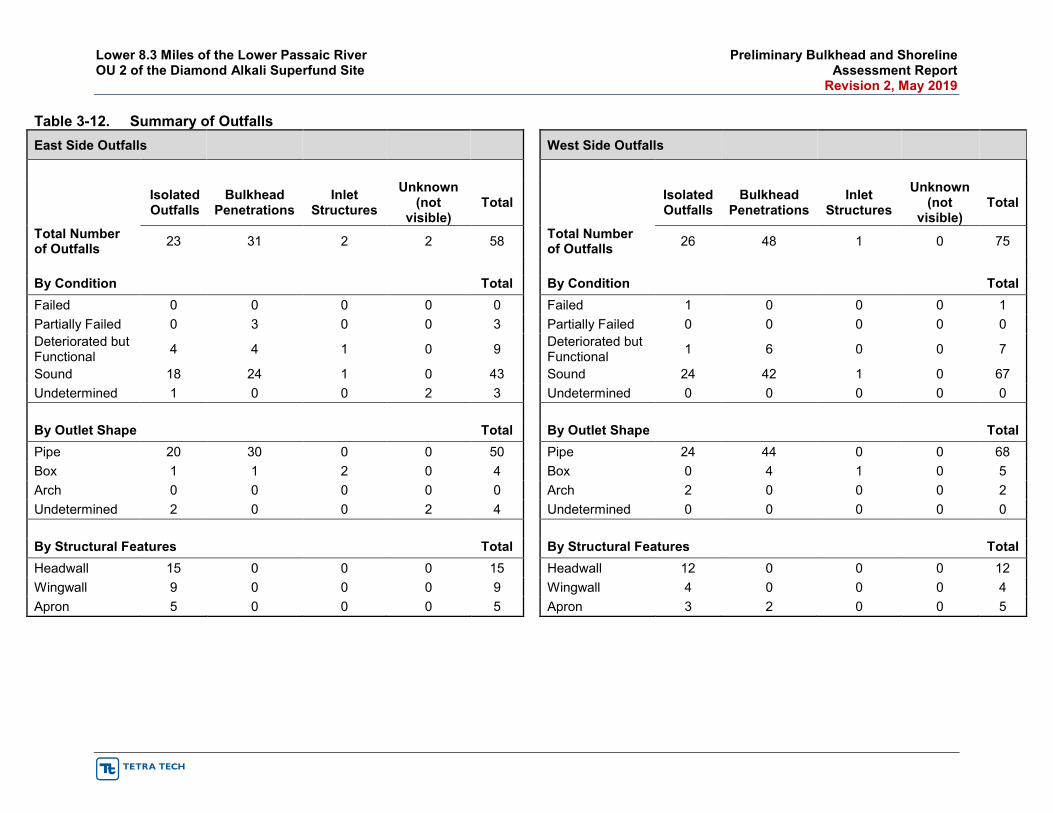
Lower 8.3 Miles of the Lower Passaic River Preliminary Bulkhead and Shoreline OU 2 of the Diamond Alkali Superfund Site Assessment Report Revision 2, May 2019
Table 3-12. Summary of Outfalls East Side Outfalls West Side Outfalls
Isolated Outfalls
Bulkhead Penetrations
Inlet Structures
Unknown (not
visible) Total
Isolated Outfalls
Bulkhead Penetrations
Inlet Structures
Unknown (not
visible) Total
Total Number of Outfalls 23 31 2 2 58
Total Number of Outfalls 26 48 1 0 75
By Condition Total By Condition Total Failed 0 0 0 0 0 Failed 1 0 0 0 1 Partially Failed 0 3 0 0 3 Partially Failed 0 0 0 0 0 Deteriorated but Functional 4 4 1 0 9
Deteriorated but Functional 1 6 0 0 7
Sound 18 24 1 0 43 Sound 24 42 1 0 67 Undetermined 1 0 0 2 3 Undetermined 0 0 0 0 0 By Outlet Shape Total By Outlet Shape Total Pipe 20 30 0 0 50 Pipe 24 44 0 0 68 Box 1 1 2 0 4 Box 0 4 1 0 5 Arch 0 0 0 0 0 Arch 2 0 0 0 2 Undetermined 2 0 0 2 4 Undetermined 0 0 0 0 0 By Structural Features Total By Structural Features Total Headwall 15 0 0 0 15 Headwall 12 0 0 0 12 Wingwall 9 0 0 0 9 Wingwall 4 0 0 0 4 Apron 5 0 0 0 5 Apron 3 2 0 0 5
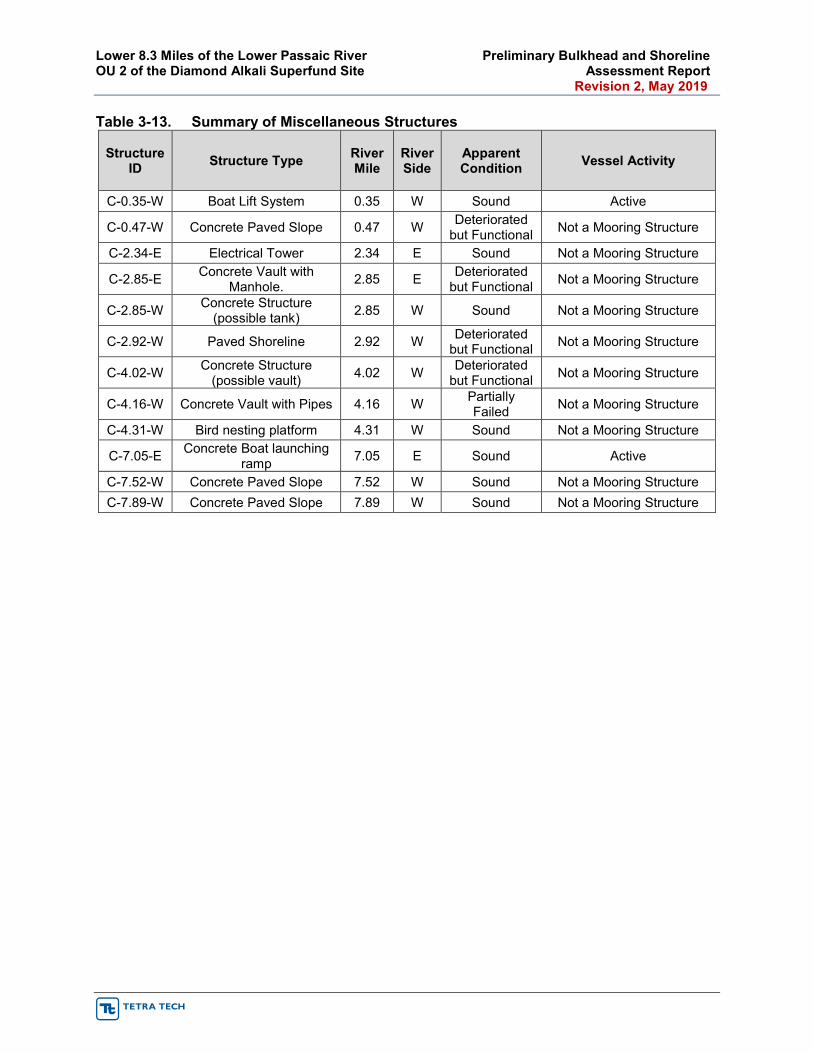
Lower 8.3 Miles of the Lower Passaic River Preliminary Bulkhead and Shoreline OU 2 of the Diamond Alkali Superfund Site Assessment Report Revision 2, May 2019
Table 3-13. Summary of Miscellaneous Structures
Structure ID Structure Type River
Mile River Side
Apparent Condition Vessel Activity
C-0.35-W Boat Lift System 0.35 W Sound Active
C-0.47-W Concrete Paved Slope 0.47 W Deteriorated but Functional Not a Mooring Structure
C-2.34-E Electrical Tower 2.34 E Sound Not a Mooring Structure
C-2.85-E Concrete Vault with Manhole. 2.85 E Deteriorated
but Functional Not a Mooring Structure
C-2.85-W Concrete Structure (possible tank) 2.85 W Sound Not a Mooring Structure
C-2.92-W Paved Shoreline 2.92 W Deteriorated but Functional Not a Mooring Structure
C-4.02-W Concrete Structure (possible vault) 4.02 W Deteriorated
but Functional Not a Mooring Structure
C-4.16-W Concrete Vault with Pipes 4.16 W Partially Failed Not a Mooring Structure
C-4.31-W Bird nesting platform 4.31 W Sound Not a Mooring Structure
C-7.05-E Concrete Boat launching ramp 7.05 E Sound Active
C-7.52-W Concrete Paved Slope 7.52 W Sound Not a Mooring Structure C-7.89-W Concrete Paved Slope 7.89 W Sound Not a Mooring Structure
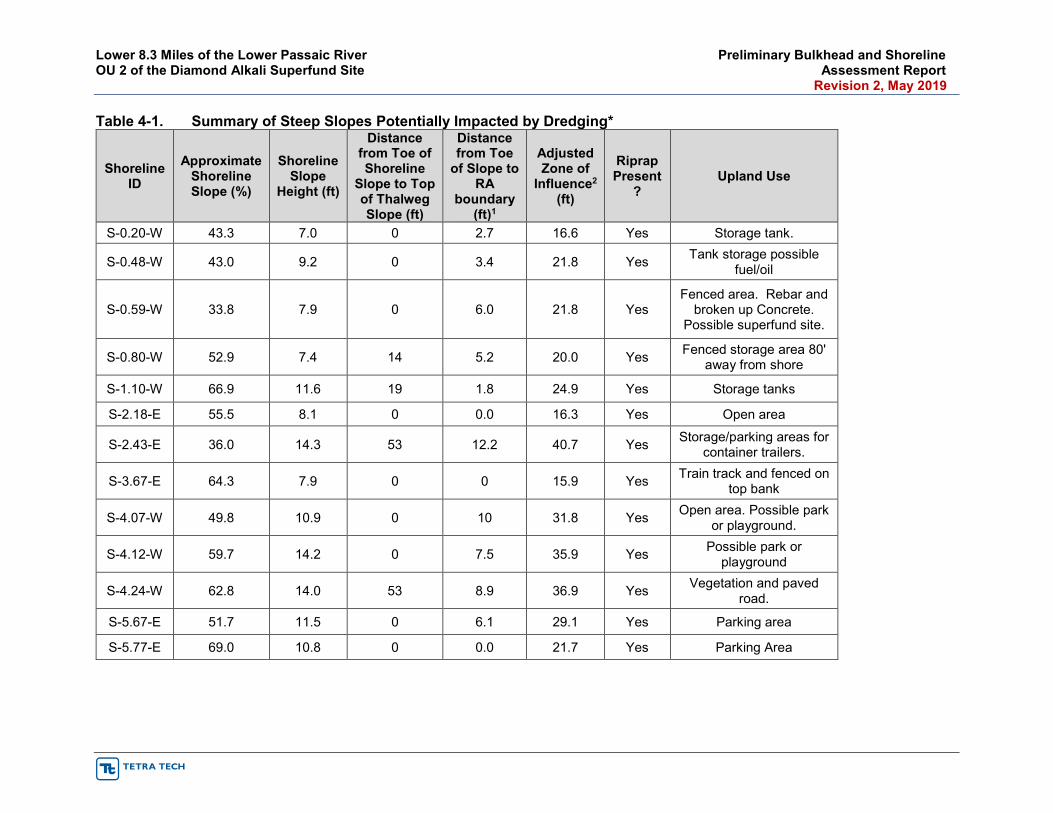
Lower 8.3 Miles of the Lower Passaic River Preliminary Bulkhead and Shoreline OU 2 of the Diamond Alkali Superfund Site Assessment Report Revision 2, May 2019
Table 4-1. Summary of Steep Slopes Potentially Impacted by Dredging*
Shoreline ID
Approximate Shoreline Slope (%)
Shoreline Slope
Height (ft)
Distance from Toe of Shoreline
Slope to Top of Thalweg Slope (ft)
Distance from Toe
of Slope to RA
boundary (ft)1
Adjusted Zone of
Influence2 (ft)
Riprap Present
? Upland Use
S-0.20-W 43.3 7.0 0 2.7 16.6 Yes Storage tank.
S-0.48-W 43.0 9.2 0 3.4 21.8 Yes Tank storage possible fuel/oil
S-0.59-W 33.8 7.9 0 6.0 21.8 Yes Fenced area. Rebar and
broken up Concrete. Possible superfund site.
S-0.80-W 52.9 7.4 14 5.2 20.0 Yes Fenced storage area 80' away from shore
S-1.10-W 66.9 11.6 19 1.8 24.9 Yes Storage tanks
S-2.18-E 55.5 8.1 0 0.0 16.3 Yes Open area
S-2.43-E 36.0 14.3 53 12.2 40.7 Yes Storage/parking areas for container trailers.
S-3.67-E 64.3 7.9 0 0 15.9 Yes Train track and fenced on top bank
S-4.07-W 49.8 10.9 0 10 31.8 Yes Open area. Possible park or playground.
S-4.12-W 59.7 14.2 0 7.5 35.9 Yes Possible park or playground
S-4.24-W 62.8 14.0 53 8.9 36.9 Yes Vegetation and paved road.
S-5.67-E 51.7 11.5 0 6.1 29.1 Yes Parking area
S-5.77-E 69.0 10.8 0 0.0 21.7 Yes Parking Area
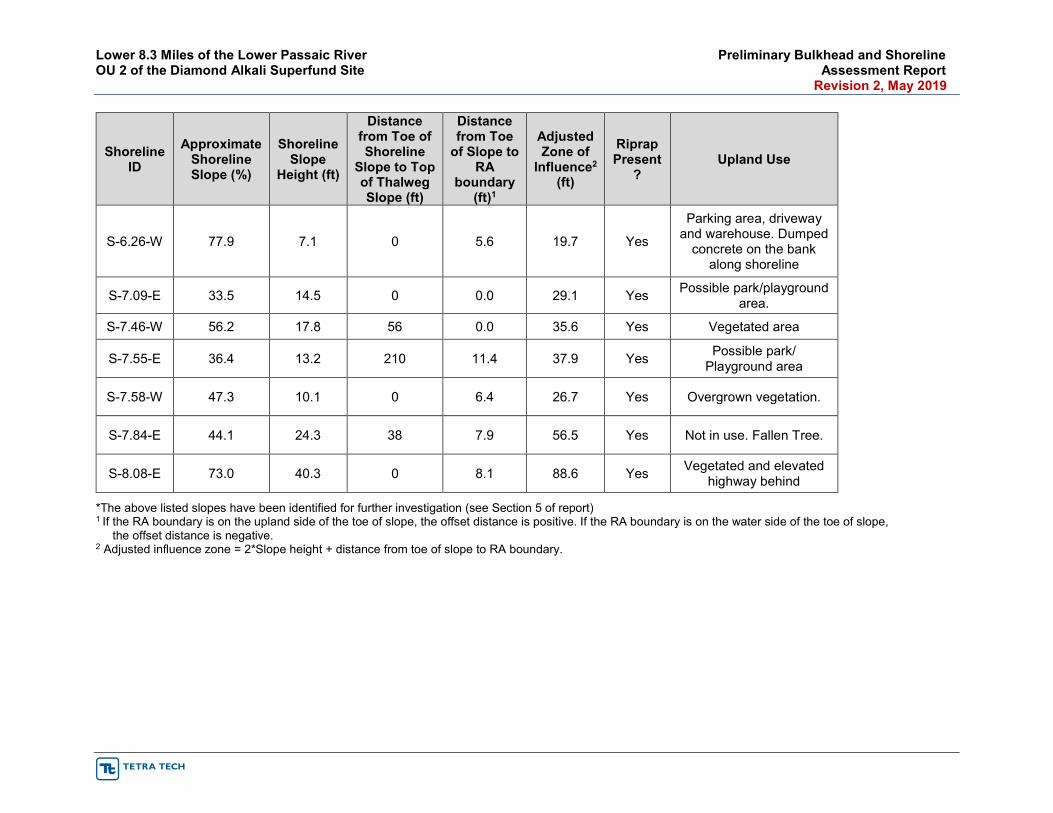
Lower 8.3 Miles of the Lower Passaic River Preliminary Bulkhead and Shoreline OU 2 of the Diamond Alkali Superfund Site Assessment Report Revision 2, May 2019
Shoreline ID
Approximate Shoreline Slope (%)
Shoreline Slope
Height (ft)
Distance from Toe of Shoreline
Slope to Top of Thalweg Slope (ft)
Distance from Toe
of Slope to RA
boundary (ft)1
Adjusted Zone of
Influence2 (ft)
Riprap Present
? Upland Use
S-6.26-W 77.9 7.1 0 5.6 19.7 Yes
Parking area, driveway and warehouse. Dumped
concrete on the bank along shoreline
S-7.09-E 33.5 14.5 0 0.0 29.1 Yes Possible park/playground area.
S-7.46-W 56.2 17.8 56 0.0 35.6 Yes Vegetated area
S-7.55-E 36.4 13.2 210 11.4 37.9 Yes Possible park/ Playground area
S-7.58-W 47.3 10.1 0 6.4 26.7 Yes Overgrown vegetation.
S-7.84-E 44.1 24.3 38 7.9 56.5 Yes Not in use. Fallen Tree.
S-8.08-E 73.0 40.3 0 8.1 88.6 Yes Vegetated and elevated highway behind
*The above listed slopes have been identified for further investigation (see Section 5 of report) 1 If the RA boundary is on the upland side of the toe of slope, the offset distance is positive. If the RA boundary is on the water side of the toe of slope, the offset distance is negative. 2 Adjusted influence zone = 2*Slope height + distance from toe of slope to RA boundary.
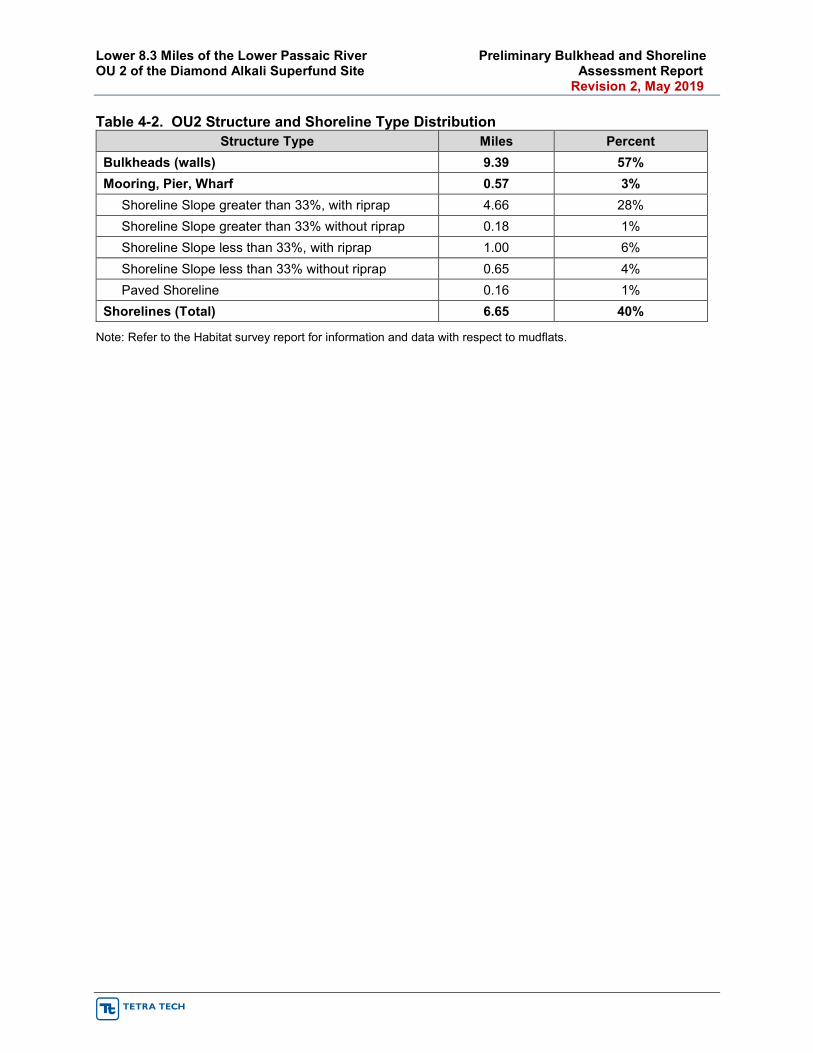
Lower 8.3 Miles of the Lower Passaic River Preliminary Bulkhead and Shoreline OU 2 of the Diamond Alkali Superfund Site Assessment Report Revision 2, May 2019
Table 4-2. OU2 Structure and Shoreline Type Distribution Structure Type Miles Percent
Bulkheads (walls) 9.39 57% Mooring, Pier, Wharf 0.57 3% Shoreline Slope greater than 33%, with riprap 4.66 28% Shoreline Slope greater than 33% without riprap 0.18 1% Shoreline Slope less than 33%, with riprap 1.00 6% Shoreline Slope less than 33% without riprap 0.65 4% Paved Shoreline 0.16 1% Shorelines (Total) 6.65 40%
Note: Refer to the Habitat survey report for information and data with respect to mudflats.

Lower 8.3 Miles of the Lower Passaic River Preliminary Bulkhead and Shoreline OU 2 of the Diamond Alkali Superfund Site Assessment Report Revision 2, May 2019
LPROU2-PDI_PBSAR_Rev 2_2019-05-20_CLEAN.docx
FIGURES
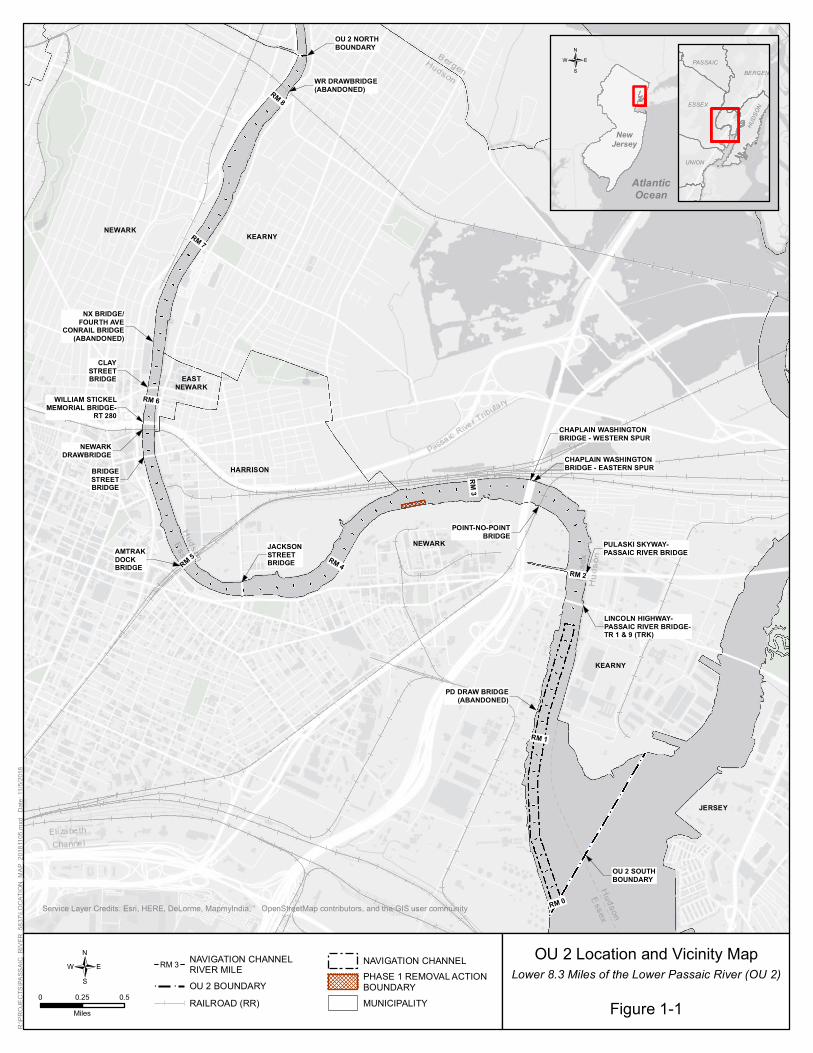
EASTNEWARK
JERSEY
HARRISON
TWP
NEWARK
KEARNY
KEARNY
NEWARK
RM 2
RM 4
RM 1
RM 8
RM 6
RM 0
RM
3
RM 7
RM 5
OU 2 NORTHBOUNDARY
OU 2 SOUTHBOUNDARY
PD DRAW BRIDGE(ABANDONED)
LINCOLN HIGHWAY-PASSAIC RIVER BRIDGE-TR 1 & 9 (TRK)
PULASKI SKYWAY-PASSAIC RIVER BRIDGE
POINT-NO-POINTBRIDGE
CHAPLAIN WASHINGTONBRIDGE - EASTERN SPUR
CHAPLAIN WASHINGTONBRIDGE - WESTERN SPUR
JACKSONSTREETBRIDGE
AMTRAKDOCKBRIDGE
BRIDGESTREETBRIDGE
NEWARKDRAWBRIDGE
WILLIAM STICKELMEMORIAL BRIDGE-
RT 280
CLAYSTREETBRIDGE
NX BRIDGE/FOURTH AVE
CONRAIL BRIDGE(ABANDONED)
WR DRAWBRIDGE(ABANDONED)
Service Layer Credits: Esri, HERE, DeLorme, MapmyIndia, ' OpenStreetMap contributors, and the GIS user community
NewJersey
AtlanticOcean
ESSEX
BERGEN
UNION
PASSAIC
HUDS
ON
/
R:\P
RO
JEC
TS\P
ASS
AIC
_RIV
ER_5
837\
LOC
ATIO
N_M
AP_
2018
1105
.mxd
D
ate:
11/
5/20
18
OU 2 Location and Vicinity MapLower 8.3 Miles of the Lower Passaic River (OU 2)
Figure 1-10 0.50.25
Miles
/ NAVIGATION CHANNELRIVER MILE
! ! OU 2 BOUNDARY
RAILROAD (RR)
NAVIGATION CHANNEL
PHASE 1 REMOVAL ACTIONBOUNDARY
MUNICIPALITY
RM 3
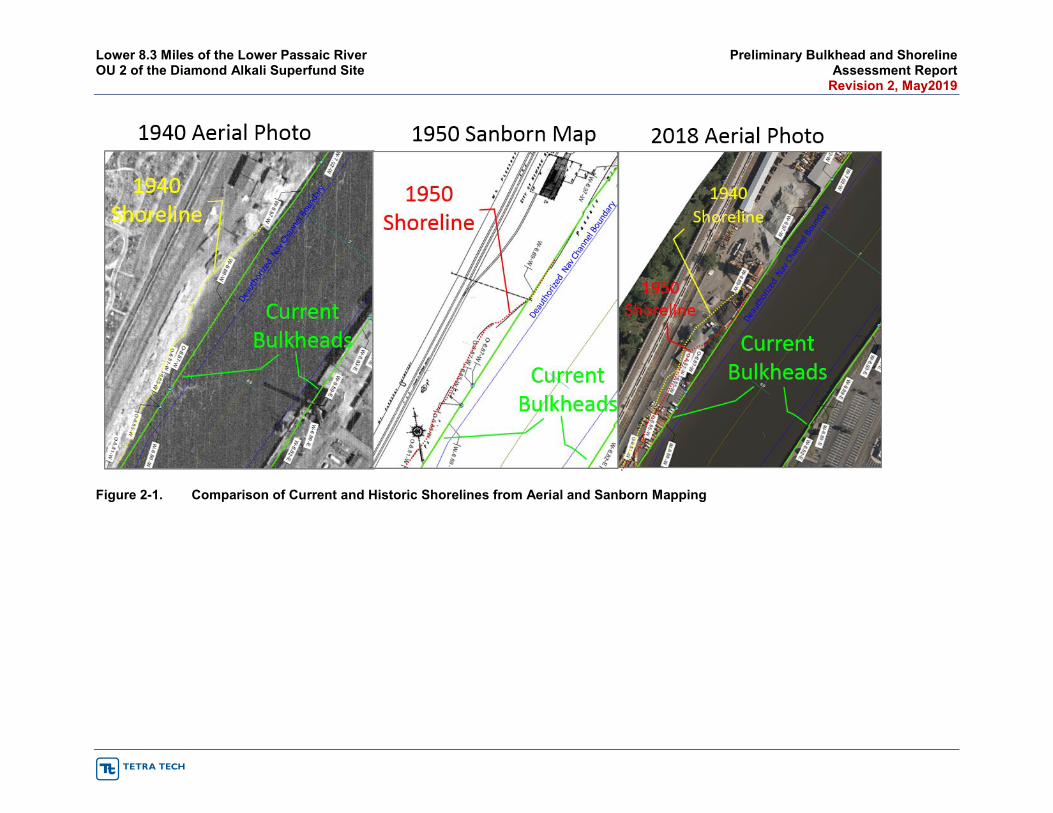
Lower 8.3 Miles of the Lower Passaic River Preliminary Bulkhead and Shoreline OU 2 of the Diamond Alkali Superfund Site Assessment Report Revision 2, May2019
Figure 2-1. Comparison of Current and Historic Shorelines from Aerial and Sanborn Mapping
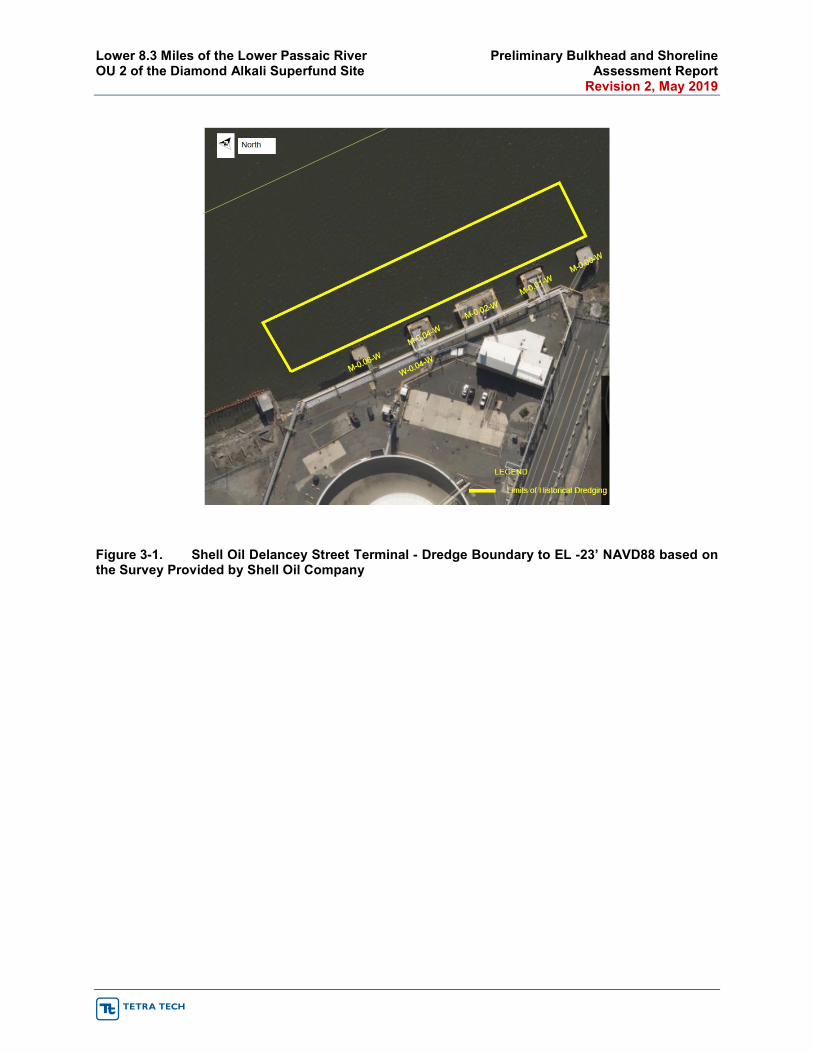
Lower 8.3 Miles of the Lower Passaic River Preliminary Bulkhead and Shoreline OU 2 of the Diamond Alkali Superfund Site Assessment Report Revision 2, May 2019
Figure 3-1. Shell Oil Delancey Street Terminal - Dredge Boundary to EL -23’ NAVD88 based on the Survey Provided by Shell Oil Company
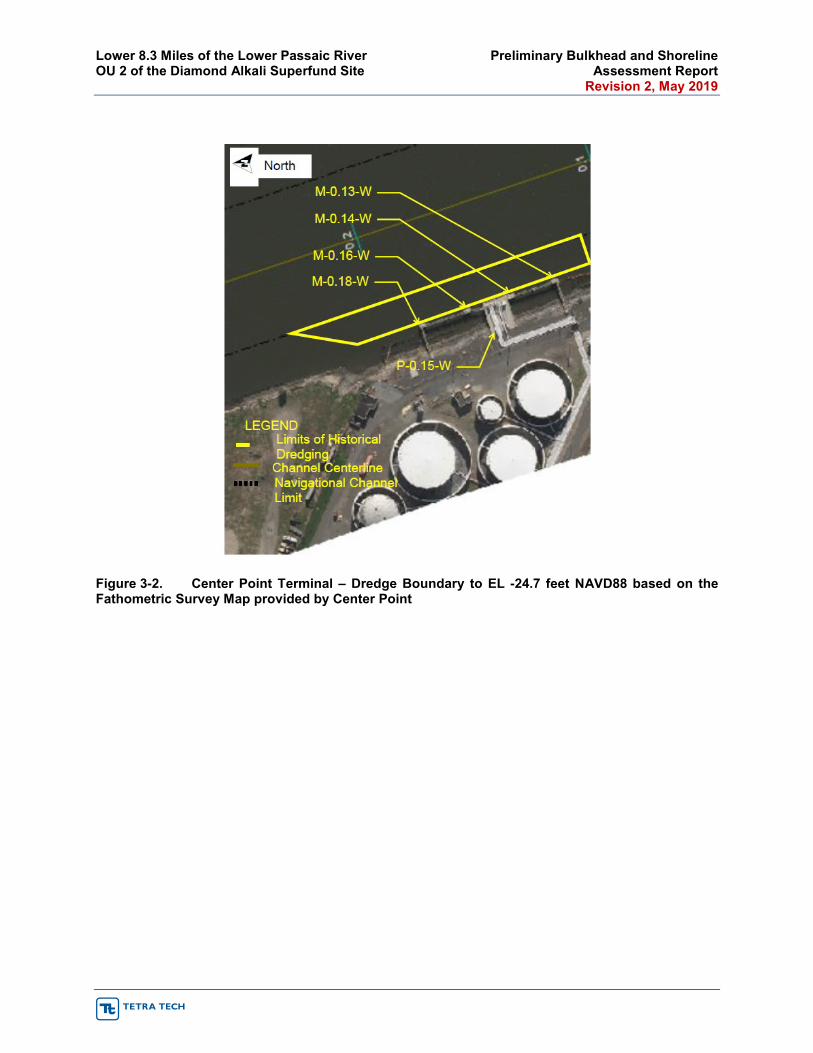
Lower 8.3 Miles of the Lower Passaic River Preliminary Bulkhead and Shoreline OU 2 of the Diamond Alkali Superfund Site Assessment Report Revision 2, May 2019
Figure 3-2. Center Point Terminal – Dredge Boundary to EL -24.7 feet NAVD88 based on the Fathometric Survey Map provided by Center Point
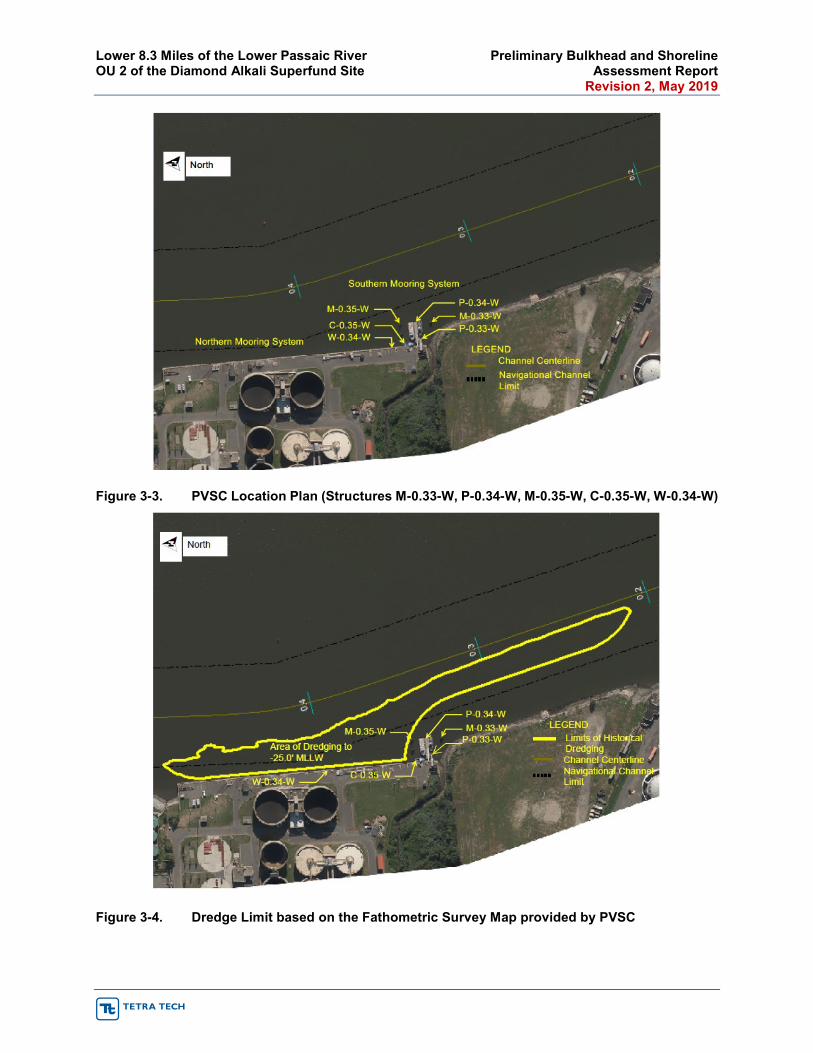
Lower 8.3 Miles of the Lower Passaic River Preliminary Bulkhead and Shoreline OU 2 of the Diamond Alkali Superfund Site Assessment Report Revision 2, May 2019
Figure 3-3. PVSC Location Plan (Structures M-0.33-W, P-0.34-W, M-0.35-W, C-0.35-W, W-0.34-W)
Figure 3-4. Dredge Limit based on the Fathometric Survey Map provided by PVSC

Lower 8.3 Miles of the Lower Passaic River Preliminary Bulkhead and Shoreline OU 2 of the Diamond Alkali Superfund Site Assessment Report Revision 2, May 2019
Figure 3-5. Darling International (Structures W-0.50-W, P-0.52-W) with Navigation Channel
Dredge area estimated based on usage and bathymetric data
Figure 3-6. Sunoco Logistics (Structures M-0.64-W, M-0.65-W, W-0.73-W, P-0.79-W) and Estimated Dredge Limit
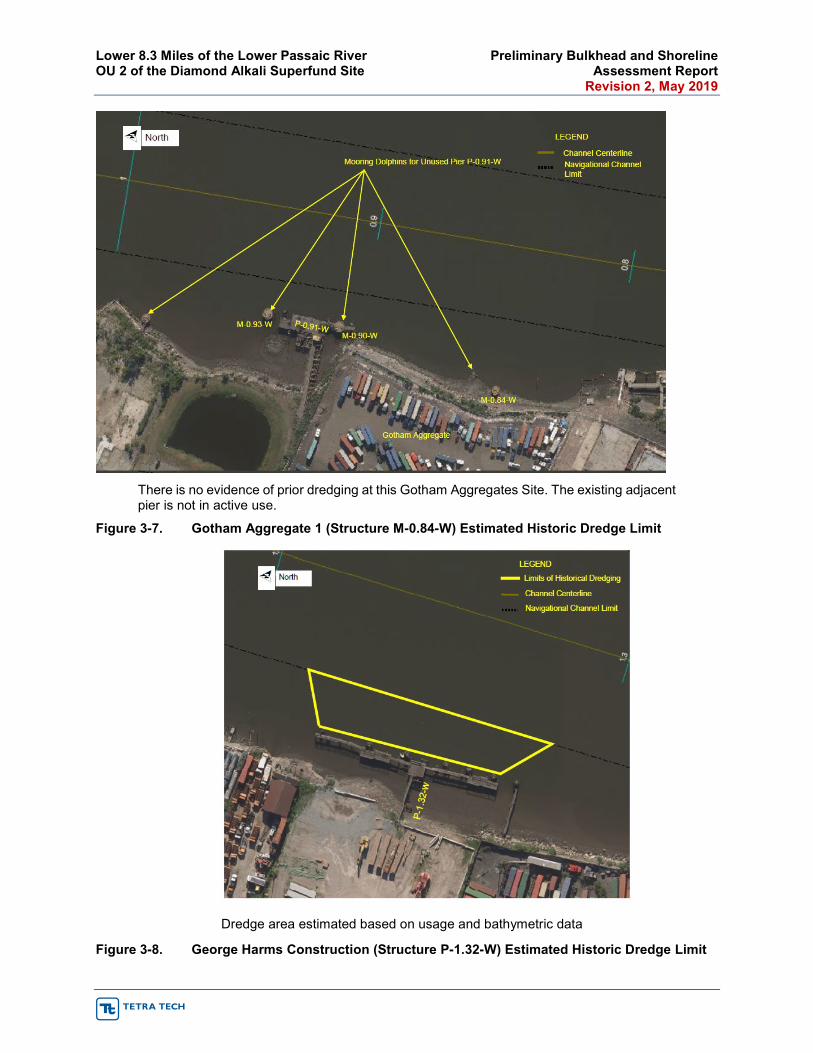
Lower 8.3 Miles of the Lower Passaic River Preliminary Bulkhead and Shoreline OU 2 of the Diamond Alkali Superfund Site Assessment Report Revision 2, May 2019
There is no evidence of prior dredging at this Gotham Aggregates Site. The existing adjacent pier is not in active use.
Figure 3-7. Gotham Aggregate 1 (Structure M-0.84-W) Estimated Historic Dredge Limit
Dredge area estimated based on usage and bathymetric data
Figure 3-8. George Harms Construction (Structure P-1.32-W) Estimated Historic Dredge Limit
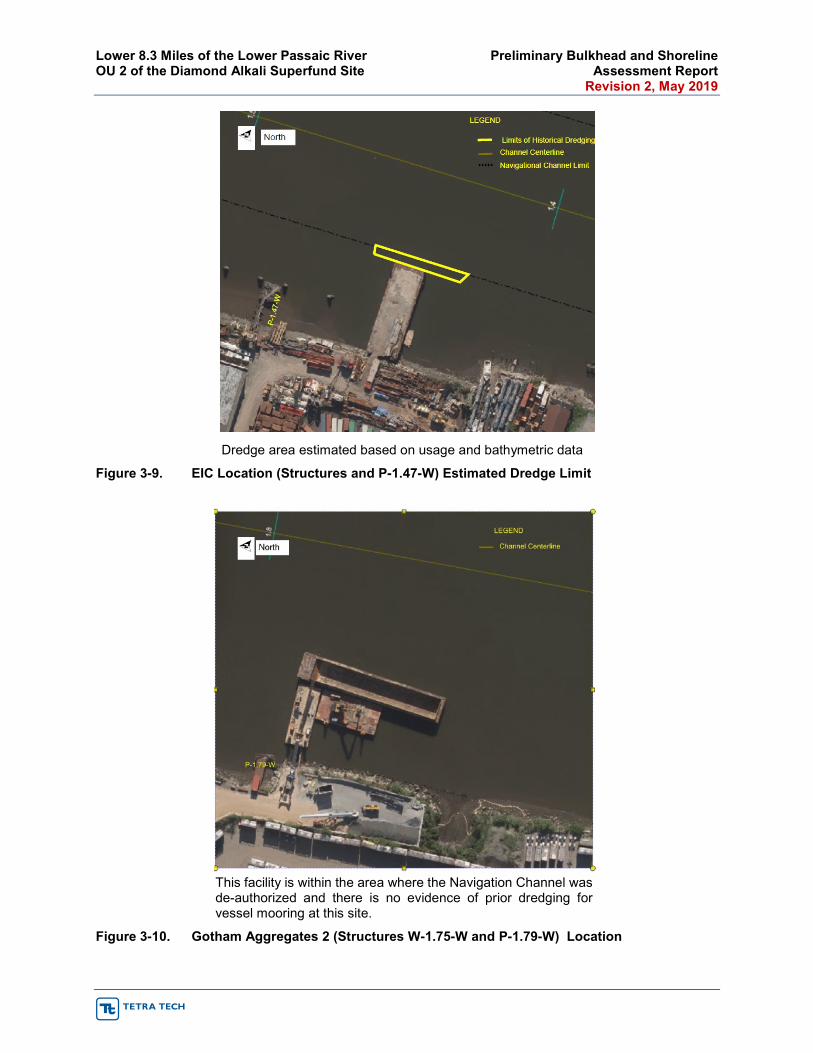
Lower 8.3 Miles of the Lower Passaic River Preliminary Bulkhead and Shoreline OU 2 of the Diamond Alkali Superfund Site Assessment Report Revision 2, May 2019
Dredge area estimated based on usage and bathymetric data
Figure 3-9. EIC Location (Structures and P-1.47-W) Estimated Dredge Limit
This facility is within the area where the Navigation Channel was de-authorized and there is no evidence of prior dredging for vessel mooring at this site.
Figure 3-10. Gotham Aggregates 2 (Structures W-1.75-W and P-1.79-W) Location
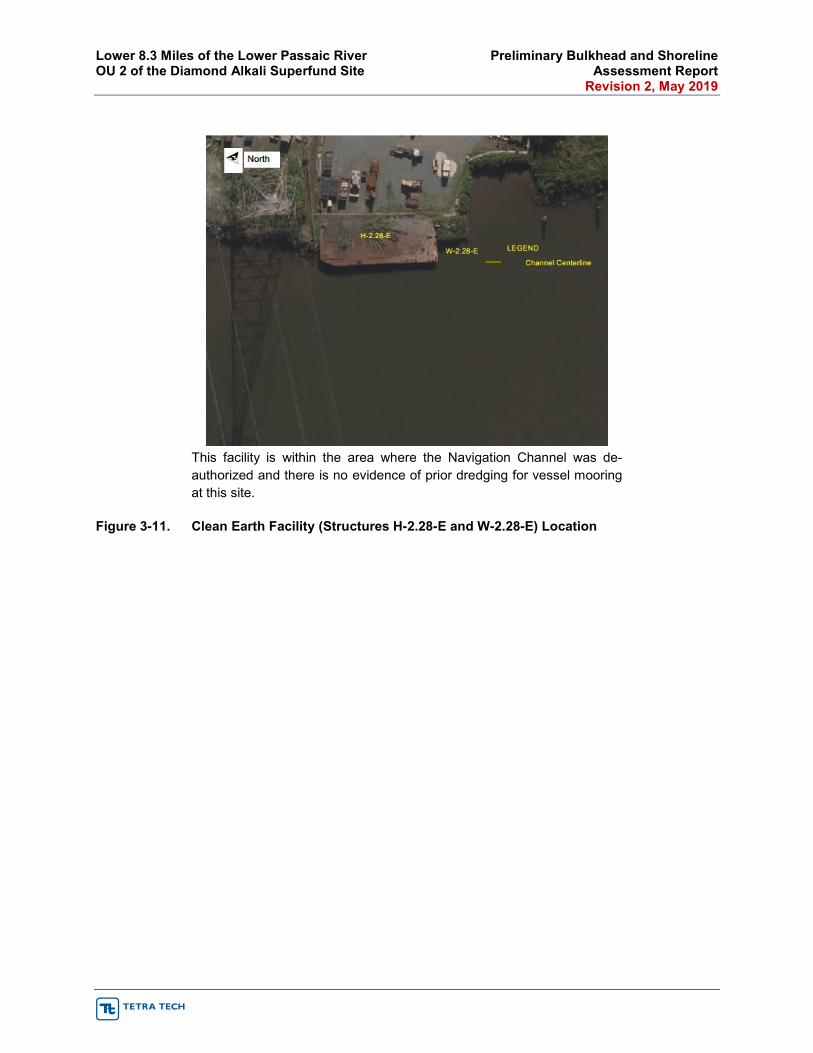
Lower 8.3 Miles of the Lower Passaic River Preliminary Bulkhead and Shoreline OU 2 of the Diamond Alkali Superfund Site Assessment Report Revision 2, May 2019
This facility is within the area where the Navigation Channel was de-authorized and there is no evidence of prior dredging for vessel mooring at this site.
Figure 3-11. Clean Earth Facility (Structures H-2.28-E and W-2.28-E) Location
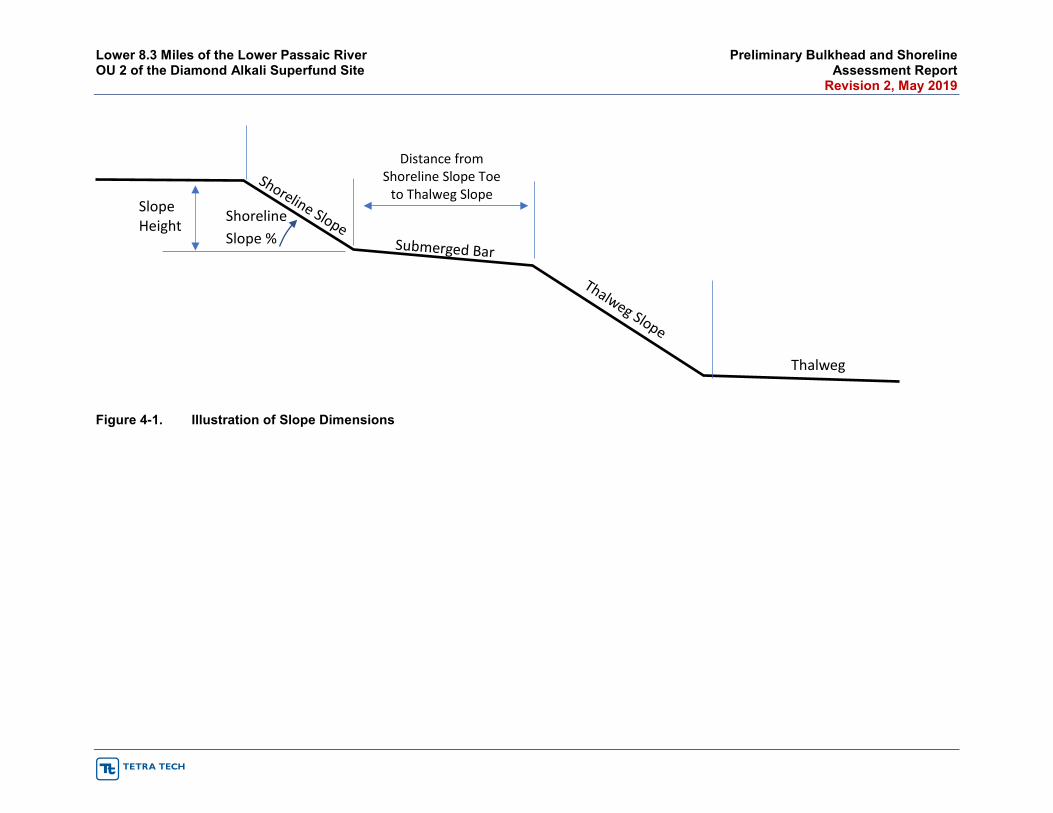
Lower 8.3 Miles of the Lower Passaic River Preliminary Bulkhead and Shoreline OU 2 of the Diamond Alkali Superfund Site Assessment Report Revision 2, May 2019
Figure 4-1. Illustration of Slope Dimensions
Slope Height
Distance from Shoreline Slope Toe
to Thalweg Slope
Shoreline Slope %
Thalweg
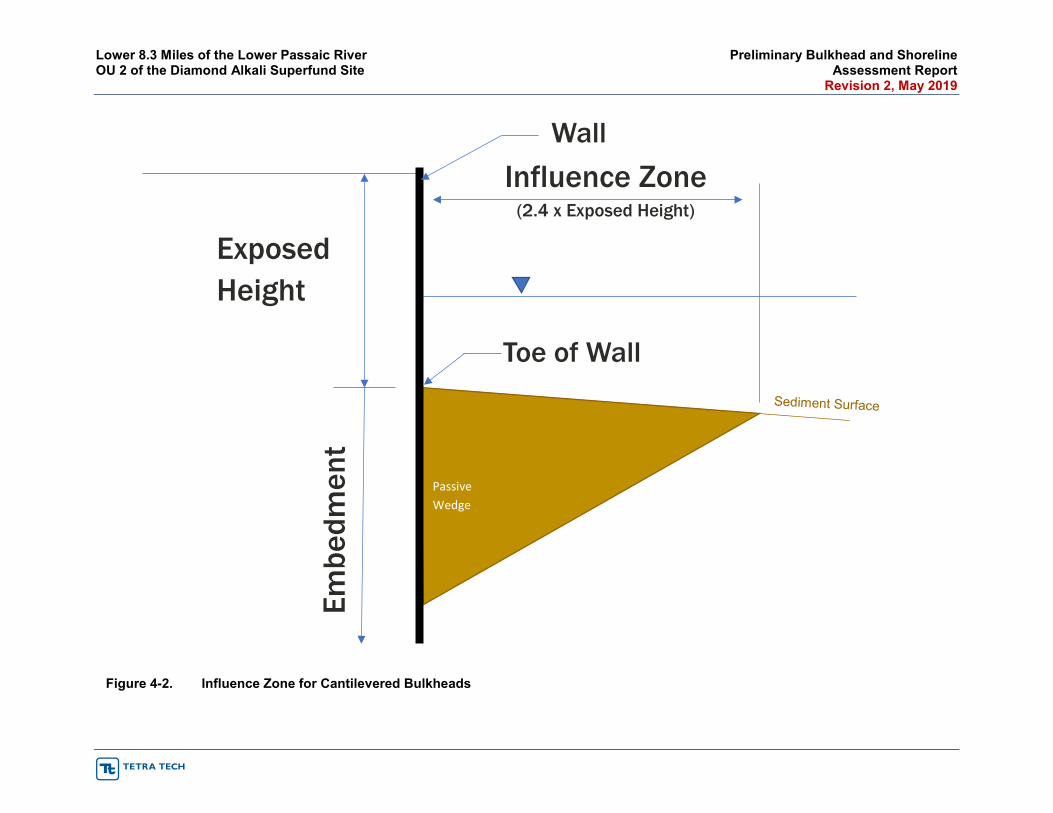
Lower 8.3 Miles of the Lower Passaic River Preliminary Bulkhead and Shoreline OU 2 of the Diamond Alkali Superfund Site Assessment Report Revision 2, May 2019
Passive Wedge
Influence Zone (2.4 x Exposed Height)
Exposed
Height
Embe
dmen
t
Wall
Toe of Wall
Figure 4-2. Influence Zone for Cantilevered Bulkheads
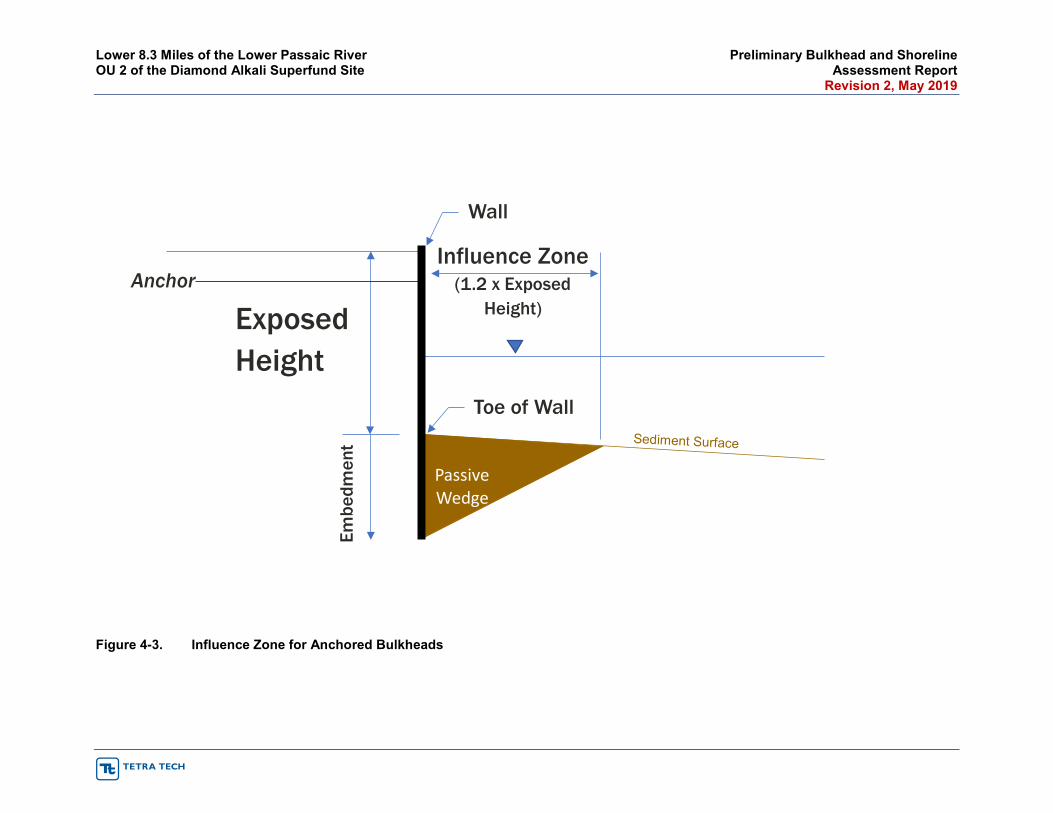
Lower 8.3 Miles of the Lower Passaic River Preliminary Bulkhead and Shoreline OU 2 of the Diamond Alkali Superfund Site Assessment Report Revision 2, May 2019
Figure 4-3. Influence Zone for Anchored Bulkheads
Passive Wedge
Influence Zone (1.2 x Exposed
Height) Exposed
Height
Anchor
Embe
dmen
t
Wall
Toe of Wall
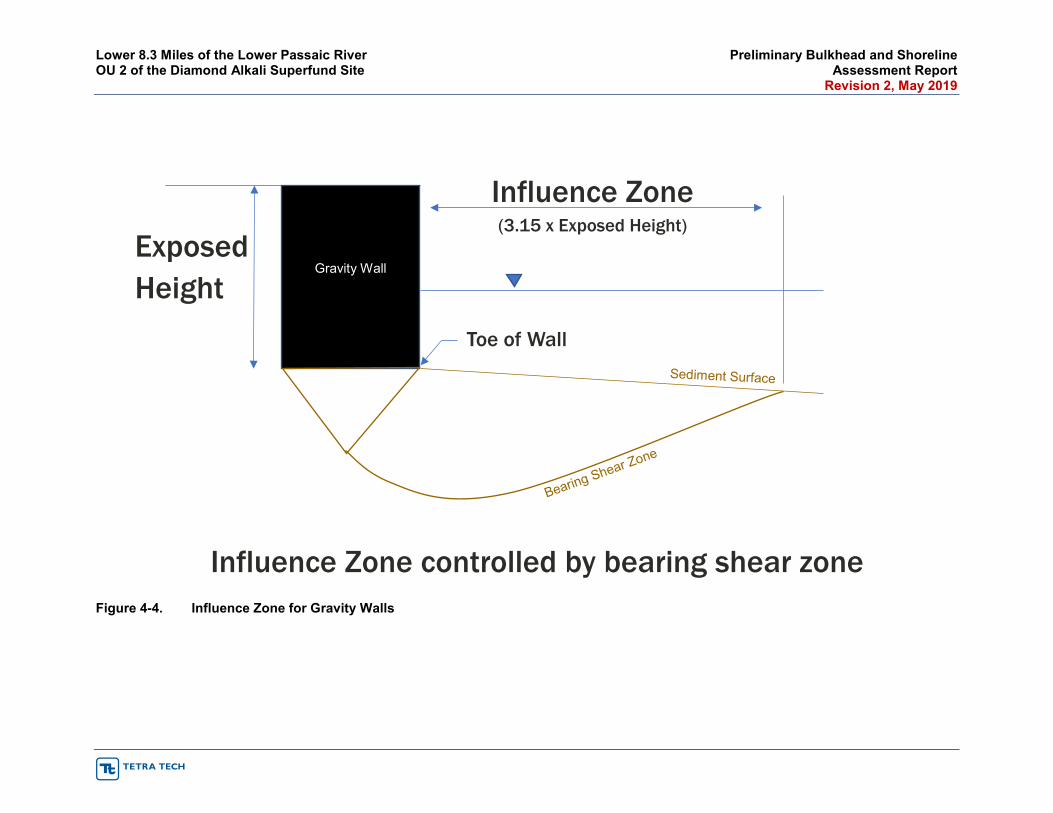
Lower 8.3 Miles of the Lower Passaic River Preliminary Bulkhead and Shoreline OU 2 of the Diamond Alkali Superfund Site Assessment Report Revision 2, May 2019
Figure 4-4. Influence Zone for Gravity Walls
Influence Zone (3.15 x Exposed Height)
Exposed
Height
Gravity Wall
Influence Zone controlled by bearing shear zone
Toe of Wall
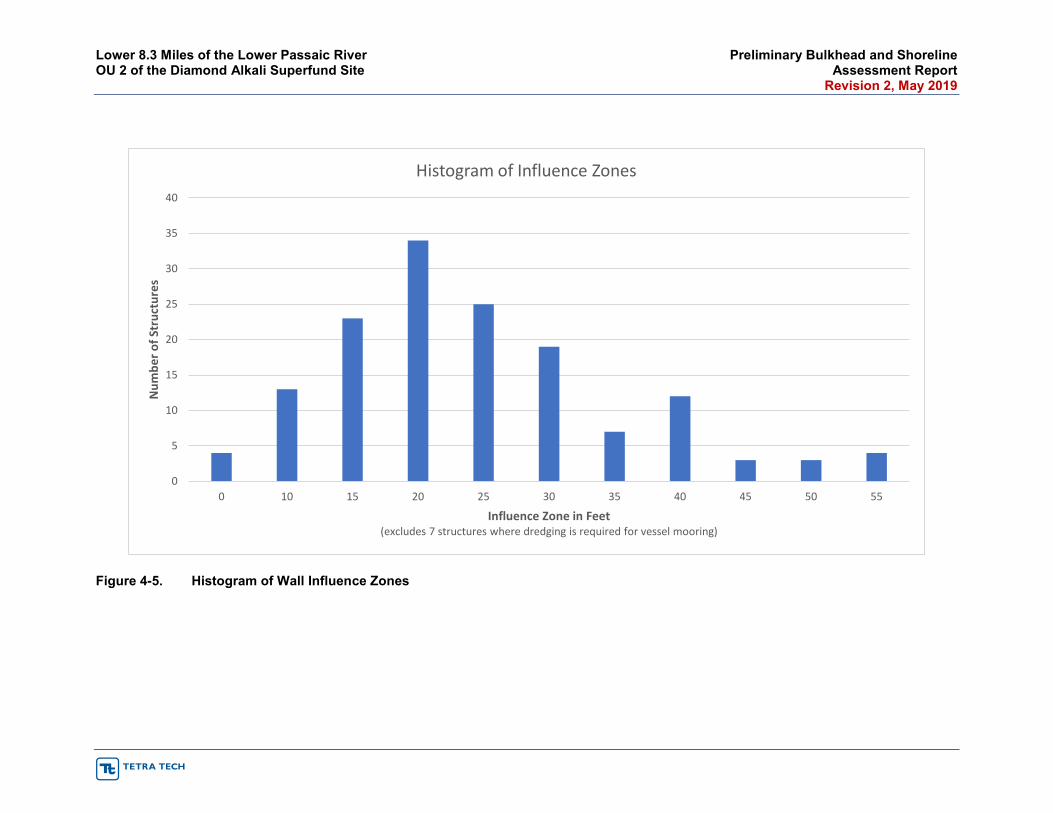
Lower 8.3 Miles of the Lower Passaic River Preliminary Bulkhead and Shoreline OU 2 of the Diamond Alkali Superfund Site Assessment Report Revision 2, May 2019
Figure 4-5. Histogram of Wall Influence Zones
0
5
10
15
20
25
30
35
40
0 10 15 20 25 30 35 40 45 50 55
Num
ber o
f Str
uctu
res
Influence Zone in Feet(excludes 7 structures where dredging is required for vessel mooring)
Histogram of Influence Zones
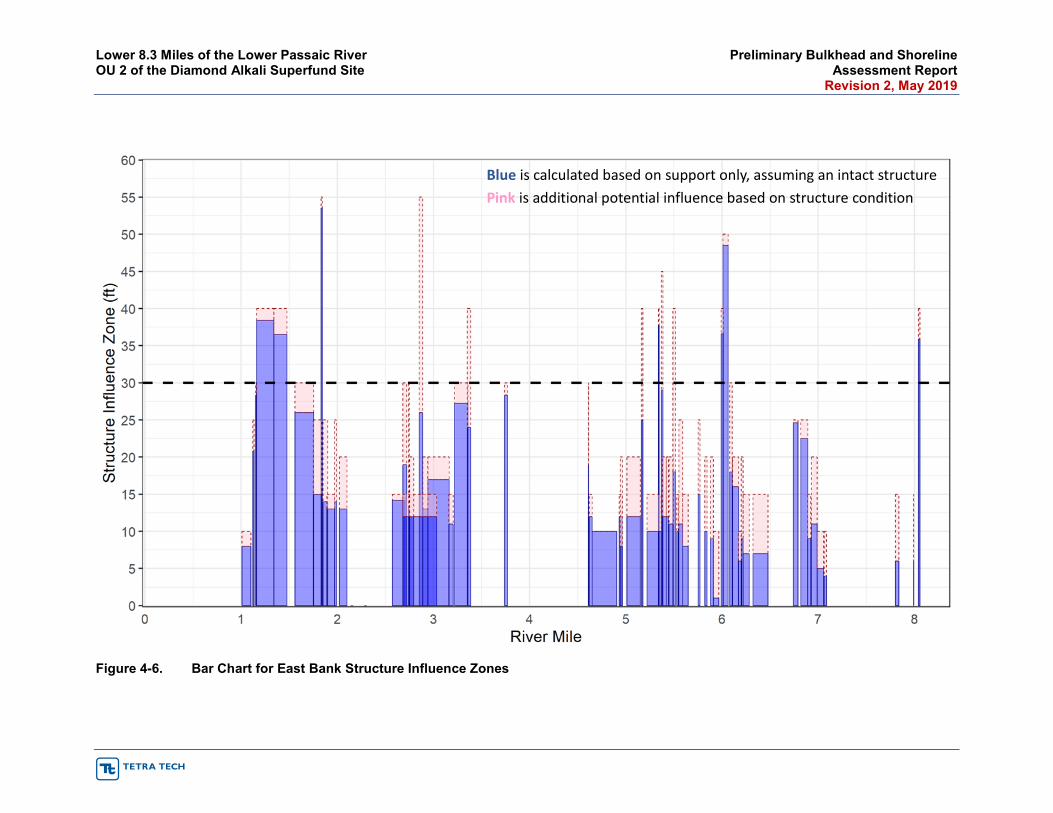
Lower 8.3 Miles of the Lower Passaic River Preliminary Bulkhead and Shoreline OU 2 of the Diamond Alkali Superfund Site Assessment Report Revision 2, May 2019
Figure 4-6. Bar Chart for East Bank Structure Influence Zones
Blue is calculated based on support only, assuming an intact structure
Pink is additional potential influence based on structure condition
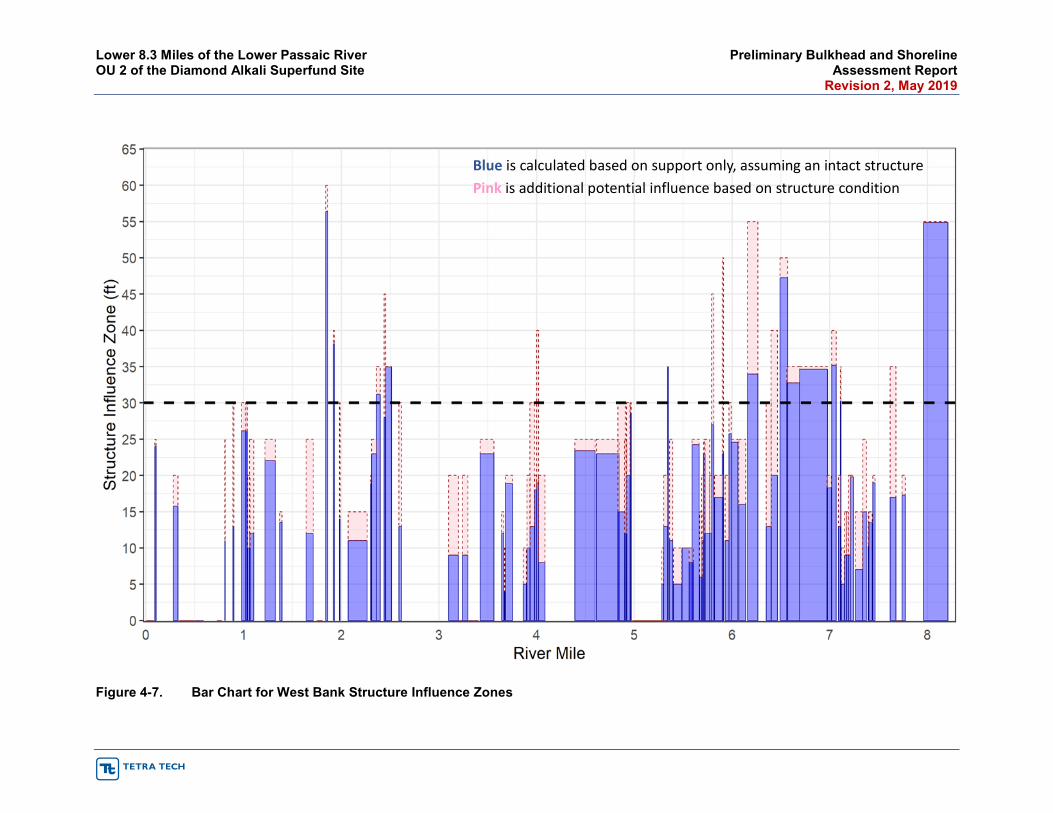
Lower 8.3 Miles of the Lower Passaic River Preliminary Bulkhead and Shoreline OU 2 of the Diamond Alkali Superfund Site Assessment Report Revision 2, May 2019
Figure 4-7. Bar Chart for West Bank Structure Influence Zones
Blue is calculated based on support only, assuming an intact structure
Pink is additional potential influence based on structure condition
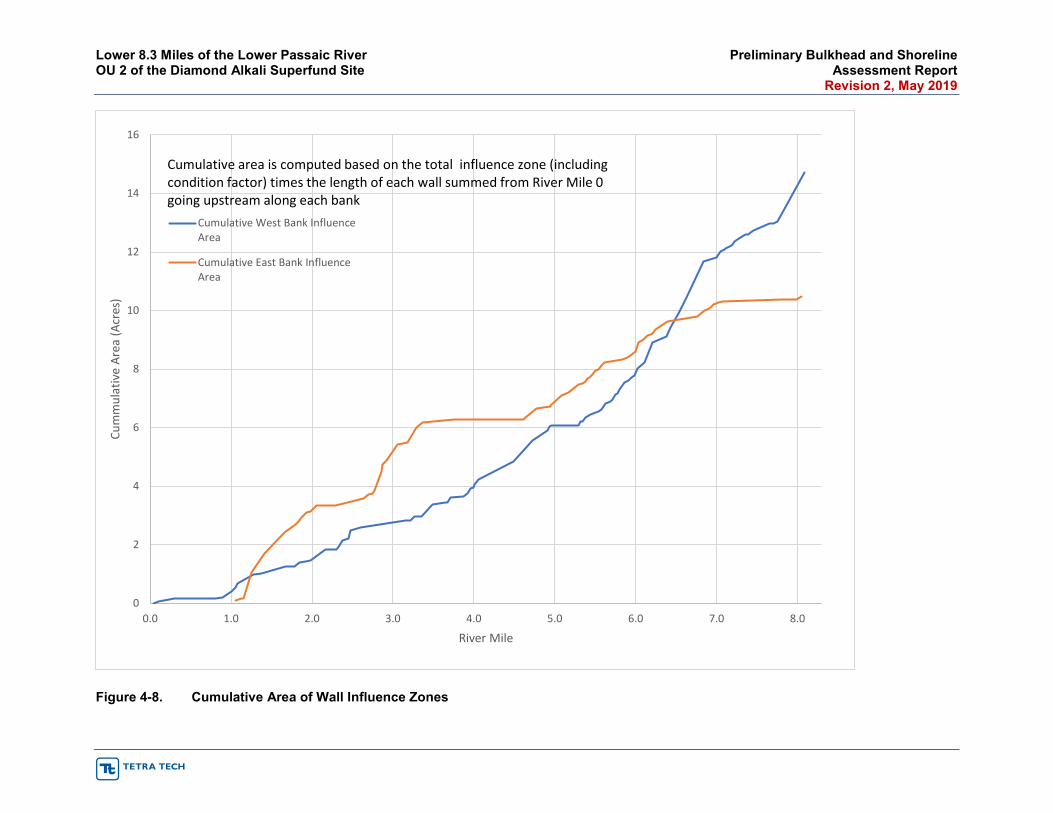
Lower 8.3 Miles of the Lower Passaic River Preliminary Bulkhead and Shoreline OU 2 of the Diamond Alkali Superfund Site Assessment Report Revision 2, May 2019
Figure 4-8. Cumulative Area of Wall Influence Zones
0
2
4
6
8
10
12
14
16
0.0 1.0 2.0 3.0 4.0 5.0 6.0 7.0 8.0
Cum
mul
ativ
e Ar
ea (A
cres
)
River Mile
Cumulative West Bank InfluenceArea
Cumulative East Bank InfluenceArea
Cumulative area is computed based on the total influence zone (includingcondition factor) times the length of each wall summed from River Mile 0going upstream along each bank
Lower 8.3 Miles of the Lower Passaic River Preliminary Bulkhead and Shoreline OU 2 of the Diamond Alkali Superfund Site Assessment Report Revision 2, May 2019
LPROU2-PDI_PBSAR_Rev 2_2019-05-20_CLEAN.docx
APPENDICES
Lower 8.3 Miles of the Lower Passaic River Preliminary Bulkhead and Shoreline OU 2 of the Diamond Alkali Superfund Site Assessment Report Revision 2, May 2019
LPROU2-PDI_PBSAR_Rev 2_2019-05-20_CLEAN.docx
APPENDIX A—SOURCES OF BULKHEAD AND SHORELINE DATA

Lower 8.3 Miles of the Lower Passaic River Preliminary Bulkhead and Shoreline OU 2 of the Diamond Alkali Superfund Site Assessment Report Revision 2, May 2019
LPROU2-PDI_PBSAR_Rev 2_2019-05-20_CLEAN.docx
APPENDIX B—OWNER-PROVIDED STRUCTURE INFORMATION

Lower 8.3 Miles of the Lower Passaic River Preliminary Bulkhead and Shoreline OU 2 of the Diamond Alkali Superfund Site Assessment Report Revision 2, May 2019
LPROU2-PDI_PBSAR_Rev 2_2019-05-20_CLEAN.docx
APPENDIX C—STRUCTURE DATA TABLES
Lower 8.3 Miles of the Lower Passaic River Preliminary Bulkhead and Shoreline OU 2 of the Diamond Alkali Superfund Site Assessment Report Revision 2, May 2019
LPROU2-PDI_PBSAR_Rev 2_2019-05-20_CLEAN.docx
APPENDIX D—STRUCTURE MAPS

Lower 8.3 Miles of the Lower Passaic River Preliminary Bulkhead and Shoreline OU 2 of the Diamond Alkali Superfund Site Assessment Report Revision 2, May 2019
LPROU2-PDI_PBSAR_Rev 2_2019-05-20_CLEAN.docx
APPENDIX E—STRUCTURE PHOTOGRAPH LOG
Lower 8.3 Miles of the Lower Passaic River Preliminary Bulkhead and Shoreline OU 2 of the Diamond Alkali Superfund Site Assessment Report Revision 2, May 2019
LPROU2-PDI_PBSAR_Rev 2_2019-05-20_CLEAN.docx
APPENDIX F—BRIDGE LIDAR AND PHOTO IMAGES

Lower 8.3 Miles of the Lower Passaic River Preliminary Bulkhead and Shoreline OU 2 of the Diamond Alkali Superfund Site Assessment Report Revision 2, May 2019
LPROU2-PDI_PBSAR_Rev 2_2019-05-20_CLEAN.docx
APPENDIX G—CALCULATED ZONES OF INFLUENCE