Embed Size (px)
Citation preview
PRELIMINARY DEVELOPMENT AND FLIGHT TRIALS OF A
CRUISE ALTITUDE AND SPEED OPTIMIZATION DECISION
SUPPORT TOOL
Clement Li and R. John Hansman
This report is based on the Master’s Thesis of Clement Li submitted to the Department of
Aeronautics and Astronautics in partial fulfillment of the requirements for the degree of Master
of Science at the Massachusetts Institute of Technology.
Report No. ICAT-2018-08
Sep 2018
MIT International Center for Air Transportation (ICAT)
Department of Aeronautics & Astronautics
Massachusetts Institute of Technology
Cambridge, MA 02139 USA
Form DOT F 1700.7 (8-72) Reproduction of completed page authorized
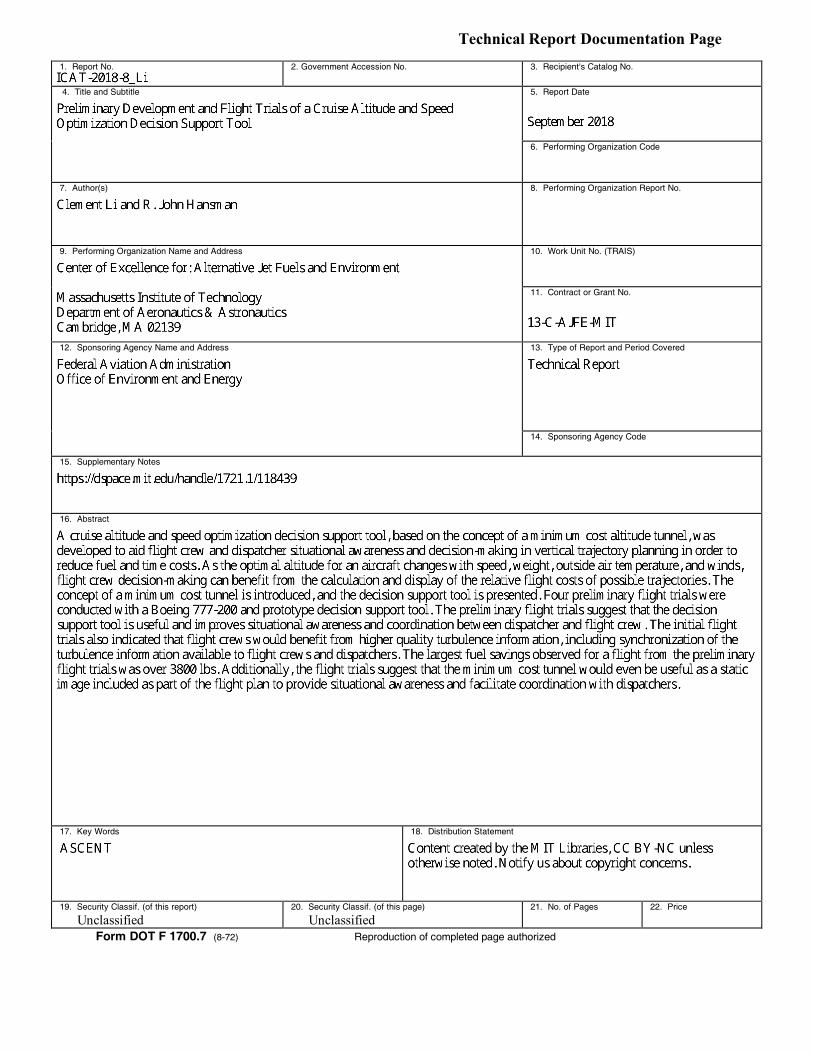
1. Report No. 2. Government Accession No. 3. Recipient's Catalog No.
4. Title and Subtitle 5. Report Date
6. Performing Organization Code
7. Author(s) 8. Performing Organization Report No.
9. Performing Organization Name and Address 10. Work Unit No. (TRAIS)
11. Contract or Grant No.
12. Sponsoring Agency Name and Address 13. Type of Report and Period Covered
14. Sponsoring Agency Code
15. Supplementary Notes
16. Abstract
17. Key Words 18. Distribution Statement
19. Security Classif. (of this report)
Unclassified 20. Security Classif. (of this page)
Unclassified 21. No. of Pages 22. Price
Technical Report Documentation Page

2
Preliminary Development and Flight Trials of a Cruise
Altitude and Speed Optimization Decision Support Tool
by
Clement Li
Submitted to the Department of Aeronautics and Astronauticson August 23, 2018, in partial ful�llment of the
requirements for the degree ofMaster of Science in Aeronautics and Astronautics
Abstract
A cruise altitude and speed optimization decision support tool, based on the conceptof a minimum cost altitude tunnel, was developed to aid �ight crew and dispatchersituational awareness and decision-making in vertical trajectory planning in order toreduce fuel and time costs. As the optimal altitude for an aircraft changes with speed,weight, outside air temperature, and winds, �ight crew decision-making can bene�tfrom the calculation and display of the relative �ight costs of possible trajectories.The concept of a minimum cost tunnel is introduced, and the decision support tool ispresented. Four preliminary �ight trials were conducted with a Boeing 777-200 andprototype decision support tool. The preliminary �ight trials suggest that the decisionsupport tool is useful and improves situational awareness and coordination betweendispatcher and �ight crew. The initial �ight trials also indicated that �ight crewswould bene�t from higher quality turbulence information, including synchronizationof the turbulence information available to �ight crews and dispatchers. The largestfuel savings observed for a �ight from the preliminary �ight trials was over 3800 lbs.Additionally, the �ight trials suggest that the minimum cost tunnel would even beuseful as a static image included as part of the �ight plan to provide situationalawareness and facilitate coordination with dispatchers.
Thesis Supervisor: R. John HansmanTitle: T. Wilson Professor of Aeronautics & Astronautics
3

4
Acknowledgments
The authors would like to thank Chris Dorbian (FAA), Tom Reynolds (Lincoln Labs),
Luke Jensen, Alan Midki�, Rocky Stone, and Gen Schnee for their support and
assistance in this project.
This work was sponsored by the Federal Aviation Administration (FAA) O�ce
of Environment and Energy as a part of ASCENT Project 15 under Air Force Con-
tract FA8721-05-C-0002. Any opinions, �ndings, conclusions, or recommendations
expressed in this material are those of the authors and do not necessarily re�ect the
views of the FAA or other ASCENT sponsors.
5

6
Contents
1 Introduction 13
2 Background 15
2.1 Lateral Planning . . . . . . . . . . . . . . . . . . . . . . . . . . . . . 15
2.2 Vertical Planning . . . . . . . . . . . . . . . . . . . . . . . . . . . . . 16
2.3 Cost . . . . . . . . . . . . . . . . . . . . . . . . . . . . . . . . . . . . 17
2.4 Fuel Burn . . . . . . . . . . . . . . . . . . . . . . . . . . . . . . . . . 18
2.5 Flight Time . . . . . . . . . . . . . . . . . . . . . . . . . . . . . . . . 19
2.6 Turbulence . . . . . . . . . . . . . . . . . . . . . . . . . . . . . . . . . 19
2.7 Current Flight Planning Practice . . . . . . . . . . . . . . . . . . . . 20
2.8 Altitude Tunnel . . . . . . . . . . . . . . . . . . . . . . . . . . . . . . 23
3 Cost Minimization Approach 27
3.1 Optimization and Cost Calculation Process . . . . . . . . . . . . . . . 27
3.1.1 Step 1: Initial Performance Estimate . . . . . . . . . . . . . . 27
3.1.2 Step 2: Cost Matrix Generation and Optimization . . . . . . . 30
3.1.3 Step 3: Final Performance Estimate . . . . . . . . . . . . . . . 33
3.2 Aircraft Performance Model . . . . . . . . . . . . . . . . . . . . . . . 33
3.3 Weather Model . . . . . . . . . . . . . . . . . . . . . . . . . . . . . . 34
4 Cruise Altitude and Speed Optimization Decision Support Tool 35
4.1 Minimum Cost Tunnel . . . . . . . . . . . . . . . . . . . . . . . . . . 35
4.2 Decision Support Tool . . . . . . . . . . . . . . . . . . . . . . . . . . 36
7
4.3 User Interface . . . . . . . . . . . . . . . . . . . . . . . . . . . . . . . 36
4.3.1 Minimum Cost Tunnel . . . . . . . . . . . . . . . . . . . . . . 36
4.3.2 User Controls . . . . . . . . . . . . . . . . . . . . . . . . . . . 39
4.3.3 Additional Information . . . . . . . . . . . . . . . . . . . . . . 41
4.4 DST Information Flow Architecture . . . . . . . . . . . . . . . . . . . 42
4.5 Prototype DST . . . . . . . . . . . . . . . . . . . . . . . . . . . . . . 44
5 Preliminary Flight Trials Set-Up 47
5.1 Decision Support Tool Set-Up . . . . . . . . . . . . . . . . . . . . . . 47
5.2 In-Flight . . . . . . . . . . . . . . . . . . . . . . . . . . . . . . . . . . 48
5.3 Post-Flight . . . . . . . . . . . . . . . . . . . . . . . . . . . . . . . . 49
5.4 Flight Trials . . . . . . . . . . . . . . . . . . . . . . . . . . . . . . . . 50
6 Preliminary Flight Trials Results 51
6.1 Flight 1: LAX-HNL . . . . . . . . . . . . . . . . . . . . . . . . . . . . 51
6.2 Flight 2: HNL-SFO . . . . . . . . . . . . . . . . . . . . . . . . . . . . 54
6.3 Flight 3: ORD-PVG . . . . . . . . . . . . . . . . . . . . . . . . . . . 58
6.4 Flight 4: PVG-ORD . . . . . . . . . . . . . . . . . . . . . . . . . . . 64
7 Discussion 71
7.1 Decision Support Tool Utility . . . . . . . . . . . . . . . . . . . . . . 71
7.2 Flight Crew and Dispatcher Coordination . . . . . . . . . . . . . . . 73
8 Conclusions 77
8
List of Figures
2-1 Fuel Savings from Altitude Optimization for 217,000 U.S. domestic
Flights in 2012. Adapted from [1] . . . . . . . . . . . . . . . . . . . . 17
2-2 Typical Fuel E�ciency Contours. Adapted from [1]. . . . . . . . . . . 18
2-3 Typical �ight plan showing waypoint names, latitude, longitude, planned
Mach, winds, expected segment fuel burn, and other information . . . 22
2-4 Minimum cost tunnel showing relative penalty costs at various altitudes
along the cruise track. Cooler colors indicate lower penalty costs (e.g.
blue represents altitudes with less than 1% penalty cost). Adapted
from [1] . . . . . . . . . . . . . . . . . . . . . . . . . . . . . . . . . . 23
2-5 Example fuel e�ciency tunnel showing a typical case where the tunnel
approximately follows a cruise-climb. Adapted from [2] . . . . . . . . 24
2-6 Example fuel e�ciency tunnel showing a descending tunnel due to
favorable winds at lower altitudes. Adapted from [2] . . . . . . . . . . 25
2-7 Example fuel e�ciency tunnel showing sudden altitude shifts due to
�ight crossing into and out of jetstreams. Adapted from [2] . . . . . . 25
3-1 Performance estimation process iterated for each lateral segment along
the track . . . . . . . . . . . . . . . . . . . . . . . . . . . . . . . . . . 29
3-2 Cost minimization process calculates performance for a set of possible
�ight conditions and produces a cost matrix . . . . . . . . . . . . . . 30
9
3-3 Cost minimization process then determines the minimum cost trajec-
tory by �rst identifying the cost of the minimal cost speed for each
altitude at each segment, generating a directed graph, and then apply-
ing Dijkstra's shortest path algorithm . . . . . . . . . . . . . . . . . . 32
3-4 Altitude tunnel is generated using the altitude costs for each segment
at the minimum cost Mach number for each altitude and each seg-
ment from the optimization. The penalty costs are calculated from the
optimal trajectory cost and displayed as an altitude tunnel . . . . . . 32
4-1 Simpli�ed minimum cost tunnel with 1% and 2% penalty boundaries
shown . . . . . . . . . . . . . . . . . . . . . . . . . . . . . . . . . . . 36
4-2 DST interface displaying minimum cost tunnel . . . . . . . . . . . . . 38
4-3 DST interface displaying EDR as example turbulence information . . 41
4-4 Information Flow Architecture . . . . . . . . . . . . . . . . . . . . . . 43
4-5 DST prototype with external GPS receiver . . . . . . . . . . . . . . . 45
5-1 Preliminary �ight trial setup. DST was operated on the ground with
images sent to �ight crew via website and in�ight Wi-Fi. When in-
�ight Wi-Fi inoperative, recommended trajectory sent via ACARS.
Dispatcher viewed DST display through website. . . . . . . . . . . . . 48
5-2 DST information displayed on the �ight deck . . . . . . . . . . . . . . 49
5-3 Lateral routes for preliminary �ight trials . . . . . . . . . . . . . . . . 50
6-1 Flight 1 DST display, forecasts generated 0600Z . . . . . . . . . . . . 52
6-2 Flight 1 DST display, forecasts generated 1200Z . . . . . . . . . . . . 52
6-3 Flight 1 summary with as-�own trajectory (green), �ight plan guidance
regions (blue), and �ight crew comments . . . . . . . . . . . . . . . . 54
6-4 Flight 2 DST display, forecasts from 0600Z . . . . . . . . . . . . . . . 55
6-5 Flight 2 DST display, forecasts generated 1200Z . . . . . . . . . . . . 56
6-6 Flight 2 DST display, revised �ight plan, forecasts generated 1200Z . 56
10
6-7 Flight 2 summary with as-�own trajectory (green), �ight plan guidance
regions (blue), and �ight crew comments . . . . . . . . . . . . . . . . 57
6-8 Flight 2 Signi�cant Weather Chart included with �ight plan . . . . . 58
6-9 Flight 3 DST display, forecasts generated 0600Z . . . . . . . . . . . . 59
6-10 Flight 3 DST display, revised �ight plan, forecasts generated 0600Z . 60
6-11 Flight 3 DST display, forecasts generated 1200Z . . . . . . . . . . . . 60
6-12 Flight 3 lateral deviation due to MOA with as-�own trajectory (green)
and original planned trajectory (magenta) . . . . . . . . . . . . . . . 61
6-13 Flight 3 DST display, updated position, forecasts generated 1200Z . . 61
6-14 Flight 3 DST display, forecasts generated 1800Z . . . . . . . . . . . . 62
6-15 Flight 3 second lateral deviation with as-�own trajectory (green) and
original planned trajectory (magenta) . . . . . . . . . . . . . . . . . . 63
6-16 Flight 3 DST display, updated position, forecasts generated 1800Z . . 63
6-17 Flight 3 summary with as-�own trajectory (green) . . . . . . . . . . . 64
6-18 Flight 4 DST display with 1200Z forecasts . . . . . . . . . . . . . . . 65
6-19 Flight 4 DST display, updated position with 1200Z forecasts . . . . . 66
6-20 Flight 4 lateral deviation with as-�own trajectory (green) and original
planned trajectory (magenta) . . . . . . . . . . . . . . . . . . . . . . 67
6-21 Flight 4 DST display with position update and forecasts generated at
1800Z . . . . . . . . . . . . . . . . . . . . . . . . . . . . . . . . . . . 67
6-22 Flight 4 summary with as-�own trajectory in green . . . . . . . . . . 68
11

12
Chapter 1
Introduction
This study investigates opportunities for improving airline �ight e�ciency through
a cruise altitude and speed optimization decision support tool. Although signi�cant
e�ort has been spent on optimizing lateral routes, optimizing vertical trajectories can
result in signi�cant savings [1]. Currently, some �ights spend some or all of cruise
o� the optimal speed and altitude. This may be due to either planned deviations
or tactical adjustments made en-route, and deviations may occur for turbulence,
air tra�c constraints, outdated weather information, di�culties in communicating
complicated trajectories, or other reasons.
Currently, �ight crews are provided with limited information and guidance for
�ying optimal vertical trajectories. Flight plans are typically generated two to three
hours before takeo� and consist of a list of lateral waypoints and a single altitude
pro�le with winds provided at three or four altitudes. The optimal trajectory changes
with the �ight's weight and with the evolution of weather. While optimal trajectories
often tend to increase gradually in altitude as the aircraft burns o� fuel, they can
also involve unexpected and sudden altitude shifts up and down when crossing into
or out of jetstreams.
As a result, when o�-nominal situations arise, such as encountering unexpected
turbulence along the planned route, determining the optimal trajectory with respect
to the new situation can be di�cult for �ight crews. In current practice, �ight crews
use general rules of thumb and the �ight management computer (FMC) to calculate
13
estimated fuel burn and �ight time. Using the FMC can impose workload demands,
as manual input of each trajectory considered is required.
A decision support tool (DST) was developed to assist in increasing situational
awareness and reducing costs by calculating and displaying the costs of the per-
formance space in the form of a minimum cost tunnel, along with identifying the
cost-optimal trajectory. The minimum cost tunnel provides a graphical representa-
tion of the relative costs of the altitude decision space, allowing crews to evaluate
trajectory options by visual inspection. The decision support tool also incorporates
higher resolution wind data and updates to forecasts as they become available over
the progression of a �ight.
14
Chapter 2
Background
Airlines seek to minimize the costs of a �ight without compromising safety or pas-
senger comfort. As aircraft typically spend the majority of their �ight time and,
consequently, fuel burn in cruise, the cruise phase presents an opportunity for reduc-
ing �ight costs through trajectory optimization. Flight costs can be broken down into
fuel burn and time-associated costs, such as crew costs and maintenance costs that
generally scale with time. Trajectory planning involves determining the lateral route,
altitude pro�le, and speed pro�le for a �ight that minimizes the �ight's total cost
within constraints imposed by the airspace structure, air tra�c control, and weather
for the safety of the �ight. Additionally, �ights also take into account turbulence in
order to maintain a comfortable ride quality for passengers.
2.1 Lateral Planning
Planning of lateral routes consists of �nding routes that minimize �ight time at a
constant airspeed, given the expected winds aloft during the �ight and accessible
airspace. In the presence of winds, the great-circle route, which minimizes ground
distance between two points, is often not the route resulting in the shortest �ight
time or fuel burn. Wind-optimal trajectories achieve shorter �ight times while �ying
slightly longer ground distances by taking advantage of favorable tailwinds and min-
imizing the impact of headwinds. Flights must also be planned to avoid restricted
15
areas, such as active military operating areas, and areas of signi�cant weather. Con-
sideration may also be given for air tra�c control considerations, such as ATC fees or
routes likely to be cleared by air tra�c control. Savings on the order of 1-3% can be
achieved by improving lateral route planning, and there is signi�cant ongoing e�ort to
improve lateral trajectory planning both for the pre-�ight planning phase and while
en-route [3] [4].
2.2 Vertical Planning
In addition to lateral optimization which has been well studied, signi�cant savings can
also be realized through vertical optimization, where less research has been directed.
Vertical planning seeks to minimize costs by determining the altitude and speed
pro�les based on both aircraft performance and wind conditions. As the aircraft gets
lighter from burning fuel, the optimal altitude tends to increase. However, if there is
a di�erences in the wind �eld at various altitudes, the optimal altitude may also shift
towards stronger tailwinds or weaker headwinds when the di�erence in windspeed is
signi�cant enough to o�set the additional fuel burn. As the wind �eld varies with
time and lateral location, the optimal altitude will also tend to have local variations.
When turbulence is expected en-route, airlines may prefer to �y vertical trajectories
with higher costs in order to avoid turbulence.
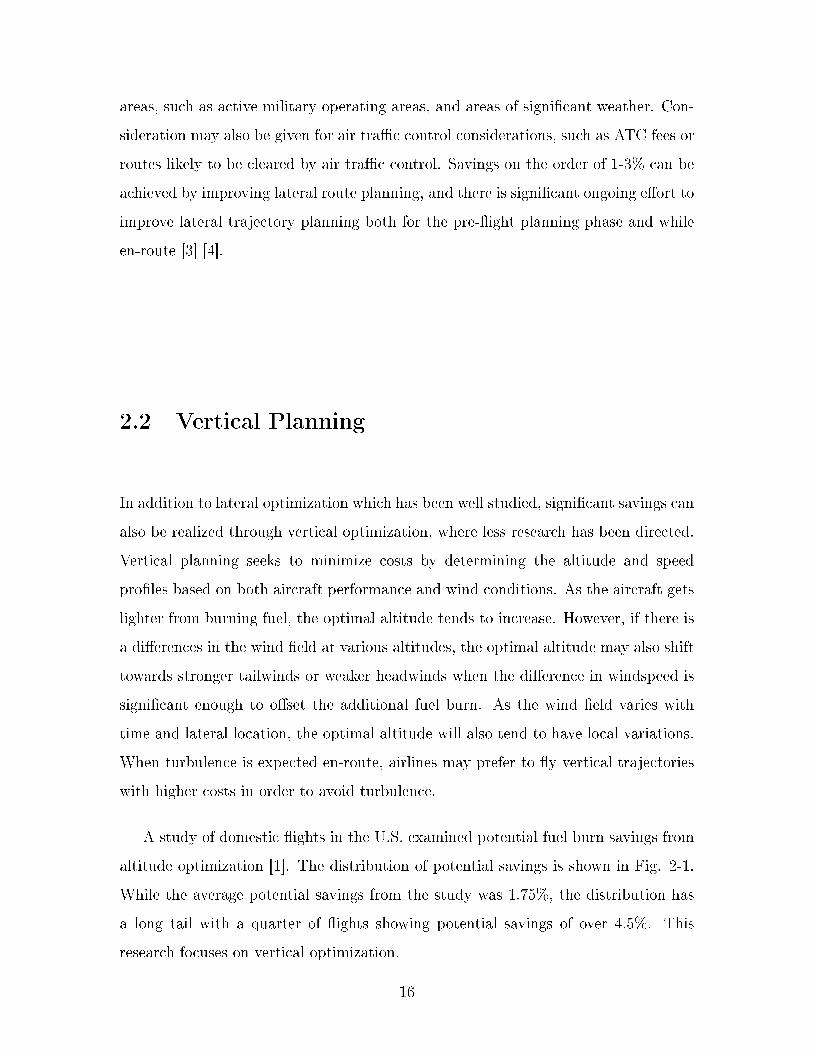
A study of domestic �ights in the U.S. examined potential fuel burn savings from
altitude optimization [1]. The distribution of potential savings is shown in Fig. 2-1.
While the average potential savings from the study was 1.75%, the distribution has
a long tail with a quarter of �ights showing potential savings of over 4.5%. This
research focuses on vertical optimization.
16
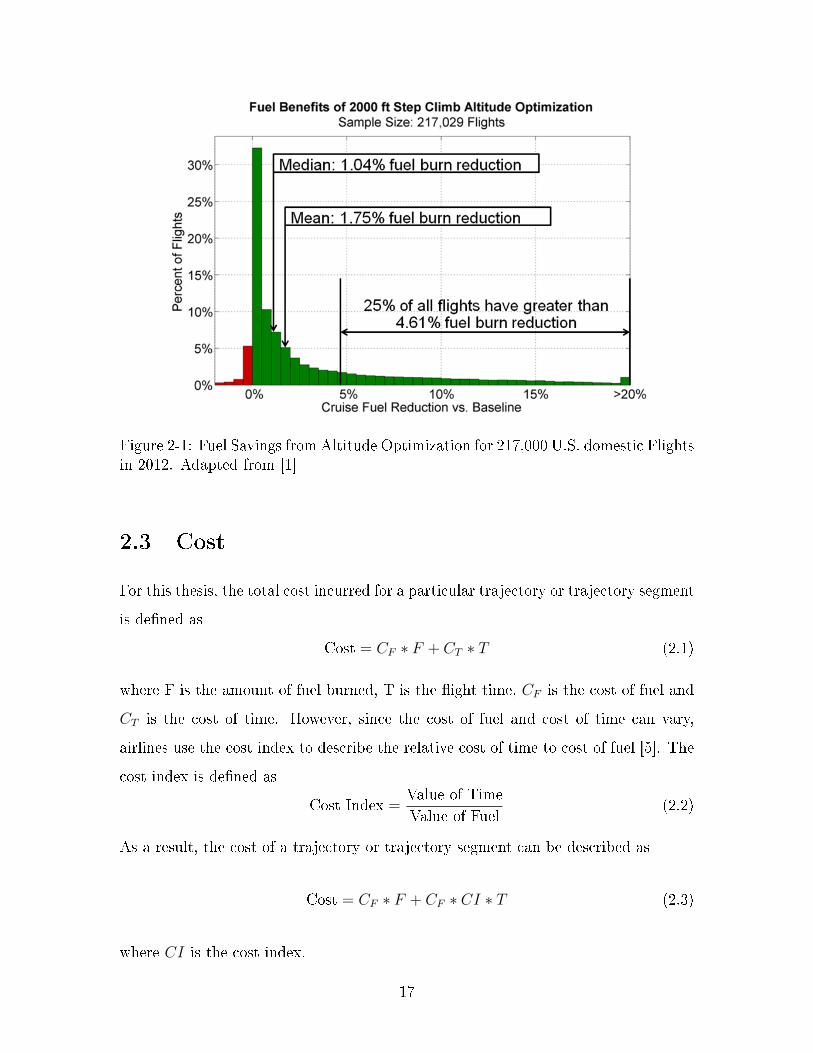
Figure 2-1: Fuel Savings from Altitude Optimization for 217,000 U.S. domestic Flightsin 2012. Adapted from [1]
2.3 Cost
For this thesis, the total cost incurred for a particular trajectory or trajectory segment
is de�ned as
Cost = CF ∗ F + CT ∗ T (2.1)
where F is the amount of fuel burned, T is the �ight time, CF is the cost of fuel and
CT is the cost of time. However, since the cost of fuel and cost of time can vary,
airlines use the cost index to describe the relative cost of time to cost of fuel [5]. The
cost index is de�ned as
Cost Index =Value of Time
Value of Fuel(2.2)
As a result, the cost of a trajectory or trajectory segment can be described as
Cost = CF ∗ F + CF ∗ CI ∗ T (2.3)
where CI is the cost index.
17
2.4 Fuel Burn
The fuel-optimal altitude and speed for an aircraft at any given point along its �ight
depend on the weight of the aircraft, winds aloft, and outside air temperature. E�-
ciency contours of speci�c ground range (SGR) for a typical transport aircraft at a
given weight are shown in Fig. 2-2. SGR is a measure of the ground distance traveled
per mass of fuel burned. The e�ciency contours are spaced more widely near the
optimal point, representing a region where the fuel burn is relatively insensitive to
altitude and speed. However, as an aircraft's speed and altitude move away from
that region, the fuel e�ciency falls o� sharply, re�ected by the narrowing contours.
Current airline �ights typically �y faster than fuel-optimal and at altitudes that may
vary from the optimal altitude.
Figure 2-2: Typical Fuel E�ciency Contours. Adapted from [1].
As aircraft weight decreases due to fuel burn, the optimal altitude increases. As
weight decreases, the amount of lift generated by the aircraft must also decrease to
maintain steady level �ight. In order to maintain the angle of attack that achieves
the maximum lift-to-drag ratio, the aircraft can either slow down or climb to a higher
altitude where the air density is lower. Higher speeds, within the normal operating
speeds of transport aircraft, maximize the distance travelled per unit of fuel, and
18
therefore, the optimal altitude increases as weight decreases [6].
Accounting for winds, the fuel-optimal altitude tends to shift toward altitudes
with stronger tailwinds and away from stronger headwinds. Stronger tailwinds re-
quire less energy to travel a given ground distance, since the aircraft's speed over the
ground increases compared to the true airspeed, which determines fuel burn. Head-
winds require additional fuel for the same distance, since the groundspeed decreases
compared to the true airspeed.
In headwinds, the fuel-optimal speed increases in order to reduce the amount of
time the aircraft spends in the headwind. Similarly, in tailwinds, the fuel-optimal
speed decreases, as the aircraft is then able to extract greater bene�t by staying in
the tailwind for a longer period of time over a given distance.
2.5 Flight Time
Airlines also consider maintenance and crew costs, which increase with �ight time. As
a result airlines may �y faster than fuel-optimal in order to reduce time costs. In the
event of delays, airlines may also be willing to burn additional fuel in order to regain
schedule. Cruise speed is primarily managed through the cost index. Cost index
policy di�ers between airlines, but generally will vary with aircraft type, current fuel
and labor costs, route, and the extent a �ight is early or late.
2.6 Turbulence
Passenger �ights also take ride quality into consideration and may choose to �y tra-
jectories with additional costs in order to avoid turbulence. Turbulence may cause
passenger discomfort, or in severe cases, be a safety concern for passengers and crew
who may be injured by being thrown against the cabin or from unsecured objects.
In 2016, 44 serious injuries were reported [7]. Flights are typically planned to avoid
areas of forecast or reported turbulence, and �ight crews often request changes in al-
titude upon encountering unexpected turbulence. If unable to avoid the turbulence,
19
the �ight crew may slow the aircraft to turbulence penetration speed and ensure that
the cabin crew, passengers, and objects are secured.
Turbulence information is available in the form of forecasts and observations from
pilot reports (PIREPs) or automatic aircraft reports of encountered turbulence. A
common metric used for turbulence is eddy dissipation rate (EDR), an aircraft-
independent quantity that is used to measure turbulence intensity. EDR describes
the rate of dissipation of kinetic energy into heat [8]. EDR can be measured in situ
with sensors onboard aircraft or estimated from numerical weather prediction mod-
els. Dispatchers at an airline operations center have access to forecasts and the subset
of pilot reports that are publicly available, submitted internally within the airline,
or from the airline's weather service provider. Flight crews generally have access
to turbulence forecasts and any additional turbulence information provided by the
dispatchers. They are also able to query ATC for ride reports from �ights in the
vicinity.
2.7 Current Flight Planning Practice
Dispatchers, along with the captain of the �ight, are responsible for pre�ight planning,
dispatching, and monitoring of �ights to ensure safety and e�ciency [9]. Dispatchers
are typically located at a centralized airline operations center and monitor weather
conditions at the destination, alternate airports, and along the route [10]. Dispatchers
use �ight planning tools and past experience to plan lateral routes based on forecasts
for en-route winds and weather, en-route charges such as ATC fees, as well as other
requirements that may vary depending on region and route. Fuel loading is calculated
based on the route, speed, winds aloft, aircraft performance, payload weight, and
reserve requirements. For domestic �ights, FAR part 121 speci�es that �ights must
also include su�cient fuel to �y to an alternate airport and an additional 45 minutes
[11].
The altitude pro�le is generated based on the estimated optimal altitude for the
expected weight along the route. The start of cruise, when air tra�c constraints
20
allow, is planned for the optimal altitude at the expected weight and time at top of
climb. Step climbs along the route are planned as the optimal altitude increases along
the progression of the �ight. Although the optimal altitude varies continuously, step
climbs are used to approximate the continuous optimal pro�le due to the airspace
allowing �ights only at speci�c, discrete �ight levels. The cost index is determined
by economic factors and schedule, with higher cost indices sometimes employed to
recover from delays.
The dispatcher makes additional modi�cations based on his or her experience and
judgment if there are anticipated issues such as with air tra�c control or weather
at the destination. For example, dispatchers may load additional fuel if convective
weather is expected around the destination airport in case of the need to hold over
the destination or modify the lateral trajectory en-route for weather avoidance.
The brie�ng package, including the �ight plan and other relevant �ight information
such as signi�cant weather charts and NOTAM brie�ngs, is sent to the �ight crew
approximately two hours prior to departure.
The captain reviews the brie�ng package, �ight plan, and other relevant infor-
mation before either signing o� on the �ight plan or discussing any issues with the
dispatcher. The captain may, for example, request additional discretionary fuel based
on his or her experience. The dispatcher and captain reach consensus on the �ight
plan, and the �ight is released. The dispatcher �les the �ight plan with air tra�c
control, which may clear the �ight for the proposed route or amend the routing that
is cleared and delivered to the �ight crew. The dispatcher may also revise the �ight
plan if weather conditions change, signi�cant delays are incurred, or the expected
takeo� weight of the aircraft changes signi�cantly.
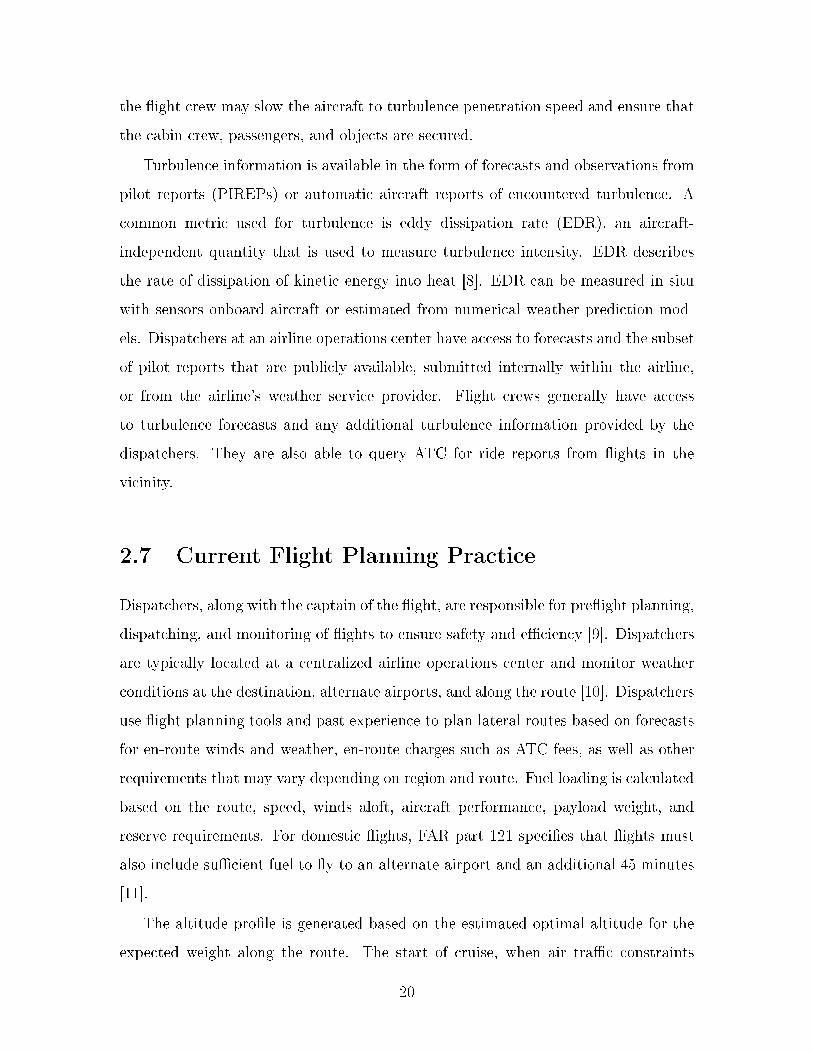
The �ight plan is provided to the �ight crew as a point-to-point list of lateral
waypoints with a corresponding, recommended altitude, as shown in Fig. 2-3. The
leftmost column lists waypoint names. Moving to the right, the next column lists the
planned altitude in 1000s of ft. Also listed are latitude, longitude, planned Mach,
winds, and expected segment fuel burn.
Once en-route, the dispatcher continues to monitor the progress of the �ight and
21
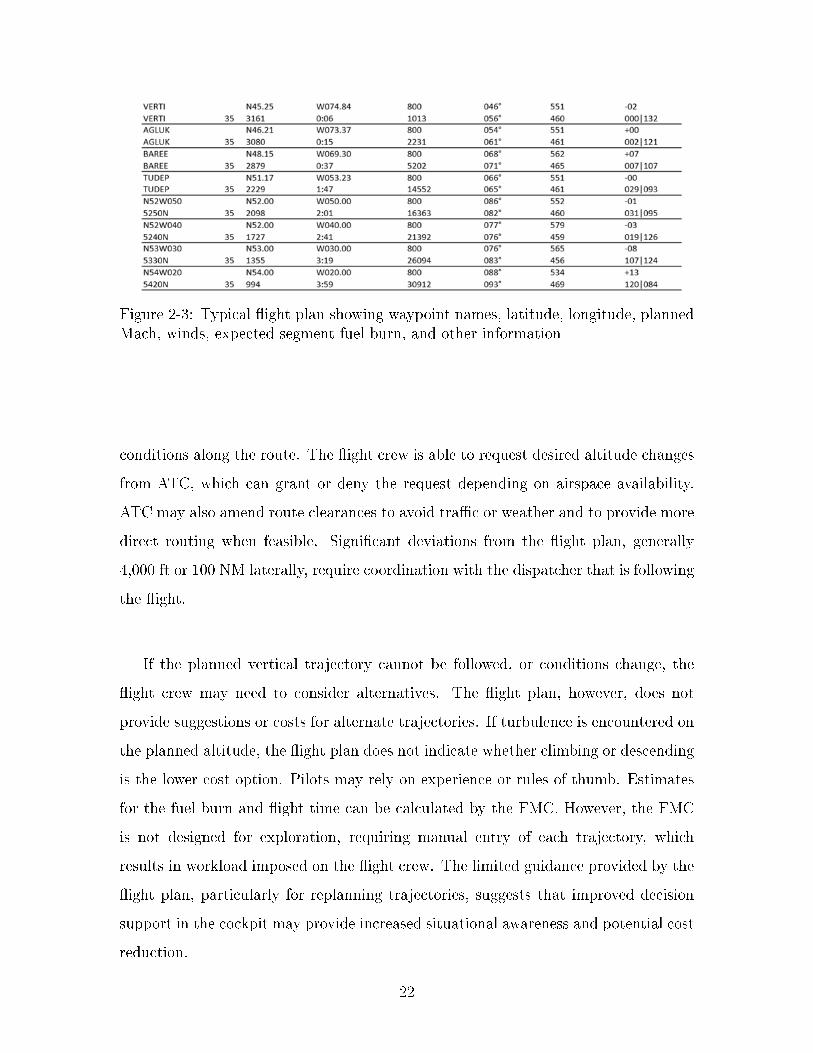
Figure 2-3: Typical �ight plan showing waypoint names, latitude, longitude, plannedMach, winds, expected segment fuel burn, and other information
conditions along the route. The �ight crew is able to request desired altitude changes
from ATC, which can grant or deny the request depending on airspace availability.
ATC may also amend route clearances to avoid tra�c or weather and to provide more
direct routing when feasible. Signi�cant deviations from the �ight plan, generally
4,000 ft or 100 NM laterally, require coordination with the dispatcher that is following
the �ight.
If the planned vertical trajectory cannot be followed, or conditions change, the
�ight crew may need to consider alternatives. The �ight plan, however, does not
provide suggestions or costs for alternate trajectories. If turbulence is encountered on
the planned altitude, the �ight plan does not indicate whether climbing or descending
is the lower cost option. Pilots may rely on experience or rules of thumb. Estimates
for the fuel burn and �ight time can be calculated by the FMC. However, the FMC
is not designed for exploration, requiring manual entry of each trajectory, which
results in workload imposed on the �ight crew. The limited guidance provided by the
�ight plan, particularly for replanning trajectories, suggests that improved decision
support in the cockpit may provide increased situational awareness and potential cost
reduction.
22
2.8 Altitude Tunnel
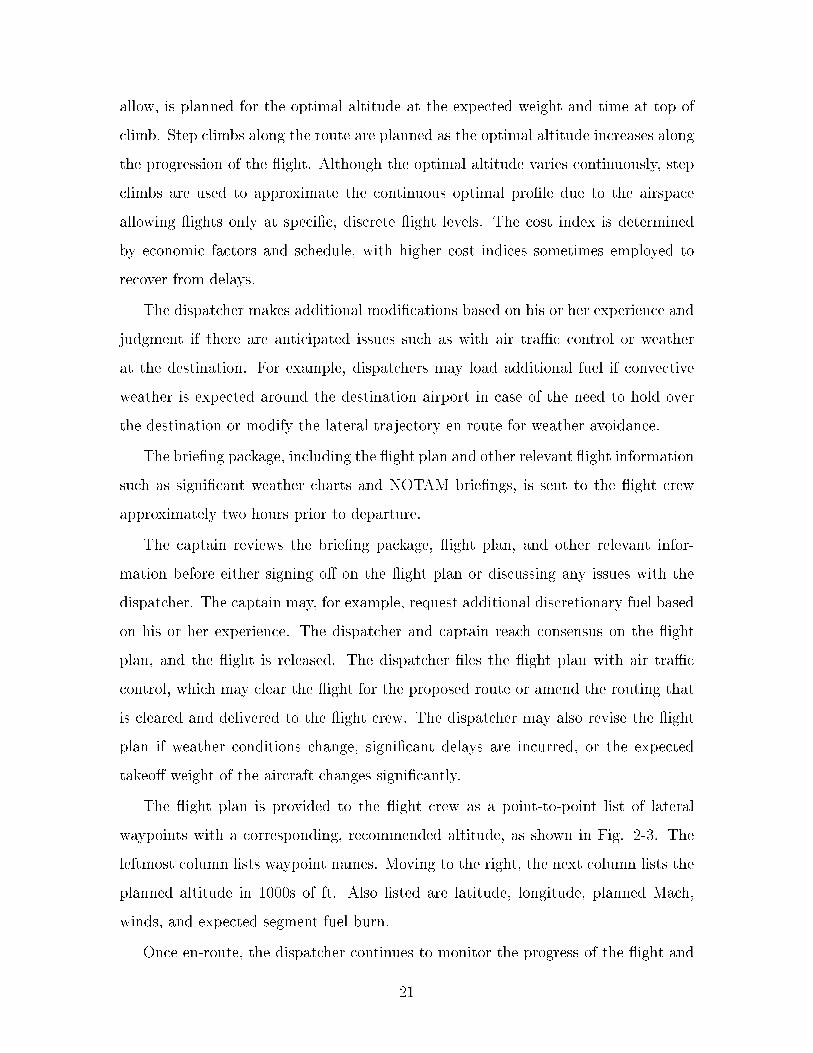
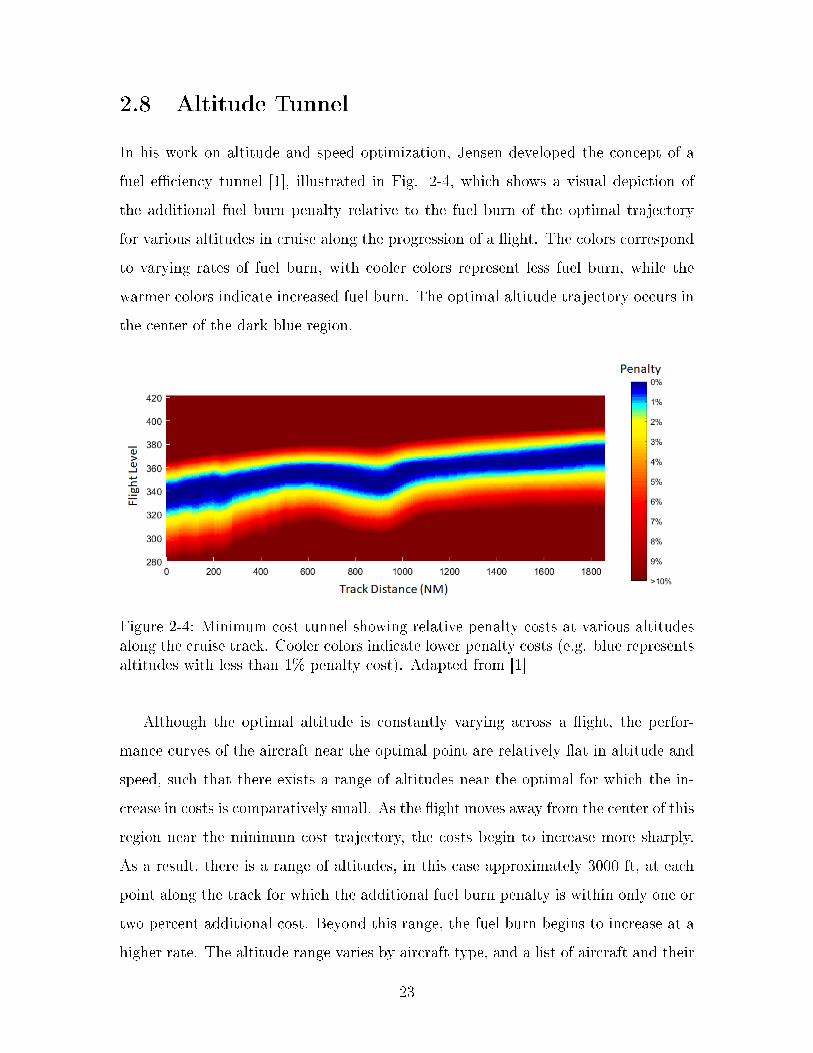
In his work on altitude and speed optimization, Jensen developed the concept of a
fuel e�ciency tunnel [1], illustrated in Fig. 2-4, which shows a visual depiction of
the additional fuel burn penalty relative to the fuel burn of the optimal trajectory
for various altitudes in cruise along the progression of a �ight. The colors correspond
to varying rates of fuel burn, with cooler colors represent less fuel burn, while the
warmer colors indicate increased fuel burn. The optimal altitude trajectory occurs in
the center of the dark blue region.
Figure 2-4: Minimum cost tunnel showing relative penalty costs at various altitudesalong the cruise track. Cooler colors indicate lower penalty costs (e.g. blue representsaltitudes with less than 1% penalty cost). Adapted from [1]
Although the optimal altitude is constantly varying across a �ight, the perfor-
mance curves of the aircraft near the optimal point are relatively �at in altitude and
speed, such that there exists a range of altitudes near the optimal for which the in-
crease in costs is comparatively small. As the �ight moves away from the center of this
region near the minimum cost trajectory, the costs begin to increase more sharply.
As a result, there is a range of altitudes, in this case approximately 3000 ft, at each
point along the track for which the additional fuel burn penalty is within only one or
two percent additional cost. Beyond this range, the fuel burn begins to increase at a
higher rate. The altitude range varies by aircraft type, and a list of aircraft and their
23
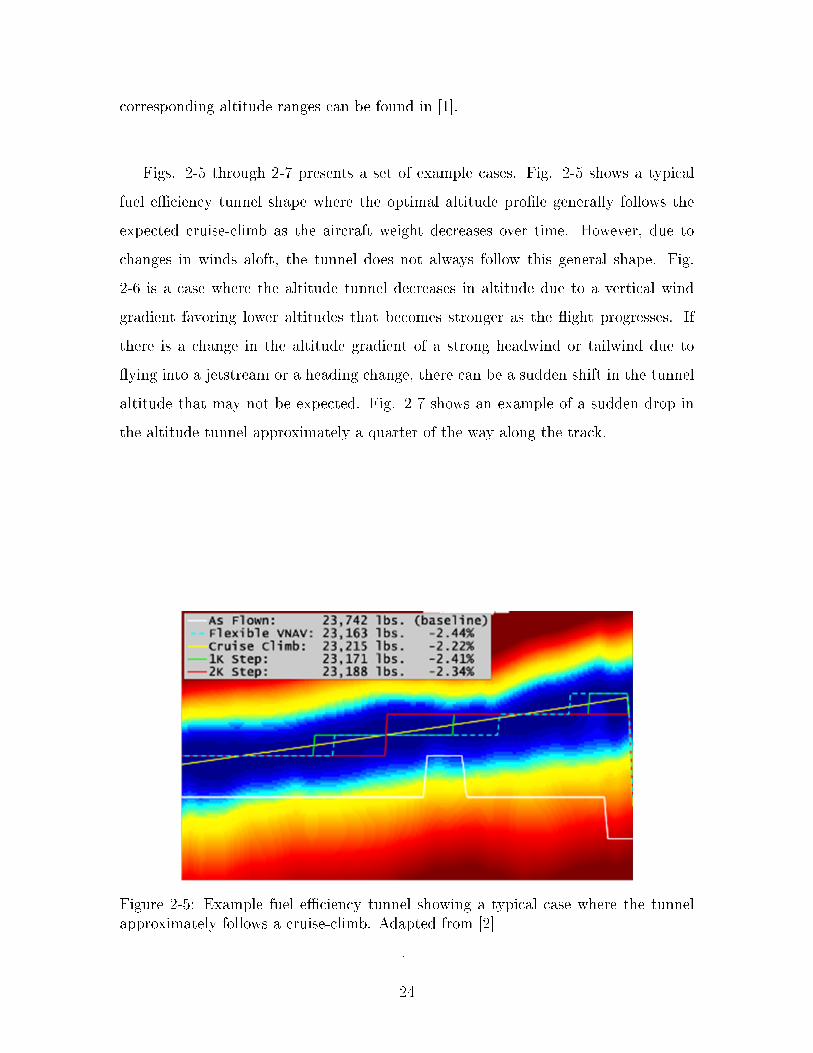
corresponding altitude ranges can be found in [1].
Figs. 2-5 through 2-7 presents a set of example cases. Fig. 2-5 shows a typical
fuel e�ciency tunnel shape where the optimal altitude pro�le generally follows the
expected cruise-climb as the aircraft weight decreases over time. However, due to
changes in winds aloft, the tunnel does not always follow this general shape. Fig.
2-6 is a case where the altitude tunnel decreases in altitude due to a vertical wind
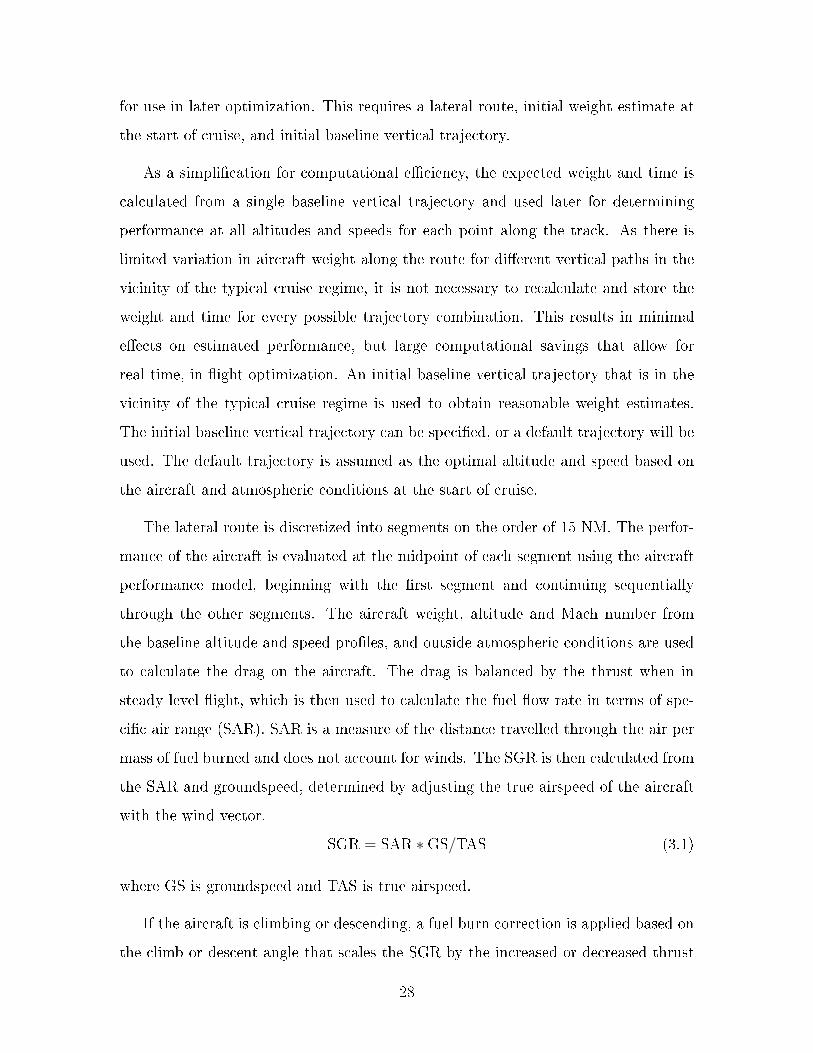
gradient favoring lower altitudes that becomes stronger as the �ight progresses. If
there is a change in the altitude gradient of a strong headwind or tailwind due to
�ying into a jetstream or a heading change, there can be a sudden shift in the tunnel
altitude that may not be expected. Fig. 2-7 shows an example of a sudden drop in
the altitude tunnel approximately a quarter of the way along the track.
Figure 2-5: Example fuel e�ciency tunnel showing a typical case where the tunnelapproximately follows a cruise-climb. Adapted from [2]
.
24
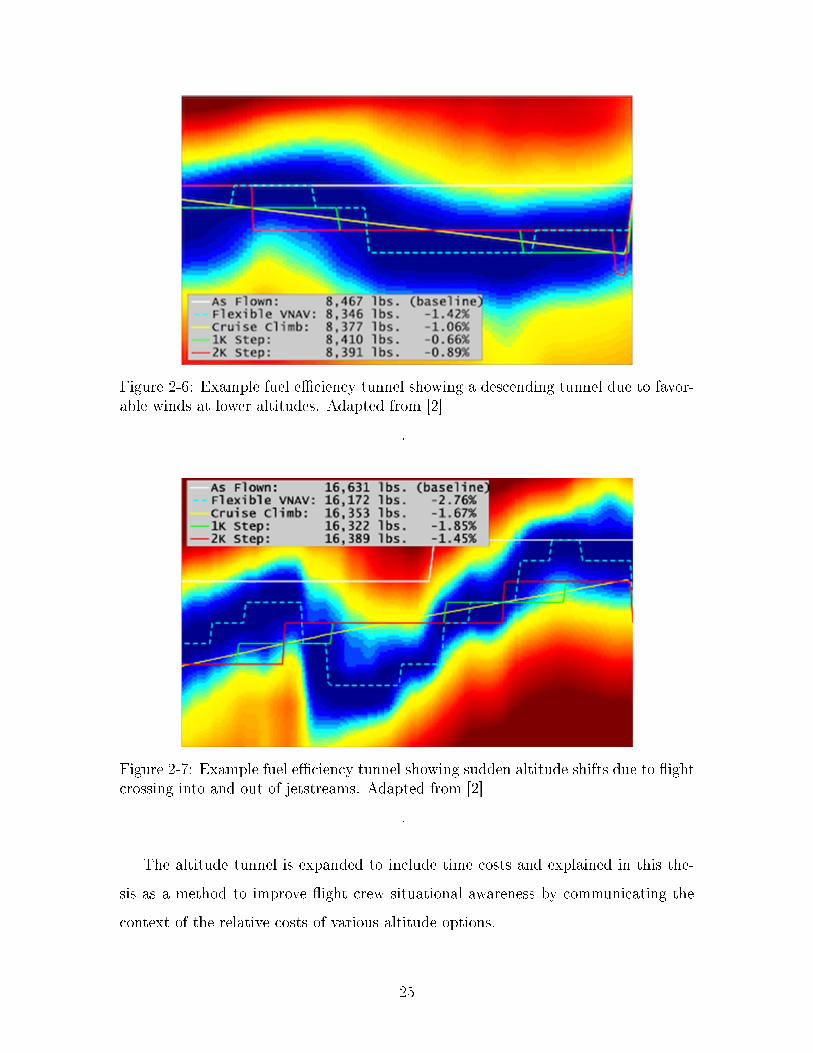
Figure 2-6: Example fuel e�ciency tunnel showing a descending tunnel due to favor-able winds at lower altitudes. Adapted from [2]
.
Figure 2-7: Example fuel e�ciency tunnel showing sudden altitude shifts due to �ightcrossing into and out of jetstreams. Adapted from [2]
.
The altitude tunnel is expanded to include time costs and explained in this the-
sis as a method to improve �ight crew situational awareness by communicating the
context of the relative costs of various altitude options.
25

26
Chapter 3
Cost Minimization Approach
3.1 Optimization and Cost Calculation Process
The optimal vertical trajectory and o�-optimal penalties for a �ight are calculated for
a given lateral trajectory using a discretized approach with an aircraft performance
model, gridded weather forecasts, and an initial baseline altitude and speed pro�le
based on the approach in [1]. The initial pro�les are either speci�ed or a default pro�le
is assumed as the optimal altitude and speed based on the aircraft and atmospheric
conditions at the start of cruise. The cost index is either speci�ed, or a default is
assumed of zero.
To determine the optimal vertical trajectory and o�-optimal penalties, the lateral
trajectory is discretized into segments, and the expected weight of the aircraft along
the lateral route is �rst calculated. A cost matrix is generated for a set of possible
altitudes and speeds at each segment along the lateral route, and the optimal trajec-
tory is selected. Finally, the performance of the selected trajectory is calculated for
fuel burn and time estimates.
3.1.1 Step 1: Initial Performance Estimate
The performance of the �ight along the baseline trajectory is �rst calculated in order
to estimate the expected weight of the aircraft and time along the entire trajectory
27
for use in later optimization. This requires a lateral route, initial weight estimate at
the start of cruise, and initial baseline vertical trajectory.
As a simpli�cation for computational e�ciency, the expected weight and time is
calculated from a single baseline vertical trajectory and used later for determining
performance at all altitudes and speeds for each point along the track. As there is
limited variation in aircraft weight along the route for di�erent vertical paths in the
vicinity of the typical cruise regime, it is not necessary to recalculate and store the
weight and time for every possible trajectory combination. This results in minimal
e�ects on estimated performance, but large computational savings that allow for
real-time, in-�ight optimization. An initial baseline vertical trajectory that is in the
vicinity of the typical cruise regime is used to obtain reasonable weight estimates.
The initial baseline vertical trajectory can be speci�ed, or a default trajectory will be
used. The default trajectory is assumed as the optimal altitude and speed based on
the aircraft and atmospheric conditions at the start of cruise.
The lateral route is discretized into segments on the order of 15 NM. The perfor-
mance of the aircraft is evaluated at the midpoint of each segment using the aircraft
performance model, beginning with the �rst segment and continuing sequentially
through the other segments. The aircraft weight, altitude and Mach number from
the baseline altitude and speed pro�les, and outside atmospheric conditions are used
to calculate the drag on the aircraft. The drag is balanced by the thrust when in
steady level �ight, which is then used to calculate the fuel �ow rate in terms of spe-
ci�c air range (SAR). SAR is a measure of the distance travelled through the air per
mass of fuel burned and does not account for winds. The SGR is then calculated from
the SAR and groundspeed, determined by adjusting the true airspeed of the aircraft
with the wind vector.
SGR = SAR ∗GS/TAS (3.1)
where GS is groundspeed and TAS is true airspeed.
If the aircraft is climbing or descending, a fuel burn correction is applied based on
the climb or descent angle that scales the SGR by the increased or decreased thrust
28
required to balance either the positive or negative contribution of weight
SGRClimb/Descent = SGR ∗ Thrust
Thrust+Weight ∗ sin(θ)(3.2)
where θ is the �ight path angle. The �ight path angle was set as a constant angle of
1.25 degrees based on the typical climb performance of a Boeing 777 at altitude.
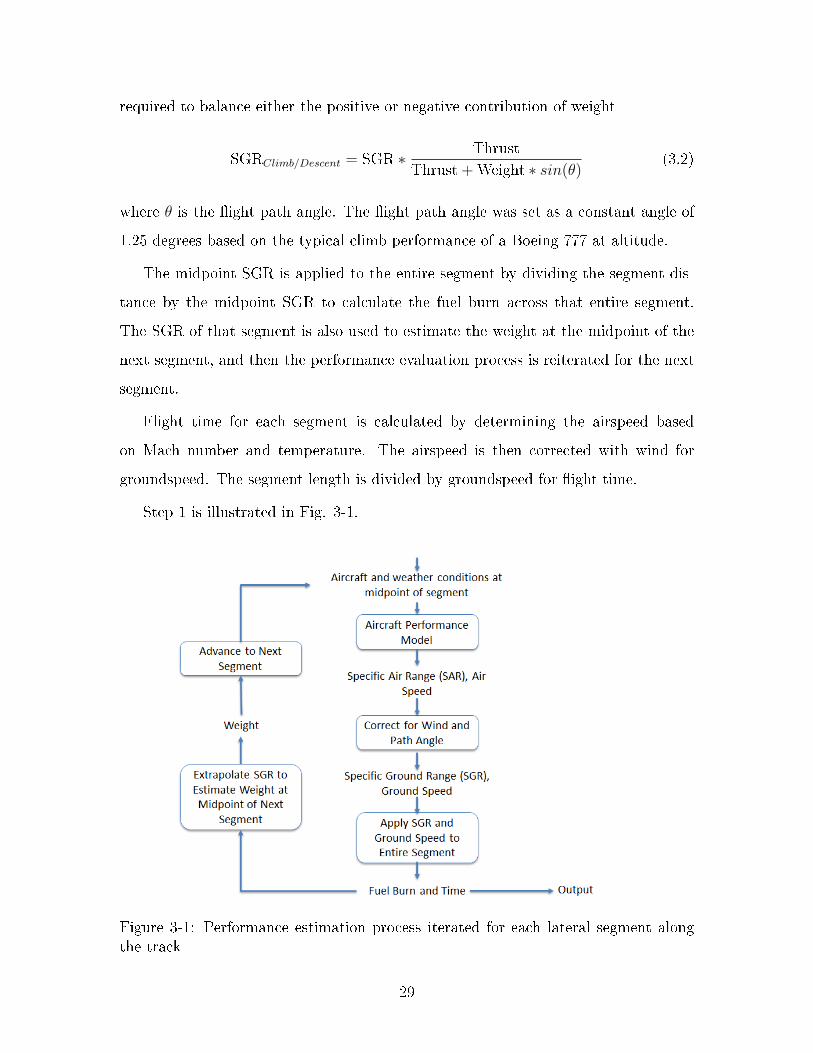
The midpoint SGR is applied to the entire segment by dividing the segment dis-
tance by the midpoint SGR to calculate the fuel burn across that entire segment.
The SGR of that segment is also used to estimate the weight at the midpoint of the
next segment, and then the performance evaluation process is reiterated for the next
segment.
Flight time for each segment is calculated by determining the airspeed based
on Mach number and temperature. The airspeed is then corrected with wind for
groundspeed. The segment length is divided by groundspeed for �ight time.
Step 1 is illustrated in Fig. 3-1.
Figure 3-1: Performance estimation process iterated for each lateral segment alongthe track
29
3.1.2 Step 2: Cost Matrix Generation and Optimization
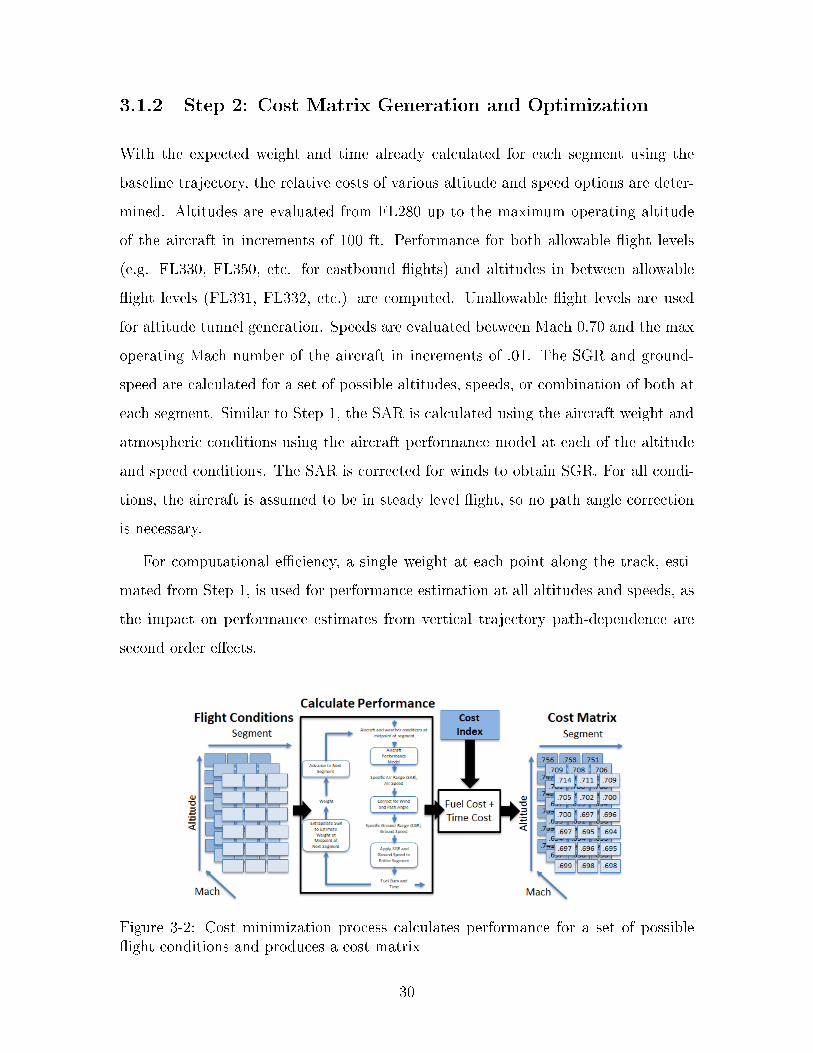
With the expected weight and time already calculated for each segment using the
baseline trajectory, the relative costs of various altitude and speed options are deter-
mined. Altitudes are evaluated from FL280 up to the maximum operating altitude
of the aircraft in increments of 100 ft. Performance for both allowable �ight levels
(e.g. FL330, FL350, etc. for eastbound �ights) and altitudes in between allowable
�ight levels (FL331, FL332, etc.) are computed. Unallowable �ight levels are used
for altitude tunnel generation. Speeds are evaluated between Mach 0.70 and the max
operating Mach number of the aircraft in increments of .01. The SGR and ground-
speed are calculated for a set of possible altitudes, speeds, or combination of both at
each segment. Similar to Step 1, the SAR is calculated using the aircraft weight and
atmospheric conditions using the aircraft performance model at each of the altitude
and speed conditions. The SAR is corrected for winds to obtain SGR. For all condi-
tions, the aircraft is assumed to be in steady level �ight, so no path angle correction
is necessary.
For computational e�ciency, a single weight at each point along the track, esti-
mated from Step 1, is used for performance estimation at all altitudes and speeds, as
the impact on performance estimates from vertical trajectory path-dependence are
second order e�ects.
Figure 3-2: Cost minimization process calculates performance for a set of possible�ight conditions and produces a cost matrix
30
The cost of each altitude and speed option at every segment is calculated by
adding the time cost, weighted by the cost index, to the fuel burn, resulting in a cost
matrix. The minimum cost path through the cost matrix is then determined.
Altitude changes are constrained by the aircraft climb rate. From segment to
segment, the aircraft can stay at the current altitude or change to reachable altitudes.
The time required for acceleration to a di�erent speed is assumed to be short compared
to the segment time, so all speeds are reachable at any segment.
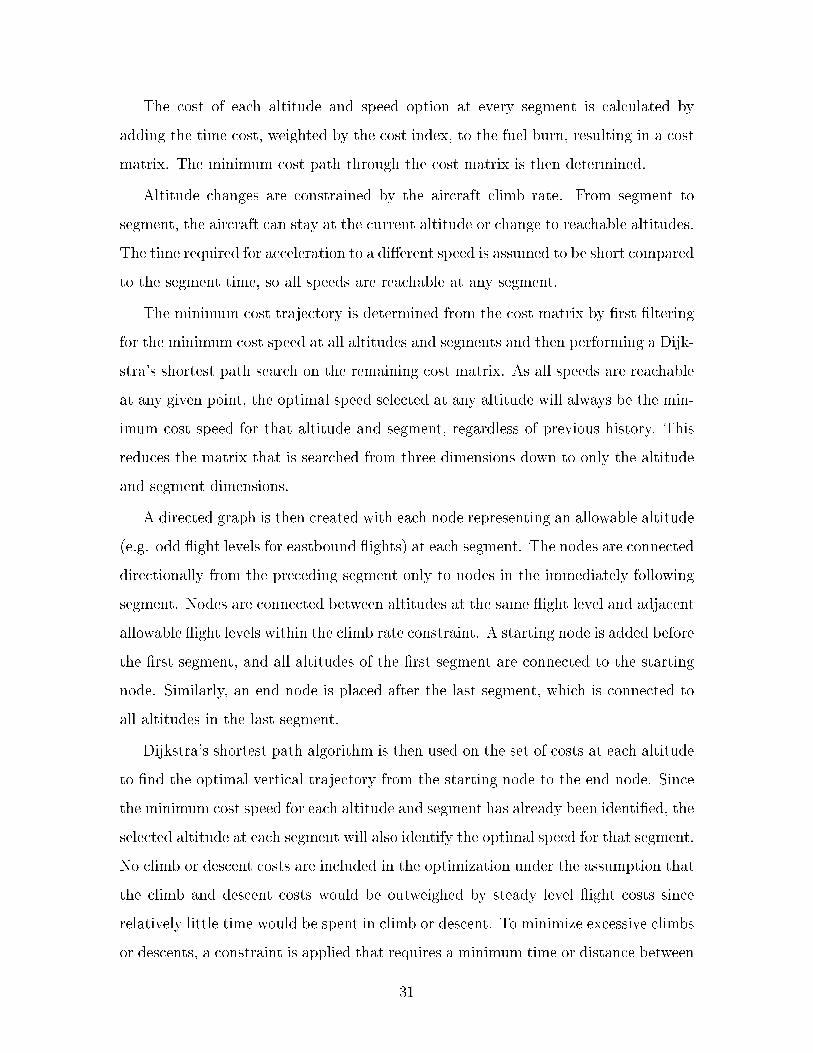
The minimum cost trajectory is determined from the cost matrix by �rst �ltering
for the minimum cost speed at all altitudes and segments and then performing a Dijk-
stra's shortest path search on the remaining cost matrix. As all speeds are reachable
at any given point, the optimal speed selected at any altitude will always be the min-
imum cost speed for that altitude and segment, regardless of previous history. This
reduces the matrix that is searched from three dimensions down to only the altitude
and segment dimensions.
A directed graph is then created with each node representing an allowable altitude
(e.g. odd �ight levels for eastbound �ights) at each segment. The nodes are connected
directionally from the preceding segment only to nodes in the immediately following
segment. Nodes are connected between altitudes at the same �ight level and adjacent
allowable �ight levels within the climb rate constraint. A starting node is added before
the �rst segment, and all altitudes of the �rst segment are connected to the starting
node. Similarly, an end node is placed after the last segment, which is connected to
all altitudes in the last segment.
Dijkstra's shortest path algorithm is then used on the set of costs at each altitude
to �nd the optimal vertical trajectory from the starting node to the end node. Since
the minimum cost speed for each altitude and segment has already been identi�ed, the
selected altitude at each segment will also identify the optimal speed for that segment.
No climb or descent costs are included in the optimization under the assumption that
the climb and descent costs would be outweighed by steady level �ight costs since
relatively little time would be spent in climb or descent. To minimize excessive climbs
or descents, a constraint is applied that requires a minimum time or distance between
31
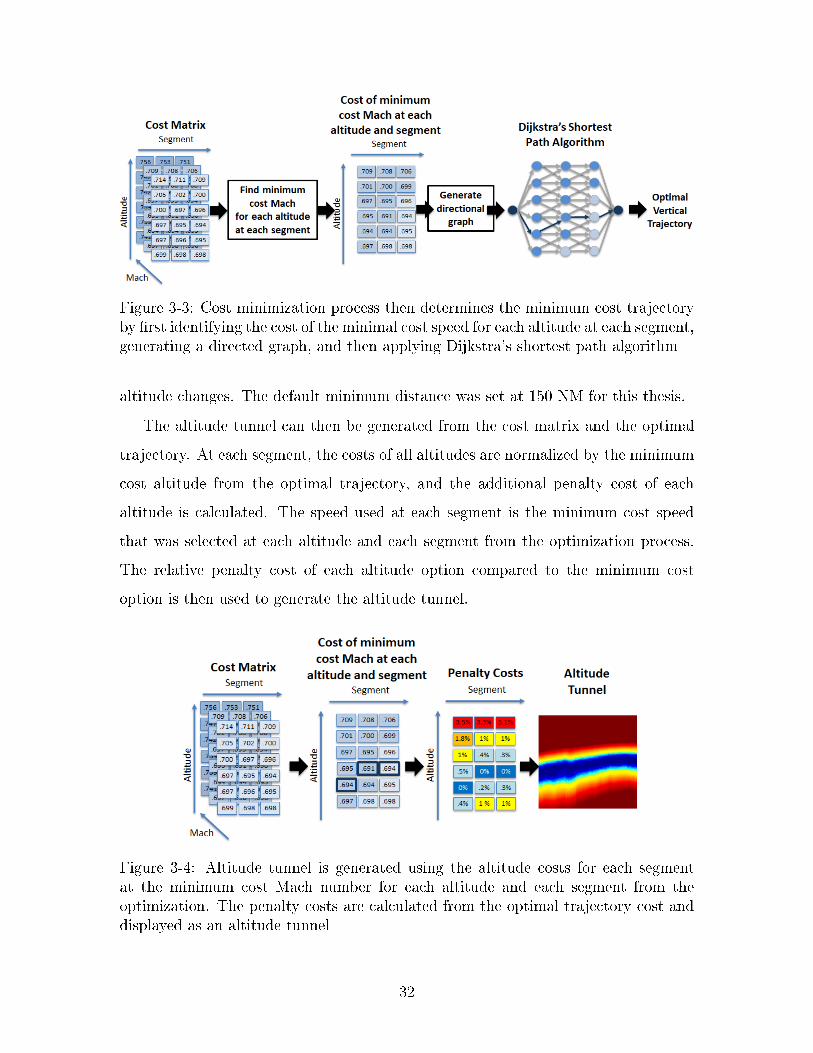
Figure 3-3: Cost minimization process then determines the minimum cost trajectoryby �rst identifying the cost of the minimal cost speed for each altitude at each segment,generating a directed graph, and then applying Dijkstra's shortest path algorithm
altitude changes. The default minimum distance was set at 150 NM for this thesis.
The altitude tunnel can then be generated from the cost matrix and the optimal
trajectory. At each segment, the costs of all altitudes are normalized by the minimum
cost altitude from the optimal trajectory, and the additional penalty cost of each
altitude is calculated. The speed used at each segment is the minimum cost speed
that was selected at each altitude and each segment from the optimization process.
The relative penalty cost of each altitude option compared to the minimum cost
option is then used to generate the altitude tunnel.
Figure 3-4: Altitude tunnel is generated using the altitude costs for each segmentat the minimum cost Mach number for each altitude and each segment from theoptimization. The penalty costs are calculated from the optimal trajectory cost anddisplayed as an altitude tunnel
32
3.1.3 Step 3: Final Performance Estimate
Fuel burn and �ight time estimates are then calculated for the optimal trajectory,
segment by segment. The aircraft weight and time at each segment is updated based
on the optimal altitude pro�le, optimal speed pro�le, and atmospheric conditions.
The aircraft performance model and atmospheric conditions are used to calculate SGR
and �ight time. Although climb and descent costs were not considered during the
optimization process, they are included in the performance calculations by correcting
fuel burn for path angle. For comparison of fuel burn and �ight time with a baseline
vertical trajectory, a climb or descent is added, if necessary, to the last segments at
the end of cruise of the optimized trajectory so that both the baseline and optimized
trajectories have the same altitude di�erence between start of cruise and end of cruise.
This eliminates any geopotential energy di�erences of the aircraft so that fuel burn
comparisons can be made between the two trajectories.
3.2 Aircraft Performance Model
The aircraft performance model used for this research was the Base of Aircraft Data
(BADA) version 4. BADA4 utilizes a kinetic approach that models the aircraft as
a point mass. Lift, drag, and fuel �ow are modelled using polynomial expressions
with aircraft-speci�c coe�cients that account for aircraft and atmospheric condi-
tions. BADA4 requires inputs of aircraft type, weight, speed, altitude, and outside
air temperature [12].
The coe�cients used by BADA4 were identi�ed based on a set of reference perfor-
mance data [13], and the speci�city of the BADA4 models therefore are dependent on
the quantity and range of data used in BADA4 development. BADA4 distinguishes
down to variants of aircraft types (Boeing 777-200 vs. Boeing 777-300), but does
not provide models for di�erent engines (e.g. 777-300 with GE90 vs. 777-300 with
PW4000 engines). It also does not capture variation between individual aircraft of
the same type and variant. Individual aircraft show variations in drag and fuel �ow
for the same �ight conditions that come from slight di�erences between aircraft, such
33
as aerodynamic rigging or engine wear. Other aircraft performance models can also
be used, if available.
3.3 Weather Model
Atmospheric conditions used in performance estimation are based on forecasts from
numerical weather prediction models. Gridded wind and temperature forecasts are
needed that span the duration of the �ight.
For �ights within the continental U.S., the source used for wind and temperature
data is the Rapid Refresh (RAP) product from the National Centers for Environ-
mental Prediction (NCEP). The RAP model provides forecasts on a 13 km by 13 km
grid over the continental U.S. The RAP analysis is run once each hour, outputting
forecasts at intervals of every hour. For �ights occurring outside of the continental
U.S., the Global Forecast System (GFS) is used, which provides 0.25 or 0.5 degree
grids globally with analysis cycles of every six hours and forecast intervals of every
three hours.
These forecasts are limited to a number of gridded points in space and for speci�c
forecast times, usually on the order of 5-30 NM and in intervals of 1-6 hours. As �ner
resolution is needed for �nding the atmospheric conditions at the midpoint of each
segment at the corresponding time, the gridded forecasts are interpolated spatially
and temporally. Spatial interpolation is �rst done separately on both the forecast
immediately preceding each segment time and the forecast immediately following us-
ing Delaunay triangulation and linearly interpolating in space. Then the atmospheric
conditions at that point in space for the forecasts preceding and following the time
of interest are linearly interpolated in time.
34
Chapter 4
Cruise Altitude and Speed
Optimization Decision Support Tool
4.1 Minimum Cost Tunnel
In order to implement the altitude tunnel as part of a decision support tool, the
colors of the altitude tunnel were modi�ed to adhere to �ight deck conventions. For
example, in the original tunnel used for analysis, red indicated altitudes with low
fuel e�ciency. However, on the �ight deck, red is reserved for warnings. The tunnel
visualization was therefore simpli�ed and is represented through penalty contours, as
shown in Fig. 4-1. At altitudes within the thinner set of lines, the �ight will incur
an additional penalty of up to 1% of the minimum fuel burn trajectory. Within the
thicker set of lines, the �ight will incur an additional fuel burn penalty within 2%
of the minimum burn trajectory. As the original tunnel only accounts for fuel burn,
the fuel e�ciency tunnel concept was expanded to a minimum cost tunnel in order
to include time costs. In the case where the cost index is set to zero, the minimum
cost tunnel represents a fuel e�ciency tunnel, as the value of time is set to zero.
35
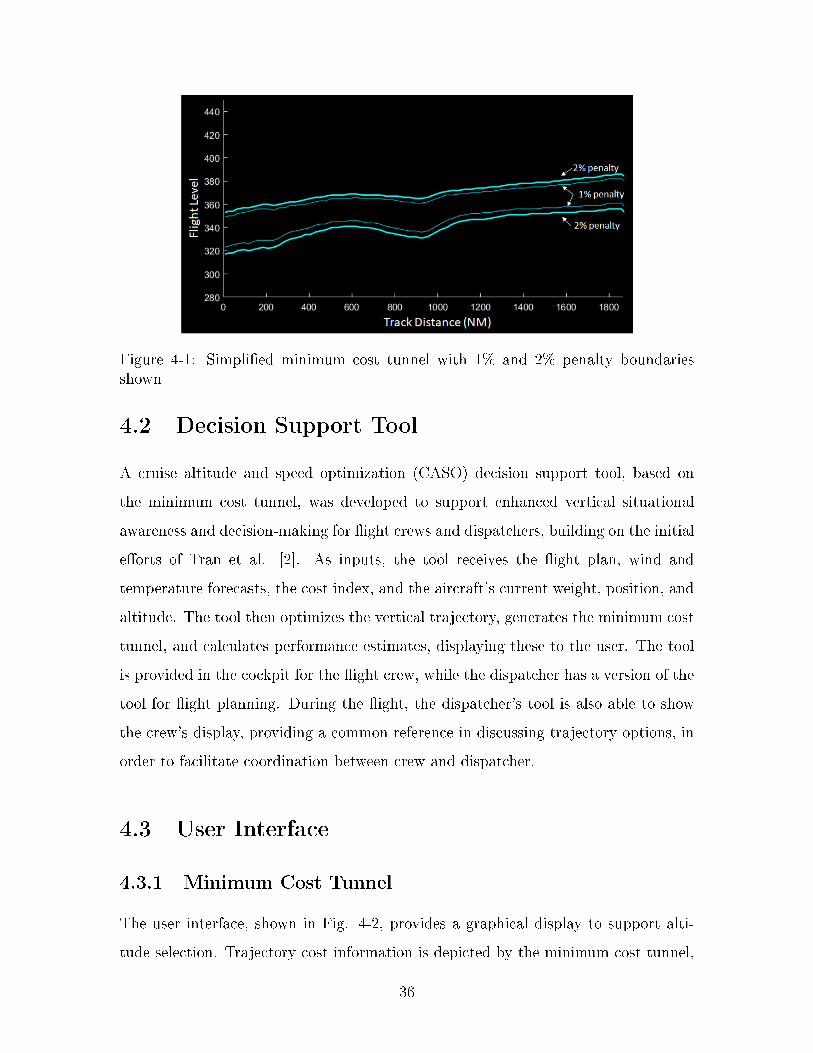
Figure 4-1: Simpli�ed minimum cost tunnel with 1% and 2% penalty boundariesshown
4.2 Decision Support Tool
A cruise altitude and speed optimization (CASO) decision support tool, based on
the minimum cost tunnel, was developed to support enhanced vertical situational
awareness and decision-making for �ight crews and dispatchers, building on the initial
e�orts of Tran et al. [2]. As inputs, the tool receives the �ight plan, wind and
temperature forecasts, the cost index, and the aircraft's current weight, position, and
altitude. The tool then optimizes the vertical trajectory, generates the minimum cost
tunnel, and calculates performance estimates, displaying these to the user. The tool
is provided in the cockpit for the �ight crew, while the dispatcher has a version of the
tool for �ight planning. During the �ight, the dispatcher's tool is also able to show
the crew's display, providing a common reference in discussing trajectory options, in
order to facilitate coordination between crew and dispatcher.
4.3 User Interface
4.3.1 Minimum Cost Tunnel
The user interface, shown in Fig. 4-2, provides a graphical display to support alti-
tude selection. Trajectory cost information is depicted by the minimum cost tunnel,
36
demarcated by the 1% and 2% marginal cost contours. The 1% contours provide a
region within which the �ight crew attempts to stay. A good approximation to the
optimal pro�le can be found by following the center of the tunnel. Having the 2%
contours, in addition to the 1% contour, provides a sense of the cost gradient, showing
a relatively faster increase in marginal costs outside of the 1% region compared to the
center of the tunnel. Flight levels are indicated on the vertical axis. Track distance
along the route is displayed on the horizontal axis below the tunnel, and waypoint
names are displayed above the tunnel at the corresponding location along the �ight's
track distance. Waypoints and track distance provide points of reference for the tun-
nel and trajectory options. The CASO-optimized trajectory and the current planned
trajectory are overlaid on the tunnel, allowing for visual comparison with respect to
the minimum cost tunnel. A performance limit for max altitude is also shown, in
this case placed at the highest altitude where a climb rate of 300 ft/min is achievable.
The performance ceiling overlaid on the tunnel delineates the feasible altitude options
with respect to the tunnel and clearly indicates where the aircraft should not be �own
in order to avoid compromising maneuver margins. Ownship position is depicted by
a white outline of a triangle.
37
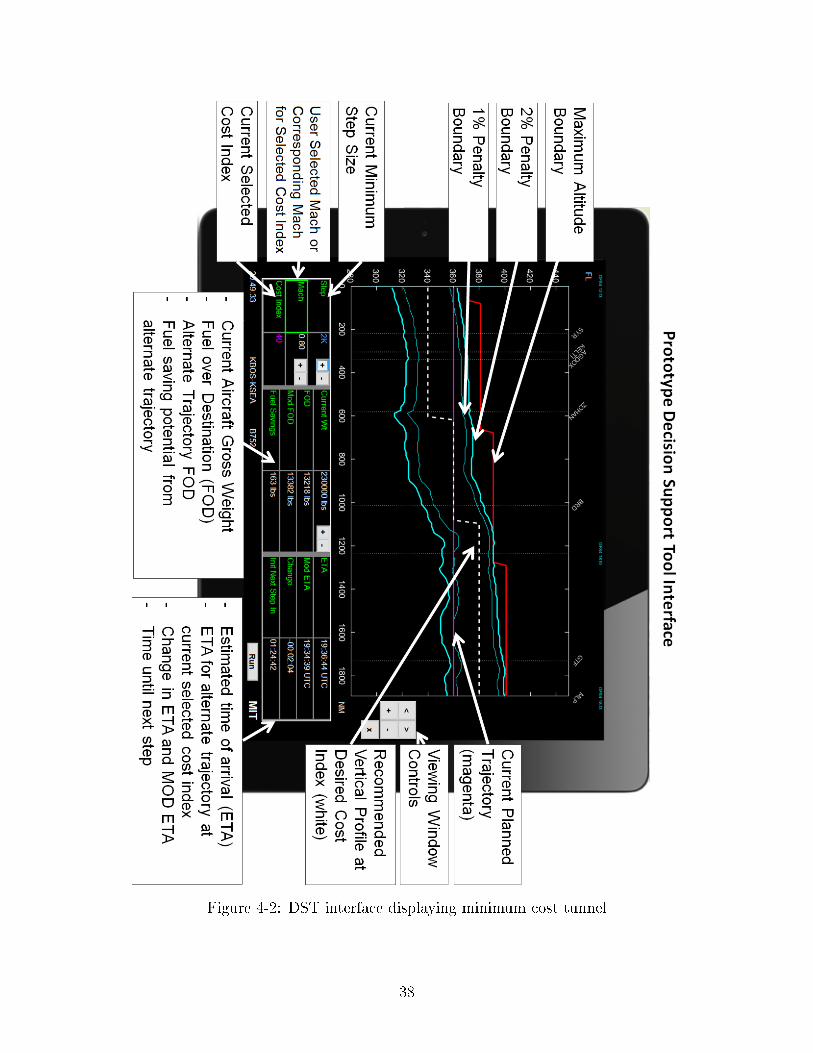
Figure 4-2: DST interface displaying minimum cost tunnel
38
The altitude tunnel was simpli�ed to conform to �ight deck color conventions,
with the cost contours drawn in cyan, which is normally used for communicating
information. Red is reserved for warnings, and as a result, is used to mark the altitude
limit. When depicting lateral routes, magenta is used to depict the FMS programmed
trajectory and is used in this case to denote the planned vertical trajectory.
The tunnel depiction provides a method for simple visual evaluation of the decision
space, compared to the limited winds aloft information currently provided to the
�ight crew, consisting of wind vectors at three or four altitudes at each waypoint. As
wind patterns can result in complex optimal trajectories, dispatchers have indicated a
desire for an e�ective method of communicating the rationale behind complex vertical
trajectories to �ight crews. The tunnel is also intended to provide context for optimal
trajectories and visually indicates altitudes where the combined e�ects of winds and
aircraft performance are more favorable.
The analysis and forecast times for each weather forecast used in the optimization
are displayed above the waypoints. This details which forecasts were used at each
location along the �ight and provides a sense for how current or dated the forecasts
are.
The viewing window can be set to show the entire cruise phase, or zoomed in to
focus on the immediate area. When zoomed in, the viewing window can track the
ownship position, with the tunnel scrolling by as the �ight progresses, re�ecting the
perspective of the aircraft. When zoomed out to show the entire cruise phase, the
ownship marker moves against the stationary tunnel.
4.3.2 User Controls
At the bottom of the interface, the user is able to modify the cost index or select
a speci�c Mach number to govern speed, rather than using the cost index. When
a speci�c Mach number is selected, the cost index is still used for generating the
minimum cost tunnel. This may be useful, for example, when air tra�c control
assigns a Mach number while �ying in the North Atlantic Organized Track System
to maintain procedural separation outside of radar coverage. [14].
39
Similarly, the minimum step constraint for altitude changes can be speci�ed. In
general, aircraft are separated into even and odd �ight levels (e.g. FL320 vs. FL330)
based on the aircraft direction. Flights with magnetic heading between 0 and 179
degrees are assigned odd �ight levels, while aircraft �ying 180 to 359 degrees are
assigned even �ight levels, resulting in intervals of 2,000 ft between possible �ight
levels for an aircraft in most cases. However, there are exceptions, such as one-
directional tracks where �ight levels may be assigned in 1,000 ft increments.
The lateral route can be modi�ed by manually entering the new set of waypoints,
or by downloading an updated �ight plan. As �ights will occasionally be given sig-
ni�cant lateral reroutes, particularly when weather is a factor, the lateral trajectory
can be modi�ed in �ight.
The user is also able to specify a custom vertical trajectory, either by drawing
on a touchscreen or by manual entry of waypoint locations and �ight levels, for the
DST to calculate performance predictions. This allows the user to directly specify
preferences and to quantitatively compare speci�c trajectories that the user has in
mind.
The tool may also support the user speci�cation of areas for the trajectory op-
timizer to avoid, such as areas of known turbulence, or a required time of arrival
by which the recommended trajectory will be constrained during optimization. If a
�ight is delayed and trying to arrive by a speci�c landing time, the user may constrain
the optimizer to arrive by that speci�ed time. Similarly, if a �ight is early, the user
may constrain the optimizer to arrive at the desired time, particularly if there may
be penalties associated with early arrivals. In some cases, noise restrictions at cer-
tain airports preclude landing before a speci�c time, or otherwise enforce a penalty
or quota [15]. Flights may be forced to �y a holding pattern if they arrive early.
By reducing speed or through judicious altitude selection, some fuel savings may be
gained, in addition to arriving at the desired time.
Aircraft parameters and performance estimates are also located at the bottom
panel. The current aircraft weight is displayed. Expected fuel on board at end of
cruise for the current planned trajectory is shown alongside the expected fuel on
40
board at the end of cruise for the optimized or user-modi�ed trajectory, and the fuel
savings of the optimized or user-modi�ed trajectory over the planned trajectory is
highlighted as a separately displayed value to clearly present the potential bene�t.
The estimated time of arrival at the end of cruise is also shown for both the planned
trajectory and the optimal or user-modi�ed trajectory, with the di�erence in cruise
time also displayed separately. Additionally, the time until next altitude change for
the recommended trajectory is displayed to provide the crew with awareness of the
timeframe in which action is suggested.
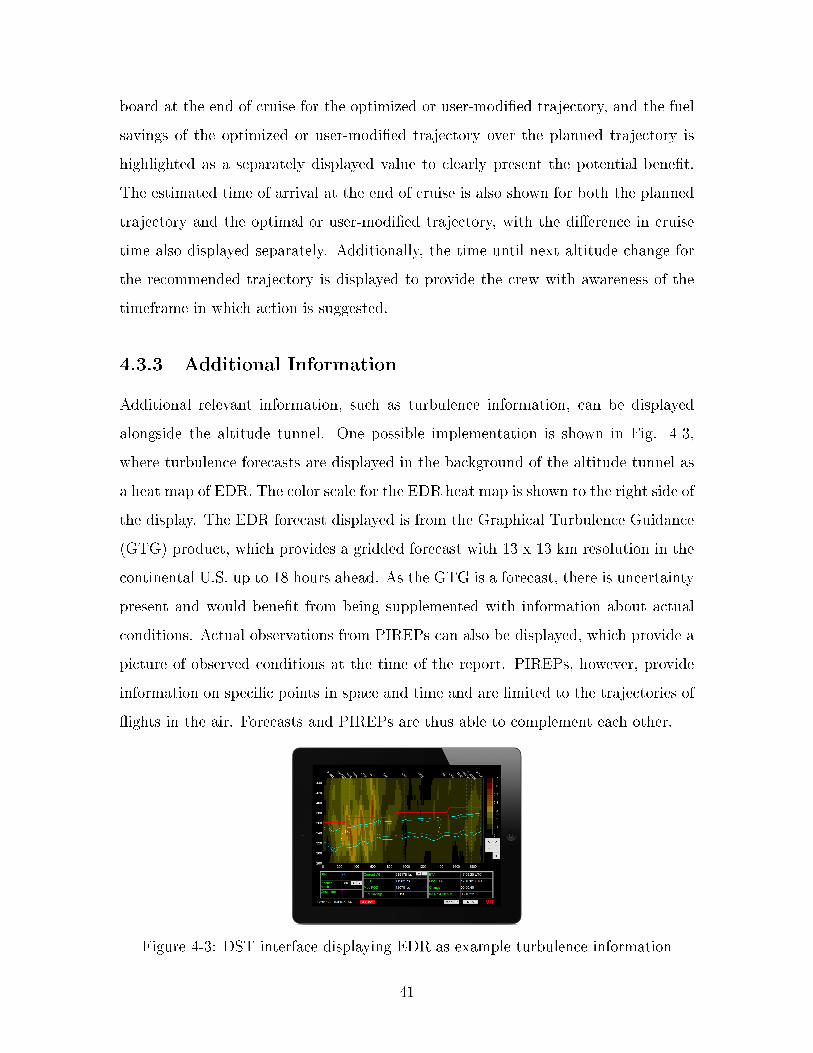
4.3.3 Additional Information
Additional relevant information, such as turbulence information, can be displayed
alongside the altitude tunnel. One possible implementation is shown in Fig. 4-3,
where turbulence forecasts are displayed in the background of the altitude tunnel as
a heat map of EDR. The color scale for the EDR heat map is shown to the right side of
the display. The EDR forecast displayed is from the Graphical Turbulence Guidance
(GTG) product, which provides a gridded forecast with 13 x 13 km resolution in the
continental U.S. up to 18 hours ahead. As the GTG is a forecast, there is uncertainty
present and would bene�t from being supplemented with information about actual
conditions. Actual observations from PIREPs can also be displayed, which provide a
picture of observed conditions at the time of the report. PIREPs, however, provide
information on speci�c points in space and time and are limited to the trajectories of
�ights in the air. Forecasts and PIREPs are thus able to complement each other.
Figure 4-3: DST interface displaying EDR as example turbulence information
41
Placing the turbulence and fuel e�ciency information on the same display facili-
tates simultaneous consideration of both factors while making altitude decisions. In
current operations, turbulence information is provided on a chart or display separate
from e�ciency or cost information, requiring switching attention between di�erent
charts or documents to evaluate both.
The DST is designed to accept other sources and forms of turbulence information,
as well as other types of information.
4.4 DST Information Flow Architecture
The decision support tool is designed to be displayed in the cockpit on electronic
�ight bags (EFBs) or �ight displays for the �ight crew, and on the ground for the
dispatcher. The computational processes can be run on the EFB or computer onboard
the aircraft, or on a computer on the ground with the outputs uplinked to the aircraft.
Fig. 4-4 shows the information �ow for the case where computations are run on
onboard the aircraft. The DST receives aircraft state information (e.g. current lateral
position, altitude, and weight) from the aircraft databus. Wind, temperature, and
turbulence information is obtained through an air-to-ground datalink, such as the
in�ight Wi-Fi linked to onboard passenger entertainment systems. There is a trend
towards increasing equipage, reliability, and bandwidth of in�ight Wi-Fi capabilities
in airlines, with major carriers equipping most if not all of their �eets. Newer systems
have demonstrated download speeds of up to 15 Mbps. Once the most recent forecasts
are available, the forecasts will automatically download and be stored in a database to
ensure the latest available information is being used. By downloading automatically
to an internal database, the DST is also able to recalculate trajectories with those
forecasts even if the �ight's internet connection is lost.
42
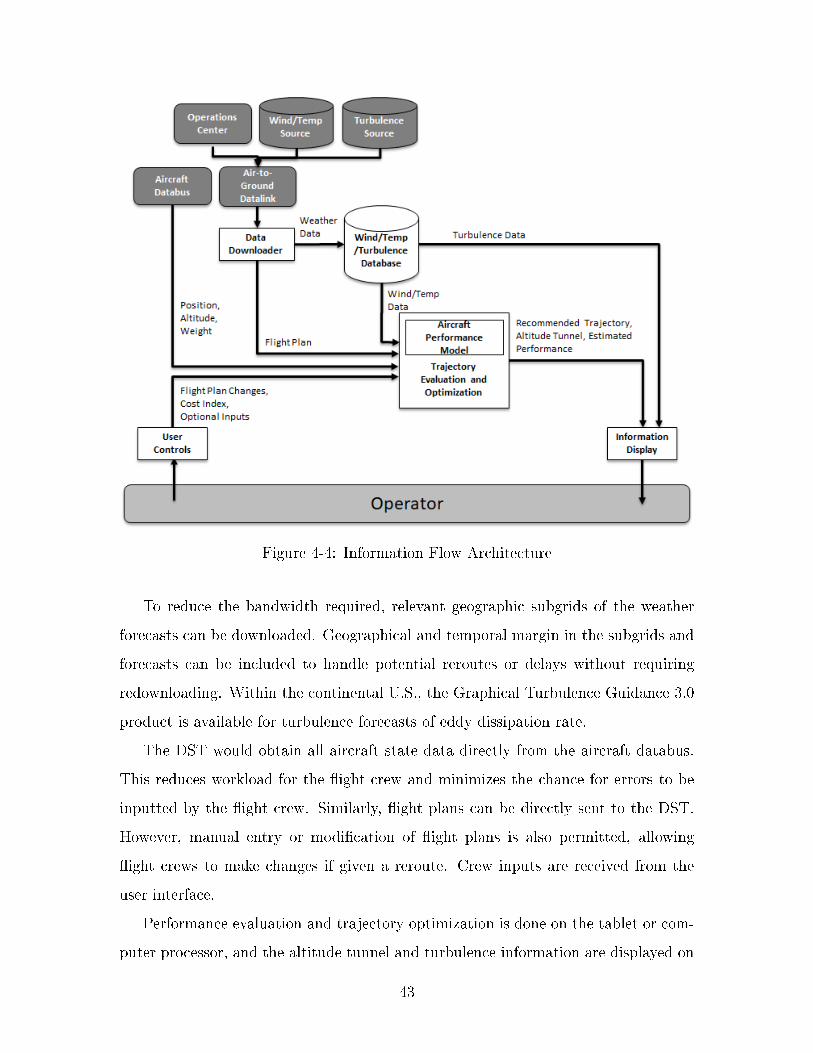
Figure 4-4: Information Flow Architecture
To reduce the bandwidth required, relevant geographic subgrids of the weather
forecasts can be downloaded. Geographical and temporal margin in the subgrids and
forecasts can be included to handle potential reroutes or delays without requiring
redownloading. Within the continental U.S., the Graphical Turbulence Guidance 3.0
product is available for turbulence forecasts of eddy dissipation rate.
The DST would obtain all aircraft state data directly from the aircraft databus.
This reduces workload for the �ight crew and minimizes the chance for errors to be
inputted by the �ight crew. Similarly, �ight plans can be directly sent to the DST.
However, manual entry or modi�cation of �ight plans is also permitted, allowing
�ight crews to make changes if given a reroute. Crew inputs are received from the
user interface.
Performance evaluation and trajectory optimization is done on the tablet or com-
puter processor, and the altitude tunnel and turbulence information are displayed on
43
the user interface. The CASO tool is able to utilize di�erent aircraft performance
models, as well as di�erent weather models.
The DST can also be run while the aircraft is on the ground either on the EFB
for the �ight crew's use prior to departure or at a dispatcher workstation. Weather
data is received through a regular internet connection, and aircraft position, altitude,
and weight are entered manually or pipelined from aircraft reports to the dispatcher
workstation.
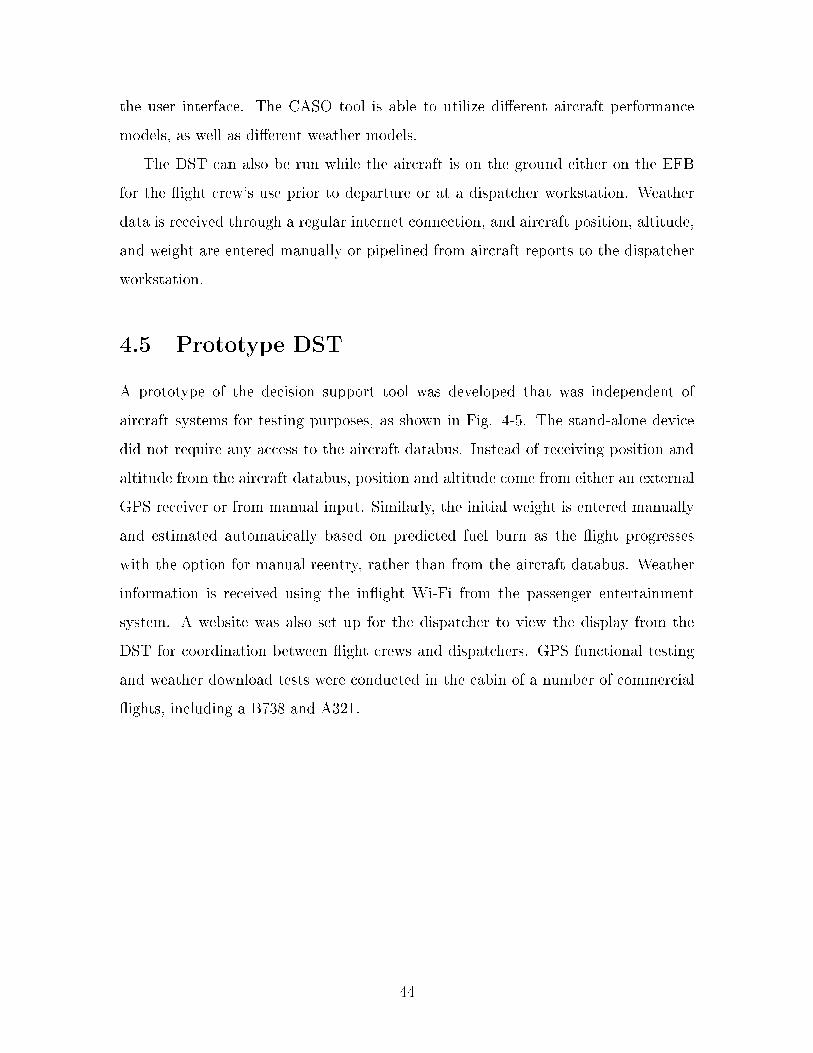
4.5 Prototype DST
A prototype of the decision support tool was developed that was independent of
aircraft systems for testing purposes, as shown in Fig. 4-5. The stand-alone device
did not require any access to the aircraft databus. Instead of receiving position and
altitude from the aircraft databus, position and altitude come from either an external
GPS receiver or from manual input. Similarly, the initial weight is entered manually
and estimated automatically based on predicted fuel burn as the �ight progresses
with the option for manual reentry, rather than from the aircraft databus. Weather
information is received using the in�ight Wi-Fi from the passenger entertainment
system. A website was also set up for the dispatcher to view the display from the
DST for coordination between �ight crews and dispatchers. GPS functional testing
and weather download tests were conducted in the cabin of a number of commercial
�ights, including a B738 and A321.
44
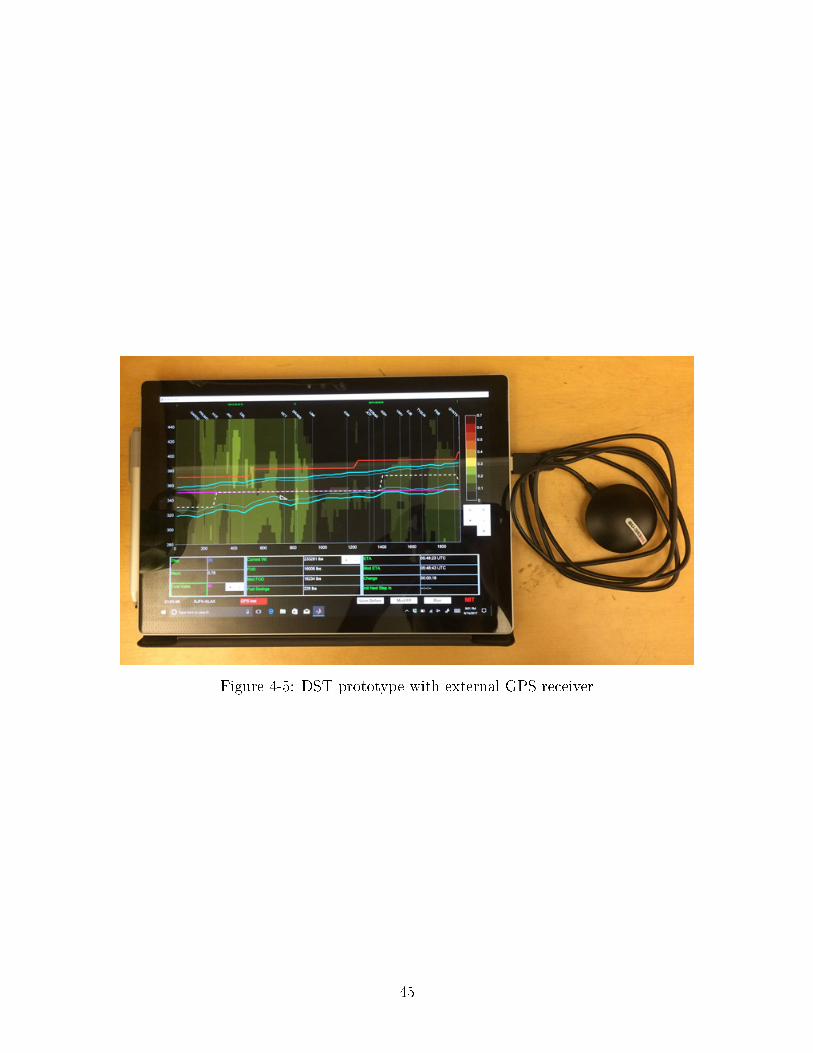
Figure 4-5: DST prototype with external GPS receiver
45

46
Chapter 5
Preliminary Flight Trials Set-Up
Preliminary �ight trials were conducted on a Boeing 777-200 in collaboration with a
major carrier for initial evaluation of the DST. Four initial trial �ights were conducted
in April and May 2018.
CASO guidance from the DST was provided to the crew before departure and
updated en-route whenever the �ight plan was modi�ed, weather forecasts were up-
dated, or a position report was received. The �ight crew consulted the DST output
and attempted to follow the CASO guidance when possible. Fuel burn and �ight
time was recorded onboard the aircraft and then compared with the �ight planned
fuel burn and �ight time. After the �ight, debrief discussions were held with the �ight
crew regarding decisions made and feedback on the DST.
5.1 Decision Support Tool Set-Up
The preliminary �ights occurred while work was ongoing to gain jumpseat access.
As a result, the DST was run on a computer on the ground, and the output was
sent to the �ight crew and dispatcher for the preliminary �ights. The setup for the
preliminary �ight trials is shown in Fig. 5-1. The �ight crew and dispatcher for each
�ight were briefed on the CASO DST prior to the �ight. The �ight plan, including
expected aircraft weight at start of cruise, was received after being created by the
dispatcher and entered into the DST, which optimized the vertical trajectory and
47
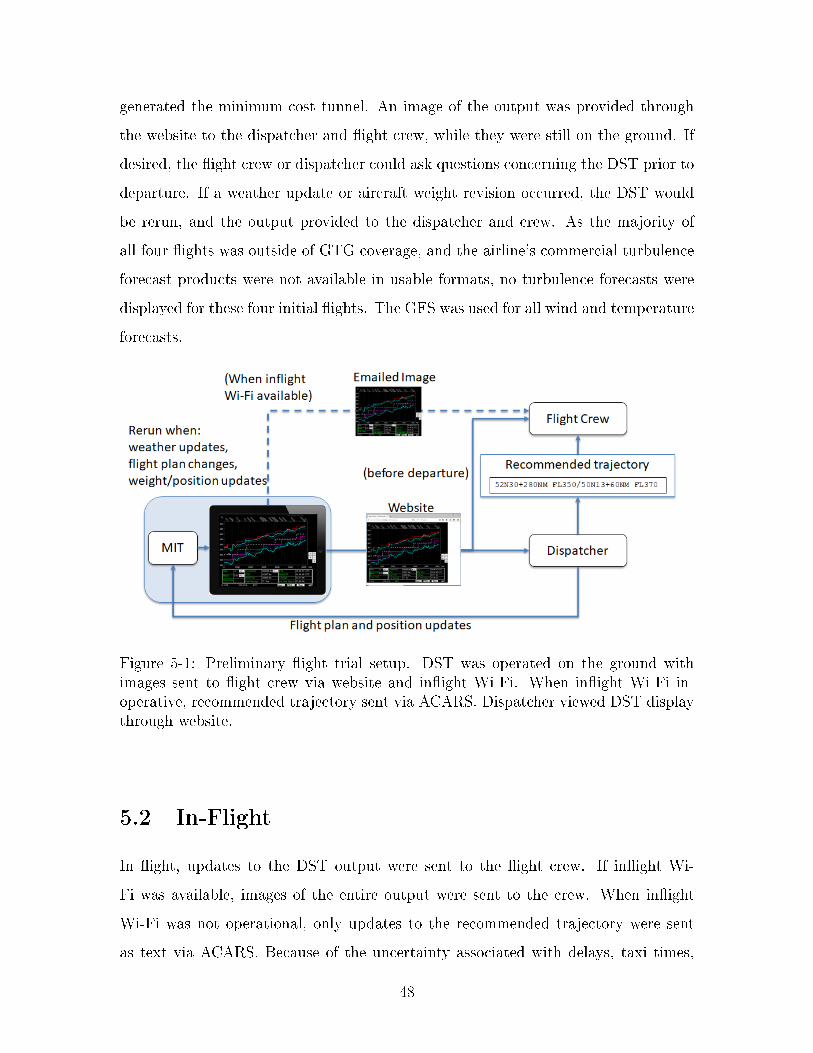
generated the minimum cost tunnel. An image of the output was provided through
the website to the dispatcher and �ight crew, while they were still on the ground. If
desired, the �ight crew or dispatcher could ask questions concerning the DST prior to
departure. If a weather update or aircraft weight revision occurred, the DST would
be rerun, and the output provided to the dispatcher and crew. As the majority of
all four �ights was outside of GTG coverage, and the airline's commercial turbulence
forecast products were not available in usable formats, no turbulence forecasts were
displayed for these four initial �ights. The GFS was used for all wind and temperature
forecasts.
Figure 5-1: Preliminary �ight trial setup. DST was operated on the ground withimages sent to �ight crew via website and in�ight Wi-Fi. When in�ight Wi-Fi in-operative, recommended trajectory sent via ACARS. Dispatcher viewed DST displaythrough website.
5.2 In-Flight
In �ight, updates to the DST output were sent to the �ight crew. If in�ight Wi-
Fi was available, images of the entire output were sent to the crew. When in�ight
Wi-Fi was not operational, only updates to the recommended trajectory were sent
as text via ACARS. Because of the uncertainty associated with delays, taxi times,
48
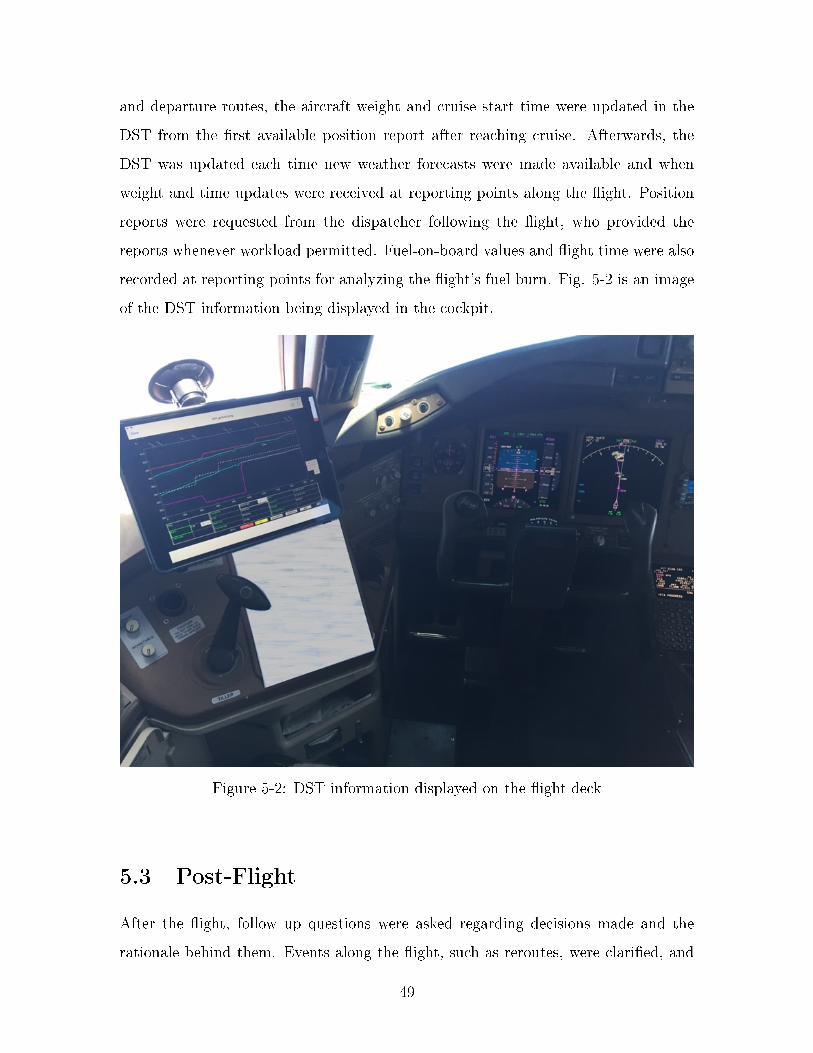
and departure routes, the aircraft weight and cruise start time were updated in the
DST from the �rst available position report after reaching cruise. Afterwards, the
DST was updated each time new weather forecasts were made available and when
weight and time updates were received at reporting points along the �ight. Position
reports were requested from the dispatcher following the �ight, who provided the
reports whenever workload permitted. Fuel-on-board values and �ight time were also
recorded at reporting points for analyzing the �ight's fuel burn. Fig. 5-2 is an image
of the DST information being displayed in the cockpit.
Figure 5-2: DST information displayed on the �ight deck
5.3 Post-Flight
After the �ight, follow up questions were asked regarding decisions made and the
rationale behind them. Events along the �ight, such as reroutes, were clari�ed, and
49
barriers to following the CASO guidance that were encountered were identi�ed. Feed-
back was collected from the crew and dispatcher after the �ights regarding the tool
and its usefulness. The recorded fuel burn and �ight time from the as-�own trajectory
was compared with the �ight planned trajectory's fuel burn and �ight time.
5.4 Flight Trials
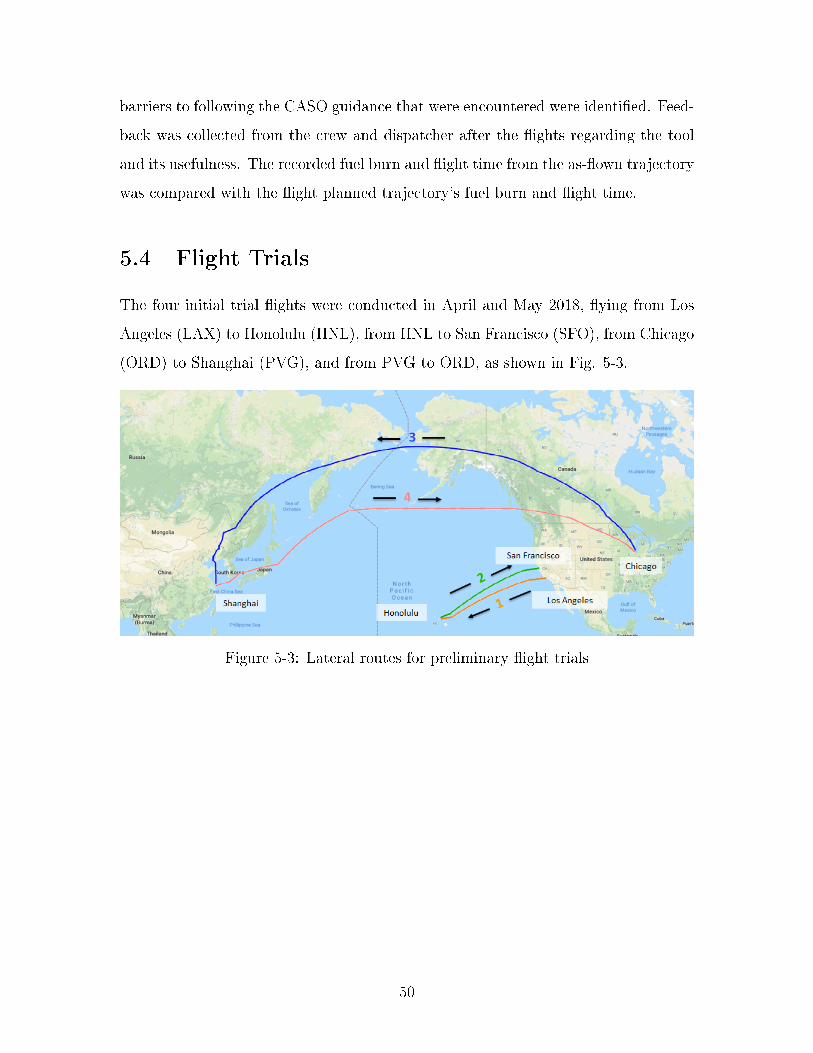
The four initial trial �ights were conducted in April and May 2018, �ying from Los
Angeles (LAX) to Honolulu (HNL), from HNL to San Francisco (SFO), from Chicago
(ORD) to Shanghai (PVG), and from PVG to ORD, as shown in Fig. 5-3.
Figure 5-3: Lateral routes for preliminary �ight trials
50
Chapter 6
Preliminary Flight Trials Results
6.1 Flight 1: LAX-HNL
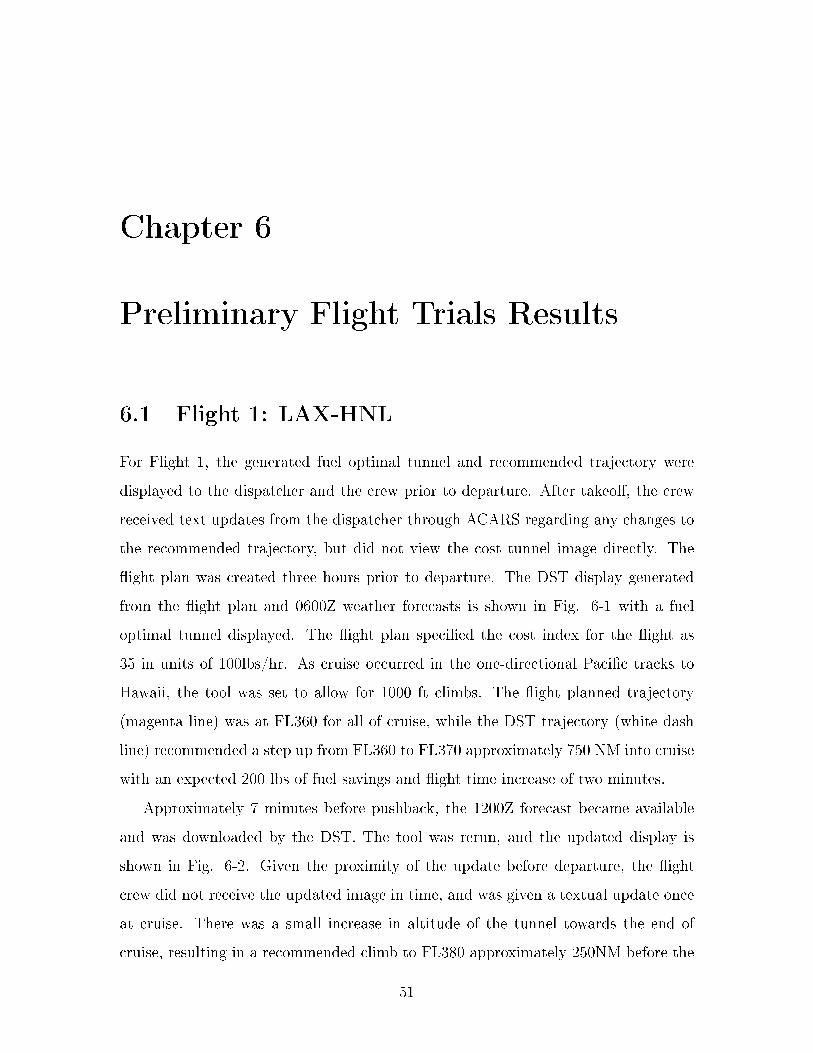
For Flight 1, the generated fuel optimal tunnel and recommended trajectory were
displayed to the dispatcher and the crew prior to departure. After takeo�, the crew
received text updates from the dispatcher through ACARS regarding any changes to
the recommended trajectory, but did not view the cost tunnel image directly. The
�ight plan was created three hours prior to departure. The DST display generated
from the �ight plan and 0600Z weather forecasts is shown in Fig. 6-1 with a fuel
optimal tunnel displayed. The �ight plan speci�ed the cost index for the �ight as
35 in units of 100lbs/hr. As cruise occurred in the one-directional Paci�c tracks to
Hawaii, the tool was set to allow for 1000 ft climbs. The �ight planned trajectory
(magenta line) was at FL360 for all of cruise, while the DST trajectory (white dash
line) recommended a step up from FL360 to FL370 approximately 750 NM into cruise
with an expected 200 lbs of fuel savings and �ight time increase of two minutes.
Approximately 7 minutes before pushback, the 1200Z forecast became available
and was downloaded by the DST. The tool was rerun, and the updated display is
shown in Fig. 6-2. Given the proximity of the update before departure, the �ight
crew did not receive the updated image in time, and was given a textual update once
at cruise. There was a small increase in altitude of the tunnel towards the end of
cruise, resulting in a recommended climb to FL380 approximately 250NM before the
51
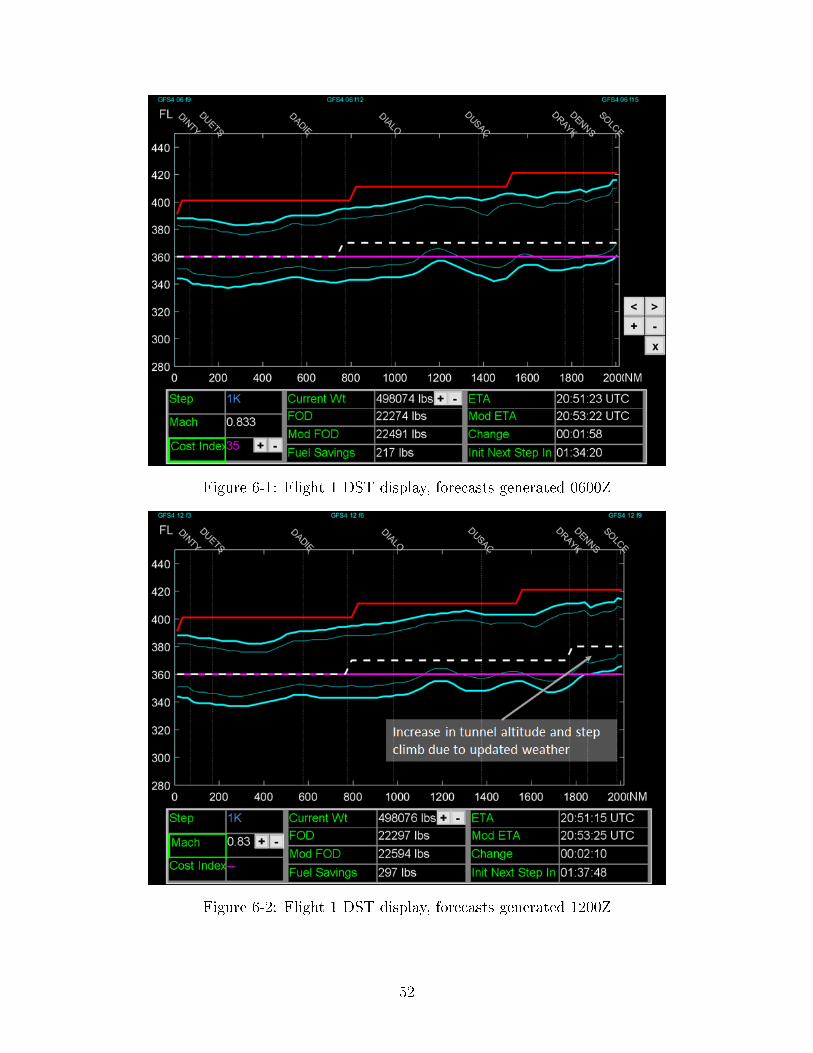
Figure 6-1: Flight 1 DST display, forecasts generated 0600Z
Figure 6-2: Flight 1 DST display, forecasts generated 1200Z
52
end of cruise. The DST was updated with the actual aircraft weight after the �rst 200
NM of cruise. However, there was no signi�cant change in the tunnel or recommended
pro�le.
The �ight crew attempted to follow the DST recommended trajectory. The as-
�own trajectory (green line) is overlaid on the altitude tunnel and shown in Fig. 6-3
with a �ight plan guidance area for light turbulence in blue overlaid as part of the
post-�ight analysis. The �ight plan guidance areas are from the signi�cant weather
chart included with the �ight plan, but were not available on the DST for these
�ights. The �ight followed the DST recommendation and climbed from FL360 to
FL370 near the midpoint between waypoints 700 NM into cruise. At approximately
1500 NM, the �ight encountered moderate turbulence at FL370. The turbulence
was forecasted to be light on the signi�cant weather chart included with the �ight
plan, however guidance from other turbulence products did not indicate forecasts
of moderate turbulence. After hearing from an aircraft below that reported FL300
as being a signi�cantly smoother ride than FL320, the crew requested and received
clearance to descend to FL310, remaining at that altitude until approximately 50 NM
prior to the top of descent, where signi�cant turbulence reoccurred, causing an early
descent.
In this case, the trajectory recommended by the DST did not expect signi�cant
bene�t, with less than 0.5% di�erence in cost compared to the �ight planned tra-
jectory. Although the weather update did not result in signi�cant changes in the
cost tunnel or recommended trajectory in this case, the timing of the forecast up-
date would have prevented the inclusion of the updated data in conventional �ight
planning procedures if there had been signi�cant changes to the tunnel and recom-
mended trajectory. For this �ight, all altitude change requests made to ATC were
granted, and turbulence was the only factor preventing the �ight from following the
recommended trajectory. It is notable that the turbulence forecasts available to the
crews did not display the moderate turbulence that was encountered and was not
anticipated during �ight planning.
53
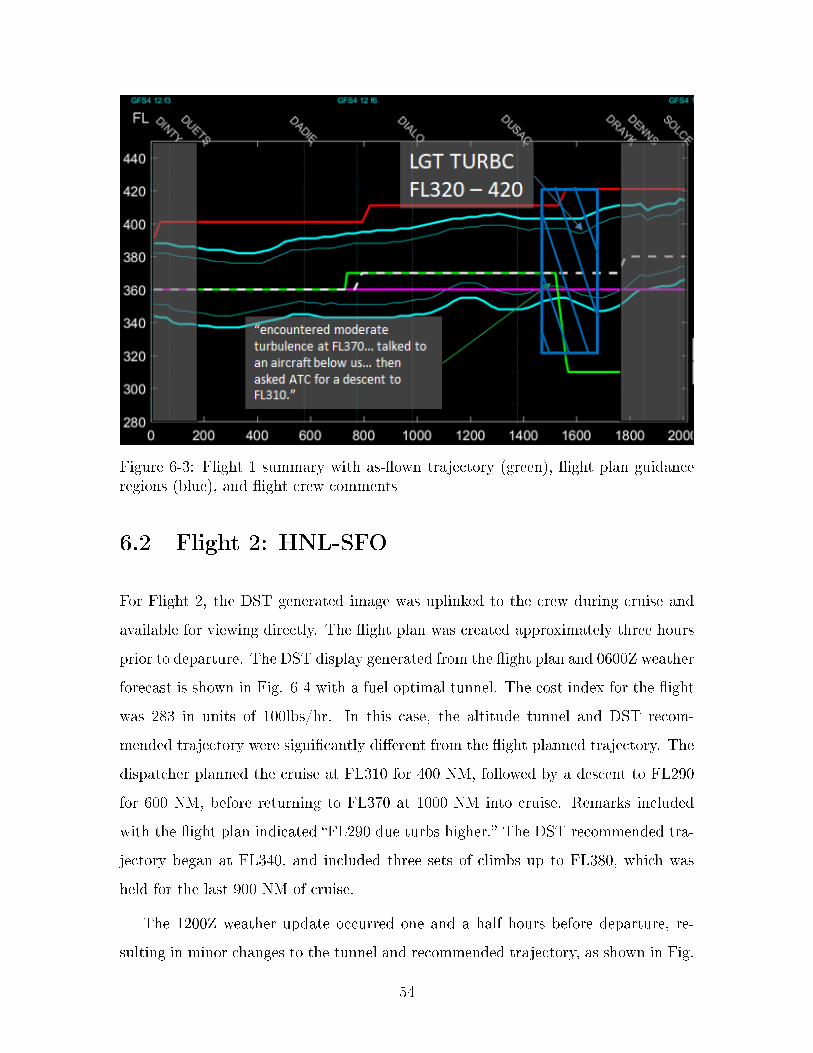
Figure 6-3: Flight 1 summary with as-�own trajectory (green), �ight plan guidanceregions (blue), and �ight crew comments
6.2 Flight 2: HNL-SFO
For Flight 2, the DST generated image was uplinked to the crew during cruise and
available for viewing directly. The �ight plan was created approximately three hours
prior to departure. The DST display generated from the �ight plan and 0600Z weather
forecast is shown in Fig. 6-4 with a fuel-optimal tunnel. The cost index for the �ight
was 283 in units of 100lbs/hr. In this case, the altitude tunnel and DST recom-
mended trajectory were signi�cantly di�erent from the �ight planned trajectory. The
dispatcher planned the cruise at FL310 for 400 NM, followed by a descent to FL290
for 600 NM, before returning to FL370 at 1000 NM into cruise. Remarks included
with the �ight plan indicated �FL290 due turbs higher.� The DST recommended tra-
jectory began at FL340, and included three sets of climbs up to FL380, which was
held for the last 900 NM of cruise.
The 1200Z weather update occurred one and a half hours before departure, re-
sulting in minor changes to the tunnel and recommended trajectory, as shown in Fig.
54
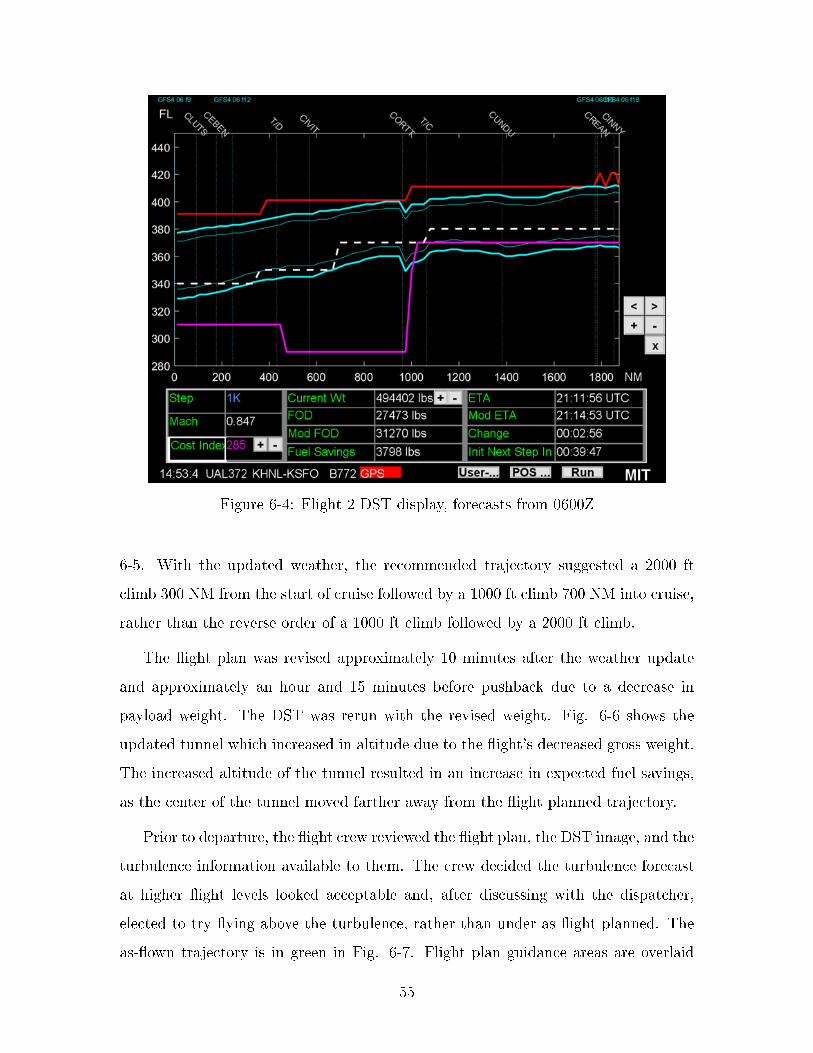
Figure 6-4: Flight 2 DST display, forecasts from 0600Z
6-5. With the updated weather, the recommended trajectory suggested a 2000 ft
climb 300 NM from the start of cruise followed by a 1000 ft climb 700 NM into cruise,
rather than the reverse order of a 1000 ft climb followed by a 2000 ft climb.
The �ight plan was revised approximately 10 minutes after the weather update
and approximately an hour and 15 minutes before pushback due to a decrease in
payload weight. The DST was rerun with the revised weight. Fig. 6-6 shows the
updated tunnel which increased in altitude due to the �ight's decreased gross weight.
The increased altitude of the tunnel resulted in an increase in expected fuel savings,
as the center of the tunnel moved farther away from the �ight planned trajectory.
Prior to departure, the �ight crew reviewed the �ight plan, the DST image, and the
turbulence information available to them. The crew decided the turbulence forecast
at higher �ight levels looked acceptable and, after discussing with the dispatcher,
elected to try �ying above the turbulence, rather than under as �ight planned. The
as-�own trajectory is in green in Fig. 6-7. Flight plan guidance areas are overlaid
55
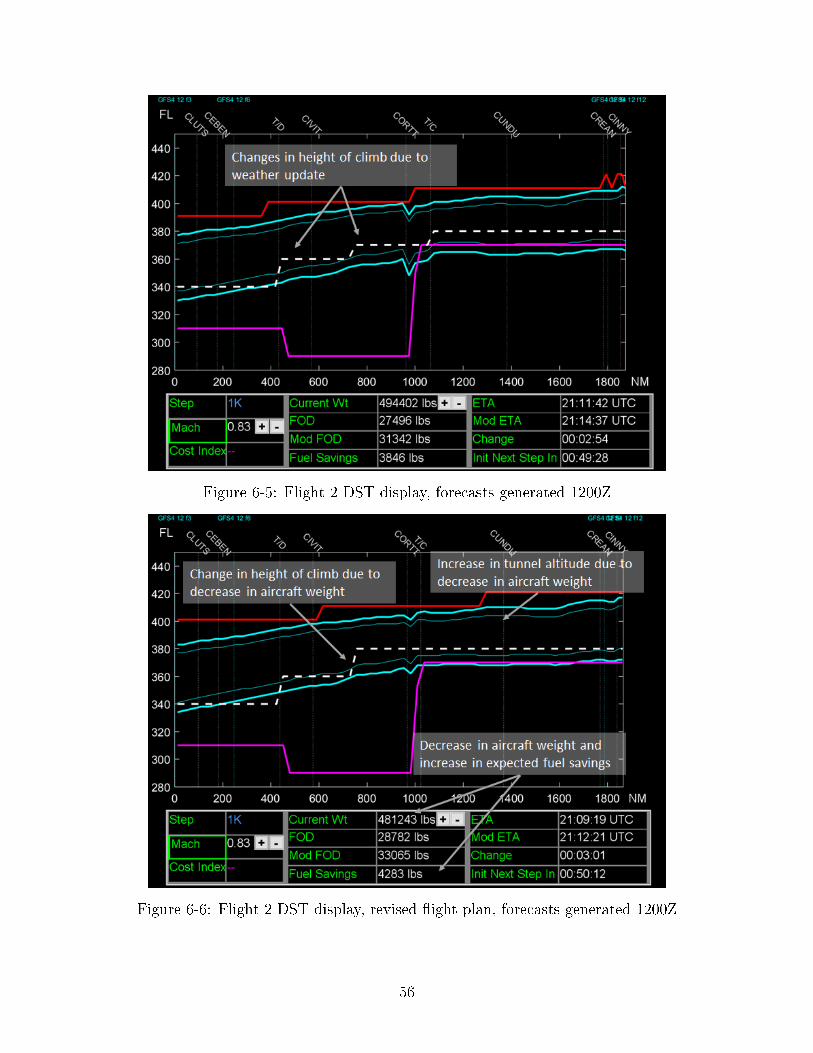
Figure 6-5: Flight 2 DST display, forecasts generated 1200Z
Figure 6-6: Flight 2 DST display, revised �ight plan, forecasts generated 1200Z
56
from post-�ight analysis, but were not available on the DST in �ight.
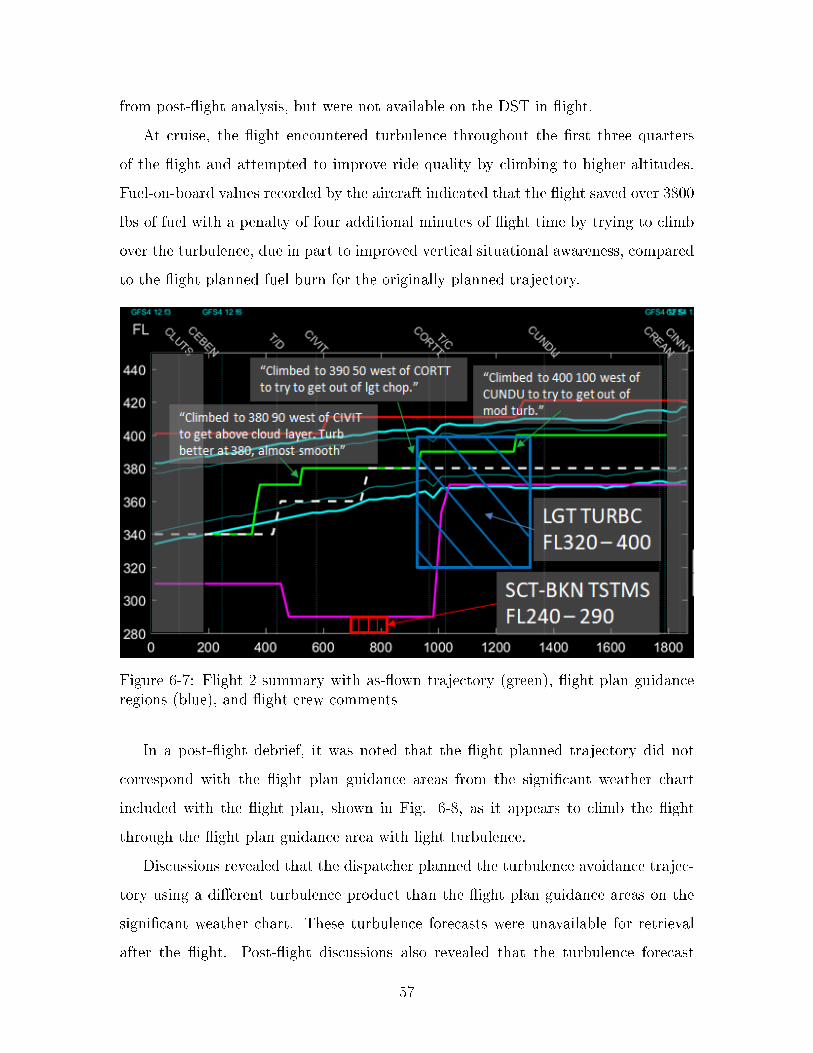
At cruise, the �ight encountered turbulence throughout the �rst three quarters
of the �ight and attempted to improve ride quality by climbing to higher altitudes.
Fuel-on-board values recorded by the aircraft indicated that the �ight saved over 3800
lbs of fuel with a penalty of four additional minutes of �ight time by trying to climb
over the turbulence, due in part to improved vertical situational awareness, compared
to the �ight planned fuel burn for the originally planned trajectory.
Figure 6-7: Flight 2 summary with as-�own trajectory (green), �ight plan guidanceregions (blue), and �ight crew comments
In a post-�ight debrief, it was noted that the �ight planned trajectory did not
correspond with the �ight plan guidance areas from the signi�cant weather chart
included with the �ight plan, shown in Fig. 6-8, as it appears to climb the �ight
through the �ight plan guidance area with light turbulence.
Discussions revealed that the dispatcher planned the turbulence avoidance trajec-
tory using a di�erent turbulence product than the �ight plan guidance areas on the
signi�cant weather chart. These turbulence forecasts were unavailable for retrieval
after the �ight. Post-�ight discussions also revealed that the turbulence forecast
57
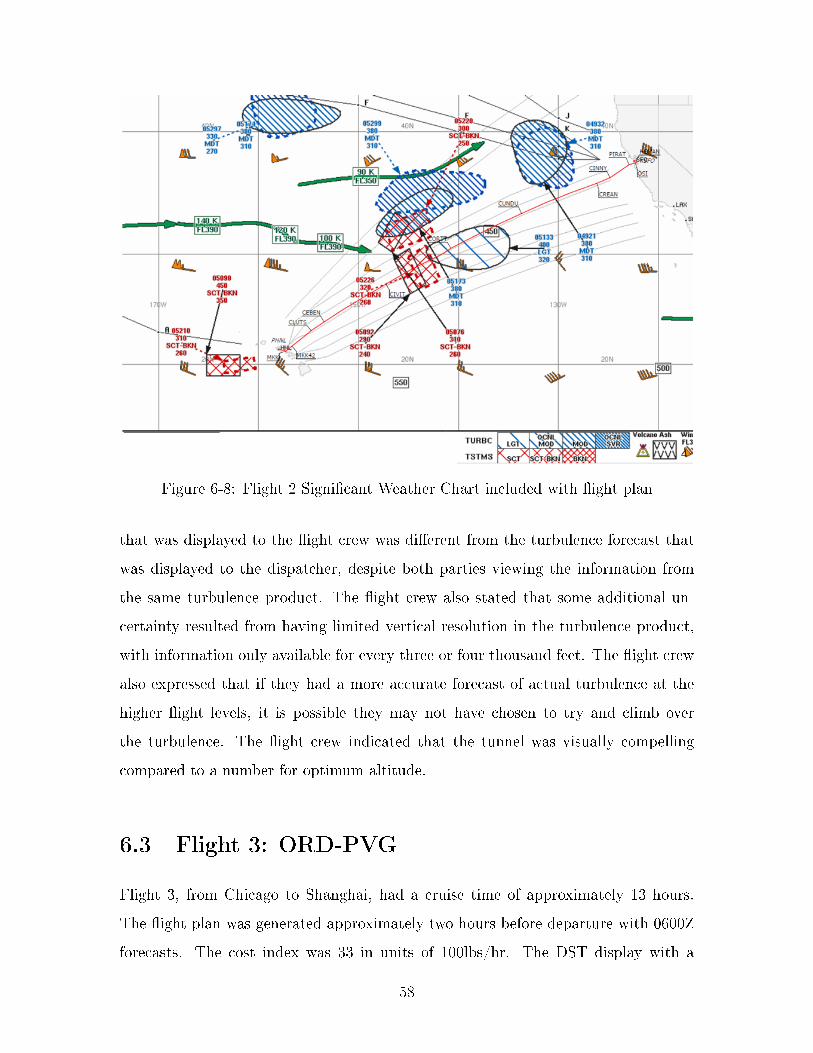
Figure 6-8: Flight 2 Signi�cant Weather Chart included with �ight plan
that was displayed to the �ight crew was di�erent from the turbulence forecast that
was displayed to the dispatcher, despite both parties viewing the information from
the same turbulence product. The �ight crew also stated that some additional un-
certainty resulted from having limited vertical resolution in the turbulence product,
with information only available for every three or four thousand feet. The �ight crew
also expressed that if they had a more accurate forecast of actual turbulence at the
higher �ight levels, it is possible they may not have chosen to try and climb over
the turbulence. The �ight crew indicated that the tunnel was visually compelling
compared to a number for optimum altitude.
6.3 Flight 3: ORD-PVG
Flight 3, from Chicago to Shanghai, had a cruise time of approximately 13 hours.
The �ight plan was generated approximately two hours before departure with 0600Z
forecasts. The cost index was 33 in units of 100lbs/hr. The DST display with a
58
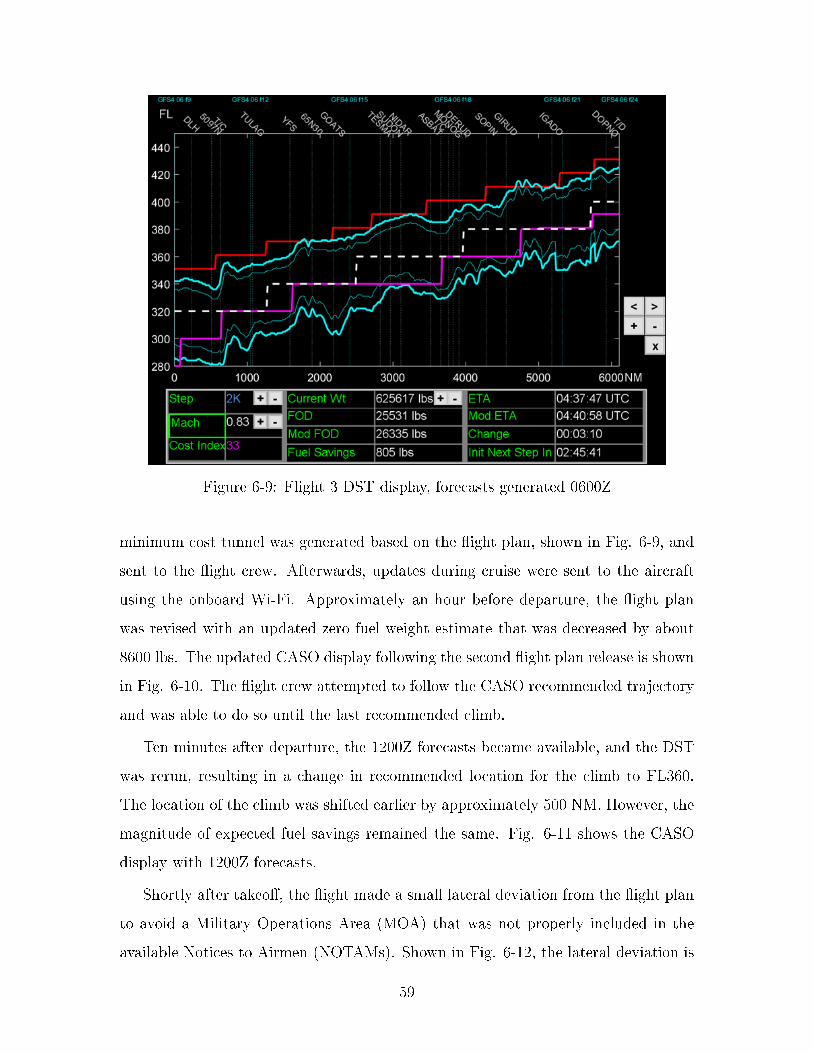
Figure 6-9: Flight 3 DST display, forecasts generated 0600Z
minimum cost tunnel was generated based on the �ight plan, shown in Fig. 6-9, and
sent to the �ight crew. Afterwards, updates during cruise were sent to the aircraft
using the onboard Wi-Fi. Approximately an hour before departure, the �ight plan
was revised with an updated zero fuel weight estimate that was decreased by about
8600 lbs. The updated CASO display following the second �ight plan release is shown
in Fig. 6-10. The �ight crew attempted to follow the CASO recommended trajectory
and was able to do so until the last recommended climb.
Ten minutes after departure, the 1200Z forecasts became available, and the DST
was rerun, resulting in a change in recommended location for the climb to FL360.
The location of the climb was shifted earlier by approximately 500 NM. However, the
magnitude of expected fuel savings remained the same. Fig. 6-11 shows the CASO
display with 1200Z forecasts.
Shortly after takeo�, the �ight made a small lateral deviation from the �ight plan
to avoid a Military Operations Area (MOA) that was not properly included in the
available Notices to Airmen (NOTAMs). Shown in Fig. 6-12, the lateral deviation is
59
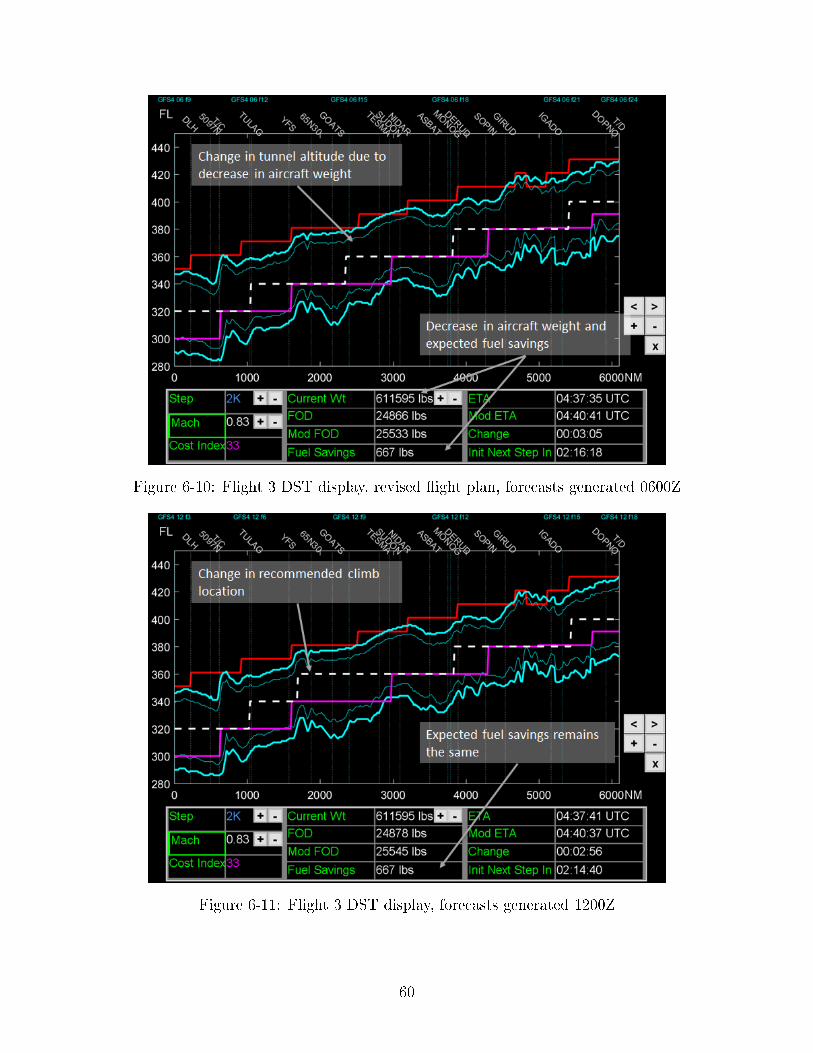
Figure 6-10: Flight 3 DST display, revised �ight plan, forecasts generated 0600Z
Figure 6-11: Flight 3 DST display, forecasts generated 1200Z
60
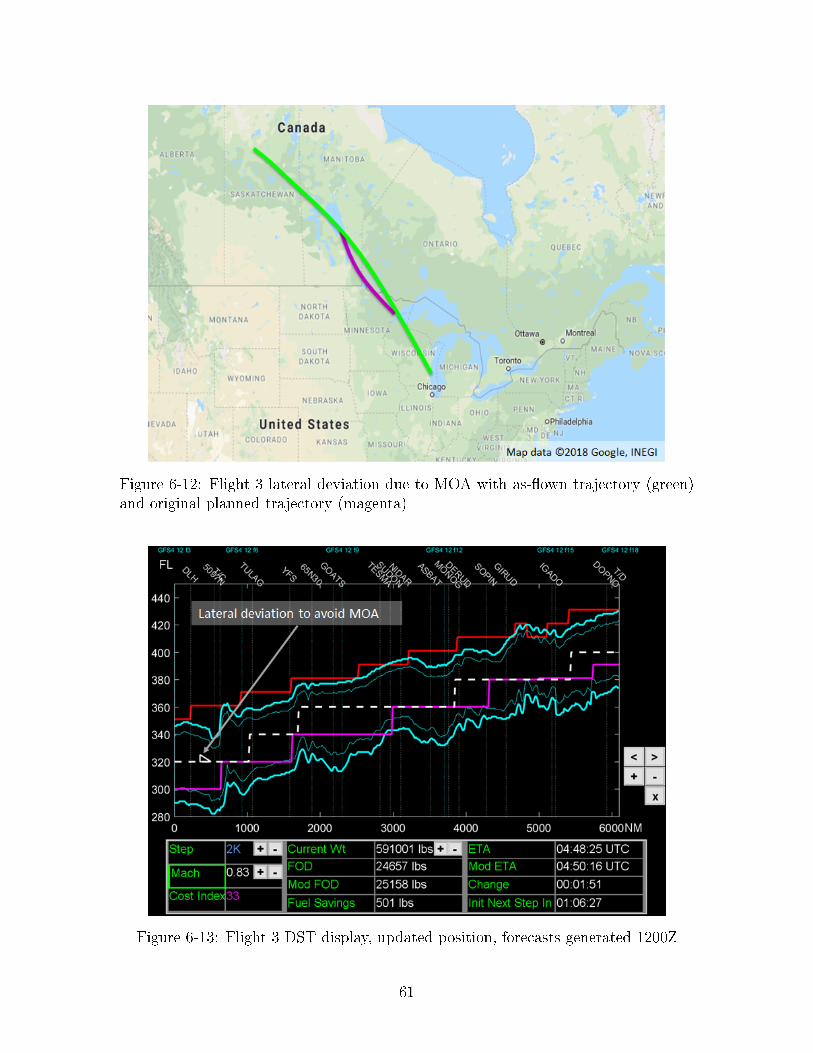
Figure 6-12: Flight 3 lateral deviation due to MOA with as-�own trajectory (green)and original planned trajectory (magenta)
Figure 6-13: Flight 3 DST display, updated position, forecasts generated 1200Z
61
depicted by the green line, while the original �ight plan route is shown in magenta.
The aircraft weight, position, and time was also updated from a position report
received from the dispatcher, shown in Fig. 6-13.
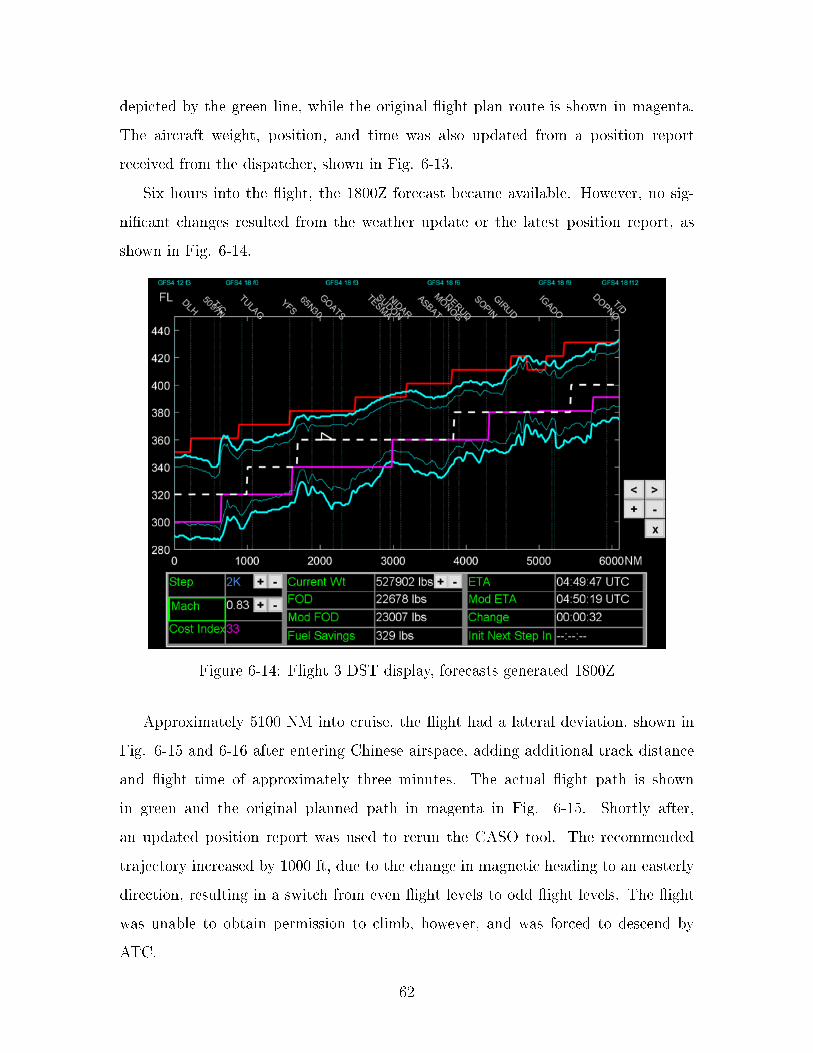
Six hours into the �ight, the 1800Z forecast became available. However, no sig-
ni�cant changes resulted from the weather update or the latest position report, as
shown in Fig. 6-14.
Figure 6-14: Flight 3 DST display, forecasts generated 1800Z
Approximately 5100 NM into cruise, the �ight had a lateral deviation, shown in
Fig. 6-15 and 6-16 after entering Chinese airspace, adding additional track distance
and �ight time of approximately three minutes. The actual �ight path is shown
in green and the original planned path in magenta in Fig. 6-15. Shortly after,
an updated position report was used to rerun the CASO tool. The recommended
trajectory increased by 1000 ft, due to the change in magnetic heading to an easterly
direction, resulting in a switch from even �ight levels to odd �ight levels. The �ight
was unable to obtain permission to climb, however, and was forced to descend by
ATC.
62
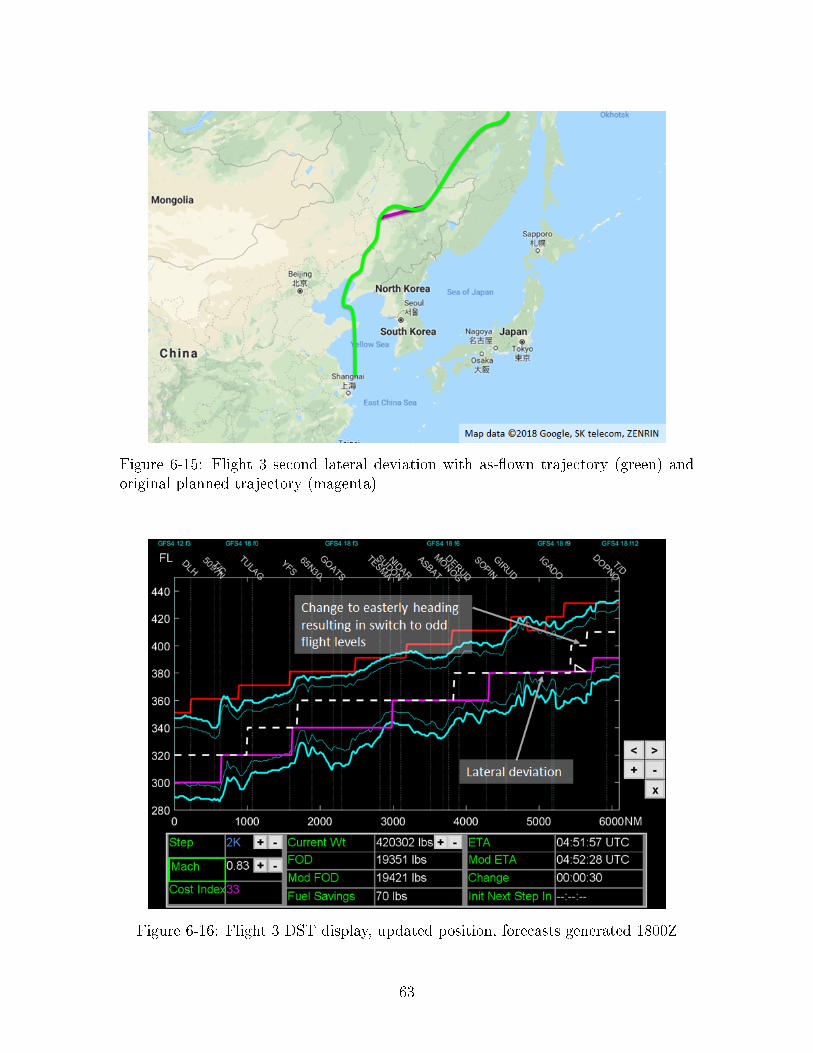
Figure 6-15: Flight 3 second lateral deviation with as-�own trajectory (green) andoriginal planned trajectory (magenta)
Figure 6-16: Flight 3 DST display, updated position, forecasts generated 1800Z
63
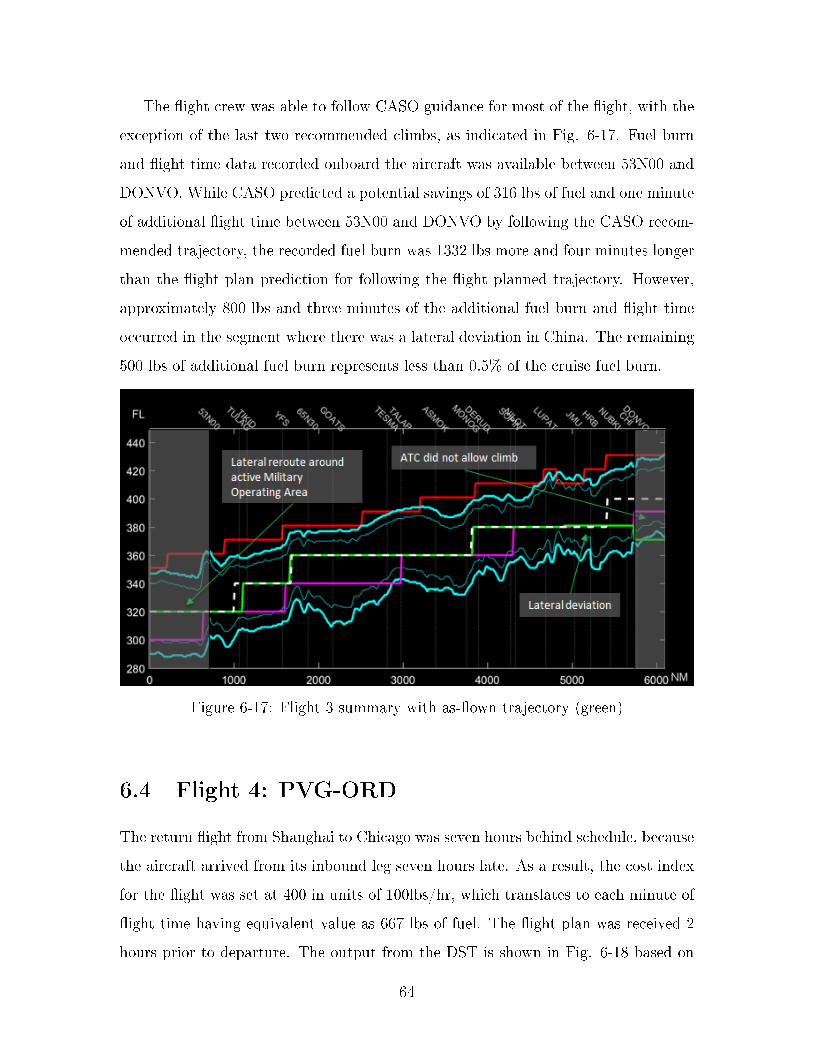
The �ight crew was able to follow CASO guidance for most of the �ight, with the
exception of the last two recommended climbs, as indicated in Fig. 6-17. Fuel burn
and �ight time data recorded onboard the aircraft was available between 53N00 and
DONVO. While CASO predicted a potential savings of 316 lbs of fuel and one minute
of additional �ight time between 53N00 and DONVO by following the CASO recom-
mended trajectory, the recorded fuel burn was 1332 lbs more and four minutes longer
than the �ight plan prediction for following the �ight planned trajectory. However,
approximately 800 lbs and three minutes of the additional fuel burn and �ight time
occurred in the segment where there was a lateral deviation in China. The remaining
500 lbs of additional fuel burn represents less than 0.5% of the cruise fuel burn.
Figure 6-17: Flight 3 summary with as-�own trajectory (green)
6.4 Flight 4: PVG-ORD
The return �ight from Shanghai to Chicago was seven hours behind schedule, because
the aircraft arrived from its inbound leg seven hours late. As a result, the cost index
for the �ight was set at 400 in units of 100lbs/hr, which translates to each minute of
�ight time having equivalent value as 667 lbs of fuel. The �ight plan was received 2
hours prior to departure. The output from the DST is shown in Fig. 6-18 based on
64
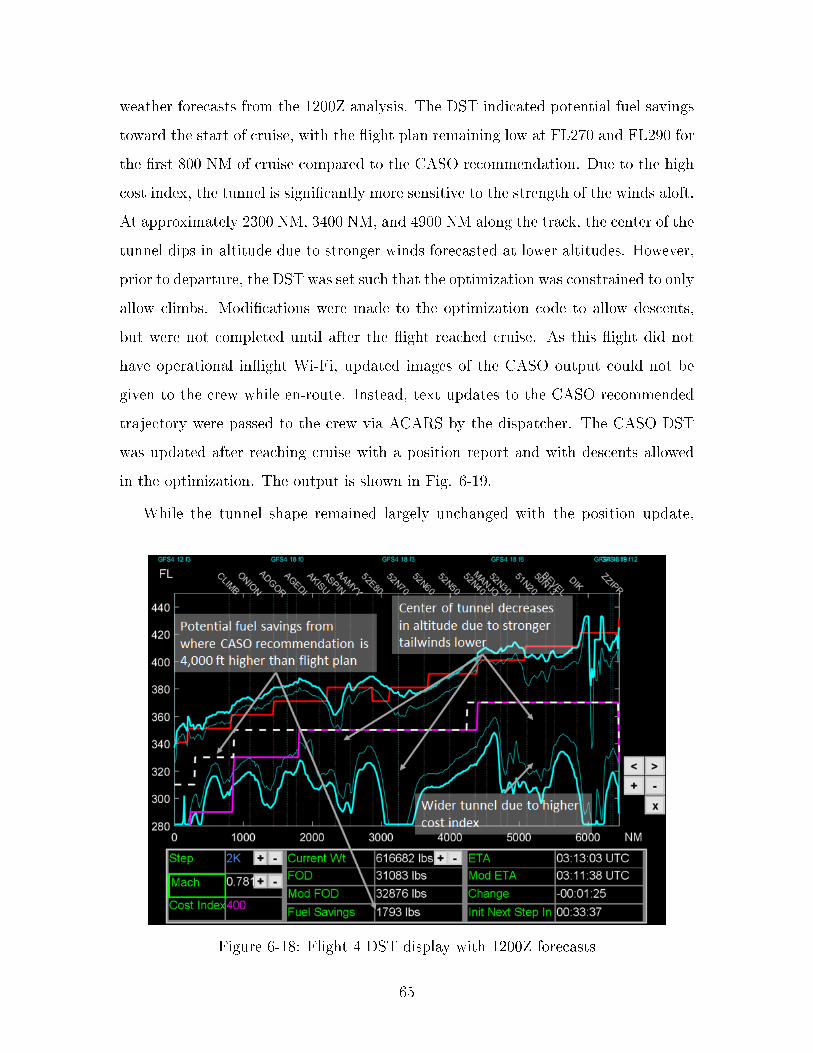
weather forecasts from the 1200Z analysis. The DST indicated potential fuel savings
toward the start of cruise, with the �ight plan remaining low at FL270 and FL290 for
the �rst 800 NM of cruise compared to the CASO recommendation. Due to the high
cost index, the tunnel is signi�cantly more sensitive to the strength of the winds aloft.
At approximately 2300 NM, 3400 NM, and 4900 NM along the track, the center of the
tunnel dips in altitude due to stronger winds forecasted at lower altitudes. However,
prior to departure, the DST was set such that the optimization was constrained to only
allow climbs. Modi�cations were made to the optimization code to allow descents,
but were not completed until after the �ight reached cruise. As this �ight did not
have operational in�ight Wi-Fi, updated images of the CASO output could not be
given to the crew while en-route. Instead, text updates to the CASO recommended
trajectory were passed to the crew via ACARS by the dispatcher. The CASO DST
was updated after reaching cruise with a position report and with descents allowed
in the optimization. The output is shown in Fig. 6-19.
While the tunnel shape remained largely unchanged with the position update,
Figure 6-18: Flight 4 DST display with 1200Z forecasts
65
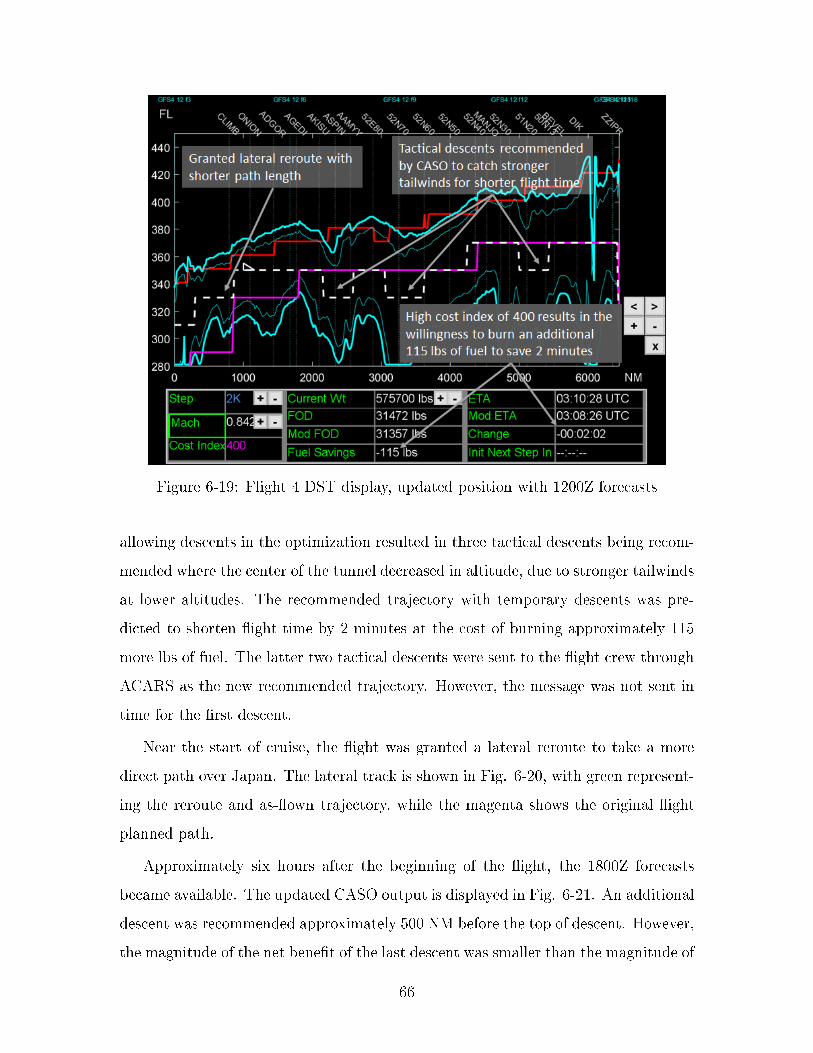
Figure 6-19: Flight 4 DST display, updated position with 1200Z forecasts
allowing descents in the optimization resulted in three tactical descents being recom-
mended where the center of the tunnel decreased in altitude, due to stronger tailwinds
at lower altitudes. The recommended trajectory with temporary descents was pre-
dicted to shorten �ight time by 2 minutes at the cost of burning approximately 115
more lbs of fuel. The latter two tactical descents were sent to the �ight crew through
ACARS as the new recommended trajectory. However, the message was not sent in
time for the �rst descent.
Near the start of cruise, the �ight was granted a lateral reroute to take a more
direct path over Japan. The lateral track is shown in Fig. 6-20, with green represent-
ing the reroute and as-�own trajectory, while the magenta shows the original �ight
planned path.
Approximately six hours after the beginning of the �ight, the 1800Z forecasts
became available. The updated CASO output is displayed in Fig. 6-21. An additional
descent was recommended approximately 500 NM before the top of descent. However,
the magnitude of the net bene�t of the last descent was smaller than the magnitude of
66
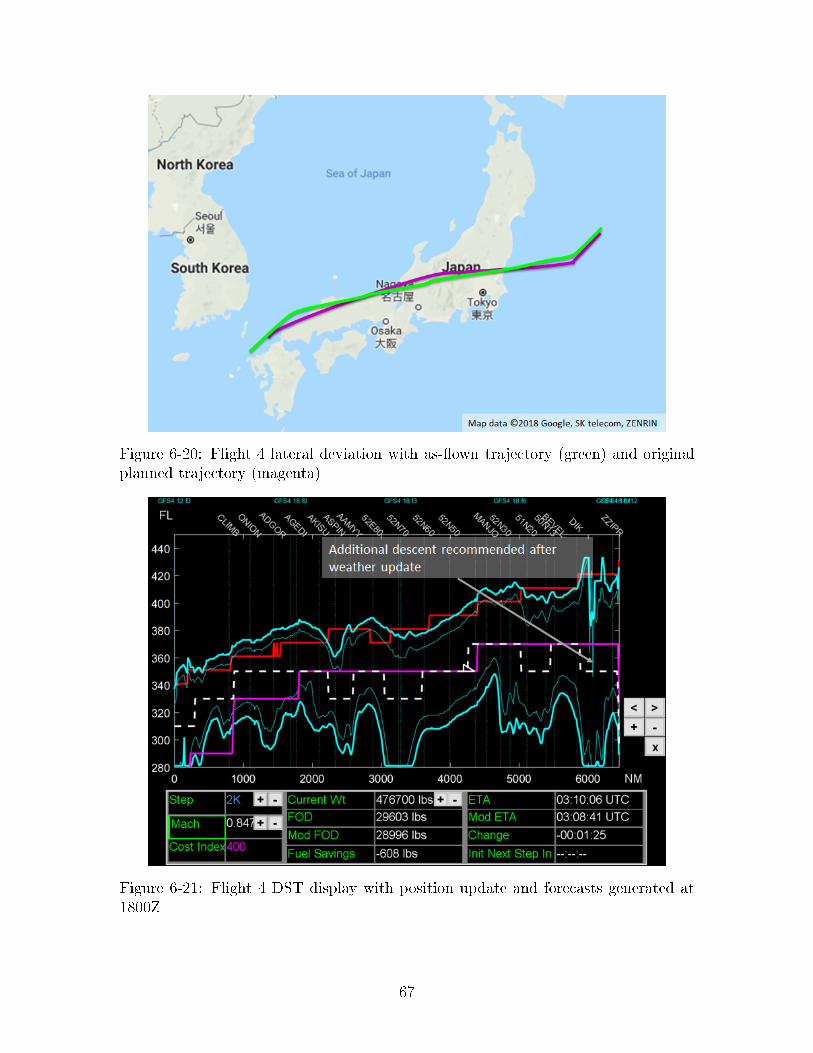
Figure 6-20: Flight 4 lateral deviation with as-�own trajectory (green) and originalplanned trajectory (magenta)
Figure 6-21: Flight 4 DST display with position update and forecasts generated at1800Z
67
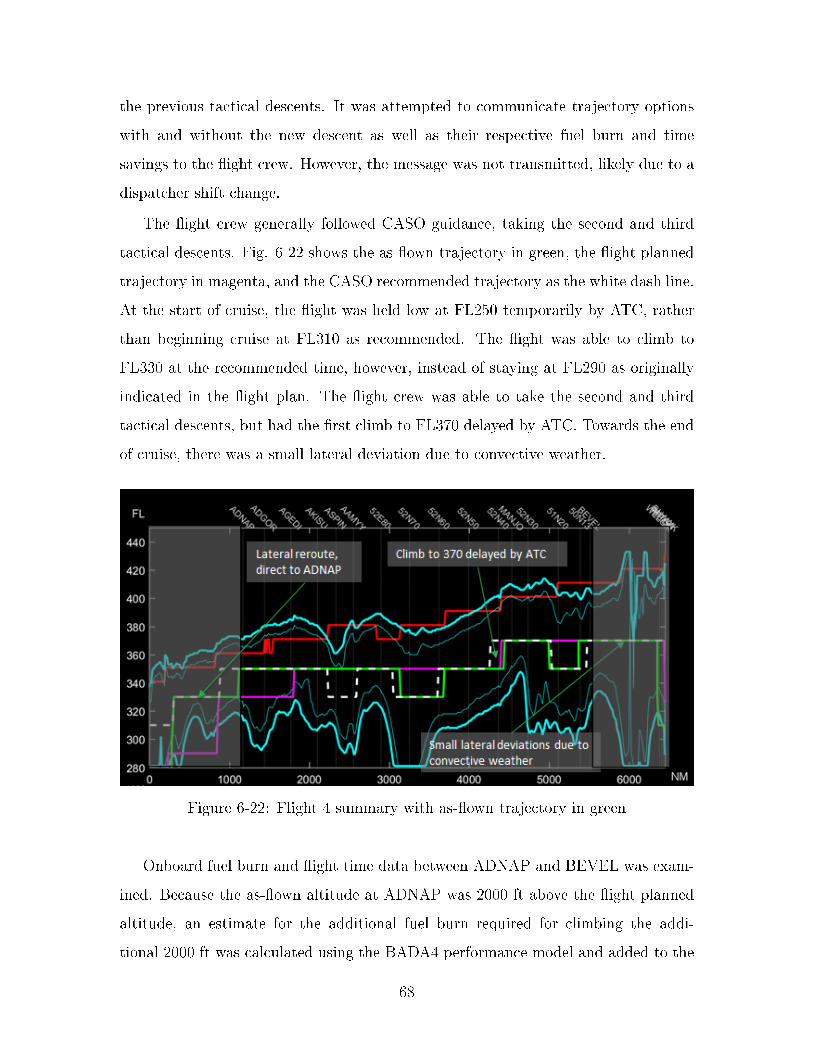
the previous tactical descents. It was attempted to communicate trajectory options
with and without the new descent as well as their respective fuel burn and time
savings to the �ight crew. However, the message was not transmitted, likely due to a
dispatcher shift change.
The �ight crew generally followed CASO guidance, taking the second and third
tactical descents. Fig. 6-22 shows the as-�own trajectory in green, the �ight planned
trajectory in magenta, and the CASO recommended trajectory as the white dash line.
At the start of cruise, the �ight was held low at FL250 temporarily by ATC, rather
than beginning cruise at FL310 as recommended. The �ight was able to climb to
FL330 at the recommended time, however, instead of staying at FL290 as originally
indicated in the �ight plan. The �ight crew was able to take the second and third
tactical descents, but had the �rst climb to FL370 delayed by ATC. Towards the end
of cruise, there was a small lateral deviation due to convective weather.
Figure 6-22: Flight 4 summary with as-�own trajectory in green
Onboard fuel burn and �ight time data between ADNAP and BEVEL was exam-
ined. Because the as-�own altitude at ADNAP was 2000 ft above the �ight planned
altitude, an estimate for the additional fuel burn required for climbing the addi-
tional 2000 ft was calculated using the BADA4 performance model and added to the
68
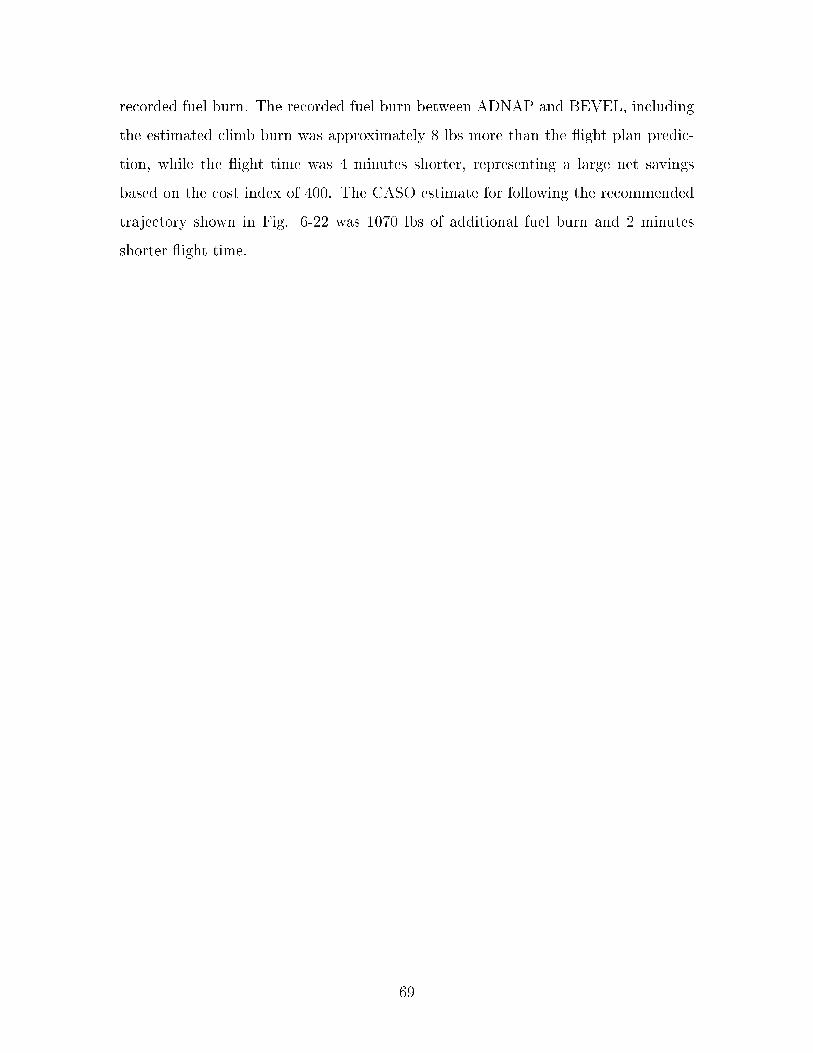
recorded fuel burn. The recorded fuel burn between ADNAP and BEVEL, including
the estimated climb burn was approximately 8 lbs more than the �ight plan predic-
tion, while the �ight time was 4 minutes shorter, representing a large net savings
based on the cost index of 400. The CASO estimate for following the recommended
trajectory shown in Fig. 6-22 was 1070 lbs of additional fuel burn and 2 minutes
shorter �ight time.
69

70
Chapter 7
Discussion
7.1 Decision Support Tool Utility
In post-�ight debrie�ngs, �ight crews indicated that the decision support tool im-
proved situational awareness of the vertical trajectory decision space and costs of
various trajectory options. This is consistent with the �ight crew's demonstrated abil-
ity to identify and �y trajectories with reduced cost compared to the �ight planned
trajectory using the tool in the preliminary �ight trials. In Flight 2, the �ight crew
identi�ed that the �ight planned trajectory was signi�cantly o� the optimal trajec-
tory after viewing the decision support tool and also gained awareness of the relative
cost of following the �ight planned trajectory both by the altitude tunnel and by the
fuel savings estimate. Although the �ight crew was aware that the optimum altitude
was above the �ight planned altitude of FL290, the tool was able to provide a pre-
cise trajectory and display the relative costs. Consequently, the �ight crew was also
able to evaluate various other trajectories, besides the recommended trajectory, when
turbulence was encountered while attempting to follow the recommended trajectory.
In the case of Flight 2, the altitude tunnel indicated that climbing above the opti-
mal trajectory was a lower cost option than descending. Similarly, in Flight 4, the
�ight crew was able to identify and �y tactical descents with expected time bene�ts
that the crew would not have been aware of without the tool. The post-�ight debrief
discussions and the trajectories �own indicate that the decision support tool is useful.
71
The crew reported the tunnel to be compelling. For Flight 2, when asked if they
would still have chosen to �y above the turbulence rather than under without the
DST, the crew's response was �I may have still chosen to go high because I knew the
optimum altitude for the �ight was much higher than the planned FL310 descending
to FL290. The altitude tunnel is visually more compelling than just a number for
optimum altitude. It certainly reinforced my decision to climb higher rather than
descend as the �ight plan suggested.� The �ight crew also proactively asked about
tactical descents in Flight 4 after viewing the tunnel, prior to the tool being con�gured
to include descents in the optimization. The preliminary �ight trials indicate that
the tunnel helped motivate decisions made by the crew.
Because it was necessary to run the decision support tool from the ground, the
positive results from the preliminary �ight trials indicate that much of the decision
support tool's utility can be achieved as a static image provided to the �ight crew
as part of the pre-�ight brie�ng. By providing an image of the minimum cost tunnel
as part of the �ight plan, the �ight crew is able to gain an awareness of the relative
costs of the decision space across the entire �ight, coordinate with the dispatcher
if necessary, and consult the tunnel en-route if unexpected events arise. While the
static image would not be updated during the �ight, the minimum cost tunnel tends
to retain its general shape, as seen in the preliminary �ights, even for �ights of over
10 hours. For �ights outside the continental U.S., the update rate of once every six
hours results in at most three relevant potential weather updates for even the longest
�ights. For �ights within the continental U.S. that have the bene�t of hourly-updated
forecasts, the minimum cost tunnel and recommended trajectory can be monitored
for signi�cant changes. As a result of the limited changes observed from the weather
updates in the four trial �ights, it is currently unclear how much additional bene�t
is gained from weather updates. The tool can be run on the ground as a dispatcher
tool, with any updates to the recommended trajectory that is deemed signi�cant
enough uplinked to the aircraft, minimizing bandwidth requirements. Updates to the
recommended trajectory may be caused by new weather forecasts or other changes
such as large reroutes. Flights 1 and 4 demonstrated the feasibility of this approach,
72
as both �ights did not use in�ight Wi-Fi to receive images updated with the latest
weather forecast or aircraft information. Instead, updates to the recommended tra-
jectory were sent to the aircraft via ACARS, and the �ight crew was still able to follow
the recommended trajectory to the extent allowed by air tra�c and turbulence. In
both cases, the general shape of the tunnel remained the same, with relatively small
changes to climb and descent locations resulting from the weather updates.
The cost savings from each �ight in the preliminary �ight trials also suggest that
the decision support tool is most useful for �ights that are planned signi�cantly o�
the optimal trajectory or that encounter unusual circumstances. Flight 2, planned
signi�cantly o� cost-optimal due to turbulence, illustrates this with 3800 lbs of fuel
saved and 4 minutes of additional �ight time compared to the original �ight plan.
Similarly, Flight 4, which was delayed seven hours, showed time savings of 4 minutes
�ying at a cost index of 400 in units of 100 lbs/hr. For �ights already planned near the
optimal trajectory, the bene�t achievable is dependent on the �delity of the aircraft
performance model and weather model.
7.2 Flight Crew and Dispatcher Coordination
Prior to departure on Flight 2, the �ight crew called the dispatcher after viewing the
decision support tool to discuss the planned turbulence avoidance trajectory, because
the �ight planned trajectory was signi�cantly o� the altitude tunnel, and turbulence
forecasts appeared to show that �ying above the turbulence was a viable option. The
pre-departure communication between the �ight crew and dispatcher, initiated after
the �ight crew viewed the tool, indicates that the decision support tool also helped
facilitate coordination between the �ight crew and dispatcher. During previous dis-
cussions with airlines, dispatchers have also stated that the altitude tunnel would
be useful for communicating complex trajectories, such as those involving tempo-
rary descents as displayed and �own in Flight 4. Dispatchers expressed di�culties
with communicating those trajectories to the �ight crew using current �ight plans
due to the inability to explain e�ectively the reason behind the trajectory. Before
73
departure on Flight 4, while the decision support tool recommended trajectory was
still con�gured to only allow climbs without descents, the �ight crew viewed the tool
and indicated that they expected descents based on the minimum cost tunnel. This
indicates that the minimum cost tunnel is able to e�ectively communicate complex
trajectories by visually providing the rationale for those trajectories.
As part of the feedback in post-�ight debrief discussions, one of the dispatchers
indicated that having an alert or noti�cation from the website whenever an update
occurred would be a desirable feature. This would be helpful for the dispatcher to
know when changes occurred without having to constantly monitor for changes.
The discrepancy in turbulence information and the decisions made by the �ight
crew and dispatcher in Flight 2 suggests that �ights would bene�t from improved
turbulence information and �ight crew-dispatcher coordination. The di�erence be-
tween the �ight planned trajectory and the trajectory selected by the �ight crew is
in part attributable to di�erences in available turbulence information. The debrief
discussion following Flight 2 indicated that the dispatcher had turbulence information
that was di�erent from the �ight crew's turbulence information, despite using simi-
lar products. Discussions with a pilot from another airline also indicated that their
dispatchers planned routes using one product, while �ight crews tended to rely on a
separate product. The di�erences in available information may create unnecessary
uncertainty, resulting either in unnecessary �ight costs or more instances of �ying into
avoidable turbulence. This is especially pronounced when the di�erences are observed
while using the same turbulence product. Having synchronized turbulence informa-
tion would reduce unnecessary uncertainty and facilitate clearer communication of
rationale between dispatcher and pilot. The �ight crew also expressed a desire for
higher accuracy and higher resolution turbulence forecasts, indicating that decisions
may have been di�erent if better forecasts were available.
The di�erence between the dispatcher planned trajectory and the initial trajectory
that the captain decided to �y in Flight 2 may also be in part in�uenced by potential
di�erences in conservatism regarding turbulence. For example, the dispatcher may
prefer to be more conservative, as they are the ones planning the initial trajectory.
74

The �ight crew may be less conservative, as they are in control of the aircraft and
are able to modify the initial trajectory later on, if they desire. Synchronizing turbu-
lence information would allow for clearer communication of preferences and facilitate
negotiation and agreement between dispatcher and pilots.
75

76
Chapter 8
Conclusions
A cruise altitude and speed optimization decision support tool for aiding crew and
dispatcher situational awareness and decision-making based on the minimum cost
altitude tunnel was developed. A prototype of the tool has been implemented, and
preliminary �ight trials were conducted on a Boeing 777.
The DST provided improved situational awareness in vertical trajectory costs to
the �ight crew before and during the �ights. The �ight crew reported the minimum
cost tunnel to be compelling. The DST was also found to be useful for facilitating
coordination between the �ight crew and the dispatcher. The preliminary �ight trials
also showed that trajectory decision-making would be aided by improved turbulence
information, particularly a synchronization of the turbulence information available to
the �ight crew and to the dispatcher. The largest potential bene�ts are seen with
�ights that are planned signi�cantly o� the optimal trajectory. In the preliminary
�ight trials, one �ight achieved fuel savings of over 3800 lbs due to the �ight being
planned low for turbulence. Savings for �ights with relatively good agreement be-
tween the �ight plan and the CASO DST will depend on the �delity in the aircraft
performance model and weather forecasts. The preliminary �ight trials indicate that
the DST would still be useful even as a static image provided with the �ight plan
prior to departure.
Potential future research would include re�ning the �delity of the performance es-
timation by improving the climb and descent models and including climb and descent
77

costs in the optimization. Integration of turbulence information in the tool is another
area for continued work. Future research may examine incorporating turbulence into
the cost function and optimization. The synchronization of information and devel-
opment of tools to improve coordination between �ight crews, dispatchers, and air
tra�c controllers may also be investigated.
78
Bibliography
[1] Luke Jensen and R.J. Hansman. Fuel e�ciency bene�ts and implementationconsiderations for cruise altitude and speed optimization in the national airspacesystem. Master's thesis, Massachusetts Institute of Technology, 2014.
[2] Henry Tran and R.J. Hansman. Fuel bene�t from optimal trajectory assign-ment on the north atlantic tracks. Master's thesis, Massachusetts Institute ofTechnology, 2016.
[3] Kapil Sheth, Dave McNally, Alex Morando, Alexis Clymer, Patrick Somersall,and Fu-Tai Shih. Assessment of a national airspace system airborne reroutingtool. Air Tra�c Management Research and Development Seminar, 2015.
[4] David Wing. Achieving tasar operational readiness. AIAA AVIATION Forum,2015.
[5] W. Roberson, R. Root, and D. Adams. Fuel conservation strategies: Cruise�ight. Boeing Aero Magazine, 2007.
[6] Robert F. Stengel. Flight Dynamics, chapter 2.6. Princeton University Press,2004.
[7] Fact sheet - turbulence. FAA Fact Sheet, 2017.
[8] Peter Meischner, Robert Baumann Hartmut Holler, and Thomas Jank. Eddydissipation rates in thunderstorms estimated by doppler radar in relation toaircraft in situ measurements. Journal of Atmospheric and Oceanic Technology,2001.
[9] 14 CFR 121.533, 2018.
[10] John W. Sheremeta Jr. and Thomas R. Weitzel. Control of u.s. airlines: Anexploration of operational factors and performance among dispatchers. Interna-tional Journal of Applied Aviation Studies, 2005.
[11] 14 CFR 121.639, 2018.
[12] A.Nuic and V. Mouillet. User manual for the base of aircraft data (bada) family4. Technical report, EUROCONTROL, 2016.
79
[13] Angela Nuic, Damir Poles, and Vincent Mouillet. Bada: An advanced aircraftperformance model for present and future atm systems. International Journal
of Adaptice Control and Signal Processing, 2010.
[14] North atlantic operations and airspace manual. Technical report, InternationalCivil Aviation Organization, 2017.
[15] Environmental noise directive noise action plan 2013-2018. Technical report,Heathrow Airport, 2014.
80