Embed Size (px)
Citation preview
The State of Cash
Preliminary Findings from the 2015 Diary of Consumer Payment Choice
CPO Market Analysis Team
Wendy Matheny, Shaun O’Brien, and Claire Wang
November 2016
The views in this paper are solely the responsibility of the authors and should not be interpreted as
reflecting the views of the Federal Reserve System.
Preliminary Findings from the 2015 Diary of Consumer Payment Choice
November 2016 Page 2 of 14
EXECUTIVE SUMMARY
As the payments landscape evolves, cash remains a unique, resilient, and heavily used consumer payment
instrument. Still, with new payment options and ways to shop, consumers are adapting how they view and
use cash. The Diary of Consumer Payment Choice (Diary) serves as the Cash Product Office’s (CPO)
primary data source on consumer payment behavior. Insights from the Diary, and other data sources, help
the CPO understand the role that cash will play in the future. This research helps the Federal Reserve (Fed)
fulfill its objectives of maintaining confidence in U.S. currency and promoting a safe and efficient payment
system.
When first conducted in 2012, the Diary showed that cash was the most frequently used payment
instrument and that cash use was prevalent across all demographic groups. The key findings of the 2015
Diary of Consumer Payment Choice are similar and suggest that:
Cash continues to be the most frequently used consumer payment instrument
Cash is widely used in a variety of circumstances
Cash dominates small-value transactions
The average value of cash holdings has grown
The 2015 results also show that cash is facing competition from other payment instruments. In 2015, 32
percent of consumer transactions were made with cash, compared with 40 percent in 2012. Growing
consumer comfort with payment cards and the growth of online commerce, among other factors,
contribute to this trend. Nonetheless, a broad range of results suggests that cash remains resilient and
continues to play a key and unique role for consumers.
The first section of the paper discusses high-level, aggregate trends in cash demand and in financial
institutions’ currency orders and deposits with the Fed. The second section focuses on four findings about
cash use from the 2015 Diary, outlined above. The final section explores three insights that the 2015 data
give us on consumer payment preferences and practices.
BACKGROUND: HIGH-LEVEL TRENDS SUGGEST CASH USE IS EVOLVING
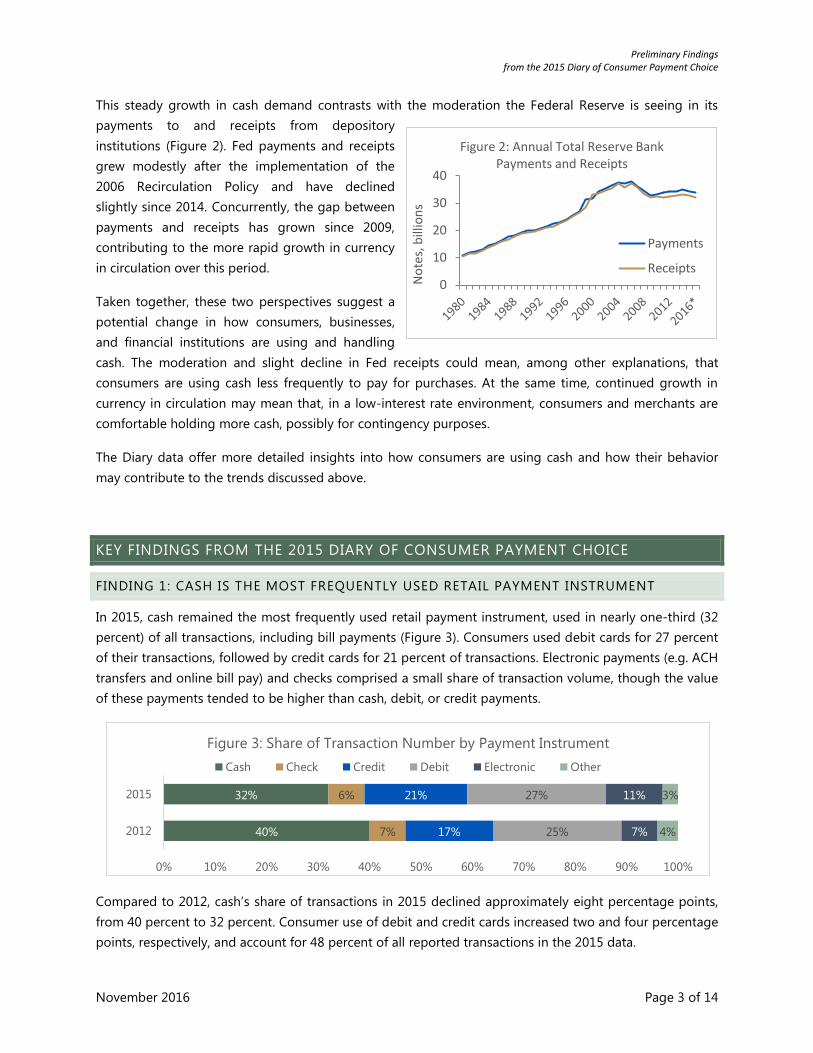
Despite innovations in smartphone technology and
mobile payment apps, Fed data on the amount of
currency in circulation suggest that demand for
cash is strong. Figure 1 shows currency in circulation
from January 1980 to August 2016 and includes
notes held by merchants, financial institutions, and
consumers. The amount of currency in circulation has
increased steadily over time, and demand for higher
denominations has accelerated in the years since the
2008 financial crisis.
0
20
40
1980
1984
1988
1992
1996
2000
2004
2008
2012
2016
No
tes,
billio
ns
Figure 1: Currency in Circulation
$1-$5
$10-$20
$50-$100
Preliminary Findings from the 2015 Diary of Consumer Payment Choice
November 2016 Page 3 of 14
This steady growth in cash demand contrasts with the moderation the Federal Reserve is seeing in its
payments to and receipts from depository
institutions (Figure 2). Fed payments and receipts
grew modestly after the implementation of the
2006 Recirculation Policy and have declined
slightly since 2014. Concurrently, the gap between
payments and receipts has grown since 2009,
contributing to the more rapid growth in currency
in circulation over this period.
Taken together, these two perspectives suggest a
potential change in how consumers, businesses,
and financial institutions are using and handling
cash. The moderation and slight decline in Fed receipts could mean, among other explanations, that
consumers are using cash less frequently to pay for purchases. At the same time, continued growth in
currency in circulation may mean that, in a low-interest rate environment, consumers and merchants are
comfortable holding more cash, possibly for contingency purposes.
The Diary data offer more detailed insights into how consumers are using cash and how their behavior
may contribute to the trends discussed above.
KEY FINDINGS FROM THE 2015 DIARY OF CONSUMER PAYMENT CHOICE
FINDING 1: CASH IS THE MOST FREQUENTLY USED RETAIL PAYMENT INSTRUMENT
In 2015, cash remained the most frequently used retail payment instrument, used in nearly one-third (32
percent) of all transactions, including bill payments (Figure 3). Consumers used debit cards for 27 percent
of their transactions, followed by credit cards for 21 percent of transactions. Electronic payments (e.g. ACH
transfers and online bill pay) and checks comprised a small share of transaction volume, though the value
of these payments tended to be higher than cash, debit, or credit payments.
Compared to 2012, cash’s share of transactions in 2015 declined approximately eight percentage points,
from 40 percent to 32 percent. Consumer use of debit and credit cards increased two and four percentage
points, respectively, and account for 48 percent of all reported transactions in the 2015 data.
40%
32%
7%
6%
17%
21%
25%
27%
7%
11%
4%
3%
0% 10% 20% 30% 40% 50% 60% 70% 80% 90% 100%
2012
2015
Figure 3: Share of Transaction Number by Payment Instrument
Cash Check Credit Debit Electronic Other
0
10
20
30
40
No
tes,
bill
ion
s
Figure 2: Annual Total Reserve Bank Payments and Receipts
Payments
Receipts
Preliminary Findings from the 2015 Diary of Consumer Payment Choice
November 2016 Page 4 of 14
Cash’s decline in transaction share can be attributed to two types of factors: (1) fundamental changes in
consumer behavior and preferences and (2) structural changes to the Diary survey tool.
Fundamentally, consumer preferences and shopping behavior appear to have changed as consumers
increasingly use non-cash payment instruments. Fewer people cited cash as their preferred payment
instrument (see Insight 1 below), and consumers are increasing the amount of shopping they do online or
through remote platforms. The share of transactions that took place online or remotely increased to 10
percent in 2015, up from 6 percent in 2012.
Structurally, changes to the survey instrument and a different panel of diarists may have contributed to
part of the change in cash’s share of transactions in 2015. The addition of a bill payment module at the
end of the third Diary day provided a more accurate record of bill payments, increasing the share of
reported electronic payments. The 2015 Diary participants also recorded fewer small-value transactions.1
As cash tends to be used for small-value transactions, the lower number of reported small-value
transactions disproportionately diminished cash’s share of total transactions. Appendix I provides more
information on changes between the 2012 and 2015 Diaries.
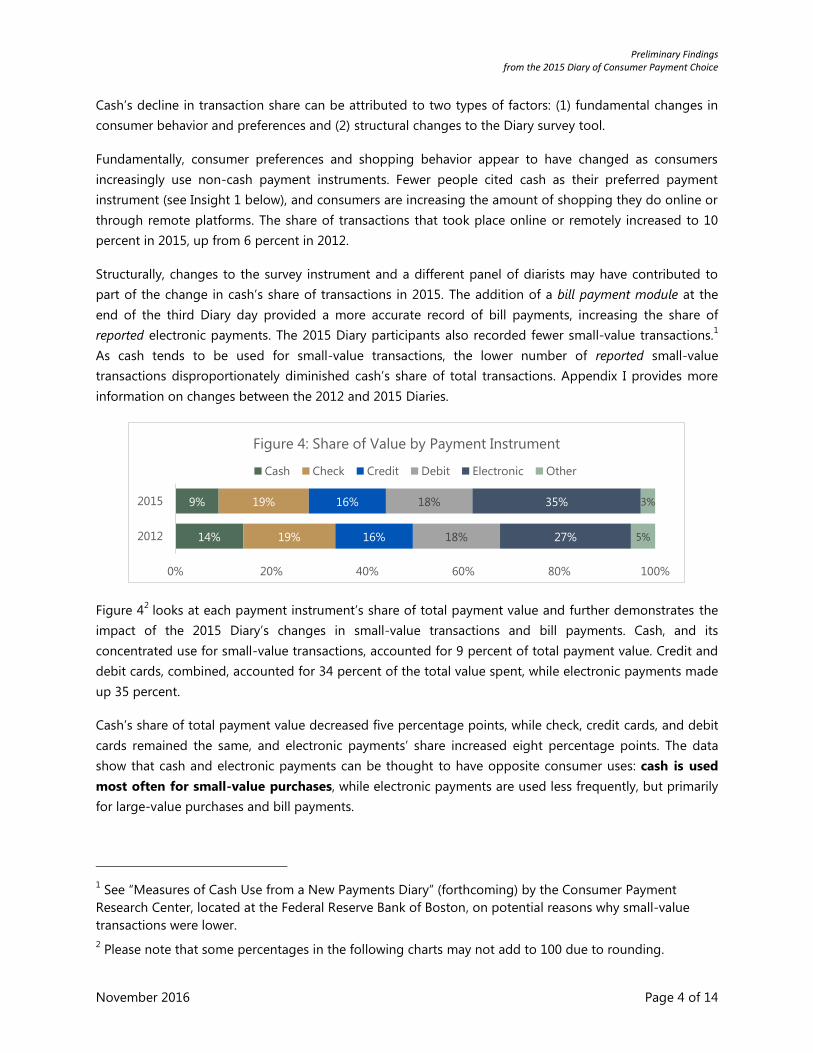
Figure 42 looks at each payment instrument’s share of total payment value and further demonstrates the
impact of the 2015 Diary’s changes in small-value transactions and bill payments. Cash, and its
concentrated use for small-value transactions, accounted for 9 percent of total payment value. Credit and
debit cards, combined, accounted for 34 percent of the total value spent, while electronic payments made
up 35 percent.
Cash’s share of total payment value decreased five percentage points, while check, credit cards, and debit
cards remained the same, and electronic payments’ share increased eight percentage points. The data
show that cash and electronic payments can be thought to have opposite consumer uses: cash is used
most often for small-value purchases, while electronic payments are used less frequently, but primarily
for large-value purchases and bill payments.
1 See “Measures of Cash Use from a New Payments Diary” (forthcoming) by the Consumer Payment
Research Center, located at the Federal Reserve Bank of Boston, on potential reasons why small-value
transactions were lower.
2 Please note that some percentages in the following charts may not add to 100 due to rounding.
14%
9%
19%
19%
16%
16%
18%
18%
27%
35%
5%
3%
0% 20% 40% 60% 80% 100%
2012
2015
Figure 4: Share of Value by Payment Instrument
Cash Check Credit Debit Electronic Other
Preliminary Findings from the 2015 Diary of Consumer Payment Choice
November 2016 Page 5 of 14
FINDING 2: CASH IS WIDELY USED, EVEN WHEN OTHER OPTIONS ARE AVAILABLE
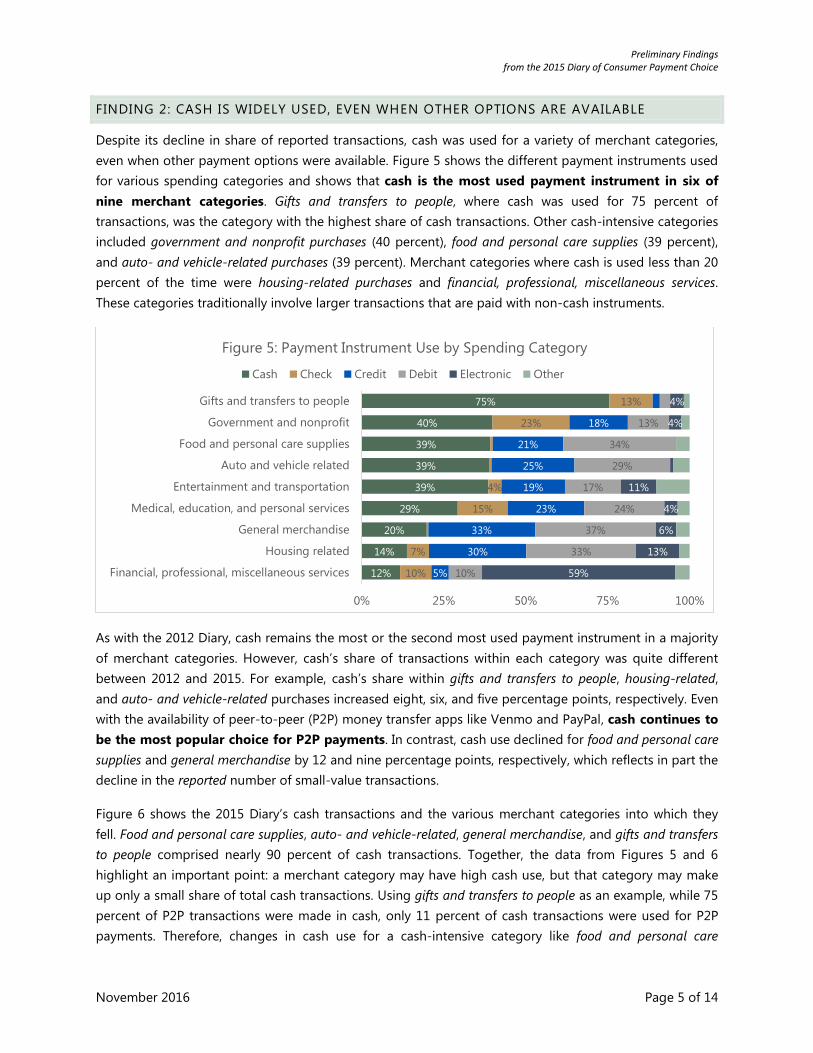
Despite its decline in share of reported transactions, cash was used for a variety of merchant categories,
even when other payment options were available. Figure 5 shows the different payment instruments used
for various spending categories and shows that cash is the most used payment instrument in six of
nine merchant categories. Gifts and transfers to people, where cash was used for 75 percent of
transactions, was the category with the highest share of cash transactions. Other cash-intensive categories
included government and nonprofit purchases (40 percent), food and personal care supplies (39 percent),
and auto- and vehicle-related purchases (39 percent). Merchant categories where cash is used less than 20
percent of the time were housing-related purchases and financial, professional, miscellaneous services.
These categories traditionally involve larger transactions that are paid with non-cash instruments.
As with the 2012 Diary, cash remains the most or the second most used payment instrument in a majority
of merchant categories. However, cash’s share of transactions within each category was quite different
between 2012 and 2015. For example, cash’s share within gifts and transfers to people, housing-related,
and auto- and vehicle-related purchases increased eight, six, and five percentage points, respectively. Even
with the availability of peer-to-peer (P2P) money transfer apps like Venmo and PayPal, cash continues to
be the most popular choice for P2P payments. In contrast, cash use declined for food and personal care
supplies and general merchandise by 12 and nine percentage points, respectively, which reflects in part the
decline in the reported number of small-value transactions.
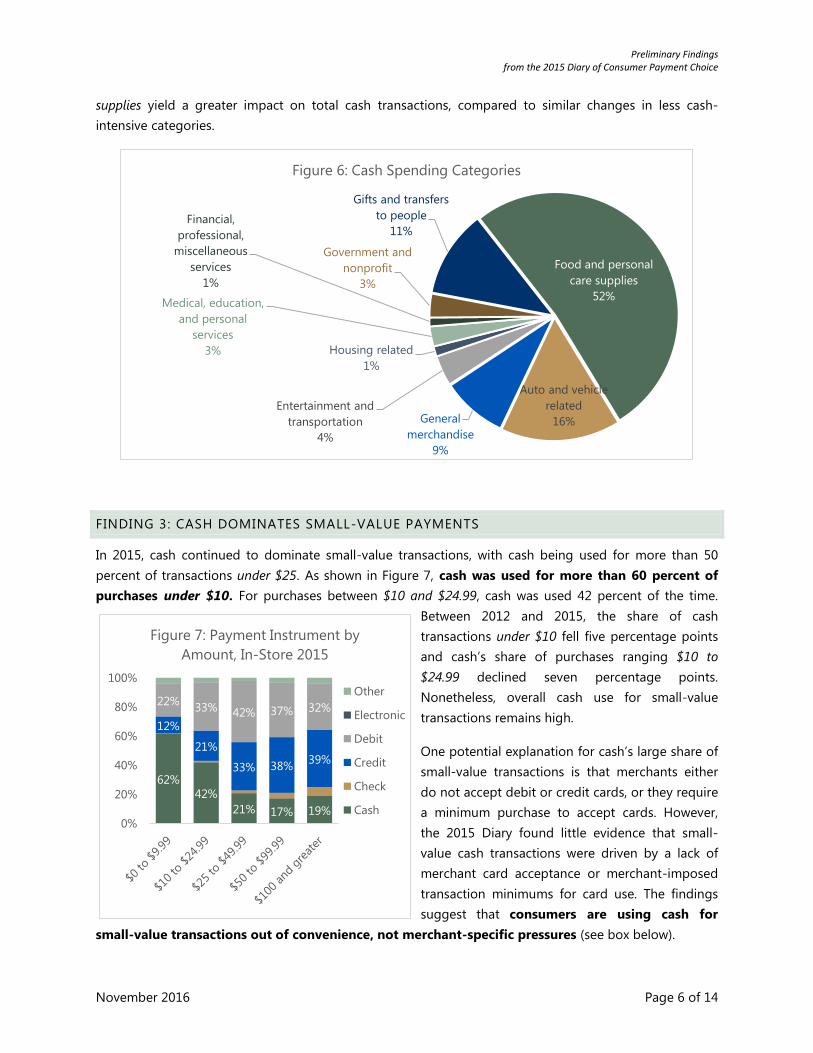
Figure 6 shows the 2015 Diary’s cash transactions and the various merchant categories into which they
fell. Food and personal care supplies, auto- and vehicle-related, general merchandise, and gifts and transfers
to people comprised nearly 90 percent of cash transactions. Together, the data from Figures 5 and 6
highlight an important point: a merchant category may have high cash use, but that category may make
up only a small share of total cash transactions. Using gifts and transfers to people as an example, while 75
percent of P2P transactions were made in cash, only 11 percent of cash transactions were used for P2P
payments. Therefore, changes in cash use for a cash-intensive category like food and personal care
12%
14%
20%
29%
39%
39%
39%
40%
75%
10%
7%
15%
4%
23%
13%
5%
30%
33%
23%
19%
25%
21%
18%
10%
33%
37%
24%
17%
29%
34%
13%
59%
13%
6%
4%
11%
4%
4%
0% 25% 50% 75% 100%
Financial, professional, miscellaneous services
Housing related
General merchandise
Medical, education, and personal services
Entertainment and transportation
Auto and vehicle related
Food and personal care supplies
Government and nonprofit
Gifts and transfers to people
Figure 5: Payment Instrument Use by Spending Category
Cash Check Credit Debit Electronic Other
Preliminary Findings from the 2015 Diary of Consumer Payment Choice
November 2016 Page 6 of 14
62%
42%
21% 17% 19%
12%
21%
33% 38% 39%
22% 33% 42% 37% 32%
0%
20%
40%
60%
80%
100%
Figure 7: Payment Instrument by
Amount, In-Store 2015
Other
Electronic
Debit
Credit
Check
Cash
supplies yield a greater impact on total cash transactions, compared to similar changes in less cash-
intensive categories.
FINDING 3: CASH DOMINATES SMALL-VALUE PAYMENTS
In 2015, cash continued to dominate small-value transactions, with cash being used for more than 50
percent of transactions under $25. As shown in Figure 7, cash was used for more than 60 percent of
purchases under $10. For purchases between $10 and $24.99, cash was used 42 percent of the time.
Between 2012 and 2015, the share of cash
transactions under $10 fell five percentage points
and cash’s share of purchases ranging $10 to
$24.99 declined seven percentage points.
Nonetheless, overall cash use for small-value
transactions remains high.
One potential explanation for cash’s large share of
small-value transactions is that merchants either
do not accept debit or credit cards, or they require
a minimum purchase to accept cards. However,
the 2015 Diary found little evidence that small-
value cash transactions were driven by a lack of
merchant card acceptance or merchant-imposed
transaction minimums for card use. The findings
suggest that consumers are using cash for
small-value transactions out of convenience, not merchant-specific pressures (see box below).
Food and personal
care supplies
52%
Auto and vehicle
related
16% General
merchandise
9%
Entertainment and
transportation
4%
Housing related
1%
Medical, education,
and personal
services
3%
Financial,
professional,
miscellaneous
services
1%
Government and
nonprofit
3%
Gifts and transfers
to people
11%
Figure 6: Cash Spending Categories
Preliminary Findings from the 2015 Diary of Consumer Payment Choice
November 2016 Page 7 of 14
Most in-store transactions (63 percent) fall into the under $25 value range. The large share of purchases in
this price range, combined with consumers’ propensity to use cash for purchases in this price range,
explains why cash is still the most frequently used payment instrument. However, if merchants increase
their online presence and consumers shift shopping activity to electronic and mobile channels, cash’s
share of transactions—including small-value transactions—could decline.
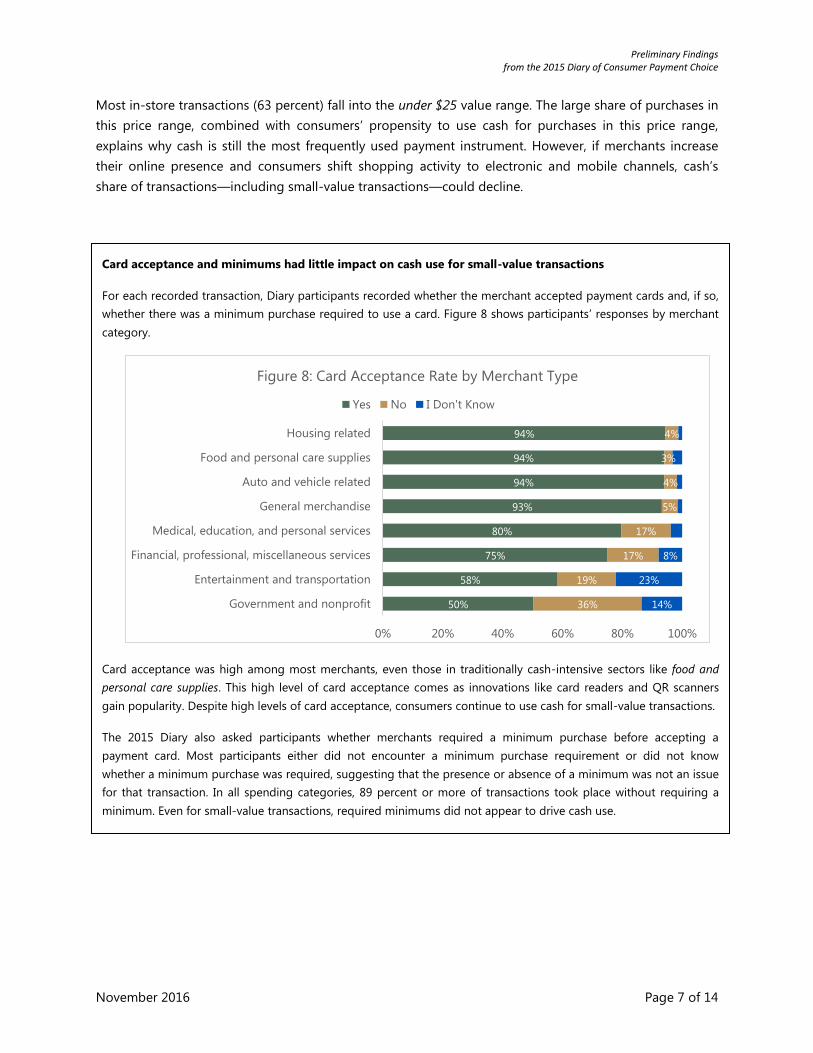
Card acceptance and minimums had little impact on cash use for small-value transactions
For each recorded transaction, Diary participants recorded whether the merchant accepted payment cards and, if so,
whether there was a minimum purchase required to use a card. Figure 8 shows participants’ responses by merchant
category.
Card acceptance was high among most merchants, even those in traditionally cash-intensive sectors like food and
personal care supplies. This high level of card acceptance comes as innovations like card readers and QR scanners
gain popularity. Despite high levels of card acceptance, consumers continue to use cash for small-value transactions.
The 2015 Diary also asked participants whether merchants required a minimum purchase before accepting a
payment card. Most participants either did not encounter a minimum purchase requirement or did not know
whether a minimum purchase was required, suggesting that the presence or absence of a minimum was not an issue
for that transaction. In all spending categories, 89 percent or more of transactions took place without requiring a
minimum. Even for small-value transactions, required minimums did not appear to drive cash use.
50%
58%
75%
80%
93%
94%
94%
94%
36%
19%
17%
17%
5%
4%
3%
4%
14%
23%
8%
0% 20% 40% 60% 80% 100%
Government and nonprofit
Entertainment and transportation
Financial, professional, miscellaneous services
Medical, education, and personal services
General merchandise
Auto and vehicle related
Food and personal care supplies
Housing related
Figure 8: Card Acceptance Rate by Merchant Type
Yes No I Don't Know
Preliminary Findings from the 2015 Diary of Consumer Payment Choice
November 2016 Page 8 of 14
FINDING 4: AVERAGE VALUE OF CONSUMER CASH HOLDINGS INCREASED SLIGHTLY
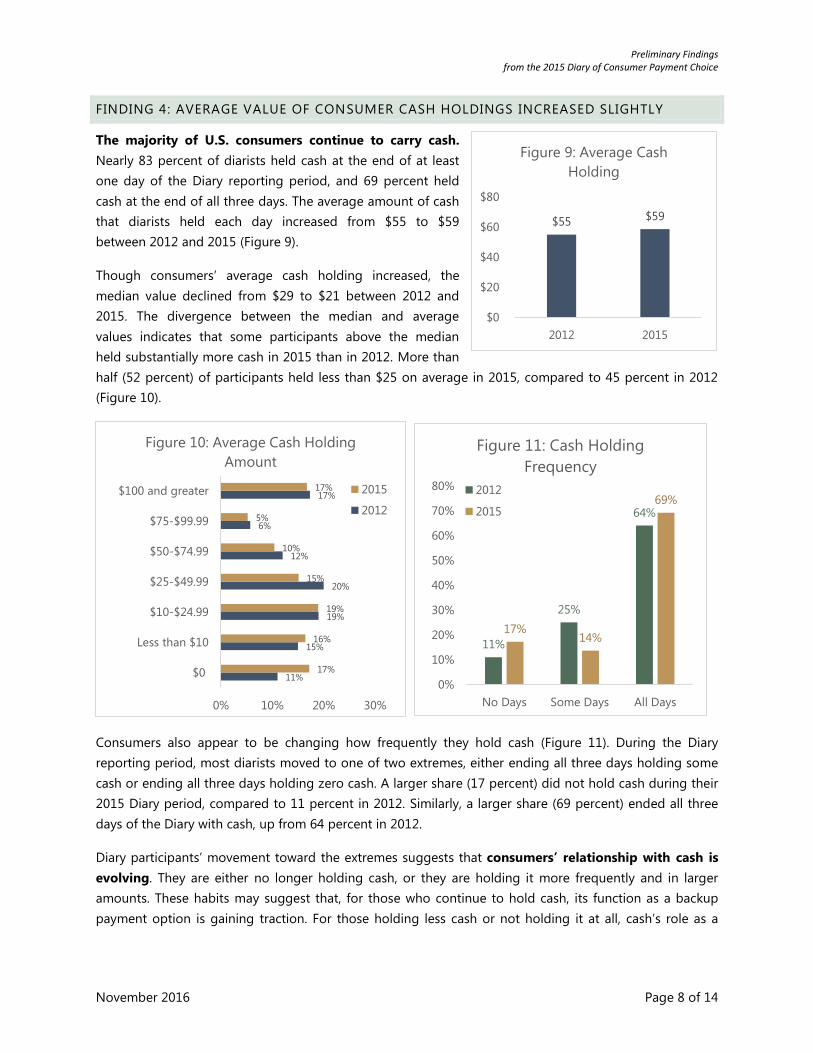
The majority of U.S. consumers continue to carry cash.
Nearly 83 percent of diarists held cash at the end of at least
one day of the Diary reporting period, and 69 percent held
cash at the end of all three days. The average amount of cash
that diarists held each day increased from $55 to $59
between 2012 and 2015 (Figure 9).
Though consumers’ average cash holding increased, the
median value declined from $29 to $21 between 2012 and
2015. The divergence between the median and average
values indicates that some participants above the median
held substantially more cash in 2015 than in 2012. More than
half (52 percent) of participants held less than $25 on average in 2015, compared to 45 percent in 2012
(Figure 10).
Consumers also appear to be changing how frequently they hold cash (Figure 11). During the Diary
reporting period, most diarists moved to one of two extremes, either ending all three days holding some
cash or ending all three days holding zero cash. A larger share (17 percent) did not hold cash during their
2015 Diary period, compared to 11 percent in 2012. Similarly, a larger share (69 percent) ended all three
days of the Diary with cash, up from 64 percent in 2012.
Diary participants’ movement toward the extremes suggests that consumers’ relationship with cash is
evolving. They are either no longer holding cash, or they are holding it more frequently and in larger
amounts. These habits may suggest that, for those who continue to hold cash, its function as a backup
payment option is gaining traction. For those holding less cash or not holding it at all, cash’s role as a
11%
15%
19%
20%
12%
6%
17%
17%
16%
19%
15%
10%
5%
17%
0% 10% 20% 30%
$0
Less than $10
$10-$24.99
$25-$49.99
$50-$74.99
$75-$99.99
$100 and greater
Figure 10: Average Cash Holding
Amount
2015
2012
11%
25%
64%
17% 14%
69%
0%
10%
20%
30%
40%
50%
60%
70%
80%
No Days Some Days All Days
Figure 11: Cash Holding
Frequency
2012
2015
$55 $59
$0
$20
$40
$60
$80
2012 2015
Figure 9: Average Cash
Holding
Preliminary Findings from the 2015 Diary of Consumer Payment Choice
November 2016 Page 9 of 14
51% 59%
8%
18% 12%
22%
23%
45%
26% 26%
6% 6%
0%
20%
40%
60%
80%
100%
Figure 13: Backup
Payment Preferences
Cash
Check
Credit card
Debit card
Other
transactional payment instrument has diminished; for these consumers, cash’s usefulness as a back-up
instrument may not be compelling enough to carry it.
INSIGHTS ON CONSUMERS AND CONSUMER PREFERENCE
INSIGHT 1: CONSUMERS’ STATED PREFERENCES INFLUENCE HOW THEY PAY
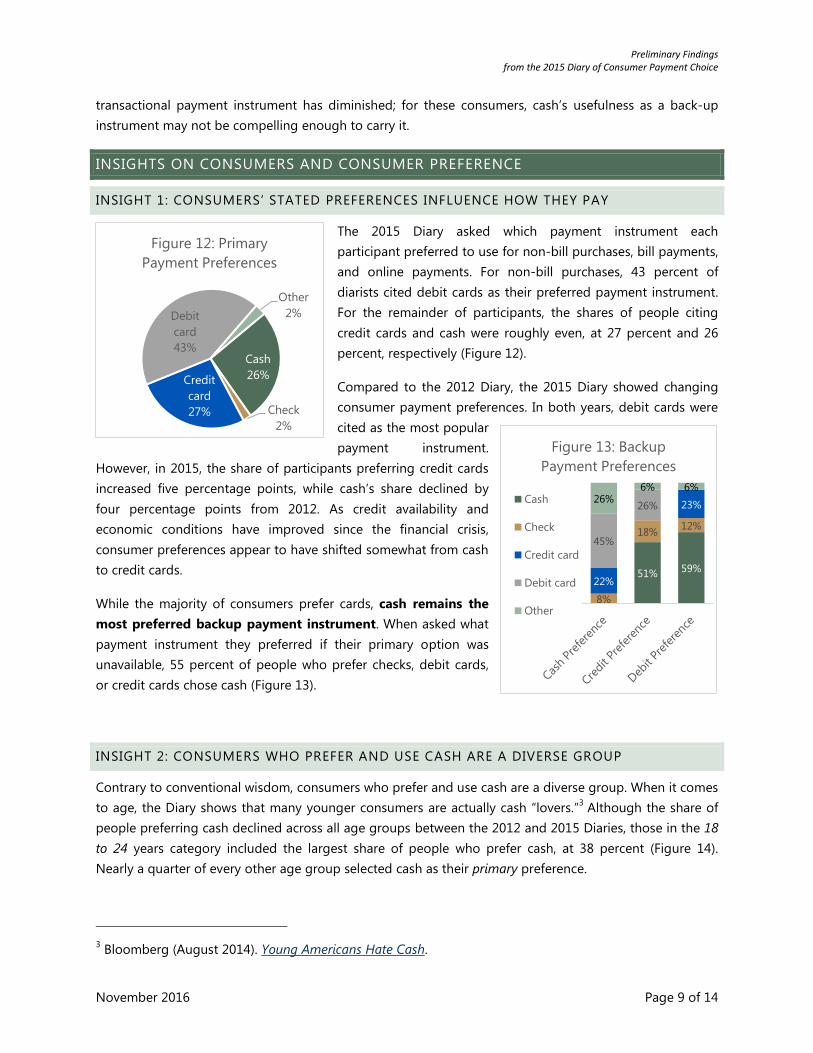
The 2015 Diary asked which payment instrument each
participant preferred to use for non-bill purchases, bill payments,
and online payments. For non-bill purchases, 43 percent of
diarists cited debit cards as their preferred payment instrument.
For the remainder of participants, the shares of people citing
credit cards and cash were roughly even, at 27 percent and 26
percent, respectively (Figure 12).
Compared to the 2012 Diary, the 2015 Diary showed changing
consumer payment preferences. In both years, debit cards were
cited as the most popular
payment instrument.
However, in 2015, the share of participants preferring credit cards
increased five percentage points, while cash’s share declined by
four percentage points from 2012. As credit availability and
economic conditions have improved since the financial crisis,
consumer preferences appear to have shifted somewhat from cash
to credit cards.
While the majority of consumers prefer cards, cash remains the
most preferred backup payment instrument. When asked what
payment instrument they preferred if their primary option was
unavailable, 55 percent of people who prefer checks, debit cards,
or credit cards chose cash (Figure 13).
INSIGHT 2: CONSUMERS WHO PREFER AND USE CASH ARE A DIVERSE GROUP
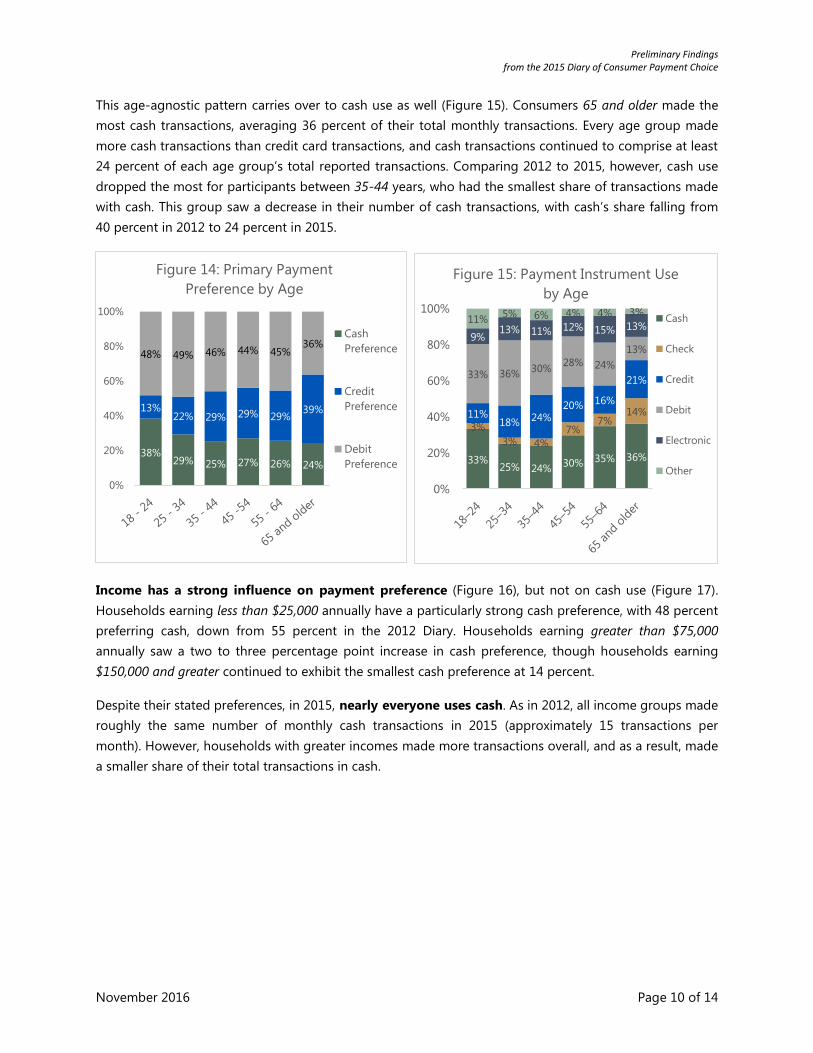
Contrary to conventional wisdom, consumers who prefer and use cash are a diverse group. When it comes
to age, the Diary shows that many younger consumers are actually cash “lovers.”3 Although the share of
people preferring cash declined across all age groups between the 2012 and 2015 Diaries, those in the 18
to 24 years category included the largest share of people who prefer cash, at 38 percent (Figure 14).
Nearly a quarter of every other age group selected cash as their primary preference.
3 Bloomberg (August 2014). Young Americans Hate Cash.
Cash
26%
Check
2%
Credit
card
27%
Debit
card
43%
Other
2%
Figure 12: Primary
Payment Preferences
Preliminary Findings from the 2015 Diary of Consumer Payment Choice
November 2016 Page 10 of 14
This age-agnostic pattern carries over to cash use as well (Figure 15). Consumers 65 and older made the
most cash transactions, averaging 36 percent of their total monthly transactions. Every age group made
more cash transactions than credit card transactions, and cash transactions continued to comprise at least
24 percent of each age group’s total reported transactions. Comparing 2012 to 2015, however, cash use
dropped the most for participants between 35-44 years, who had the smallest share of transactions made
with cash. This group saw a decrease in their number of cash transactions, with cash’s share falling from
40 percent in 2012 to 24 percent in 2015.
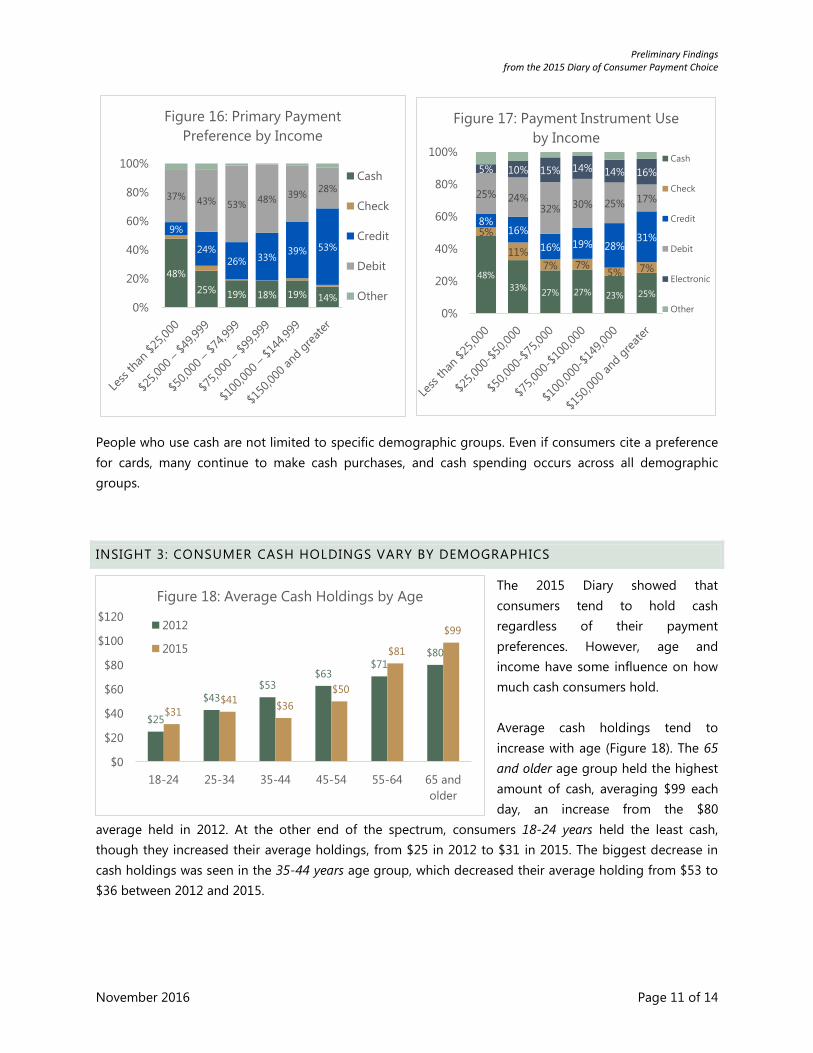
Income has a strong influence on payment preference (Figure 16), but not on cash use (Figure 17).
Households earning less than $25,000 annually have a particularly strong cash preference, with 48 percent
preferring cash, down from 55 percent in the 2012 Diary. Households earning greater than $75,000
annually saw a two to three percentage point increase in cash preference, though households earning
$150,000 and greater continued to exhibit the smallest cash preference at 14 percent.
Despite their stated preferences, in 2015, nearly everyone uses cash. As in 2012, all income groups made
roughly the same number of monthly cash transactions in 2015 (approximately 15 transactions per
month). However, households with greater incomes made more transactions overall, and as a result, made
a smaller share of their total transactions in cash.
38% 29% 25% 27% 26% 24%
13% 22% 29% 29% 29%
39%
48% 49% 46% 44% 45% 36%
0%
20%
40%
60%
80%
100%
Figure 14: Primary Payment
Preference by Age
Cash
Preference
Credit
Preference
Debit
Preference 33% 25% 24%
30% 35% 36%
3%
3% 4%
7% 7%
14% 11% 18% 24%
20% 16%
21% 33% 36%
30% 28% 24%
13% 9%
13% 11% 12% 15% 13% 11%
5% 6% 4% 4% 3%
0%
20%
40%
60%
80%
100%
Figure 15: Payment Instrument Use
by Age
Cash
Check
Credit
Debit
Electronic
Other
Preliminary Findings from the 2015 Diary of Consumer Payment Choice
November 2016 Page 11 of 14
People who use cash are not limited to specific demographic groups. Even if consumers cite a preference
for cards, many continue to make cash purchases, and cash spending occurs across all demographic
groups.
INSIGHT 3: CONSUMER CASH HOLDINGS VARY BY DEMOGRAPHICS
The 2015 Diary showed that
consumers tend to hold cash
regardless of their payment
preferences. However, age and
income have some influence on how
much cash consumers hold.
Average cash holdings tend to
increase with age (Figure 18). The 65
and older age group held the highest
amount of cash, averaging $99 each
day, an increase from the $80
average held in 2012. At the other end of the spectrum, consumers 18-24 years held the least cash,
though they increased their average holdings, from $25 in 2012 to $31 in 2015. The biggest decrease in
cash holdings was seen in the 35-44 years age group, which decreased their average holding from $53 to
$36 between 2012 and 2015.
48%
25% 19% 18% 19% 14%
9%
24%
26% 33% 39% 53%
37% 43% 53%
48% 39%
28%
0%
20%
40%
60%
80%
100%
Figure 16: Primary Payment
Preference by Income
Cash
Check
Credit
Debit
Other
48%
33% 27% 27% 23% 25%
5%
11%
7% 7% 5% 7%
8% 16%
16% 19% 28% 31%
25% 24% 32% 30% 25% 17%
5% 10% 15% 14% 14% 16%
0%
20%
40%
60%
80%
100%
Figure 17: Payment Instrument Use
by Income
Cash
Check
Credit
Debit
Electronic
Other
$25
$43
$53 $63
$71 $80
$31 $41
$36
$50
$81
$99
$0
$20
$40
$60
$80
$100
$120
18-24 25-34 35-44 45-54 55-64 65 and
older
Figure 18: Average Cash Holdings by Age
2012
2015
Preliminary Findings from the 2015 Diary of Consumer Payment Choice
November 2016 Page 12 of 14
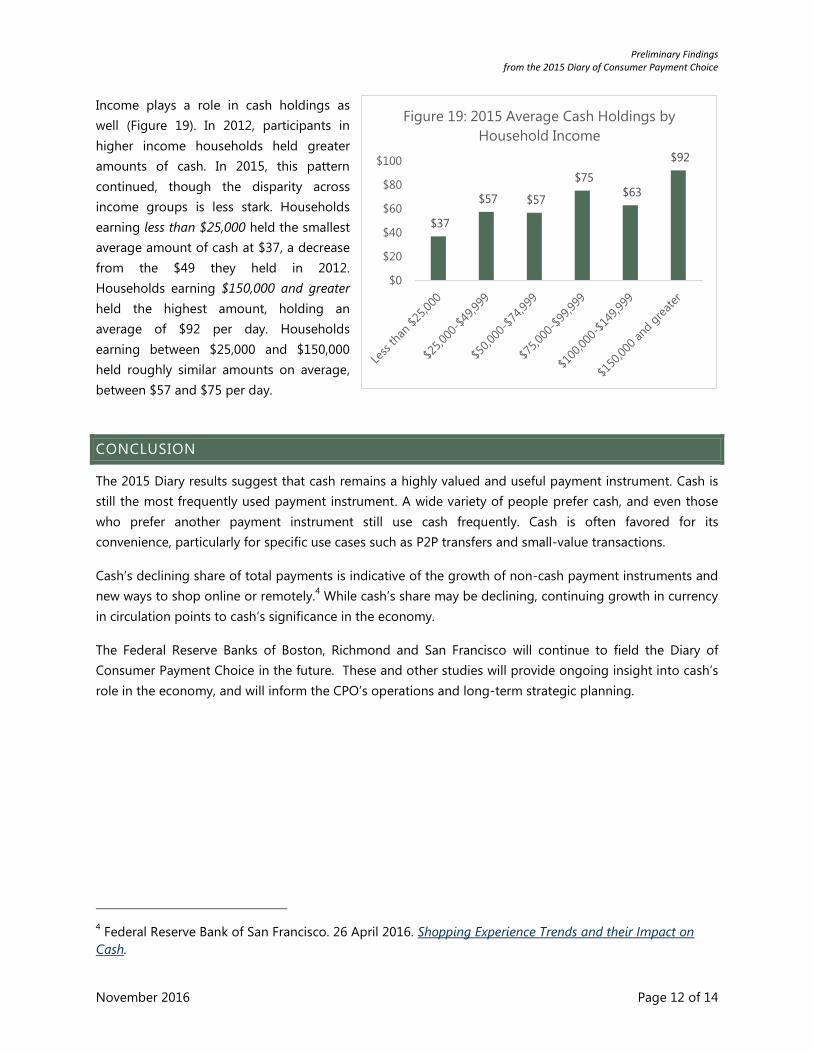
Income plays a role in cash holdings as
well (Figure 19). In 2012, participants in
higher income households held greater
amounts of cash. In 2015, this pattern
continued, though the disparity across
income groups is less stark. Households
earning less than $25,000 held the smallest
average amount of cash at $37, a decrease
from the $49 they held in 2012.
Households earning $150,000 and greater
held the highest amount, holding an
average of $92 per day. Households
earning between $25,000 and $150,000
held roughly similar amounts on average,
between $57 and $75 per day.
CONCLUSION
The 2015 Diary results suggest that cash remains a highly valued and useful payment instrument. Cash is
still the most frequently used payment instrument. A wide variety of people prefer cash, and even those
who prefer another payment instrument still use cash frequently. Cash is often favored for its
convenience, particularly for specific use cases such as P2P transfers and small-value transactions.
Cash’s declining share of total payments is indicative of the growth of non-cash payment instruments and
new ways to shop online or remotely.4 While cash’s share may be declining, continuing growth in currency
in circulation points to cash’s significance in the economy.
The Federal Reserve Banks of Boston, Richmond and San Francisco will continue to field the Diary of
Consumer Payment Choice in the future. These and other studies will provide ongoing insight into cash’s
role in the economy, and will inform the CPO’s operations and long-term strategic planning.
4 Federal Reserve Bank of San Francisco. 26 April 2016. Shopping Experience Trends and their Impact on
Cash.
$37
$57 $57
$75
$63
$92
$0
$20
$40
$60
$80
$100
Figure 19: 2015 Average Cash Holdings by
Household Income
Preliminary Findings from the 2015 Diary of Consumer Payment Choice
November 2016 Page 13 of 14
ABOUT THE DIARY OF CONSUMER PAYMENT CHOICE
The Diary of Consumer Payment Choice is a survey designed to study the purchase and payment behavior
of U.S. consumers. The study is conducted using a nationally representative sample of U.S. consumers. The
second fielding of the Diary of Consumer Payment Choice (Diary) took place from October 16 to
December 15, 2015. Participants were asked to record information on all transactions – purchases, bill
payments, deposits, withdrawals, etc. – conducted during an assigned consecutive three-day period.
The 2015 Diary is the second iteration of a research initiative by the Federal Reserve Banks of Boston,
Richmond, and San Francisco. The initial Diary, conducted in 2012, found that cash was a valuable
payment instrument for a significant portion of consumers and businesses. In the 2012 study, consumers
used cash more frequently than any other payment instrument, and cash played a dominant role for
small-value transactions and for key demographic groups like lower-income consumers.
ABOUT THE CASH PRODUCT OFFICE
As the nation’s central bank, the Federal Reserve ensures that cash is available when and where it is
needed, including in times of crisis and business disruption, by providing FedCash®
Services to depository
institutions and, through them, to the general public. In fulfilling this role, the Fed’s primary responsibility
is to maintain public confidence in the integrity and availability of U.S. currency.
The Federal Reserve System’s Cash Product Office (CPO) provides strategic leadership for this key function
by formulating and implementing service level policies, operational guidance, and technology strategies
for U.S. currency and coin services provided by Federal Reserve Banks nationally and internationally. In
addition to guiding policies and procedures, the CPO establishes budget guidance for FedCash®
Services,
provides support for Federal Reserve currency and coin inventory management, and supports business
continuity planning at the supply chain level. It also conducts market research and works directly with
financial institutions and retailers to analyze trends in cash use.
Preliminary Findings from the 2015 Diary of Consumer Payment Choice
November 2016 Page 14 of 14
APPENDIX
Appendix I
Changes to the 2015 Diary of Consumer Payment Choice Structure
For both the 2012 and 2015 Diaries, participants tracked all transactions (deposits, withdrawals, purchases,
bills, etc.) for an assigned, consecutive three-day period within the observation window. In 2012, the
observation window was the month of October. The 2015 Diary expanded the observation window to two
months, from October 16 to December 15. This extended timeframe allowed researchers to observe
payment choice and purchase behavior through part of the 2015 holiday season.
Approximately 2,500 participants completed the 2012 Diary. Slightly fewer than 1,500 participated in 2015.
To increase the number of observations for the 2015 Diary, 500 of the 1,500 participants took the Diary a
second time, approximately one month after their initial completion. This repeat participation had the
benefit of allowing researchers to assess whether individuals changed their behavior during the holiday
season.
Other additions to the 2015 Diary included:
1. A separate bill payment module at the end of a diarist’s third day to improve bill payment records
during the observed diary period
2. Follow-up questions regarding card acceptance to determine whether individuals were using cash
for convenience or out of necessity
3. Additional preference questions to allow participants to specify different payment preferences
based on transaction value and on whether the purchase took place in-person or not
The 2015 Diary also revealed a marked change in the total number of transactions and small-value
transactions when compared to the inaugural 2012 study. This reduction likely impacts small-value
transactions that took place in-person and had a high probability of cash use. More information about
this reduction can be found in the paper “Measures of Cash Use from a New Payments Diary”
(forthcoming) by the Consumer Payment Research Center located at the Federal Reserve Bank of Boston.