Embed Size (px)
Citation preview

Submitted To:
Prince Willian Sound Science Center 300 Breakwater Avenue
P.O. Box 705 Cordova, Alaska 99574
By:
Shannon & Wilson, Inc. 5430 Fairbanks Street, Suite 3
Anchorage, Alaska 99518 AECC 125
Phone: (907)561-2120
Fax: (206)695-6777 E-mail: [email protected]
100619-001
Preliminary Geotechnical Engineering Report Proposed Prince William Sound Science Center
Cordova, Alaska
November 2018

Preliminary GER, PWSSC Development.docx 100619-001 i
TABLE OF CONTENTS Page
1.0 INTRODUCTION ..................................................................................................................1
2.0 SITE AND PROJECT DESCRIPTION .................................................................................1
3.0 SUBSURFACE EXPLORATIONS .......................................................................................2 3.1 Drilling Explorations ..................................................................................................3 3.2 Geophysical Explorations ..........................................................................................4
4.0 LABORATORY TESTING ...................................................................................................5
5.0 SUBSURFACE CONDITIONS .............................................................................................6 5.1 Results of Drilling Explorations .................................................................................6 5.2 Results of Seismic Refraction Survey ........................................................................8
6.0 GEOLOGIC HAZARDS ........................................................................................................9 6.1 Faulting .......................................................................................................................9 6.2 Seismic Site Conditions .............................................................................................9 6.3 Tsunami ....................................................................................................................10
7.0 PRELIMINARY GEOTECHNICAL CONSIDERATIONS ...............................................10
8.0 CLOSURE/LIMITATIONS .................................................................................................12

TABLE OF CONTENTS (cont.)
Preliminary GER, PWSSC Development.docx 100619-001 ii
FIGURES 1 Vicinity Map 2 Site Plan 3 Soil Description and Log Key (3 Sheets) 4 Rock Classification System 5 Frost Classification Legend 6 Log of Boring B-1 7 Log of Boring B-2 8 Log of Boring B-3 9 Log of Boring B-4 10 Log of Boring B-5 11 Log of Boring B-6 12 Grain Size Classification (4 Sheets) 13 Atterberg Limits Results 14 Seismic Refraction Profiles (2 Sheets) 15 Gradation and Durability Requirements
APPENDICES
A Results of Geophysical Survey by Geotek Alaska, Inc. B Important Information About Your Geotechnical/Environmental Report
Preliminary GER, PWSSC Development.docx 100619-002 1
GEOTECHNICAL ENGINEERING REPORT PROPOSED PRINCE WILLIAM SOUND SCIENCE CENTER
CORDOVA, ALASKA
1.0 INTRODUCTION
This report presents the results of subsurface explorations and laboratory testing conducted by Shannon & Wilson, Inc. (S&W) for the proposed Prince William Sound Science Center (PWSSC) development in Cordova, Alaska. The purpose of this geotechnical study was to observe and document subsurface conditions and present preliminary geotechnical design considerations for the proposed improvements, which generally include construction of new laboratory, maintenance, and dormitory buildings. To accomplish this, we advanced six soil borings and conducted geophysical surveys in portions of the site that could be readily accessed with minimal impacts to the site. Soil samples recovered from the borings were tested in our geotechnical laboratory and engineering studies were performed to support our recommendations for the improvements. Presented in this report are descriptions of the site and project, subsurface exploration and laboratory test procedures, an interpretation of subsurface conditions, and our preliminary geotechnical recommendations.
This report is intended to be used by the owner and its design team to inform the decision to move forward with purchasing the site, and for preliminary design and cost estimating purposes if the site is purchased. Therefore, the recommendations contained in this report are generalized and preliminary in nature. Furthermore, this report is provided with the understanding that detailed engineering analysis will be conducted, and geotechnical engineering recommendations will be provided to support final design as the design progresses.
S&W also conducted a Phase I Environmental Site Assessment (ESA) for the property. The results of the assessment are included on separate cover in our September 14, 2018 report, Phase I Environmental Site Assessment, Proposed Prince William Sound Center, Cordova, Alaska.
Authorization to proceed with this work was received in the form of a Task Order and Master Services Agreement signed by Ms. Katrina Hoffman of PWSSC, on July 27, 2018. Our work was generally performed according to this task order and our June 27, 2018 proposal.
2.0 SITE AND PROJECT DESCRIPTION
The proposed PWSSC development is located along New England Cannery Road, approximately 1.5 miles north of Cordova, Alaska. The legal address for the property is Alaska State Land Survey (ASLS) 2001-5, an approximately 5.2-acre parcel, generally bound by New England

Preliminary GER, PWSSC Development.docx 100619-001 2
Cannery Road on the west, Fleming Creek on the east, and the Fleming Creek Lagoon on the south. Approximately 1.1 acres in the western portion of the property consists of a flat, gravel pad that was being used as recreational vehicle (RV) parking area and tent campground. Based on the aerial photography reviewed for our Phase I ESA, the pad area was created by placing fill in the area between New England Cannery Road and the upland portions of the property, sometime between 1972 and 1976. The 1972 aerial photograph also shows a stranded vessel, reportedly named the Bancroft, in the fill pad area before the area was filled. The vessel was reportedly buried during the fill operation, although no physical records had been provided to S&W at the time of this report. The remaining portions of the property are generally undeveloped and forested, except for an overgrown “jeep” trail that runs approximately 200 feet northeast into the property from behind ‘Campsite 3’. A vicinity map indicating the general project location is presented as Figure 1. A site plan, included as Figure 2, shows prominent site features, functional area boundaries, and the approximate boring locations.
The topography of the site is variable, from relatively flat within the gravel pad area to gently to moderately steep slopes in the upland areas in the northeastern portion of the site. According to a June 22, 2018 survey drawing, ground surface elevations across the property ranged between about 12 and 50 feet relative to the North American Vertical Datum of 1988 (NAVD88). Undeveloped portions of the site are vegetated with moderately dense stands of mature Hemlock trees. The ground surface is generally covered with moss, fallen trees, and other forest detritus.
We understand that the project generally includes construction of three new buildings at the site: 1) An administration/research/education building with a footprint of approximately 8,400 square feet, 2) A warehouse with a footprint of approximately 5,000 square feet, and 3) a dormitory building with a footprint of approximately 3,000 square feet. We understand the buildings will be one to two-story, relatively lightly loaded, wood or steel-framed structures. The structures may be supported on deep or shallow foundations, depending on the structures location on the site (see Section 7.0). Other site improvements likely include utility connections, parking areas, and sidewalks.
3.0 SUBSURFACE EXPLORATIONS
Subsurface explorations for this study consisted of advancing six geotechnical borings and conducting geophysical surveys at the site. The general boring locations were selected by representatives of S&W and PWSSC prior to mobilizing to the field. The borings were generally positioned to provide relatively even coverage of accessible portions of the project area given the difficult access conditions in upland portions of the site. Four of the borings were located within the fill pad area and two of the borings were located along the fringes of the upland areas. The geophysical surveys were focused on a similar area to complement the borehole data.
Preliminary GER, PWSSC Development.docx 100619-001 3
The boring locations shown on Figure 2, were estimated using a handheld global positioning system (GPS) capable of horizontal accuracies of ±20 feet. It should be noted that GPS accuracies may be affected by tree cover, geographic features, and other atmospheric anomalies. Surface elevations shown on the boring logs were estimated from topographic contours shown on the June 22, 2018 site survey drawing by DOWL Engineers. As indicated on the drawing, vertical elevations are adjusted to the NAVD88 vertical datum. Elevations presented in this report are referenced to the NAVD88 datum unless otherwise specified. The boring locations shown on the site plan and the elevations reported on the boring logs should be considered approximate. The seismic refraction line locations, also shown on Figure 2, were recorded using a Leica GS Series RTK GPS rover unit. The GPS points were recorded without a base station and should be considered approximate.
3.1 Drilling Explorations
The borings, designated Borings B-1 through B-6, were advanced at the site on October 16, 2018. Drilling services for this project were provided by Discovery Drilling, Inc. using a truck-mounted CME 85 drill rig. An experienced representative from S&W was present during drilling to locate the borings, observe drill action, collect samples, log subsurface conditions, and observe groundwater conditions.
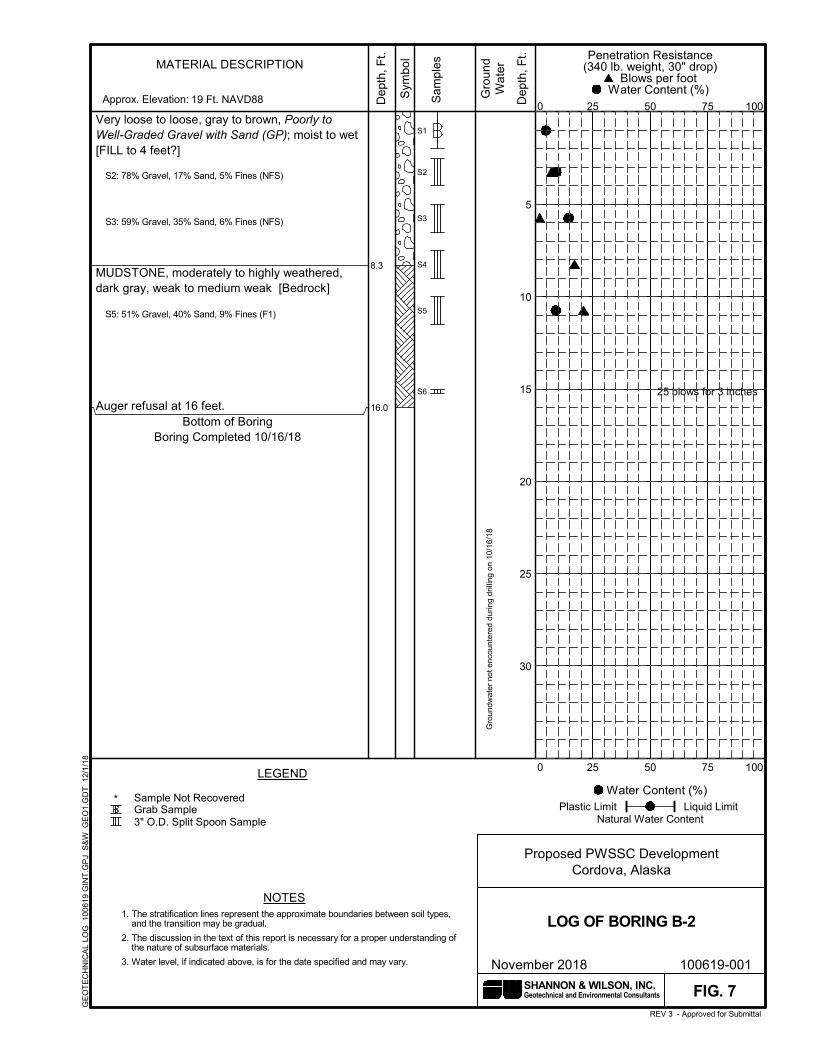
The borings were advanced with 31/4-inch inner diameter (ID), continuous flight, hollow-stem augers to depths ranging between approximately 15 and 31 feet below the ground surface (bgs). As the borings were advanced, samples were typically recovered using modified penetration test (MPT) procedures at 2.5-foot intervals to 10 feet bgs and at 5-foot intervals thereafter. In the MPT method, samples are recovered by driving a 3-inch outer diameter (OD) split-spoon sampler into the bottom of the advancing hole with blows of a 340-pound hammer free falling 30 inches onto the drill rod. The number of blows required to advance the sampler the final 12 inches of an 18-inch penetration or the middle 12 inches of a 24-inch penetration is termed the penetration resistance. Blow counts are shown graphically on the boring log figures as “penetration resistance” and are displayed adjacent to sample depth. The penetration resistance values give a measure of the relative density (compactness) or consistency (stiffness) of cohesionless or cohesive soils, respectively. Where the sampler did not penetrate the full 18 or 24 inches, our logs report the number of blows and corresponding total penetration in inches. In addition to the split-spoon samples, a grab sample of the near-surface soils was collected from the auger cuttings in the upper 2 feet of each boring. After drilling, the borings were backfilled with auger cuttings removed during drilling.
The soils encountered were observed and described in the field in general accordance with the classification system described by ASTM International (ASTM) D2488. Selected samples recovered during drilling were tested in our laboratory to refine our soil descriptions in general

Preliminary GER, PWSSC Development.docx 100619-001 4
accordance with the Unified Soil Classification System (USCS) described in Figure 3. Rock descriptions were made in general accordance with the Alaska Department of Transportation & Public Facilities (ADOT&PF) Alaska Field Rock Classification and Structural Mapping Guide presented on Figure 4. Frost classifications were also estimated for samples based on laboratory testing (sieve analyses and percent passing the No. 200 sieve [P-200]) and are shown on the boring logs. The frost classification system is presented in Figure 5. Summary logs of the borings are presented in Figures 6 through 11.
3.2 Geophysical Explorations
Geophysical explorations conducted at the site consisted of seismic refraction, magnetic, electromagnetic (EM), and ground penetrating radar (GPR) surveys. Data collected during the seismic refraction survey is used to estimate overburden thickness (depth to bedrock) and provide seismic velocities. The purpose of the magnetic, EM, and GPR survey is to investigate the area surveyed for buried refuse, potential soil contamination, and estimate the lateral extent of identified anomalies. The seismic refraction survey was performed by S&W on September 14, 2018. Magnetic, EM, and GPR surveys were conducted by Geotek Alaska, Inc (GTA). October 10 through 12, 2018. The procedures and results of surveys performed by GTA are included in Appendix A. Procedures and results for S&W’s seismic refraction survey are described below and in Section 5.0.
Note that geophysical survey results represent interpretations of subsurface conditions (soil/bedrock contacts, the presence of debris, likely contamination, etc.) from ground surface measurements of a variety of physical properties. These interpretations should be considered indicative of possible conditions and should not be relied upon solely on their own as actual conditions may vary. Conditions should be confirmed through explorations and confirmation during construction.
Seismic refraction allows differentiation of earth materials based on the physical properties of the material (density, bulk modulus, and shear modulus) which affect the seismic velocity of the material. In this instance, the compression or “P-wave” velocity is measured by a string of geophones laid out in a linear array. An energy source, or “shot”, is triggered sending P-waves through the ground. P-waves are the fastest type of seismic wave, and propagate in all directions. P-waves that travel along the ground surface travel the shortest distance to each geophone. However, P-waves that travel deeper into the ground may encounter a material of higher seismic velocity. When a wave encounters a material with different physical properties it may reflect or refract. When the angle of incidence of the wave to the material interface is at the “critical angle”, the wave is refracted along the interface at the velocity of the faster material. Therefore, a wave that travels deeper into the ground may arrive at a geophone before a wave traveling along the surface. By measuring the arrival time of the P-wave at each geophone

Preliminary GER, PWSSC Development.docx 100619-001 5
location and knowing the distance between the shot location and each geophone, we can estimate the average velocity of the underlying materials. Based on the known behavior of waves and Snell’s law, the approximate velocity and depth of each change in soil or rock horizon can be determined, as long as there is an accompanying change in physical properties. It should be noted that the method assumes the compression wave velocity increases with depth. If a slower layer is encountered underlying a faster layer, a velocity inversion occurs and the results of the survey will be difficult to interpret leading to a higher degree of uncertainty in the results.
The seismic refraction survey was performed using a two-man crew. Seismic data was recorded with a Geometrics Geode seismograph connected to a 24-geophone array. A sledgehammer “source” striking a metal plate was used to initiate compression waves (P-Waves) for the survey. Geophone spacing was determined in the field based on available data and project needs at the time of the survey. Geophone spacing was generally 5 to 10 feet. We completed 460 linear feet of seismic refraction at the site over a period of one field day. Lines were positioned in the field to provide coverage where additional subsurface information is desired. The ends of each refraction line were recorded using a Leica GS Series GPS. Elevations of each geophone were not surveyed and the data was processed assuming level ground, which is consistent with the general topography of the areas surveyed.
Analysis of the refraction data was performed using Geometrics SeisImager/2D software and the refraction delay-time (reciprocal) method. Arrival times were identified on the seismic records using Geometrics PickWin software, and all arrival times were manually selected. The approximate locations of the proposed site features, and seismic refraction line are shown on Figure 2.
4.0 LABORATORY TESTING
Laboratory tests were performed on soil samples recovered from the borings to confirm our field classifications and to estimate the index properties of the typical materials encountered at the site. The laboratory testing was formulated with emphasis on estimating natural water content, gradation properties, plasticity, and frost characteristics.
Water content tests were performed on each sample recovered from the borings. The tests were generally conducted according to procedures described in ASTM International (ASTM) D2216. The results of the water content measurements are presented graphically on the boring logs presented as Figures 6 through 11.
Grain size classification (gradation) testing was performed to estimate the particle size distribution of selected samples from the borings. The gradation testing generally followed the procedures described in ASTM C117/C136. The test results are presented on Figure 12 and

Preliminary GER, PWSSC Development.docx 100619-001 6
summarized on the boring logs as percent gravel, percent sand, and percent fines. Percent fines on the boring logs are equal to the sum of the silt and clay fractions indicated by the percent passing the No. 200 sieve. Plasticity characteristics (Atterberg Limits results) are required to differentiate between silt and clay soils under USCS.
Atterberg Limits were evaluated for four samples of cohesive/fine-grained soil encountered during drilling to estimate plasticity characteristics. These tests generally followed procedures described in ASTM D4318. The results are presented on Figure 13 and on the corresponding boring logs.
Organic content tests were performed for three samples collected from our explorations. The purpose of the test is to approximate the relative amount of organic material in a soil sample with respect to the mineral soil component. These tests generally followed procedures described in ASTM D2974. The results of these tests are summarized on the boring logs. We note that additional test steps are required within the Atterberg Limits test procedure to determine if the organic content influences the soil properties, which is needed to support classifying the soil as organic.
5.0 SUBSURFACE CONDITIONS
The subsurface soil conditions encountered in our explorations are presented graphically on the boring logs included in Figures 6 through 11. Results of the geophysical surveys are included on the velocity profiles in Figure 14 and in Appendix A. We note that our explorations were primarily conducted in the fill pad area or other developed portions of the site; as such, near surface soil deposits such as surface organics and other near surface materials that are anticipated in undeveloped portions of the site were not encountered in our borings. Additionally, soil and rock conditions in upland portions of the site may vary from the conditions encountered in our borings.
5.1 Results of Drilling Explorations
In general, our borings encountered 2 to 9.5 feet of sand, gravel, and woody fill underlain by native silts, sands, and gravels. In general, the fills were shallower (4 feet bgs or less) in Borings B-2 and B-3, which were advanced along the edges of the upland areas. Bedrock, or materials interpreted as weathered bedrock, was encountered beneath the native soils at depths ranging between about 5 and 23 feet bgs in Borings B-2, B-3, B-4, and B-5.
Based on visual classifications of samples recovered during drilling and laboratory test results, the fills encountered at the site generally consisted of gravel with varying amounts of fines. In Borings B-5 and B-6, layers of silty sand with plant fibers and wood debris, interpreted as

Preliminary GER, PWSSC Development.docx 100619-001 7
potential fill, were encountered beneath the gravel fills. The fills encountered in the fill pad area were also observed to contain woody debris from about 3.5 to 4 feet bgs to the bottom of the fill, which ranged in depth between 7 and 9.5 feet bgs. In Borings B-1 and B-4, the fill was comprised almost entirely wood debris between about 3.5 to 7 feet bgs. Potential voids were also noted in the wood debris in Boring B-1. Based on penetration resistance values typically less than 10 blows per foot (bpf), the fills encountered by our borings would generally be considered loose. According to our laboratory tests, moisture contents within the fills ranged from about 4 to 32 percent, with higher values typically associated with siltier soils or fills containing organics. Fines contents typically ranged between 5 and 12 percent.
In the upland areas (Borings B-2 and B-3), the fills were underlain by 3 to 4 feet of predominantly granular materials interpreted as native soils. Based on our laboratory testing, these materials generally comprised gravel and silty sand, with fines contents ranging from 6 to 12 percent, for samples subjected to laboratory testing. The fills in the fill pad area were generally underlain by silty soils interpreted as estuarine deposits. Based on the explorations, these deposits extended to depths of about 18 to 26 feet bgs. These materials generally consisted of elastic silt with organics (plant fibers), except in Boring B-5, where the deposit contained sand and gravel constituents. Organic content was typically estimated to range between 10 and 25 percent, by volume, based on visual observations, and between 2.6 and 6.6 percent, by weight, based on our laboratory tests. Based on penetration resistance values ranging from 0 to 4 bpf, these materials are typically very soft to soft. Moisture contents typically ranged between 30 and 63 percent. Atterberg limits results on four, predominantly fine-grained samples from this stratum classified the materials as elastic silt with plasticity indices ranging between 9 and 22. Liquidity indices for samples subjected to Atterberg Limits testing ranged between 0.9 and 1.9. The liquidity index is a ratio used to compare a soils natural water content to its liquid limits and provides indication of how the material will behave in its natural moisture state. A liquidity index greater than 1.0 indicates the natural moisture content of the soil is greater than its liquid limit and the soil may behave in an increasingly flow-type manner.
Sand and gravel soils with various amounts of fines were encountered below the estuarine deposits in the fill pad area. These soils were generally considered loose to very dense and may represent completely weathered bedrock, or reworked glacial or alluvial deposits. One sample of gravel from below the estuarine deposits had a fines content of about 12 percent, based on laboratory testing.
Bedrock was encountered at depths ranging between approximately 5 and 8 feet bgs in Borings B-3 and B-2, respectively, and about 23 feet bgs in Borings B-4 and B-5. Bedrock was not confirmed in the remaining borings, although some of the soils encountered at the bottom of the borings where bedrock was not identified may have resembled completely weathered bedrock. Bedrock observed in samples recovered during drilling generally consisted of moderately to

Preliminary GER, PWSSC Development.docx 100619-001 8
highly weathered, very weak to weak, dark gray mudstone. Note, rock coring was not attempted, and rock samples were recovered with drive sampling techniques only. In some instances, full penetration was possible with the drive sampler, but typical drive samples were only able to penetrate 2 to 6 inches into the rock before refusal. In Borings B-2 and B-3, the augers were able to be advanced 8 to 10 feet into the rock before auger refusal was reached. While drilling and sampling would suggest the upper portion of the rock at the site is relatively weak it should be noted that intact rock strength or ripability cannot be directly correlated to drive sample results or drill action.
Groundwater may have been encountered at depths of about 26 and 18 feet bgs in Borings B-1 and B-5, respectively, but was not encountered in the remaining borings. We note that the presence of groundwater was difficult to discern during drilling due to the generally low permeability materials encountered during drilling. Water levels at the site are likely influenced by tidal fluctuations and may also fluctuate by several feet seasonally or during periods of high precipitation or rapid snow melt.
5.2 Results of Seismic Refraction Survey
The results of the seismic refraction survey are presented on Figure 14, Sheets 1 and 2. In general the seismic refraction records contained relatively clean data. However, attenuation of the source signal was problematic at the site. Signal attenuation can be caused by very soft soils that lower the frequency of the compression wave resulting in broader waves that result in some ambiguity when picking first arrivals. Additionally, the wood debris in the fill and very soft native silt soils may have created a slow velocity layer below the upper layers of gravelly fill, resulting in a velocity inversion. This inversion can have an unpredictable impact on the refraction of the seismic waves during the survey and subsequent analysis of the data collected. Therefore, the results of the refraction survey should be used with caution.
Interpretation of the refraction lines was difficult given the uncertainty in the validity of the data. Based on the models as interpreted, and presented on Figure 14, Line L1 encountered a low velocity layer at the ground surface typically consistent with a medium dense to dense soil. The primary refractor was an approximately 5,900-foot per second (fps) layer, which generally dips from north to south along the line. This layer has a velocity consistent with moderately weathered bedrock, or saturated soils. In general, the dip of the layer is different than anticipated based upon our borings, however, we do not have any borings immediately adjacent to Line L1.
Line L2, which runs west to east along the north side of the site did not encounter any refractors consistent with a bedrock layer. A poor-quality refractor, potentially corresponding with an increase in relative density or stiffness of the soil was observed along the line, dipping from west

Preliminary GER, PWSSC Development.docx 100619-001 9
to east and is shown on Figure 14. This is generally consistent with our borings which typically encountered rock deeper that the approximately 25-foot depth of investigation of the survey.
Line L3 contained the highest quality data and shows a low velocity 1,520 fps layer at the ground surface, consistent with fill materials encountered in the area. A relatively strong refractor was observed dipping from east to west with a compression wave velocity of approximately 7,070 fps. This velocity would be consistent with moderately weathered bedrock and generally agrees with Boring B-3, drilled in the general vicinity of Line L3 at approximately 30 feet along the line.
6.0 GEOLOGIC HAZARDS
Southcentral Alaska is one of the most seismically active areas in the United States and historically subjected to large (greater than 6.0 Magnitude) earthquakes. In 1964, the region experienced the largest recorded earthquake in North America, the Great Alaskan Earthquake, with a Moment Magnitude (M) of 9.2. The earthquake occurred in the northeast section of the Aleutian Megathrust which resulted in an estimated 100,000 square mile area of surface deformation, including the Cordova area. Post-earthquake measurements indicated the ground surface in the Cordova region was permanently uplifted about 6 feet as a result of this deformation, which wreaked havoc on port facilities and disrupted navigation in Orca Inlet. As such, the most significant geologic hazards at the site, in our opinion, are related to seismic activity and its effects. These effects include seismically induced ground failure (ie. surface rupture, faulting, lateral spreading, liquefaction, and landslides) and tsunami.
6.1 Faulting
According to geologic maps by the United States Geologic Survey (USGS), the Cordova Fault runs adjacent to the southeastern edge of the site. The fault is visible on aerial photographs as a well-defined linear feature striking southwestward from Power Creek (on the north arm of Eyak Lake), through Crater Lake (above the site), down Fleming Creek, and then across Orca Inlet to Hawkins Island. The fault is not well understood but it is postulated the fault is part of a group of potentially inactive faults that splay southwestward from the Contact Fault System north of Cordova. These splay faults are thought to mark the boundaries of successive tectonic accretionary landmasses. Displacement along these splay faults is thought to be relatively minor based on correlations with similar structures in the region east of Prince William Sound.
6.2 Seismic Site Conditions
Based on our explorations and engineering judgment, the site class according to the 2012 International Building Code (IBC) will be B for a soil profile with shallow bedrock in the upland
Preliminary GER, PWSSC Development.docx 100619-001 10
portions of the site where the building structures will be positioned. Based on general observations of the surrounding topography and subsurface conditions encountered in our borings, seismically induced liquefaction, slope failure, and surface rupture are unlikely at this site. Based on the ground motions in Figures 1613.3.1(4) and 1613.3.1(5), IBC 2012, the mapped spectral accelerations for short-period (Ss) and 1-second period (S1) were estimated at 1.509 and 0.801 g, respectively. The site class B, site specific modifying coefficients for the spectral response accelerations are FA = 1.0 and Fv = 1.0 for the short and long periods, respectively. Consequently, SMS and SM1 for site class B were calculated to be 1.509 and 0.801 g, respectively, and the corresponding SDS and SD1 are 1.006 and 0.694 g, respectively.
We conducted a brief seismic hazard analysis of the site using software developed by the United States Geological Survey (USGS) to calculate the peak ground acceleration (PGA). According to this software, the calculated PGA for the site is 0.81 g. This value is roughly equivalent to what would be calculated using probabilistic estimates of ground motions with a 2 percent probability of exceedance in 50 years (2,475-year return period). The corresponding earthquake magnitude is M9.2.
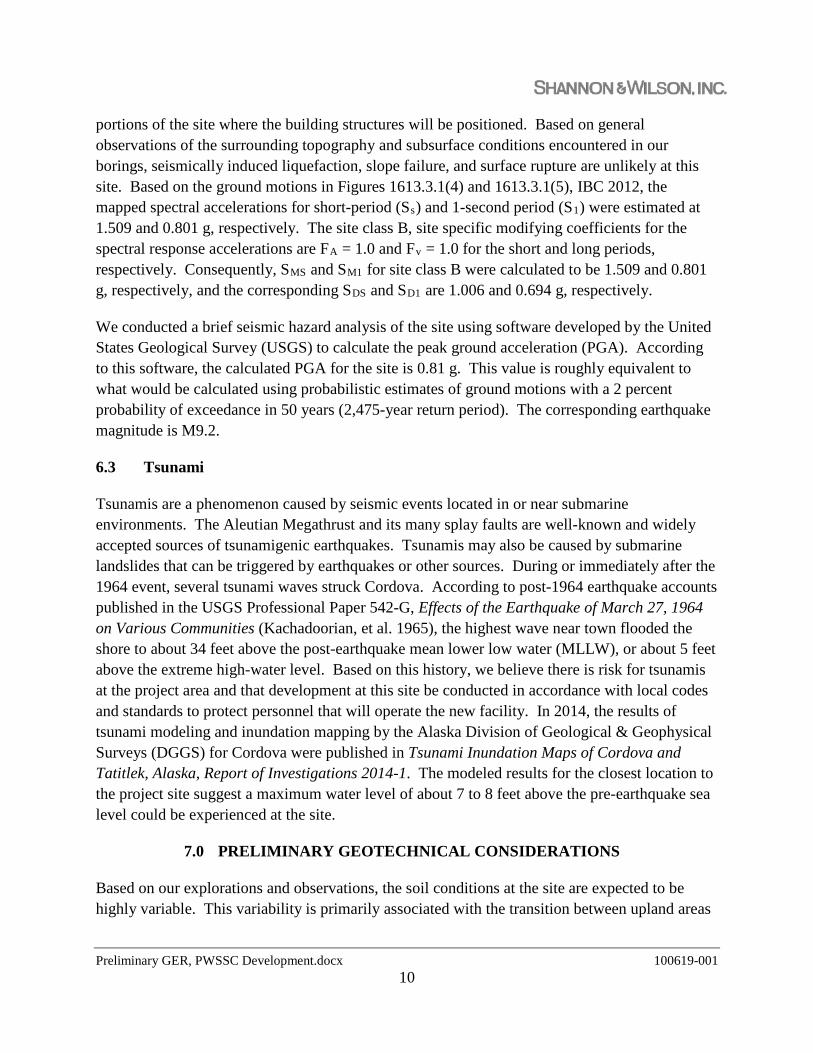
6.3 Tsunami
Tsunamis are a phenomenon caused by seismic events located in or near submarine environments. The Aleutian Megathrust and its many splay faults are well-known and widely accepted sources of tsunamigenic earthquakes. Tsunamis may also be caused by submarine landslides that can be triggered by earthquakes or other sources. During or immediately after the 1964 event, several tsunami waves struck Cordova. According to post-1964 earthquake accounts published in the USGS Professional Paper 542-G, Effects of the Earthquake of March 27, 1964 on Various Communities (Kachadoorian, et al. 1965), the highest wave near town flooded the shore to about 34 feet above the post-earthquake mean lower low water (MLLW), or about 5 feet above the extreme high-water level. Based on this history, we believe there is risk for tsunamis at the project area and that development at this site be conducted in accordance with local codes and standards to protect personnel that will operate the new facility. In 2014, the results of tsunami modeling and inundation mapping by the Alaska Division of Geological & Geophysical Surveys (DGGS) for Cordova were published in Tsunami Inundation Maps of Cordova and Tatitlek, Alaska, Report of Investigations 2014-1. The modeled results for the closest location to the project site suggest a maximum water level of about 7 to 8 feet above the pre-earthquake sea level could be experienced at the site.
7.0 PRELIMINARY GEOTECHNICAL CONSIDERATIONS
Based on our explorations and observations, the soil conditions at the site are expected to be highly variable. This variability is primarily associated with the transition between upland areas

Preliminary GER, PWSSC Development.docx 100619-001 11
and portions of the site where fills have been placed over former tidelands. Borings B-2 and B-3, which were advanced in the campsite access driveways along the edge of the uplands, encountered 5 to 8 feet of granular fill and native soil overlying weathered bedrock. Explorations were not conducted in undeveloped upland areas due to difficult access; however, several feet of organics and silty topsoil overlying unconsolidated glacial deposits and bedrock are anticipated there. Our explorations in the fill pad area generally encountered 7 to 9.5 feet of granular soil and wood fill overlying very soft, elastic silt containing organics and loose to medium dense, granular materials to depths typically ranging from about 17 feet bgs to beyond the depth of explorations. It should be noted that buried debris, other than wood, could be present in filled portions of the site even though it was not observed in our borings, as indicated by the results of the EM, magnetic, and GPR surveys. Granular materials encountered below the silt were generally interpreted as reworked glacial or alluvial deposits or completely weathered bedrock. Moderately to highly weathered bedrock was encountered in Borings B-4 and B-5 in the fill pad area at about 23 feet bgs.
The existing woody fills and underlying soft, compressible soils encountered by our explorations in the filled portions of the site should be considered unsuitable for support of buildings, or other structures that are sensitive to settlement. There is a potential for adverse settlements (potentially on the order of several feet depending on the applied loads) caused by consolidation of compressible soils once the building loads are applied, and/or from long-term decay of organic material in the subsurface. Because of the depth of unsuitable soils in portions of the site, overexcavating the unsuitable materials and replacing the material with a structural fill is not considered a feasible option in these areas. The approximate area where deep foundations (likely driven piles) are recommended is shown on the site plan in Figure 2. New structures in the upland portions of the site can likely be supported on conventional shallow concrete foundations as long as the upper layers of unsuitable soil are removed (organic, soft, or loose soils) and the footings bear directly on bedrock or relatively firm, unyielding mineral soils.
For preliminary design purposes, the minimum footing width for shallow foundations should be assumed to be 16 inches for continuous strip footings and 24 inches for spread footings. We recommend assuming that perimeter footings in heated building be placed a minimum of 42 inches below the ground surface. For interior footings in heated areas, footings may be placed directly below the floor slab such that embedment is 12 inches or more below the finished floor elevation. If portions of buildings are to be unheated, the minimum burial depth for footings should be increased to 5 feet bgs for frost protection.
For pile foundations, pile types and sizes must be selected based on vertical and lateral load requirements, degree of fixity, settlement, and pile-driving considerations. Based on our experiences on similar projects and given the subsurface conditions at the site, we anticipate that piles for the project will likely consist of 6- to 24-inch diameter, open-ended, steel pipe piles.

Preliminary GER, PWSSC Development.docx 100619-001 12
The piles will likely need to be embedded at least 10 feet into dense soils or weathered bedrock below the soft soil layer to develop sufficient lateral, axial, and uplift support for relatively lightly loaded, pile supported structures. Based on our explorations, the bedrock depth varies greatly across the site, especially at the transition from between filled areas and uplands. Where shallow bedrock is encountered, we recommend that the piles be socketed into the rock or drilled out and advanced a minimum of 15 feet into the bedrock to satisfy uplift and lateral load requirements. Pile embedment will be dependent on the actual design loads. Buildings should not be supported on combinations of shallow and pile foundations due to the risk of differing settlement profiles and lateral load response.
The existing fill material encountered during drilling comes close to meeting but generally does not meet the gradation requirements for Selected Material Type A structural fill as these soils contain more than 6 percent fines along with various amounts of woody debris. Fills containing debris (woody or other) are unsuitable for reuse as structural fill beneath buildings or other structures. Fills that do not contain woody debris may could potentially be used as structural fill beneath a structure or in the structural section for parking area structural sections, depending on the anticipated traffic loading and performance expectations. Gradation and durability requirements for typical borrow materials that will be used at the site are included in Figure 15.
Recommendations and considerations herein are based on our interpretation of the subsurface data collected at the site, and our understanding of the project and preliminary design concepts at the time of this report. These considerations are intended to be used by the owner and its design team to inform the decision to move forward with purchasing the site, and for preliminary design and cost estimating purposed once the site is purchased. Therefore, the recommendations contained in this report are generalized and preliminary in nature. This report is provided with the understanding that detailed engineering analysis will be conducted and geotechnical engineering recommendations will be provided to support final design as the site layout and design progresses.
8.0 CLOSURE/LIMITATIONS
This report was prepared for the exclusive use of our client, PWSSC, and their representatives for evaluating the site as it relates to the geotechnical aspects discussed herein. The analyses and conclusions contained in this report are based on site conditions as they presently exist. It is assumed that the exploratory borings are representative of the subsurface conditions throughout the site, i.e., the subsurface conditions everywhere are not significantly different from those disclosed by the explorations.
If there is a substantial lapse of time between the submittal of this report and the start of work at the site, or if conditions have changed due to natural causes or construction operations at or


Sources: Esri, HERE, DeLorme, Intermap, increment P Corp.,GEBCO, USGS, FAO, NPS, NRCAN, GeoBase, IGN, KadasterNL, Ordnance Survey, Esri Japan, METI, Esri China (Hong Kong),swisstopo, MapmyIndia, © OpenStreetMap contributors, and theGIS User Community
Proposed PWSSC DevelopmentCordova, Alaska
November 2018
VICINITY MAP
FIG. 1100619-001
Approximate Project Area
CordovaCANADA
ALASKA
N
0 1 2
Miles
Cordova

Approximate Property Boundary
Fleming Creek
B-3
B-6
B-5
B-1
B-4
B-2
Inferred limits of unsuitable
soils extending greater than
10 feet bgs (see Note 3)
?
?
?
?
?
?
?
L2
L3
L3
L1
L1
L2
0
2
3
0
0
1
1
5
L
1
L
2
1
1
5
0
L
3
Approximate Possible Location of
Buried Vessel, Bancroft (see Note 4)
Approximate Location
of "Jeep Trail"
Campsite #1
Campsite #2
Campsite #3
LEGEND
B-1
NOTES
1. Map adapted from June 22, 2018 site survey drawing by DOWL
Engineers and provided by PWSSC.
2. Background imagery provided by Quantum Spatial, Inc. Image
Date, June 29, 2002.
3. Pile foundations are recommended for structures located west of
this boundary. Boundary inferred based on interpretations made
from historical images and extrapolations based on the results of
our subsurface investigation and should be considered
approximate.
4. The potential location of the vessel Bancroft was inferred based
on 1972 aerial imagery from Quantum Spatial, and anecdotal
evidence that the vessel was buried during filling the site.
Anomalies in the geophysical data suggest that the boat may be
30 to 40 feet north of the location shown on this map (see
Appendix A).
Approximate Location of Boring B-1, Advanced by Shannon
& Wilson, October 2018
Approximate location of seismic refraction Line L1 (length =
230 feet). Survey performed by Shannon & Wilson,
September 2018
Geotechnical and Environmental Consultants
SHANNON & WILSON, INC.
SITE PLAN
FIG. 2
Proposed PWSSC Development
Cordova, Alaska
November 2018 101619-001
L1
0230

November 2018 100619-001
Proposed PWSSC DevelopmentCordova, Alaska
BentoniteCement Grout
Bentonite Grout
Bentonite Chips
Silica Sand
Perforated orScreened Casing
MOISTURE CONTENT TERMS
Modifying(Secondary)
Precedes majorconstituent
Major
MinorFollows major
constituent
1All percentages are by weight of total specimen passing a 3-inch sieve.2The order of terms is: Modifying Major with Minor.3Determined based on behavior.4Determined based on which constituent comprises a larger percentage.5Whichever is the lesser constituent.
COARSE-GRAINEDSOILS
(less than 50% fines)1
NOTE: Penetration resistances (N-values) shown on boring logs are as recorded in the field and have not been corrected for hammer efficiency, overburden, or other factors.
PARTICLE SIZE DEFINITIONS
RELATIVE DENSITY / CONSISTENCYSand or Gravel 4
30% or morecoarse-grained:
Sandy or Gravelly 4
More than 12%fine-grained:
Silty or Clayey 3
15% to 30%coarse-grained:with Sand orwith Gravel 4
30% or more totalcoarse-grained and
lesser coarse-grained constituent
is 15% or more:with Sand orwith Gravel 5
Geotechnical and Environmental ConsultantsSHANNON & WILSON, INC.
Very softSoftMedium stiffStiffVery stiffHard
Very looseLooseMedium denseDenseVery dense
RELATIVEDENSITY
FINE-GRAINED SOILS(50% or more fines)1
COHESIVE SOILS
< 22 - 44 - 8
8 - 1515 - 30
> 30
1Gravel, sand, and fines estimated by mass. Other constituents, such asorganics, cobbles, and boulders, estimated by volume.
2Reprinted, with permission, from ASTM D2488 - 09a Standard Practice forDescription and Identification of Soils (Visual-Manual Procedure), copyrightASTM International, 100 Barr Harbor Drive, West Conshohocken, PA 19428.A copy of the complete standard may be obtained from ASTM International,www.astm.org.
140 pounds with a 30-inch free fall.Rope on 6- to 10-inch-diam. cathead2-1/4 rope turns, > 100 rpm
NOTE: If automatic hammers areused, blow counts shown on boringlogs should be adjusted to account forefficiency of hammer.
10 to 30 inches longShoe I.D. = 1.375 inchesBarrel I.D. = 1.5 inchesBarrel O.D. = 2 inches
Sum blow counts for second and third6-inch increments.Refusal: 50 blows for 6 inches orless; 10 blows for 0 inches.
RELATIVECONSISTENCY
N, SPT,BLOWS/FT.
5% to 12%fine-grained:with Silt orwith Clay 3
15% or more of asecond coarse-
grained constituent:with Sand orwith Gravel 5
< 5%
5 to 10%
15 to 25%
30 to 45%
50 to 100%
Surface CementSeal
Asphalt or Cap
Slough
Inclinometer orNon-perforated Casing
Vibrating WirePiezometer
N, SPT,BLOWS/FT.
Sheet 1 of 3
< 44 - 10
10 - 3030 - 50
> 50
DESCRIPTION
< #200 (0.075 mm = 0.003 in.)
#200 to #40 (0.075 to 0.4 mm; 0.003 to 0.02 in.)#40 to #10 (0.4 to 2 mm; 0.02 to 0.08 in.)#10 to #4 (2 to 4.75 mm; 0.08 to 0.187 in.)
SIEVE NUMBER AND/OR APPROXIMATE SIZE
#4 to 3/4 in. (4.75 to 19 mm; 0.187 to 0.75 in.)3/4 to 3 in. (19 to 76 mm)
3 to 12 in. (76 to 305 mm)
> 12 in. (305 mm)
FineCoarse
FineMediumCoarse
BOULDERS
COBBLES
GRAVEL
FINES
SAND
S&W INORGANIC SOIL CONSTITUENT DEFINITIONS
CONSTITUENT2
SOIL DESCRIPTIONAND LOG KEY
COHESIONLESS SOILS
Silt, Lean Clay,Elastic Silt, or
Fat Clay 3
PERCENTAGES TERMS 1, 2
Trace
Few
Little
Some
Mostly
WELL AND BACKFILL SYMBOLS
Absence of moisture, dusty, dryto the touch
Damp but no visible water
Visible free water, from belowwater table
FIG. 3
Shannon & Wilson, Inc. (S&W), uses a soilidentification system modified from the UnifiedSoil Classification System (USCS). Elements ofthe USCS and other definitions are provided onthis and the following pages. Soil descriptionsare based on visual-manual procedures (ASTMD2488) and laboratory testing procedures(ASTM D2487), if performed.
STANDARD PENETRATION TEST (SPT)SPECIFICATIONS
Hammer:
Sampler:
N-Value:
Dry
Moist
Wet
2013
_BO
RIN
G_C
LAS
S1
10
0619
GIN
T.G
PJ
SW
NE
W.G
DT
11/
29/
18

November 2018 100619-001
Proposed PWSSC DevelopmentCordova, Alaska
Clayey Gravel; Clayey Gravel withSand
Gravels
Primarily organic matter, dark incolor, and organic odor
SW
(more than 12%fines)
Silts and Clays
Silts and Clays
(more than 50%retained on No.
200 sieve)
(50% or more ofcoarse fraction
passes the No. 4sieve)
(liquid limit lessthan 50)
(liquid limit 50 ormore)
GC
SC
Inorganic
Organic
(more than 50%of coarse
fraction retainedon No. 4 sieve)
MAJOR DIVISIONS GROUP/GRAPHICSYMBOL
CH
OH
ML
CL
TYPICAL IDENTIFICATIONS
Gravel
Sand
Silty Sand; Silty Sand with Gravel
Clayey Sand; Clayey Sand with Gravel
Organic
Inorganic
FINE-GRAINEDSOILS
SM
Sands
Silty or ClayeyGravel
Silt; Silt with Sand or Gravel; Sandy orGravelly Silt
Organic Silt or Clay; Organic Silt orClay with Sand or Gravel; Sandy orGravelly Organic Silt or Clay
HIGHLY-ORGANIC
SOILS
COARSE-GRAINED
SOILS
OL
(less than 5%fines)
GW
(less than 5%fines)
PT
Well-Graded Gravel; Well-GradedGravel with Sand
Poorly Graded Gravel; Poorly GradedGravel with Sand
Lean Clay; Lean Clay with Sand orGravel; Sandy or Gravelly Lean Clay
NOTES
1. Dual symbols (symbols separated by a hyphen, i.e., SP-SM, Sandwith Silt) are used for soils with between 5% and 12% fines or whenthe liquid limit and plasticity index values plot in the CL-ML area ofthe plasticity chart. Graphics shown on the logs for these soil typesare a combination of the two graphic symbols (e.g., SP and SM).
2. Borderline symbols (symbols separated by a slash, i.e., CL/ML,Lean Clay to Silt; SP-SM/SM, Sand with Silt to Silty Sand) indicatethat the soil properties are close to the defining boundary betweentwo groups.
Peat or other highly organic soils (seeASTM D4427)
Geotechnical and Environmental ConsultantsSHANNON & WILSON, INC. FIG. 3
(more than 12%fines)
MH
SP
GP
GM
Silty orClayey Sand
Silty Gravel; Silty Gravel with Sand
(50% or morepasses the No.
200 sieve)
SOIL DESCRIPTIONAND LOG KEY
Elastic Silt; Elastic Silt with Sand orGravel; Sandy or Gravelly Elastic Silt
Fat Clay; Fat Clay with Sand or Gravel;Sandy or Gravelly Fat Clay
Organic Silt or Clay; Organic Silt orClay with Sand or Gravel; Sandy orGravelly Organic Silt or Clay
Poorly Graded Sand; Poorly GradedSand with Gravel
Well-Graded Sand; Well-Graded Sandwith Gravel
Sheet 2 of 32013
_BO
RIN
G_C
LAS
S2
10
0619
GIN
T.G
PJ
SW
NE
W.G
DT
11/
29/
18
NOTE: No. 4 size = 4.75 mm = 0.187 in.; No. 200 size = 0.075 mm = 0.003 in.
UNIFIED SOIL CLASSIFICATION SYSTEM (USCS)(Modified From USACE Tech Memo 3-357, ASTM D2487, and ASTM D2488)

November 2018 100619-001
Proposed PWSSC DevelopmentCordova, Alaska
Angular
Subangular
Subrounded
Rounded
Flat
Elongated
Sharp edges and unpolished planarsurfaces.
Similar to angular, but with roundededges.
Nearly planar sides with well-roundededges.
Smoothly curved sides with no edges.
Width/thickness ratio > 3.
Length/width ratio > 3.
Narrow range of grain sizes presentor, within the range of grain sizespresent, one or more sizes aremissing (Gap Graded). Meets criteriain ASTM D2487, if tested.Full range and even distribution ofgrain sizes present. Meets criteria inASTM D2487, if tested.
Crumbles or breaks with handling orslight finger pressureCrumbles or breaks with considerablefinger pressureWill not crumble or break with fingerpressure
Weak
Moderate
Strong
VISUAL-MANUAL CRITERIAA 1/8-in. thread cannot be rolledat any water content.A thread can barely be rolled anda lump cannot be formed whendrier than the plastic limit.A thread is easy to roll and notmuch time is required to reach theplastic limit. The thread cannot bererolled after reaching the plasticlimit. A lump crumbles when drierthan the plastic limit.It take considerable time rollingand kneading to reach the plasticlimit. A thread can be rerolledseveral times after reaching theplastic limit. A lump can beformed without crumbling whendrier than the plastic limit.
FIG. 3
Interbedded
Laminated
Fissured
Slickensided
Blocky
Lensed
Homogeneous
Alternating layers of varying material or colorwith layers at least 1/4-inch thick; singular: bed.Alternating layers of varying material or colorwith layers less than 1/4-inch thick; singular:lamination.Breaks along definite planes or fractures withlittle resistance.Fracture planes appear polished or glossy;sometimes striated.Cohesive soil that can be broken down intosmall angular lumps that resist furtherbreakdown.Inclusion of small pockets of different soils,such as small lenses of sand scattered througha mass of clay.Same color and appearance throughout.
At Time of DrillingDiameterElevationFeetIron OxideGallonsHorizontalHollow Stem AugerInside DiameterInchesPoundsMagnesium OxideMillimeterManganese OxideNot Applicable or Not AvailableNonplasticOutside DiameterObservation WellPounds per Cubic FootPhoto-Ionization DetectorPressuremeter TestParts per MillionPounds per Square InchPolyvinyl ChlorideRotations per MinuteStandard Penetration TestUnified Soil Classification SystemUnconfined Compressive StrengthVibrating Wire PiezometerVerticalWeight of HammerWeight of RodsWeight
ATDDiam.Elev.
ft.FeOgal.
Horiz.HSAI.D.in.
lbs.MgOmm
MnONANP
O.D.OWpcf
PIDPMTppm
psiPVCrpmSPT
USCSqu
VWPVert.
WOHWOR
Wt.
STRUCTURE TERMS1
SOIL DESCRIPTIONAND LOG KEY
1Reprinted, with permission, from ASTM D2488 - 09a Standard Practice forDescription and Identification of Soils (Visual-Manual Procedure), copyright ASTMInternational, 100 Barr Harbor Drive, West Conshohocken, PA 19428. A copy ofthe complete standard may be obtained from ASTM International, www.astm.org.2Adapted, with permission, from ASTM D2488 - 09a Standard Practice forDescription and Identification of Soils (Visual-Manual Procedure), copyright ASTMInternational, 100 Barr Harbor Drive, West Conshohocken, PA 19428. A copy ofthe complete standard may be obtained from ASTM International, www.astm.org.
GRADATION TERMS
APPROX.PLASITICTY
INDEXRANGE
< 4
4 to 10
10 to 20
> 20
PARTICLE ANGULARITY AND SHAPE TERMS1
SHANNON & WILSON, INC.Sheet 3 of 3
ACRONYMS AND ABBREVIATIONSPoorly Graded
Well-Graded
Irregular patches of different colors.
Soil disturbance or mixing by plants oranimals.
Nonsorted sediment; sand and gravelin silt and/or clay matrix.
Material brought to surface by drilling.
Material that caved from sides ofborehole.
Disturbed texture, mix of strengths.
Mottled
Bioturbated
Diamict
Cuttings
Slough
Sheared
DESCRIPTIONNonplastic
Low
Medium
High
ADDITIONAL TERMS
Geotechnical and Environmental Consultants
PLASTICITY2
CEMENTATION TERMS1
2013
_BO
RIN
G_C
LAS
S3
10
0619
GIN
T.G
PJ
SW
NE
W.G
DT
11/
29/
18


SHANNON & WILSON, INC.
FROST CLASSIFICATION(after Municipality of Anchorage, 2007)
GROUP P-200* USC SYSTEM
NFSGravelly Soils 0 to 6 GW, GP, GW-GM, GP-GM
F1
Sandy Soils
Gravelly Soils 6 to 13
SW, SP, SW-SM, SP-SM
GM, GW-GM, GP-GM
F2Sandy Soils
Gravelly Soils
6 to 19
13 to 25
SP-SM, SW-SM, SM
GM
F3
Sands, except very
Gravelly Soils
Over 19
Over 25
SM, SC
GM, GC
fine silty sands**
Clays, PI>12 CL, CH
All Silts
Very fine silty sands**
Clays, PI<12
Varved clays andother
fined grained, bandedsediments
F4
Over 19
ML, MH
SM, SC
CL, CL-ML
CL and MLCL, ML, and SM;SL, SH, and ML;
CL, CH, ML, and SM
0.02 Mil.
3 to 15
10 to 20
Over 15
Over 20
Over 15
(based on P-200 results)
3 to 10
0 to 3
0 to 3 0 to 6
PI = Plasticity indexP-200 = Percent passing the number 200 sieve0.02 Mil. = Percent material below 0.02 millimeter grain size
*Approximate P-200 value equivalent for frost classification. Value range based on typical, well-graded soil curves. ** Very fine sand : greater than 50% of sand fraction passing the number 100 sieve
SHANNON & WILSON, INC.Geotechnical & Environmental Consultants
FROST CLASSIFICATION LEGEND
November 2018
FIG. 5100619-001
Proposed PWSSC DevelopmentCordova, Alaska
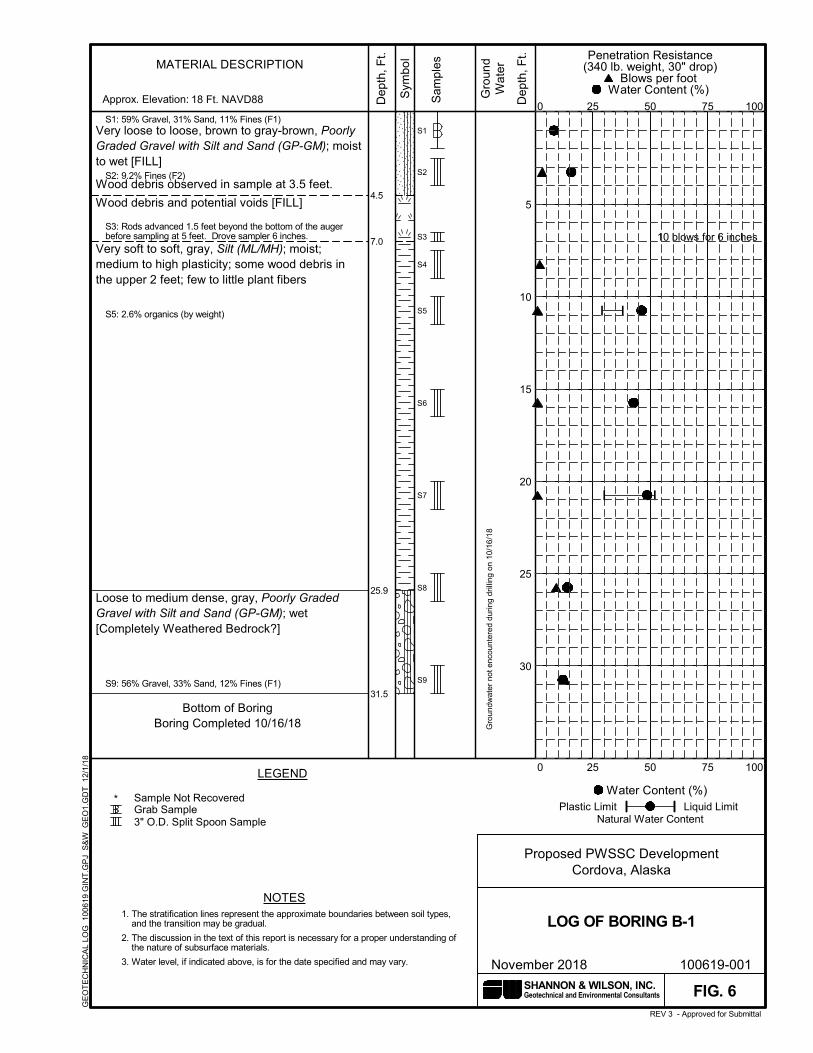
Bottom of BoringBoring Completed 10/16/18
4.5
7.0
25.9
31.5
S1: 59% Gravel, 31% Sand, 11% Fines (F1)
S2: 9.2% Fines (F2)
S3: Rods advanced 1.5 feet beyond the bottom of the augerbefore sampling at 5 feet. Drove sampler 6 inches.
S5: 2.6% organics (by weight)
S9: 56% Gravel, 33% Sand, 12% Fines (F1)
S1
S2
S3
S4
S5
S6
S7
S8
S9
10 blows for 6 inches
Very loose to loose, brown to gray-brown, PoorlyGraded Gravel with Silt and Sand (GP-GM); moistto wet [FILL]
Wood debris observed in sample at 3.5 feet.
Wood debris and potential voids [FILL]
Very soft to soft, gray, Silt (ML/MH); moist;medium to high plasticity; some wood debris inthe upper 2 feet; few to little plant fibers
Loose to medium dense, gray, Poorly GradedGravel with Silt and Sand (GP-GM); wet[Completely Weathered Bedrock?]
LOG OF BORING B-1
REV 3 - Approved for Submittal
1. The stratification lines represent the approximate boundaries between soil types,and the transition may be gradual.
Grab Sample
3. Water level, if indicated above, is for the date specified and may vary.
Liquid Limit
FIG. 6
50
5
10
15
20
25
30
Gro
und
Wat
er
Dep
th, F
t.
SHANNON & WILSON, INC.
LEGEND 25
100619-001
2. The discussion in the text of this report is necessary for a proper understanding ofthe nature of subsurface materials.
100
Plastic Limit
MATERIAL DESCRIPTION
Geotechnical and Environmental Consultants
3" O.D. Split Spoon Sample
Dep
th, F
t.
0
* Sample Not Recovered
Sam
ples
November 2018
75 18 Ft. NAVD88
Natural Water Content
50
Water Content (%)
100
Sym
bol
0
Penetration Resistance(340 lb. weight, 30" drop)
Blows per foot Water Content (%)
25
NOTES
Gro
undw
ater
not
enc
ount
ere
d du
ring
dri
lling
on
10/1
6/1
8
Approx. Elevation:
75
Proposed PWSSC DevelopmentCordova, Alaska
GE
OT
EC
HN
ICA
L LO
G 1
006
19 G
INT
.GP
J S
&W
_GE
O1.
GD
T 1
2/1/
18
Bottom of BoringBoring Completed 10/16/18
8.3
16.0
S2: 78% Gravel, 17% Sand, 5% Fines (NFS)
S3: 59% Gravel, 35% Sand, 6% Fines (NFS)
S5: 51% Gravel, 40% Sand, 9% Fines (F1)
S1
S2
S3
S4
S5
S6 25 blows for 3 inches
Very loose to loose, gray to brown, Poorly toWell-Graded Gravel with Sand (GP); moist to wet[FILL to 4 feet?]
MUDSTONE, moderately to highly weathered,dark gray, weak to medium weak [Bedrock]
Auger refusal at 16 feet.
LOG OF BORING B-2
REV 3 - Approved for Submittal
1. The stratification lines represent the approximate boundaries between soil types,and the transition may be gradual.
Grab Sample
3. Water level, if indicated above, is for the date specified and may vary.
Liquid Limit
FIG. 7
50
5
10
15
20
25
30
Gro
und
Wat
er
Dep
th, F
t.
SHANNON & WILSON, INC.
LEGEND 25
100619-001
2. The discussion in the text of this report is necessary for a proper understanding ofthe nature of subsurface materials.
100
Plastic Limit
MATERIAL DESCRIPTION
Geotechnical and Environmental Consultants
3" O.D. Split Spoon Sample
Dep
th, F
t.
0
* Sample Not Recovered
Sam
ples
November 2018
75 19 Ft. NAVD88
Natural Water Content
50
Water Content (%)
100
Sym
bol
0
Penetration Resistance(340 lb. weight, 30" drop)
Blows per foot Water Content (%)
25
NOTES
Gro
undw
ater
not
enc
ount
ere
d du
ring
dri
lling
on
10/1
6/1
8
Approx. Elevation:
75
Proposed PWSSC DevelopmentCordova, Alaska
GE
OT
EC
HN
ICA
L LO
G 1
006
19 G
INT
.GP
J S
&W
_GE
O1.
GD
T 1
2/1/
18

Bottom of BoringBoring Completed 10/16/18
2.0
5.0
15.1
S2: 32% Gravel, 52% Sand, 16% Fines (F2)
S1
S2
S3
S4
S5
S6
62 blows for 11 inches
37 blows for 6 inches
55 blows for 6 inches
15 blows for 1 inch
Loose, gray to brown, Poorly Graded Gravel withSand (GP); moist to wet [FILL]
Medium dense, brown, Silty Sand with Gravel(SM); moist
MUDSTONE, moderately to highly weathered,dark gray, weak to medium weak [Bedrock]
LOG OF BORING B-3
REV 3 - Approved for Submittal
1. The stratification lines represent the approximate boundaries between soil types,and the transition may be gradual.
Grab Sample
3. Water level, if indicated above, is for the date specified and may vary.
Liquid Limit
FIG. 8
50
5
10
15
20
25
30
Gro
und
Wat
er
Dep
th, F
t.
SHANNON & WILSON, INC.
LEGEND 25
100619-001
2. The discussion in the text of this report is necessary for a proper understanding ofthe nature of subsurface materials.
100
Plastic Limit
MATERIAL DESCRIPTION
Geotechnical and Environmental Consultants
3" O.D. Split Spoon Sample
Dep
th, F
t.
0
* Sample Not Recovered
Sam
ples
November 2018
75 21 Ft. NAVD88
Natural Water Content
50
Water Content (%)
100
Sym
bol
0
Penetration Resistance(340 lb. weight, 30" drop)
Blows per foot Water Content (%)
25
NOTES
Gro
undw
ater
not
enc
ount
ere
d du
ring
dri
lling
on
10/1
6/1
8
Approx. Elevation:
75
Proposed PWSSC DevelopmentCordova, Alaska
GE
OT
EC
HN
ICA
L LO
G 1
006
19 G
INT
.GP
J S
&W
_GE
O1.
GD
T 1
2/1/
18

Bottom of BoringBoring Completed 10/16/18
3.8
7.0
17.5
23.0
25.3
S1: 58% Gravel, 31% Sand, 11% Fines (F1)
S4: 4.6% organics (by weight),65.5% Fines (F4)
S1
S2
S3
S4
S5
S6
S7
S8
42 blows for 6 inches
35 blows for 3.5 inches
Medium dense, gray to brown, Poorly GradedGravel with Silt and Sand (GP-GM); wet [FILL]
Wood debris [FILL]
Very soft to soft, gray, Silt (ML/MH); moist;medium to high plasticity; few to little plant fibers
Very dense, gray, Silty Sand with Gravel (SM);moist [Completely Weathered Bedrock?]
MUDSTONE, moderately to highly weathered,dark gray, medium weak [Bedrock]
LOG OF BORING B-4
REV 3 - Approved for Submittal
1. The stratification lines represent the approximate boundaries between soil types,and the transition may be gradual.
Grab Sample
3. Water level, if indicated above, is for the date specified and may vary.
Liquid Limit
FIG. 9
50
5
10
15
20
25
30
Gro
und
Wat
er
Dep
th, F
t.
SHANNON & WILSON, INC.
LEGEND 25
100619-001
2. The discussion in the text of this report is necessary for a proper understanding ofthe nature of subsurface materials.
100
Plastic Limit
MATERIAL DESCRIPTION
Geotechnical and Environmental Consultants
3" O.D. Split Spoon Sample
Dep
th, F
t.
0
* Sample Not Recovered
Sam
ples
November 2018
75 18 Ft. NAVD88
Natural Water Content
50
Water Content (%)
100
Sym
bol
0
Penetration Resistance(340 lb. weight, 30" drop)
Blows per foot Water Content (%)
25
NOTES
Gro
undw
ater
not
enc
ount
ere
d du
ring
dri
lling
on
10/1
6/1
8
Approx. Elevation:
75
Proposed PWSSC DevelopmentCordova, Alaska
GE
OT
EC
HN
ICA
L LO
G 1
006
19 G
INT
.GP
J S
&W
_GE
O1.
GD
T 1
2/1/
18
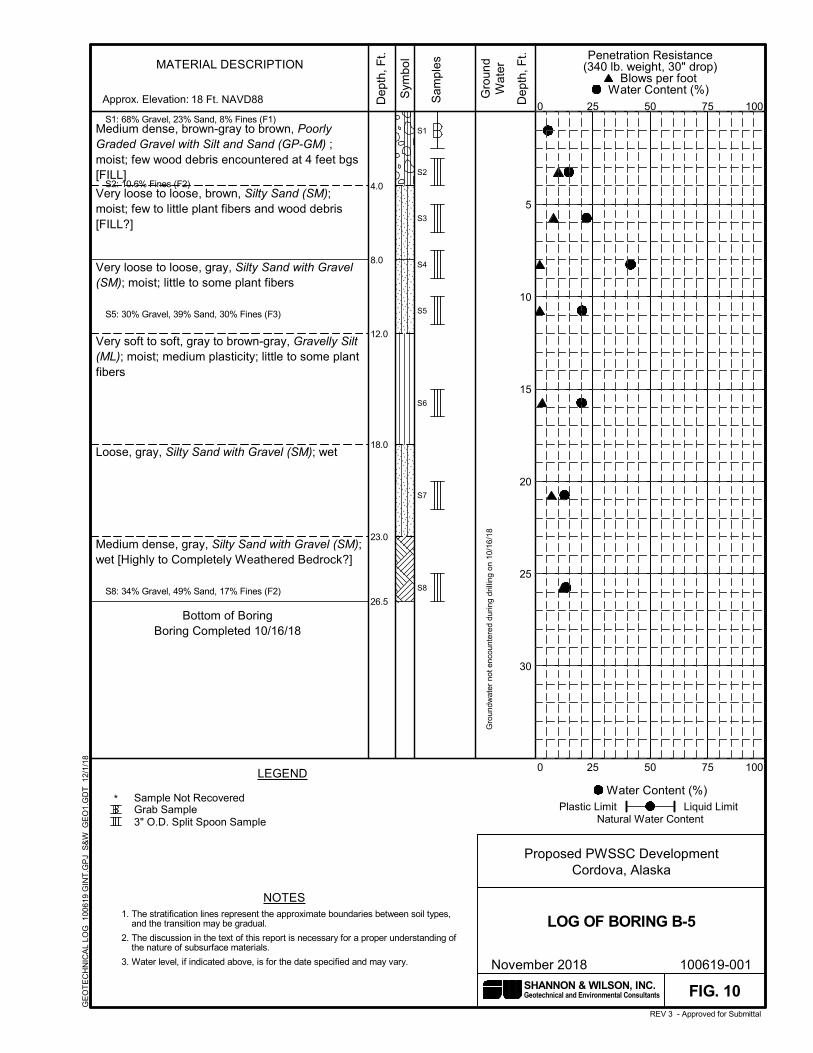
Bottom of BoringBoring Completed 10/16/18
4.0
8.0
12.0
18.0
23.0
26.5
S1: 68% Gravel, 23% Sand, 8% Fines (F1)
S2: 10.6% Fines (F2)
S5: 30% Gravel, 39% Sand, 30% Fines (F3)
S8: 34% Gravel, 49% Sand, 17% Fines (F2)
S1
S2
S3
S4
S5
S6
S7
S8
Medium dense, brown-gray to brown, PoorlyGraded Gravel with Silt and Sand (GP-GM) ;moist; few wood debris encountered at 4 feet bgs[FILL]
Very loose to loose, brown, Silty Sand (SM);moist; few to little plant fibers and wood debris[FILL?]
Very loose to loose, gray, Silty Sand with Gravel(SM); moist; little to some plant fibers
Very soft to soft, gray to brown-gray, Gravelly Silt(ML); moist; medium plasticity; little to some plantfibers
Loose, gray, Silty Sand with Gravel (SM); wet
Medium dense, gray, Silty Sand with Gravel (SM);wet [Highly to Completely Weathered Bedrock?]
LOG OF BORING B-5
REV 3 - Approved for Submittal
1. The stratification lines represent the approximate boundaries between soil types,and the transition may be gradual.
Grab Sample
3. Water level, if indicated above, is for the date specified and may vary.
Liquid Limit
FIG. 10
50
5
10
15
20
25
30
Gro
und
Wat
er
Dep
th, F
t.
SHANNON & WILSON, INC.
LEGEND 25
100619-001
2. The discussion in the text of this report is necessary for a proper understanding ofthe nature of subsurface materials.
100
Plastic Limit
MATERIAL DESCRIPTION
Geotechnical and Environmental Consultants
3" O.D. Split Spoon Sample
Dep
th, F
t.
0
* Sample Not Recovered
Sam
ples
November 2018
75 18 Ft. NAVD88
Natural Water Content
50
Water Content (%)
100
Sym
bol
0
Penetration Resistance(340 lb. weight, 30" drop)
Blows per foot Water Content (%)
25
NOTES
Gro
undw
ater
not
enc
ount
ere
d du
ring
dri
lling
on
10/1
6/1
8
Approx. Elevation:
75
Proposed PWSSC DevelopmentCordova, Alaska
GE
OT
EC
HN
ICA
L LO
G 1
006
19 G
INT
.GP
J S
&W
_GE
O1.
GD
T 1
2/1/
18

Bottom of BoringBoring Completed 10/16/18
7.0
9.5
25.7
26.5
S1: 65% Gravel, 26% Sand, 8% Fines (F1)
S3: 12.2% Fines (F1)
S6: 6.6% organics (by weight)
S1
S2
S3
S4
S5
S6
S7
S8
Loose to dense, gray to brown, Silty Sand withGravel (SM) to Poorly Graded Gravel with Sand(GW); moist to wet; wood debris in the bottom 2feet [FILL]
Loose, brown, Silty Sand (SM); moist to wet; fewto little plant fibers and wood debris [FILL?]
Very soft to soft, gray, Silt (ML/MH); moist;medium to high plasticity; trace shells; few tosome plant fibers
Loose, gray, Silty Sand (SM); moist
LOG OF BORING B-6
REV 3 - Approved for Submittal
1. The stratification lines represent the approximate boundaries between soil types,and the transition may be gradual.
Grab Sample
3. Water level, if indicated above, is for the date specified and may vary.
Liquid Limit
FIG. 11
50
5
10
15
20
25
30
Gro
und
Wat
er
Dep
th, F
t.
SHANNON & WILSON, INC.
LEGEND 25
100619-001
2. The discussion in the text of this report is necessary for a proper understanding ofthe nature of subsurface materials.
100
Plastic Limit
MATERIAL DESCRIPTION
Geotechnical and Environmental Consultants
3" O.D. Split Spoon Sample
Dep
th, F
t.
0
* Sample Not Recovered
Sam
ples
November 2018
75 18 Ft. NAVD88
Natural Water Content
50
Water Content (%)
100
Sym
bol
0
Penetration Resistance(340 lb. weight, 30" drop)
Blows per foot Water Content (%)
25
NOTES
Gro
undw
ater
not
enc
ount
ere
d du
ring
dri
lling
on
10/1
6/1
8
Approx. Elevation:
75
Proposed PWSSC DevelopmentCordova, Alaska
GE
OT
EC
HN
ICA
L LO
G 1
006
19 G
INT
.GP
J S
&W
_GE
O1.
GD
T 1
2/1/
18

0
10
20
30
40
50
60
70
80
90
100
0.0010.010.11101001,000
2 #601/2
SH
AN
NO
N &
WIL
SO
N, IN
C.
#20#4
fine
PE
RC
EN
T F
INE
R B
Y W
EIG
HT
SILT OR CLAY
12
GRAIN SIZE IN MILLIMETERS
4
fine
Geotechnical and Environm
ental Consultants
COBBLES
1
U.S. SIEVE NUMBERS
3/8
SAND
36 3/4 #10 #200
medium
#40
U.S. SIEVE OPENING IN INCHES
1 1/2
coarse coarse
HYDROMETER
#100
GRAVEL
1/4
PI
11.93
8.13
27.38
0.0 - 1.5
30.0 - 31.5
2.5 - 4.0
196.4
215.1
45.2
Depth, Ft0.0 - 1.5
30.0 - 31.5
2.5 - 4.0
75
37.5
75 0.61
D60 %ClayD10
Classification
FIG
. 12
%Gravel
31
33
17
Sh
eet 1 of 4
Sample CcDepth, Ft
Proposed P
WS
SC
Developm
entC
ordova, Alaska
Novem
ber 2018100619
-001
Cu
D100 %Silt
4.2
13.1
4.0
LL
Poorly Graded Gravel with Silt and Sand (GP-GM)
Poorly Graded Gravel with Silt and Sand (GP-GM)
Poorly Graded Gravel with Sand (GP)
Sample59
56
78
1.75
2.01
8.14
D30
PL
%SandB-1 S1
B-1 S9
B-2 S2
11
12
5
GR
AIN
SIZ
E C
LA
SS
IFIC
AT
ION
B-1 S1
B-1 S9
B-2 S2

0
10
20
30
40
50
60
70
80
90
100
0.0010.010.11101001,000
2 #601/2
SH
AN
NO
N &
WIL
SO
N, IN
C.
#20#4
fine
PE
RC
EN
T F
INE
R B
Y W
EIG
HT
SILT OR CLAY
12
GRAIN SIZE IN MILLIMETERS
4
fine
Geotechnical and Environm
ental Consultants
COBBLES
1
U.S. SIEVE NUMBERS
3/8
SAND
36 3/4 #10 #200
medium
#40
U.S. SIEVE OPENING IN INCHES
1 1/2
coarse coarse
HYDROMETER
#100
GRAVEL
1/4
PI
9.01
6.81
3.23
5.0 - 6.5
10.0 - 11.5
2.5 - 4.0
28.5
71.5
Depth, Ft5.0 - 6.5
10.0 - 11.5
2.5 - 4.0
37.5
37.5
37.5
0.32
0.1
D60 %ClayD10
Classification
FIG
. 12
%Gravel
35
40
52
Sh
eet 2 of 4
Sample CcDepth, Ft
Proposed P
WS
SC
Developm
entC
ordova, Alaska
Novem
ber 2018100619
-001
Cu
D100 %Silt
2.6
4.0
LL
Well-Graded Gravel with Silt and Sand (GW-GM)
Poorly Graded Gravel with Silt and Sand (GP-GM)
Silty Sand with Gravel (SM)
Sample59
51
32
2.73
1.6
0.56
D30
PL
%SandB-2 S3
B-2 S5
B-3 S2
6
9
16
GR
AIN
SIZ
E C
LA
SS
IFIC
AT
ION
B-2 S3
B-2 S5
B-3 S2

0
10
20
30
40
50
60
70
80
90
100
0.0010.010.11101001,000
2 #601/2
SH
AN
NO
N &
WIL
SO
N, IN
C.
#20#4
fine
PE
RC
EN
T F
INE
R B
Y W
EIG
HT
SILT OR CLAY
12
GRAIN SIZE IN MILLIMETERS
4
fine
Geotechnical and Environm
ental Consultants
COBBLES
1
U.S. SIEVE NUMBERS
3/8
SAND
36 3/4 #10 #200
medium
#40
U.S. SIEVE OPENING IN INCHES
1 1/2
coarse coarse
HYDROMETER
#100
GRAVEL
1/4
PI
11.27
16.95
2.52
0.0 - 2.0
0.0 - 2.0
10.0 - 11.5
189.0
118.6
Depth, Ft0.0 - 2.0
0.0 - 2.0
10.0 - 11.5
75
75
37.5
0.14
D60 %ClayD10
Classification
FIG
. 12
%Gravel
31
23
39
Sh
eet 3 of 4
Sample CcDepth, Ft
Proposed P
WS
SC
Developm
entC
ordova, Alaska
Novem
ber 2018100619
-001
Cu
D100 %Silt
4.7
6.8
LL
Poorly Graded Gravel with Silt and Sand (GP-GM)
Poorly Graded Gravel with Silt and Sand (GP-GM)
Silty Sand with Gravel (SM)
Sample58
68
30
1.78
4.05
D30
PL
%SandB-4 S1
B-5 S1
B-5 S5
11
8
30
GR
AIN
SIZ
E C
LA
SS
IFIC
AT
ION
B-4 S1
B-5 S1
B-5 S5

0
10
20
30
40
50
60
70
80
90
100
0.0010.010.11101001,000
2 #601/2
SH
AN
NO
N &
WIL
SO
N, IN
C.
#20#4
fine
PE
RC
EN
T F
INE
R B
Y W
EIG
HT
SILT OR CLAY
12
GRAIN SIZE IN MILLIMETERS
4
fine
Geotechnical and Environm
ental Consultants
COBBLES
1
U.S. SIEVE NUMBERS
3/8
SAND
36 3/4 #10 #200
medium
#40
U.S. SIEVE OPENING IN INCHES
1 1/2
coarse coarse
HYDROMETER
#100
GRAVEL
1/4
PI
3.69
14.18
25.0 - 26.5
0.0 - 2.0 109.7
Depth, Ft25.0 - 26.5
0.0 - 2.0
37.5
75 0.13
D60 %ClayD10
Classification
FIG
. 12
%Gravel
49
26
Sh
eet 4 of 4
Sample CcDepth, Ft
Proposed P
WS
SC
Developm
entC
ordova, Alaska
Novem
ber 2018100619
-001
Cu
D100 %Silt
5.0
LL
Silty Sand with Gravel (SM)
Poorly Graded Gravel with Silt and Sand (GP-GM)
Sample34
65
0.54
3.02
D30
PL
%SandB-5 S8
B-6 S1
17
8
GR
AIN
SIZ
E C
LA
SS
IFIC
AT
ION
B-5 S8
B-6 S1

0
10
20
30
40
50
60
0 20 40 60 80 100
Classification
ML
PI Fines
CH
LL
PLASTICITY
INDEX
LIQUID LIMIT
PL
MH
Depth, Ft
10.0 - 11.5
20.0 - 21.5
10.0 - 11.5
15.0 - 16.5
29
30
29
40
9
22
11
17
ML or OL
MH or OH
ML or OL
MH or OH
CL
Boring
CL-ML
38
52
40
57
B-1
B-1
B-4
B-6
SHANNON & WILSON, INC.
November 2018
Proposed PWSSC DevelopmentCordova, Alaska
FIG. 13
100619-001
ATTERBERG LIMITS RESULTS
Geotechnical and Environmental Consultants

Proposed PWSSC DevelopmentCordova, Alaska
November 2018 100619-001
SEISMIC REFRACTION PROFILELINE L1
FIG. 14SHANNON & WILSON, INC.Geotechnical and Environmental Consultants
APPROXIMATE SCALE IN FEET
Legend
Geophone
Compression (P) Wave Velocity
0 20 40 60 80 100 120 140 160 180 200 220Distance (Feet)
-55
-35
-15
5D
epth
Bel
ow G
roun
d S
urfa
ce (F
eet)
North South
0 10 20 40
Ground Surface
Vp = 2,300 feet per second
Vp = 5,900 feet per second
Vp
Note1. Geophone locations were not surveyed. Model assumes a level ground surface.Depths labeled are below ground surface.
2. Based on the results of drilling it is likely that a velocity inversion is present.Results of seismic refraction survey may not be accurate. See report text foradditional explantation.
Sheet 1 of 2
Line L1

Proposed PWSSC DevelopmentCordova, Alaska
November 2018 100619-001
SEISMIC REFRACTION PROFILELINES L2 & L3
FIG. 14SHANNON & WILSON, INC.Geotechnical and Environmental Consultants
APPROXIMATE SCALE IN FEET
Legend
Geophone
Compression (P) Wave Velocity
0 20 40 60 80 100Distance (Feet)
-30
-10
Dep
th B
elow
Gro
und
Sur
face
(Fee
t)
0 20 40 60 80 100Distance (Feet)
-30
-10
Dep
th B
elow
Gro
und
Sur
face
(Fee
t)West East
0 10 20 40
Ground Surface
Vp = 1,640 feet per second
Vp =2,190 feet per second
Vp
Note1. Geophone locations were not surveyed. Model assumes a level ground surface.Depths labeled are below ground surface.
2. Based on the results of drilling it is likely that a velocity inversion is present.Results of seismic refraction survey may not be accurate. See report text foradditional explantation.
Sheet 2 of 2
Ground Surface
Line L2 Line L3
East West
Vp = 1,520 feet per second
Vp =7,070 feet per second

GRADATION AND DURABILITY REQUIREMENTS
E-1 Surface CoursePERCENT PASSING
BY WEIGHTU.S. STANDARD SIEVE SIZE
1 in.3/4 in.3/8 in.No. 4No. 8No. 50No. 200
25 mm19 mm9.5 mm4.75 mm2.36 mm0.300 mm0.075 mm
10070 - 10050 - 8535 - 6520 - 5015 - 308 - 15
English Metric
After: Alaska Department of TransportationStandard Specifications for Highway Construction
Coarse Aggregate Durability
L.A. AbrasionSulfate SoundnessDegradation
45 - 50 max. *9 max.45 min.
Test Type Percent LossRetained on #4 Sieve
* Asphalt and Surface Course = 45% max Base Course = 50% max
Selected Material Type APERCENT PASSING
BY WEIGHTU.S. STANDARD SIEVE SIZE
No. 4No. 200
4.75 mm0.075 mm
Selected Material Type BPERCENT PASSING
BY WEIGHTU.S. STANDARD SIEVE SIZE
No. 200 0.075 mm 10 Max. on minus3-in. portion
20 - 556 Max. on minus
3-in. portion
English Metric
English Metric
SHANNON & WILSON, INC.Geotechnical & Environmental Consultants
Proposed PWSSC DevelopmentCordova, Alaska
GRADATION AND DURABILITYREQUIREMENTS
November 2018
FIG. 15100619-001
Aggregate containing no muck, frozen material, roots, sod or other deleterious matter and with a plasticity index not greater than 6 as tested by ATM 204 and ATM 205.
Aggregate containing no muck, frozen material, roots, sod or other deleterious matter and with a plasticity index not greater than 6 as tested by ATM 204 and ATM 205.

100619-001
APPENDIX A
RESULTS OF GEOPHYSICAL SURVEY BY GEOTEK ALASKA, INC.

GeoTek Alaska, Inc.
P.O. 11-1155 • Anchorage • Alaska • 99511-1155 • (907) 569-5900 • Fax (907) 929-5762
October 22, 2018 18-1063
Mr. Thomas Keatts Shannon & Wilson, Inc. 5430 Fairbanks Street, Suite 3 Anchorage, AK 99518 Phone: (907) 561-2120 Direct: (907) 433-3212 [email protected] RE: Letter Report – Geophysical Survey at the Proposed Prince William
Sound Science Center in Cordova, Alaska
The following is a Letter Report submitted to Shannon & Wilson, Inc. (SWI) by
GeoTek Alaska, Inc (GTA). This report concerns the performance of a
geophysical survey at the proposed site for the Prince William Sound Science
Center (PWSSC) in Cordova, AK. SWI contracted GTA to perform the
geophysical survey on September 3, 2017.
Geophysical Survey Objective and Parameters
Introduction Shannon & Wilson, Inc. contracted GeoTek Alaska, Inc. to provide geophysical
services at a proposed site for the construction of the Prince William Sound
Science Center (PWSSC) near Cordova, AK (Figure 1). GTA was contracted to
perform a geophysical survey of an area of concern (AOC) that is suspected to
contain underground buried refuse (i.e. scrap metal, drums, vehicle bodies,
building debris, etc.), and possible soil contamination associated with buried
refuse. The purpose of the geophysical survey is to investigate the area for
buried metal refuse, extents, and soil contamination.
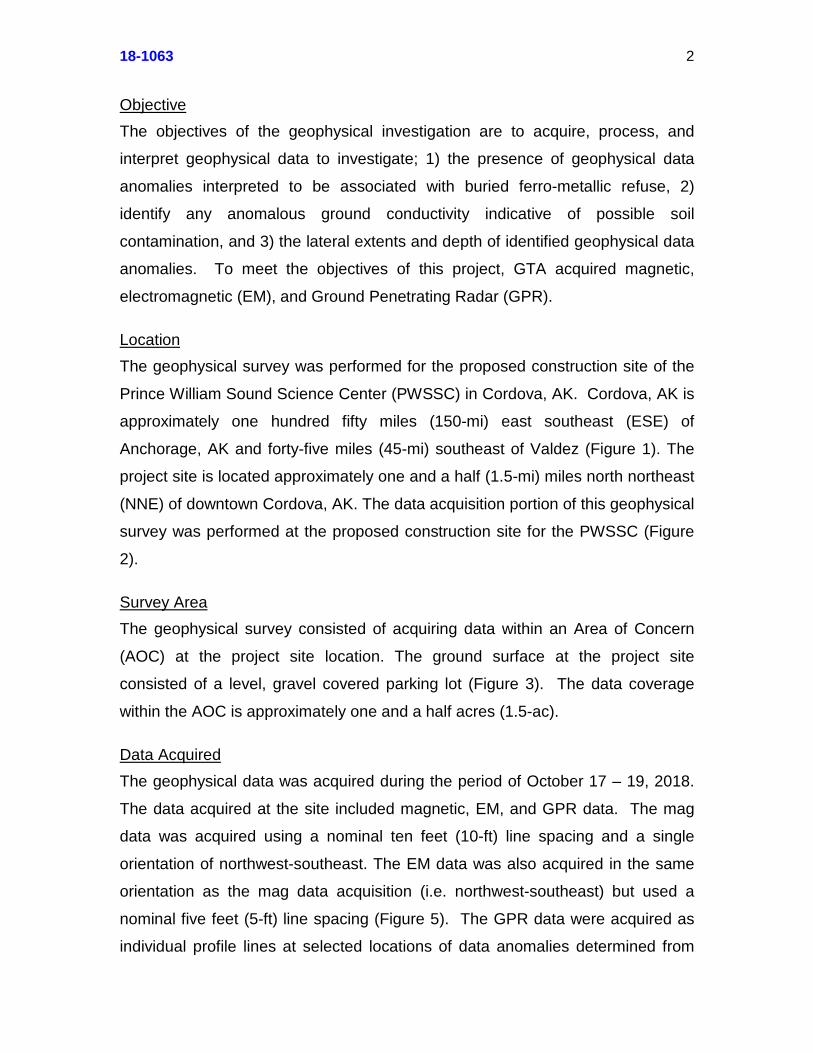
18-1063 2
Objective The objectives of the geophysical investigation are to acquire, process, and
interpret geophysical data to investigate; 1) the presence of geophysical data
anomalies interpreted to be associated with buried ferro-metallic refuse, 2)
identify any anomalous ground conductivity indicative of possible soil
contamination, and 3) the lateral extents and depth of identified geophysical data
anomalies. To meet the objectives of this project, GTA acquired magnetic,
electromagnetic (EM), and Ground Penetrating Radar (GPR).
Location The geophysical survey was performed for the proposed construction site of the
Prince William Sound Science Center (PWSSC) in Cordova, AK. Cordova, AK is
approximately one hundred fifty miles (150-mi) east southeast (ESE) of
Anchorage, AK and forty-five miles (45-mi) southeast of Valdez (Figure 1). The
project site is located approximately one and a half (1.5-mi) miles north northeast
(NNE) of downtown Cordova, AK. The data acquisition portion of this geophysical
survey was performed at the proposed construction site for the PWSSC (Figure
2).
Survey Area The geophysical survey consisted of acquiring data within an Area of Concern
(AOC) at the project site location. The ground surface at the project site
consisted of a level, gravel covered parking lot (Figure 3). The data coverage
within the AOC is approximately one and a half acres (1.5-ac).
Data Acquired The geophysical data was acquired during the period of October 17 – 19, 2018.
The data acquired at the site included magnetic, EM, and GPR data. The mag
data was acquired using a nominal ten feet (10-ft) line spacing and a single
orientation of northwest-southeast. The EM data was also acquired in the same
orientation as the mag data acquisition (i.e. northwest-southeast) but used a
nominal five feet (5-ft) line spacing (Figure 5). The GPR data were acquired as
individual profile lines at selected locations of data anomalies determined from

18-1063 3
mag and EM data processed in the field. In general, the orientation of the GPR
data profile lines was determined by the orientation of the identified mag or EM
data anomalies. For the three (3) days of data acquisition, the weather during
the first and last day (Oct. 17th & 19th) of data acquisition consisted of heavy rain
and high winds (with gusts up to 45 mph), and the second day (Oct. 18th) had
broken clouds with variable winds (0 -15 mph).
Instrumentation
The geophysical survey data were acquired with GTA’s or rented equipment; the
mag data was acquired using a Geonics 858 magnetometer in gradiometer
mode, the EM data was acquired using a Geonics EM31-MK2 conductivity meter
(frequency domain), and the GPR data was acquired using a Sensors and
Software pulseEKKO Pro GPR system with two hundred megahertz (200 MHz)
antennas.
Data Quality In general, the quality of all acquired data is good (on a scale of good, fair, poor).
For the mag and EM instrumentation, quality control was maintained using real-
time observation of the data during acquisition, and pre-acquisition and post-
acquisition response tests. The quality of the GPR data was maintained by real-
time observation of the data during acquisition. Depth of detection for the EM31
instrument is effective to an approximate depth of eighteen feet (18-ft). The
depth of detection for the magnetometer (gradiometer mode) is dependent on the
mass of ferro-metallic object to be detected. For the applied GPR
instrumentation, the depth of signal penetration was approximately twelve feet
(12-ft) below the ground surface (bgs) using the 200 MHz GPR antennas. For all
instrumentation applied, an appropriate depth of investigation was achieved for
the project objectives.

18-1063 4
Instrumentation and Technical Approach The geophysical survey consisted of acquiring magnetic, EM and GPR data
within one (1) identified AOC at the project site. Following, is a brief description
of GTA’s equipment used in the acquisition of the geophysical data:
Magnetic (Mag)
The equipment used for the mag data acquisition at the project site consisted of
the Geometrics 858 Magnetometer. The following is a brief description of the
equipment and basic concepts of operation:
Geometrics – 858 Magnetometer (gradiometer configuration) - The G-858
magnetometer system is a professional quality magnetic mapping tool
providing exceptional speed and efficiency in acquiring magnetic data. An
option of the G-858 magnetometer system is a gradiometer configuration.
The gradiometer configuration is comprised of a belt-mounted display/logging
console connected to two (2) vertically stacked cesium vapor sensors
mounted on a hand-held counterbalanced staff carried by the operator at
approximately three to four feet (3 to 4-ft) above the ground surface. The
gradiometer configuration was used to acquire the magnetic data (vertical
gradient) for the geophysical survey performed at this project site.
The following photographs show the magnetometer configuration during data
acquisition.
Geometrics G-858 Magnetometer in Gradiometer Configuration
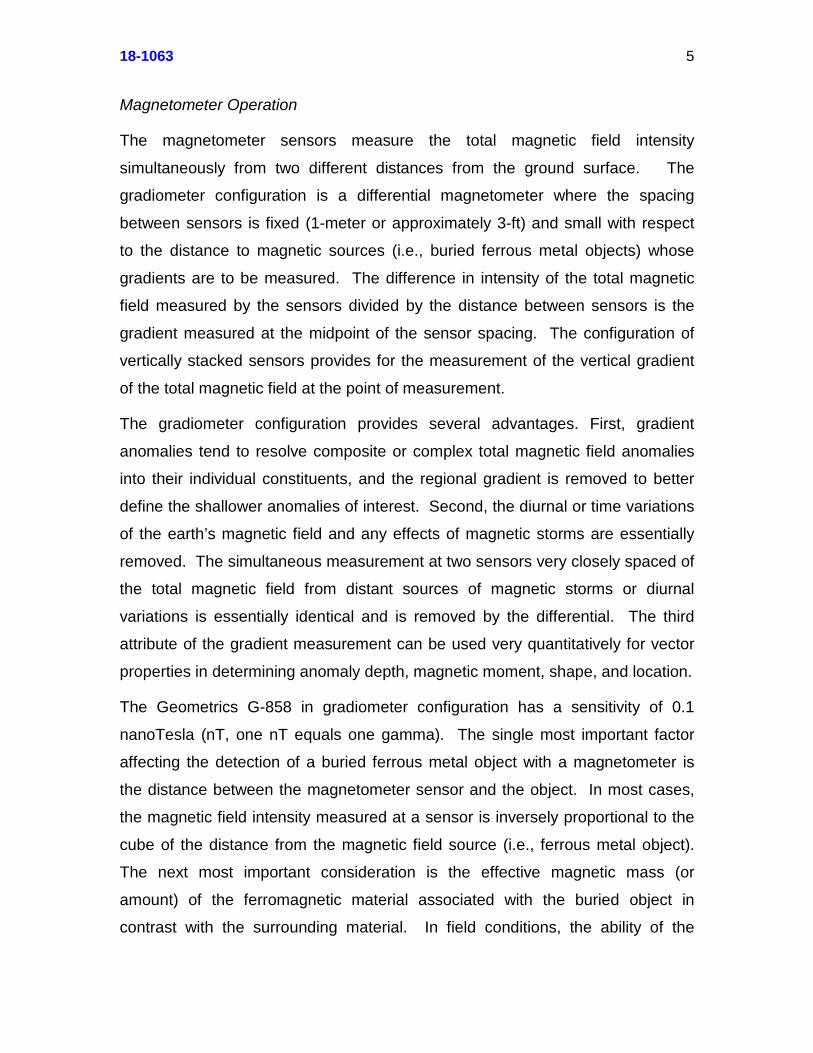
18-1063 5
Magnetometer Operation
The magnetometer sensors measure the total magnetic field intensity
simultaneously from two different distances from the ground surface. The
gradiometer configuration is a differential magnetometer where the spacing
between sensors is fixed (1-meter or approximately 3-ft) and small with respect
to the distance to magnetic sources (i.e., buried ferrous metal objects) whose
gradients are to be measured. The difference in intensity of the total magnetic
field measured by the sensors divided by the distance between sensors is the
gradient measured at the midpoint of the sensor spacing. The configuration of
vertically stacked sensors provides for the measurement of the vertical gradient
of the total magnetic field at the point of measurement.
The gradiometer configuration provides several advantages. First, gradient
anomalies tend to resolve composite or complex total magnetic field anomalies
into their individual constituents, and the regional gradient is removed to better
define the shallower anomalies of interest. Second, the diurnal or time variations
of the earth’s magnetic field and any effects of magnetic storms are essentially
removed. The simultaneous measurement at two sensors very closely spaced of
the total magnetic field from distant sources of magnetic storms or diurnal
variations is essentially identical and is removed by the differential. The third
attribute of the gradient measurement can be used very quantitatively for vector
properties in determining anomaly depth, magnetic moment, shape, and location.
The Geometrics G-858 in gradiometer configuration has a sensitivity of 0.1
nanoTesla (nT, one nT equals one gamma). The single most important factor
affecting the detection of a buried ferrous metal object with a magnetometer is
the distance between the magnetometer sensor and the object. In most cases,
the magnetic field intensity measured at a sensor is inversely proportional to the
cube of the distance from the magnetic field source (i.e., ferrous metal object).
The next most important consideration is the effective magnetic mass (or
amount) of the ferromagnetic material associated with the buried object in
contrast with the surrounding material. In field conditions, the ability of the

18-1063 6
gradiometer to detect a buried ferrous metal object is typically reduced from ideal
conditions due to several limiting factors. These factors include (but are not
limited to), survey or grid line spacing, the ferrous metal object’s metallurgy and
degree of oxidation (i.e., rusting), object shape and orientation, background noise
(e.g., fabricated materials, electric current), and magnetic mineralogy of the local
soils in the project area. GTA’s experience indicates the G-858 gradiometer’s
ability to detect a fifty-five-gallon (55-gal) drum (slightly rusted) is a maximum
distance of approximately seventeen to twenty feet (17-20-ft) from the sensors.
Electromagnetic (EM)
The equipment used for the EM data acquisition at the project site consisted of
the Geonics EM31-MK2 metal detector. The following is a brief description of the
equipment and basic concepts of operation:
Geonics EM31-MK2 - The Geonics EM31-MK2 is a ground conductivity
meter. Based on the design principles of inductive electromagnetics, ground
conductivity meters provide a non-invasive method for measurement of
subsurface conductivity and magnetic susceptibility. Without any requirement
for soil-to-instrument contact, surveys can be performed quickly – facilitating
dense data collection and, consequently, excellent spatial resolution – and
over most geologic environments, including conditions of highly resistive
surface materials such as sand and gravel. As a recognized standard for
applications in environmental site characterization, the EM31-MK2 provides
measurement of apparent conductivity and magnetic susceptibility.
The EM31-MK2 maps geologic variations, groundwater contaminants, or any
subsurface feature associated with changes in ground conductivity. The
instrument uses a patented electromagnetic inductive technique that allows
measurements without electrodes or ground contact. With this inductive
method, surveys can be carried out under most geologic conditions including
those of high surface resistivity such as sand, gravel, and asphalt.

18-1063 7
Ground conductivity (quadrature) and magnetic susceptibility (inphase)
measurements are read directly from a data logger (which provides for simple
data transfer). The data logger also provides for the Real Time (RT)
graphical presentation of the data during acquisition.
The effective depth of exploration is approximately eighteen feet (18-ft),
making it ideal for geotechnical and environmental site characterization.
Important advantages of the EM31-MK2 over conventional resistivity methods
are the speed with which surveys can be performed, the precision with which
small changes in conductivity can be measured and the continuous readout
and data collection while traversing the survey area. Additionally, the inphase
component is particularly useful for the detection of buried metallic structure
and waste material.
The following photograph shows the EM31-MK2 during data acquisition.
Geonics EM31-MK2 Ground Conductivity Meter
EM31 Operation
The basic principle of operation of the EM31 instrument is simple. A transmitter
coil located at one end of the instrument induces circular eddy current loops in
the earth. Under certain conditions fulfilled in the design of the instrument, the
magnitude of any one of these current loops is directly proportional to the ground
conductivity near the loop. Each one of the current loops generates a magnetic
field that is proportional to the value of the current flowing within that loop. A part

18-1063 8
of the magnetic field from each loop is intercepted by the receiver coil and results
in an output voltage. Thus, the output voltage is also linearly related to the
ground conductivity. The instrument is calibrated to read the correct conductivity
when the earth is uniform. The unit of conductivity used is milliSiemens per
meter (mS/m).
There are two (2) components of the induced magnetic field measured by the
instrument. The first is the quadrature component that provides the ground
conductivity measurement, and the second is the inphase component used
primarily for calibration purposes. However, the inphase component is
significantly more sensitive to large metallic objects and is very useful when
looking for buried metal objects (e.g., tanks and drums). In general, the inphase
component is a better detector of metal, but the quadrature is more sensitive to
long, extended targets (e.g., pipelines) that are, at least partially, in electrical
contact with the ground.
Ground Penetrating Radar
The equipment used for the GPR data acquisition at the project site consisted of
the Sensors and Software pulseEKKO Pro system. Following, is a brief
description of the GPR equipment and basic concepts of operation used for the
acquisition of the GPR data:
Sensors and Software pulseEKKO Pro system - The Sensors and
Software pulseEKKO Pro system consists of a GPR antenna system (with
attached transmitter and receiver) that is transported manually. Based on the
project objectives, the 200 MHz antenna were chosen to provide subsurface
penetration to approx. 12-ft to 15-ft.
The GPR system also includes a Digital Video Logger (DVL) and battery.
The DVL is where GPR data is recorded and displayed. The real-time display
of traces allows the operator to see the acquired data on the DVL as the
operator moves. This provides for quality control during data acquisition.

18-1063 9
The following photograph shows the GPR equipment during a geophysical
survey.
Sensors & Software pulseEkko Pro GPR
GPR Operation
Ground Penetrating Radar directs a pulse of radio waves (i.e., frequencies from
12.5 MHz to 1000 MHz) downward into the earth. Part of the transmitted energy
of the waves is reflected to the receiver from interfaces or objects with differing
electrical properties. GPR reflection data is recorded as a function of the two-
way time required for a signal pulse to transmit, reflect, and return to the receiver
antenna. Differing soil or material properties produce reflection events in the
GPR profile data. A reflection event is produced at an interface where the
electrical properties (e.g., dielectric constant and electrical conductivity) vary with
soil lithology, associated grain size and porosity, water saturation, and pore
chemistry. Note: the vertical resolution and depth of penetration of a GPR signal
is dependent on the frequency of the antennas (selected for the project
objectives), and the velocity of the transmitted signal in the penetrated material.
Additionally, localized buried targets (both metallic and non-metallic) can also
produce a reflection event that enables the location of the object, and
determination of its depth in the subsurface. A hyperbolic shaped response or
diffraction is diagnostic of localized buried targets. The top of the hyperbola in
GPR profile data indicates the location of a buried object. The shape of the tails

18-1063 10
of the hyperbola provides for the calculation of the velocity of the radio waves in
the subsurface. Thus, the depth of a buried object can be determined from the
time of the reflection event for the object (top of hyperbola) and the calculated
velocity of the radio waves in the subsurface.
A GPR profile line consists of data traces recorded at a station spacing
determined appropriate for the project. The records of multiple, separate pulses
at a single location (i.e., station) are summed to enhance the signal-to-noise ratio
and produce a single trace for that station. The summed trace is transmitted in
digital form by a data-logging instrument or computer. The display of each
summed trace at every station along the established survey grid line produces a
GPR profile line for that grid line location. The geophysical data were acquired at
an appropriate station spacing interval (0.3-ft for the 200 MHz antenna) for the
project objective.
Geophysical Data Processing
To meet the objectives of this project, the geophysical data (i.e., mag, EM, and
GPR data sets) were processed to obtain the optimum data quality and displays
for interpretation. Data processing provides the ability to produce color contour
display maps and GPR data profile lines from the data sets. The following
provides a brief discussion of the data displays used for this project.
Mag and EM Data Display
The mapping and identification of any mag and EM data anomalies at a
project site are accomplished by producing color contour maps from the
acquired and processed data. The geophysical and location data acquired at
a project site consists of a measurement made by the geophysical instrument
at a specific location (x,y). The unit of measurement for the magnetic data is
nanoTesla per meter. The unit of measurement for the quadrature
component (or apparent ground conductivity) of the processed EM data is
milliSiemens per meter (mS/m), and the inphase component is parts per
trillion (ppt). Color contour maps provide for the interpretation of data

18-1063 11
anomalies that may be associated with metal (surface or subsurface) and
ground conductivity anomalous to background.
The instrument readings of the magnetometer and the two (2) components of
the EM31, quadrature and inphase, are mapped in conjunction with the
simultaneously acquired location data. The processing software first grids the
acquired or processed data readings and then produces color contours of the
gridded data values using a selected color scheme. Anomalously high data
values or peak values are then identified by choosing the appropriate colors
and contour intervals to enhance the differentiation of the peak or anomalous
data values from the background data values for each project site.
For the color contour figures included in this report, a color scheme has been
selected that assigns hot colors (e.g., magenta, red) to the higher data
readings, yellow and green for the mid-range data readings, and shades of
blue for the lower data readings. Color bars are provided that indicate the
data value range for the color contours shown in the maps.
GPR Data Display
As previously mentioned, typical geophysical software produces two-
dimensional (2D) cross sections of the subsurface from the recorded GPR
data, commonly called GPR profile lines. The GPR figures included in this
report display the traditional profile view.
Control Surveying
The location and extent of the acquired geophysical data coverage was
established in the field by GTA and based on figures provided by the client. The
dimensions of the geophysical survey were chosen to include the entire extent of
the AOC within the data acquisition coverage. The positioning of the geophysical
data was accomplished by using a Leica 1200 GPS unit and Real Time
Kinematic (RTK) positioning. Position data were referenced to an established
base station. All positioning data were acquired in the field using the WGS84
datum and geographic coordinate system (latitude and longitude). The

18-1063 12
positioning of the geophysical data was transformed post survey to a NAD83
Datum and Alaska State Plane Zone 3 (ASP Z3) coordinate system. All
geophysical data positioning and maps in this report are displayed using the
NAD83 Datum and ASP Z3 coordinate system. The map units are in US survey
feet. The coordinate for the base station is shown below in Table 1. Positions
displayed in the figures included in this report are based on data acquired and
processed by GTA. Note: GTA is not a Registered Land Surveyor (RLS).
The GPR profile line locations were determined in the field based on field
processing of the mag and EM data. Start and End points for each GPR profile
line were determined for selected data anomalies, and these points were “staked
out” or located prior to GPR data acquisition.
Table 1 Project Control Points – GPS Base Stations
Project Control Point
Coordinate System Geographic
(Latitude, Longitude) Alaska State Plane (Zone 3)
Datum Latitude (DD.DDD)
Longitude (DD.DDD) Datum Northing
(feet) Easting (feet)
Base 1 WGS84 60.5635398 N 145.7430597 W NAD83 2397956.62 1686651.58
Results Figures
Figures 1 - 3 Project Location Figure 4 Mag Data Coverage and Color Contour Map Figure 5 - 6 EM Data Coverage and Color Contour Map Figure 7 Mag Data Color Contour Map with Identified Anomalies and
Location of GPR Data Profile Lines Figures 8 - 11 Identified mag/EM Data Anomalies with Interpreted GPR
Profile Lines
The results from the geophysical survey at the project site are shown in Figures 4
-11.
18-1063 13
Figure 4 shows the color contour map of the acquired magnetic data with the
acquisition path of the instrument shown on the left and without the acquisition
line path on the right. High data value readings (i.e. mag data anomalies) are
observed within the project area based on this color contour map. The observed,
high data readings (anomalous from background) are produced from both
surface metal and buried metal within the mag data coverage. Observed surface
metal at the project site consisted of signs, signposts, bicycle, wooden kiosk with
metal roof, and what appeared to be a utility box. In the interpretation of the mag
data, only high readings (data anomalies) from objects in the subsurface (i.e. not
at locations of observed surface metal) are identified in further discussion of the
results.
Figure 5 shows the color contour map of the acquired inphase component of the
EM31 data with the acquisition path of the instrument shown on the left and
without the acquisition line path on the right. An obvious, high data value
anomaly is present in this data set, with a few smaller anomalous areas also
observed. The larger anomalous area is in the same approximate location of the
largest anomalous area observed in the mag data set. The inphase component
of the EM31 instrument is sensitive to buried metal, so it would be expected to
find an anomaly present in the same location of a mag data anomaly. Thus, the
inphase component appears to corroborate the observation of a mag data
anomaly in the same location.
Figure 6 shows the color contour map of the acquired quadrature component (i.e.
apparent conductivity) of the EM31 data with the acquisition path of the
instrument shown on the left and without the acquisition line path on the right. As
for the inphase component, high data value readings are observed in the same
approximate location as the larger anomaly observed in the mag data set. It
should be noted that the area of high data readings in the quadrature component
is slightly larger than that of the inphase component anomaly. Additionally, since
the quadrature component of the EM31 instrument is the apparent conductivity of
the soils, it is important to note the higher mid-level (orange contour) that extend
west from the location of the higher data readings (magenta & red contours).

18-1063 14
After processing the mag and EM data in the field, a similar version of the color
contour map of the mag data shown in Figure 4 was produced using geographic
coordinates (i.e. lat/long). Based on this mag data map, anomalies (not
associated with surface metal) were identified for determining the location for the
acquisition of GPR data profile lines.
Figure 7 shows the color contour map of the mag data and indicates the selected
GPR profile lines over the identified area of the mag/EM data anomalies of
interest. All mag data anomalies chosen for further GPR data acquisition were
interpreted to be associated with buried metal. The following discussion
addresses each of the mag data anomalies and the results of the GPR
interpretation.
Figures 8 and 9 include the mag data color contour map (on the left of the figure)
with the location of an anomaly, designated Anomaly “A”, identified by a dashed,
black rectangle. The location of GPR profile line(s) through that anomaly are
indicated by black lines. Based on the mag data map, Anomaly “A” is the largest
mag anomaly in both data value and extent. No surface metal was observed at
this location.
Three (3) GPR profile lines were acquired in a northwest/southeast orientation
through the higher data readings at this location to determine if this anomaly is
associated with excavation and burial, or localized scrap metal that has been
incorporated into the soil (during fill or grading at the site). GPR Profile Lines 3 -
5 are shown on the right of Figure 8. Based on the mag data map, the location
and extent of the higher mag data readings (magenta & red color contours) along
the profile lines are indicated in red at the top of the profile. Additionally, the
location of observed hyperbolic responses (or diffractions) are indicated by red
arches (hyperbolas).
The diffractions (hyperbolic responses) may be indicative of a response from a
metal object that produced the mag data anomaly. The interpreted GPR profile
lines do indicate evidence of excavation and fill due to the observed dipping
reflections on both sides of the mag data anomaly extent and highlighted

18-1063 15
diffractions. These dipping reflections are interpreted as sidewalls of an
excavation with subsequent fill producing reflections (and diffractions) within the
sidewall reflections. Incidentally, there are other GPR data diffractions (i.e.
hyperbolic responses) observed in the profile lines, but only those near or within
the mag data anomaly (“A”) have been highlighted by red arches.
Figures 10 and 11 include the mag data color contour map with locations of
designated Anomalies “B1”, “B2”, and “C” (Figure 10), and designated Anomalies
“D” and “E” identified in Figure 11. Due to the relatively small areas of anomalous
high mag data readings, only one GPR profile line was chosen through each of
these anomalies.
The GPR profile line acquired at the anomaly “B1” location indicates that the mag
response is a localized anomaly with no observed evidence of excavation and
burial. The GPR profile line acquired at the anomaly “B2” location indicates that
there is evidence of dipping reflections on either side of the diffractions
highlighted in Profile Line 1. This may indicate that excavation was performed
prior to the filling with metallic debris and other non-metallic refuse or
soils/gravel. This is also the case for the mag data anomaly designated “C”.
Dipping reflections are observed on both sides of the highlighted diffraction in
Profile Line 2.
GPR Profile Line 8, acquired through the location of Anomaly “D”, is shown in
Figure 11. The location of this anomaly along Profile Line 8 indicates dipping
reflections to the northwest and southeast of the diffraction identified in Figure
11. Profile Line 9, acquired through the locations of two (2) small, mag data
anomalies (“E”), indicate diffractions are present within or very near the locations
of the small anomalies. However, Profile Line 9 does not indicate any evidence
for excavation performed prior to fill and grading at this location within the project
AOC.
It should be noted that high frequency noise began to appear at the time of data
acquisition of Profile Line 9, and this is observable in the deeper portion of the
profile line, particularly on the southeast end of this profile line. An additional

18-1063 16
Profile Line 10 was acquired, but the quality of the data was poor due to this high
frequency noise. The location Profile Line 10 was selected through other small
mag data anomalies. But, due to the quality of this data it was not chosen for
display in this report.
Limitations of Technical Services GeoTek Alaska, Inc. (GTA) performed our services in a manner consistent with
the skill level of currently practicing professionals under similar conditions. GTA's
investigations are conducted within the design limitations of the equipment used
for the purposes described in this report. Interpretations developed and
presented in this report are based on the data collected by GTA in the field and
were performed to the best of the interpreter’s abilities. Limitations exist as
actual site conditions may vary; thus, no warranty is expressed or implied. This
report is intended for the exclusive use of SubArctic Services and their
authorized parties for purposes described herein.
Conclusions In conclusion, GTA accomplished the objectives of this geophysical survey at the
project site at the proposed Prince William Sound Science Center near Cordova,
Alaska. The following are some general comments from the interpretation of the
geophysical data:
• GTA performed a geophysical survey at a project site located at the proposed
construction site of the Prince William Sound Science Center (Figure 2).
Magnetic (mag), EM (EM31), and Ground Penetrating Radar (GPR) data (200
MHz) were acquired. The mag data consisted of acquiring data at a nominal
line spacing of ten feet (10-ft) over an area of approximately one and a half
acres (1.5-ac) as shown in Figure 3. It should be noted that mag and EM
data were not acquired in any vegetated areas at the project site. GPR data
was acquired as individual profile lines over areas identified in the mag and

18-1063 17
EM data as anomalous. Ten (10) GPR profile lines were acquired for a total
linear footage of one thousand three hundred fifteen feet (1,315-ft). The
acquisition of magnetic, EM, and GPR data comprised the field efforts of this
geophysical survey at the project site.
• Based on the mag and EM data, several data anomalies (or anomalous
areas) were identified as locations potentially associated with buried metal
refuse. Figure 7 indicates the anomalous areas identified in the mag data
that were selected for further investigation using GPR instrumentation. The
mag and EM data were processed in the field, data anomalies identified, and
GPR profile line locations selected to further investigate the mag and EM data
anomalous areas. Start and stop points for the GPR data profile lines were
input to the GPS system, and these points were then “staked out” or located
at the project site using GPS. The EM data and subsequently acquired GPR
profile lines were final processed and interpreted to achieve the objectives of
the geophysical survey.
• Six (6) mag data anomalous areas at the project site were identified and were
designated with letters “A” – “E” (Figures 8-11). Based on the color contour
maps of the mag and EM data, the largest area of anomalous data readings
is present in the central portion of the surveyed area near the eastern
boundary of the AOC. The anomalous area, designated “A”, may extend east
into areas where geophysical data could not be acquired.
• One of the factors used to determine the base of excavation is the presence
of GPR hyperbolic responses (diffractions), particularly in areas with
anomalous mag and EM data values. The hyperbolic response in GPR data
is produced from objects with electrical properties different than the
surrounding soil. For the GPR interpretation, it is assumed that buried metal
exists above the base of any excavation. Thus, the hyperbolic responses
observed in the GPR data within the areas of anomalous mag data are
assumed to be from metallic objects above the base of any excavation
observed or indicated in the GPR data.

18-1063 18
• At this project site, the GPR profile lines indicate that the interpreted buried
metal ranges from an approximate depth of four feet to ten feet (4-ft to 10-ft)
below the ground surface (bgs).
• Based on comparison to a figure provided by the client, the location of a ship
(or boat) identified in the figure appears to coincide with the location of the
largest area of anomalous readings, Anomaly “A”, in the mag and EM data
sets. While no coordinates were provided for the ship observed in the figure,
the location was deemed approximate to the same location of the data
anomaly based on the curvature of the nearby road and general shape of the
surveyed area (AOC).
• It should be noted that the quadrature component of the EM31 data (Figure 6)
indicates higher mid-level readings (orange contour) are present to the west
of the high data anomaly (magenta & red contours). This may be an
indication of subsurface contamination migrating to the west from the location
of the high data anomaly (Anomaly “A”).
Closure GeoTek Alaska, Inc. appreciates this opportunity to support Shannon & Wilson,
Inc. with the geophysical survey at the proposed construction site of the Prince
William Sound Science Center, in Cordova, Alaska. GTA remains available to
assist Shannon & Wilson, Inc. with future projects. Should you have any
questions or require any additional information, please do not hesitate to contact
the undersigned at (907) 569-5900.
Sincerely,
Chris Nettels President/Consulting Geophysicist

Figure:
Project No:
Created By:
File Path:
Date:
Geophysical and Environmental Site Assessment 1
Shannon & Wilson, Inc.PWSSC – Cordova, Alaska
Project Location
N
R:\00-000 GEOPHYSICAL PROJECTS\18-000 GEOPHYSICAL
PROJECTS\18-1063 PWSSC_SWI\Geophysics\Report
CBN
18-1063
10/18/2018
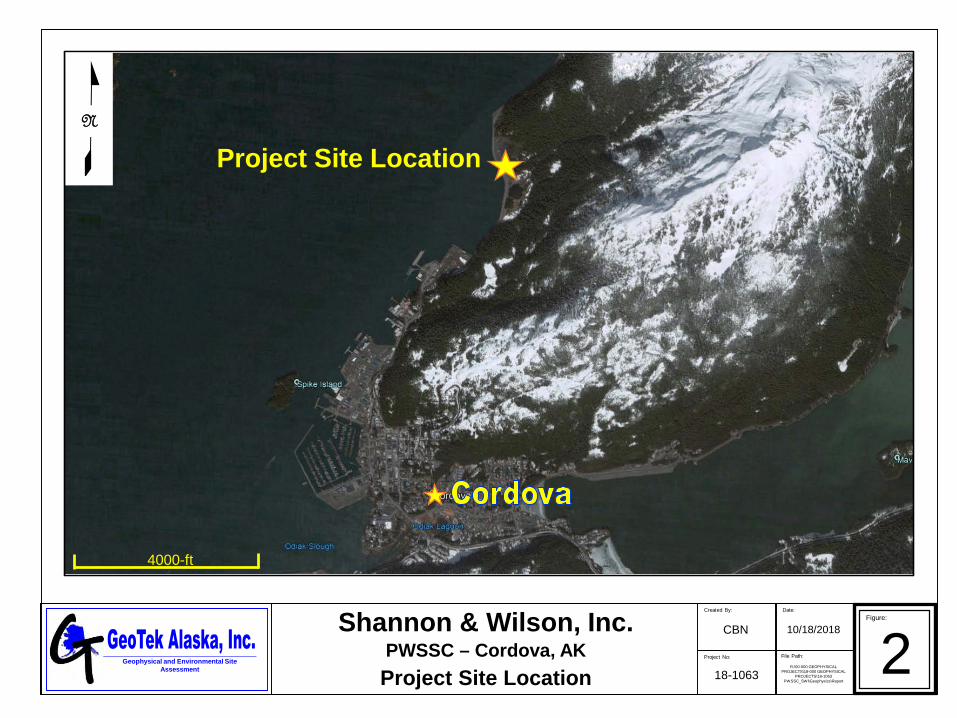
Figure:
Project No:
Created By:
File Path:
Date:
Geophysical and Environmental Site Assessment 2
Project Site Location
Shannon & Wilson, Inc.PWSSC – Cordova, AKProject Site Location
4000-ft
N
CBN
18-1063
10/18/2018
R:\00-000 GEOPHYSICAL PROJECTS\18-000 GEOPHYSICAL
PROJECTS\18-1063 PWSSC_SWI\Geophysics\Report

Figure:
Project No:
Created By:
File Path:
Date:
Geophysical and Environmental Site Assessment 3CBNShannon & Wilson
PWSSC – Cordova, AKGeophysical Survey Area 18-1063
10/18/2018
N
200-ft
200-ft
Geophysical Survey Area(approximate)
R:\00-000 GEOPHYSICAL PROJECTS\18-000 GEOPHYSICAL
PROJECTS\18-1063 PWSSC_SWI\Geophysics\Report

Geophysical and Environmental Site Assessment
Figure:Date:Created By:
Project No: File Path: 4Shannon & Wilson, Inc.Proposed PWSSC - Cordova, Alaska
Magnetic Data – Color Contour MapR:\00-000 GEOPHYSICAL
PROJECTS\18-000 GEOPHYSICAL PROJECTS\18-1063 PWSSC
_SWI\Geophysics\Report
CBN
18-1063
10/18/2018
w/ acquisition line path shown

Geophysical and Environmental Site Assessment
Figure:Date:Created By:
Project No: File Path: 5Shannon & Wilson, Inc.Proposed PWSSC - Cordova, Alaska
EM31 Data (Inphase) – Color Contour MapR:\00-000 GEOPHYSICAL
PROJECTS\18-000 GEOPHYSICAL PROJECTS\18-1063 PWSSC
_SWI\Geophysics\Report
CBN
18-1063
10/18/2018
w/ acquisition line path shown

Geophysical and Environmental Site Assessment
Figure:Date:Created By:
Project No: File Path: 6Shannon & Wilson, Inc.Proposed PWSSC - Cordova, Alaska
EM31 Data (Conductivity) – Color Contour MapR:\00-000 GEOPHYSICAL
PROJECTS\18-000 GEOPHYSICAL PROJECTS\18-1063 PWSSC
_SWI\Geophysics\Report
CBN
18-1063
10/18/2018
w/ acquisition line path shown

Figure:Created By:
Project No:
Date:
File Path:____________________________________________________Geophysical and Environmental Site Assessment 7CBNShannon & Wilson, Inc.
Proposed PWSSC - Cordova, AlaskaGPR Profile Line Locations
R:\00-000 GEOPHYSICAL PROJECTS\18-000 GEOPHYSICAL
PROJECTS\18-1063 PWSSC_SWI\Geophysics\Report
18-1063
10/18/2018
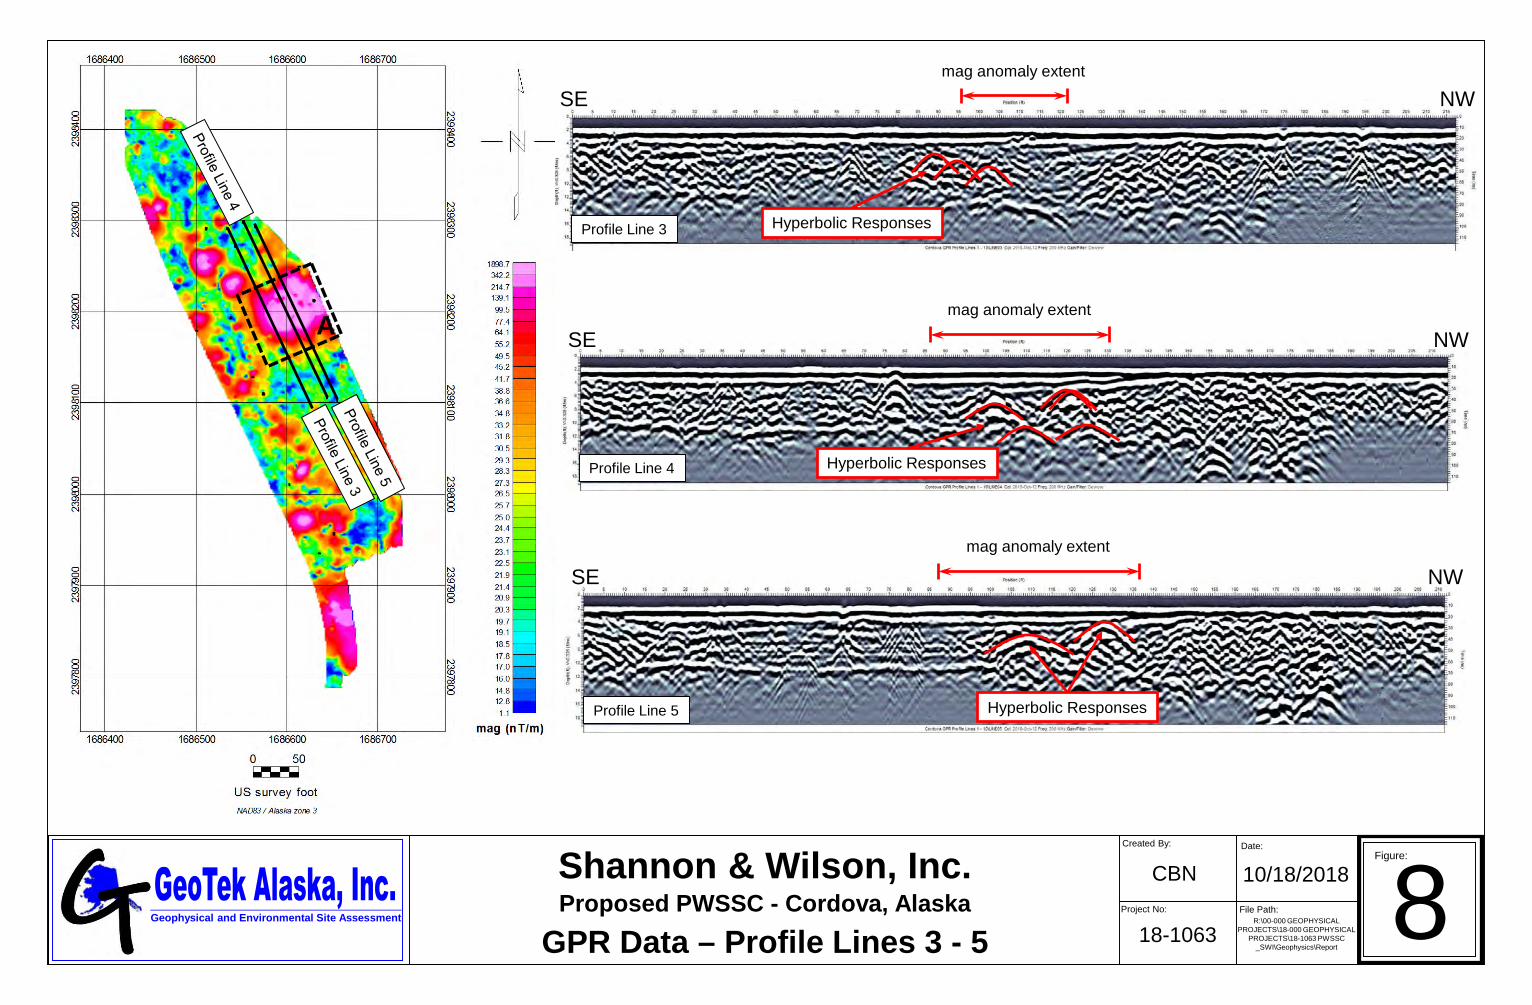
mag anomaly extent
mag anomaly extent
mag anomaly extent
Geophysical and Environmental Site Assessment
Figure:Date:Created By:
Project No: File Path: 8Shannon & Wilson, Inc.Proposed PWSSC - Cordova, Alaska
GPR Data – Profile Lines 3 - 5
Profile Line 5
Profile Line 4
Profile Line 3
Hyperbolic Responses
Hyperbolic Responses
Hyperbolic Responses
SE NW
SE NW
SE NW
R:\00-000 GEOPHYSICAL PROJECTS\18-000 GEOPHYSICAL
PROJECTS\18-1063 PWSSC_SWI\Geophysics\Report
CBN
18-1063
10/18/2018
A

Geophysical and Environmental Site Assessment
Figure:Date:Created By:
Project No: File Path:
Profile Line 6
Profile Line 7
mag anomaly extent
mag anomaly extent
Shannon & Wilson, Inc.Proposed PWSSC - Cordova, Alaska
GPR Data – Profile Lines 6 & 7
Hyperbolic Response
Hyperbolic Responses
SW NE
SW NE
R:\00-000 GEOPHYSICAL PROJECTS\18-000 GEOPHYSICAL
PROJECTS\18-1063 PWSSC_SWI\Geophysics\Report
CBN
18-1063
10/18/2018
A
9

Geophysical and Environmental Site Assessment
Figure:Date:Created By:
Project No: File Path:
Shannon & Wilson, Inc.Proposed PWSSC - Cordova, Alaska
GPR Data – Profile Lines 1 & 2
Profile Line 1
Profile Line 2
mag anomaly extentmag anomaly extent
mag anomaly extent
Hyperbolic Response
Hyperbolic Responses
Hyperbolic Response
S N
S N
R:\00-000 GEOPHYSICAL PROJECTS\18-000 GEOPHYSICAL
PROJECTS\18-1063 PWSSC_SWI\Geophysics\Report
CBN
18-1063
10/18/2018
B2
C
10
B1

Geophysical and Environmental Site Assessment
Figure:Date:Created By:
Project No: File Path: 11
mag anomaly extent
Profile Line 8
Profile Line 9
mag anomaly extent mag anomaly extent
Shannon & Wilson, Inc.Proposed PWSSC - Cordova, Alaska
GPR Data – Profile Lines 8 & 9
Hyperbolic Response
Hyperbolic Responses
SE NW
SE NW
R:\00-000 GEOPHYSICAL PROJECTS\18-000 GEOPHYSICAL
PROJECTS\18-1063 PWSSC_SWI\Geophysics\Report
CBN
18-1063
10/18/2018
D
E

100619-001
APPENDIX B
IMPORTANT INFORMATION ABOUT YOUR GEOTECHNICAL/ENVIRONMENTAL REPORT

Page 1 of 2 1/2016
SHANNON & WILSON, INC. Geotechnical and Environmental Consultants
Attachment to and part of Report 100619-001 Date: November 2018 To: Prince William Sound Science Center
IMPORTANT INFORMATION ABOUT YOUR GEOTECHNICAL/ENVIRONMENTAL
REPORT CONSULTING SERVICES ARE PERFORMED FOR SPECIFIC PURPOSES AND FOR SPECIFIC CLIENTS.
Consultants prepare reports to meet the specific needs of specific individuals. A report prepared for a civil engineer may not be adequate for a construction contractor or even another civil engineer. Unless indicated otherwise, your consultant prepared your report expressly for you and expressly for the purposes you indicated. No one other than you should apply this report for its intended purpose without first conferring with the consultant. No party should apply this report for any purpose other than that originally contemplated without first conferring with the consultant.
THE CONSULTANT'S REPORT IS BASED ON PROJECT-SPECIFIC FACTORS.
A geotechnical/environmental report is based on a subsurface exploration plan designed to consider a unique set of project-specific factors. Depending on the project, these may include: the general nature of the structure and property involved; its size and configuration; its historical use and practice; the location of the structure on the site and its orientation; other improvements such as access roads, parking lots, and underground utilities; and the additional risk created by scope-of-service limitations imposed by the client. To help avoid costly problems, ask the consultant to evaluate how any factors that change subsequent to the date of the report may affect the recommendations. Unless your consultant indicates otherwise, your report should not be used: (1) when the nature of the proposed project is changed (for example, if an office building will be erected instead of a parking garage, or if a refrigerated warehouse will be built instead of an unrefrigerated one, or chemicals are discovered on or near the site); (2) when the size, elevation, or configuration of the proposed project is altered; (3) when the location or orientation of the proposed project is modified; (4) when there is a change of ownership; or (5) for application to an adjacent site. Consultants cannot accept responsibility for problems that may occur if they are not consulted after factors which were considered in the development of the report have changed.
SUBSURFACE CONDITIONS CAN CHANGE.
Subsurface conditions may be affected as a result of natural processes or human activity. Because a geotechnical/environmental report is based on conditions that existed at the time of subsurface exploration, construction decisions should not be based on a report whose adequacy may have been affected by time. Ask the consultant to advise if additional tests are desirable before construction starts; for example, groundwater conditions commonly vary seasonally. Construction operations at or adjacent to the site and natural events such as floods, earthquakes, or groundwater fluctuations may also affect subsurface conditions and, thus, the continuing adequacy of a geotechnical/environmental report. The consultant should be kept apprised of any such events, and should be consulted to determine if additional tests are necessary.
MOST RECOMMENDATIONS ARE PROFESSIONAL JUDGMENTS.
Site exploration and testing identifies actual surface and subsurface conditions only at those points where samples are taken. The data were extrapolated by your consultant, who then applied judgment to render an opinion about overall subsurface conditions. The actual interface between materials may be far more gradual or abrupt than your report indicates. Actual conditions in areas not sampled may differ from those predicted in your report. While nothing can be done to prevent such situations, you and your consultant can work together to help reduce their impacts. Retaining your consultant to observe subsurface construction operations can be particularly beneficial in this respect.

Page 2 of 2 1/2016
A REPORT'S CONCLUSIONS ARE PRELIMINARY.
The conclusions contained in your consultant's report are preliminary because they must be based on the assumption that conditions revealed through selective exploratory sampling are indicative of actual conditions throughout a site. Actual subsurface conditions can be discerned only during earthwork; therefore, you should retain your consultant to observe actual conditions and to provide conclusions. Only the consultant who prepared the report is fully familiar with the background information needed to determine whether or not the report's recommendations based on those conclusions are valid and whether or not the contractor is abiding by applicable recommendations. The consultant who developed your report cannot assume responsibility or liability for the adequacy of the report's recommendations if another party is retained to observe construction.
THE CONSULTANT'S REPORT IS SUBJECT TO MISINTERPRETATION.
Costly problems can occur when other design professionals develop their plans based on misinterpretation of a geotechnical/environmental report. To help avoid these problems, the consultant should be retained to work with other project design professionals to explain relevant geotechnical, geological, hydrogeological, and environmental findings, and to review the adequacy of their plans and specifications relative to these issues.
BORING LOGS AND/OR MONITORING WELL DATA SHOULD NOT BE SEPARATED FROM THE REPORT.
Final boring logs developed by the consultant are based upon interpretation of field logs (assembled by site personnel), field test results, and laboratory and/or office evaluation of field samples and data. Only final boring logs and data are customarily included in geotechnical/environmental reports. These final logs should not, under any circumstances, be redrawn for inclusion in architectural or other design drawings, because drafters may commit errors or omissions in the transfer process. To reduce the likelihood of boring log or monitoring well misinterpretation, contractors should be given ready access to the complete geotechnical engineering/environmental report prepared or authorized for their use. If access is provided only to the report prepared for you, you should advise contractors of the report's limitations, assuming that a contractor was not one of the specific persons for whom the report was prepared, and that developing construction cost estimates was not one of the specific purposes for which it was prepared. While a contractor may gain important knowledge from a report prepared for another party, the contractor should discuss the report with your consultant and perform the additional or alternative work believed necessary to obtain the data specifically appropriate for construction cost estimating purposes. Some clients hold the mistaken impression that simply disclaiming responsibility for the accuracy of subsurface information always insulates them from attendant liability. Providing the best available information to contractors helps prevent costly construction problems and the adversarial attitudes that aggravate them to a disproportionate scale.
READ RESPONSIBILITY CLAUSES CLOSELY.
Because geotechnical/environmental engineering is based extensively on judgment and opinion, it is far less exact than other design disciplines. This situation has resulted in wholly unwarranted claims being lodged against consultants. To help prevent this problem, consultants have developed a number of clauses for use in their contracts, reports, and other documents. These responsibility clauses are not exculpatory clauses designed to transfer the consultant's liabilities to other parties; rather, they are definitive clauses that identify where the consultant's responsibilities begin and end. Their use helps all parties involved recognize their individual responsibilities and take appropriate action. Some of these definitive clauses are likely to appear in your report, and you are encouraged to read them closely. Your consultant will be pleased to give full and frank answers to your questions. The preceding paragraphs are based on information provided by the ASFE/Association of Engineering Firms Practicing in the Geosciences, Silver Spring, Maryland