Embed Size (px)
Citation preview

PRELIMINARY REGULATORY ECONOMIC ANALYSIS
FOR
CRITERIA AND PROCEDURES FOR PROPOSED ASSESSMENT OF CIVIL PENALTIES
U.S. Department of Labor
Mine Safety and Health Administration Office of Standards, Regulations, and Variances
July 2006

i
Table of Contents
I. EXECUTIVE SUMMARY............................................................................................................................... 1 INTRODUCTION............................................................................................................................................. 1 MINE SECTORS AFFECTED ......................................................................................................................... 1 POPULATION AT RISK.................................................................................................................................. 1 BENEFITS ........................................................................................................................................................ 1 COMPLIANCE COSTS.................................................................................................................................... 1 EXECUTIVE ORDER 12866 AND REGULATORY FLEXIBILITY ACT.................................................... 1
II. INDUSTRY PROFILE .................................................................................................................................... 3 INTRODUCTION............................................................................................................................................. 3 STRUCTURE OF THE MINING INDUSTRY ................................................................................................ 3 STRUCTURE OF THE COAL MINING INDUSTRY .................................................................................... 6 ECONOMIC CHARACTERISTICS OF THE COAL MINING INDUSTRY ................................................. 6 COAL MINING INDUSTRY OUTLOOK ....................................................................................................... 8 THE STRUCTURE OF THE METAL/NONMETAL MINING INDUSTRY.................................................. 9
Metal Mining ................................................................................................................................................. 9 Stone Mining ................................................................................................................................................. 9 Sand & Gravel Mining................................................................................................................................. 10 Nonmetal Mining......................................................................................................................................... 10
ECONOMIC CHARACTERISTICS OF THE METAL/NONMETAL MINING INDUSTRY ..................... 11 III. BENEFITS ................................................................................................................................................... 12 IV. COST OF COMPLIANCE........................................................................................................................... 13
SUMMARY .................................................................................................................................................... 13 METHODOLOGY .......................................................................................................................................... 14 SCOPE............................................................................................................................................................. 15 ANALYSIS ..................................................................................................................................................... 16
Baseline ....................................................................................................................................................... 16 Impacts If No Compliance Response to Higher Penalties ........................................................................... 18 Impacts with Compliance Response to Higher Penalties............................................................................. 21
FEASIBILITY................................................................................................................................................. 24 Technological Feasibility............................................................................................................................. 24 Economic Feasibility ................................................................................................................................... 24
V. REGULATORY FLEXIBILITY CERTIFICATION AND INITIAL REGULATORY FLEXIBILITY ANALYSIS ......................................................................................................................................................... 26
INTRODUCTION........................................................................................................................................... 26 DEFINITION OF A SMALL MINE............................................................................................................... 26 FACTUAL BASIS FOR CERTIFICATION................................................................................................... 27
General Approach........................................................................................................................................ 27 Derivation of Costs and Revenues............................................................................................................... 27 Results of Screening Analysis ..................................................................................................................... 27
VI. OTHER REGULATORY CONSIDERATIONS ......................................................................................... 29 THE UNFUNDED MANDATES REFORM ACT of 1995............................................................................ 29 TREASURY AND GENERAL GOVERNMENT APPROPRIATIONS ACT OF 1999: ASSESSMENT OF FEDERAL REGULATIONS AND POLICIES ON FAMILIES .................................................................... 29 EXECUTIVE ORDER 12630: GOVERNMENT ACTIONS AND INTERFERENCE WITH CONSTITUTIONALLY PROTECTED PROPERTY RIGHTS..................................................................... 29 EXECUTIVE ORDER 12988: CIVIL JUSTICE REFORM.......................................................................... 29 EXECUTIVE ORDER 13045: PROTECTION OF CHILDREN FROM ENVIRONMENTAL HEALTH RISKS AND SAFETY RISKS........................................................................................................................ 29 EXECUTIVE ORDER 13132: FEDERALISM ............................................................................................. 29 EXECUTIVE ORDER 13175: CONSULTATION AND COORDINATION WITH INDIAN TRIBAL GOVERNMENTS........................................................................................................................................... 30 EXECUTIVE ORDER 13211: ACTIONS CONCERNING REGULATIONS THAT SIGNIFICANTLY AFFECT ENERGY SUPPLY, DISTRIBUTION, OR USE............................................................................ 30

ii
EXECUTIVE ORDER 13272: PROPER CONSIDERATION OF SMALL ENTITIES IN AGENCY RULEMAKING .............................................................................................................................................. 30
VII. PAPERWORK REDUCTION ACT OF 1995......................................................................................... 31 VIII. REFERENCES .......................................................................................................................................... 32
1
I. EXECUTIVE SUMMARY
INTRODUCTION This Preliminary Regulatory Economic Analysis (PREA) examines the costs and
benefits of MSHA’s proposed rule to revise its civil penalty assessment procedures by eliminating single penalties, by revising the calculation of points for regular assessments, and by raising the penalties for most violations.
MINE SECTORS AFFECTED The proposed rule would be applicable to all coal and metal/nonmetal (MNM) mines
subject to MSHA’s jurisdiction. A description of the mine sectors covered by this rule is provided in Chapter II of this PREA.
POPULATION AT RISK
Based on 2004 data, the proposed rule would apply to the entire mining industry, covering all 14,480 mine operators and 6,693 independent contractors in the United States, as well as the 214,450 miners and 72,739 contract workers they employ.
BENEFITS
Chapter III of this PREA discusses the incentive effect of the proposed rule to reduce violations, and by reducing violations to reduce accidents, injuries, and illnesses.
COMPLIANCE COSTS MSHA estimates in Chapter IV of this PREA that the proposed rule would result in
increased penalty costs to the mining industry of about $20.9 million annually. MSHA has determined that the proposed rule is both technologically and economically feasible.
EXECUTIVE ORDER 12866 AND REGULATORY FLEXIBILITY ACT
Executive Order 12866 requires that regulatory agencies assess both the costs and benefits of intended regulations. MSHA has fulfilled this requirement for the proposed rule. Based upon its analysis of penalty costs, MSHA has determined that this rule would not have an annual effect of $100 million or more on the economy. Therefore, the rule is not an economically significant regulatory action pursuant to § 3(f)(1) of Executive Order 12866.
The Regulatory Flexibility Act (RFA) requires regulatory agencies to consider a rule’s impact on small entities. The Small Business Administration (SBA) provides criteria to define a small business entity. Under the RFA, MSHA must use SBA’s criterion for a small entity in determining a rule’s economic impact unless, after consultation with SBA and an opportunity for public comment, MSHA establishes an alternative definition for a small mine and publishes that definition in the Federal Register. For the mining industry, SBA defines “small” as a mine with 500 or fewer employees. MSHA traditionally has considered small mines to be those with fewer than 20 employees. For this proposed rule, MSHA has examined the cost on mines with 5 or fewer employees to ensure that this subset of mines is
2
not significantly and adversely impacted. To ensure that the proposed rule conforms with the RFA, MSHA has analyzed the impact of the rule on mines with 500 or fewer employees (as well as on mines with fewer than 20 employees and on mines with 5 or fewer employees). MSHA has determined that the rule would not impose a substantial cost increase on small mines, whether a small mine is defined as one with 500 or fewer employees or one with fewer than 20 employees or one with 5 or fewer employees. Based upon this analysis, the Agency has determined that the rule would not have a significant economic impact on a substantial number of small mines. The factual basis for this determination is discussed in Chapter V of this PREA.

3
II. INDUSTRY PROFILE
INTRODUCTION This industry profile provides information concerning the structure and economic
characteristics of the mining industry, which includes data about the number of mines and miners by type and size of mine.
The value of the U.S. mining industry’s 2004 coal and MNM production was estimated to be about $66.1 billion, or 0.56 percent of 2004 Gross Domestic Product (GDP). Coal mining contributed about $22.1 billion to the GDP,1 while the MNM mining sector contributed about $44.0 billion.2
STRUCTURE OF THE MINING INDUSTRY
MSHA divides the mining industry into two major sectors based on commodity: (1) coal mines and (2) MNM mines. These two sectors are further divided by type of operation (e.g., underground mines or surface mines). The Agency maintains its own data on the number of mines and on mining employment by mine type and size. MSHA also collects data on the number of independent contractors and contractor employees by mining sector.
MSHA categorizes mines by size based on employment. For purposes of this industry profile, MSHA has categorized mines into three groups. These are mines that employ fewer than 20 workers; 20 to 500 workers; and more than 500 workers. For the past 20 years, for rulemaking purposes, the Agency has consistently defined a small mine to be one employing fewer than 20 employees and a large mine to be one employing 20 or more employees. However, to comply with the requirements of the Small Business Regulatory Enforcement Fairness Act (SBREFA) amendments to the Regulatory Flexibility Act (RFA), MSHA must use the Small Business Administration’s (SBA’s) criteria for a small entity when determining a rule’s economic impact. For the mining industry, SBA defines a small mine as one employing 500 or fewer employees and a large mine as one employing more than 500 workers. Thus, combining the first two MSHA mine categories noted above will meet the SBA’s definition of a small mine.
Table II-1 presents the number of small and large coal mines and their employment, excluding contractors, for the coal mining sector by mine type. The table presents the three mine size categories based on employment: (1) fewer than 20 employees (MSHA’s traditional small mine definition); (2) 20 to 500 employees; and (3) more than 500 employees. In addition, it shows that, of all coal mines, about 32 percent are underground mines employing about 49 percent of miners, while 68 percent are surface mines employing roughly 51 percent of miners.
1 Coal production data are from U.S. Department of Labor Mine Safety and Health Administration,
Office of Program Evaluation and Information Resources, 2004 data. The average U.S. underground and surface price of coal for 2004 is from the Department of Energy, Energy Information Administration, Annual Coal Report 2004, November 2005, Table 29, page 55.
2 U.S. Department of the Interior, U.S. Geological Survey, Mineral Commodities Summaries 2005, January 2005, p. 8.

4
Table II-1: Distribution of Coal Operations and Employment (Excluding Contractors)
by Mine Type and Size, 2004
Mines MinersOffice Emp. Mines Miners
Office Emp. Mines Miners
Office Emp. Mines Miners
Office Emp.
Underg. 237 2,351 57 389 30,496 904 8 4,694 124 634 37,541 1,085Surface 912 5,503 463 460 27,949 1,877 3 1,994 39 1,375 35,446 2,379Total 1,149 7,854 520 849 58,445 2,781 11 6,688 163 2,009 72,987 3,464
Mine Type
Size of Coal Mine* All Coal <20 Employees 20 to 500 Employees >500 Employees Mines
*Based on MSHA’s traditional definition, small mines are those in the <20 employees category. Based on SBA’s definition, small mines are those in the <20 employees and 20 to 500 employees categories. Source: U.S. Department of Labor Mine Safety and Health Administration, Office of Program Evaluation and Information Resources, 2004 data.
Table II-2 presents corresponding data on the number of independent coal contractors and their employment. Table II-2 shows that, of all coal contractor firms, about 29 percent operate in underground mines and employ about 29 percent of contractor employees (excluding office employment), while 71 percent operate at surface mines and employ 71 percent of contractor employees (excluding office employment).
Table II-2: Distribution of Coal Contractors and Contractor Employment by Size of Operation, 2004
Firms Emp.Office Emp. Firms Emp.
Office Emp. Firms Emp.
Office Emp. Firms Emp.
Office Emp.
Underg. 632 2,817 186 108 5,949 399 0 0 0 740 8,766 585Surface 1,546 6,898 456 264 14,564 977 0 0 0 1,811 21,462 1,433Total 2,178 9,715 642 372 20,513 1,376 0 0 0 2,550 30,228 2,018
Contr. Type
Size of Coal Contractor* All Coal <20 Employees 20 to 500 Employees >500 Employees Contractors
* Based on MSHA’s traditional definition, small contractors are those in the <20 employees category. Based on SBA’s definition, small contractors are those in the <20 employees and 20 to 500 employees categories. Source: U.S. Department of Labor Mine Safety and Health Administration, Office of Program Evaluation and Information Resources, 2004 data, and U.S. Department of Labor, Mine Safety and Health Administration, 2004 Final Data, CT441 Report, cycle 2004/381.
5
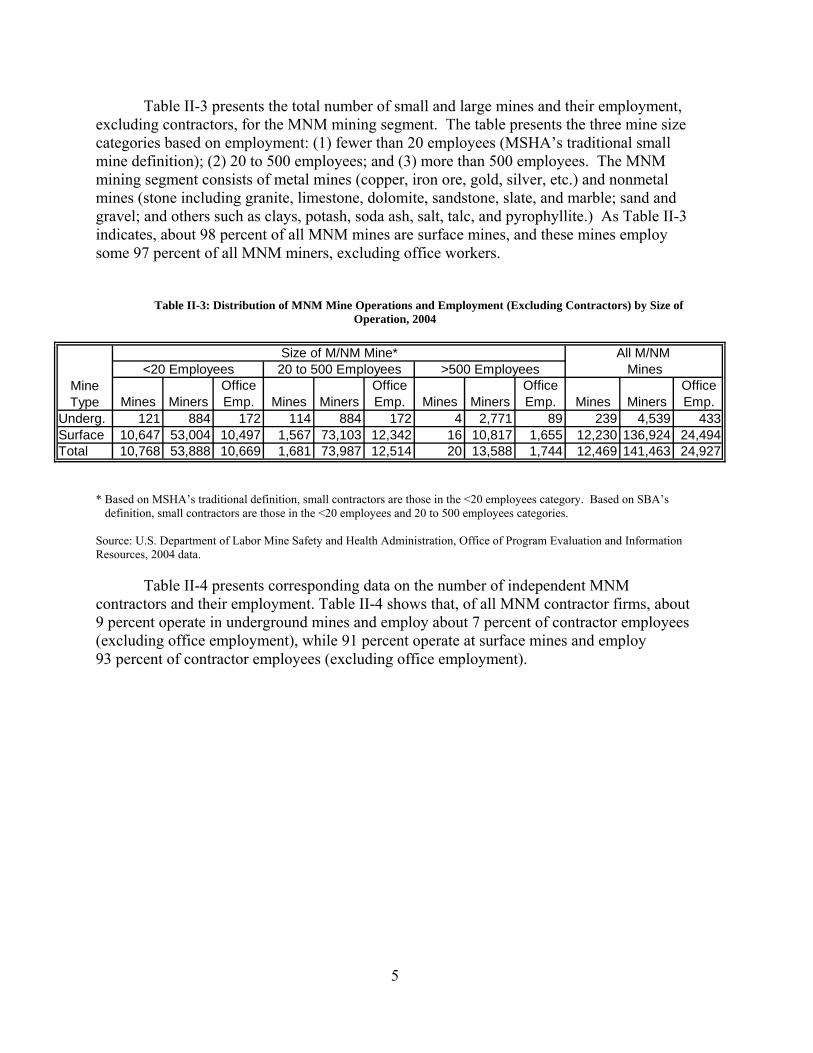
Table II-3 presents the total number of small and large mines and their employment, excluding contractors, for the MNM mining segment. The table presents the three mine size categories based on employment: (1) fewer than 20 employees (MSHA’s traditional small mine definition); (2) 20 to 500 employees; and (3) more than 500 employees. The MNM mining segment consists of metal mines (copper, iron ore, gold, silver, etc.) and nonmetal mines (stone including granite, limestone, dolomite, sandstone, slate, and marble; sand and gravel; and others such as clays, potash, soda ash, salt, talc, and pyrophyllite.) As Table II-3 indicates, about 98 percent of all MNM mines are surface mines, and these mines employ some 97 percent of all MNM miners, excluding office workers.
Table II-3: Distribution of MNM Mine Operations and Employment (Excluding Contractors) by Size of Operation, 2004
Mines MinersOffice Emp. Mines Miners
Office Emp. Mines Miners
Office Emp. Mines Miners
Office Emp.
Underg. 121 884 172 114 884 172 4 2,771 89 239 4,539 433Surface 10,647 53,004 10,497 1,567 73,103 12,342 16 10,817 1,655 12,230 136,924 24,494Total 10,768 53,888 10,669 1,681 73,987 12,514 20 13,588 1,744 12,469 141,463 24,927
Mine Type
Size of M/NM Mine* All M/NM <20 Employees 20 to 500 Employees >500 Employees Mines
* Based on MSHA’s traditional definition, small contractors are those in the <20 employees category. Based on SBA’s definition, small contractors are those in the <20 employees and 20 to 500 employees categories. Source: U.S. Department of Labor Mine Safety and Health Administration, Office of Program Evaluation and Information Resources, 2004 data.
Table II-4 presents corresponding data on the number of independent MNM contractors and their employment. Table II-4 shows that, of all MNM contractor firms, about 9 percent operate in underground mines and employ about 7 percent of contractor employees (excluding office employment), while 91 percent operate at surface mines and employ 93 percent of contractor employees (excluding office employment).

6
Table II-4: Distribution of MNM Mine Contractor Employment by Size of Operation, 2004
Firms Emp.Office Emp. Firms Emp.
Office Emp. Firms Emp.
Office Emp. Firms Emp.
Office Emp.
Underg. 368 1,749 71 46 2,273 126 1 571 0 414 4,594 197Surface 3,314 15,745 638 411 20,460 1,136 3 1,713 0 3,770 37,917 1,774Total 3,682 17,494 709 457 22,733 1,262 4 2,284 0 4,143 42,511 1,971
Contr. Type
Size of M/NM Contractor* All M/NM <20 Employees 20 to 500 Employees >500 Employees Contractors
* Based on MSHA’s traditional definition, small contractors are those in the <20 employees category. Based on SBA’s definition, small contractors are those in the <20 employees and 20 to 500 employees categories. Source: U.S. Department of Labor Mine Safety and Health Administration, Office of Program Evaluation and Information Resources, 2004 data, and U.S. Department of Labor, Mine Safety and Health Administration, 2004 Data, CT441 Report, cycle 2004/381.
STRUCTURE OF THE COAL MINING INDUSTRY Agency data in Table II-1 indicate that there were 2,009 coal mines that reported
production during some portion of calendar year 2004. When applying MSHA’s small mine definition (fewer than 20 workers), 1,149 (about 57 percent) were small mines and 860 (about 43 percent) were large mines. Using SBA’s small mine definition, 11 mines (0.5 percent) were large mines and the rest were small mines.
Coal mine employment in 2004 was 76,451, of which 72,987 were miners and 3,464 were office workers. Based on MSHA’s small mine definition, 7,854 coal miners (11 percent) in 2004 worked at small mines and 65,133 miners (89 percent) worked at large mines. Using SBA’s small mine definition, 66,299 coal miners (91 percent) worked at small mines and 6,688 coal miners (9 percent) worked at large mines. Based on the Agency’s small mine definition, on average, each small coal mine employs 7 miners and each large coal mine employs 76 miners. Using SBA’s small mine definition, on average, each small coal mine employs 33 miners and each large coal mine employs 608 miners.
ECONOMIC CHARACTERISTICS OF THE COAL MINING INDUSTRY MSHA classifies the U.S. coal mining sector into two major commodity groups:
bituminous and anthracite. The former is further divided into sub-bituminous and lignite. Bituminous operations represent about 92% of coal mining operations, employ over 98% of all coal miners, and account for over 99% of total coal production. The remaining 8% of coal mining operations are mostly anthracite.3
3 U.S. Department of Energy, Energy Information Administration, Annual Energy Review 2004, August 2004, Table 7.2, p. 207.

7
The U.S. coal sector produced approximately 1.11 billion short tons of coal (0.744 billion tons at surface mines and 0.367 billion tons at underground mines) in 2004. The average price of coal at surface and underground mines was $14.75 and $30.36 per ton, respectively.4 Surface coal mines accounted for $11.0 billion of revenues and underground coal mines accounted for $11.1 billion, for a total of $22.1 billion. Based on MSHA’s definition, small mines produced 28.7 million tons, valued at about $0.585 billion. Based on SBA’s definition, small mines produced 896 million tons, valued at $18.1 billion, or about 81% of coal production and about 82% of coal revenues. 5
Mines east of the Mississippi River accounted for about 44 percent of coal production in 2004. For the period 1949 through 2004, coal production east of the Mississippi River ranged, from a low of 395 million tons in 1954 to a high of 630 million tons in 1990; 2004 production was estimated at 484 million tons. During this same period, however, coal production west of the Mississippi increased each year from a low of 20 million tons in 1959 to an estimated record high of 627 million tons in 2004.6 Growth in western coal mines is due, in part, to environmental concerns that increase demand for low-sulfur coal, which is abundant in the West. In addition, surface mining, with its higher average productivity, is much more prevalent in the West.
Average domestic coal prices (nominal and real prices) for the period 1950-2004 are presented in Table II-5. The nominal price is the price not adjusted for inflation. The real price is the price of coal after it has been adjusted for inflation by using constant dollars from a particular year (in Table II-5, the real price is in terms of 2000 dollars). During this period the inflation-adjusted, or real, price of coal has generally declined. The only exceptions were a spike in coal prices during the OPEC petroleum price increases in the 1970s and the modest increase in real coal prices since 2000. The real price of coal in 2004 was approximately 42 percent lower than in 1950.7 The real price of coal per Btu was approximately 28 percent lower in 2004 than in 1950, which has caused coal to become the least expensive of the major fossil fuels in terms of price per Btu.8
4 Coal prices are the average open market sales prices for 2004. U.S. Department of Energy, Energy
Information Administration, Annual Coal Report 2004, November 2005, Table 28. 5 Coal production obtained from U.S. Department of Labor, Mine Safety and Health Administration,
Directorate of Program Evaluation and Information Resources, 2004 data. Average U.S. coal price estimates obtained from the Department of Energy, Energy Information Administration, Annual Coal Report 2004, November 2005, Table 29, p. 52. Underground and surface coal revenues are separately computed, then summed to obtain total coal revenue.
6 Ibid. 7 US Department of Energy, Energy Information Administration, Annual Energy Review 2004, August
2005, Table 7.8, p. 215. 8 US Department of Energy, Energy Information Administration, Annual Energy Review 2004, August
2005, Table 3.1, p. 71. Coal energy (per Btu) was more expensive than natural gas energy in 1950, but was less expensive in 2001. Both coal and gas energy were less expensive than crude oil energy in 1950 and 2001.

8
Table II.-5: Coal Prices 1950-2004 (Dollars per Short Ton and Dollars per Million BTU)
Year
Nominal Price (Dollars/Short
Ton)
Real Price (2000
Dollars/Short Ton)
Nominal Price
(Dollars/106
BTU)
Real Price (2000
Dollars/106
BTU)1950 5.19 31.40 0.21 1.251955 4.69 25.02 0.19 0.991960 4.83 22.96 0.19 0.921965 4.55 20.19 0.18 0.821970 6.34 23.03 0.27 0.871975 19.35 50.92 0.85 2.221980 24.65 45.61 1.10 2.041985 25.20 36.15 1.15 1.651990 21.76 26.67 1.00 1.221991 21.49 25.45 0.99 1.171992 21.03 24.34 0.97 1.121993 19.85 22.46 0.93 1.051994 19.41 21.50 0.91 1.011995 18.83 20.44 0.88 0.961996 18.50 19.71 0.97 0.921997 18.14 19.01 0.95 0.891998 17.67 18.32 0.83 0.861999 16.63 16.99 0.79 0.812000 16.78 16.78 0.80 0.802001 17.38 16.97 0.83 0.822002 17.98 17.27 0.87 0.842003 17.85 16.84 0.87 0.822004 19.85 18.34 0.97 0.90
Source: US Department of Energy, Energy Information Administration, Annual Energy Review2004, August 2005, Table 7.8, p. 219; Table 3.1, p.67.
COAL MINING INDUSTRY OUTLOOK The U.S. coal industry has enjoyed a fairly constant domestic demand. About 90
percent of U.S. coal demand was accounted for by electric power producers in 2004.9 Domestic coal demand is projected to increase because of growth in coal use for electricity generation. Coal consumption for electricity generation is projected to increase as the utilization of existing coal-fired generation capacity increases and as new capacity is added. The average utilization rate is projected to increase from 69 percent in 2001 to 83 percent in 2025. The amount of U.S coal exported in 2001 was 49 million tons (about 5 percent of production). These exports are projected to decline in the future, to about 26 million tons by 2025.10
9 U.S. Department of Energy, Energy Information Administration, Annual Energy Review 2004, August 2005, Table 7.3, p. 209.
10 U.S. Department of Energy, Energy Information Administration, Annual Energy Outlook 2004. January 2004, pp. 89, 90.

9
THE STRUCTURE OF THE METAL/NONMETAL MINING INDUSTRY The MNM mining sector consists of about 80 different commodities including
industrial minerals. There were 12,469 MNM mines in the U.S. in 2004, of which 10,768 (86%) were small mines and 1,701 (14%) were large mines, using MSHA’s traditional definition of small and large mines. Based on SBA’s definition, however, only 20 MNM mines (0.16%) were large mines.11
The data in Table II-3 indicate that employment at MNM mines in 2004 was 166,390, of which 64,557 workers (39%) were employed by small mines and 101,833 workers (61%) were employed by large mines (excluding contractor workers), using MSHA’s definition. Based on SBA’s definition, however, 151,058 workers (91%) were employed by small mines and 13,588 workers (9%) were employed by large mines (excluding contractor workers). Using MSHA’s definition, the average employment is 6 workers at a small MNM mine and 60 workers at a large MNM mine. Using SBA’s definition, there is an average of 12 workers in each small MNM mine and 767 workers in each large MNM mine.12
Metal Mining
There are about 24 metal commodities mined in the U.S. Underground metal mines use a few basic mining methods, such as room and pillar and block caving, but all these mines, small and large, rely heavily on diesel-powered production and support equipment.
Surface metal mines normally include drilling, blasting, loading, and hauling; these processes are typical in all surface mines, irrespective of commodity types. Surface metal mines in the U.S. rank among some of the largest mines in the world.
Metal mines constitute 2 percent of all MNM mines and employ 17 percent of all MNM miners. Under MSHA’s traditional definition of a small mine, 54 percent of metal mines are small, and these mines employ 3 percent of all miners working in metal mines. Using SBA’s definition, 93 percent of metal mines are small, and they employ 54 percent of all miners working in metal mines.13
Stone Mining
In the stone mining subsector, there are eight different stone commodities, of which seven are further classified as either dimension stone or crushed and broken stone. Stone mining in the U.S. is predominantly done by quarrying, with only a few slight variations. Crushed stone mines typically drill and blast, while dimension stone mines generally use channel burners, drills, or wire saws. Diesel powered-haulage is used to transfer the broken rock from the quarry to the mill where crushing and sizing are done.
11 U.S. Department of Labor Mine Safety and Health Administration, Directorate of Program
Evaluation and Information Resources, calendar year 2004 data. 12 Ibid. 13 Ibid.

10
Stone mines constitute 35 percent of all MNM mines, and they employ 45 percent of all MNM miners. Using MSHA’s definition of a small mine, 75 percent of stone mines are small, and these mines employ 31 percent of all miners working in stone mines. Using SBA’s definition, 99.98 percent of stone mines are small, and they employ 99 percent of all miners working in stone mines.14
Sand & Gravel Mining
Sand and gravel, for construction, is generally extracted from surface deposits using dredges or draglines. Further preparation involves washing and screening. As in other surface mining operations, sand and gravel uses diesel-driven machines, such as front-end loaders, trucks, and bulldozers, for haulage. The preparation of industrial sand and silica flour involves the use of crushers, ball mills, vibrating screens, and classifiers.
The sand and gravel subsector represents the single largest commodity group in the U.S. mining industry based on the number of mining operations. Sand and gravel mines comprise 57 percent of all MNM mines, and they employ 27 percent of all MNM miners. Using MSHA’s definition of a small mine, 95 percent of sand and gravel mines are small, and these mines employ 77 percent of all miners working in sand and gravel mines. Using SBA’s definition, 100 percent of sand and gravel mines are small, and they employ approximately 44,592 miners.15
Nonmetal Mining
For enforcement and statistical purposes, MSHA separates stone and sand and gravel mining from other nonmetal mining. There are about 35 nonmetal commodities, not including stone, and sand and gravel. Nonmetal mining uses a wide variety of underground mining methods such as continuous mining (similar to coal mining), in-situ retorting, block caving, and room and pillar. The mining method is dependent on the geologic characteristics of the ore and host rock. Some nonmetal operations use kilns and dryers in ore processing. Ore crushing and milling are processes common to both nonmetal and metal mining.
As with underground mining, there is a wide range of mining methods utilized in extracting minerals by surface mining. In addition to drilling and blasting, other mining methods, such as evaporation and dredging, are also utilized, depending on the ore formation.
Nonmetal mines comprise 6 percent of all MNM mines, and they employ 14 percent of all MNM miners. Using MSHA’s definition of a small mine, 69 percent of other nonmetal mines are small, and they employ 14 percent of all miners working in these nonmetal mines. Using SBA’s definition, 99.7 percent of other nonmetal mines are small, and they employ 93 percent of all miners working in these nonmetal mines.16
14 Ibid. 15 Ibid. 16 Ibid.

11
ECONOMIC CHARACTERISTICS OF THE METAL/NONMETAL MINING INDUSTRY
The value of all MNM mining output in 2004 was estimated at $44 billion. Metal mines, which include copper, gold, iron, lead, silver, tin, and zinc mines, contributed $10.8 billion.17 Nonmetal production was valued at $33.2 billion: $10 billion from stone mining, $6.9 billion from sand and gravel, and $16.3 billion from other nonmetals such as potash, clay, and salt. 18
The end uses of MNM mining output are diverse. For example, iron and aluminum are used to produce vehicles and other heavy duty equipment, as well as consumer goods such as household equipment and soft drink cans. Other metals, such as uranium and titanium, have more limited uses. Nonmetals, like cement, are used in construction while salt is used as a food additive and for road de-icing in the winter. Soda ash, phosphate rock, and potash also have a wide variety of commercial uses. Stone and sand and gravel are used in numerous industries and extensively in the construction industry.
17 U.S. Department of Interior, U.S. Geological Survey, Mineral Commodity Summaries 2005, January
6, 2005, p. 8. 18 Ibid., pp.142, 144, 158, 160.

12
III. BENEFITS
The Mine Safety and Health Administration has qualitatively determined that the proposed rule would yield net health and safety benefits, relative to a continuation of the civil penalties in the existing rule. The proposed rule revises MSHA’s civil penalty assessment procedures by eliminating single penalties, revises the calculation of points for regular assessments, and raises the penalties for most violations.
The benefits of the proposed rule are the reduced number of injuries and fatalities that would result from increased compliance with MSHA’s health and safety standards and regulations in response to higher penalty assessments. MSHA projects that higher penalties will induce mine operators to reduce all safety and health violations. The reduction in the number of violations, particularly S&S violations, or those reasonably likely to result in reasonably serious injury or illness, will reduce the number and severity of injuries and illnesses.
The likely reduction in violations and the benefits resulting from increased compliance has not been scientifically established to be at any particular level. Accordingly, MSHA has not provided a quantitative estimate of the reduction in injuries and fatalities due to the proposed rule.

13
IV. COST OF COMPLIANCE
SUMMARY Before proceeding, it is important to note the nature of the impacts associated with
the proposed rule. For most MSHA rules, the estimated impact reflects the cost to the mining industry of achieving compliance with the rule. That is not true for this proposed rule. Also, the analysis of the costs or economic impact of a rule normally assumes that mine operators are in 100% compliance with a rule. Under the assumption that mine operators are in 100% compliance with all of MSHA's rules, there would be no cost of compliance with this proposed rule, since no mine operator who fully complies with the law would be exposed to civil penalties.
For purposes of analyzing the economic effects of this rule, MSHA instead focuses on the likely change in costs to mine operators and independent contractors, where compliance with all of MSHA's rules is no longer assumed. For an increase in civil penalties, these costs are of two types. The first type is the increased payment of civil penalties for those infractions that continue to be incurred by mine operators. The second type is the increased cost to the mine operator of complying with rules that the mine operator would otherwise not comply with.
The first cost impact of the proposed rule is the higher civil payments for penalties received. This impact is not a traditional compliance cost, but rather a cost specifically due to non-compliance with MSHA standards and regulations. For purposes of the analyses in this PREA, the increase in penalties paid is the only cost attributed to this proposed rule. Table IV-1 summarizes these costs.
Table IV-1. Summary of Increase in Civil Penalties Due to Proposed Rule
Increase in Civil Penalties
Contractor/Mine Employment Size
Coal Contractor
Coal Operator
M/NM Contractor
M/NM Operator All Violations
1-5 $52,409 $103,715 $117,784 $675,389 $949,2976-19 $26,859 $403,261 $40,671 $1,097,109 $1,567,89920-500 $41,757 $12,651,975 $75,059 $2,219,845 $14,988,636501+ -$940 $2,650,123 $15,739 $746,628 $3,411,550All Mine Sizes $120,084 $15,809,074 $249,253 $4,738,971 $20,917,382
The second cost impact of the proposed rule is the expenses incurred to increase
compliance with MSHA standards and regulations so as to reduce the number and amount of civil penalties otherwise received. These are compliance costs, but for existing MSHA standards and regulations. These costs were included in economic assumptions made when those standards and regulations were promulgated. At that time, MSHA generally assumed full industry compliance. Therefore, compliance efforts made in response to higher penalties are not a cost attributable to the proposed rule. However, for illustrative purposes only, this analysis reflects additional expenditures associated with improved compliance. Table IV-2 summarizes these costs, even though they are not being counted as costs of the proposed rule.

14
Table IV-2. Summary of Additional Expenditures to Improve ComplianceDue to Proposed Rule*
Additional Expenditures to Improve Compliance*
Contractor/Mine Employment Size
Coal Contractor
Coal Operator
M/NM Contractor
M/NM Operator All Violations
1-5 $22,461 $44,449 $50,479 $289,453 $406,8426-19 $11,511 $172,826 $17,430 $470,190 $671,95720-500 $17,896 $5,422,275 $32,168 $951,362 $6,423,701501+ -$403 $1,135,767 $6,745 $319,983 $1,462,093All Mine Sizes $51,465 $6,775,317 $106,823 $2,030,988 $8,964,592
*These additional expenditures are shown for illustrative purposes only and are not included in the costs of this proposal, since they were included in analyses of costs when standards were promulgated.
These cost estimates and the methodology for deriving these estimates are described
in more detail below.
METHODOLOGY MSHA analyzes two possible effects on mine operations from the adjustment of
penalties. When penalties go up, mine operators must pay more for violations. This first effect increases the collection of assessments by MSHA. The penalty increase also induces mine operators to reduce the number of violations. This second effect increases the resources mine operators devote to preventing health and safety violations.
The increase or decrease in MSHA assessments is a transfer of resources between government and private industry. It is not a cost or cost saving to society as a whole, although it is a private cost or cost saving to mine operators. On the other hand, resources used (or not used) to prevent health and safety violations are a cost (or cost saving) to society. The sum of assessments and resource costs equals total costs to mine operators.
MSHA believes that the response of health and safety violations to a change in penalty size is probably inelastic. That is, a 1% increase in penalty amount probably leads to less than a 1% reduction in violations. MSHA has performed no studies to estimate the size of this effect.
Several considerations bear on the likely size of the elasticity number. The amount of resources a mine operator or independent contractor devotes to compliance with standards and regulations depends, in part, on the relationship between the penalty size and the cost of compliance. If the cost of compliance is small relative to the penalty size, mine operators are likely to comply rather than incur penalties.
On the other hand, if the cost of compliance is high relative to the penalty size, penalty size alone is unlikely to ensure compliance by all mine operators. In the appropriate circumstances, MSHA has authority to close down mines (in whole or in part) until such time as the mine comes into compliance. (See Sections 103(k), 104(d), and 107(a) of the Federal

15
Mine Safety and Health Act of 1977.19) The cost of mine closure is generally rather high relative to the cost of compliance. Most mines choose to comply within hours or days of a closure order. Only very rarely does a mine operator choose to remain shut down by an MSHA closure order, rather than incur the expense of compliance.
Accordingly, the types of violations most likely to be affected by penalty size are those infractions where the cost of compliance is modest relative to penalty size. In the absence of other incentives for compliance, a neutral assumption is that there would be a unitary elasticity for the response of health and safety violations to a change in penalty size.
However, other incentives for compliance do exist. In particular, workers are concerned about the health and safety of their mine environment. Depending on the nature, frequency, and extent of violations found by MSHA inspectors, workers may become harder to recruit or retain. Other things equal, a mine operator would prefer not to develop a reputation for operating an unsafe or unhealthy mine. Additionally, even when not discovered by MSHA inspectors, health and safety violations increase the likelihood of accident, with possible loss of mine equipment and property and possible miner injury. These factors tend to reduce productivity and increase material and labor costs independently of the size of penalties.
Knowledge of these additional incentives supports a belief that the response of health and safety violations to a change in penalty size is probably inelastic. MSHA has performed no studies to estimate the size of this effect. Strictly for purposes of providing an example of possible effects, MSHA assumes an elasticity number of -0.3 for the response of violations to penalty size.
The additional expenditures to improve compliance are resource costs that arise because penalty increases cause mine operators to devote more resources to avoiding health and safety violations that may result in civil penalties. These resource costs are computed as the integral of a constant-elasticity curve over the penalty-prices associated with the expected quantity changes.20
As indicated above, the calculations using an elasticity number of -0.3 are included for purposes of illustration only. Use of a less elastic number (say -0.1) would yield larger changes in assessments and smaller changes in resource costs. Use of a more elastic number (say -0.7) would yield smaller changes in assessments and larger changes in resource costs.
SCOPE
The proposed rule applies to all mines subject to MSHA's jurisdiction. The new civil penalties apply only to mines that fail to comply with the relevant statutes and regulations pertaining to worker health and safety.
19 Public Law 91-173, as amended by Public Law 95-164. 20 The constant-elasticity curve has formula P = AQ(1/ε), where P = Penalty Amount, Q = Quantity (or
Number) of Violations, ε = Elasticity, and A is an arbitrary parameter. The integral of PdQ is PQ/(1+1/ε).

16
ANALYSIS
In order to derive and explain the cost impact of the proposed rule on the mining industry, MSHA has divided its analysis into three sections: (1) the baseline--the total number and monetary amount of civil penalty assessments proposed by MSHA in 2005, the year prior to the proposed rule; (2) the impact of the proposed rule on civil penalty assessments under the assumption that mine operators and independent contractors take no actions, in response to higher proposed penalty assessments, to increase compliance with MSHA standards and regulations; and (3) the impact of the proposed rule on the number and amount of civil penalty assessments taking into account the anticipated response of mine operators and independent contractors to increase compliance with MSHA standards and regulations and thereby reduce the number of civil penalty assessments they would otherwise receive.
Baseline The first step in estimating the impact of the proposed rule is to establish a baseline: the number and monetary amount of civil penalty assessments in the absence of the proposed rule. For this purpose, MSHA chose all civil penalty assessments for 2005, the last full calendar year of data prior to the proposed rule. Table IV-3 shows the number of civil penalty assessments issued in 2005, disaggregated by mine employment size, by coal and metal and nonmetal (MNM), and by operators and independent contractors.
Table IV-3. Baseline Number of Civil Penalty Assessments for 2005
Coal-M/NM, Operator/Contractor
Contractor/Mine Employment Size
Coal Contractor
Coal Operator
M/NM Contractor
M/NM Operator All Violations
1-5 2,856 2,741 1,609 12,528 19,7346-19 757 9,063 1,048 16,125 26,99320-500 1,479 43,428 1,183 17,685 63,775501+ 1 4,432 66 1,672 6,171All Mine Sizes 5,093 59,664 3,906 48,010 116,673
The mine size categories being used are 1-5 employees, 6-19 employees, 20-500
employees, and more than 500 employees. These categories are relevant for the analysis of impacts in chapter V of this PREA, to determine whether small mines, as defined by the Small Business Administration (SBA) and MSHA, would be significantly impacted by the proposed rule. Mines with 500 or fewer employees meet SBA’s definition of a small mine. Mines with fewer than 20 employees meet MSHA’s traditional definition of a small mine.
Mine violation data have been broken out by coal and MNM and by operator and independent contractor. The employment sizes shown are contractor size for independent contractors and mine size for mine operators.
Of the 116,673 civil penalty assessments issued in 2005, 113,484, or about 97.3%, were single penalty or regular assessments. The remaining 3,189, or 2.7%, were special assessments.
17
As can be calculated from Table IV-3, there were about 25% more coal violations than MNM violations in 2005, even though there were more than 3 ½ times as many MNM operators and independent contractors as there were coal operators and independent contractors. One reason for the larger number of coal violations is that there are about 3 times as many underground coal mines as underground MNM mines. There are a number of circumstances surrounding underground mines which tend to result in a greater number of violations. They are required to be inspected more often, and conditions are generally more dangerous and subject to change. Another reason for more coal violations is that coal mines are, on average, larger operations than MNM mines, and larger mines tend to receive more violations, on average, than smaller mines. The average coal mine operator employed about 3 times as many miners as the average MNM operator in 2004.
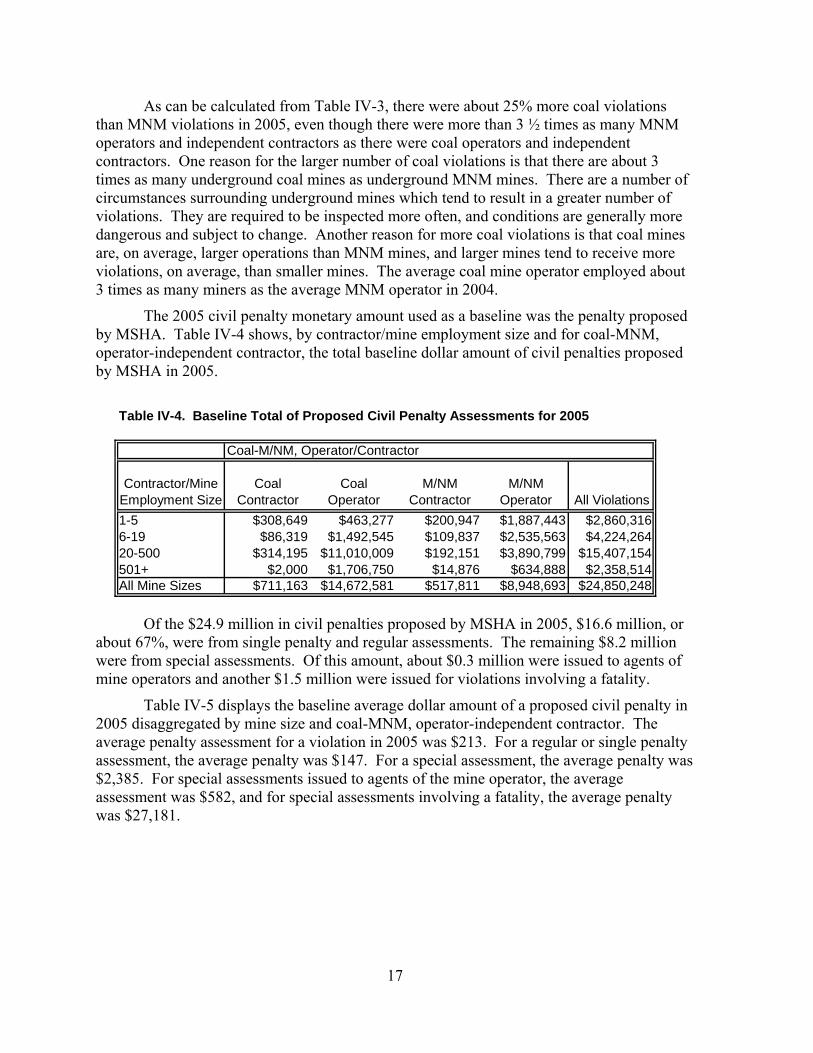
The 2005 civil penalty monetary amount used as a baseline was the penalty proposed by MSHA. Table IV-4 shows, by contractor/mine employment size and for coal-MNM, operator-independent contractor, the total baseline dollar amount of civil penalties proposed by MSHA in 2005.
Table IV-4. Baseline Total of Proposed Civil Penalty Assessments for 2005
Contractor/Mine Employment Size
Coal Contractor
Coal Operator
M/NM Contractor
M/NM Operator All Violations
1-5 $308,649 $463,277 $200,947 $1,887,443 $2,860,3166-19 $86,319 $1,492,545 $109,837 $2,535,563 $4,224,26420-500 $314,195 $11,010,009 $192,151 $3,890,799 $15,407,154501+ $2,000 $1,706,750 $14,876 $634,888 $2,358,514All Mine Sizes $711,163 $14,672,581 $517,811 $8,948,693 $24,850,248
Coal-M/NM, Operator/Contractor
Of the $24.9 million in civil penalties proposed by MSHA in 2005, $16.6 million, or
about 67%, were from single penalty and regular assessments. The remaining $8.2 million were from special assessments. Of this amount, about $0.3 million were issued to agents of mine operators and another $1.5 million were issued for violations involving a fatality.
Table IV-5 displays the baseline average dollar amount of a proposed civil penalty in 2005 disaggregated by mine size and coal-MNM, operator-independent contractor. The average penalty assessment for a violation in 2005 was $213. For a regular or single penalty assessment, the average penalty was $147. For a special assessment, the average penalty was $2,385. For special assessments issued to agents of the mine operator, the average assessment was $582, and for special assessments involving a fatality, the average penalty was $27,181.

18
Table IV-5. Baseline Average Proposed Civil Penalty Assessmentper Violation in 2005
Coal-M/NM, Operator/Contractor
Contractor/Mine Employment Size
Coal Contractor
Coal Operator
M/NM Contractor
M/NM Operator
Average of All Violations
1-5 $108 $169 $125 $151 $1456-19 $114 $165 $105 $157 $15620-500 $212 $254 $162 $220 $242501+ $2,000 $385 $225 $380 $382All Mine Sizes $140 $246 $133 $186 $213
Consistent with the formulas used to calculate regular assessments under the existing
regulations, Table IV-5 shows that the average proposed penalty assessment in 2005 tended to increase as mine size increased. This effect is consistent, particularly for mine operators with 20 or more employees.
Table IV-5 also indicates that the difference in average penalties between coal and MNM mines and independent contractors of a given employment size is generally small.
Table IV-4 reveals that total civil penalty assessments in 2005 were substantially larger, more than 50% larger, for coal mines than for MNM mines. The larger aggregate penalty assessment for coal mines is due to the larger number of violations issued to coal mines and the higher average penalty per violation. Coal violations tend to be more serious, on average, than MNM violations (e.g., 40% of coal violations are Significant and Substantial, or S&S, versus 23% for MNM violations).
Impacts If No Compliance Response to Higher Penalties
With the baseline established, the next task in the cost analysis is to determine the impact of the proposed rule on civil penalty assessments under the assumption that mine operators and independent contractors take no actions, in response to higher proposed penalty assessments, to increase compliance with MSHA standards and regulations. This task is an intermediate step in determining the total cost impact of the proposed rule, as MSHA’s assumption in the next section is that mine operators and independent contractors would change their compliance behavior in response to increased penalties.
Given the assumption of no compliance response by mine operators and independent contractors, the number of violations would not change in response to the proposed rule. They would remain the same as presented in Table IV-3 for the baseline. However, the type of the violations would change under the proposed rule. In the analysis, all 2005 regular and single penalty assessments would be issued as regular assessments under the proposed rule. MSHA assumed that most unwarrantable failure citations and orders would be processed as regular assessments under the minimum penalty requirements of the MINER Act. MSHA further assumed that the 2005 special assessments issued to agents, those involving a fatality, those involving failure to promptly notify MSHA, and those involving flagrant violations would be assessed as special assessments under the proposed rule. MSHA assumed that all other 2005 special assessments would be processed as regular assessments. Thus, under the proposed rule, MSHA estimates that the number of special assessments would decline by

19
85%, from 3,189 to 491. MSHA anticipates that, under the proposal, the regular assessment provision would generally provide an appropriate penalty in most cases. Equally significant, this would allow MSHA to focus its enforcement resources on more field enforcement activities, as opposed to administrative review activities.
Tables IV-6 and IV-7 show the estimated total dollar amount and average dollar amount, respectively, of civil penalties under the proposed rule, assuming no compliance response by mine operators and independent contractors. Table IV-8 shows, relative to the baseline, the estimated percentage increase of civil penalties (both total and average) under the proposed rule, assuming no compliance response by mine operators and independent contractors. All of these tables are disaggregated by contractor/mine employment size, coal-MNM, and operator/contractor.
Table IV-6. Total Proposed Civil Penalty Assessments Under Proposed Rule,Assuming No Compliance Response
Coal-M/NM, Operator/Contractor
Contractor/Mine Employment Size
Coal Contractor
Coal Operator
M/NM Contractor
M/NM Operator All Violations
1-5 $414,826 $684,448 $410,544 $3,207,759 $4,717,5776-19 $133,074 $2,287,667 $187,432 $4,744,450 $7,352,62320-500 $415,811 $37,598,722 $340,542 $8,365,383 $46,720,458501+ $807 $7,394,118 $43,973 $2,288,395 $9,727,293All Mine Sizes $964,518 $47,964,955 $982,491 $18,605,987 $68,517,951
Table IV-7. Average of Proposed Civil Penalty Assessments per ViolationUnder Proposed Rule, Assuming No Compliance Response
Coal-M/NM, Operator/Contractor
Contractor/Mine Employment Size
Coal Contractor
Coal Operator
M/NM Contractor
M/NM Operator
Average of All Violations
1-5 $145 $250 $255 $256 $2396-19 $176 $252 $179 $294 $27220-500 $281 $866 $288 $473 $733501+ $807 $1,668 $666 $1,369 $1,576All Mine Sizes $189 $804 $252 $388 $587

20
Table IV-8. Percentage Increase in Total and Average Proposed Civil PenaltyAssessments Under Proposed Rule, Assuming No Compliance Response
Coal-M/NM, Operator/Contractor
Contractor/Mine Employment Size
Coal Contractor
Coal Operator
M/NM Contractor
M/NM Operator
Average Percentage Increase All Violations
1-5 34% 48% 104% 70% 65%6-19 54% 53% 71% 87% 74%20-500 32% 241% 77% 115% 203%501+ -60% 333% 196% 260% 312%All Mine Sizes 36% 227% 90% 108% 176%
As indicated in these tables, MSHA estimates that total civil penalty assessments
would increase under the proposed rule, assuming no compliance response, from $24.9 million in the baseline to $68.5 million, an increase of $43.7 million, or 176%. Approximately $2.5 million, or about 4% of the $68.5 million, would come from special assessments. Of the $43.7 million increase, approximately $1.9 million would result from the minimum penalty provisions for unwarrantable violations in the MINER Act. In its analysis of 2005 data, MSHA found one violation which met the failure to provide timely notification provisions in the MINER Act. For this category of violations, the MINER Act imposes a penalty of $5,000 to $60,000. However, the particular violation had already received a special assessment in excess of $5,000. Thus, MSHA did not adjust penalty totals to account for this provision of the MINER Act.
MSHA has determined that flagrant violations will be processed under the special assessment provision. As stated in the proposal, MSHA will use the definition for flagrant violation in the MINER Act, but the Agency cannot estimate, at this point in the rulemaking process, the specific impact of this new requirement in the MINER Act. The Agency does, however, anticipate that penalties would increase due to this provision.
MSHA estimates that the average penalty assessment would increase under the proposed rule, assuming no compliance response, from $213 (shown in Table IV-5) to $587 (shown in Table IV-7), an increase of 176% (shown in Table IV-8). Consistent with Congressional intent, the average penalty generally increases as mine size or contractor size increases (shown in Table IV-7).
For purposes of the analysis, special assessments that remain as special assessments were assumed to receive the same penalty, unless they would be impacted by the minimum penalty provisions of the MINER Act. All special assessments in 2005 involving a fatality exceeded the new minimum penalty provisions, so these penalties are assumed unchanged by the proposed rule. However, the average penalty for special assessments issued to agents of the mine operator is estimated to increase by 367% under the proposed rule. This increase is entirely due to the application of the minimum penalty provisions for unwarrantable violations in the MINER Act.
For purposes of analysis, the remaining special assessments are assumed to be treated as regular assessments under the proposal. In the analysis, the average penalty for 2005

21
special assessments, assumed to be issued as regular assessments under the proposed rule, increased by 84%.
Impacts with Compliance Response to Higher Penalties
MSHA intends and expects that higher penalty assessments would lead to efforts by mine operators and independent contractors to increase compliance with MSHA standards and regulations and ultimately to decreased violations. MSHA assumes that each violation is associated with a probability of occurrence that declines as penalty assessments rise. To estimate this impact, MSHA assumes that each 10% increase in penalty for a violation is associated with a 3% decrease in its probability of occurrence.
In economic terms, this is equivalent to assuming an elasticity of -0.3 between the number of violations and the dollar size of penalties.21 This elasticity of -0.3 was previously assumed by MSHA in its regulatory economic analysis for the 2003 direct final rule to adjust civil penalties for inflation.
MSHA has consistently applied this assumption to each assessed violation in the 2005 database. For most violations, the proposed rule would result in a penalty increase. Accordingly, MSHA has computed a reduction (or in the rare case, an increase) in the probability of the violation’s occurrence. The reduction is larger as the penalty increases.
Tables IV-9 and IV-10 estimate the increased compliance response of the industry to higher penalty assessments. Table IV-9 provides estimates for mine operators and Table IV-10 provides estimates for independent contractors. Tables IV-9 and IV-10 show, by mine or contractor employment size and by coal and MNM, the number of violations and the dollar amount of penalties in the 2005 database (“Old”). Using the assumption that the elasticity of response is -0.3 for each violation, Tables IV-9 and IV-10 estimate the new reduced number of violations and the higher penalties associated with these violations (“New”). Taking into account the mine industry’s compliance response, MSHA estimates that, were the proposed rule in effect in 2005, total violations would have declined from 116,673 to 95,035, a reduction of about 19% in the total number of violations.
21 Using the constant elasticity formula, P = AQ(1/ε), where ε = Elasticity = -0.3, we can derive
(Q2/Q1) = (P2/P1)(-0.3). Thus, for example, an increase in a penalty from $60 to $100 would be associated with a reduction in the frequency of that violation from 1.0 to 0.86. An increase in a penalty from $60 to $60,000 would be associated with a reduction in the frequency of that violation from 1.0 to 0.13.

22
Table IV-9. Impact of Proposed Rule on Mine OperatorsGiven Increased Compliance Response to Higher Penalty Assessments
Mine Employment
Size
Old Number of Violations
Old Proposed Penalties
New Number of Violations
New Proposed Penalties
Change in Penalties
Additional Expenditures to Improve
Compliance*1-5 2,741 $463,277 2,476 $566,992 $103,715 $44,4496-19 9,063 $1,492,545 8,145 $1,895,806 $403,261 $172,82620-500 43,428 $11,010,009 33,616 $23,661,984 $12,651,975 $5,422,275501+ 4,432 $1,706,750 2,941 $4,356,873 $2,650,123 $1,135,767All Mine Sizes 59,664 $14,672,581 47,178 $30,481,655 $15,809,074 $6,775,317
Mine Employment
Size
Old Number of Violations
Old Proposed Penalties
New Number of Violations
New Proposed Penalties
Change in Penalties
Additional Expenditures to Improve
Compliance*1-5 12,528 $1,887,443 10,955 $2,562,832 $675,389 $289,4536-19 16,125 $2,535,563 13,846 $3,632,672 $1,097,109 $470,19020-500 17,685 $3,890,799 13,986 $6,110,644 $2,219,845 $951,362501+ 1,672 $634,888 1,101 $1,381,516 $746,628 $319,983All Mine Sizes 48,010 $8,948,693 39,889 $13,687,664 $4,738,971 $2,030,988
Impact on Coal Mine Operators
*These additional expenditures are shown for illustrative purposes only and are not included in the costs of this proposal, since they were included in analyses of costs when standards were promulgated.
Impact on Metal/Nonmetal Mine Operators

23
Table IV-10. Impact of Proposed Rule on Independent ContractorsGiven Increased Compliance Response to Higher Penalty Assessments
Contractor Employment Size
Old Number of Violations
Old Proposed Penalties
New Number of Violations
New Proposed Penalties
Change in Penalties
Additional Expenditures to Improve
Compliance*1-5 2,856 $308,649 2,607 $361,058 $52,409 $22,4616-19 757 $86,319 678 $113,178 $26,859 $11,51120-500 1,479 $314,195 1,349 $355,952 $41,757 $17,896501+ 1 $2,000 1 $1,060 -$940 -$403All Contractor Sizes 5,093 $711,163 4,636 $831,247 $120,084 $51,465
Contractor Employment Size
Old Number of Violations
Old Proposed Penalties
New Number of Violations
New Proposed Penalties
Change in Penalties
Additional Expenditures to Improve
Compliance*1-5 1,609 $200,947 1,377 $318,731 $117,784 $50,4796-19 1,048 $109,837 905 $150,508 $40,671 $17,43020-500 1,183 $192,151 998 $267,210 $75,059 $32,168501+ 66 $14,876 52 $30,615 $15,739 $6,745All Contractor Sizes 3,906 $517,811 3,332 $767,064 $249,253 $106,823
Impact on Coal Independent Contractors
*These additional expenditures are shown for illustrative purposes only and are not included in the costs of this proposal, since they were included in analyses of costs when standards were promulgated.
Impact on Metal/Nonmetal Independent Contractors
The “Change in Penalties” column represents the increase in penalties, relative to the baseline, for remaining violations. The total change in proposed penalty assessments is approximately $15.8 million for coal mine operators, $0.1 million for coal independent contractors, $4.7 million for MNM mine operators, and $0.2 million for MNM independent contractors. The sum of these four numbers, $20.9 million, is the total cost of the proposed rule.
To reduce the number of violations in response to the higher penalty assessments, MSHA assumes that mines would increase expenditures to improve compliance with MSHA safety and health standards. The column, “Additional Expenditures to Improve Compliance,” represents MSHA’s estimate of these increased compliance costs. These estimates are based on the same assumption that the elasticity of response is -0.3 and the additional assumption that the increased compliance activities would be undertaken by the mining industry to avoid increased penalties. These increased compliance costs to avoid higher penalties are not counted as a cost of this proposed rule, because full compliance with MSHA standards is assumed when standards are promulgated.
Table IV-11 summarizes the impacts by mining sector.

24
Table IV-11. Impact of Proposed Rule, Both With Unchanged Complianceand With Increased Compliance Response to Higher Penalty Assessments
Mining SectorOld Proposed
Penalties
New Proposed Penalties,
Same Compliance
Change in Penalties,
Same Compliance
% Change in Penalties,
Same Compliance
Coal $15,383,744 $48,929,473 $33,545,729 218%Metal $1,396,682 $4,054,371 $2,657,689 190%Nonmetal $594,888 $1,171,774 $576,886 97%Sand and Gravel $3,113,522 $5,544,307 $2,430,785 78%Stone $4,361,412 $8,818,026 $4,456,614 102%Total $24,850,248 $68,517,951 $43,667,703 176%
Mining Sector
Additional Expenditures to Improve
Compliance*
New Proposed Penalties, Improved
Compliance
Change in Penalties, Improved
Compliance
% Change in Penalties, Improved
ComplianceCoal $6,826,782 $31,312,902 $15,929,158 104%Metal $524,403 $2,620,288 $1,223,606 88%Nonmetal $132,222 $903,406 $308,518 52%Sand and Gravel $522,167 $4,331,911 $1,218,389 39%Stone $959,019 $6,599,123 $2,237,711 51%Total $8,964,592 $45,767,630 $20,917,382 84%
Reduced Number of Violations
*These additional expenditures are shown for illustrative purposes only and are not included in the costs of this proposal, since they were included in analyses of costs when standards were promulgated.
Same Number of Violations
FEASIBILITY MSHA has concluded that the requirements of the proposed rule are technologically
and economically feasible.
Technological Feasibility
The proposed rule is a regulation, not a standard. It does not involve activities on the frontiers of scientific knowledge. The mining industry has been complying with the adjudication and payment of civil penalties for decades. MSHA concludes, therefore, that the proposed rule is technologically feasible.
Economic Feasibility
MSHA estimates that the yearly increased penalty assessments issued to coal mines as a result of the proposed rule would be $15.9 million dollars, which is equal to about 0.07 percent of coal mine sector revenues of $22.1 billion in 2004. MSHA estimates that the yearly increased penalty assessments issued to MNM mines as a result of the proposed rule

25
would be $5.0 million dollars, which is equal to about 0.01 percent of MNM mine sector revenues of $44.0 billion in 2004. Since the total estimated increased penalty assessments for both the coal and MNM mine sectors are well below one percent of their estimated revenues, MSHA concludes that the proposed rule is economically feasible for the mining industry.22
22 As shown earlier, in response to increased penalty assessments, MSHA expects that coal mine
operators and contractors would spend an additional $6.8 million and metal/nonmetal operators and contractors an additional $2.1 million to increase compliance with MSHA standards and regulations so as to reduce the number and amount of civil penalty assessments otherwise received. But the costs to achieve compliance with these standards and regulations have already been estimated and recognized, under full compliance assumptions, when the standards and regulations were promulgated. Therefore, the costs associated with improved compliance are not properly attributable to the proposed rule. To include them as a cost of the proposed rule would be to double-count them.

26
V. REGULATORY FLEXIBILITY CERTIFICATION AND INITIAL REGULATORY FLEXIBILITY ANALYSIS
INTRODUCTION
Pursuant to the Regulatory Flexibility Act (RFA) of 1980, as amended by the Small Business Regulatory Enforcement Fairness Act (SBREFA), MSHA has analyzed the impact of the proposed rule on small entities. Based on that analysis, MSHA certifies that the proposed rule would not have a significant economic impact on a substantial number of small entities that are covered by this rulemaking. The factual basis for this certification is presented below.
DEFINITION OF A SMALL MINE Under the RFA, in analyzing the impact of a proposed rule on small entities, MSHA
must use the Small Business Administration's (SBA's) definition for a small entity, or after consultation with the SBA Office of Advocacy, establish an alternative definition for the mining industry by publishing that definition in the Federal Register for notice and comment. MSHA has not taken such an action, and hence is required to use the SBA definition. The SBA defines a small entity in the mining industry as an establishment with 500 or fewer employees (13 CFR 121.201).
MSHA has also examined the impacts of agency rules on a subset of mines with 500 or fewer employees--those with fewer than 20 employees, which MSHA and the mining community have traditionally referred to as “small mines.” These small mines differ from larger mines not only in the number of employees, but also in economies of scale in material produced, in the type and amount of production equipment, and in supply inventory. Therefore, their costs of complying with MSHA's rules and the impact of the agency's rules on them will also tend to be different. It is for this reason that “small mines,” as traditionally defined by MSHA as those employing fewer than 20 workers, are of special concern to MSHA. In addition, for this proposed rule, MSHA has examined the cost on mines with 5 or fewer employees to ensure that this subset of mines is not significantly and adversely impacted by the proposed rule.
This analysis complies with the legal requirements of the RFA for an analysis of the impacts on “small entities” while continuing MSHA's traditional definition of “small mines.” Both the proposal and this analysis reflect MSHA’s concern for mines with 5 or fewer employees. MSHA concludes that it can certify that the proposed rule would not have a significant economic impact on a substantial number of small entities that are covered by this rulemaking. MSHA has determined that this is the case for mines with fewer than 20 employees and mines with 500 or fewer employees. In its detailed factual basis below, MSHA will also show effects of the proposal on mines with 5 or fewer employees.

27
FACTUAL BASIS FOR CERTIFICATION
General Approach
Our analysis of economic impacts on “small entities” begins with a "screening" analysis. The screening compares the estimated costs of a rule for small entities in the sector affected by the rule to the estimated revenues for the affected sector. When estimated costs are less than one percent of the estimated revenues (for the size categories considered), MSHA believes it is generally appropriate to conclude that there is no significant economic impact on a substantial number of small entities. If estimated costs are equal to or exceed one percent of revenues, it tends to indicate that further analysis may be warranted.
Derivation of Costs and Revenues
Normally, the analysis of the costs or economic impact of a rule assumes that mine operators are in 100% compliance with a rule. Under the assumption that mine operators are in 100% compliance with all of MSHA's rules, there would be no cost of compliance with the proposed rule, since no mine operator would be exposed to civil penalties. For purposes of analyzing the effects on small mines, MSHA reverses this usual assumption and instead analyzes the increased penalty assessments for mines not in compliance with the agency’s other rules.
For coal mines, estimated 2004 production was 4.6 million tons for mines with 1-5 employees, 28.7 million tons for mines with 1-19 employees, and 896.8 million tons for mines with 1-500 employees. Using the 2004 price of coal of $19.93 per ton23, the 2004 coal revenues are estimated to be approximately $91 million for mines with 1-5 employees, $572 million for mines with 1-19 employees, and $17,872 million for mines with 1-500 employees.
For MNM mines, the total 2004 revenue generated by the MNM industry ($44.0 billion)24 was divided by the total number of employee hours to arrive at the average revenue per hour of employee production ($145.90). The $145.90 was multiplied by employee hours in specific mine size categories to arrive at estimated revenues for these categories. This approach was used to determine the estimated revenues for the MNM mining industry because MSHA does not collect data on MNM production. The 2004 MNM revenues are estimated to be approximately $3.9 billion for mines with 1-5 employees, $15.4 billion for mines with 1-19 employees, and $40.6 billion for mines with 1-500 employees.
Results of Screening Analysis
Table V-1 below shows that when dividing the increase in penalties by the revenues in each mine size category, the cost of the rule for coal mines is 0.17% of revenues for mines with 1-5 employees, 0.10% of revenues for mines with 1-19 employees, and 0.07% of
23 The average price of $19.93 per ton comes from the U.S. Department of Energy, Energy Information
Administration, Annual Coal Report 2004, Table 28, November 2005. 24 U.S. Department of the Interior, U.S. Geological Survey, Mineral Commodity Summaries 2005,
January 2005, p. 8.

28
revenues for mines with 1-500 employees. Table V-1 also shows the penalty increase as a percentage of revenues for all coal mines to be 0.07%.
Table V-1 also shows that when dividing the increase in penalties by the revenues in each mine size category, the cost of the rule for MNM mines is 0.02% of revenues for mines with 1-5 employees, 0.01% of revenues for mines with 1-19 employees, and 0.01% of revenues for mines with 1-500 employees. Table V-1 further shows the penalty increase as a percentage of revenues for all MNM mines to be 0.01%.
For coal mines, Table V-1 further shows that the proposed rule would result in an increase in penalties per mine of: $279 for mines having 1-5 employees; $510 for mines having 1-19 employees; and $6,640 for mines having 500 or fewer employees. For MNM mines, Table V-1 shows that the proposed rule would result in an increase in penalties per mine of: $125 for mines having 1-5 employees; $179 for mines having 1-19 employees; and $340 for mines having 500 or fewer employees.
Employment Size Number of Mines
Increase in Penalties
Estimated Revenue (Millions)
Increase in Penalties Per Mine
Penalty Increase as %
of Revenue
1-5 employees 560 $156,124 $91 $279 0.17%1-19 employees 1,149 $586,243 $572 $510 0.10%1-500 employees 2,000 $13,279,975 $17,872 $6,640 0.07%All mines 2,011 $15,929,158 $22,144 $7,921 0.07%
1-5 employees 6,370 $793,173 $3,903 $125 0.02%1-19 employees 10,771 $1,930,953 $15,379 $179 0.01%1-500 employees 12,447 $4,225,857 $40,628 $340 0.01%All mines 12,467 $4,988,224 $44,000 $400 0.01%
Coal Mines
M/NM Mines
Table V-1. Increase in Penalties Due to Proposed RuleCompared to Mine Revenues, by Mine Size
As shown in Table V-1, when applying MSHA’s and SBA’s definitions of small
mines, yearly costs of the proposed rule are substantially less than one percent of estimated yearly revenues, well below the level suggesting that the rule might have a significant economic impact on a substantial number of small entities. Accordingly, MSHA has certified that the proposed rule would not have a significant economic impact on a substantial number of small entities that are covered by the rule.

29
VI. OTHER REGULATORY CONSIDERATIONS
THE UNFUNDED MANDATES REFORM ACT OF 1995 The proposed rule does not include any Federal mandate that may result in increased
expenditures by State, local, or tribal governments; nor does it increase private sector expenditures by more than $100 million annually; nor does it significantly or uniquely affect small governments. Accordingly, the Unfunded Mandates Reform Act of 1995 (2 U.S.C. 1501 et seq.) requires no further agency action or analysis.
TREASURY AND GENERAL GOVERNMENT APPROPRIATIONS ACT OF 1999: ASSESSMENT OF FEDERAL REGULATIONS AND POLICIES ON FAMILIES
The proposed rule would have no effect on family well-being or stability, marital commitment, parental rights or authority, or income or poverty of families and children. Accordingly, Section 654 of the Treasury and General Government Appropriations Act of 1999 (5 U.S.C. 601 note) requires no further agency action, analysis, or assessment.
EXECUTIVE ORDER 12630: GOVERNMENT ACTIONS AND INTERFERENCE WITH CONSTITUTIONALLY PROTECTED PROPERTY RIGHTS
The proposed rule would not implement a policy with takings implications. Accordingly, Executive Order 12630, Governmental Actions and Interference with Constitutionally Protected Property Rights, requires no further agency action or analysis.
EXECUTIVE ORDER 12988: CIVIL JUSTICE REFORM
The proposed rule was drafted and reviewed in accordance with Executive Order 12988, Civil Justice Reform. The proposed rule was written to provide a clear legal standard for affected conduct and was carefully reviewed to eliminate drafting errors and ambiguities, so as to minimize litigation and undue burden on the Federal court system. MSHA has determined that the proposed rule would meet the applicable standards provided in Section 3 of Executive Order 12988.
EXECUTIVE ORDER 13045: PROTECTION OF CHILDREN FROM ENVIRONMENTAL HEALTH RISKS AND SAFETY RISKS
The proposed rule would have no adverse impact on children. Accordingly, Executive Order 13045, Protection of Children from Environmental Health Risks and Safety Risks, as amended by Executive Orders 13229 and 13296, requires no further agency action or analysis.
EXECUTIVE ORDER 13132: FEDERALISM The proposed rule does not have “federalism implications” because it does not “have
substantial direct effects on the States, on the relationship between the national government and the States, or on the distribution of power and responsibilities among the various levels

30
of government.” Accordingly, Executive Order 13132, Federalism, requires no further agency action or analysis.
EXECUTIVE ORDER 13175: CONSULTATION AND COORDINATION WITH INDIAN TRIBAL GOVERNMENTS
The proposed rule does not have “tribal implications” because it does not “have substantial direct effects on one or more Indian tribes, on the relationship between the Federal government and Indian tribes, or on the distribution of power and responsibilities between the Federal government and Indian tribes.” Accordingly, Executive Order 13175, Consultation and Coordination with Indian Tribal Governments, requires no further agency action or analysis.
EXECUTIVE ORDER 13211: ACTIONS CONCERNING REGULATIONS THAT SIGNIFICANTLY AFFECT ENERGY SUPPLY, DISTRIBUTION, OR USE
The proposed rule has been reviewed for its impact on the supply, distribution, and use of energy because it applies to the coal mining industry. Insofar as the proposed rule would result in added yearly civil penalty assessments of approximately $15.9 million to the coal mining industry, relative to annual revenues of $22.1 billion in 2004, it is not a “significant energy action” because it is not “likely to have a significant adverse effect on the supply, distribution, or use of energy * * * (including a shortfall in supply, price increases, and increased use of foreign supplies).” Accordingly, E.O. 13211, Actions Concerning Regulations That Significantly Affect Energy Supply, Distribution, or Use, requires no further Agency action or analysis.
EXECUTIVE ORDER 13272: PROPER CONSIDERATION OF SMALL ENTITIES IN AGENCY RULEMAKING
MSHA has thoroughly reviewed the proposed rule to assess and take appropriate account of its potential impact on small businesses, small governmental jurisdictions, and small organizations. MSHA has determined and certified that the proposed rule would not have a significant economic impact on a substantial number of small entities.

31
VII. PAPERWORK REDUCTION ACT OF 1995
Collections of information associated with civil penalties are exempted from the requirements of the Paperwork Reduction Act, since they involve “an administrative action or investigation involving an agency against specific individuals or entities.” 44 U.S.C. § 3518(c)(1)(B)(ii). Therefore, the proposed rule contains no information collection requirements that are subject to review by the Office of Management and Budget (OMB) under the Paperwork Reduction Act.

32
VIII. REFERENCES U.S. Department of Energy, Energy Information Administration, Annual Energy Outlook
2004, January 2004.
U.S. Department of Energy, Energy Information Administration, Annual Energy Review 2004, August 2005.
U.S. Department of Energy, Energy Information Administration, Annual Coal Report 2004, November 2005.
U.S. Department of the Interior, U.S. Geological Survey, Mineral Commodities Summaries 2005, January 2005.
U.S. Department of Labor, Mine Safety and Health Administration, Office of Program Evaluation and Information Resources, 2004, 2005 data.